
Blueprint for a Simulation Framework to Increase Driver Training Safety in North America: Case Study

 ,
, 
Abstract
:1. Introduction
2. Research Methodology
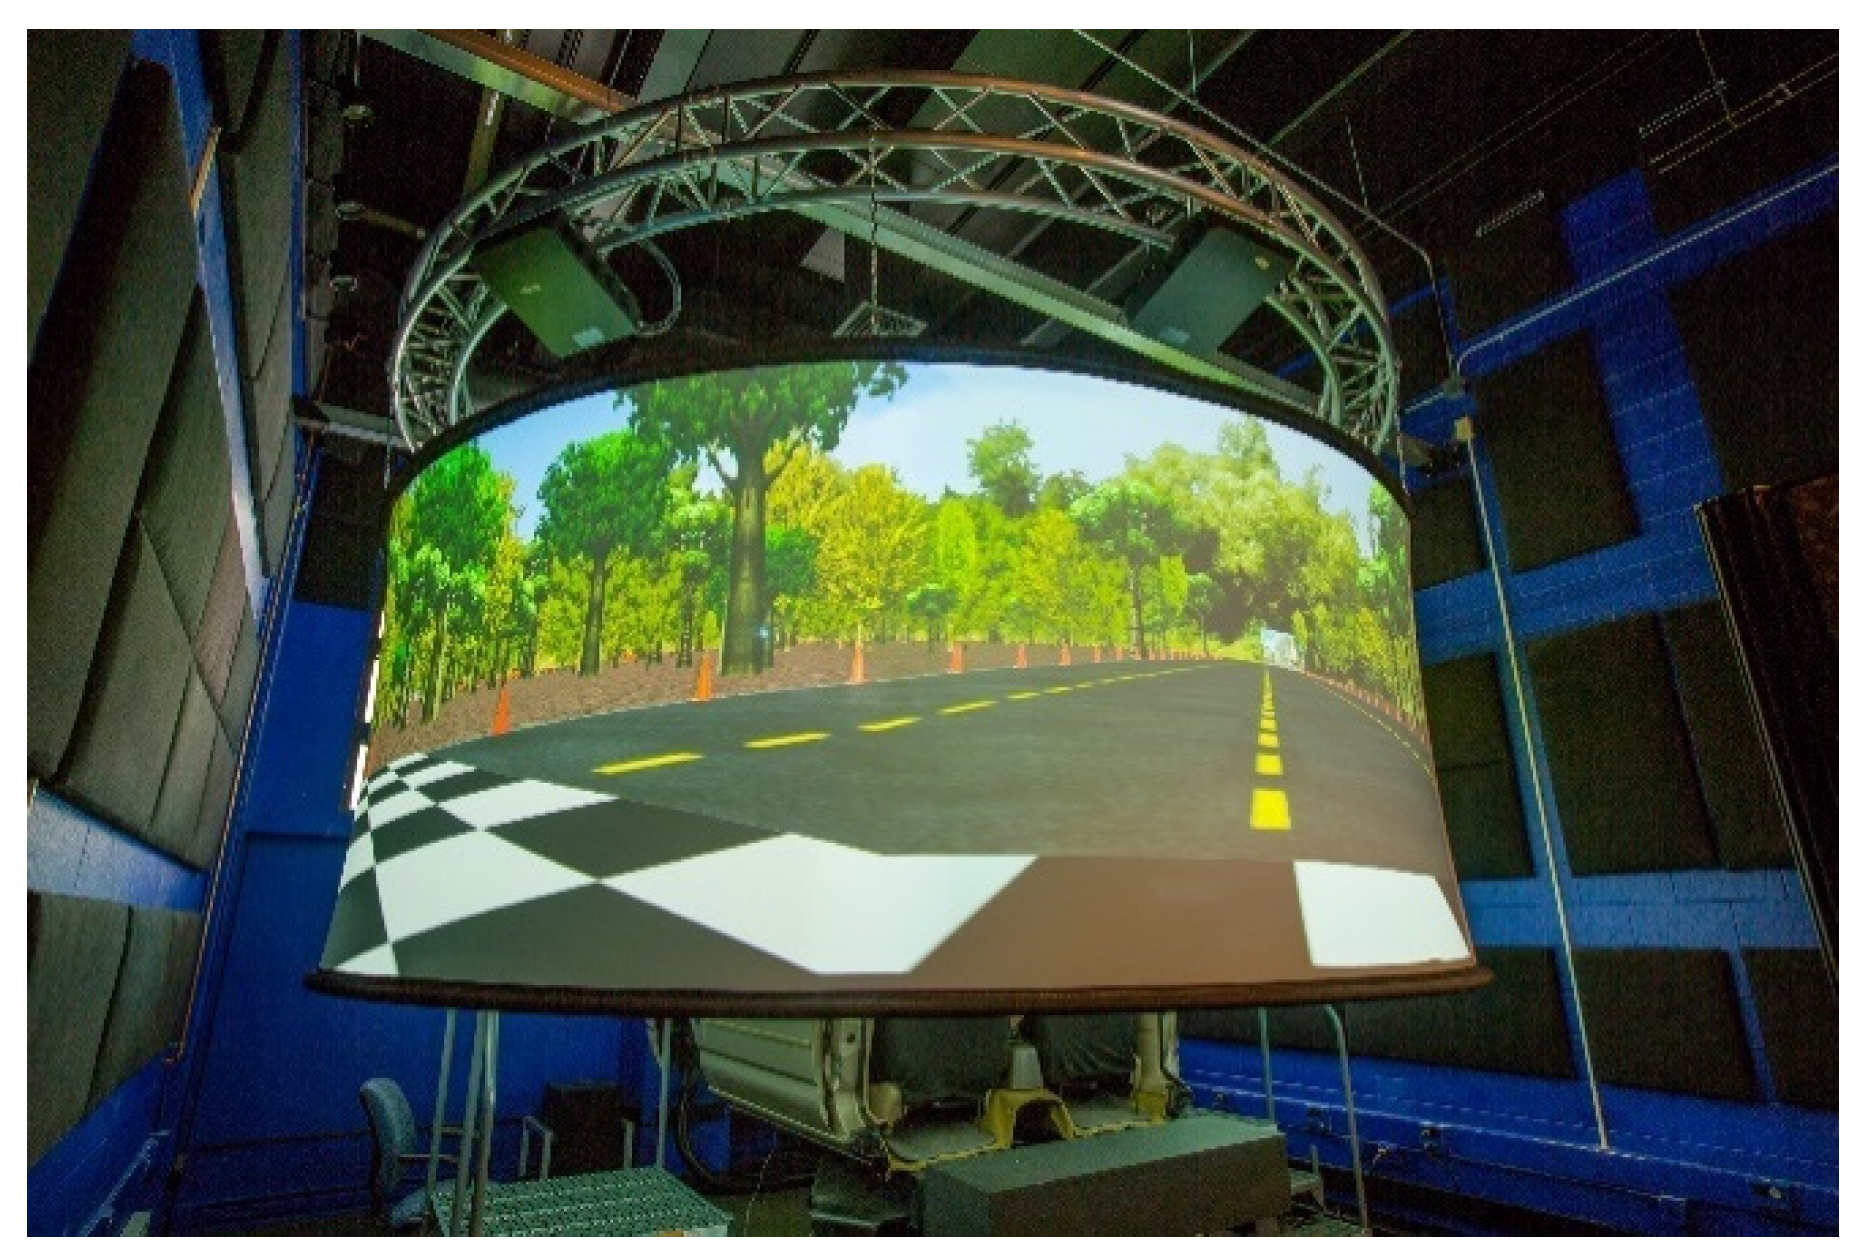
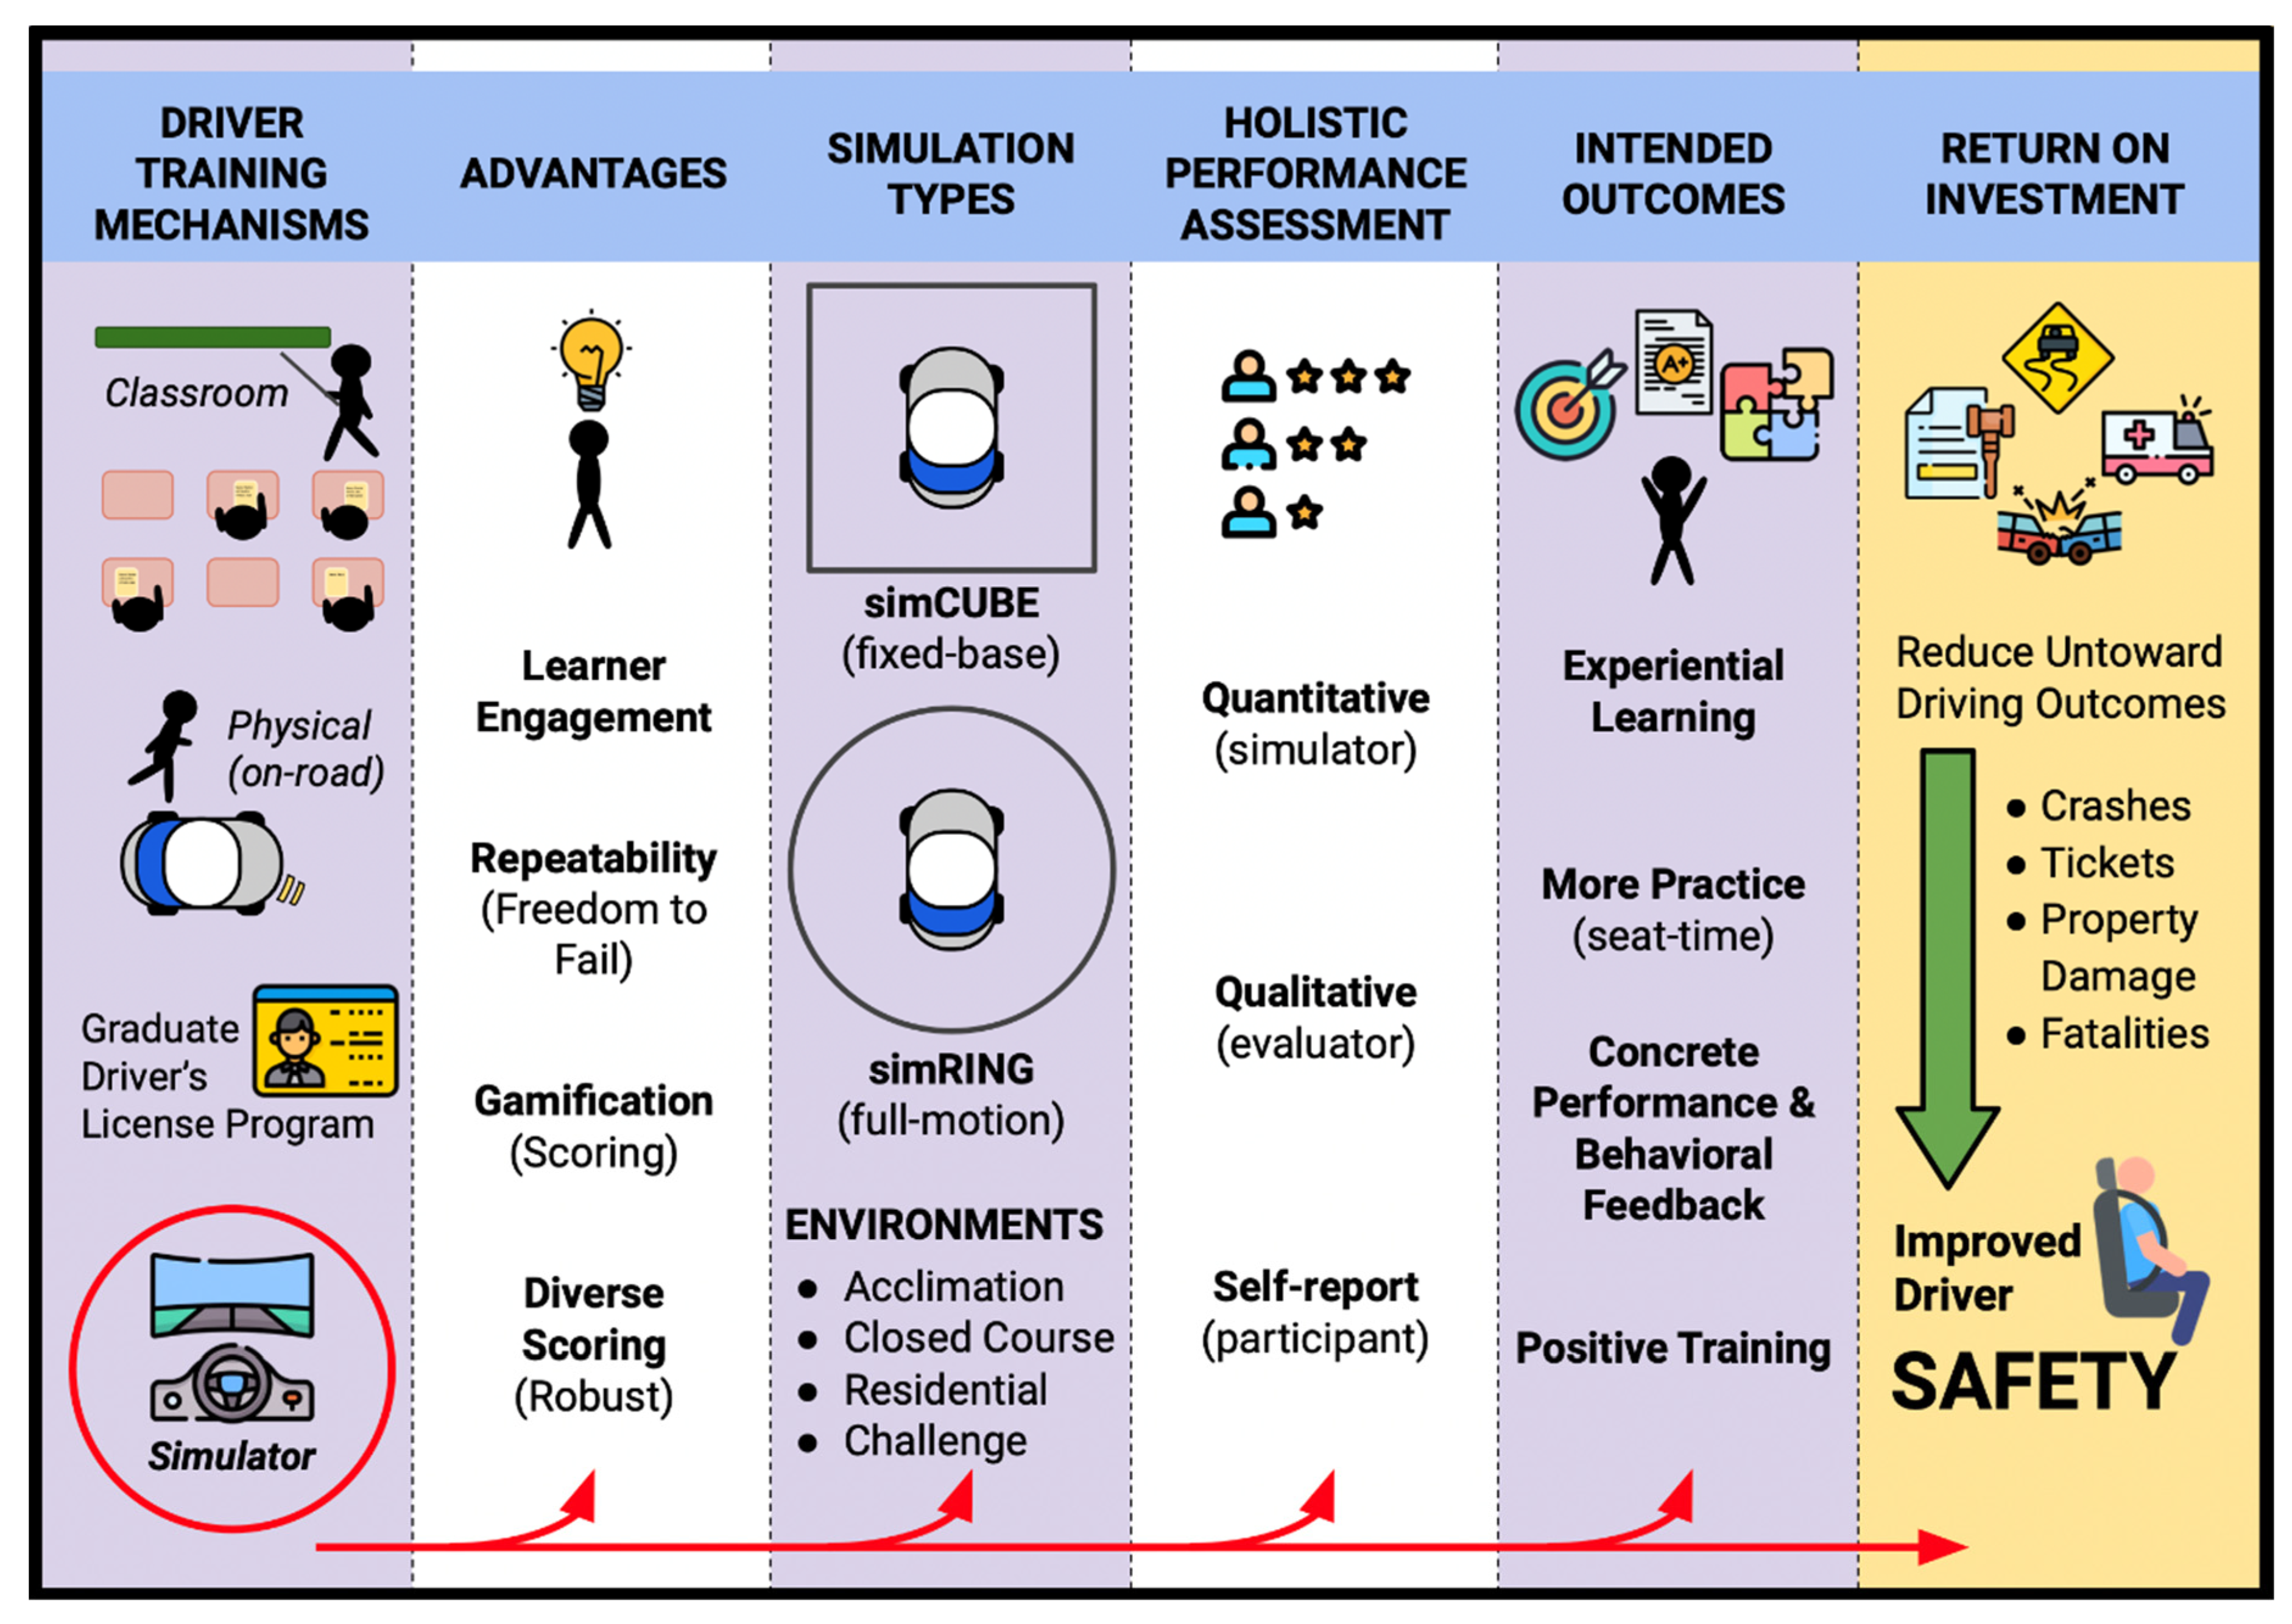
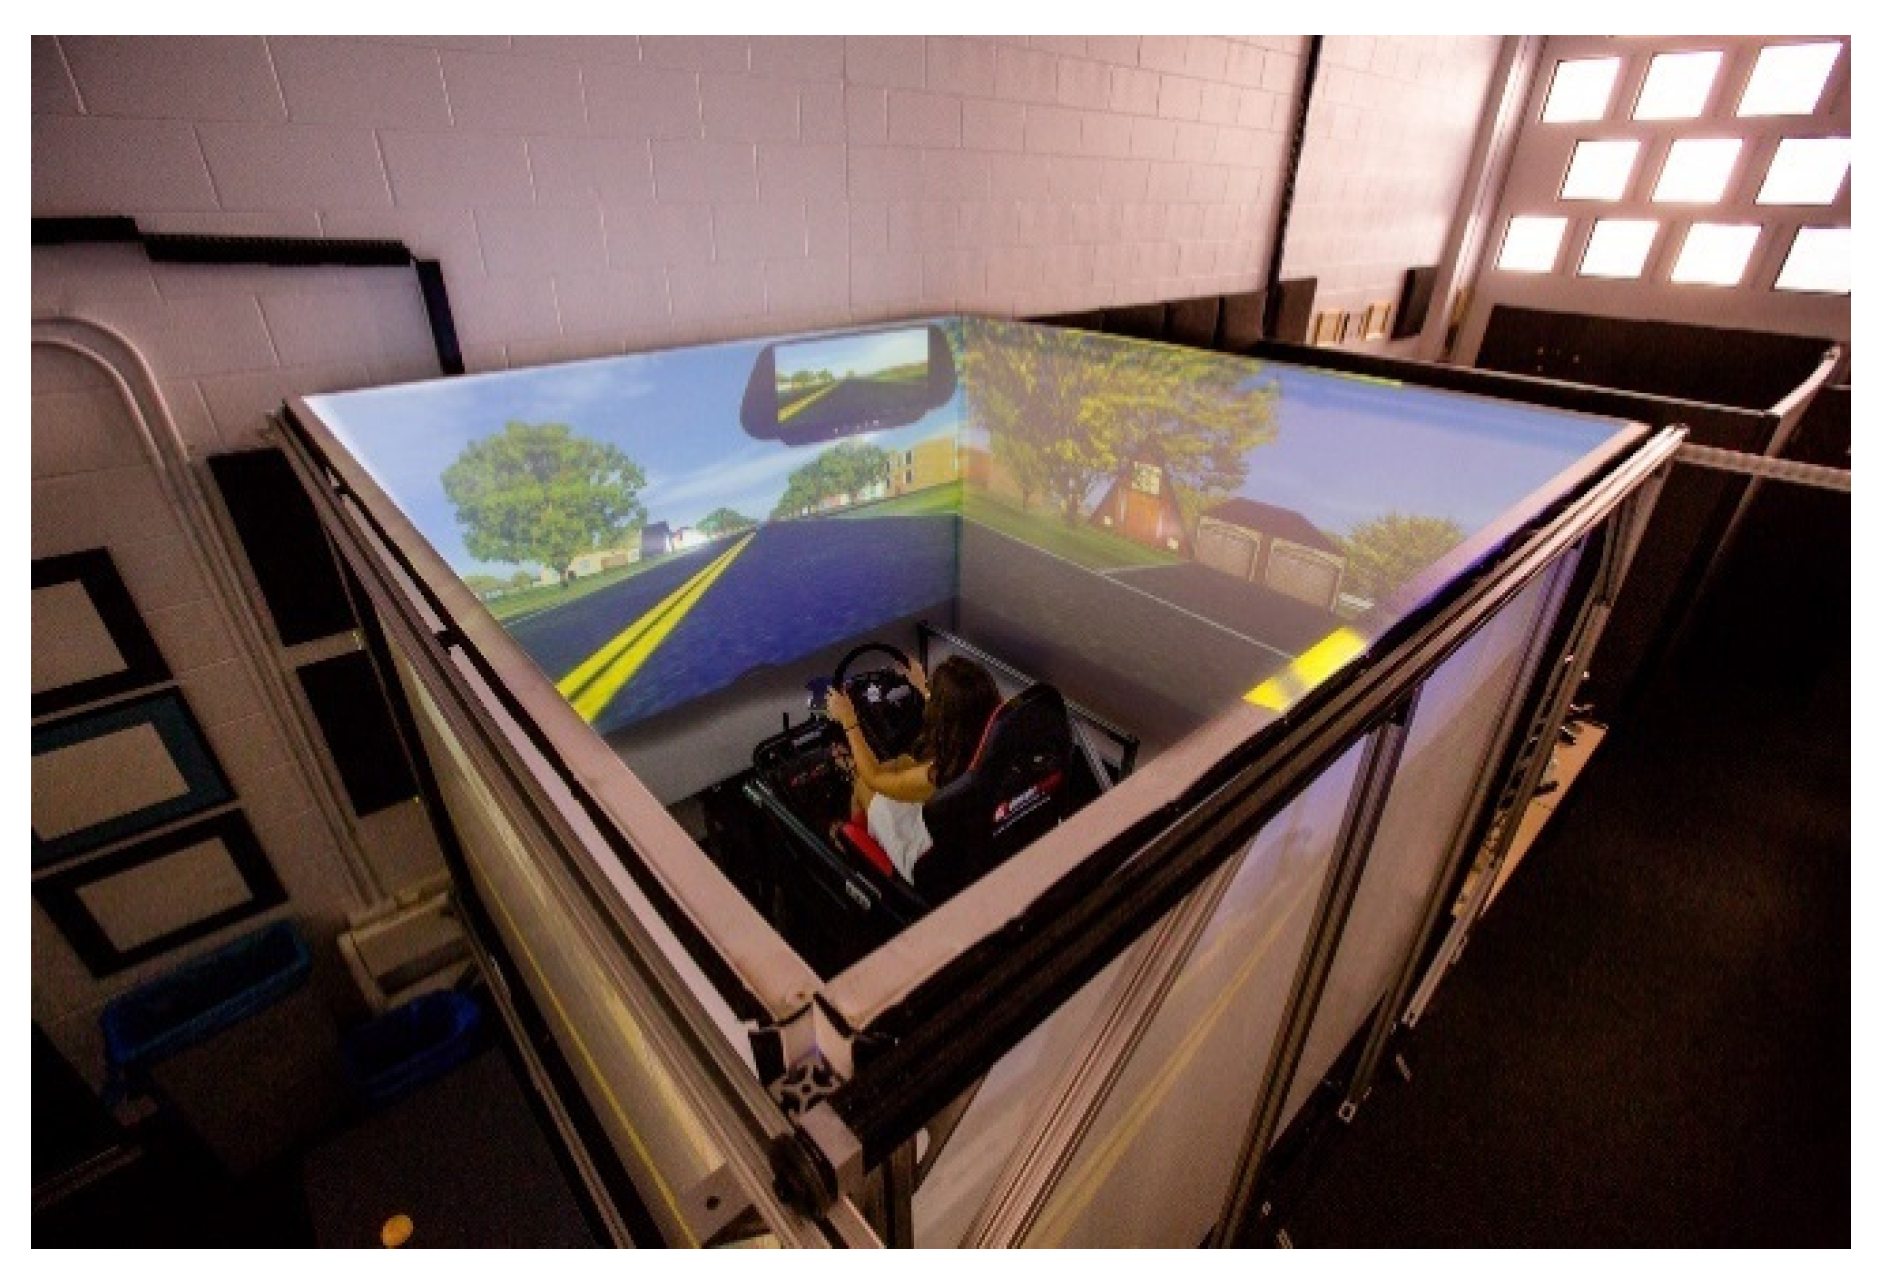
2.1. Training Environment Design
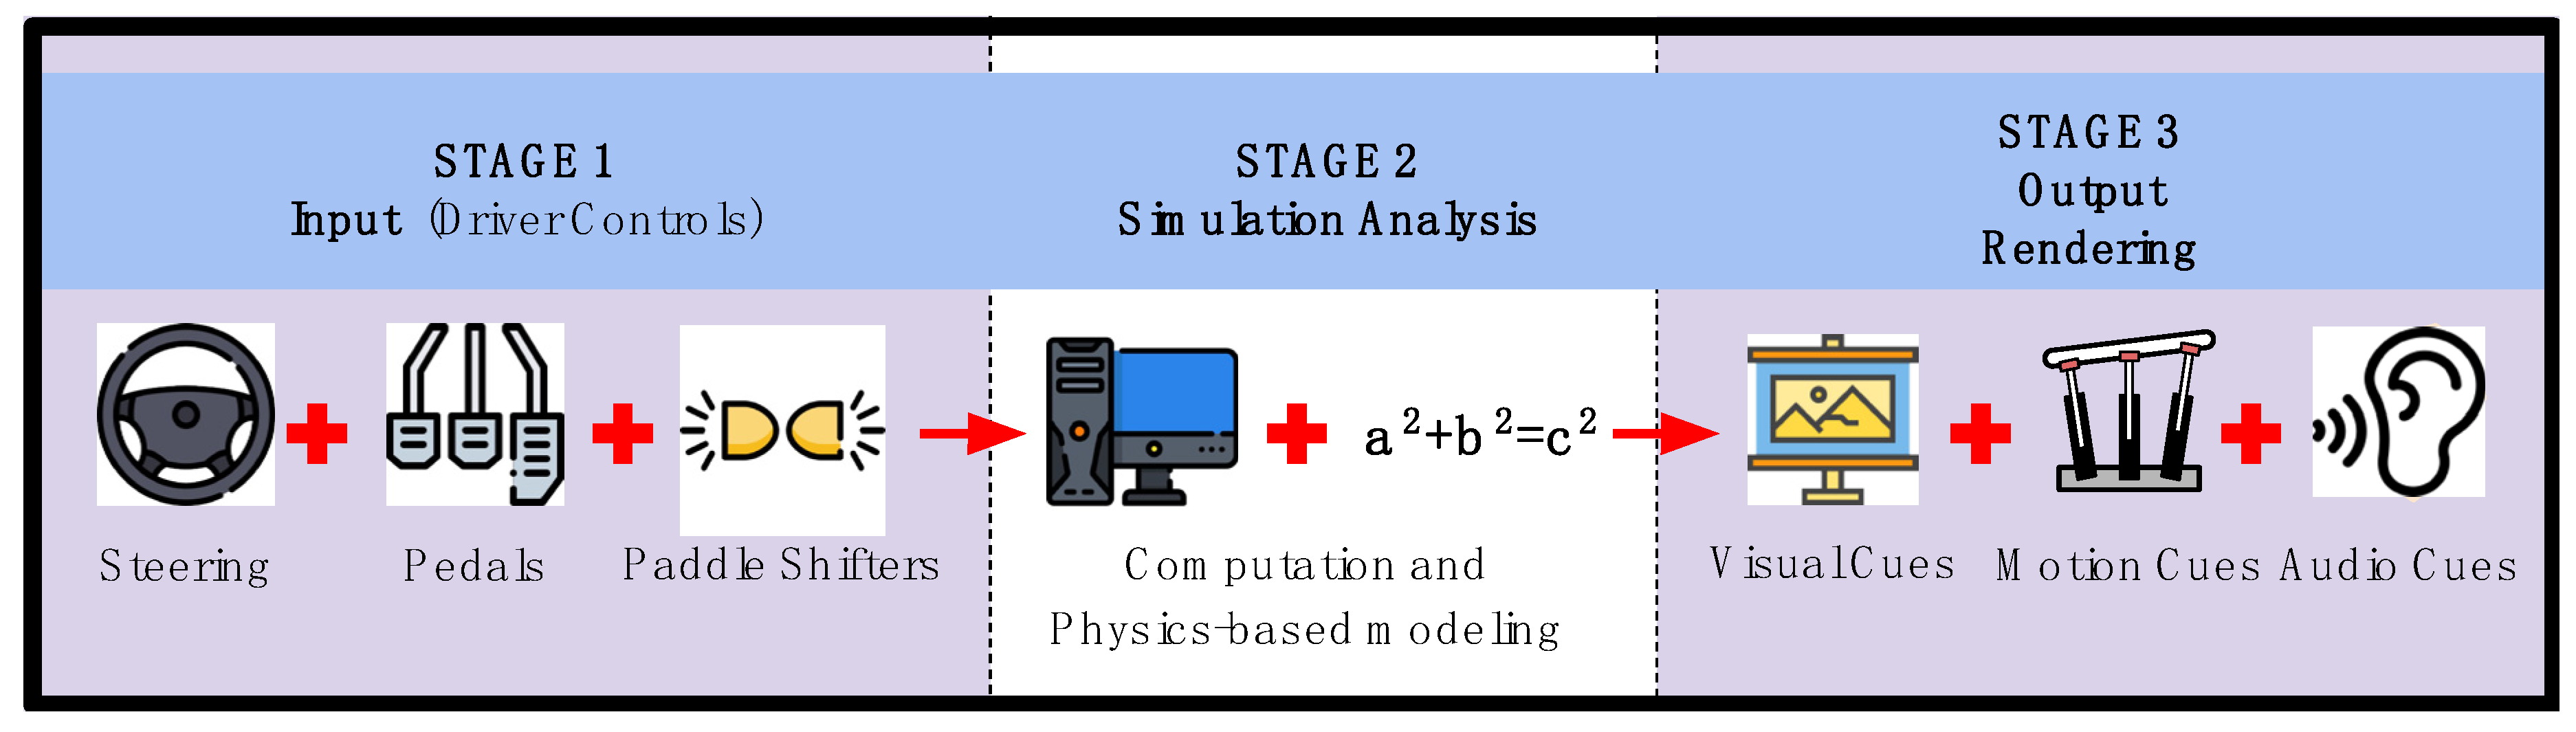
2.1.1. Stage 1: Input—Driver Controls
2.1.2. Stage 2: Simulation Analysis
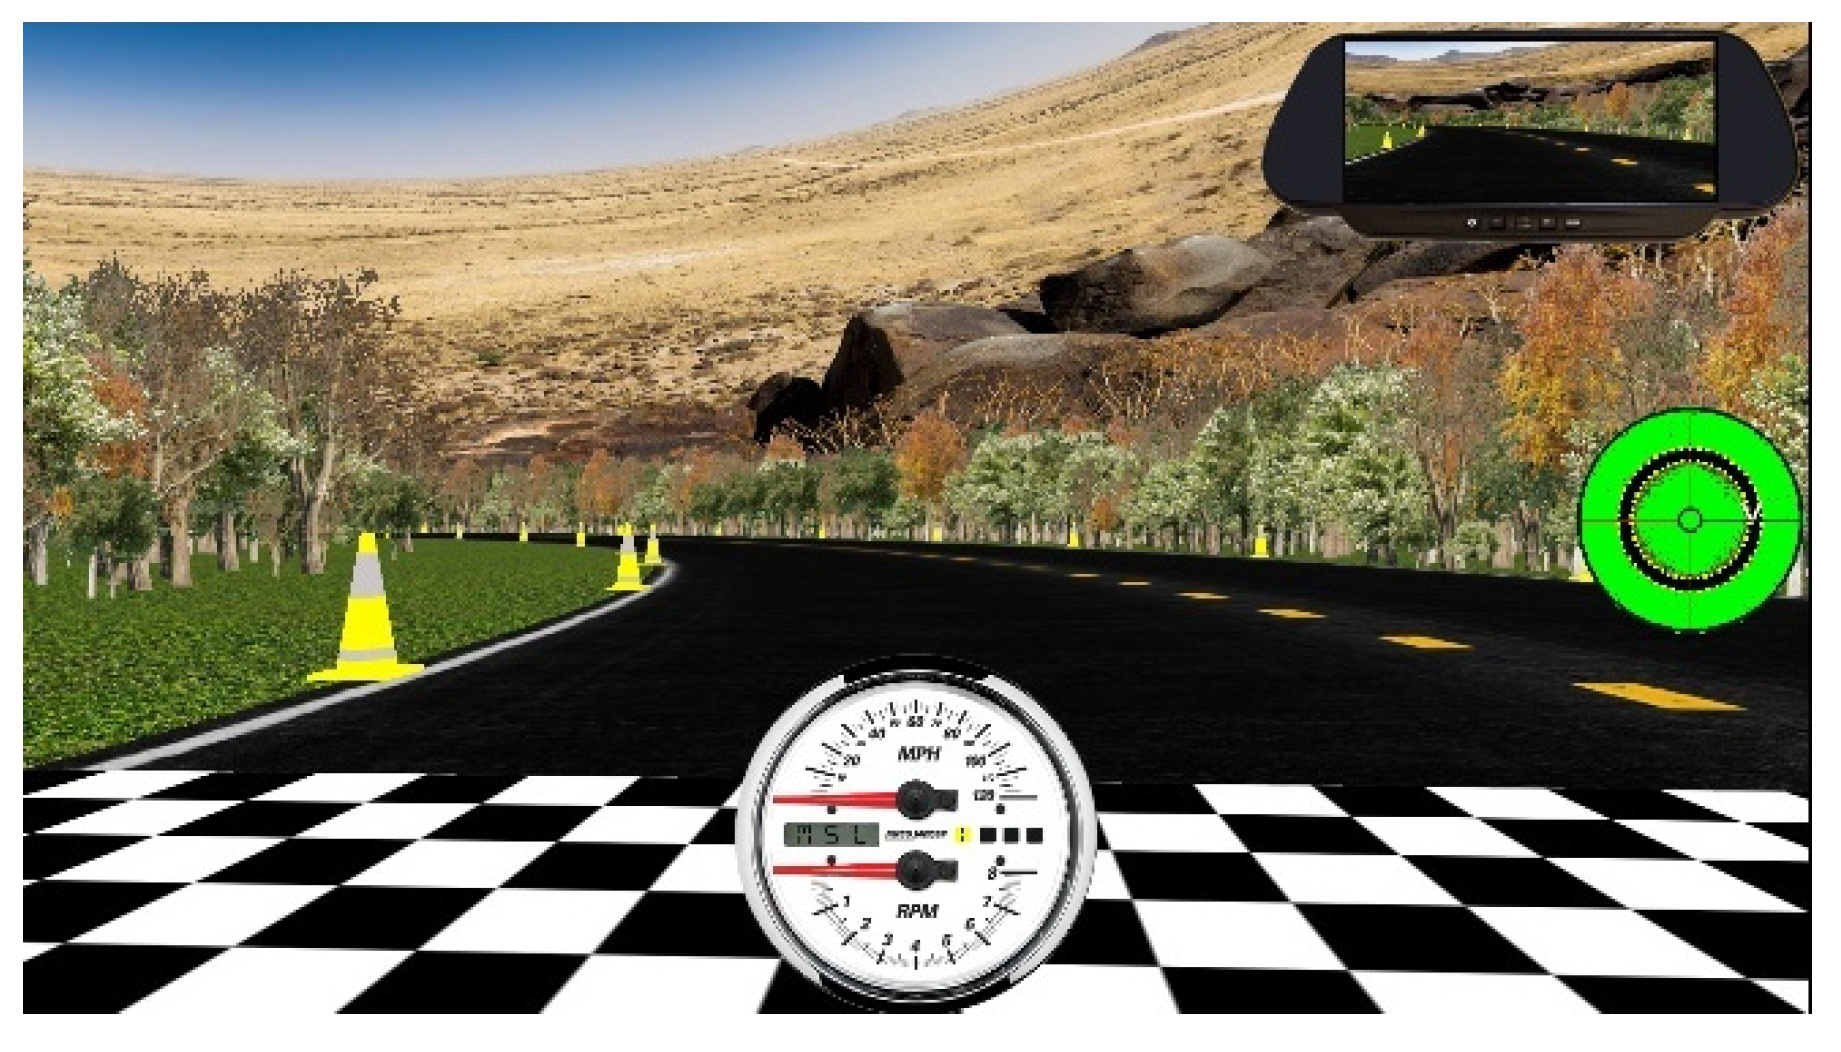
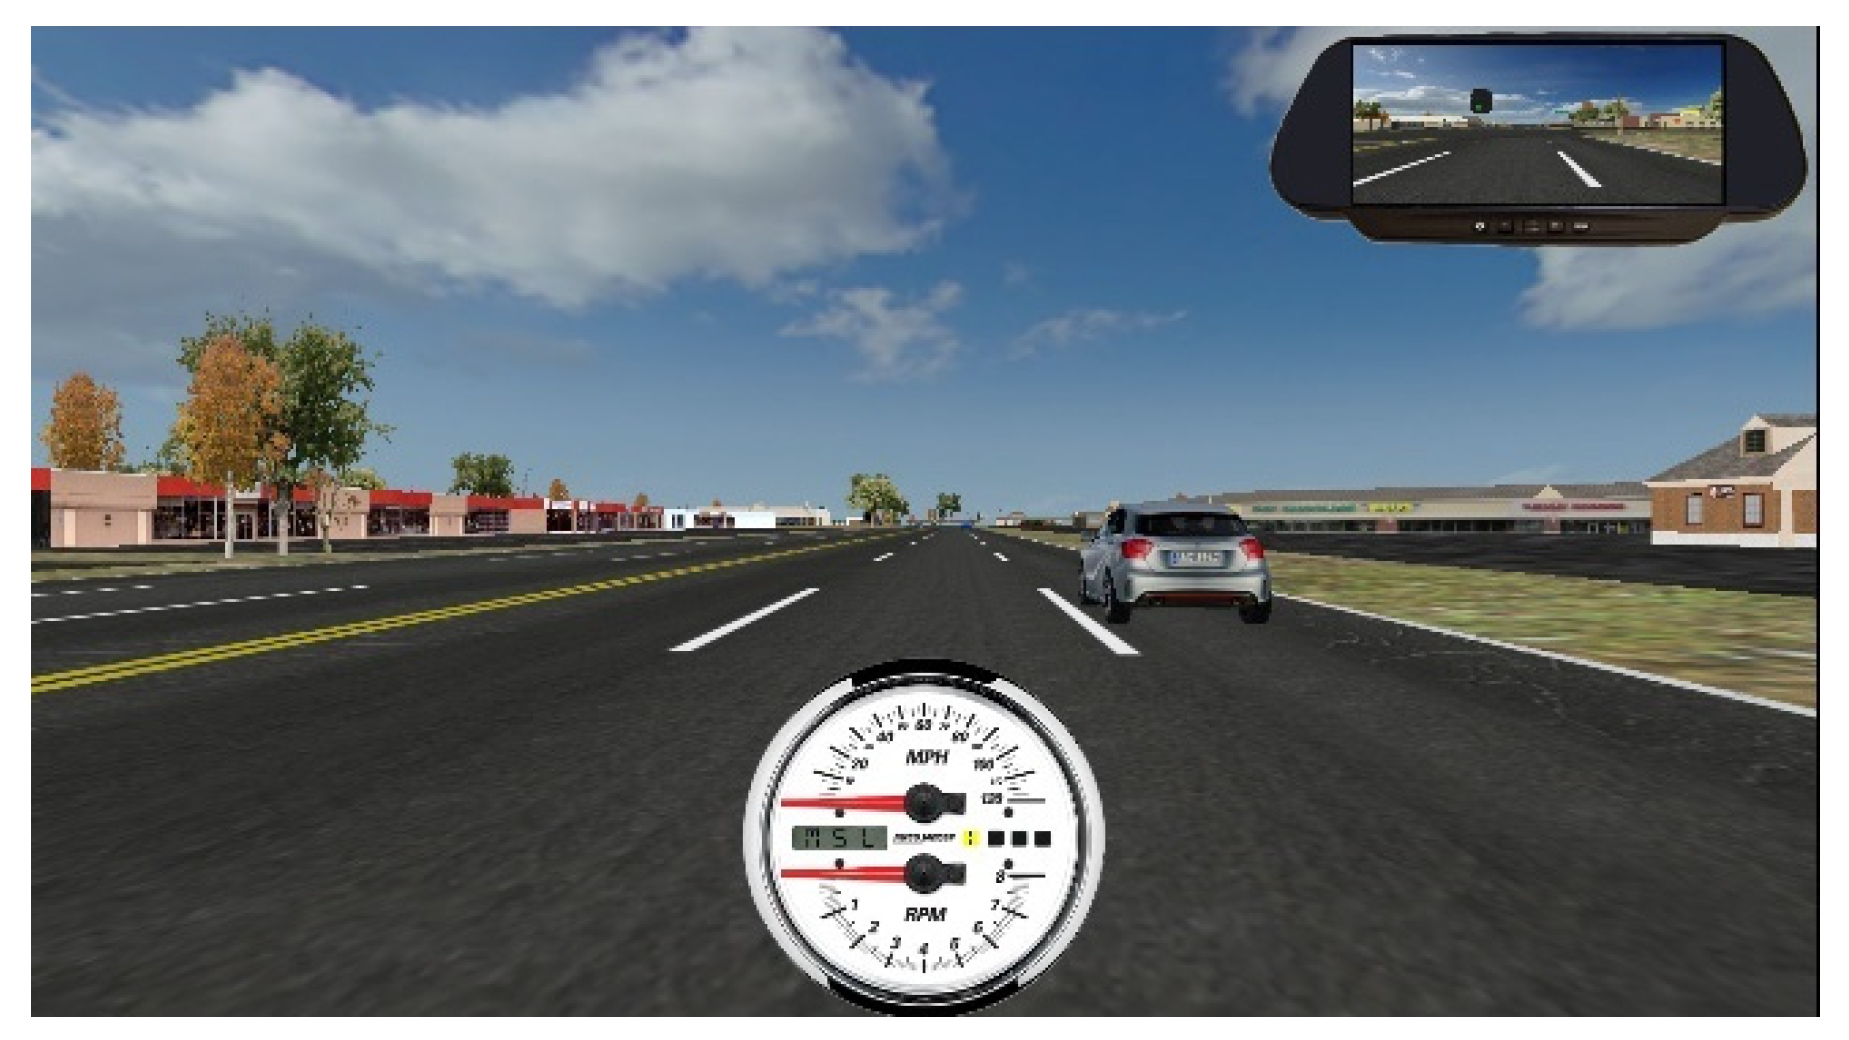
2.1.3. Stage 3: Outputs—Visual, Haptic and Audio
2.2. Training Modules
2.2.1. Closed Course Driving
2.2.2. Residential Driving
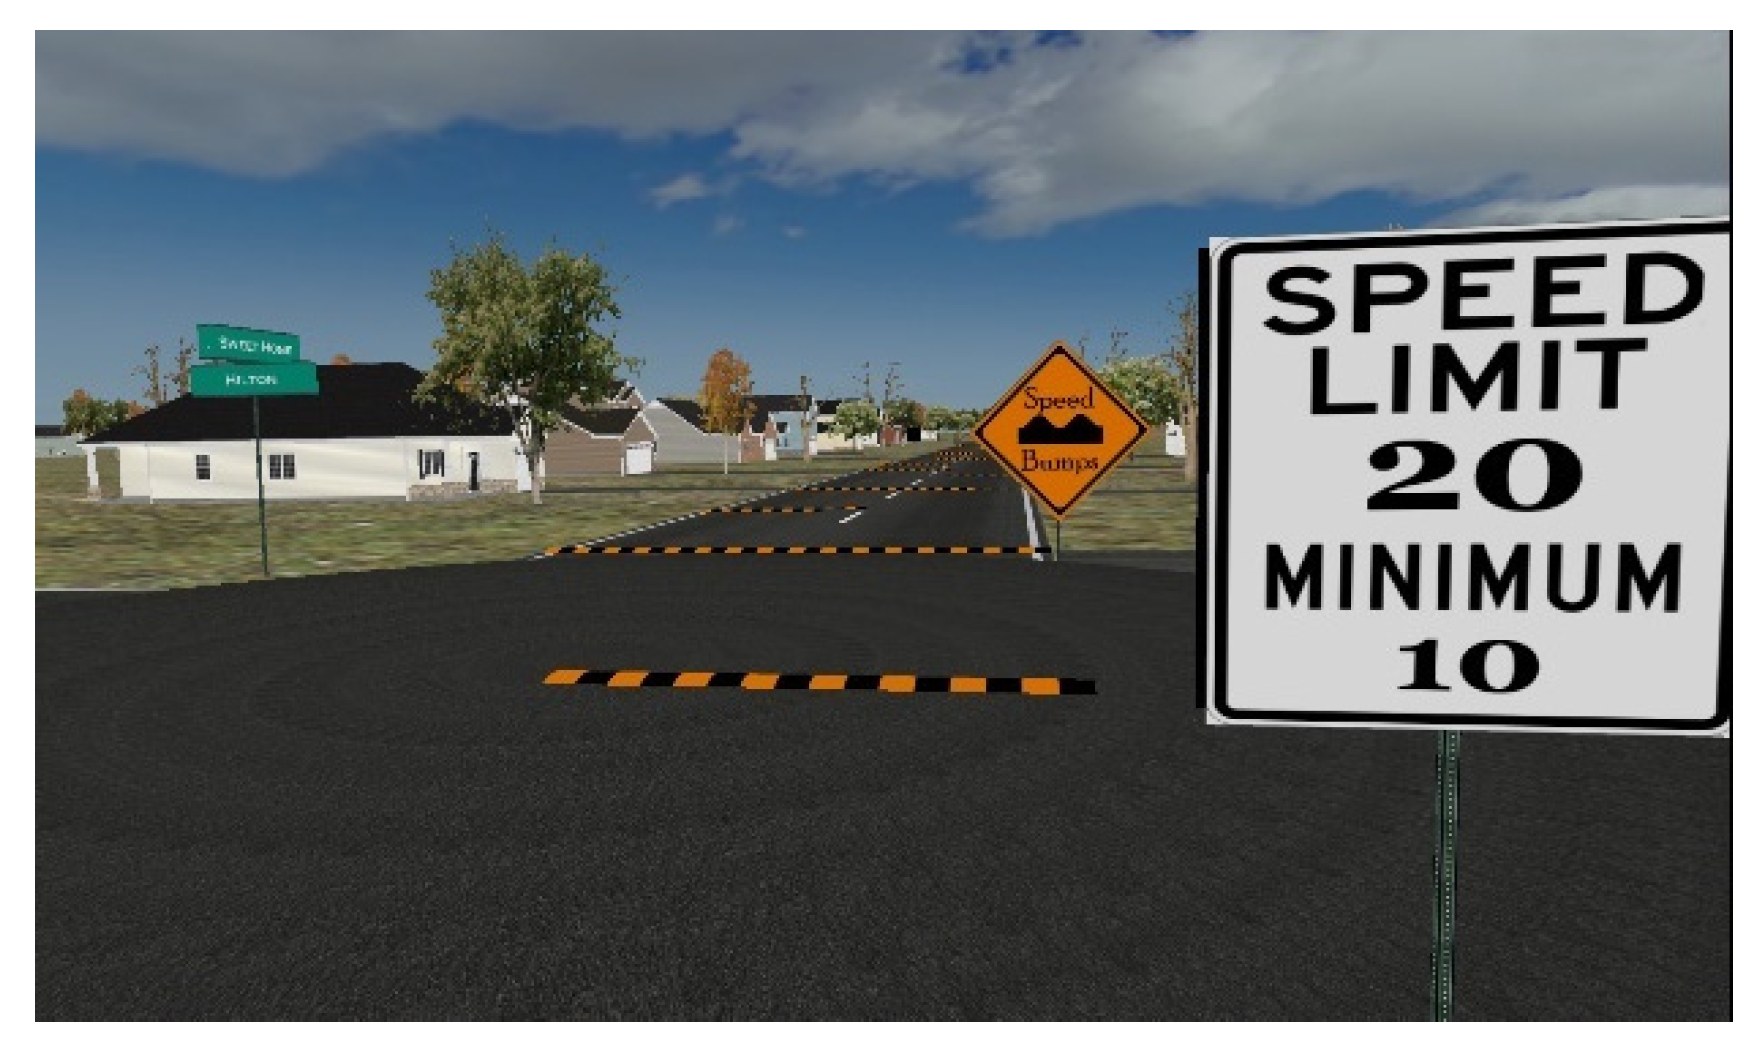
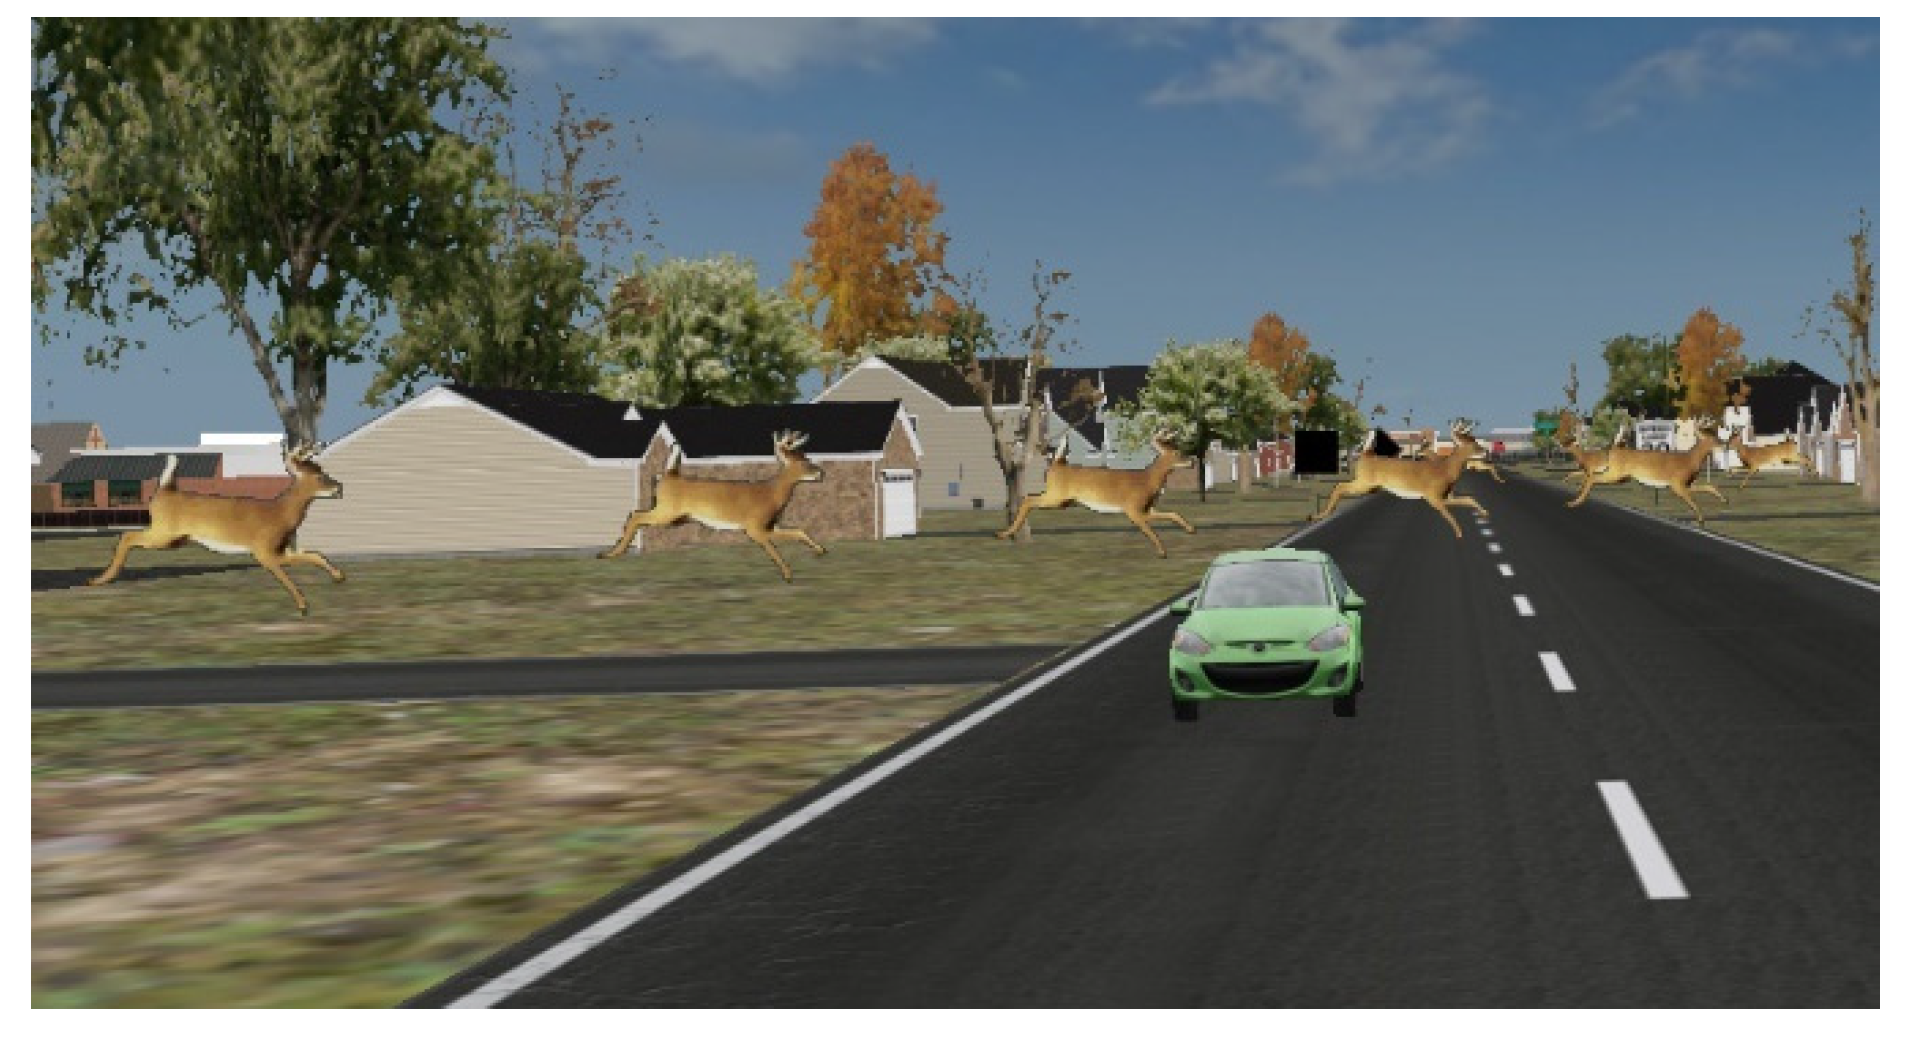
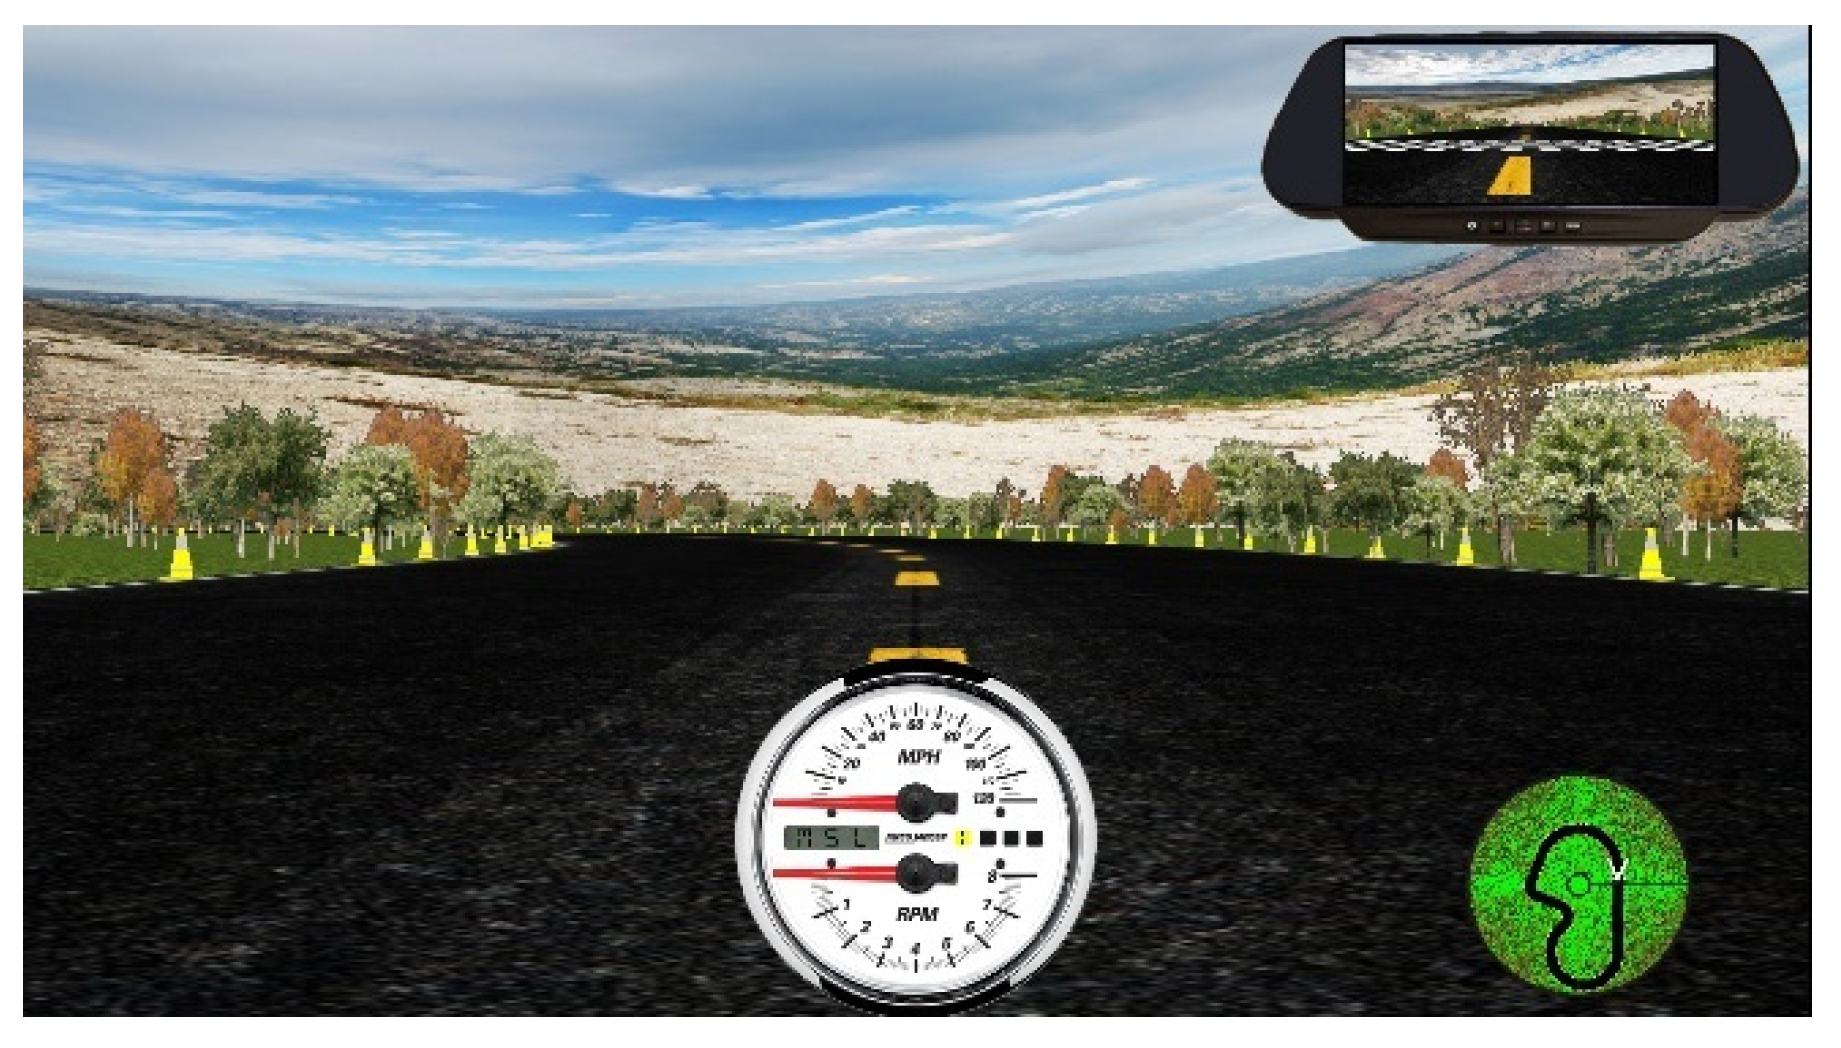
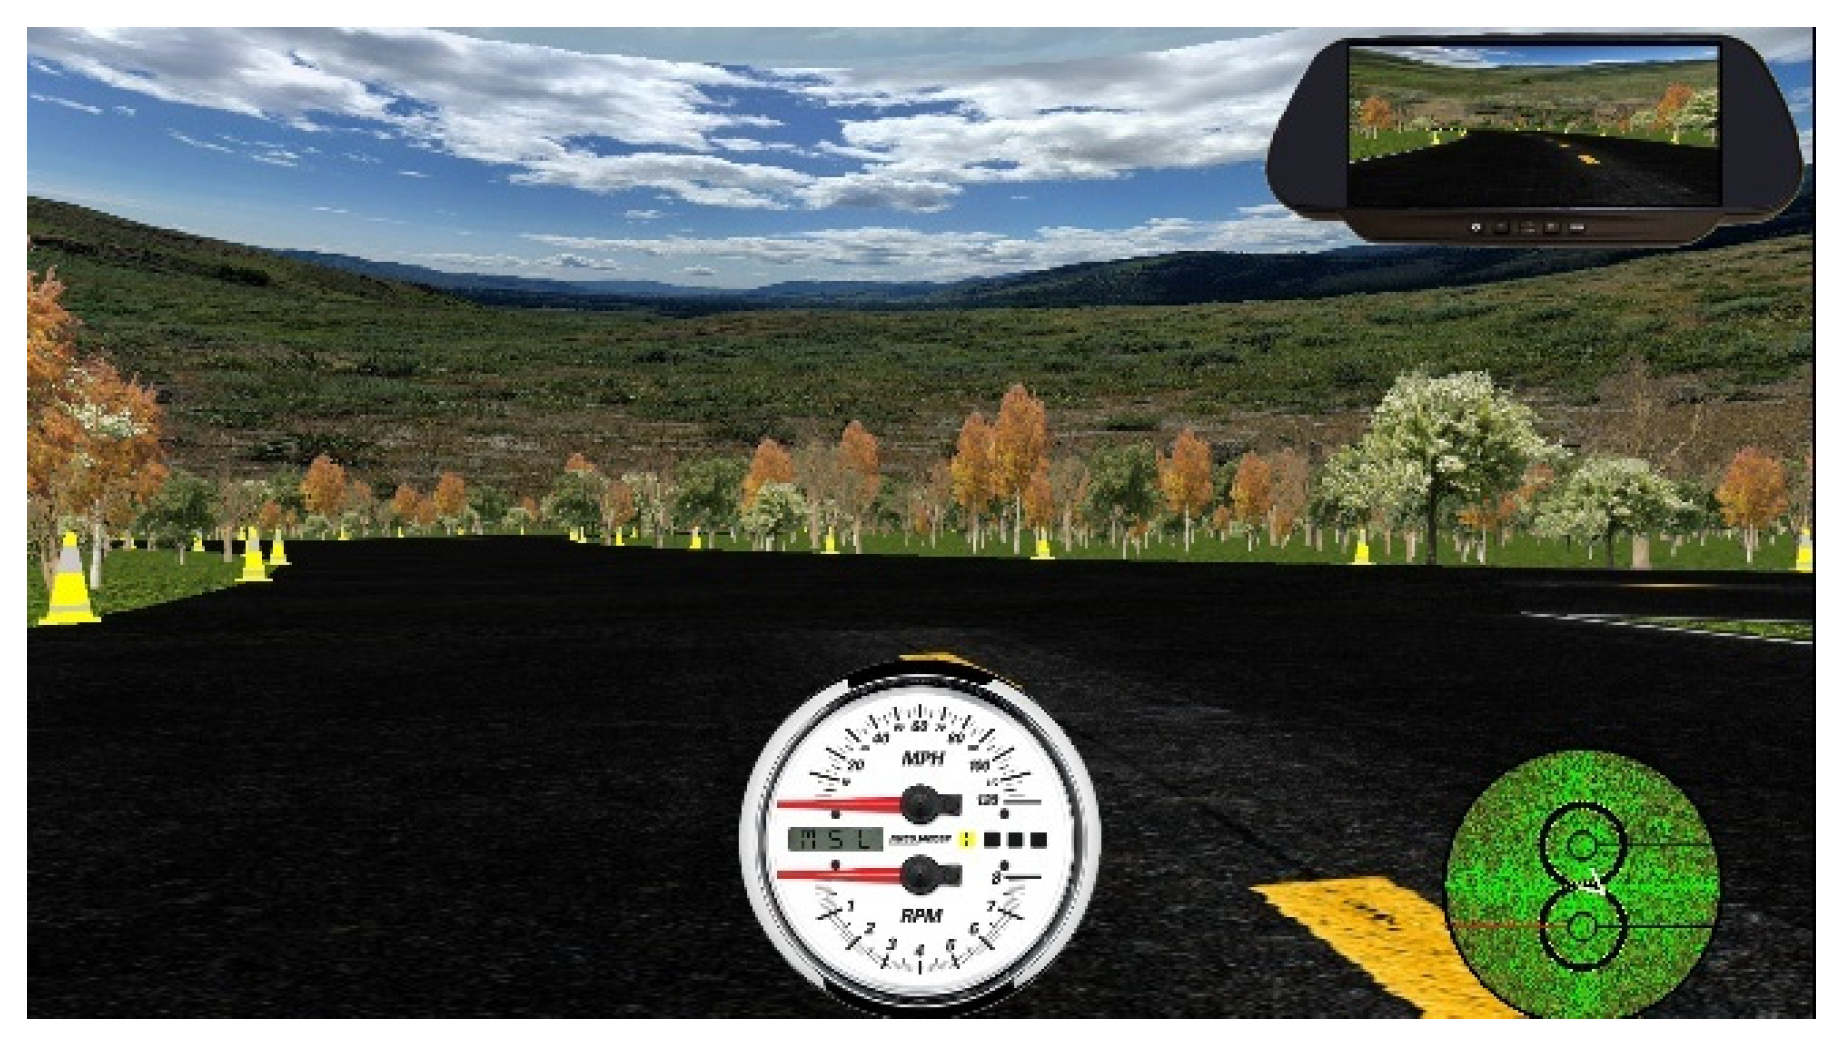
2.2.3. Challenging Scenarios
- A construction zone with roadway cones, narrow lanes, and large vehicles
- An aggressive driver (tailgater) segment in a narrowed section of roadway
- Speed modulation segments, including a section with speed bumps (see Figure 9)
- A complex highway merge with large vehicles and inclement weather
- An animal crossing within a quiet cul-de-sac (see Figure 10)
2.3. Instructional Sessions and Performance Measures
2.3.1. Quantitative Measures
2.3.2. Qualitative Measures
2.3.3. Self-Report Measures
2.4. Experimental Cohort
3. Results and Discussion
3.1. Quantitative Measures
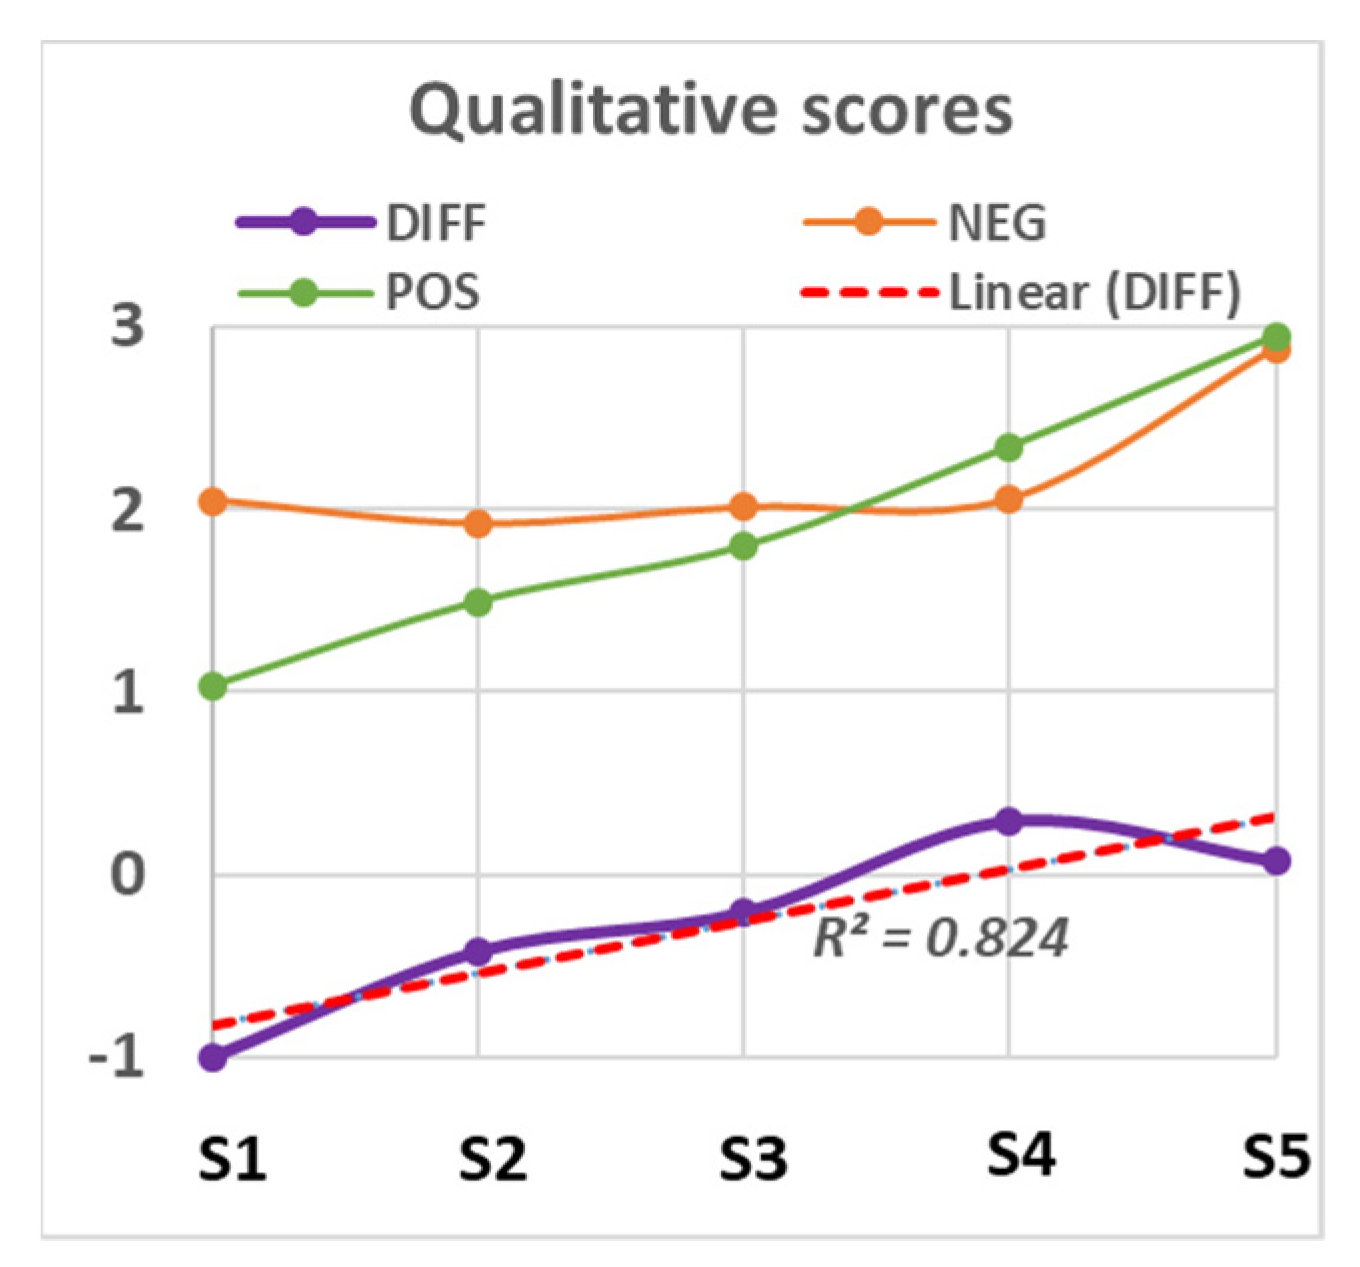
3.2. Qualitative Measures
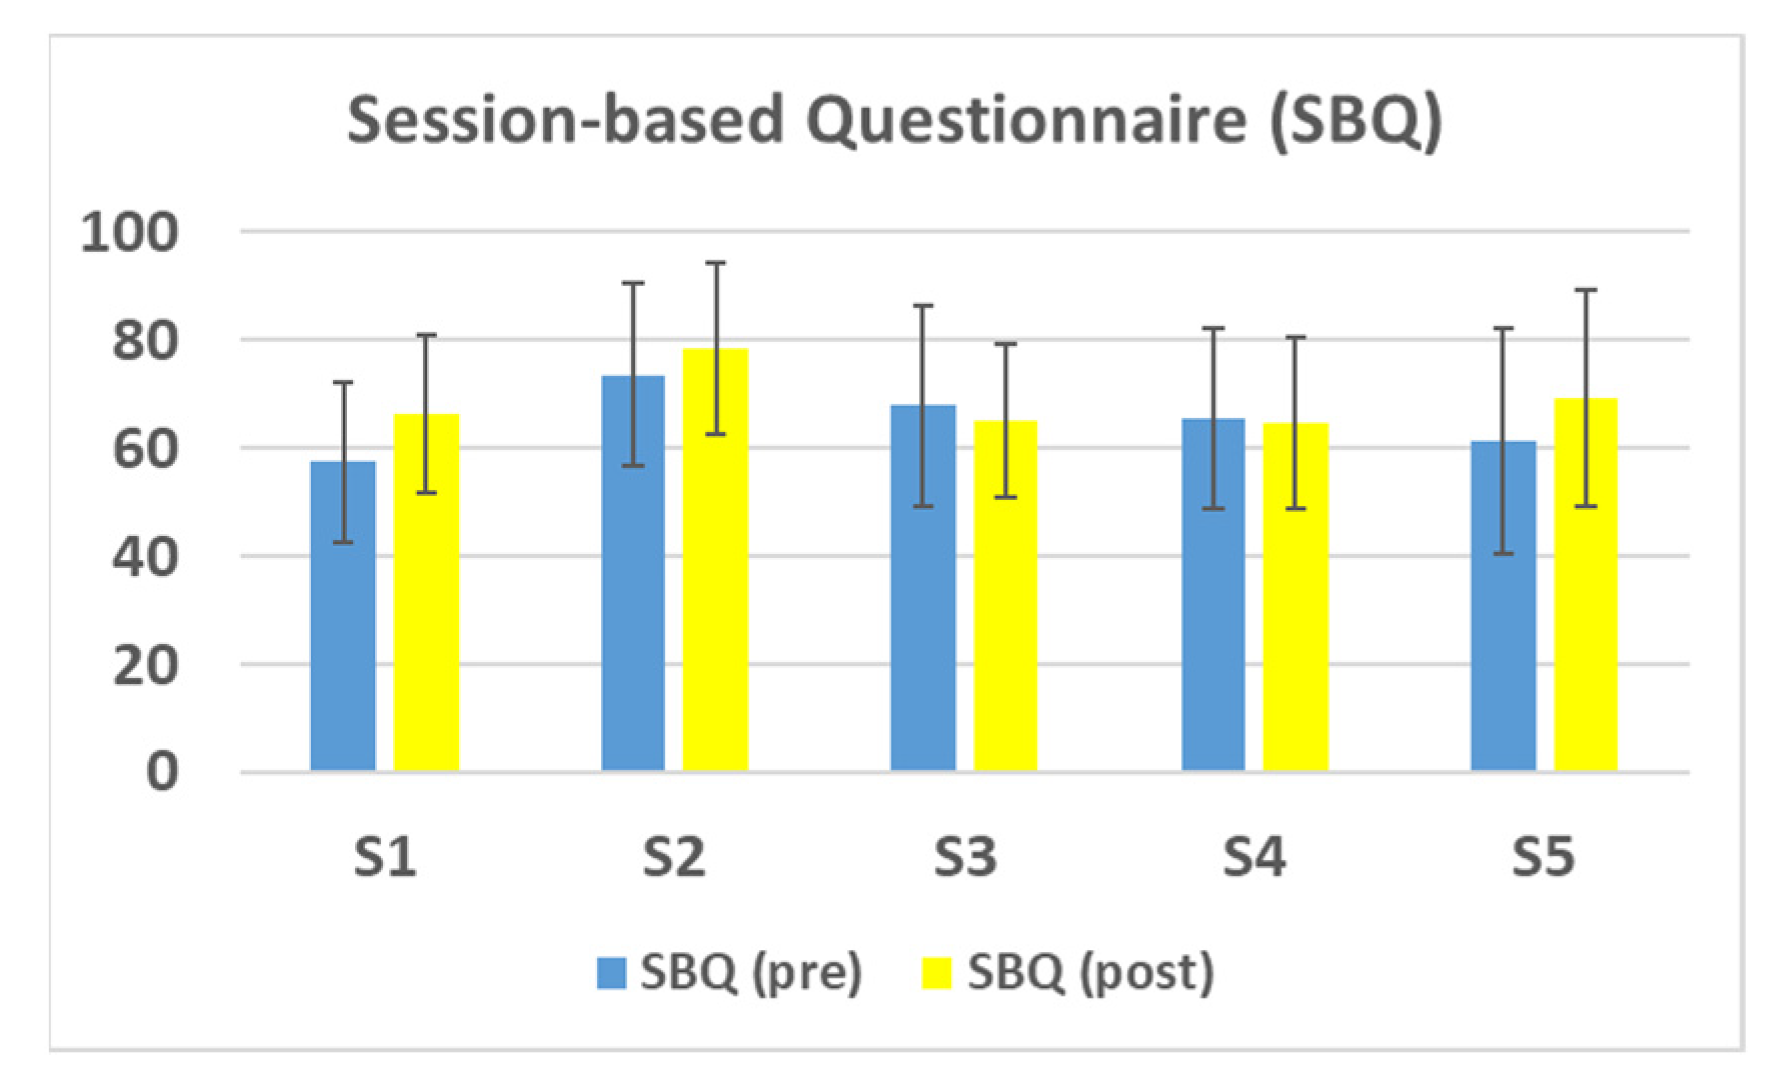
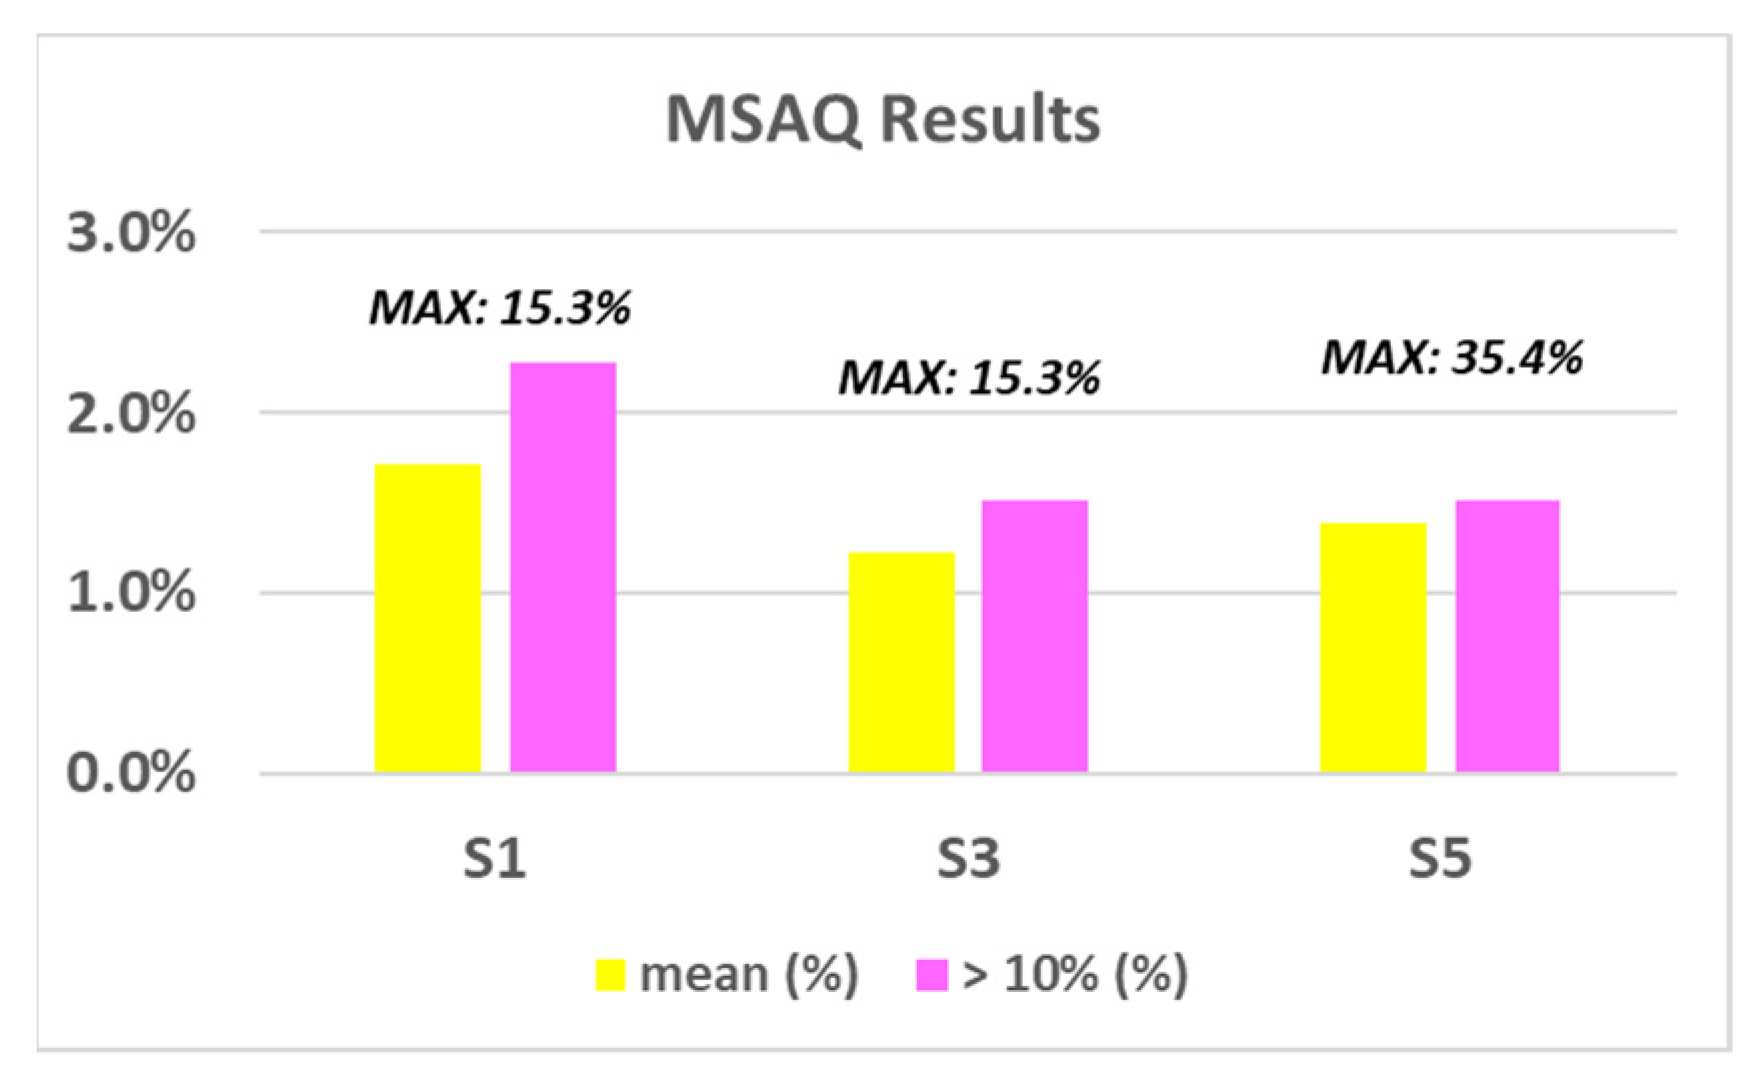
3.3. Self-Report Measures
4. Broader Impacts of Our Methodology and Implementation
5. Conclusions and Future Work
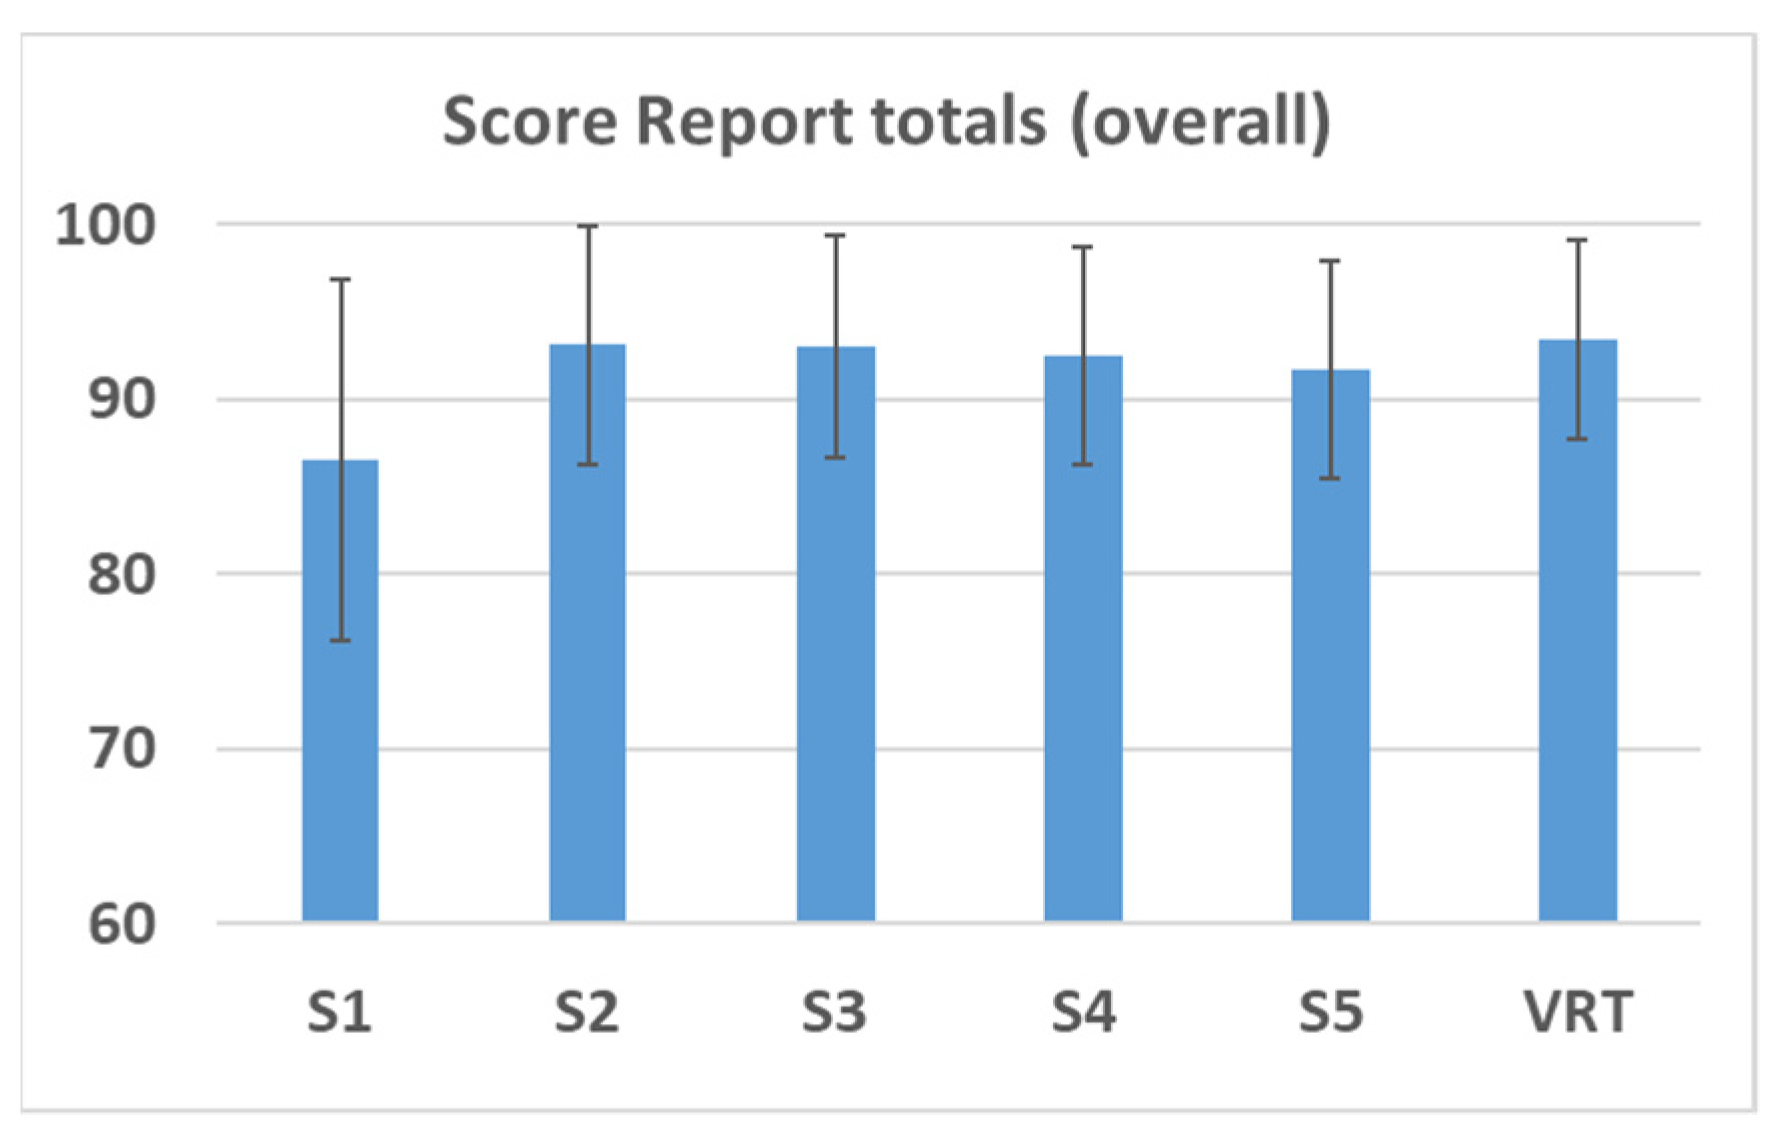
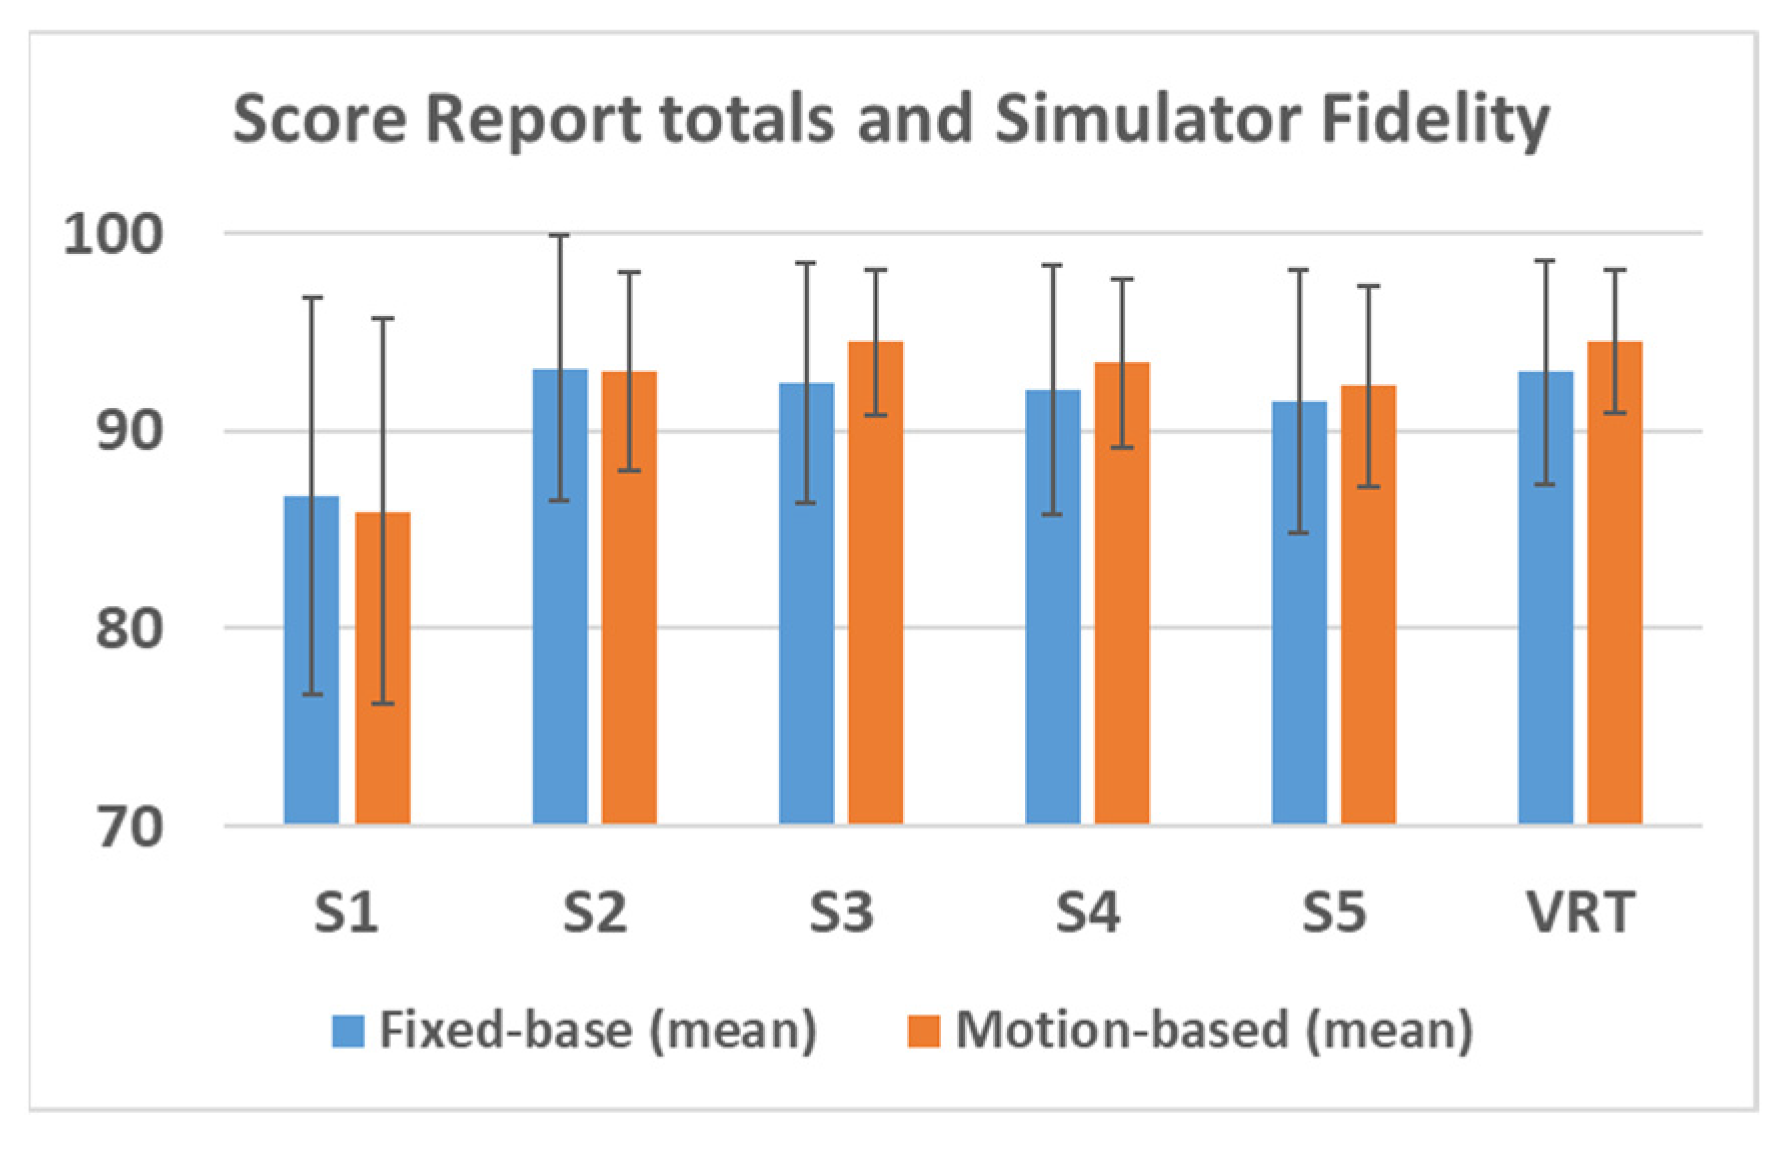
- Cohort score report total scores exhibited a general upward trend across the entire program, and these trends were moderately enhanced with the presence of motion cues (quantitative).
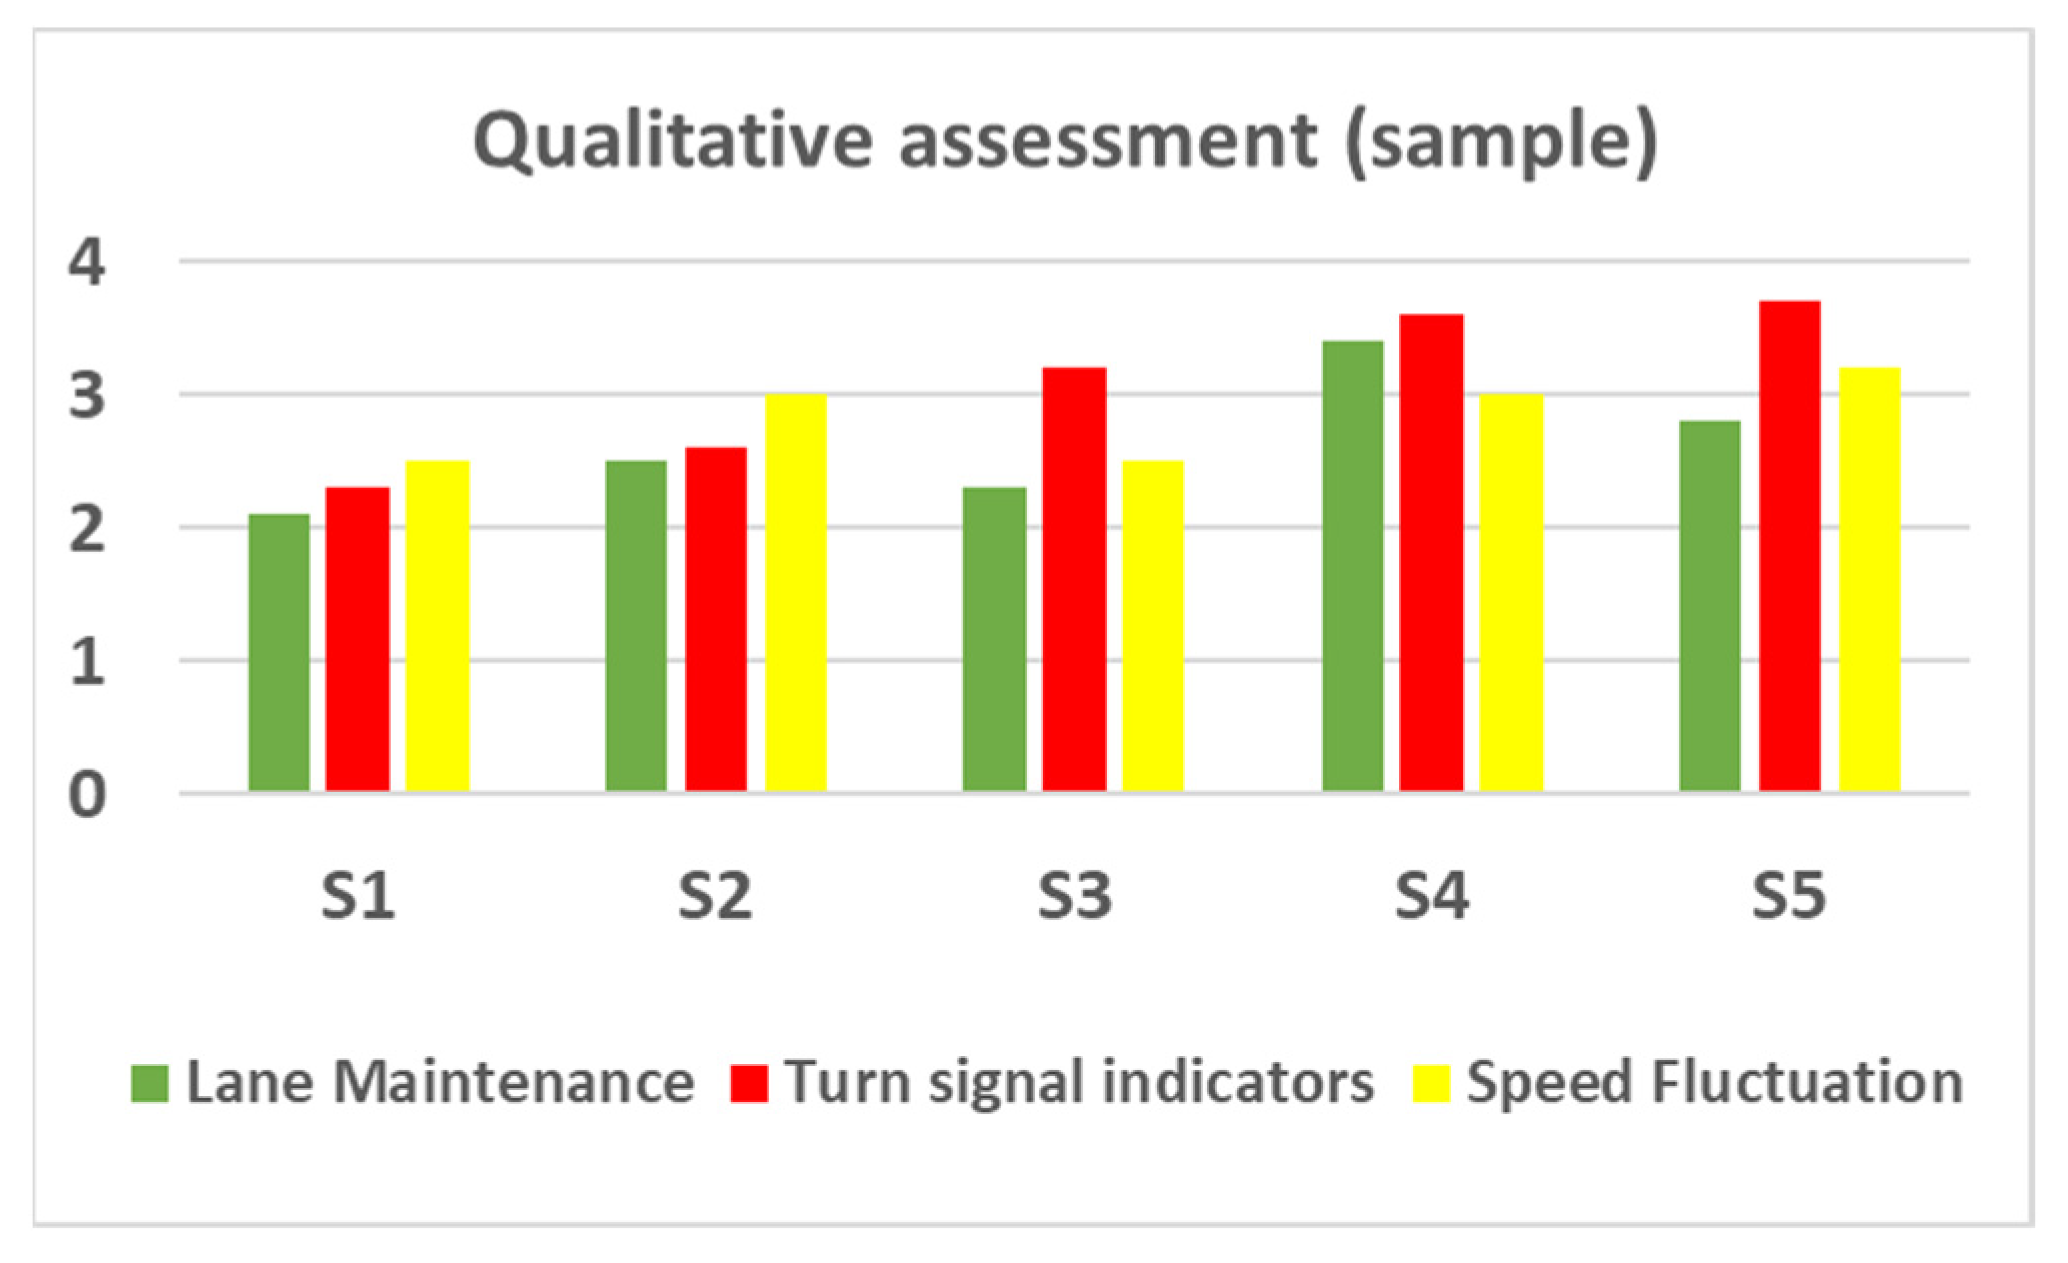
- Both negative and positive feedback evaluator comments increased as the training modules proceeded. The overarching hypothesis is that the increase in positive feedback was counteracted by the driving session evaluator’s tendency for increased “bias” in the form of growing expectations as the program proceeded (qualitative).
- Post-SBQ scores were higher than pre-SBQ scores (due to module-specific knowledge gained due to simulator exposure), as expected. Motion sickness (by way of MSAQ) was found to be insignificant, which can be credited to the experimental design (see Table 2) and to the young demographics of this specific cohort (self-report).
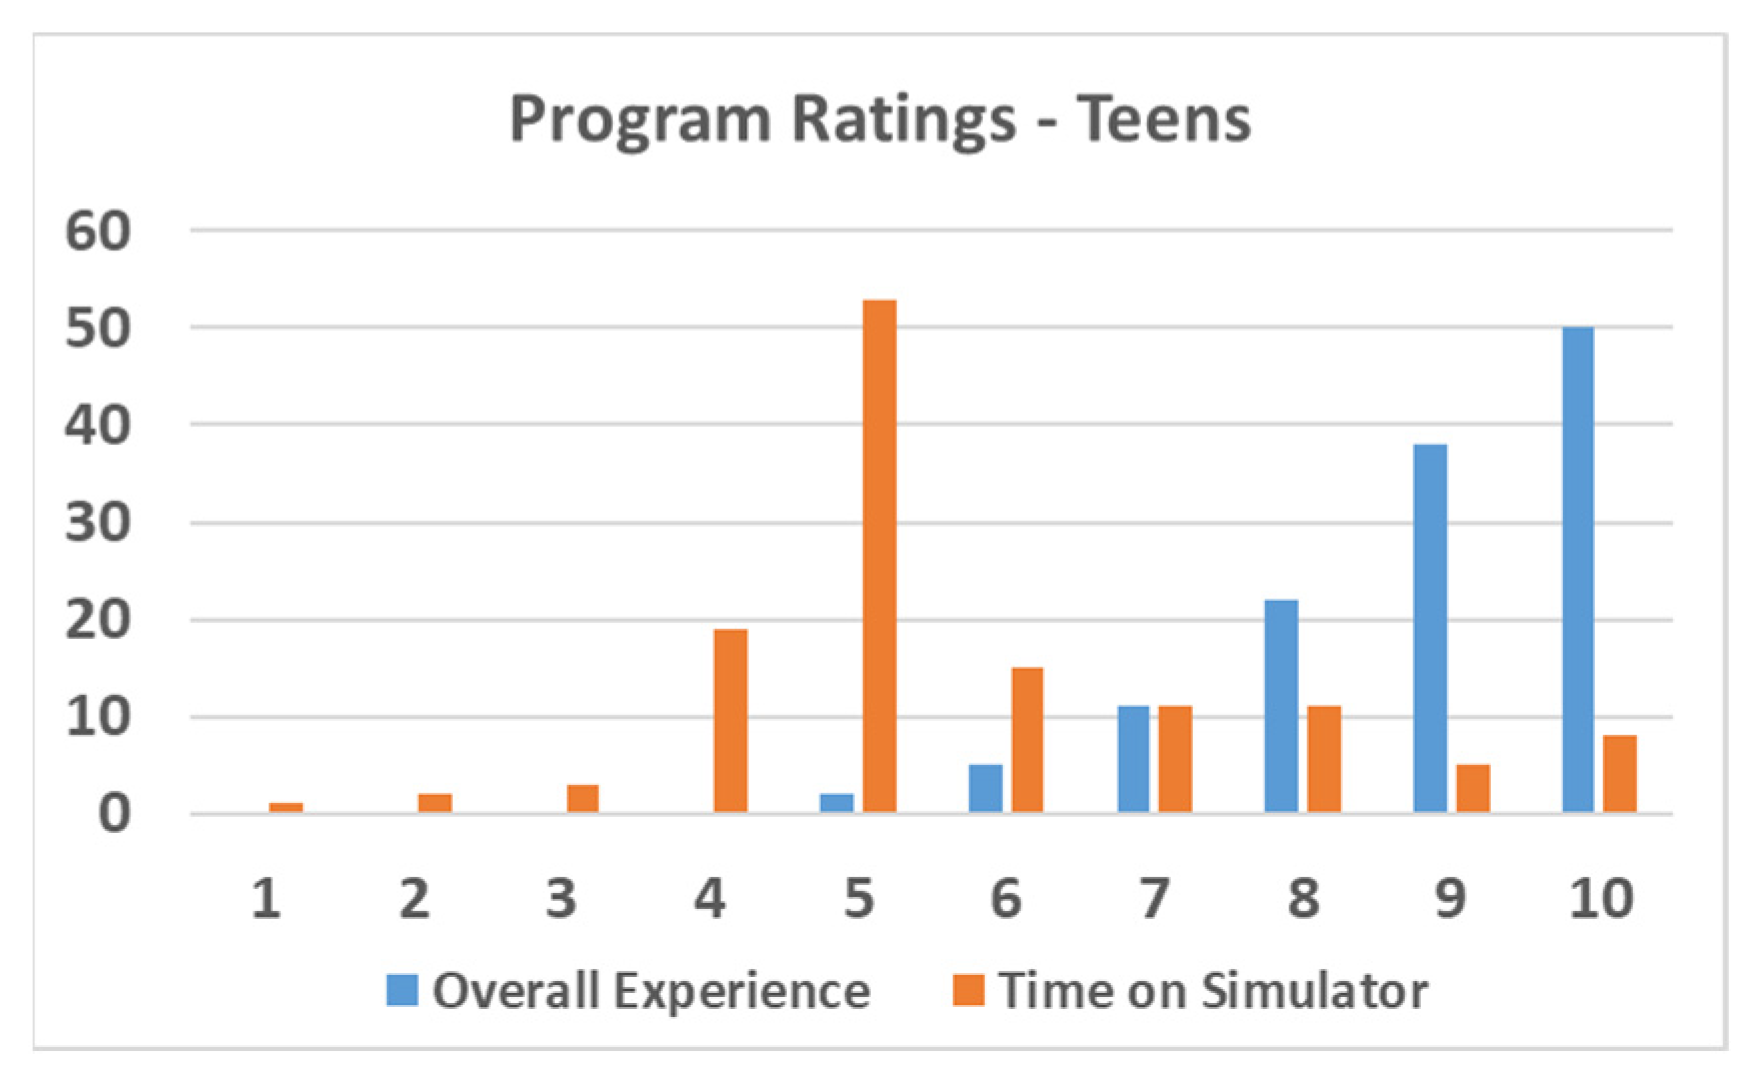
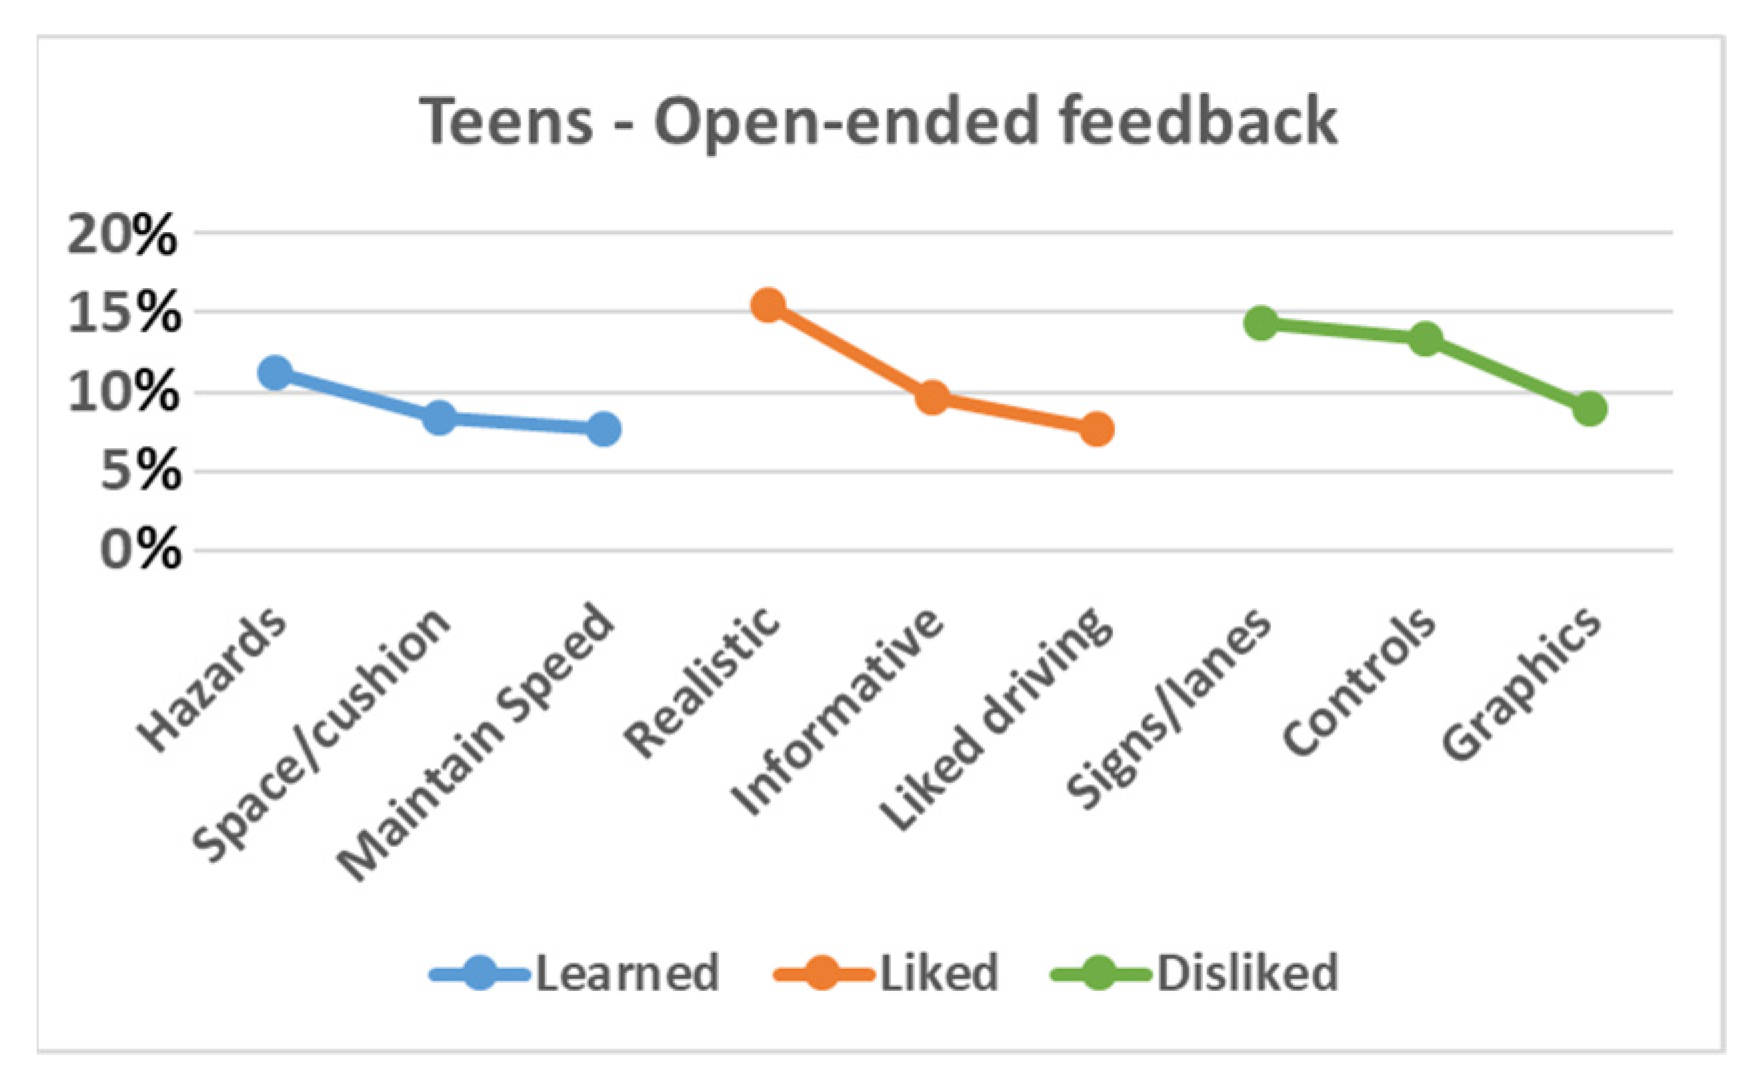
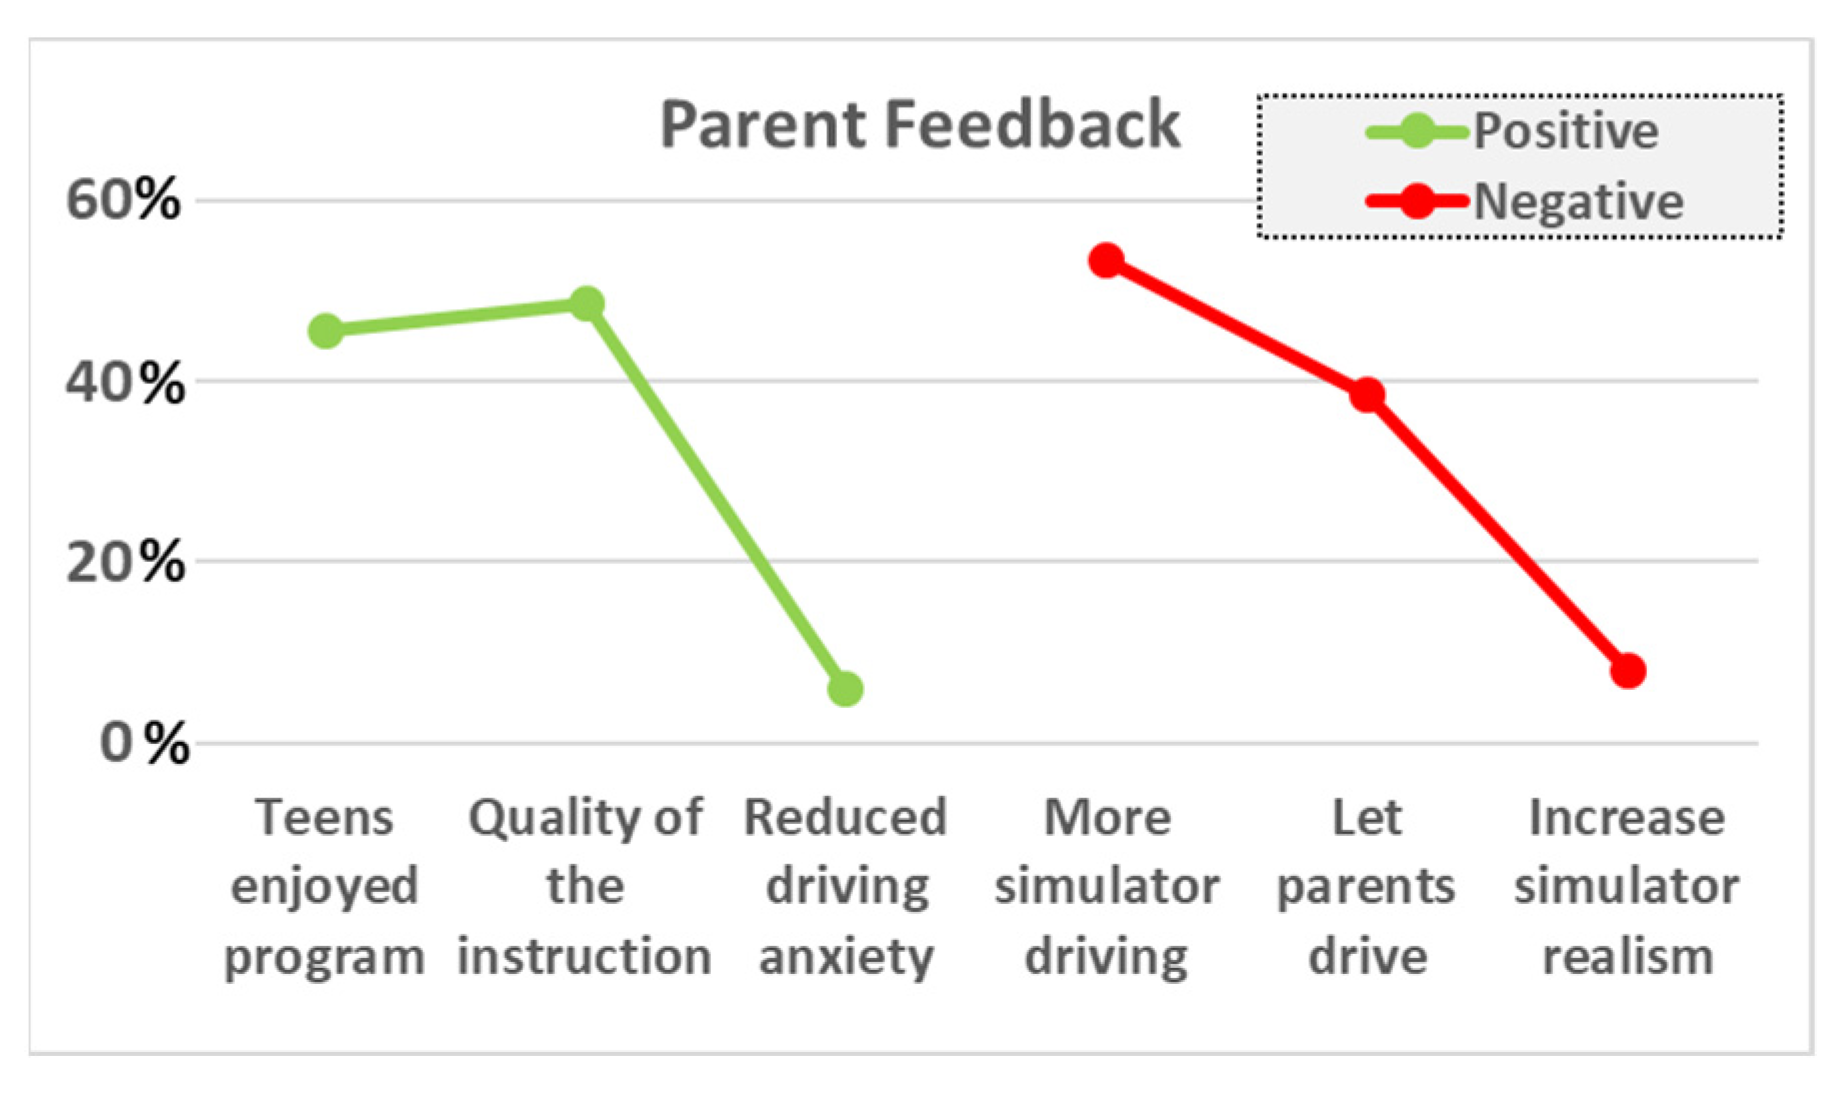
- Teens rated their experience on the simulator favorably but suggested that more of the overall session time should have been spent on the simulator itself rather than on related activities associated with the training program. They recognized the simulator as an effective way to learn but disliked some of the visual elements and control aspects of the simulator (self-report).
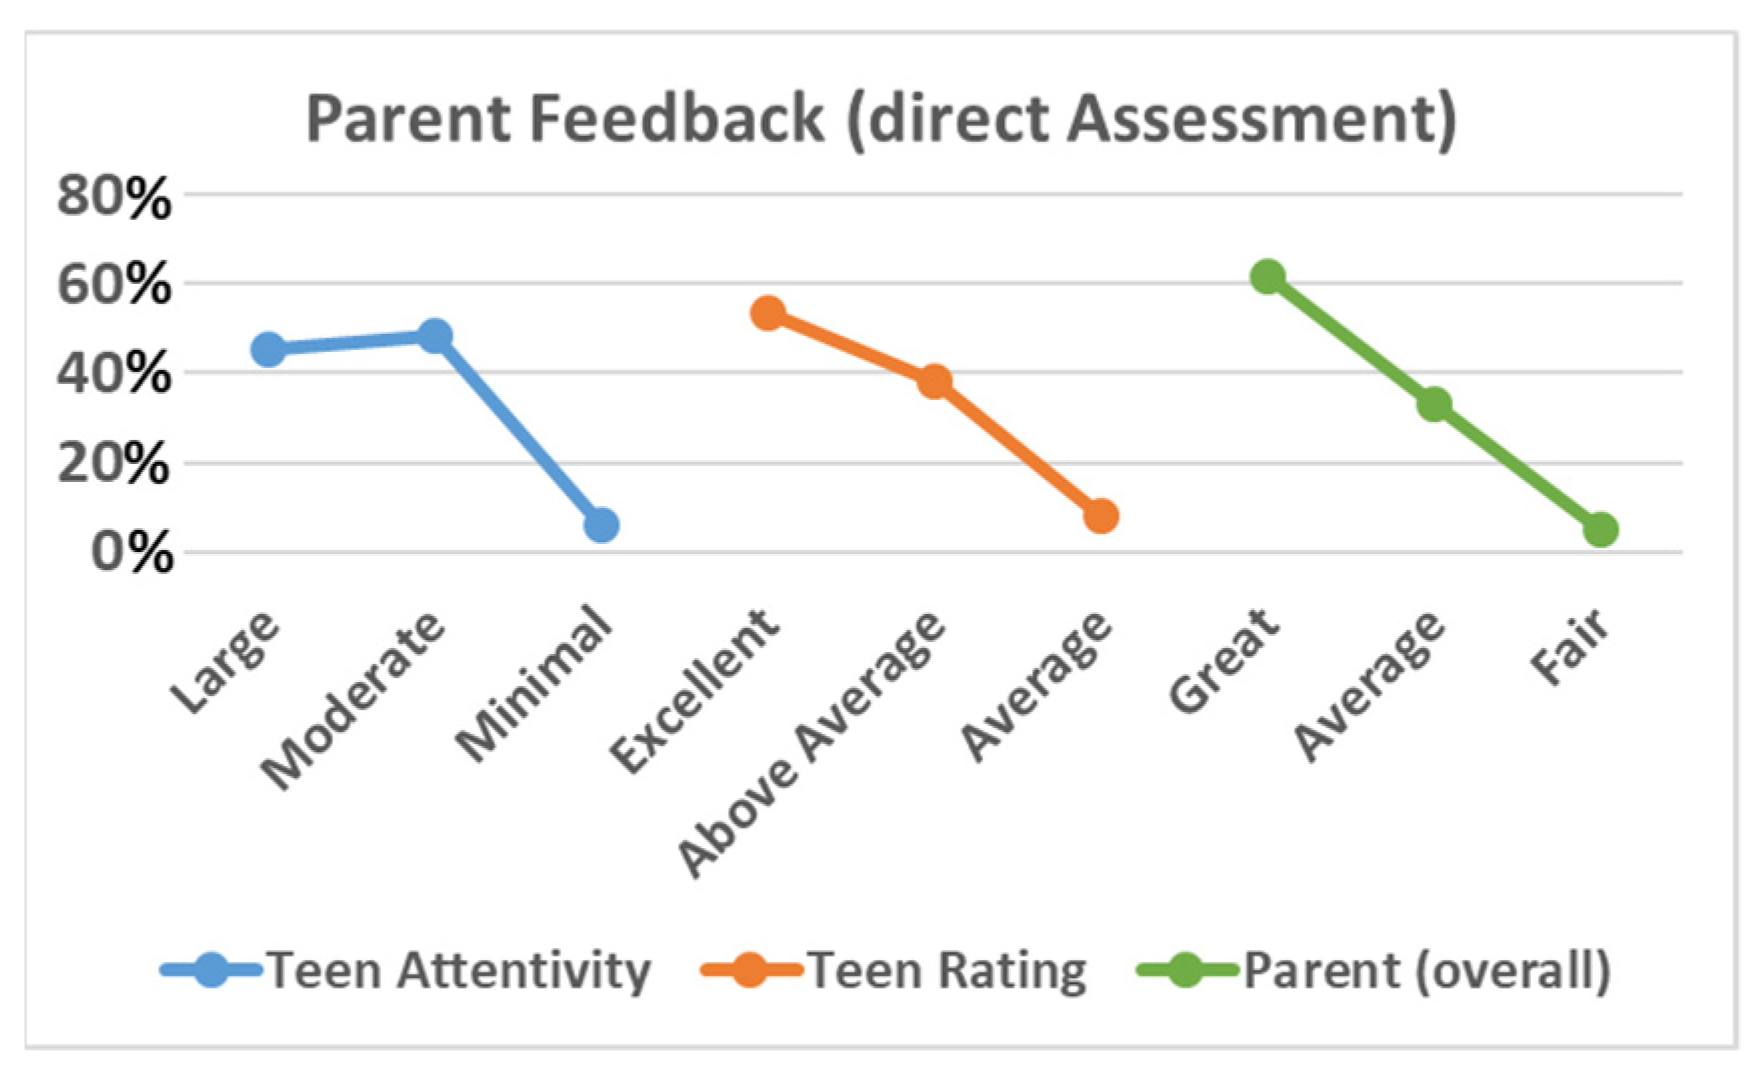
- Almost all parents agreed that the simulator program should be a first step toward future driver training. Furthermore, per their own observations of subsequent teen driving performance, favorable feedback was issued for specific driving skillsets gained, including improved recognition to road signs and road hazards (self-report).
5.1. Improved Metrics for Quantifying Simulator Performance
5.2. Improvements to Experimental Training Environment
5.3. Impairment Training Modules
5.4. Driving Exercises that Promote Reverse Egress
5.5. Driving Exercises for Driver Training on Rural Roads
5.6. Longitudinal Data to Measure Efficacy of SBT
Author Contributions
Funding
Institutional Review Board Statement
Informed Consent Statement
Data Availability Statement
Acknowledgments
Conflicts of Interest
References
- Centers for Disease Control and Prevention (CDC). WISQARS (Web-Based Injury Statistics Query and Reporting System). US Department of Health and Human Services. September 2019. Available online: https://www.cdc.gov/injury/wisqars/index.html (accessed on 12 November 2020).
- Insurance Institute for Highway Safety (IIHS). Fatality Facts 2017: Teenagers. Highway Loss Data Institute. December 2018. Available online: https://www.iihs.org/topics/fatality-statistics/detail/teenagers (accessed on 12 November 2020).
- Mayhew, D.R.; Simpson, H.M.; Pak, A. Changes in collision rates among novice drivers during the first months of driving. Accid. Anal. Prev. 2003, 35, 683–691. [Google Scholar] [CrossRef]
- McCartt, A.T.; Shabanova, V.I.; Leaf, W.A. Driving experiences, crashes, and teenage beginning drivers. Accid. Anal. Prev. 2003, 35, 311–320. [Google Scholar] [CrossRef]
- Thomas, F.D., III; Blomberg, R.D.; Fisher, D.L. A Fresh Look at Driver Education in America; Report No. DOT HS 811 543; National Highway Traffic Safety Administration: Washington, DC, USA, 2012.
- Vaa, T.; Høye, A.; Almqvist, R. Graduated driver licensing: Searching for the best composition of components. Lat. Am. J. Manag. Sustain. Dev. 2015, 2, 160. [Google Scholar] [CrossRef]
- Strayer, D.L.; Cooper, J.M.; Goethe, R.M.; McCarty, M.M.; Getty, D.J.; Biondi, F. Visual and Cognitive Demands of Using In-Vehicle Information Systems; AAA Foundation for Traffic Safety: Washington, DC, USA, 2017. [Google Scholar]
- Rechtin, M. Dumb and Dumber: America’s Driver Education is Failing Us All—Reference Mark. motortrend.com (Online Article), Published 20 June 2017. Available online: https://www.motortrend.com/news/dumb-dumber-americas-driver-education-failing-us-reference-mark/ (accessed on 26 November 2020).
- Helman, S.V.; Fildes, W.; Oxley, B.; Fernández-Medina, J.; Weekley, K. Study on Driver Training, Testing and Medical Fitness—Final Report; European Commission, Directorate-General Mobility and Transport (DG MOVE): Brussels, Belgium, 2017; ISBN 978-92-79-66623-0. [Google Scholar]
- Nalmpantis, D.; Naniopoulos, A.; Bekiaris, E.; Panou, M.; Gregersen, N.P.; Falkmer, T.; Baten, G.; Dols, J.F. “TRAINER” project: Pilot applications for the evaluation of new driver training technologies. In Traffic & Transport Psychology: Theory and Application; Underwood, G., Ed.; Elsevier: Oxford, UK, 2005; pp. 141–156. ISBN 9780080443799. [Google Scholar]
- Imtiaz, A.; Mueller, J.; Stanley, L. Driving Behavior Differences among Early Licensed Teen, Novice Teen, and Experienced Drivers in Simulator and Real World Potential Hazards. In Proceedings of the IIE Annual Conference and Expo 2014, Montreal, QC, Canada, 31 May–3 June 2014. [Google Scholar]
- Mirman, J.H.; Curry, A.E.; Winston, F.K.; Wang, W.; Elliott, M.R.; Schultheis, M.T.; Thiel, M.C.F.; Durbin, D.R. Effect of the teen driving plan on the driving performance of teenagers before licensure: A randomized clinical trial. JAMA Pediatrics 2014, 168, 764–771. [Google Scholar] [CrossRef] [PubMed] [Green Version]
- Milleville-Pennel, I.; Marquez, S. Comparison between elderly and young drivers’ performances on a driving simulator and self-assessment of their driving attitudes and mastery. Accid. Anal. Prev. 2020, 135, 105317. [Google Scholar] [CrossRef] [PubMed]
- Martín-delosReyes, L.M.; Jiménez-Mejías, E.; Martínez-Ruiz, V.; Moreno-Roldán, E.; Molina-Soberanes, D.; Lardelli-Claret, P. Efficacy of training with driving simulators in improving safety in young novice or learner drivers: A systematic review. Transp. Res. Part F Traffic Psychol. Behav. 2019, 62, 58–65. [Google Scholar] [CrossRef]
- Campbell, B.T.; Borrup, K.; Derbyshire, M.; Rogers, S.; Lapidus, G. Efficacy of Driving Simulator Training for Novice Teen Drivers. Conn. Med. 2016, 80, 291–296. [Google Scholar] [PubMed]
- De Groot, S.; De Winter, J.C.F.; Mulder, M.; Wieringa, P.A. Didactics in simulator based driver training: Current state of affairs and future potential. In Proceedings of the Driving Simulation Conference North America, Iowa City, IA, USA, 12–14 September 2007. [Google Scholar]
- McDonald, C.C.; Goodwin, A.H.; Pradhan, A.K.; Romoser MR, E.; Williams, A.F. A Review of Hazard Anticipation Training Programs for Young Drivers. J. Adolesc. Health 2015, 57 (Suppl. 1), S15–S23. [Google Scholar] [CrossRef] [Green Version]
- Fuller, R. Driver training and assessment: Implications of the task-difficulty homeostasis model. In Driver Behaviour and Training; Dorn, L., Ed.; Ashgate: Dublin, Ireland, 2007; Volume 3, pp. 337–348. [Google Scholar]
- Hulme, K.F.; Kasprzak, E.; English, K.; Moore-Russo, D.; Lewis, K. Experiential Learning in Vehicle Dynamics Education via Motion Simulation and Interactive Gaming. Int. J. Comput. Games Technol. 2009, 2009, 952524. [Google Scholar] [CrossRef] [Green Version]
- Hulme, K.F.; Lewis, K.E.; Kasprzak, E.M.; Russo, D.-M.; Singla, P.; Fuglewicz, D.P. Game-based Experiential Learning in Dynamics Education Using Motion Simulation. In Proceedings of the Interservice/Industry Training, Simulation and Education Conference (I/ITSEC), Orlando, FL, USA, 29 November–2 December 2010. [Google Scholar]
- Wickens, C.; Toplak, M.; Wiesenthal, D. Cognitive failures as predictors of driving errors, lapses, and violations. Accid. Anal. Prev. 2008, 40, 1223–1233. [Google Scholar] [CrossRef] [PubMed]
- Chiu-Shui, C.; Chien-Hui, W. How Real is the Sense of Presence in a Virtual Environment?: Applying Protocol Analysis for Data Collection. In Proceedings of the CAADRIA 2005: 10th International Conference on Computer Aided Design Research in Asia, New Delhi, India, 28–30 April 2005. [Google Scholar]
- Berkman, M.I.; Akan, E. Presence and Immersion in Virtual Reality. In Encyclopedia of Computer Graphics and Games; Lee, N., Ed.; Springer: Berlin/Heidelberg, Germany, 2019. [Google Scholar] [CrossRef]
- Groeger, J.A.; Banks, A.P. Anticipating the content and circumstances of skill transfer: Unrealistic expectations of driver training and graduated licensing? Ergonomics 2007, 50, 1250–1263. [Google Scholar] [CrossRef] [PubMed] [Green Version]
- Kaptein, N.; Theeuwes, J.; van der Horst, R. Driving Simulator Validity: Some Considerations. Transp. Res. Rec. 1996, 1550, 30–36. [Google Scholar] [CrossRef]
- Godley, S.T.; Triggs, T.J.; Fildes, B.N. Driving simulator validation for speed research. Accid. Anal. Prev. 2002, 34, 589–600. [Google Scholar] [CrossRef]
- Bella, F. Driving simulator for speed research on two-lane rural roads. Accid. Anal. Prev. 2008, 40, 1078–1087. [Google Scholar] [CrossRef]
- Stoner, H.A.; Fisher, D.; Mollenhauer, M., Jr. Simulator and scenario factors influencing simulator sickness. In Handbook of Driving Simulation for Engineering, Medicine, and Psychology; CRC Press: Boca Raton, FL, USA, 2011. [Google Scholar]
- Pettijohn, K.; Pistone, D.; Warner, A.; Roush, G.; Biggs, A. Postural Instability and Seasickness in a Motion-Based Shooting Simulation. Aerosp. Med. Hum. Perform. 2020, 91, 703–709. [Google Scholar] [CrossRef]
- Keshavarz, B.; Ramkhalawansingh, R.; Haycock, B.; Shahab, S.; Campos, J. Comparing simulator sickness in younger and older adults during simulated driving under different multisensory conditions. Transp. Res. Part F Traffic Psychol. Behav. 2018, 54, 47–62. [Google Scholar] [CrossRef]
- Gee, J.P. What Games Have to Teach Us about Learning and Literacy; Palgrave Macmillan: New York, NY, USA, 2007. [Google Scholar]
- Lee, J.; Hammer, J. Gamification in Education: What, How, Why Bother? Acad. Exch. Q. 2011, 15, 146. [Google Scholar]
- Hulme, K.F.; Androutselis, T.; Eker, U.; Anastasopoulos, P. A Game-based Modeling and Simulation Environment to Examine the Dangers of Task-Unrelated Thought While Driving. In Proceedings of the MODSIM World Conference, Virginia Beach, VA, USA, 25–27 April 2016. [Google Scholar]
- Milliken, W.F.; Milliken, D.L. Race Car Vehicle Dynamics; Society of Automotive Engineers: Warrendale, PA, USA, 1995. [Google Scholar]
- Rajamani, R. Vehicle Dynamics and Control; Springer: New York, NY, USA, 2006; ISBN 0-387-26396-9. [Google Scholar]
- Raghuwanshi, V.; Salunke, S.; Hou, Y.; Hulme, K.F. Development of a Microscopic Artificially Intelligent Traffic Model for Simulation. In Proceedings of the Interservice/Industry Training, Simulation and Education Conference (I/ITSEC), Orlando, FL, USA, 1–4 December 2014. [Google Scholar]
- Romano, R. Non-linear Optimal Tilt Coordination for Washout Algorithms. In Proceedings of the AIAA Modeling and Simulation Technologies Conference and Exhibit, AIAA 2003, Austin, TX, USA, 11–14 August 2003; p. 5681. [Google Scholar] [CrossRef]
- Bowles, R.L.; Parrish, R.V.; Dieudonne, J.E. Coordinated Adaptive Washout for Motion Simulators. J. Aircr. 1975, 12, 44–50. [Google Scholar] [CrossRef]
- Sung-Hua, C.; Li-Chen, F. An optimal washout filter design for a motion platform with senseless and angular scaling maneuvers. In Proceedings of the 2010 American Control Conference, ACC 2010, Baltimore, MD, USA, 30 June–2 July 2010; pp. 4295–4300. [Google Scholar] [CrossRef]
- Akutagawa, K.; Wakao, Y. Stabilization of Vehicle Dynamics by Tire Digital Control—Tire Disturbance Control Algorithm for an Electric Motor Drive System. World Electr. Veh. J. 2019, 10, 25. [Google Scholar] [CrossRef] [Green Version]
- New York State Department of Health (NYSDOH). Car Safety—Teen Driving Safety, (Online Statistics Portal). 2020. Available online: https://www.health.ny.gov/prevention/injury_prevention/teens.htm (accessed on 16 November 2020).
- Fabiano, G.A.; Hulme, K.; Linke, S.M.; Nelson-Tuttle, C.; Pariseau, M.E.; Gangloff, B.; Lewis, K.; Pelham, W.E.; Waschbusch, D.A.; Waxmonsky, J.; et al. The Supporting a Teen’s Effective Entry to the Roadway (STEER) Program: Feasibility and Preliminary Support for a Psychosocial Intervention for Teenage Drivers with ADHD. Cogn. Behav. Pract. 2011, 18, 267–280. [Google Scholar] [CrossRef]
- Fabiano, G.; Schatz, N.K.; Hulme, K.F.; Morris, K.L.; Vujnovic, R.K.; Willoughby, M.T.; Hennessy, D.; Lewis, K.E.; Owens, J.; Pelham, W.E. Positive Bias in Teenage Drivers with ADHD within a Simulated Driving Task. J. Atten. Disord. 2015, 22, 1150–1157. [Google Scholar] [CrossRef]
- Overton, R.A. Driving Simulator Transportation Safety: Proper Warm-up Testing Procedures, Distracted Rural Teens, and Gap Acceptance Intersection Sight Distance Design. Ph.D. Thesis, University of Tennessee, Knoxville, TN, USA, 2012. Available online: https://trace.tennessee.edu/utk_graddiss/1462 (accessed on 2 December 2020).
- Gianaros, P.; Muth, E.; Mordkoff, J.; Levine, M.; Stern, R. A Questionnaire for the Assessment of the Multiple Dimensions of Motion Sickness. Aviat. Space Environ. Med. 2001, 72, 115–119. [Google Scholar]
- De Winter, J.C.; de Groot, S.; Mulder, M.; Wieringa, P.A.; Dankelman, J.; Mulder, J.A. Relationships between driving simulator performance and driving test results. Ergonomics 2009, 52, 137–153. [Google Scholar] [CrossRef] [PubMed]
- Hirsch, P.; Bellavance, F.; Choukou, M.-A. Transfer of training in basic control skills from a truck simulator to a real truck. J. Transp. Res. Board 2017, 2637, 67–73. [Google Scholar] [CrossRef]
- Clinewood. Are Driving Simulators Beneficial for Truck Driving Training? 2018. Available online: https://clinewood.com/2018/02/19/driving-simulators-beneficial-truck-driving-training/ (accessed on 22 November 2020).
- Salas, E.; Bowers, C.A.; Rhodenizer, L. It is not how much you have but how you use it: Toward a rational use of simulation to support aviation training. Int. J. Aviat. Psychol. 1998, 8, 197–208. [Google Scholar] [CrossRef] [PubMed]
- Straus, S.G.; Matthew, W.L.; Kathryn, C.; Rick, E.; Matthew, E.B.; Timothy, M.; Christopher, M.C.; Geoffrey, E.G.; Heather, S. Collective Simulation-Based Training in the U.S. Army: User Interface Fidelity, Costs, and Training Effectiveness. Santa Monica, CA: RAND Corporation. 2019. Available online: https://www.rand.org/pubs/research_reports/RR2250.html (accessed on 18 November 2020).
- Hays, R.T.; Michael, J.S. Simulation Fidelity in Training System Design: Bridging the Gap between Reality and Training; Springer: New York, NY, USA, 1989. [Google Scholar]
- Wu, Y.; Boyle, L.; McGehee, D.; Roe, C.; Ebe, K.; Foley, J. Modeling Types of Pedal Applications Using a Driving Simulator. Hum. Factors 2015, 57, 1276–1288. [Google Scholar] [CrossRef] [PubMed]
- Kemeny, A.; Panerai, F. Evaluating perception in driving simulation experiments. Trends Cogn. Sci. 2003, 7, 31–37. [Google Scholar] [CrossRef]
- Delgado, M.K.; Wanner, K.; McDonald, C. Adolescent Cellphone Use While Driving: An Overview of the Literature and Promising Future Directions for Prevention. Media Commun. 2016, 4, 79. [Google Scholar] [CrossRef] [PubMed] [Green Version]
- Hulme, K.F.; Morris, K.L.; Anastasopoulos, P.; Fabiano, G.A.; Frank, M.; Houston, R. Multi-measure Assessment of Internal Distractions on Driver/Pilot Performance. In Proceedings of the Interservice/Industry Training, Simulation and Education Conference (I/ITSEC), Orlando, FL, USA, 30 November–4 December 2015. [Google Scholar]
- Centers for Disease Control and Prevention (CDC). Vital Signs, Teen Drinking and Driving. 2020. Available online: https://www.cdc.gov/vitalsigns/teendrinkinganddriving/index.html (accessed on 13 October 2020).
- New York State Department of Motor Vehicles (NYSDMV). Pre-Licensing Course Student’s Manual (Form MV-277.1 PDF Download). 2020. Available online: https://dmv.ny.gov/forms/mv277.1.pdf (accessed on 13 October 2020).
- Senserrick, T.; Brown, T.; Quistberg, D.A.; Marshall, D.; Winston, F. Validation of Simulated Assessment of Teen Driver Speed Management on Rural Roads. Annual proceedings/Association for the Advancement of Automotive Medicine. Assoc. Adv. Automot. Med. 2007, 51, 525–536. [Google Scholar]
- Insurance Institute for Highway Safety (IIHS). Fatality Facts 2018—Urban/Rural Comparison. 2018. Available online: https://www.iihs.org/topics/fatality-statistics/detail/urban-rural-comparison (accessed on 2 November 2020).
- Henning-Smith, C.; Kozhimannil, K.B. Rural-Urban Differences in Risk Factors for Motor Vehicle Fatalities. Health Equity 2018, 2, 260–263. [Google Scholar] [CrossRef] [PubMed]
- New York State Department of Motor Vehicles (NYSDMV). REQUEST FOR CERTIFIED DMV RECORDS (Form MV-15 PDF Download). 2019. Available online: https://dmv.ny.gov/forms/mv15.pdf (accessed on 2 November 2020).


| Session | Training Module(s) | Residential Drive Description/Features |
|---|---|---|
| Acclimation drive | Residential | Practice drives for participant acclimation (e.g., the steering wheel, the paddle shifter signal indicators, and the gas and brake pedals) and the simulator visual/motion/sound cues. Note that this drive is encountered at the beginning of each of the five training sessions. |
| Session 1 | Residential, closed-course | Course has no traffic and contains three left turns, three right turns (including one designated as “no right on red”), five traffic lights, and four stop signs. Course length: 3.2 miles. |
| Session 2 | Residential, closed-course, challenge | Course has no traffic and contains four left turns, two right turns (including one designated as “no right on red”), six traffic lights, a roundabout intersection, and three stop signs. Challenges (2): construction zone and speed modulation. Course length: 3.4 miles. |
| Session 3 | Residential, closed-course, challenge | Course introduces traffic and contains four left turns, two right turns (including one designated as “no right on red”), eight traffic lights, and one stop sign. Challenges (2): construction zone and speed modulation. Course length: 3.2 miles. |
| Session 4 | Residential, closed-course, challenge | Course introduces traffic and contains one left turn, five right turns (including one designated as “no right on red”), six traffic lights, and five stop signs. Challenges (3): construction zone, speed modulation, and animal crossings. Course length: 4.0 miles. |
| Session 5 | Residential, closed-course, challenge | Course introduces traffic and contains three left turns, four right turns (including one designated as “no right on red”), six traffic lights, and three stop signs. Challenges (2): tailgater scenario and speed modulation. Course length: 3.8 miles. |
| Virtual Road Test | Residential, challenge | Course introduces traffic and contains two left turns, six right turns (including one designated as “no right on red”), seven traffic lights, and five stop signs. Challenges (4): construction zone, speed modulation, animal crossings, and highway merge. Course length: 4.7 miles. |
| Activity | Duration |
|---|---|
| Informed consent/assent (first visit only) | 10–15 min |
| Pre-surveys and questionnaires | 10–15 min |
| Training module video briefing | 10 min |
| Acclimation drive | 5–10 min |
| Simulator training modules (as driver) 1 | 30 min |
| Breaks/transitions | 5–10 min |
| Simulator training modules (as passenger) 1 | 30 min |
| Post-surveys and questionnaires | 10 min |
| Discussion/summary/session de-briefing | 5–10 min |
| Total Module Time: | 120 min (approx.) |
| Simulator Type | Average Speed over Speed Limit (mph) | Speed Sub-Score (0–100) | Stop Sign Sub-Score (0–100) | Street Light Sub-Score (0–100) |
|---|---|---|---|---|
| Fixed-base | 1.5 | 89.5 | 92.6 | 92.8 |
| Motion-based | 2.6 | 87.3 | 96.1 | 95.1 |
Publisher’s Note: MDPI stays neutral with regard to jurisdictional claims in published maps and institutional affiliations. |
© 2021 by the authors. Licensee MDPI, Basel, Switzerland. This article is an open access article distributed under the terms and conditions of the Creative Commons Attribution (CC BY) license (http://creativecommons.org/licenses/by/4.0/).
Share and Cite
Hulme, K.F.; Lim, R.S.A.; Bauer, M.; Hatten, N.; Destro, H.; Switzer, B.; Dequesnay, J.-A.; Cashmore, R.; Duncan, I., Jr.; Abraham, A.; et al. Blueprint for a Simulation Framework to Increase Driver Training Safety in North America: Case Study. Safety 2021, 7, 24. https://0-doi-org.brum.beds.ac.uk/10.3390/safety7020024
Hulme KF, Lim RSA, Bauer M, Hatten N, Destro H, Switzer B, Dequesnay J-A, Cashmore R, Duncan I Jr., Abraham A, et al. Blueprint for a Simulation Framework to Increase Driver Training Safety in North America: Case Study. Safety. 2021; 7(2):24. https://0-doi-org.brum.beds.ac.uk/10.3390/safety7020024
Chicago/Turabian StyleHulme, Kevin F., Rachel Su Ann Lim, Meghan Bauer, Nailah Hatten, Helena Destro, Brenden Switzer, Jodie-Ann Dequesnay, Rebecca Cashmore, Ian Duncan, Jr., Anand Abraham, and et al. 2021. "Blueprint for a Simulation Framework to Increase Driver Training Safety in North America: Case Study" Safety 7, no. 2: 24. https://0-doi-org.brum.beds.ac.uk/10.3390/safety7020024