1. Introduction
In all state-of-the-art technologies, safety embodies a most important parameter. Scientists and engineers are attempting to combine adequate safety precautions, considering all relevant aspects, while making every effort to maintain a reasonable price for the final product. These facts obviously apply also to the automotive industry and the development of new technologies that are or will be implemented in modern cars [
1]. Many tests are conducted to evaluate vehicles or drivers (for example, the moose test); such assessment, however, tends to be rather costly and, most significantly, potentially dangerous for the test subjects (drivers). In order to create a safe test environment, vehicle driving simulators find use as an effective, simulation-based alternative comprising multiple scenarios that may be difficult to execute in real life. The advantages of a simulator are presented in [
2,
3,
4].
The individual chapters of the paper outline the background of driving simulators, presenting an overview of their advantages, disadvantages, and relation to control theory in terms of the driver as a controller. In the Methods section, we characterize the simulator designed in our laboratories, with a particular focus on the hardware, software (with its virtual elements), operating scenarios, and data storing options. The measured data are then discussed in the Results chapter, which summarizes multiple derived parameters in the context of a MATLAB application analysis. Importantly, we also present various methods for analyzing the measured data and highlight possible outcomes and indicators of the research.
The benefits of using a driving simulator, according to reference [
5], are as follows. Controllability, reproducibility, and standardization – in general terms, virtually any environment (or behavior) is simulable and settable for research purposes, maximizing the effectiveness of the simulation/training. Standardized testing scenarios can be created, resulting in reproducible research results; such scenarios are not limited by the specific physical location where the research is being conducted. Another related advantage is embodied in simpler data collection, this being a major asset because in real vehicles there appears the difficulty to obtain accurate and synchronized measurement data. With a driving simulator, however, we can measure a driver’s performance and input data accurately and efficiently, and the measured data are easily expandable. A driving simulator enables us to expose a tested subject to potentially hazardous driving tasks, including sudden avoidance of an obstacle or handling a vehicle at higher speeds. Simulating a dangerous situation has a positive impact on diverse branches and aspects of real-world traffic, as we can, for example, safely measure the influence of alcohol, drugs, or any other distraction from the driver’s perspective. By extension, we also obtain feedback from the tested drivers to modify the scenarios and the environment accordingly; conversely, relevant feedback highlighting specific events or markers of the scenarios is available to the drivers.
Driving simulators nevertheless exhibit several disadvantages, such as that they cannot perfectly emulate real-life behavior and perception and of the environment, being constrained by the software and hardware applied [
6]. In certain cases, even the safety state can be regarded as a disadvantage because the drivers do not perceive the limitations of actual driving and tend to more dangerous maneuvers. Moreover, the validity of the research is questionable, as only a small number of studies have investigated the connection between the skills learned from the simulator and those transferred to real-life driving. Importantly, too, the simulating drivers may feel uncomfortable or experience specific sickness symptoms (e.g., display-induced dizziness or view distortion) [
7];such problems are observed more frequently in older persons [
5,
8,
9].
In view of the overall benefits and drawbacks discussed above, a simulator is being developed to analyze human driving behavior and to measure important data concerning the virtual vehicle and the driver.
Developing an in-house vehicle driving simulator
We conducted a survey targeting driving simulators available for scientific purposes. Expectably, most of the products on the market are entertainment-oriented, facilitating multiplatform games. By extension, we also established that many corporations use driving simulators as complementary products to accompany their motion simulator solutions. With these findings in mind, our research team concluded that a system suitable for the preset aims should have the following properties and capabilities:
Open source licence
Customizable user interface
Possibility of creating custom measurement scenarios
High level of graphical realism and vehicle behavior definition
Specific parameter/data acquisition with sufficient sampling frequency
Low cost
Possibility of expanding the simulator with augmented or virtual reality
Some of the devices were designed and released directly by car manufacturers and associated experts; the most advanced options then include, for example, Mechanical Simulation’s CarSim, a system that remained beyond our reach due to its high-end price. Another widely favored setup is STISIM Drive, with its multiple pre-designed scenarios, roadway events, road traffic rules, extensive documentation, and auxiliary functions. This simulator, however, is not accessible in the open source mode and does not feature either in-depth code customization or gameplay elements. Furthermore, the expansion alternatives are limited by local resellers, as additional plugins have to be purchased. Another drawback in this context then consists in that the simulator does not provide high-level graphical realism. Conversely, we agree that the individual elements within the simulator are well engineered, have passed through numerical testing, and incorporate the feedback delivered by car manufacturers and the expert community in general.
A driving simulator that appears to conveniently complete the survey is OpenDS, which offers or enables an open source licence, a realistic vehicle and traffic behavior, environmental customization, and OpenDrive integration. These properties alone would make the system a suitable candidate to satisfy our requirements; OpenDS, however, does not feature appropriate graphical realism, expandability into augmented or virtual reality, or information regarding specific data acquisition and sampling frequency.
This analysis of the market led us to assume that, if our aims and objectives were to be met, the most effective solution would lie in developing an in-house, customized vehicle driving simulator. We therefore chose Unreal Engine 4 as a reliable framework commonly used in the gaming industry. With the broadly available documentation, tutorials, and free assets, the platform embodies a solid basis opening various paths towards the development of a simulator. Exploiting the technologies and assets supplied by Epic Games (the developer of Unreal Engine 4) and other producers then allowed us to reduce our expenses to a minimum. The preliminary tests and measurements to verify the functionalities of the in-house-designed Vehicle Driving Simulator convincingly showed that the requirements and desired parameters had been satisfied or reached, and we can thus characterize the setup as the optimum tool to resolve our specific needs.
1.1. Driver as a Controller
The current trends in transportation involve increasing the safety via various advanced driver assistant systems (ADAS), including automated driving as an instance of the human-automation synergy. Despite these options, a human being remains an integral part of the structure because he or she is responsible for the final control action. Considering this fact, the analysis and evaluation of the human behavior (human factor assessment) during driving embody essential procedures leading to a higher safety level [
10].
Human factor assessment utilizes the quantification of human behavior, cognition, and other relevant processes. The overall set of problems comprises, above all, acquiring information that relates to human interaction with a device or a procedure and the prediction of probable human reactions within different conditions. Such knowledge finds use in optimizing the human environment to improve the effectivity or performance and to eliminate or reduce human errors [
7,
11]. Pilot modeling techniques originating in aviation facilitated advancement in human control behavior research. Models to analyze the characteristics of the pilot-aircraft system can evaluate the driver-vehicle interaction, too [
12]. In order to grasp the complexity of human control behavior, Rasmussen classified this behavior as skill-, rule-, and knowledge-based [
13]. Consequently the models, according to their theoretical foundations, are classified as control theory based, human psychology based and based on intelligence techniques [
12].
Models based on control theory describe the interaction between a human being and a device as a control loop,
Figure 1 [
14].
A human being is a strong, universal, and effective controller providing prompt solutions to unexpected situations and capable of adapting itself quickly to various system operation conditions. The decision-making and future activity choices are individual-based, mainly if they occur within managing a critical situation, where all three types of behavior (skill-based, rule-based and knowledge-based) are to be applied. However, describing the human-machine interaction as a control loop enables us to study common features in individual control actions at the skill-based and possibly also at the rules-based level as a basis for the definition of a shared human/driver behavioral model.
Although the research into human behavior modeling has been widely presented and discussed (e.g., [
15,
16]), the amount of details available remains insufficient. Moreover, the steady emergence of new trends and technologies requires novel approaches and sources of information on diverse interactions with humans and the resulting impact. At present, human factor assessment relies increasingly more on simulation technologies, which appear to open prospective paths into the future of the sector.
2. Materials and Methods
2.1. Vehicle Driving Simulator
The benefits of using a driving simulator are outlined within the introductory chapter. We opted for developing an in-house vehicle driving simulator because commercially available devices did not allow us to create custom scenarios and to modify the software to suit our research needs. A purpose-specific survey was executed to identify a game engine framework suitable for the developing procedures. Eventually, Unreal Engine 4 proved to be an optimum choice, mainly thanks to its ability to support the vehicle physics; smooth implementation; available assets; enhanced graphics; VR support; and a numerous learning materials and documentation items. Such a simulator, however, is also deliverable via other engines, including Unity and CryEngine (the former being used widely).
A system having the above-presented characteristics allows creating distinct types of vehicle behavior, custom driving scenarios, and measurement cycles to acquire driver-related performance data. The simulations enable the users to experience a particular situation or behavior in order to prepare for real-life situations. The credibility of the obtained data varies, depending on the quality of the simulation itself. Our project was centered on forming a custom car driving simulator application based on the Unreal Engine 4 framework, with the skill-based behavior analysis being the preferred evaluation tool. The development of additional driving scenarios focused on rule-based and knowledge-based behavior is nevertheless also possible and will be pursued more intensively in the future. The product, referred to as the Vehicle Driving Simulator, can emulate hazardous or skill-demanding situations, which occur practically daily in regular traffic (e.g., a sudden obstacle in the way, and a rise in the driver’s fatigue); the emulating environment then offers almost unlimited repeatability of measurements, fast and secure expansion of the measured data, low cost, and, most importantly, safe operation for the testing subjects.
2.2. Software Overview
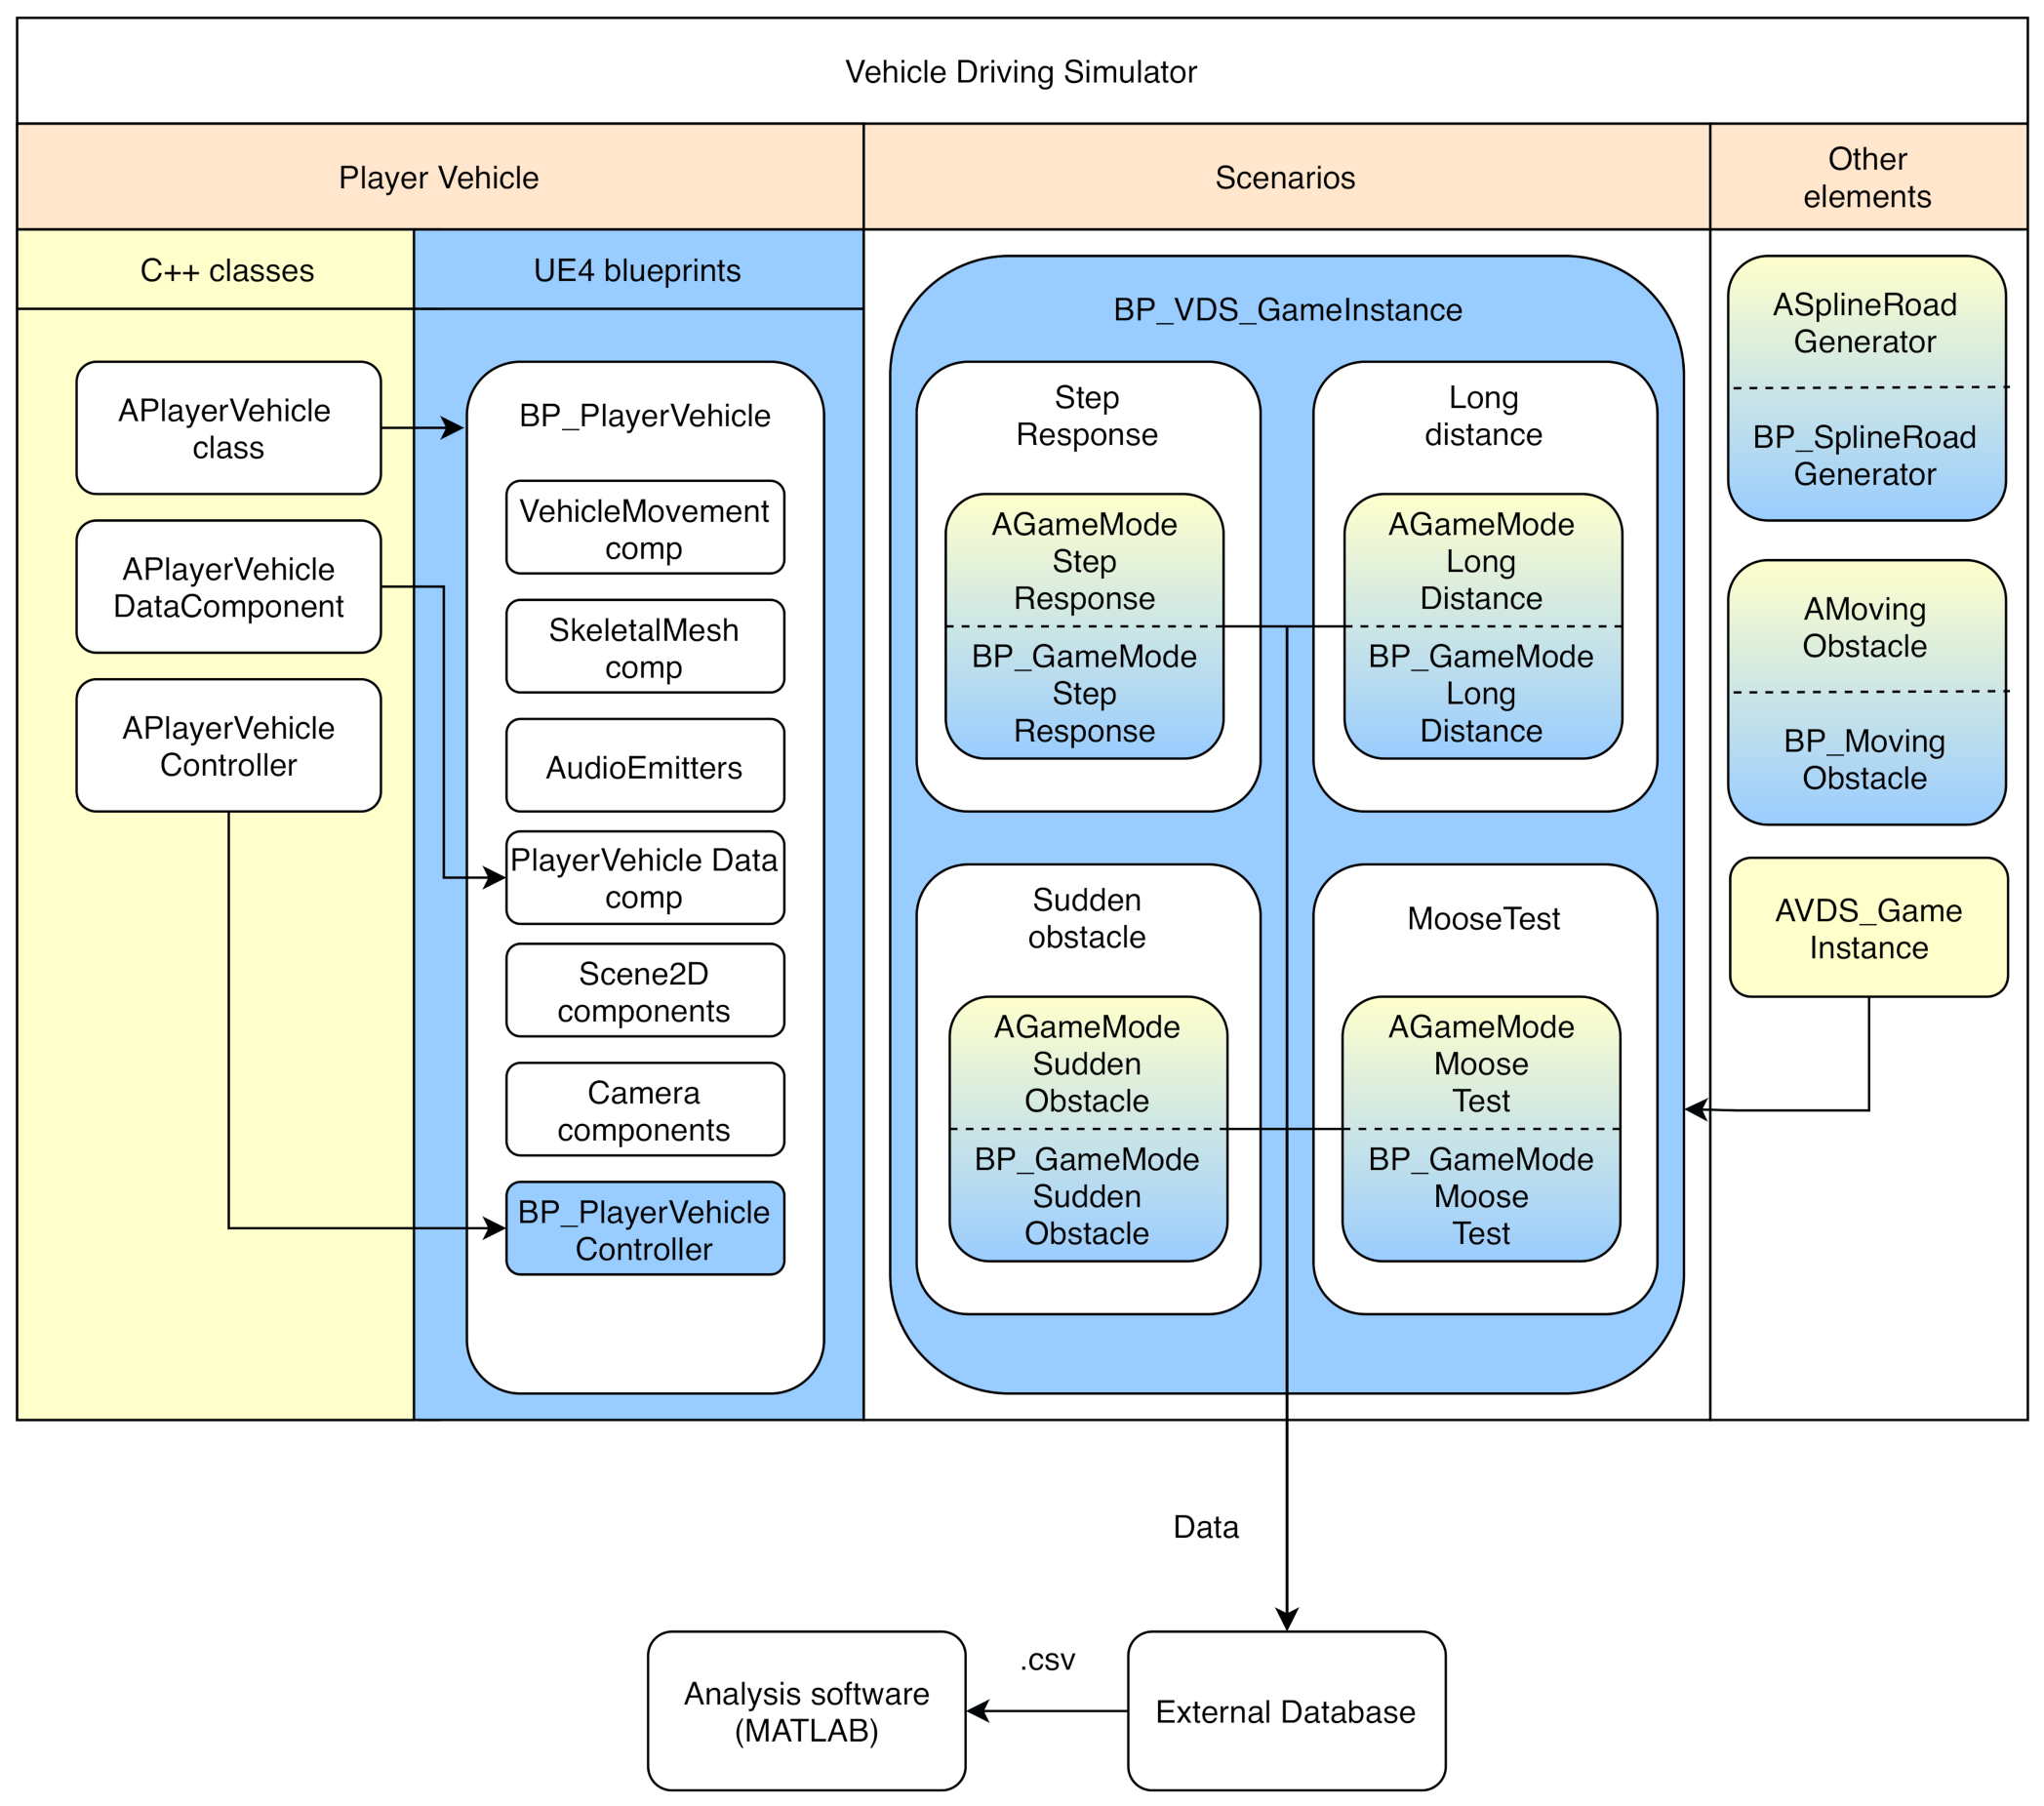
The structure of the Vehicle Driving Simulator (VDS) is detailed in
Figure 2. For this research, we utilized the Unreal Engine 4 (UE4) framework, that is, a game engine. The main benefit of the approach consists in that the framework establishes a set of base functions and an environment in which the developers can easily implement controllable objects, scenario/application behavior, and back-end data processing.
The elements within the VDS are divided into three groups, as follows—the Player Vehicle set contains the necessary C++ classes and derived blueprints (the blueprint being a type of object the UE4 works with) to create a controllable model of a car in the engine’s world. The next group then comprises four main scenarios currently available to serve the measurement purposes. Finally, the last set includes other elements that complement the indispensable gameplay functions in order for the scenarios to run properly.
2.3. Vehicle Object
This component embodies the most important part of the simulator, creating a real-life experience for a subject being measured. The main game object rests in the BP_PlayerVehicle, derived from a custom APlayerVehicle class, which itself is based on a WheeledVehicle character. This game object encapsulates all of the vehicle components, including:
VehicleMovement, responsible for moving the actor in the world. Based on NVidia’s PhysX model, it establishes a basic vehicle model with a customizable setup, such as the front/rear wheel drive or engine torque curve.
SkeletalMesh, a 3D rigged model with an animation blueprint.
AudioSound, ensuring the engine and curbs sounds to provide realistic acoustic feedback to the driver.
SceneCapture2D, delivering the rearview mirrors’ image.
Camera, offering two views, namely, first and third-person ones. While the default camera simulates the driver’s view from the car, the third person one finds use mainly in debugging (from this perspective, we can see elements that cannot be visually perceived by the driver, such as the terrain the vehicle is currently standing on).
BP_PlayerVehicleController, being a PlayerMovementController derived from the APlayerVehicleController custom class. This item checks the input devices, such as the keyboard, mouse, and steering wheel, and sends the data to the Vehicle Movement component.
PlayerVehicleData, embodying an actor element derived from the APlayerVehicleDataComponent class. This instrument takes the measured data concerning the vehicle/input devices and allows them be packed into an FStruct struct variable.
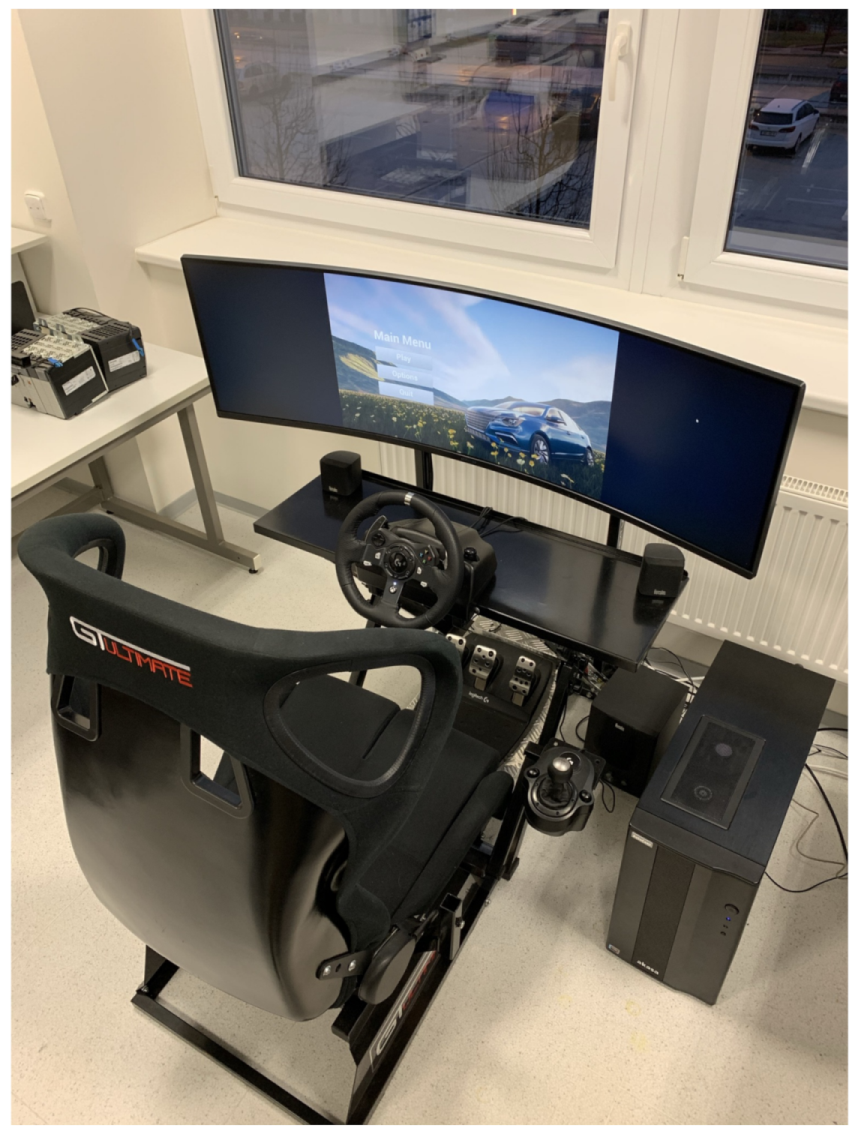
2.4. Simulator Hardware and Input Devices
The VDS has been developed for desktop PCs with the Windows 10 operating system. An overall simulator setup, including the input devices, is presented in
Figure 3. When developing the simulator, we identified an important limitation regarding the sampling period provided by UE4 for Windows 10: The Unreal Engine 4 framework’s sampling period is constrained by the Tick function. In the UE4 environment, “ticking” refers to running a piece of code at regular intervals, with the minimum interval determined by the rendering time of the next frame. Therefore, it can be said that the highest available sampling frequency equals the frame rate. Consequently, the sampling period is, to a great extent, determined by the time required to render the frames on the actual hardware the simulator is running on. The sampling non-uniformity is thus strongly influenced by variations of time that is needed to render the individual frames. Therefore, the GPU and CPU performance is of high importance.
Conversely, as proposed by H.J. Landau, the average sampling frequency of a non-uniformly sampled signal needs to be twice higher than the maximum frequency of the signal spectrum [
17] in order to be able to recover the signal. While the theorem guarantees that as long as the average frames per second are on a certain level, the data from the simulator can be considered valid. To resolve the sampling non-uniformities, we employ the mathematical method outlined in [
18]. The hardware specifications of the PC we are using to run the VDS are as follows:
Processor: an AMD Ryzen 9 3900XT 12-core 3.80 GHz
Graphics card: an NVidia RTX 2080 Super
HDD: a 1TB NVMe SSD
RAM: a 32GB DDR4 3200MHz
Monitor: an Ultra-wide (32:9) curved monitor, 49″ Samsung C49HG90
Steering wheel and pedals: a Logitech G920
Gear stick: a Logitech Driving Force Shifter
The reason for exposing the hardware specifications lies in that all the UE4-based measurements are influenced by the average frame rate, as mentioned before. Due to ergonomy factors, a frame rate of approximately 60 FPS is usually considered fully sufficient, and infrequent drops in the frame rate are tolerable. However, to enable successful signal reconstruction without an undesired loss of information on rapid steering wheel corrections, there appears the need to ensure that the sampling period variability is limited. In a vehicle driving simulator intended for research purposes, an adequate computing platform is critical; with a platform above the average frame rate of 100 Hz, this objective is nevertheless reliably achieved.
One of the main variables measured is the amount of steering wheel rotation. According to [
19,
20], the reaction delay of a human operator lies between 200 to 1500 ms. While maintaining frame rate above 100 frames per second (which equals to the sampling frequency of 100 Hz, or sampling period of 10 ms), we can safely assume that the measured data is valid and that the time resolution is sufficient for our research.
2.5. Gameplay Elements
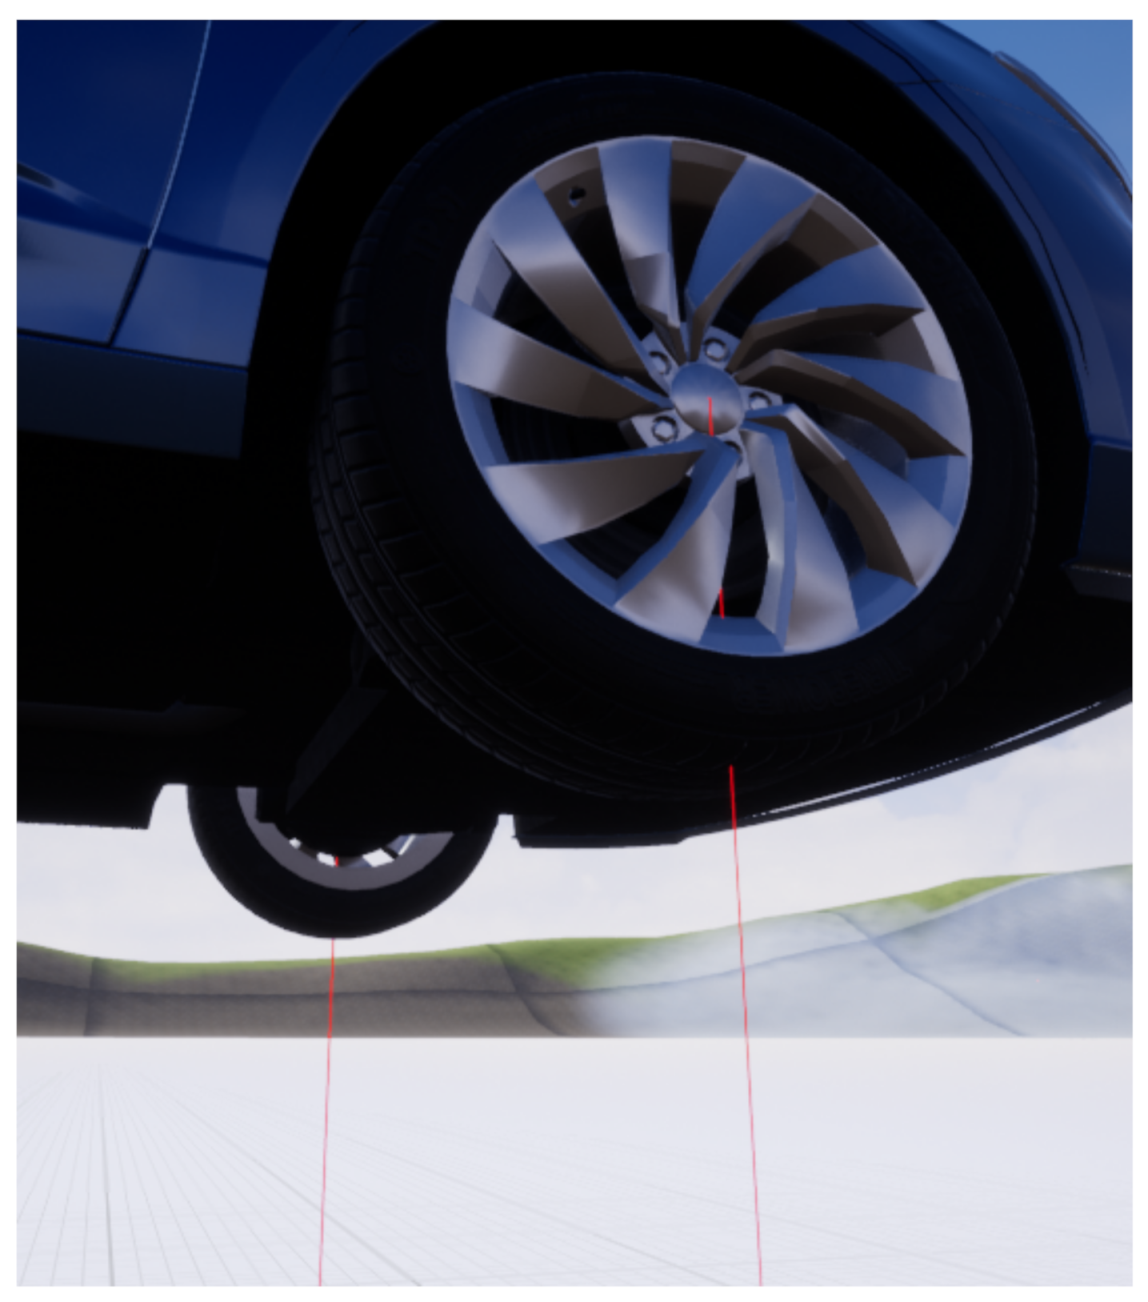
Logitech G920 Driving Force—force feedback
We use a Logitech G920 Driving Force steering wheel, which supports the force feedback. Using the Logitech SteeringWheelSDK, the force feedback is applied on the steering wheel, based on the physical material of the terrain the vehicle is currently moving on. The amount of force applied through multiple effects is determined by the combination of physical materials returned from each ray cast (a vector with pre-specified starting and ending points in 3D coordinates that returns the first object it collides with [
21], as shown in
Figure 4).
Curb detection with raycasting
A curb or an obstacle on the sides of the car are identified in a manner similar to that employed in detecting the physical material of the terrain. Assuming a critical position of the wheels, a ray cast is shot out to the ground to recognize a curb game object. If such an obstacle is revealed, a curb warning sound will play from the problem side, producing an audio alert to signal the testing subject that they are driving off the lane; thus, one of the ADAS functions is simulated.
Rear mirrors image using Scene Capture Component 2D
During the initial testing of the first versions of the VDS, a large number of the volunteers reported that they had missed the possibility of checking rearview mirrors to control and correct the position of the car in the driving lane more effectively. To indulge the need, a special material, derived from canvas render target (Scene capture component 2D), was then formed and applied to the rearview mirror mesh, delivering a relevant image [
22]. Unexpectedly, we found out that the need to compute the rearview mirror image tends to be more performance-consuming because the engine renders other camera views. We observed a decrease in the FPS of around 20%–30%; therefore, we advise the application of more performing hardware, and even more so in cases where a VR headset is employed.
Heads-up display (HUD)
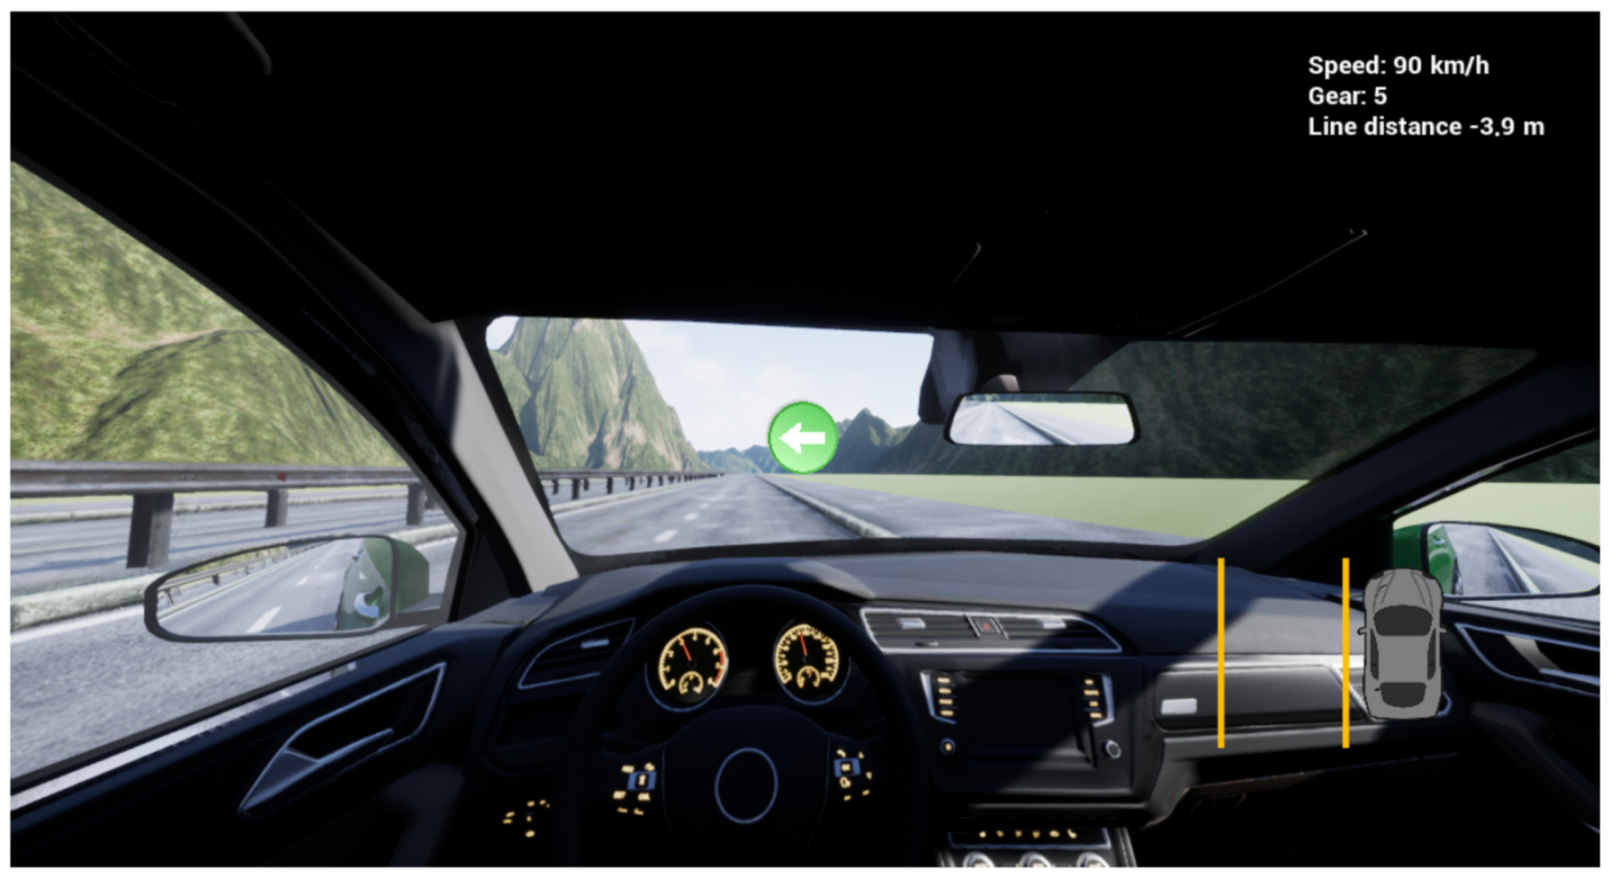
A heads-up display (HUD) was created to better present the necessary information to the tested subject. The HUD consists of several indicators, as demonstrated in
Figure 5:
Velocity, displayed in kilometers per hour.
Gear, indicating the current engine gear.
Line distance, being the distance from the spline spawned in the virtual world.
Lane indicator, showing visually that the car is moving out of the desired lane; the function and data appear only after the vehicle started to drift away.
Arrow indicator: During a step response scenario, an arrow pops up exactly at the moment the driver is supposed to change lanes. This process makes the driver’s response time measurement more precise and less dependent on observing the lane itself.
The most significant parts of the HUD are the Lane and Arrow indicators, as they directly interfere with the measurement scenarios, helping the tested driver to improve the responsiveness to the action events.
2.6. Driving Scenarios
In the VDS, several scenarios were assembled to deliver comprehensive information about the drivers’ behavior in different situations.
Calibration Scenario
A simple scenario where the driver rides around a virtual map that contains a road with small bends and a few traffic cones. The purpose rests in enabling the driver to become accustomed to the behavior of the vehicle; no data are stored.
Highway: Step Response
This option requires the driver to stay inside a lane (we record a distance between an invisible line object placed in the middle of that lane and a center of the vehicle). The virtual map comprises a straight road, or highway, over 8 kilometres long. When the driver has reached the pre-defined vehicle speed, the line object changes its position at random time intervals, resulting in a lane change event for the driver, who is visually informed of the need to change the lane (as seen in
Figure 5 in form of an arrow). From the perspective of control theory, this change then represents a step function, meaning that we can exploit the measured data to analyze the driver’s step response.
Highway: Long-distance ride
The scenario relies on a long highway loop, which takes approximately 15 to 25 min to pass through (depending on the maximum velocity set on the vehicle). The only task is to complete the ride multiple times while attempting to stay in the same lane; if the car deviates excessively from the lane, a visual warning appears (as seen in
Figure 5 in form of car deviating from the lane), urging the driver to manage the situation. Such a configuration simulates a long highway drive, in which fatigue and drowsiness are highly probable.
MooseTest
The option is based on a real-life test that measures the capabilities and dynamics of a vehicle. The particulars of the procedure are defined in ISO 3888-2:2011; this standard specifies the dimensions of the testing track, outlines the vehicle behavior, and characterizes the maneuvering to be performed by the driver. In general terms, this is one of the tests applicable in evaluating a driver’s ability to control a vehicle (considering factors such as age, training, and experience). In our case, the test focuses especially on the behavior of the vehicle physical model implemented in the VDS; currently, we are testing the vehicle’s behavior and comparing the NVidia PhysX model and the Unreal Engine Chaos physical engine.
Highway: Sudden Obstacle Scenario
Similarly to the Step Response option, this scenario consists in riding a long highway with no turns. The driver’s responsibility is to keep straight in the lane; at random time intervals, however, an object is spawned in front of the car. The central difference from the Step Response mode is that in this scenario, the driver does not expect the need to perform any sudden maneuvers. This input simulates an impulse function.
2.7. Measurement Procedure
Several highway driving scenarios were designed to evaluate the driver’s performance in a highway lane change maneuver, long-distance driving, and obstacle avoidance. The measurement, which lasts approximately one hour, involves data monitoring. The procedure comprises the stages listed below; all of these are executed via the simulator, and the produced data have to be collected for processing purposes. All tested subjects gave their informed consent for inclusion before they participated in the study. All subjects gave their informed consent for inclusion before participating in the research. The investigation was conducted in accordance with the Declaration of Helsinki, and the research protocol relating to the activity Vehicle driving simulator and driver modelling (Project Ref No. EK: 04/2020), undertaken within the project SECREDAS, was approved by the Ethics Committee for Biomedical Research at the FEEC (Ethical Comittee DBME), approval No. 04b/2020 of 25 September 2020.
The stages:
A pre-measurement questionnaire.
An approximately 5-min long drive within the calibration scenario to allow the driver to adapt themselves to the vehicle dynamics.
A drive of about 15 min in the Step Response scenario.
A drive of about 20 min within the Long-Distance Ride option.
An approximately10-min long drive in the Sudden Obstacle mode.
A post-measurement questionnaire.
The pre-measurement questions are set to determine the driver’s state before the measurement, centering on his or her basic physical and mental condition; thus, it is established, for example, how many hours the subject slept or whether they used a stimulant (such as coffee or an energy drink). Information relating to the time of the day and measurement details is included, too. The questionnaire is followed by the scenarios, as specified above. In that context, the Step Response and Long Distance modes allow us to acquire the driver’s performance parameters, while the Sudden Obstacle scenario ensures the data validation. When all of the scenarios have been completed, the driver is asked in the post-questionnaire to define his or her approach to fulfilling the particular tasks, with a focus on the personal strategy, feelings during the test cycle, and relevant feedback. Regarding data collection from the simulator, several storage alternatives are available at the theoretical level, including a structured text file and a local or remote database. Exploring UE4 features, the data storage is feasible only via the file system operations, with other available only if using 3rd party plugins or expanding the engine with your own code.
2.8. Data Format
To facilitate processing in the analysis application, the data are stored in a CSV file. For each scenario we have a separate CSV file, which comprises a set of the measured data, which encapsulates the simulated car values, such as the steering wheel angle and velocity; in more general terms, all of the items included result from the driver’s actions. The structure of the set is as follows:
timestamp,
steering wheel angle,
line distance,
velocity,
pedal input,
heartbeat.
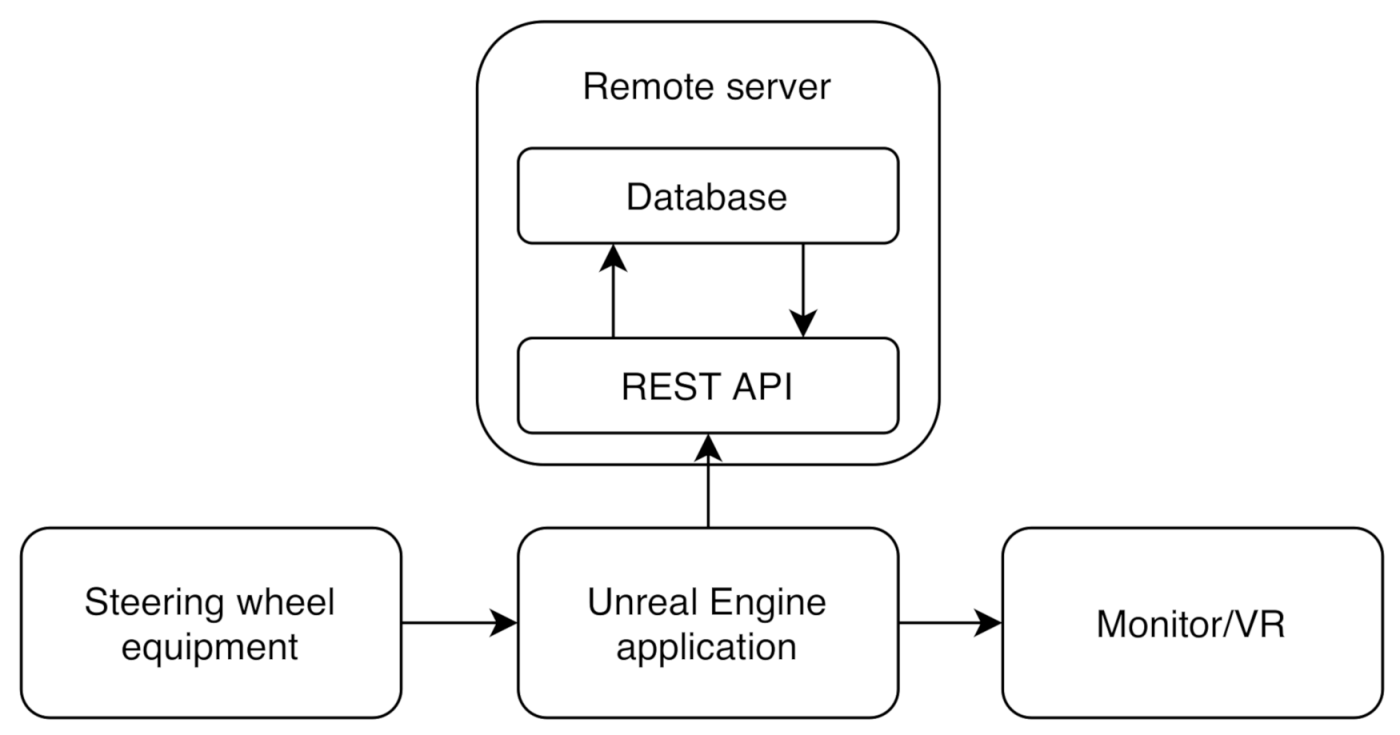
2.9. Data Storage Architecture
The size of the project, the amount of the measured data, and the necessity to access the data efficiently caused the file system to become insufficient. Thus, the database storage technique was selected and created, involving a remote database server interfaced by REST API via HTTPS connection. An insight into the features of UE4, however, indicated that the data storage relies exclusively on file system operations and that other techniques are lacking. To eliminate this deficiency, we designed (
Figure 6) and implemented a service provider server encapsulating the remote database; the main advantage of such a solution then lies in the possibility of processing the data remotely on a high-performance computer.
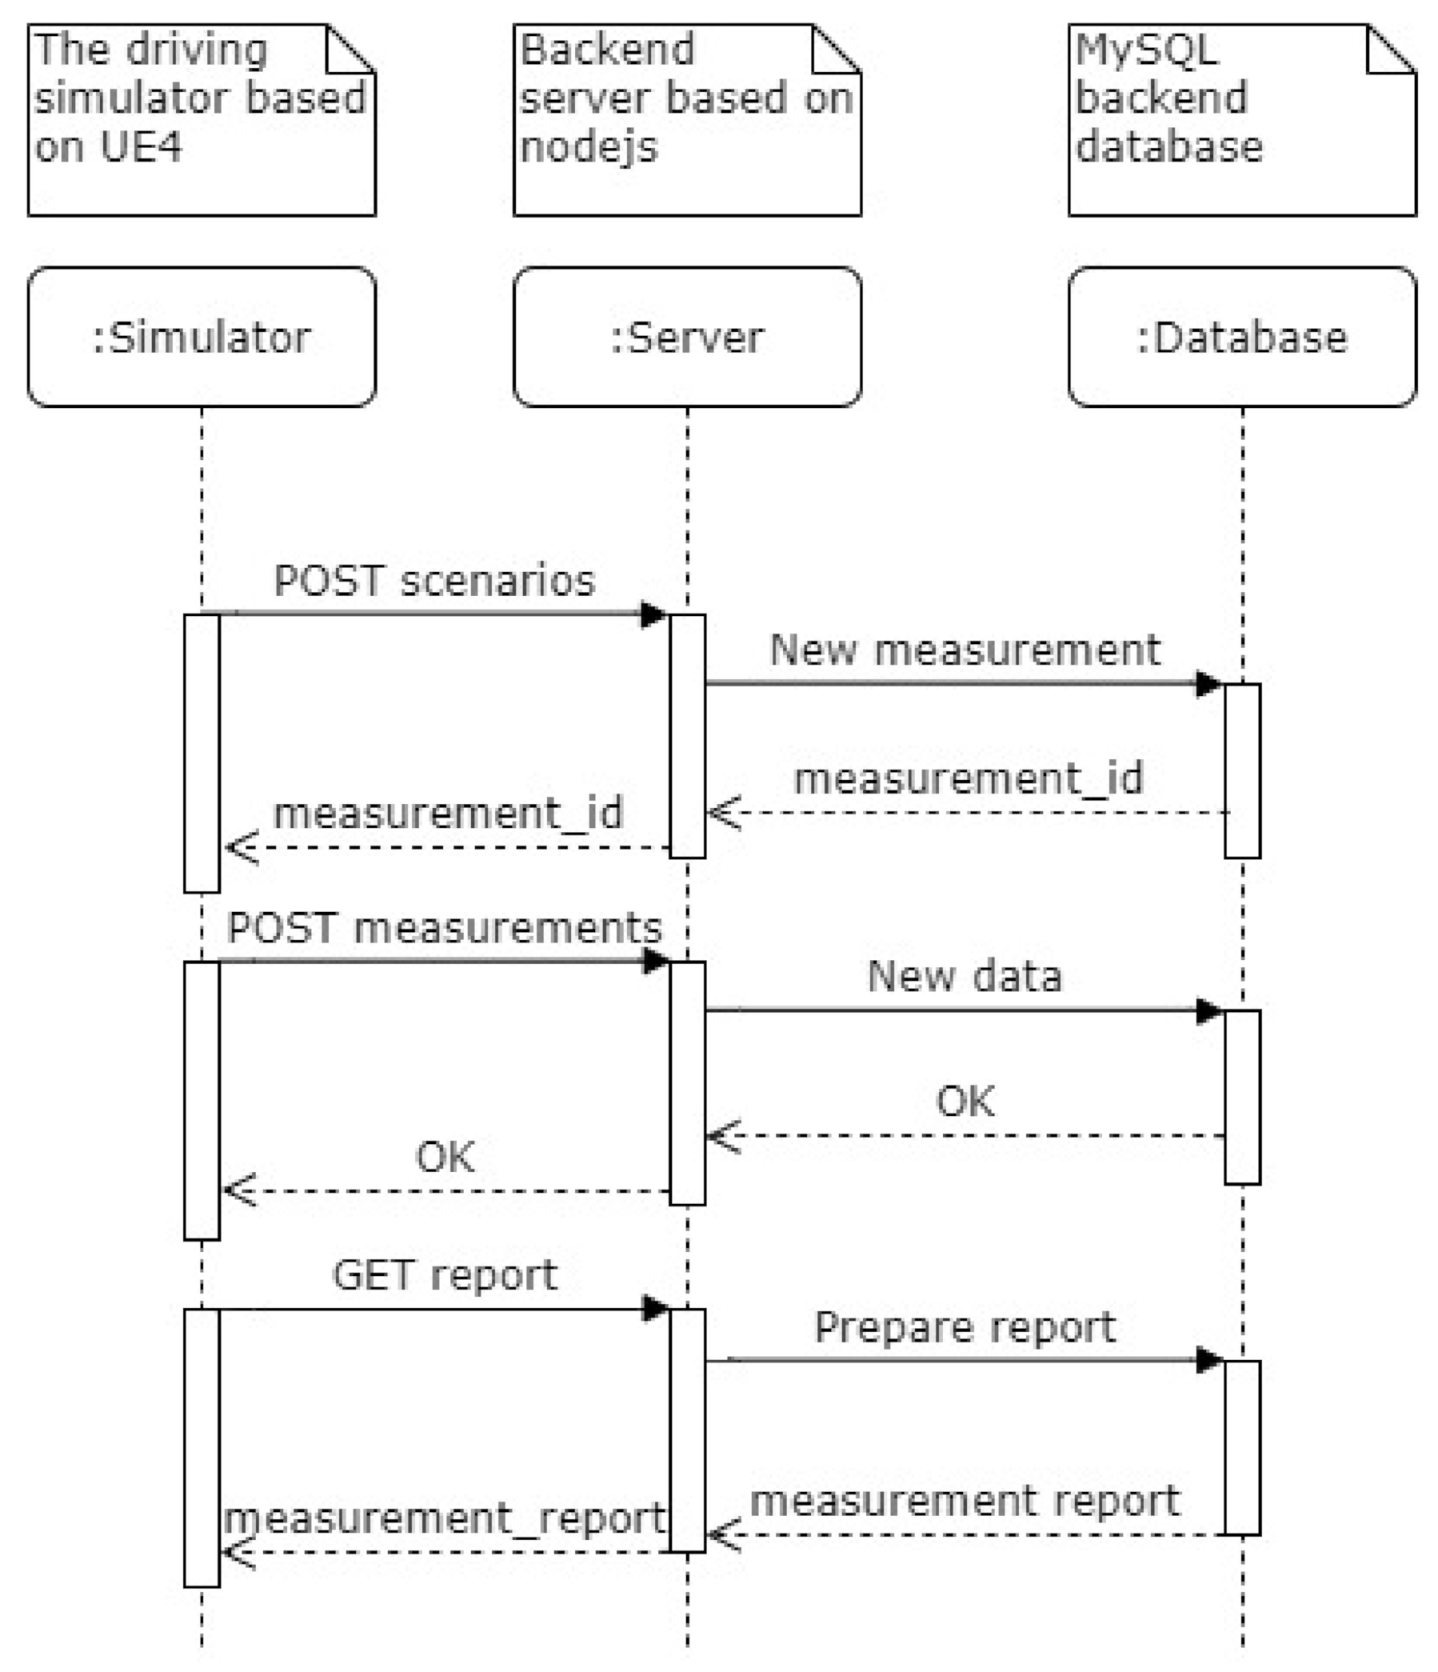
2.10. REST Interaction
The backend server needs to manage the request calls; for this reason, the designed REST API delivers appropriate commands, collecting the measured data and retrieving them in a structured form. Furthermore, the server requires a flow of measuring operations, as visualized below. At the beginning of a measurement cycle, the server is asked to create a new measuring scenario record (via a related post command) containing a link to the scenario type, person, and prior Google questionnaire. Then, the simulator can post the measured data in chunks, that is, more measured points in one message. When the measurement has ended, the server provides a structured report using a GET command. The presented flow (
Figure 7) is assumed to be used daily; in addition to the flow, the REST API ensures other standard commands, too. All of the provided requests are summarized below, reading:
POST scenarios—create a measurement scenario;
GET scenarios—retrieve a list of all closed measurement scenarios;
POST measurements—append a measured value to a specific measurement scenario;
GET measurements—retrieve a list of the measured data relating to a specific measurement scenario;
GET report—retrieve the measured data relating to a specific measurement scenario in a structured form.
When the scenarios are completed, the measured data are exported into a CSV file from the database.
3. Results
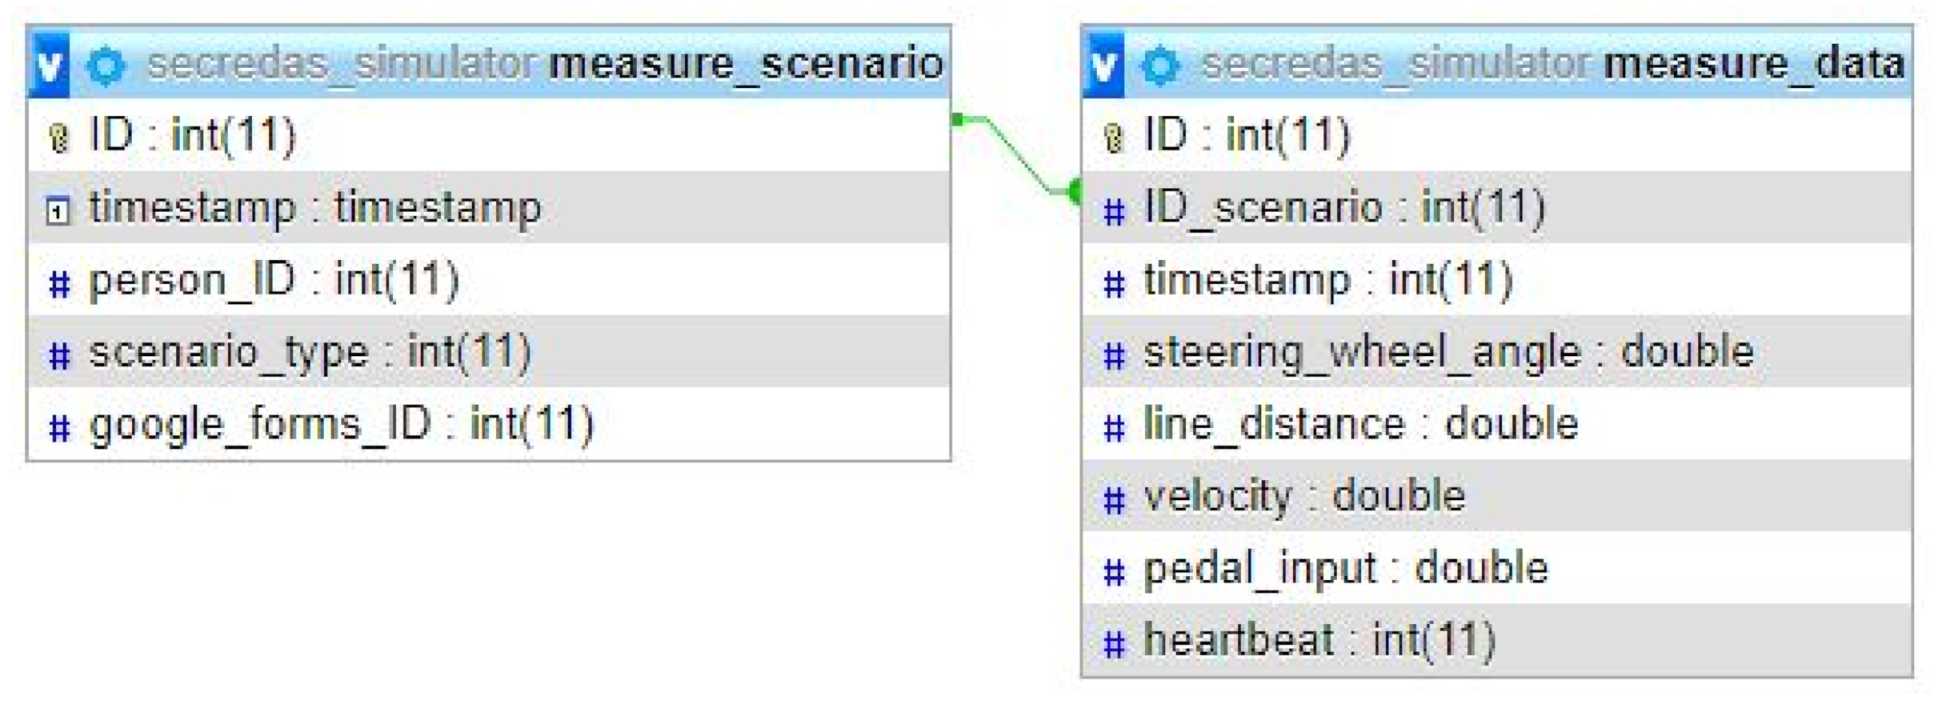
In order to analyze the measured data, a data model was created to arrange into an organized structure the input variables and data of a driver and a vehicle, respectively. The data model (
Figure 8) of the remote database follows the measure scenario concept, which comprises the bunch of the currently measured data and the actual measurement mode. The measure scenario utilizes one of the pre-defined scenarios available in the simulator and is specified in greater detail by the measurement conditions.
To verify the methods for evaluating driver performance by means of the custom vehicle driving simulator, we conducted initial test measurements on 10 volunteers. The obtained results are then to be regarded as merely demonstrative because the data sample is, from the statistical perspective, relatively small. The set of participants involved exclusively men, active drivers between 24 and 45 years of age, and each of these was subjected to all of the testing scenarios, according to the measurement procedure.
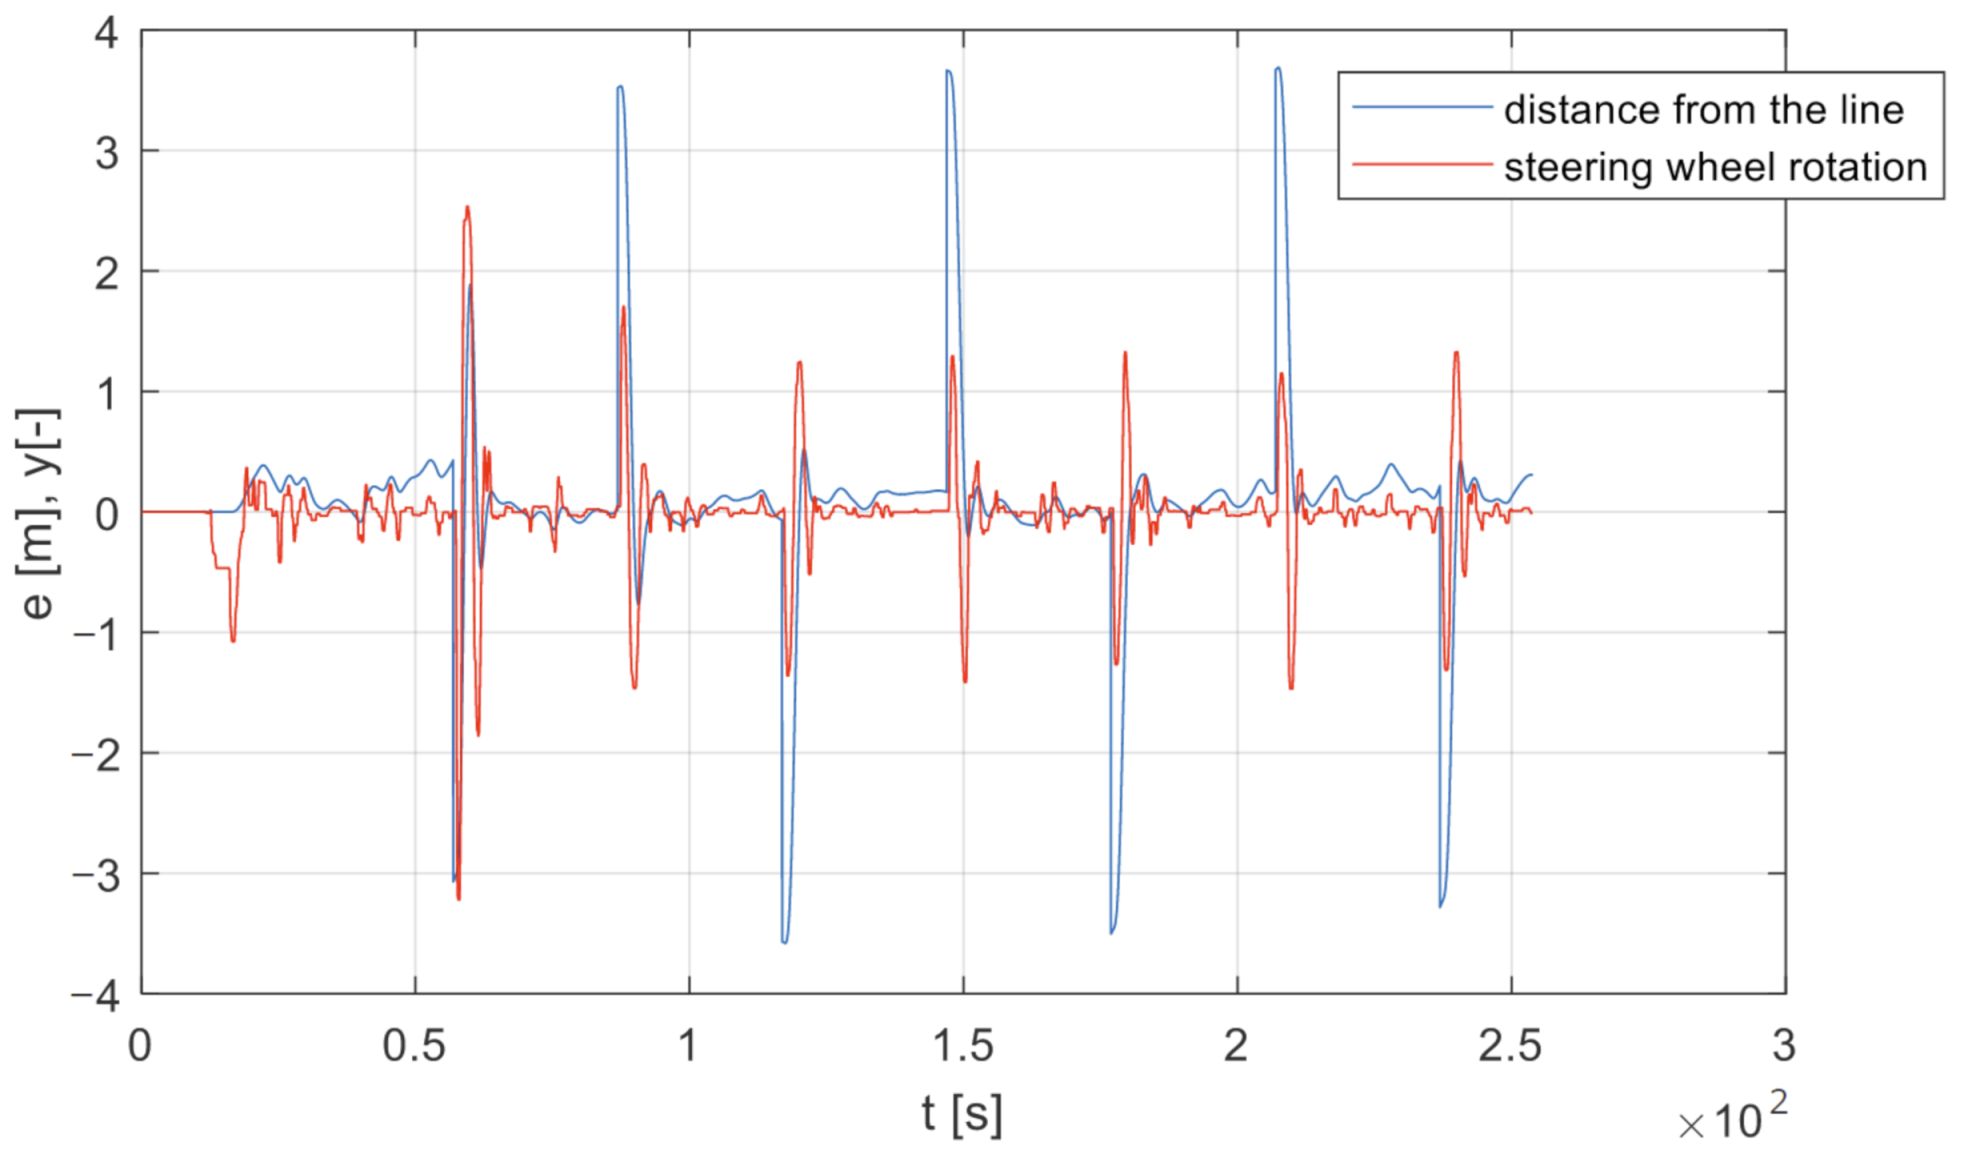
An example of measured data (relating to the Highway: Step Response scenario) is shown in
Figure 9, where a link between the line distance and the steering wheel rotation can be identified. The driver responds to a sudden lane change event with a variable reaction delay; nevertheless, after the initial two control actions, a certain driver behavior pattern is observable. These measured data are then employed to evaluate diverse parameters defining the driver’s behavior in a concrete situation under particular conditions.
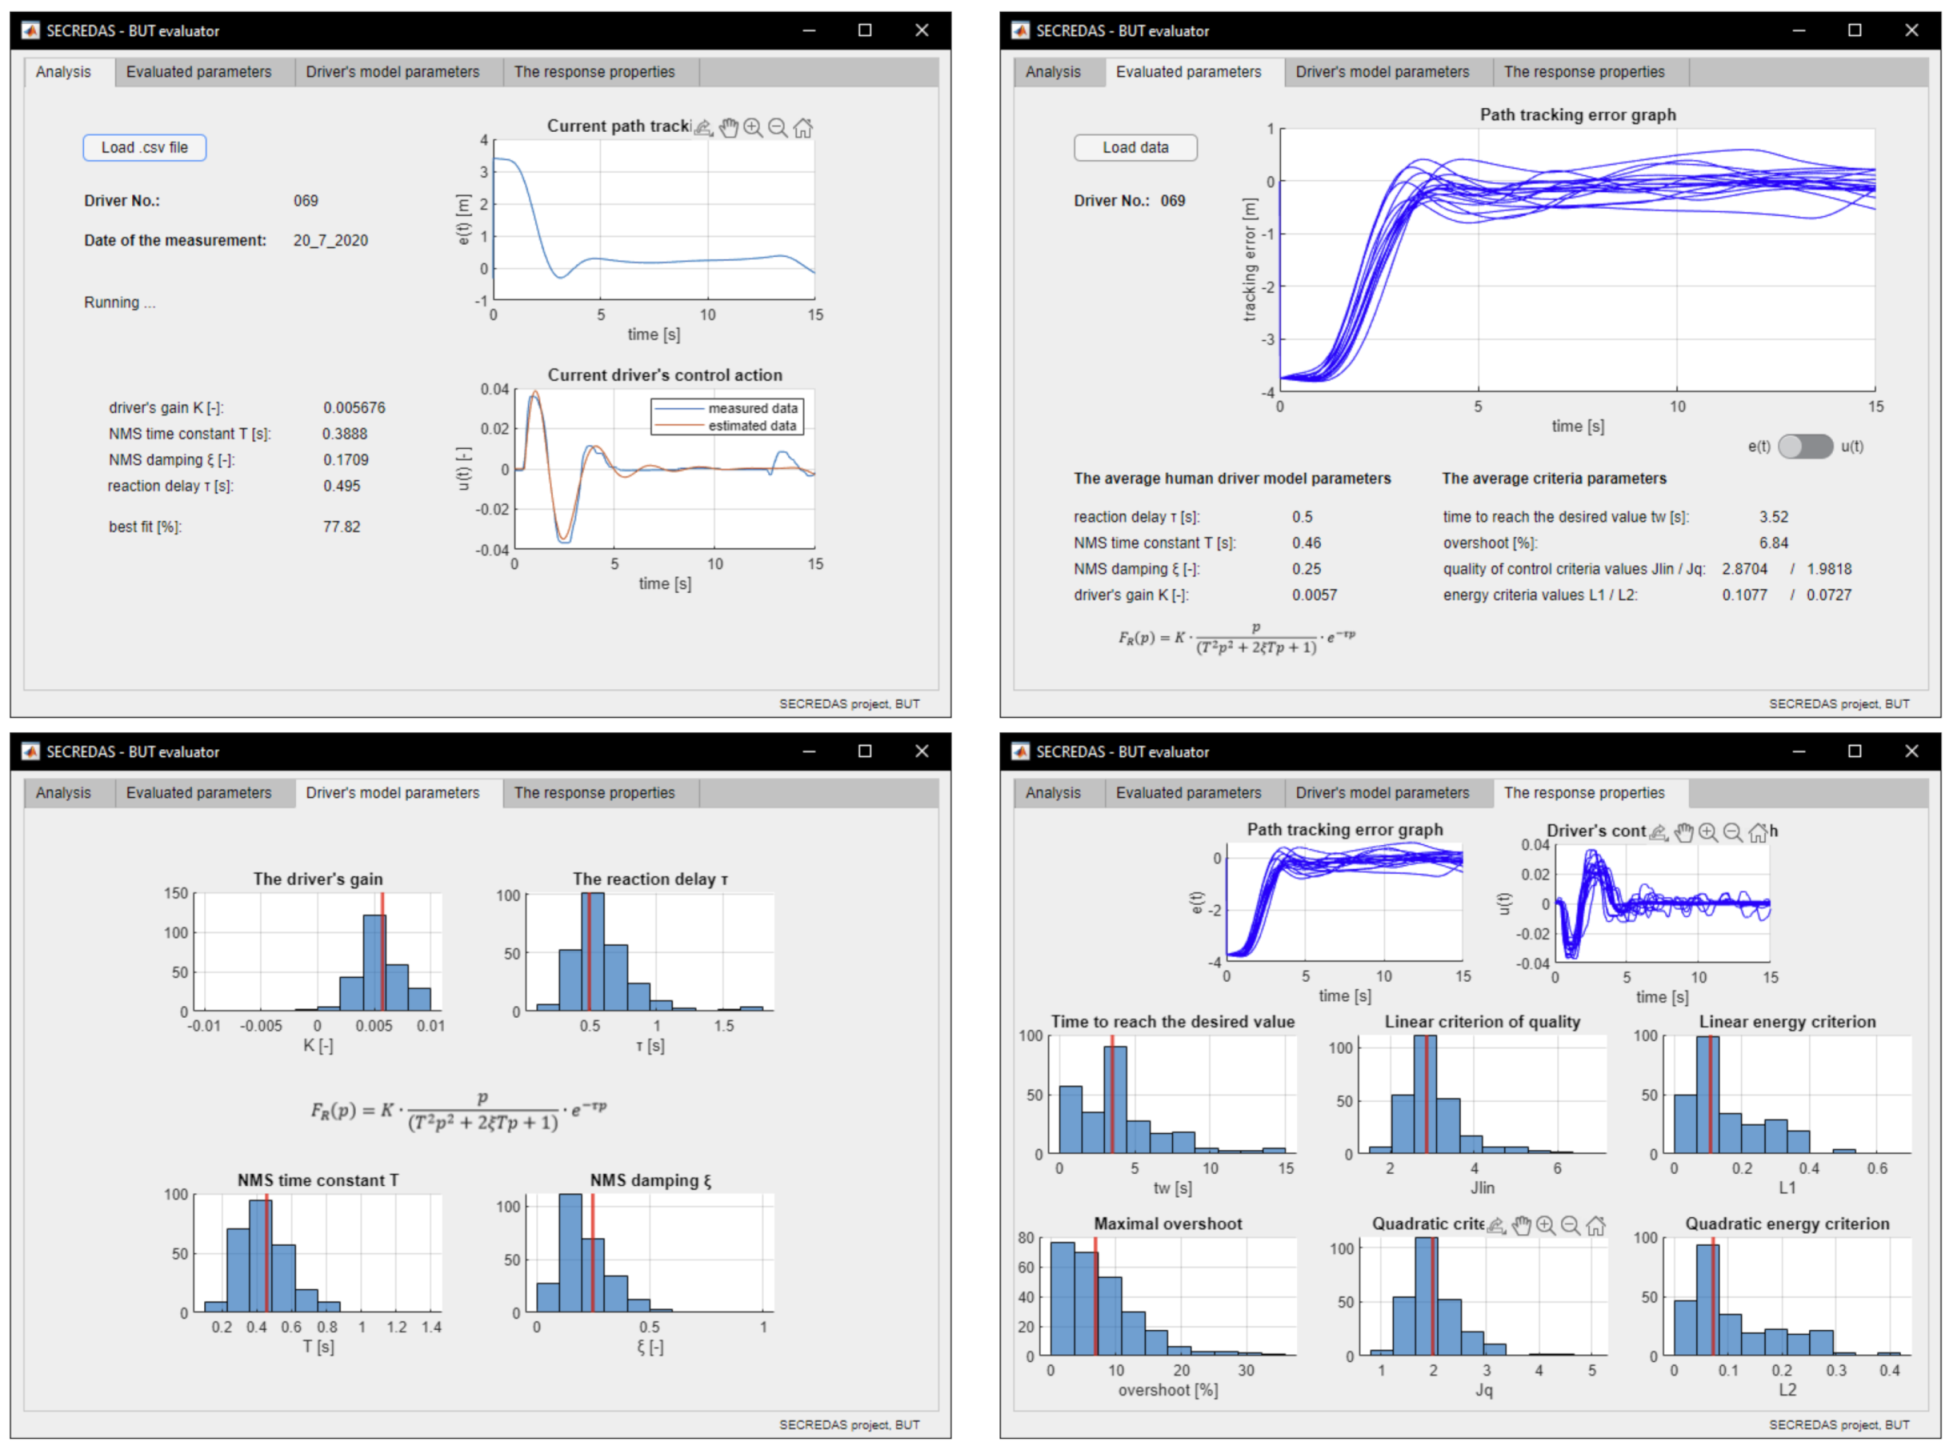
Figure 10 displays the achievement by one of the drivers, based on the analysis from the Highway: Step Response scenario (which consisted of 17 lane step change commands). The resulting parameters can then be statistically compared with those characterizing the other drivers, via histograms. The indicated histograms represent the data acquired through analyzing the step lane change commands (in each tested subject).
Our monitoring approach exploits, above all, control loop modeling; in more global terms, as already mentioned in
Section 1.1, the research utilizes methods that currently find use in the evaluation of pilot behavior, skills, and performance. The loop contains a controlled vehicle and a human driver, allowing us to describe the driver as a controller and to evaluate the basic parameters often used in control theory, including transport delay, transfer function details, nonlinear perception of the distance from the center of the lane, and overall control quality. In the evaluating procedure, the initial scenario is Highway: Step response, where the data associated with a driver’s reaction are measured (applying the steering wheel angle) by means of a repeated step change of the driving lane,
Figure 9. The outcomes are then examined and classified.
The performance of a driver is quantifiable by means of diverse analytical methods. The first of these techniques rests in evaluating the frequency response analysis to yield information about the driver’s control approach in terms of the need to compensate small deviations from the center of the lane. Based on these data, the level of the driver’s skill can be determined.
The second approach to data analysis exploits the modeling of human behavior and the identification of the model parameters. This option exposes the abilities and limitations of a human driver as regards responses to sudden situations and the ability to adapt to controlled dynamics; for such purposes, we use a combination of linear and fuzzy models. The linear portion of the behavioral model was derived from McRuer’s Crossover law and the corresponding general models [
20]. The applied formula is in the form of a second-order transfer function, (
1) [
20]; we then have.
where
K is the driver’s gain,
T and
denote the parameters defining the dynamics of the driver’s neuro-muscular system,
represents the response delay, and
s is the Laplace operator.
Each of the parameters of the model is acquired via identification, for which we employ MATLAB System Identification Toolbox. The input and output signals embody the driver’s visual stimuli (lane change command) and response to a sudden change (rotating the steering wheel), respectively. The structure of the model is derived from Equation (
1). The output of the identification process rests in the transfer function with identified parameters
,
T,
and
K, characterizing the basic dynamic properties of the human regulator, that is, the driver.
In calculating the integral criteria of quality, the input data used are those that represent the distance from the lane, following directly after the step lane change command. This may be considered the response of the control loop (comprising the human regulator and the simulated vehicle) to the step change of the input signal. Integrating the absolute value of deviation from the line in time (or the deviation squared) yields the values of the modified-linear and the quadratic criterion. The deviation pattern then allows us to read relatively easily the parameters (the time it took to achieve the desired value). The criteria for evaluating the expended energy, and , are calculated as an absolute and a quadratic norm of the steering wheel rotation signal.
The list of the parameters that represent the outputs of the individual methods is summarized in the
Table 1, together with a brief description of the individual parameters’ meaning.
The VDS data processing tool (
Figure 10) was created in MATLAB to apply the above-mentioned analyses to the measured data; the tool loads the data as a CSV file in a pre-defined order, executes the control theory-based parameter identification, and outputs multiple control variables, as displayed in
Table 1.


