
A Combinatorial Safety Analysis of Cruise Ship Diesel–Electric Propulsion Plant Blackout
by
 , ,
, ,
Victor Bolbot
1,*, 
Gerasimos Theotokatos
1 ,
,
Evangelos Boulougouris
1 ,
,
George Psarros
2 and
Rainer Hamann
3 1
Maritime Safety Research Centre, Department of Naval Architecture, Ocean and Marine Engineering, University of Strathclyde, Glasgow G4 0LZ, UK
2
DNV Group Research & Development, Maritime Transport, DNV AS, 1363 Høvik, Norway
3
DNV Regulatory Affairs, DNV SE, 20457 Hamburg, Germany
*
Author to whom correspondence should be addressed.
Safety 2021, 7(2), 38; https://0-doi-org.brum.beds.ac.uk/10.3390/safety7020038
Submission received: 21 February 2021
/
Revised: 15 April 2021
/
Accepted: 19 April 2021
/
Published: 14 May 2021
Abstract
:Diesel–Electric Propulsion (DEP) has been widely used for the propulsion of various ship types including cruise ships. Considering the potential consequences of blackouts, especially on cruise ships, it is essential to design and operate the ships’ power plants for avoiding and preventing such events. This study aims at implementing a comprehensive safety analysis for a cruise ship Diesel–Electric Propulsion (DEP) plant focusing on blackout events. The Combinatorial Approach to Safety Analysis (CASA) method is used to develop Fault Trees considering the blackout as the top event, and subsequently estimate the blackout frequency as well as implement importance analysis. The derived results demonstrate that the overall blackout frequency is close to corresponding values reported in the pertinent literature as well as estimations based on available accident investigations. This study deduces that the blackout frequency depends on the number of operating Diesel Generator (DG) sets, the DG set’s loading profile, the amount of electrical load that can be tripped during overload conditions and the plant operation phase. In addition, failures of the engine auxiliary systems and the fast-electrical load reduction functions, as well as the power generation control components, are identified as important. This study demonstrates the applicability of the CASA method to complex marine systems and reveals the parameters influencing the investigated system blackout frequency, thus providing better insights for these systems’ safety analysis and enhancement.
1. Introduction
The ship propulsion and electric power generating functions of modern cruise ships are realised using the Diesel-Electric Propulsion (DEP) plants [1,2,3]. In such cases, loss of electric power (blackout) during the ship sailing or manoeuvring may result in a number of accidents such as collision, contact and grounding, which, in turn, may cause considerable human losses of passengers and crew [4] also associated with severe environmental and reputational loss consequences. As the cruise ship industry has been rapidly developing in the last decade, with both the vessels’ size and the number constantly growing [5], ensuring that blackouts do not occur is a paramount necessity.
According to the International Maritime Organisation (IMO), a modified version of the Failure Modes and Effects Analysis (FMEA) is required for the availability assessment of the propulsion and other systems on the cruise ships following a flooding or fire accident to ensure the vessel’s safe return to port (Safe Return to Port regulations) [6]. Other studies for ensuring the safety of cruise ship power plants involved dynamic simulations [7,8], Reliability Block Diagrams [9,10,11], FMEA [12,13,14], Fault Tree Analysis (FTA) [15,16,17], FTA and FMEA [18], the HiP-HOPS method [19,20], System-Theoretic Process Analysis (STPA) [21,22,23,24], combinatory methods [25], accident investigation data [26], reachability analysis [27], and Markov chains [28].
The ships’ DEP plants are classified as complex marine Cyber-Physical Systems (CPSs) [29] and, thus, their software-intensive character and dynamic reconfiguration functions need to be considered in the safety analysis/assessment [30]. According to previous accident investigations, the control and automation system faults are important contributors to blackouts in ships [31,32]. Thus, it is essential to quantitatively assess the DEP system’s safety performance taking into account the employed software-based functions [33,34,35], as well as to estimate their importance metrics to allow for a cost-efficient safety enhancement [36,37].
In this respect, the present study aims to: (a) estimate the blackout frequency for the investigated cruise ship DEP system for various operational phases; (b) carry out an importance analysis to identify the critical components, and; (c) demonstrate the CASA applicability to a complex system. The classical safety analysis method’s deficiencies are addressed by the CASA method, which: (a) identifies Unsafe Control actions as it encapsulates the STPA steps (thus more effectively capturing the Cyber-Physical System’s (CPS) software-intensive character); (b) considers the sequences of the potential safety events by employing event sequence analysis, and; (c) provides quantification of the frequency (or probability) of the safety-related events by employing quantitative FTA.
The original contribution and novelty of this study includes: (a) the quantitative estimation of the blackout frequency for a cruise ship DEP plant and the associated importance analyses in a number of operation phases; (b) blackout frequency estimation with varying design and operational parameters such as varying Maximum Continuous Rating and the amount of tripped load; (c) a number of adaptations used with the CASA method to apply it to the investigated DEP system.
2. DEP System Description and Case Studies Definition
2.1. System Description
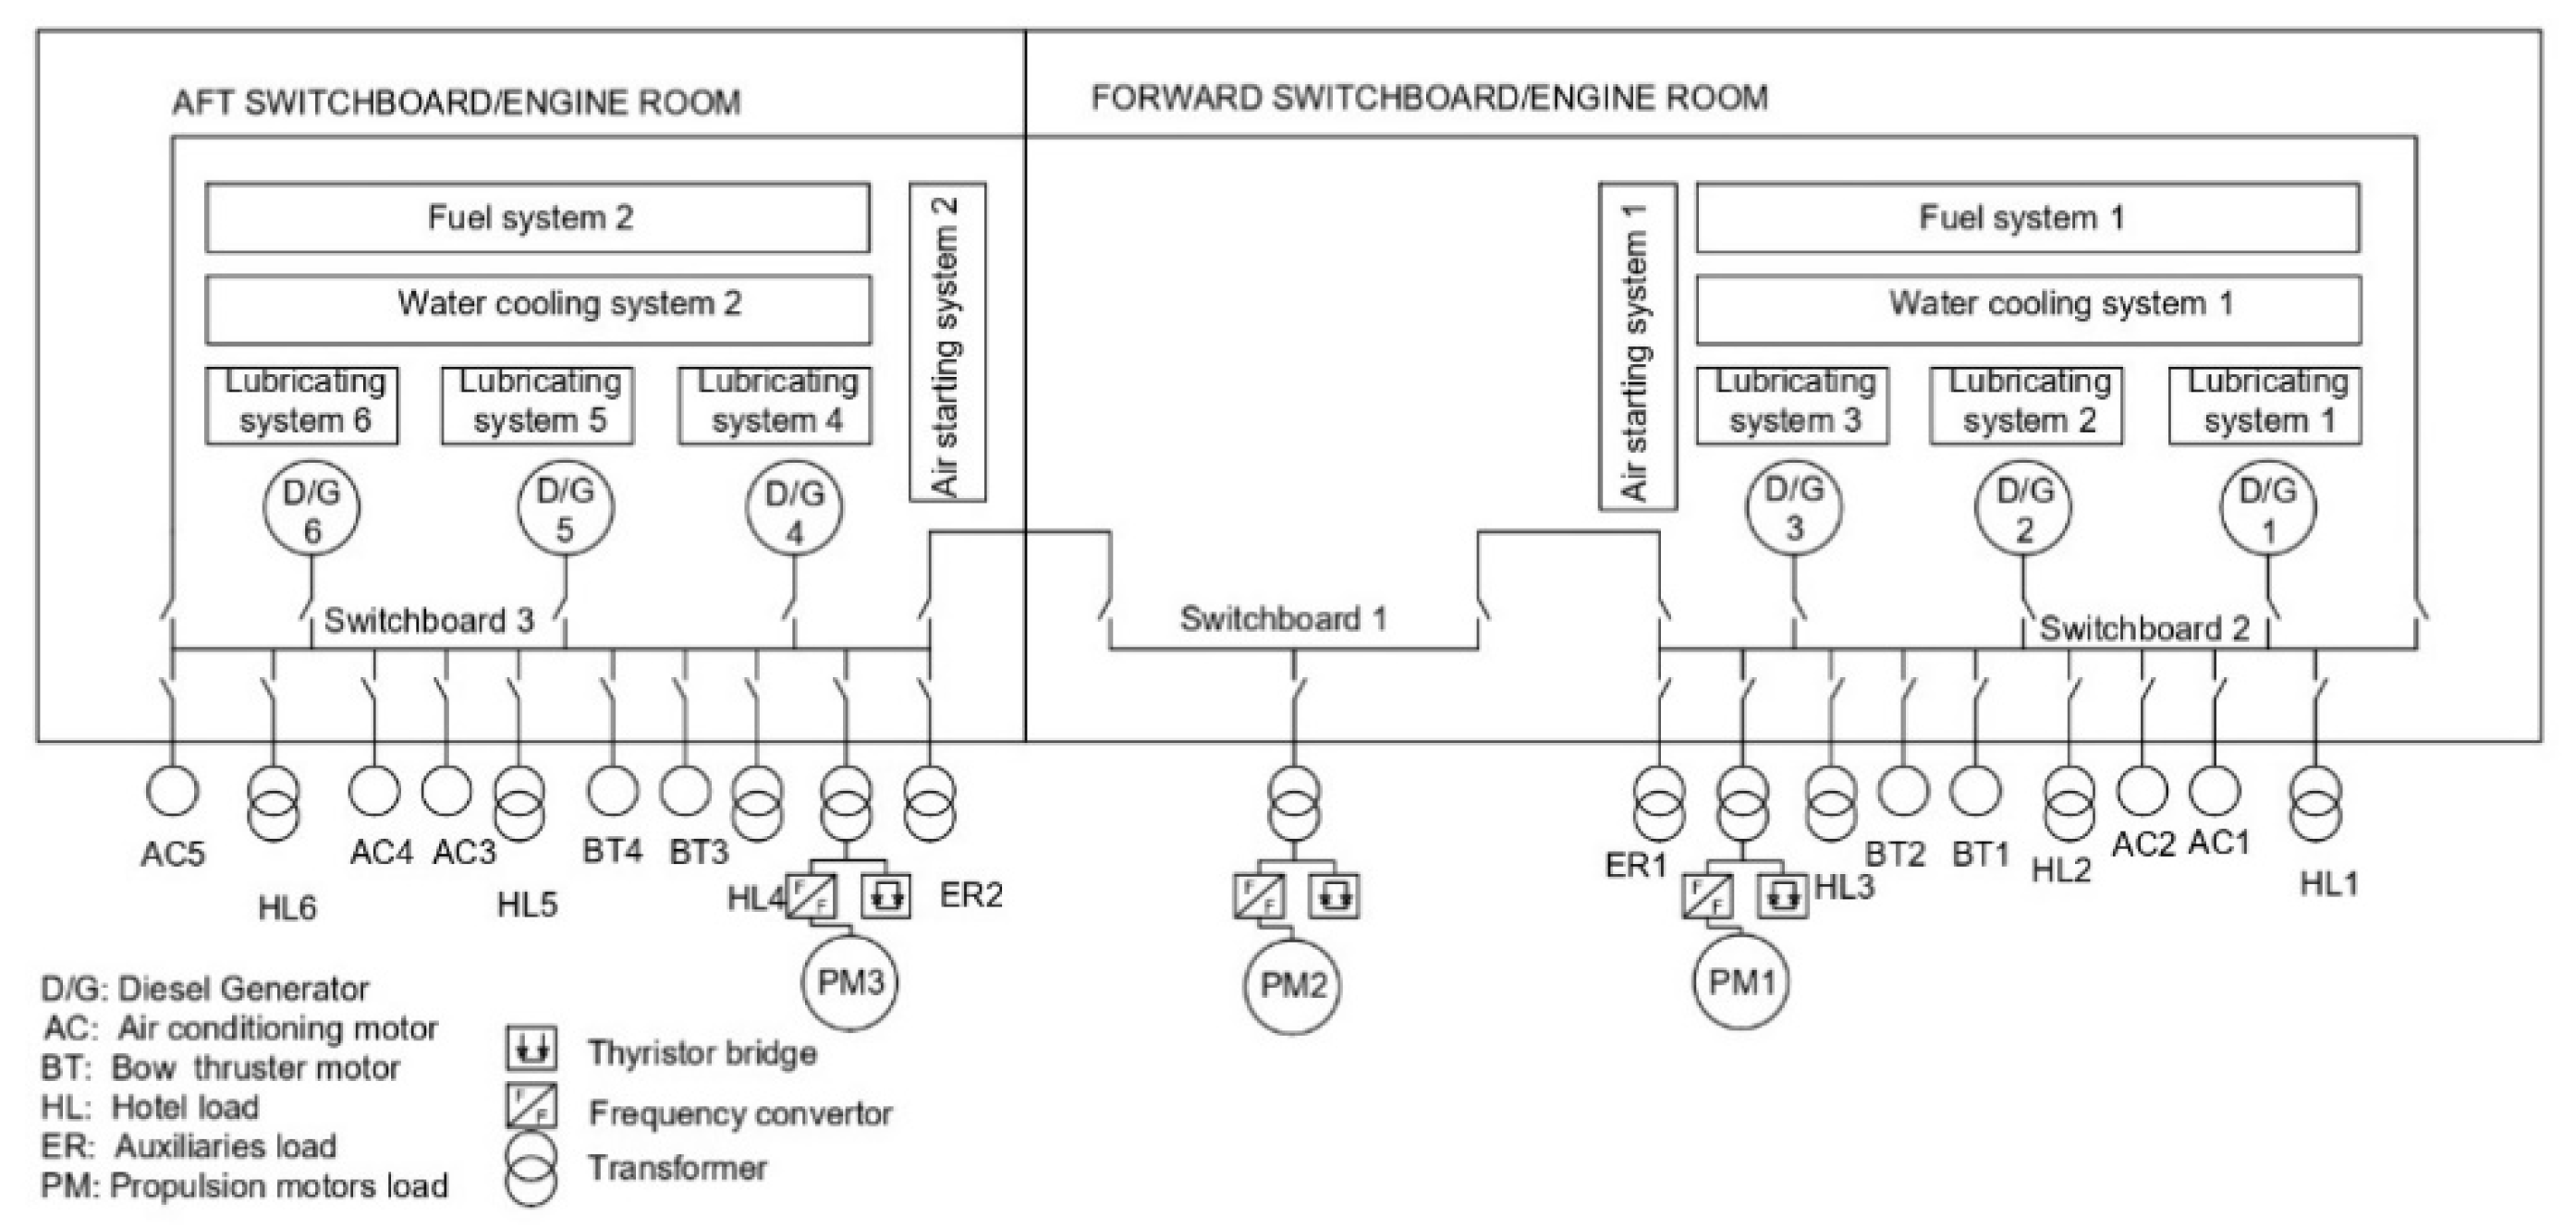
The simplified single line diagram and a system control structure diagram are provided in Figure 1 and Figure 2, respectively. Design data were retrieved from the operating and maintenance manuals of the system components, the associated system drawings and relevant literature [2,38,39,40,41,42,43] and are provided in Table 1.
The engines (of the DG sets) starting up is based on the ship’s electrical load demand, whereas the engine switchover is also implemented based on the DG set’s running hours. The system is capable of implementing fast propulsion motors electrical load reduction and preferential tripping functions (fast load reduction). This is realised by tripping heavy energy consumers including the electric motors of the Air Conditioning system compressors (AC). The system generator sets can normally accept a load up to 90% of their nominal power. The total power demand is evenly shared among the operating generator sets (proportionally to each generator-set nominal power). Prewarning alarms can allow a DG set to switch over to a healthy available DG set, when a lubrication oil low-pressure alarm, high exhaust gas temperature alarm and high cooling water temperature alarm are present in each operating DG set. As an optional function, the Intelligent DG set diagnosis can be used. Intelligent DG set diagnosis allows for tripping a faulty DG set in the case where a failure is present in the governor and Automatic Voltage Regulator (AVR) subsystems, leading to load imbalance and subsequent blackout [41].
2.2. Case Studies Selection
Based on the system description, the following case studies are selected:
- Varying the prewarning alarms’ effectiveness from 0% to 50% and 100% to assess the importance of this function.
- Varying the DG set loading, as it is also expected to affect the potential DG overload conditions [39].
- Investigation of the maintenance intervals and periodicity impact on the blackout, as it is widely acknowledged that maintenance intervals and periodicity affect the system’s safety.
- Investigation of the intelligent diagnosis impact on the blackout frequency/failure rate (intelligent diagnosis is a novel concept [41], allowing the identification of the DG set that contributes to the network instability and its switching off).
- Investigation of the system’s susceptibility to blackout with varying the number of operating DG sets.
- Investigation of the DEP system’s susceptibility to blackout and important failures in various operating phases of the cruise ship including sailing in the open sea, manoeuvring close to harbours and in the harbour phase (at berth).
To facilitate the comparative assessment of the investigated case studies and the calculated frequency of blackout (FOB) verification against results from the pertinent literature, a general operation phase was considered that aggregated the analysed operation phases. The considered case studies for the investigated system are summarised in Table 2.
3. Employed Methodological Approach
The methodology followed in this study consists of three phases, as illustrated in the flowchart shown in Figure 3. The CASA method was adapted to the needs of the case studies as described below. During the first phase, the investigated systems’ Fault Trees is developed considering the blackout as the top event. During the second phase, the top event failure is estimated for the considered case studies. During the third phase, the importance measures are calculated.
3.1. Phase 1 Fault Tree Development
During the first phase, the Fault Tree considering the blackout as the top event is developed by employing the CASA method. The CASA method and its steps’ detailed description is provided in [33]; therefore, only a short description is provided in the present study. Initially, CASA follows the steps of the STPA approach (Leveson, 2011), and the hazards or sub hazards, Unsafe Control Actions (UCAs) with their causal factors based on the hierarchical control structure are identified. Then, each sub hazard/hazard is used as an initiating event and the propagation of sub hazards into other hazards or sub hazards is examined by considering the interactions between the system components, the presence of protective barriers and the combinatory faults using Event Sequence Identification (ESI). The previous step’s results are synthesised into a single Fault Tree (FT), which effectively integrates the results of STPA and ESI analysis. In the last step of Fault Tree development, some events of the Fault Tree are further analysed by using FTA. This is implemented for the reference system as well as for the system with the intelligent diagnosis considering the total number of connected DG sets. Hence, 12 Fault Trees are developed in total. Six Fault Trees are developed for the reference system; each Fault Tree corresponds to the cases where one to six DG set(s) operate(s) (simultaneously for the case of multiple DG sets). Likewise, six FTs are developed for the investigated DEP system with intelligent diagnosis functionality. Although the developed Fault Trees are similar, some of the connections and gates are different, depicting each investigated system’s characteristics.
3.2. Phase 2 Top Event Frequency Estimation
During the second phase (Figure 3), the top event failure rate is estimated and the results are compared with respective results from generic accidental data. For the investigated system, two adaptations were made. The first adaptation includes the estimation of failure rate in different operation phases according to the following equation:
where denotes the system blackout failure rate in a specific phase, p denotes the total number of operating DGs, denotes the frequency of operation with specific DGs total number (from one to six DGs simultaneously operating in the investigated DEP system), and is the blackout failure with the specific total number of operating DGs. The employed assumption for deriving this equation is that the probabilities of the blackout are independent for each considered system configuration and operation phase.
The blackout frequency is calculated by employing the following equation as a function of the specific operational time () and the blackout failure rate () [45]:
For each operation phase, the is compared with available from accident investigation data. This is required to ensure the consistency of the derived results with existing statistical data for a number of power plants.
The second adaptation accounts for the operating components with preventative maintenance. The average failure rate between two inspection maintenance periods was estimated by considering Weibull distributions for the components’ failure rates. The use of Weibull was required to account for the inspection intervals, so that the maintenance intervals can be properly captured. The additional equations that were used for estimating the considered basic events probability () are provided in Table 3. The required input parameters include the number of the redundant components , the components’ maintenance and testing intervals (), the maintenance repair rates (), the components’ failure rates (), and the beta factor of the Weibull distribution (). The probability for DG set overload conditions in cases of a single or multiple DG sets failure was estimated using the equations derived by [39].
3.3. Phase 3 Importance Measures Estimation
During the third phase, the importance measures were employed. The only adaptation is that instead of top event failure rate (, the blackout failure rates for each operation phase are used. The importance measures results ( are compared with available statistical data. As the metric is used to identify the top event most probable cause, can be compared with available data from accident investigation reports [31] by aggregating the values for the different failure categories leading to a blackout, with this quantifying the overall contribution of each category .
The safety recommendations are primarily generated based on importance measures. However, results from other phases, the generated Fault Trees structures and observations, as well as the estimated blackout frequency in the investigated operating phases are also used to derive appropriate safety recommendations.
4. Analysis Input Description
4.1. Overview
Five types of input parameters are used, namely: (a) design data including the system layout, the system functions, the number and type of involved components, the control structure, and the maximum loads for some of the components (presented in Section 2.1); (b) the operating data for the system and its components; (c) the maintenance and inspection intervals for some of the components; (d) maintenance duration for some of the components; (e) the components’ failure rates and factors; (f) assumptions for system functionalities. The used input parameters along with the associated sources are further analysed in the next paragraphs.
4.2. Operating Data
Based on the investigated cruise ship’s actual operating data, which were collected for a period of 46 months, the frequency (time percentages) of each operation phase and the specific system configuration (the latter also considers the operating Propulsion Motors (PM) and Bow Thrusters (BT)) were estimated and presented in Table 4. These data have been aggregated by an automatic monitoring system, which provides the electric energy (in kWh) of the DG sets, the azipods and bow thrusters every 30 min over the above mentioned period.
The general phase shown in Table 4 represents the overall, averaged plant operation and is practically a combination of other operation phases. Based on the available data, the probability density functions for the DG sets’ load were estimated. From the operational data, the following observations were made: (a) a request to connect an additional DG set with the ship’s electric network is implemented every 10 h; (b) switching over between DG sets is implemented every 20 h; (c) the change from the harbour phase to the manoeuvring phase is implemented every 40 h and vice versa.
4.3. Maintenance Inspection Intervals and Maintenance Duration
The maintenance inspection intervals were retrieved from the manufacturers’ maintenance manuals, whilst the maintenance duration was estimated based on the data provided in [8,46,47], the OREDA database [48] and the actual operational data. For the safety functions sensors, it was assumed that their maintenance duration is equal to one hour, whilst the hardware and communication lines’ maintenance duration was assumed to be 20 h.
4.4. Failure Rates for Components
Several sources were used to estimate the failure rates for the components of the investigated cruise ship DEP system. These included: (a) the OREDA database [48,49,50]; (b) the pertinent literature (as reported in [25] and the Supplementary Material of this study), and; (c) previous blackout events’ investigation reports (available by a cruise ship operator). The accident investigation reports and the Protection and Indemnity (P&I) insurance [31] club results were used for a high-level comparison of the criticality assessment results with the results calculated for the investigated system. The failure rates of the system’s functions that use software were estimated from the data provided in [51,52]. The values for components with preventive maintenance were retrieved from a number of publications listed in [25] and Supplementary Material. To use the components’ failure rates (initially estimated using the exponential distribution) as components with the Weibull probability distribution, the correction ratio values were provided in [53].
In addition, the failure rates were assumed to be zero for all the STPA causal factors related to the flawed process model, except for the failure rates depicting errors related to the intelligent DG set diagnosis responsible for the identification of system load imbalances.
4.5. Analysis Assumptions
The following conservative assumptions were made for analysis purposes:
- Any electrical load sharing imbalance can be corrected by the PMS in 90% of the cases, whereas if an intelligent generator diagnosis is provided in the system, this system manages all the electrical load sharing imbalances by tripping the faulty DG set.
- An uncontrolled electrical load sharing imbalance will lead to a blackout in half of the cases, whilst only one DG set will be lost for the other half.
- Prewarning functions will allow the safe switch over to another DG set in 50% of the cases when a lubrication oil low-pressure alarm, high exhaust gas temperature alarm and high cooling water temperature alarm are present in one of the operating DG sets.
- The power plant operates with the bus-tie circuit breaker connected in all operational modes.
- It should be noted that the system operation with six DG sets is very rare for the reference system (less than 1% of the total ship operational time), so it was set at 1% to assess the influence of the system configuration with six DG sets operating on the overall blackout frequency.
- Any short circuit not cleared by the protection system will lead to the DG sets’ overcurrent and a consequent blackout.
- The tripping of air conditioning motors, bow thrusters and other loads causes insignificant electrical transients. Significant electrical transients are caused by the loss of operating propulsion motors and DG sets.
- An uncontrolled arc failure in the switchboard will cause a loss of one electric power section of the DEP plant. This is a realistic assumption, as an uncontrolled arc may result in switchboard destruction.
- Any fire in an engine room will lead to the loss of all the generator sets in this engine room.
5. Results and Discussion
5.1. Phase 1 Fault Tree Development
5.1.1. STPA Results
The list of the generated sub hazards from the STPA for the investigated DEP system that can lead to a blackout event along with the safety constraints and the existing safety measures are presented in Table 5. These hazards were identified based on previous publications such as [39,41,43,54,55,56,57]. The safety constraints and the existing safety measures are also given in Table 5. The identified sub hazards are not related to the system component failures and transfer the focus of analysis to the general system state. This is an advantage of this study compared to the previous studies [9,15,18,20] that consider only the DG sets’ availability. Herein, conditions such as imbalanced power generation, operating DG set overload and electrical transients are considered. The presented sub hazards are of the high-level type, and they most likely could be identified using a Preliminary Hazard Analysis (PHA) method. However, the PHA cannot support the Unsafe Control Actions (UCAs) and their related causal factor identification.
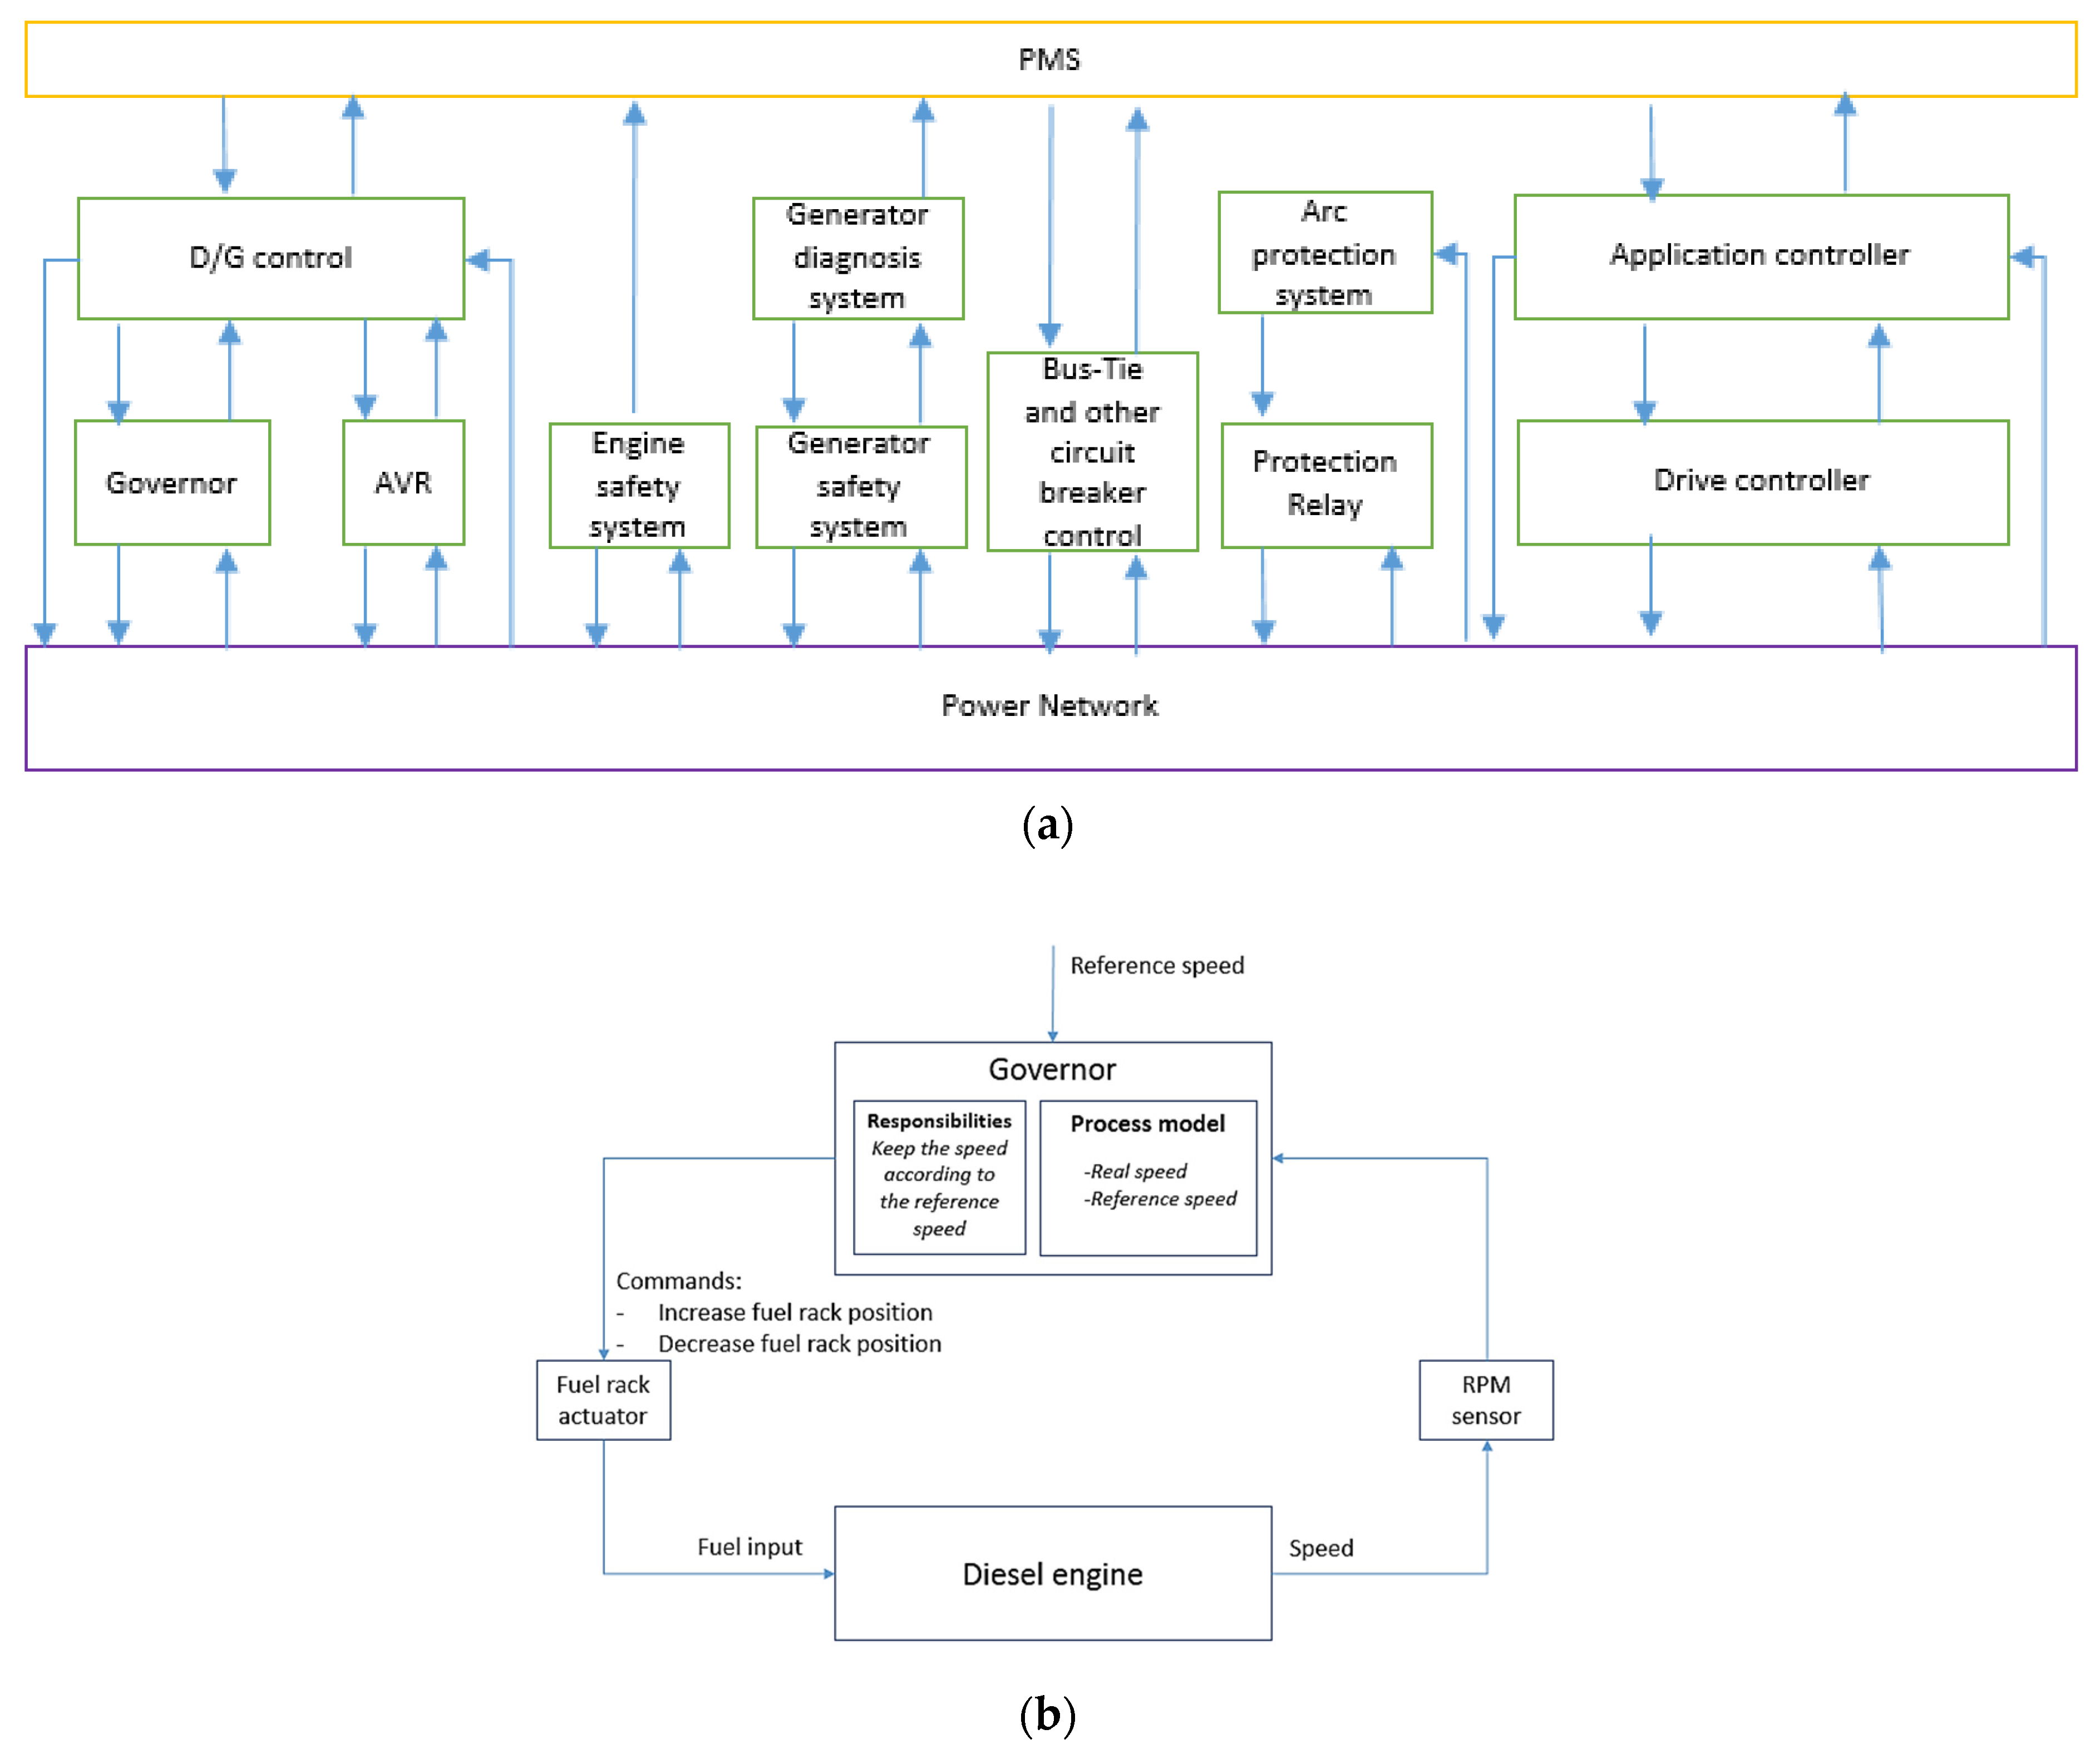
The investigated DEP system control structure (CASA Step 2) was developed based on the information in the manufacturers’ manuals and other publications cited in Section 3.1. The developed overall control structure is presented in Figure 4a, whereas the typical detailed description of the engine governor is provided in Figure 4b. The intelligent generator diagnosis system is also included in Figure 4a.
The STPA investigated system UCAs (CASA Step 3) were derived with the support of the open-source software XSTAMPP [58], by considering all the possible failure modes of the control actions; in total, 78 UCAs were identified. A considerable number of UCAs (19/78 or 24%) were related to the PMS functions, whereas six of them were related to intelligent diagnosis. Proceeding from the higher to the lower controller hierarchical levels, the number of UCAs decreases, as the controllers’ functionalities reduce in number. The greater percentage of the UCAs (56%) was related to the DG set overload hazard H-3. The incorporation of the UCAs leading to blackout for the investigated DEP system is one of the differentiating elements of the Fault Tree that is developed in the next steps compared to the Fault Trees presented in [9,15,18,20]. In this respect, the presented analysis more effectively captures the software-intensive character of the investigated DEP system.
The second step of the STPA (CASA Step 4) includes the identification of the causal factors contributing to the DEP system UCAs. For each UCA, 1 to 10 causal factors were identified. This task was repeated for all the 78 UCAs. On average, 3.8 causal factors per UCA were identified (299 in total, considering intelligent diagnosis). The distribution of all causal factors per category is shown in Figure 5. It is observed that the dominant factors were related to: (a) the flawed control algorithm implementation; (b) the inconsistent process models; (c) the flawed process model input from sensors to controllers, and; (d) the inappropriate transmission of the control signal to actuators. In addition, failures in actuators leading to the flawed execution of control actions were identified as important causal factors. Fewer causal factors were identified related to conflicting control actions, missing output from controllers due to their failure and inappropriate control input. These results are attributed to the fact that the STPA more effectively highlights the importance of the software functions for the system, thus supporting the identification of the causal factors related to the control hardware and software including flawed control algorithms, flawed process models and flawed process model input parameters [30].
5.1.2. ESI Results
The application of ESI is crucial for capturing the DEP dynamic reconfiguration functions [33]. The five sub hazards that were identified for the investigated system were used as initiating events in the ESI “Event Trees” development phase for the sub hazards H1 to H5 (Table 5).
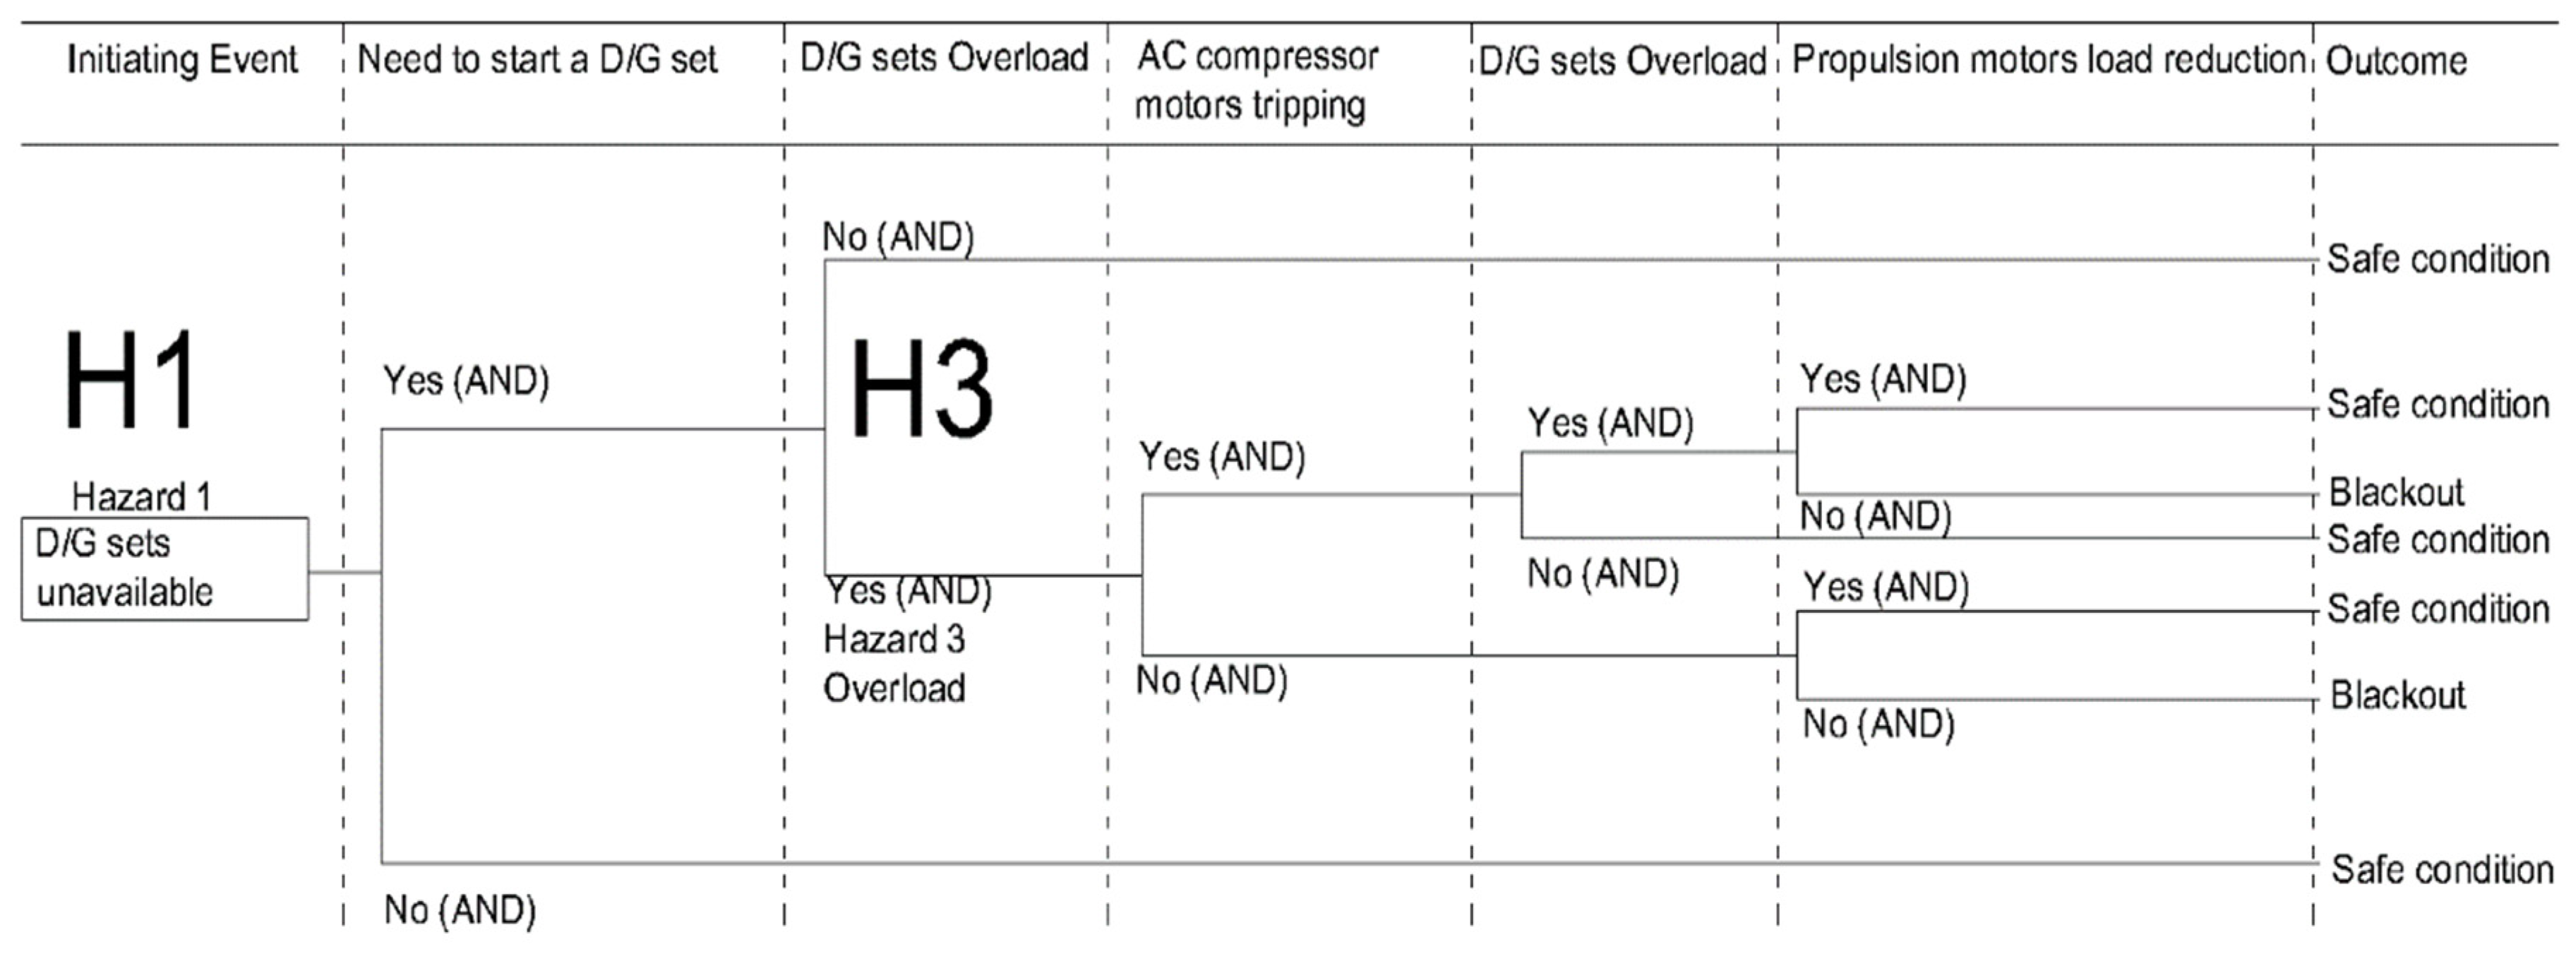
A resultant example ESI “Event Tree” showing the propagation of two of the sub hazards, namely DG set unavailability H-1 and operating DG set overload H-3, leading to blackout is presented in Figure 6. It is expected that blackout will occur provided that the DG sets’ overloading is not properly handled by the system (reducing the DG set overload by tripping the AC motors or reducing the propulsion motor electrical load). The unavailability of DG sets will indirectly lead to the DG set overload.
5.1.3. STPA and ESI Results Integration
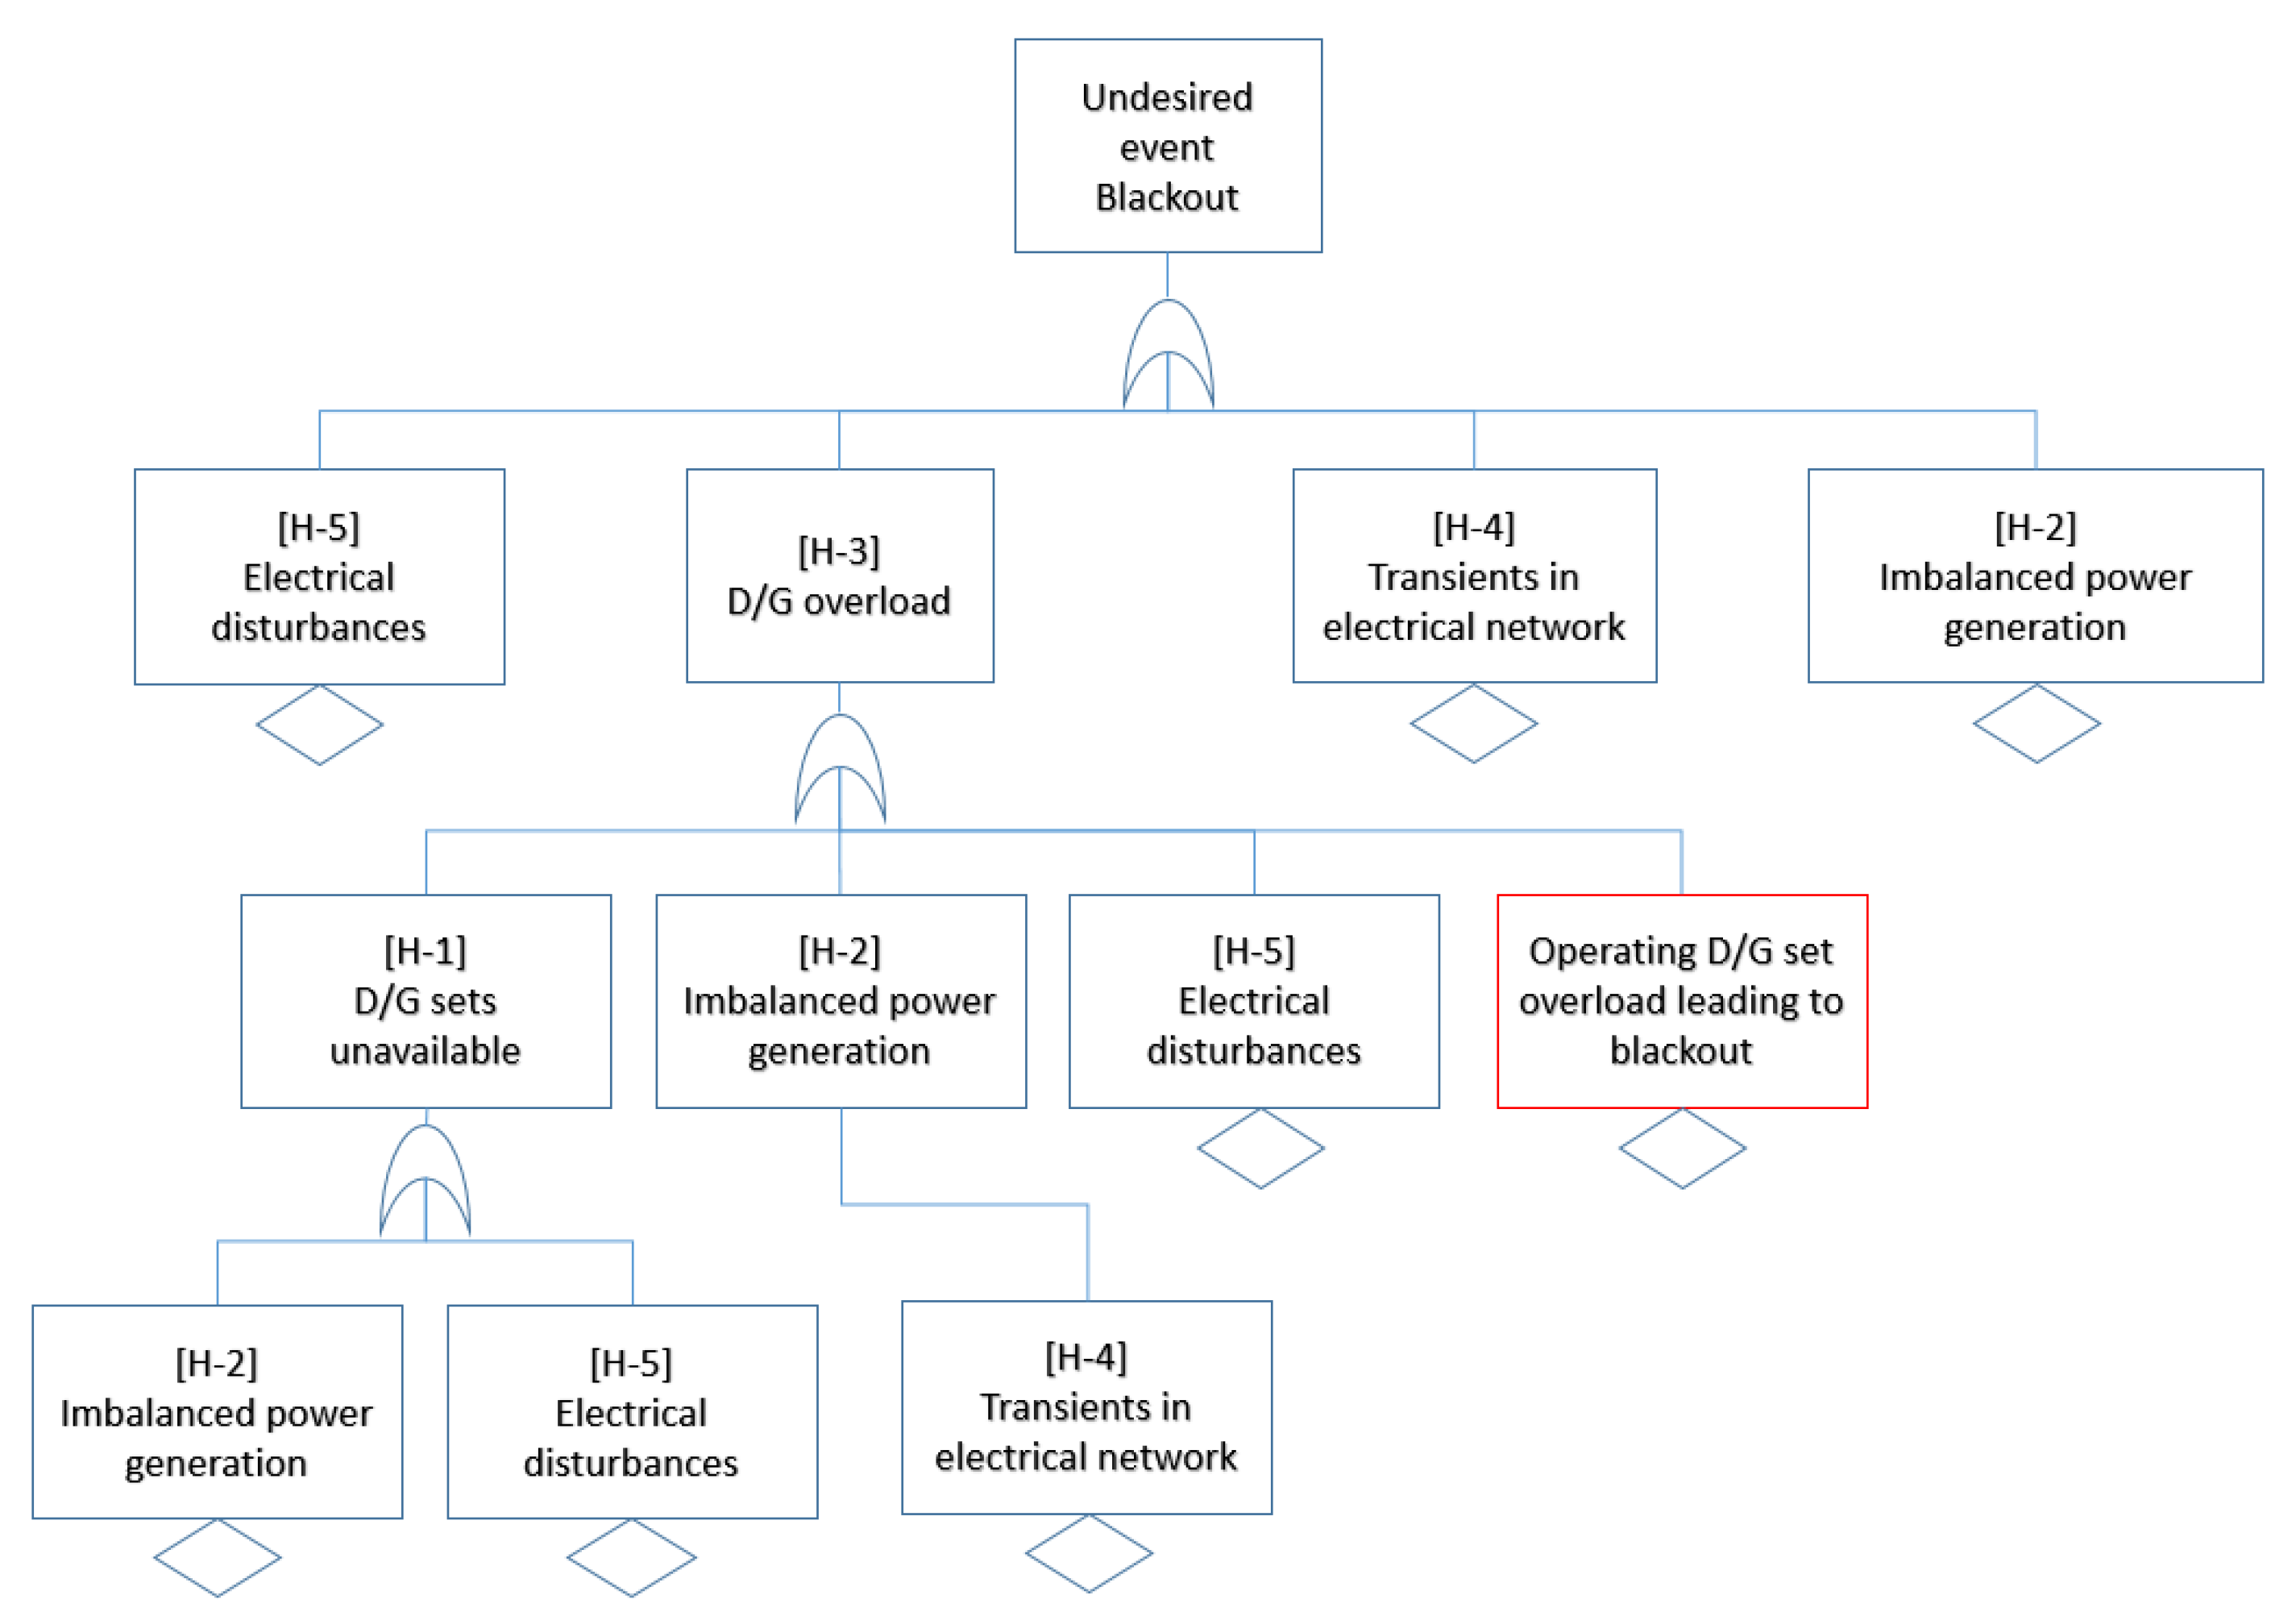
The Fault Tree derived from the synthesis of the ESI results is presented in Figure 7 (CASA Step 6). The developed Fault Tree is quite extensive and includes 13 levels, 21 AND gates, 9 OR gates and 57 undeveloped events; hence, it was not possible to present it to its full extent. The Fault Tree shown in Figure 7 demonstrates the complexity of the interactions between the different sub hazards in the investigated system. The operating DG set overload leading to a blackout event is also represented in this FT to show the relationship between Fault Trees shown in Figure 7 and Figure 8.
Following the STPA results’ integration into the developed Fault Tree (CASA Step 7), its size became extremely large, as for each event of the initial “Event Trees” and consequently to the Fault Tree two levels were added, exponentially increasing the number of gates and undeveloped events corresponding to the UCAs and the causal factors, respectively.
Refinement for the UCAs context was applied for 40 out of 78 UCAs in the reference system (CASA Step 8). Typical examples include the UCAs for starting the DG sets and controlling the position of the bus-tie breaker. The grouping of the interconnected UCAs was applied for the UCAs related to the DG sets starting, controlling the propeller speed, and thus, the load of the electric propulsion motors as well as the UCAs for controlling the bus-tie circuit breaker position. The electrical load transients may be caused by different events (fast increase in propulsion power or sudden loss of a heavy electrical consumer), which will increase or decrease the operating DG sets’ power output leading to potential imbalanced load sharing between the connected DG sets. The causal factors for the occurrence of the UCAs leading to imbalanced load sharing between the DG sets in both cases are the same, so their merging can be applied. The PMS hardware failure and the DG sets’ speed and voltage sensors’ erroneous measurements were identified as common causal factors to many UCAs and were promoted to a higher level.
Contradictions were found in the UCAs related to the PMS functions. The PMS cannot start a DG set and cannot handle a load imbalance or overload when the PMS hardware failure occurs. An additional refinement was applied to the UCAs related to the DG sets’ physical failures. An extract from the refined Fault Tree describing the conditions leading to blackout due to operating DG set overload based on the “Event Tree” of Figure 6 is presented in Figure 8. As it is observed from this figure, the refinement was applied in case of (a) not starting a DG set when a DG set has a failure; (b) not starting a DG set when the load demand is high, and; (c) for the PMS hardware failure. The DG sets and other failures are further analysed using the FTA as described in the next section.
5.1.4. FTA results
The FTA is used to further develop some events in the refined Fault Tree of the previous step; specifically, FTA was applied for the analysis of the failures in one DG set, its auxiliary systems and the ship’s propulsion electric motors. The Fault Tree derived for the main engine failures leading to the engine shut down is presented in Figure 9. This Fault Tree was developed based on information provided in [59,60,61,62,63,64,65]. However, it differentiates from the information provided in the mentioned resources in the way the failures are organised and presented, as attention was given to the conditions leading to the engine shut down. In this Fault Tree, the failures of the air starting system are not incorporated, as the air supply system is engaged only during the engine starting procedure. In addition, failures leading to the deterioration of the system performance are not considered as a cause of the engine shutdown. The critical alarms of the system leading to the system shut down are activated by: (a) failures of the DG set control hardware; (b) high cylinder liner temperature; (c) high cooling water temperature; (d) high thrust bearing temperature; (e) high main bearing temperature; (f) low lubrication oil pressure; (g) increased oil mist concentration, and; (h) other failures affecting the engine output.
5.2. Phase 2 Top Event Frequency/Failure Rate Estimation
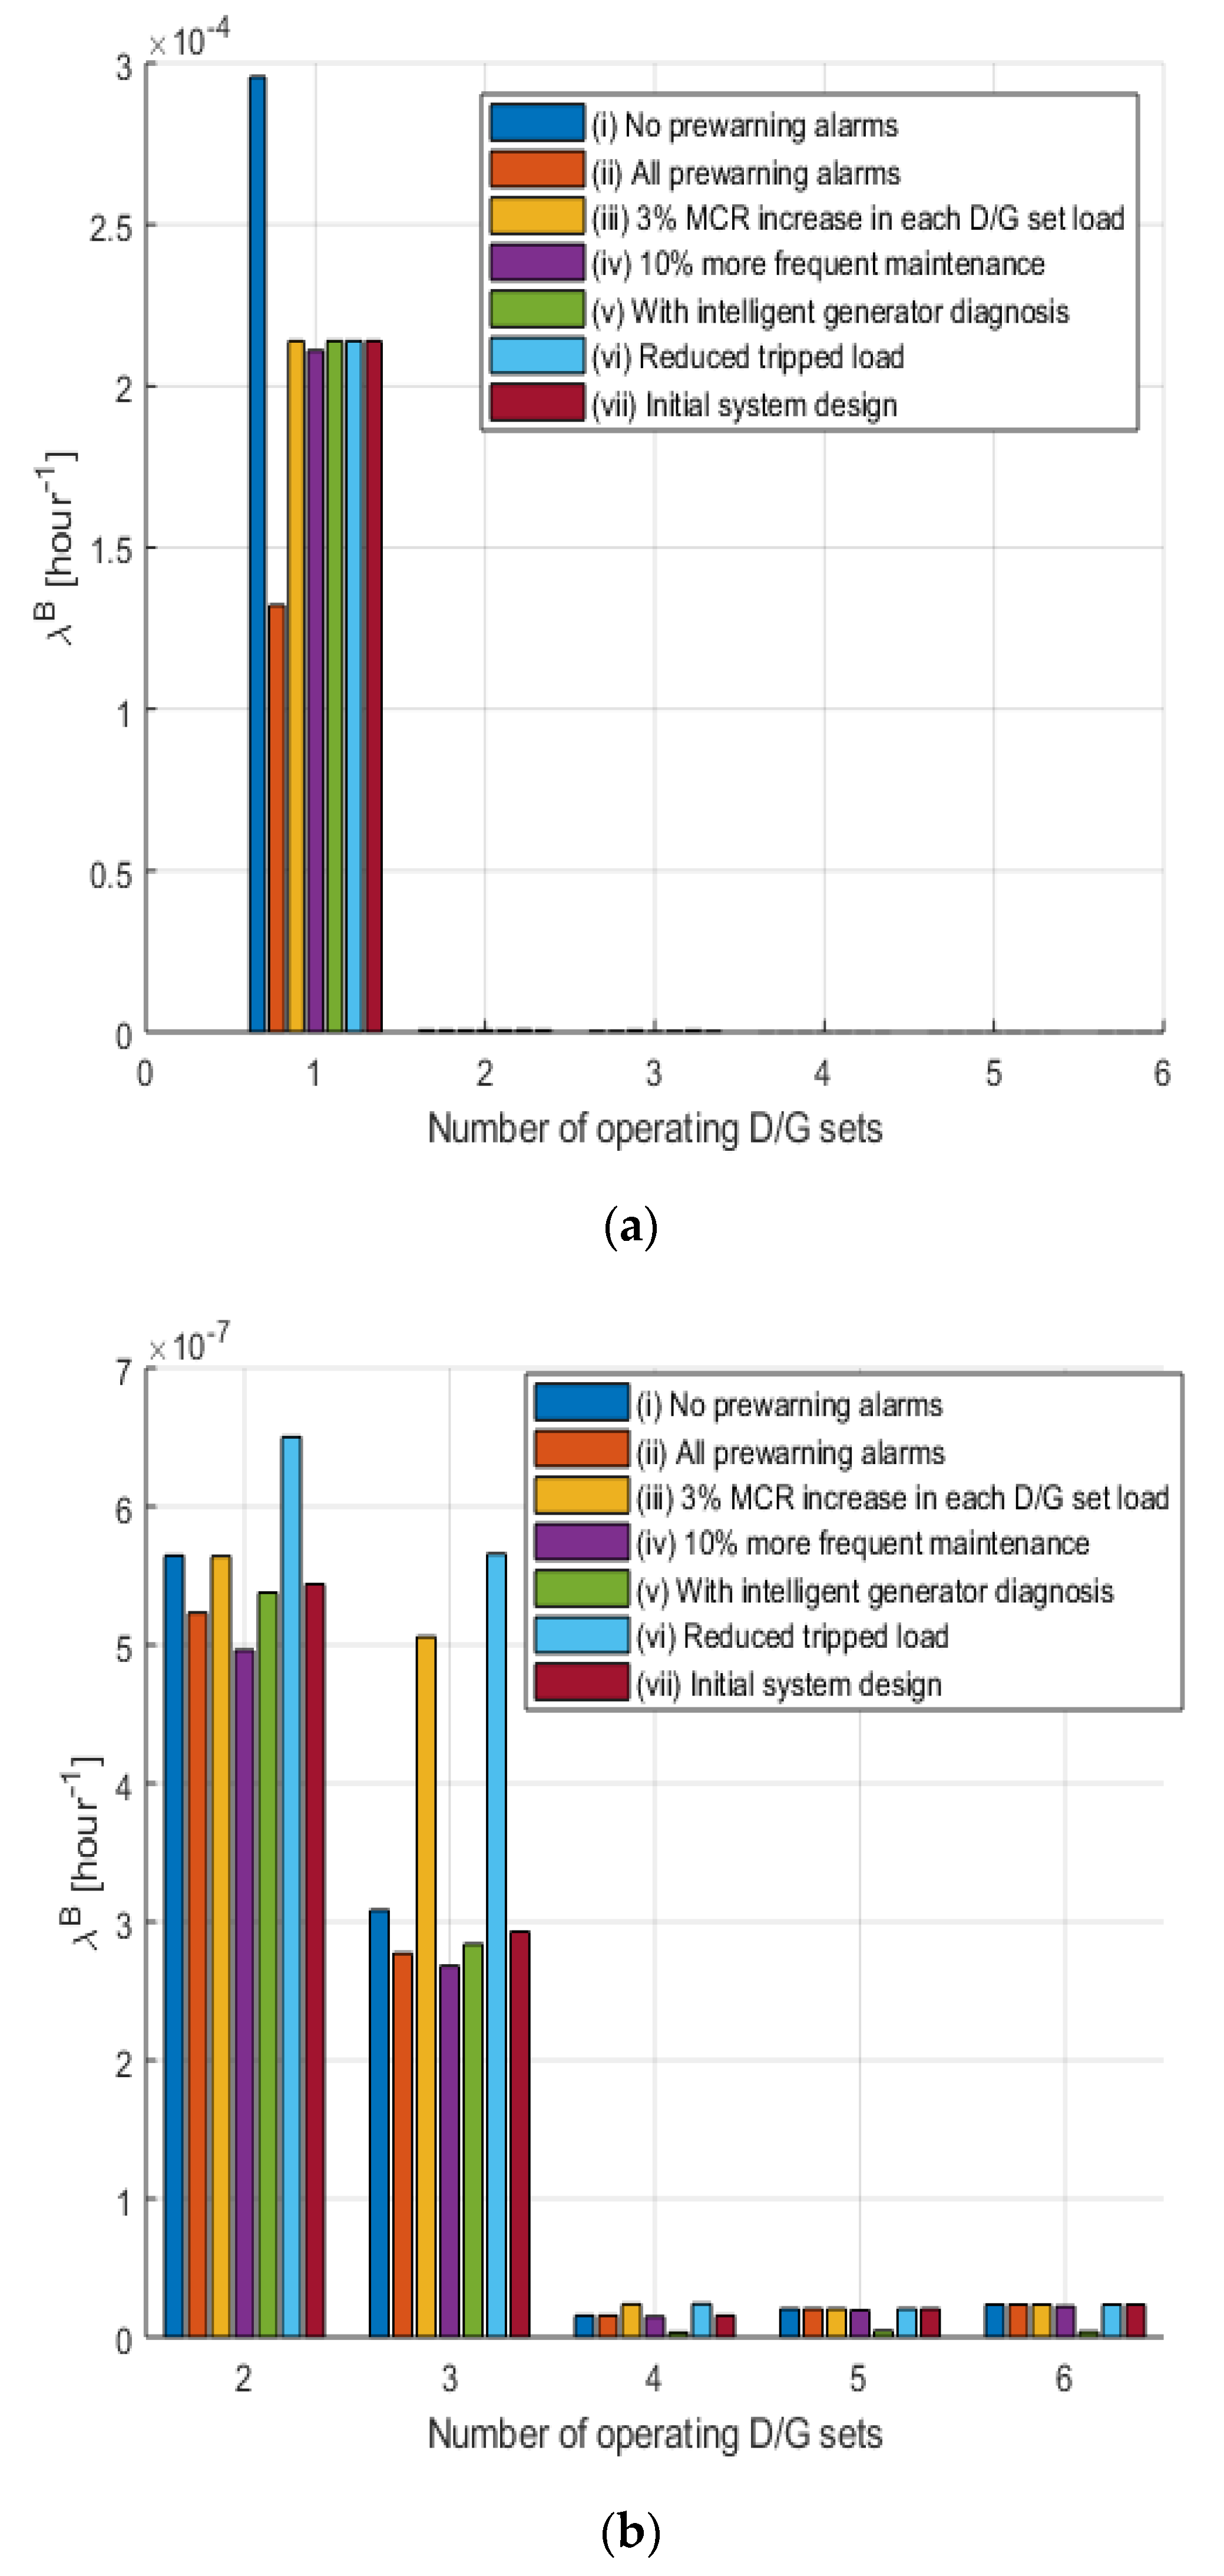
The blackout failure rate for the cases where the investigated DEP system employs a different number of DG sets simultaneously operating in the general phase is presented in Figure 10a,b. It can be deduced that the is significantly higher when only one DG set operates, as a single point failure in the operating DG set or its auxiliary systems will lead to a blackout. In addition, due to the operational profile of the cruise ship and the DG sets’ loading conditions, DG set overload conditions will occur more frequently when running with two or three DG sets (in comparison with the cases where more DG sets operate), which leads to greater values in these cases. Furthermore, operating with five operating DG sets provided a slightly greater in comparison with the when operating with four DG sets. This is primarily owing to the DG set loading profile and secondarily to the fact that more components are used in the system, so it is more probable that a failure will occur.
It can also be inferred from Figure 10 that a substantial reduction in value can be achieved for a specific system configuration for the cases where prewarning functions (case ii) are fully operational, allowing for the switching over to a different engine in case of critical alarm activation. This implies that the implementation of advanced prognostic and diagnostic techniques will improve the investigated DEP system’s safety for the case where one DG set operates, as it will allow for a reliable fault prediction and a timely system reconfiguration. In addition, it can be deduced that the is sensitive to the DG sets’ operating profile, since a small increase in loading (3% of Maximum Continuous Rating (MCR) point power) for each specific configuration leads to a considerable increase (case iii). The inspection and maintenance intervals (case iv) seem to only slightly affect the as the maintenance and inspection of some critical components are already frequent and the influence of maintenance intervals can be investigated only for a number of the system components. The addition of intelligent diagnosis (case iv) for handling load sharing errors has a positive effect on in the cases where a greater number of DG sets than three operates. According to the derived operational profile, this is less frequent though, applicable to 25% of the operational time (Table 4). Finally, the preferential tripping function parameters have a direct impact on the similar to the DG sets’ loading profile; the less load is tripped, the higher the (case vi).
The derived results for the top failure rate estimation are presented in Table 6. The estimated frequency of blackout () in the general phase is higher than but relevantly close to the value of 0.1 events per ship-year, which was also reported in [66], and to the 0.85 events per ship-year estimated according to accident investigation reports, as shown in Table 6. However, in the harbour (ship at berth) phase, the is significantly higher than the in the general phase. This is due to the fact that the system often operates with a single DG set connected to the ship’s power network. In the manoeuvring phase, a number of DG sets operate at lower loads, which leads to a lower value. This is attributed to the fact that more DG sets operate in the manoeuvring phase as a safety precaution. In the sailing phase, due to the increased number of the operating DG sets, the is found to be approximately 0.003 events per ship-year and is much lower than the respective values for the other phases and the one reported by Friis-Hansen, Ravn and Engberg [66]. However, it must be noted that human error-induced blackouts, as well as blackouts caused by disconnection from the port network in the harbour phase, are not considered in the blackout frequency calculations. Furthermore, the estimation of 0.1 average events per ship-year refers to the cruise ships and passenger vessels fleet and does not consider the specific differences between the different cruise ships’ propulsion systems, which have an important influence on the FOB calculation as discussed above.
5.3. Phase 3 Importance Measures Estimation
The calculated values for the general (case study xii) and the sailing (case study xiv) operation phases are presented in Table 7. The is used to represent the most probable failure leading to a blackout; higher values denote a higher probability that these failures will lead to a blackout. The results for the harbour and the manoeuvring operation phases were similar to the results for the general operation phase. As it can be inferred from Table 7, the mechanical failures leading to the loss of one DG set have greater importance in the general operation phase than in the sailing phase. These include the failures in the cooling water and the lubricating oil systems as well as the engine failures leading to an erroneous/missing output. The blackout failure rate is adversely affected by errors in the control systems including the PMS command leading to (a) a running DG set stopping, (b) fuel quick closing valve faulty operation, (c) faulty DG set tripping by the safety systems and (d) erroneous sensor measurements of the engine bearing temperature. Failures leading to a DG set tripping without prewarning including failures in the control system hardware or shaft failures leading to a DG set stop were also identified as important. In the sailing phase, anomalies in the load sharing and control are of greater importance than in other phases. Such failures include erroneous DG set speed measurements, failures in fuel racks and failure in the propulsion motors fast load reduction. Fuel leakages and control hardware failures were also identified as important contributors to the increase.
As the metric can be used to identify the top event most probable cause, can be compared with available data from accident investigation reports and Protection and Indemnity (P&I) insurance club categories [31] by aggregating the values for the different failure categories leading to a blackout and analysing the overall contribution of each category . The comparison of the calculated parameters with other data sources is shown in Table 8. The derived results, in general, are in line with the results derived from accident investigation reports provided by a cruise ship operator as well as the results from a published P&I club study [31]. Differences in the estimated causal factor percentage in the various operating phases can be attributed to the fact that the importance of the mechanical failures changes from one operation phase to another as the mechanical failures are of greater importance when fewer DG sets operate.
According to this analysis’ results, the mechanical, electrical and control failures have a higher contribution to the value, whilst failures in the fuel system are found to contribute less to the value, in comparison to the respective contribution estimated according to the P&I results and the available accident investigation results. The observed deviations are justified by the fact that both the P&I club and accident investigation report results were derived based on blackout analyses from a number of ships with different functionalities and design redundancy level, which, as it was explained in Section 5.2, contributes to the system performance variation. In addition, often these reports do not capture the actual accident causes. In this respect, they can be used only for a high-level comparison with the calculated results of the present study.
The ten failures with the greater estimated values for the general (case study xii) and the sailing (case study xiv) operation phases, indicating their “structural” importance, are given in Table 9. The results for the harbour and the manoeuvring operation phases were similar to the results of the general operation phase. As it can be inferred from the general operation phase results, the blackout failure rate is sensitive to (a) failures in sensors used for the DG sets tripping in case of a short circuit, and (b) failures in the thrust bearings sensors due to multiple sensors employed. In the general phase, the blackout failure rate is also sensitive to failures leading to sudden tripping of DG sets without prewarning, such as failures in hardware used for DG set control, piston failures, and lubricating oil pressure and fresh water cooling system temperature sensor failures. In addition, the was found sensitive to short circuits and differential current failures due to the fact that: (a) a 3-phase Alternate Current electric system is used, and; (b) the occurrence of the short circuit leads to a DG set tripping without prewarning. For the sailing operation phase, the is sensitive to failures related to the system power reduction functions, such as failures in the DG set and the propulsion motor power sensors as well as failures in sensors and the actuator used for the power control in the DG sets. High sensitivity was identified with respect to design errors including overwhelming electrical transients in the system and DG set circuit breaker failures. The proper operation of the DG set circuit breaker is important to ensure the DG set tripping when a number of failures in the DG set occur, as otherwise, it will lead to prolonged DG set maintenance.
5.4. Safety Recommendations
Overall, the derived results indicate that the failures of the DG sets, failures without pre-warning alarms and the failures that can lead to the simultaneous loss of a number of DG sets are the most significant for the blackout failure rate. These findings indicate that the engine room redundancy required by Safe Return to Port regulations prevents a number of scenarios leading to blackout; however, it cannot address all the hazardous scenarios as explained below. Additionally, blackout prevention requires the reliable operation of the preferential tripping and the propulsion motors load reduction functions. On the other hand, failures of the propulsion motors (except for those related to the power reduction functions) and failures in the electrical power network seem to be of less importance for the in the investigated DEP systems.
Based on this analysis’ results for the investigated system, the following safety recommendations can be provided with respect to design and operation, which can also be taken into consideration for other ship power plants:
- Ship operation with one DG set should be avoided, as it results in considerably higher values.
- The propulsion motors fast electrical power reduction function, the power increase control function and the preferential tripping function should be thoroughly examined during the system design phase and extensively tested during the ship sea trials. These software supported system functions must also be thoroughly tested following software updates.
- Adequate redundancy in speed and voltage sensors should be provided or intelligent monitoring techniques should be employed to avoid failures in the electrical power control system leading to a load imbalance and a blackout.
- The condition of the DG sets’ fuel racks needs to be closely monitored by using advanced diagnosis and prognosis techniques.
- The tripping of DG sets due to sensor failures can be reduced by employing relevant fault tolerance techniques allowing the diagnosis and by-passing of relevant sensor failures.
- The tripping of DG sets due to failures in the control system hardware can be reduced by closer monitoring of the DG set components’ health; for example, by monitoring the generator’s electrical parameters (current, voltage, leakage currents, impedance changes) [67].
- The employed DG sets’ size, loading profile and overload limits should be carefully selected to avoid overload conditions in case of one or more DG sets tripping.
- The prevention of failures leading to the simultaneous loss of a number of DG sets, such as a fuel quick closing valve faulty operation, a fire in the engine room and clogged sea chests, should be ensured.
- Meticulous design and testing of the components/subsystems with multiplicities such as piston assemblies must be ensured for DG sets.
6. Conclusions
In this study, the CASA method was employed for the safety analysis of a DEP system. Through its application, the blackout failure rate and frequency for the cruise ship power plant were estimated for different operation phases and varying design parameters as well as different operating power demand profiles. Various case studies were investigated, including the addition of new functions and intelligent prewarning capability for the system components. This method provided quantification of the considered blackout event frequency (and probability) as well as criticality metrics, leading to the identification of the most contributing factors that impact the blackout events. Based on the derived results, relevant safety recommendations for the investigated cruise ship DEP system were derived.
It was found that the overall blackout frequency for the investigated cruise ship power plant was around 0.4 events per ship-year, whilst the blackout frequency was calculated as 0.003 events per ship-year in the sailing phase and 1.5 per ship-year in the harbour phase.
It was deduced that the DG set loading conditions and the number of DG sets connected to the ship’s electric network have a significant influence on the blackout failure rate, and therefore the blackout frequency can be reduced by controlling them.
The reliable operation of the PMS fast electrical load reduction, the prewarning and reconfiguration functions was found to be crucial for avoiding blackout events.
In cases where a number of DG sets operate, failures in the components used for the electrical power generation control, such as the DG sets’ fuel racks, the electric power sensors or/and the propulsion motors load reduction functions, become more important. The mechanical component failures, such as lubrication oil or cooling water system failures, become more important in cases where a small number of DG sets operate. Failures leading to the simultaneous loss of multiple DG sets are also important from a blackout perspective, in cases where a smaller DG set number operates.
In summary, this study demonstrated that the employed method allowed the assessment of the impact of different parameters on the overall system’s undesired event failure rate overcoming the STPA limitations. It is also expected that the results of this analysis will support the design of safer DEP systems. Future work could focus on the estimation of additional safety metrics for the investigated DEP system, such as blackout duration, partial blackout probability, and blackout risk, as well as on developing intelligent diagnosis techniques for the DEP system.
Supplementary Materials
The following are available online at https://0-www-mdpi-com.brum.beds.ac.uk/article/10.3390/safety7020038/s1.
Author Contributions
Conceptualization, V.B. and G.T.; methodology development, V.B., G.T., E.B., G.P., R.H.; system analysis, V.B.; resources, V.B., G.T.; writing—original draft preparation, V.B.; writing—review and editing, V.B., G.T., E.B., G.P., R.H.; supervision, G.T., E.B., G.P., R.H. All authors have read and agreed to the published version of the manuscript.
Funding
Part of the research has been founded by the “NEXUS—Towards Game-changer Service Operation Vessels for Offshore Windfarms” project that was funded from the European Union’s Horizon 2020 research and innovation action under grant agreement N°774519.
Acknowledgments
The authors are grateful to R. Puisa and S. Williams from the Maritime Safety Research Centre (MSRC) at the University of Strathclyde, to P. C Sames from DNV AS, K. Douglas from RCCL and an anonymous cruise ship operator for their valuable comments and support. The authors affiliated with the MSRC greatly acknowledge the funding from DNV AS and RCCL for the MSRC establishment and operation. The opinions expressed herein are those of the authors and should not be construed to reflect the views of DNV AS, RCCL, EU or the acknowledged individuals and their associated organisations.
Conflicts of Interest
The authors declare no conflict of interest.
Abbreviations/Scripts
| AC | Air conditioning motors |
| AIR | Accident Investigation Reports |
| AVR | Automatic Voltage Regulator |
| BT | Bow thruster motors |
| CPS | Cyber-Physical System |
| DG or D/G | Diesel Generator |
| DEP | Diesel–Electric Propulsion |
| ESI | Events Sequence Identification |
| ETA | Event Tree Analysis |
| FMEA | Failure Modes and Effects Analysis |
| FTA | Fault Tree Analysis |
| MCR | Maximum Continuous Rating |
| P&I | Protection and Indemnity Insurance Club |
| PHA | Preliminary Hazard Analysis |
| PM | Propulsion motors |
| PMS | Power Management System |
| STPA | System-Theoretic Process Analysis |
| UCA | Unsafe Control Action |
Nomenclature
| Basic event in Fault Tree | |
| Blackout frequency | |
| Birnbaum’s importance measure (-) | |
| Fussell–Vesely importance measure (-) | |
| time system is working in specific operation phase (%) | |
| time system is working in a specific configuration (%) | |
| Operational time (hours) | |
| Probability of failure for operating component | |
| Probability of failure of safety system | |
| Probability of specific system states | |
| The probability of failure on demand (-) | |
| Pearson correlation coefficient | |
| Number of identical components | |
| Inspection or maintenance interval (hours) | |
| is critical value of a normal distribution with zero mean value, standard deviation equal to one for (1-) confidence interval (-) | |
| Subscripts | |
| Component | |
| j | Basic event in Fault Tree |
| Specific system configuration | |
| Operation phase | |
| Greek symbols | |
| Weibull shape factor (-) | |
| blackout failure rate (hours−1) | |
| Failure rate for component (hours−1) | |
| The overall top event failure rate | |
| Repair rate for component (hours−1) | |
| Standard deviation |
References
- Geertsma, R.; Negenborn, R.; Visser, K.; Hopman, J. Design and control of hybrid power and propulsion systems for smart ships: A review of developments. Appl. Energy 2017, 194, 30–54. [Google Scholar] [CrossRef]
- Ådnanes, A.K. Maritime Electrical Installations and Diesel Electric Propulsion; ABB: Oslo, Norway, 2003; p. 86. [Google Scholar]
- Stefani, A. An Introduction to Ship Automation and Control Systems; Institute of Marine Engineering, Science & Technology: London, UK, 2013. [Google Scholar]
- Nilsen, O.V.; Johansen, C.B.; Knight, M.; Hoffman, P.; Skjong, R. FSA for Cruise Ships—Task 4.1.1-Hazard Identification; SAFEDOR-4.1.1 2005-12-31 DNV rev. 1; Det Norske Veritas: Høvik, Norway, 2005. [Google Scholar]
- Cruise Lines International Association (CLIA). 2017 Cruise Industry Outlook; CLIA: Washington, DC, USA, 2016. [Google Scholar]
- IMO. Interim Expalanatory Notes for the Assessment of Passenger Ship Systems’ Capabilities after a Fire or Flooding Casuality; MSC/1Circ.1369; IMO: London, UK, 2010. [Google Scholar]
- Bø, T.I.; Johansen, T.A.; Sørensen, A.J.; Mathiesen, E. Dynamic consequence analysis of marine electric power plant in dynamic positioning. Appl. Ocean Res. 2016, 57, 30–39. [Google Scholar] [CrossRef]
- Reddy, B.D.; Lingeshwaren, S.; Chai, M.; Babu, Y.D.; Chuhan, P.J.; Kamala, S.R.; Panda, S.K.; Wu, D.; Chen, X.Q.; Die, W.; et al. Investigations on LVAC architectures of diesel electric propulsion based marine vessels for improved power quality and reliability. In Proceedings of the IEEE 8th International Power Electronics and Motion Control Conference (IPEMC-ECCE Asia), Hefei, China, 22–26 May 2016; pp. 2854–2858. [Google Scholar]
- Chang, D.; Rhee, T.; Nam, K.; Chang, K.; Lee, D.; Jeong, S. A study on availability and safety of new propulsion systems for LNG carriers. Reliab. Eng. Syst. Saf. 2008, 93, 1877–1885. [Google Scholar] [CrossRef]
- Chai, M.; Reddy, B.D.; Sobrayen, L.; Panda, S.K.; Die, W.; Xiaoqing, C. Improvement in efficiency and reliability for diesel- electric propulsion based marine vessels using genetic algorithm. In Proceedings of the 2016 IEEE Transportation Electrification Conference and Expo, Asia-Pacific (ITEC Asia-Pacific), Busan, Korea, 1–4 June 2016; pp. 180–184. [Google Scholar]
- Kumar, A.; Ram, M. Performance of marine power plant given generator, main and distribution switchboard failures. J. Mar. Sci. Appl. 2015, 14, 450–458. [Google Scholar] [CrossRef]
- Dubey, A.; Santoso, S.; Arapostathis, A. Reliability analysis of three-dimensional shipboard electrical power distribution systems. In Proceedings of the 2015 IEEE Electric Ship Technologies Symposium (ESTS), Old Town Alexandria, VA, USA, 21–24 June 2015; pp. 93–98. [Google Scholar]
- Santoso, S.; Arapostathis, A.; Abdelwahed, S.; Amgai, R.; Cartes, D.; Soman, R.; Vu, T.; Stevens, B.; Shi, J. Improving Reliability of MVDC Ship Power System; Office of Naval Research: Arlington, VA, USA, 2015. [Google Scholar]
- Jeong, B.; Oguz, E.; Wang, H.; Zhou, P. Multi-criteria decision-making for marine propulsion: Hybrid, diesel electric and diesel mechanical systems from cost-environment-risk perspectives. Appl. Energy 2018, 230, 1065–1081. [Google Scholar] [CrossRef] [Green Version]
- Vedachalam, N.; Ramadass, G. Reliability assessment of multi-megawatt capacity offshore dynamic positioning systems. Appl. Ocean Res. 2017, 63, 251–261. [Google Scholar] [CrossRef]
- Kumar, A.; Yadav, S.P.; Kumar, S. Fuzzy reliability of a marine power plant using interval valued vague sets. Int. J. Appl. Sci. Eng. 2006, 4, 71–82. [Google Scholar]
- Volkanovski, A.; Čepin, M.; Mavko, B. Application of the fault tree analysis for assessment of power system reliability. Reliab. Eng. Syst. Saf. 2009, 94, 1116–1127. [Google Scholar] [CrossRef]
- Menis, R.; Da Rin, A.; Vicenzutti, A.; Sulligoi, G. Dependable design of all electric ships integrated power system: Guidelines for system decomposition and analysis. In Proceedings of the 2012 Electrical Systems for Aircraft, Railway and Ship Propulsion, Bologna, Italy, 16–18 October 2012; pp. 1–6. [Google Scholar]
- Papadopoulos, Y.; McDermid, J. Hierarchically performed hazard origin and propagation studies. In Proceedings of the 18th International Conference on Computer Safety, Reliability and Security (SAFECOMP’99), Toulouse, France, 27–29 September 1999; pp. 139–152. [Google Scholar]
- Roskilly, T. INOMANS2HIP. Final Publishable Report; European Comission: Brussels, Belgium, 2016. [Google Scholar]
- Rokseth, B.; Utne, I.B.; Vinnem, J.E. A systems approach to risk analysis of maritime operations. Proc. Inst. Mech. Eng. Part O J. Risk Reliab. 2017, 231, 53–68. [Google Scholar] [CrossRef]
- Rokseth, B.; Utne, I.B.; Vinnem, J.E. Deriving verification objectives and scenarios for maritime systems using the systems-theoretic process analysis. Reliab. Eng. Syst. Saf. 2018, 169, 18–31. [Google Scholar] [CrossRef]
- Bolbot, V.; Theotokatos, G.; Boulougouris, E.; Vassalos, D. Comparison of diesel-electric with hybrid-electric propulsion system safety using system-theoretic process analysis. In Proceedings of the Propulsion and Power Alternatives, London, UK, 22–23 January 2009; pp. 55–61. [Google Scholar]
- Bolbot, V.; Puisa, R.; Theotokatos, G.; Boulougouris, E.; Vassalos, D. A comparative safety assessment for DC and DC with hybrid power systems in a windfarm SOV using STPA. In Proceedings of the 7th European STAMP Workshop & Conference, Helsinki, Finland, 18–20 September 2019. [Google Scholar]
- Bolbot, V.; Trivyza, N.L.; Theotokatos, G.; Boulougouris, E.; Rentizelas, A.; Vassalos, D. Cruise ships power plant optimisation and comparative analysis. Energy 2020, 196, 117061. [Google Scholar] [CrossRef]
- Aziz, A.; Ahmed, S.; Khan, F.; Stack, C.; Lind, A. Operational risk assessment model for marine vessels. Reliab. Eng. Syst. Saf. 2019, 185, 348–361. [Google Scholar] [CrossRef]
- Pico, H.N.V.; Aliprantis, D.C.; Sudhoff, S.D. Reachability analysis of shipboard power systems with uncertain pulsed loads. In Proceedings of the 2015 IEEE Electric Ship Technologies Symposium (ESTS), Old Town Alexandria, VA, USA, 21–24 June 2015; pp. 395–402. [Google Scholar]
- Bolvashenkov, I.; Kammermann, J.; Herzog, H.-G.; Frenkel, I. Operational availability and performance analysis of the multi-drive multi-motor electric propulsion system of an icebreaker gas tanker for arctic. In Proceedings of the 14th International Conference on Ecological Vehicles and Renewable Energies (EVER), Monte-Carlo, Monaco, 8–10 May 2019; pp. 1–6. [Google Scholar]
- DNV GL. Technology Outlook 2025; DNV GL: Hovik, Norway, 2015. [Google Scholar]
- Bolbot, V.; Theotokatos, G.; Bujorianu, L.M.; Boulougouris, E.; Vassalos, D. Vulnerabilities and safety assurance methods in Cyber-Physical Systems: A comprehensive review. Reliab. Eng. Syst. Saf. 2019, 182, 179–193. [Google Scholar] [CrossRef] [Green Version]
- UK P&I CLUB. Risk Focus: Loss of Power; UK P&I CLUB: London, UK, 2015. [Google Scholar]
- Finnish Safety Investigation Authority. Power Failures on Ships; The Finnish Transport Safety Agency: Helsinki, Finland, 2017. [Google Scholar]
- Bolbot, V.; Theotokatos, G.; Boulougouris, E.; Psarros, G.; Hamann, R. A novel method for safety analysis of cyber-physical systems—Application to a ship exhaust gas scrubber system. Safety 2020, 6, 26. [Google Scholar] [CrossRef]
- Bolbot, V.; Theotokatos, G.; Vassalos, D. Using system-theoretic process analysis and event tree analysis for creation of a fault tree of blackout in the Diesel-Electric Propulsion system of a cruise ship. In Proceedings of the 13th International Marine Design Conference XIII, Helsinki, Finland, 10–14 June 2018; pp. 691–699. [Google Scholar]
- Leveson, N. Engineering a Safer World: Systems Thinking Applied to Safety; MIT Press: London, England, 2011; p. 560. [Google Scholar]
- Wang, J.; Yang, J.; Sen, P.; Ruxton, T. Safety based design and maintenance optimisation of large marine engineering systems. Appl. Ocean Res. 1996, 18, 13–27. [Google Scholar] [CrossRef]
- Psarros, G.A.; Vassalos, D. Risk analysis of bulk carriers. Ships Offshore Struct. 2010, 5, 199–209. [Google Scholar] [CrossRef]
- Kongsberg. Power Management System. Available online: https://www.km.kongsberg.com/ks/web/nokbg0397.nsf/AllWeb/B759133464F70B12C1256DEB0039EBCD/$file/AD-00447B_PMS_datasheet.pdf?OpenElement (accessed on 1 June 2017).
- Radan, D. Integrated Control of Marine Electrical Power Systems. Ph.D. Thesis, Norwegian University of Science and Technology, Trondheim, Norway, 2008. [Google Scholar]
- MAN. Diesel-Electric Propulsion Plants; MAN: Augsburg, Germany, 2012. [Google Scholar]
- Krogseth, I.B. Dynamic Fault-Detection in Shipboard Electric Load Sharing; Norwegian University of Science and Technology: Trondheim, Norway, 2013. [Google Scholar]
- Meyle. Arc Detection System. Available online: http://www.meyle.com.cn/pdf/arc-detection-systems.pdf (accessed on 1 September 2017).
- Sfakianakis, K.; Vassalos, D. Design for safety and energy efficiency of the electrical onboard energy systems. In Proceedings of the IEEE Electric Ship Technologies Symposium (ESTS), Washington, DC, USA, 21–24 June 2015; pp. 150–155. [Google Scholar]
- DNV GL. Rules for Classification. Part 4. Systems and Components. Chapter 3. Rotating Machinery-Drivers; DNV GL: Baerum, Norway, 2017. [Google Scholar]
- Schüller, J.; Brinkman, J.; Van Gestel, P.J.; Van Otterloo, R. Methods for Determining and Processing Probabilities: Red Book; Committee for the Prevention of Disasters: The Hague, The Netherlands, 1997. [Google Scholar]
- Allal, A.A.; Mansouri, K.; Youssfi, M.; Qbadu, M. Toward a reliable sea water central cooling system for a safe operation of autonomous ship. In Proceedings of the International Conference on Recent Innovation in Engineering and Technology, Berlin, Germany, 15–16 February 2017; p. 10. [Google Scholar]
- Mennis, E.; Platis, A. Availability assessment of diesel generator system of a Ship: A case study. Int. J. Perform. Eng. 2013, 9, 561–567. [Google Scholar]
- OREDA. Offshore Reliability Data Handbook, 6th ed.; OREDA Participants: Viken, Norway, 2015. [Google Scholar]
- OREDA. Offshore Reliability Data Handbook, 5th ed.; OREDA Participants: Viken, Norway, 2009. [Google Scholar]
- OREDA. Offshore Reliability Data Handbook, 4th ed.; OREDA Participants: Viken, Norway, 2002. [Google Scholar]
- SINTEF. Reliability Data for Safety Instrumented Systems. PDS Data Handbook; SINTEF: Trondheim, Norway, 2006; p. 85. [Google Scholar]
- Aldemir, T.; Stovsky, M.; Kirschenbaum, J.; Mandelli, D.; Bucci, P.; Mangan, L.; Miller, D.; Sun, X.; Ekici, E.; Guarro, S. Dynamic Reliability Modeling of Digital Instrumentation and Control Systems for Nuclear Reactor Probabilistic Risk Assessments; US Nuclear Regulatory Commission: Washington, DC, USA, 2007.
- Denson, W.; Chandler, G.; Crowell, W.; Clark, A.; Jaworski, P. Nonelectronic Parts Reliability Data 1995; Defense Technical Information Centre: Fort Belvoir, VA, USA, 1994. [Google Scholar]
- Karakitsos, I.; Theotokatos, G. Modelling of diesel electric propulsion. In Proceedings of the Energy Efficient Ships, London, UK, 23–24 November 2016. [Google Scholar]
- MAIB. Report on the Investigation of the Catastrophic Failure of a Capacitor in the Aft Harmonic Filter Room on Board RMS Queen Mary 2 While Approaching Barcelona 23 September 2010; MAIB: Southampton, UK, 2011.
- Puisa, R.; Williams, S.; Vassalos, D. Towards an explanation of why onboard fires happen: The case of an engine room fire on the cruise ship “Le Boreal”. Appl. Ocean Res. 2019, 88, 223–232. [Google Scholar] [CrossRef]
- Karolius, K.B.; Cichowicz, J.; Vassalos, D. Risk-based, sensor-fused detection of flooding casualties for emergency response. Ships Offshore Struct. 2020, 10, 1–30. [Google Scholar] [CrossRef]
- Abdulkhaleq, A.; Wagner, S. XSTAMPP 2.0: New improvements to XSTAMPP Including CAST accident analysis and an extended approach to STPA. In Proceedings of the 5th STAMP Workshop, Cambridge, MA, USA, 21–24 March 2016. [Google Scholar]
- Li, Y.-H.; Shao, W.-Z.; Zhang, J. Fuzzy grey fault tree analysis on diesel engine reliability. In Proceedings of the 7th International Conference on Fuzzy Systems and Knowledge Discovery, Yantai, China, 10–12 August 2010; pp. 1263–1267. [Google Scholar]
- Arcidiacono, G.; Campatelli, G. Reliability improvement of a diesel engine using the FMETA approach. Qual. Reliab. Eng. Int. 2004, 20, 143–154. [Google Scholar] [CrossRef]
- Chybowski, L. Auxiliary Installations’ Fault Tree Model for Operation Analysis of Vessel’s Power Plant Unit; Балттехмаш-2002; KGTU: Kaliningrad, Russia, 2002; pp. 299–301. [Google Scholar]
- Laskowski, R. Fault Tree analysis as a tool for modelling the marine main engine reliability structure. Zesz. Nauk. Akad. Mor. Szczec. 2015, 41, 71–77. [Google Scholar]
- Rasoulzadeh Khorasani, V. Risk assessment of diesel engine failure in a dynamic positioning system. Master’s Thesis, University of Stavanger, Stavanger, Norway, 2015. [Google Scholar]
- Garyfallos, I. Reliability and Criticality Assesssment of Four-Stroke Dual-Fuel Engine. Master’s Thesis, The University of Strathclyde, Glasgow, Scotland, 2016. [Google Scholar]
- Lazakis, I.; Raptodimos, Y.; Varelas, T. Predicting ship machinery system condition through analytical reliability tools and artificial neural networks. Ocean Eng. 2018, 152, 404–415. [Google Scholar] [CrossRef] [Green Version]
- Friis-Hansen, P.; Ravn, E.; Engberg, P. Basic Modelling Principles for Prediction of Collision and Grounding Frequencies; IWRAP Mark II Working Document; Technical University of Denmark: Copenhagen, Denmark, 2008; pp. 1–59. [Google Scholar]
- Vichare, N.; Pecht, M. Prognostics and health management of electronics. IEEE Trans. Components Packag. Technol. 2006, 29, 222–229. [Google Scholar] [CrossRef]
Figure 1.
Description of the reference cruise ship DEP plant architecture.

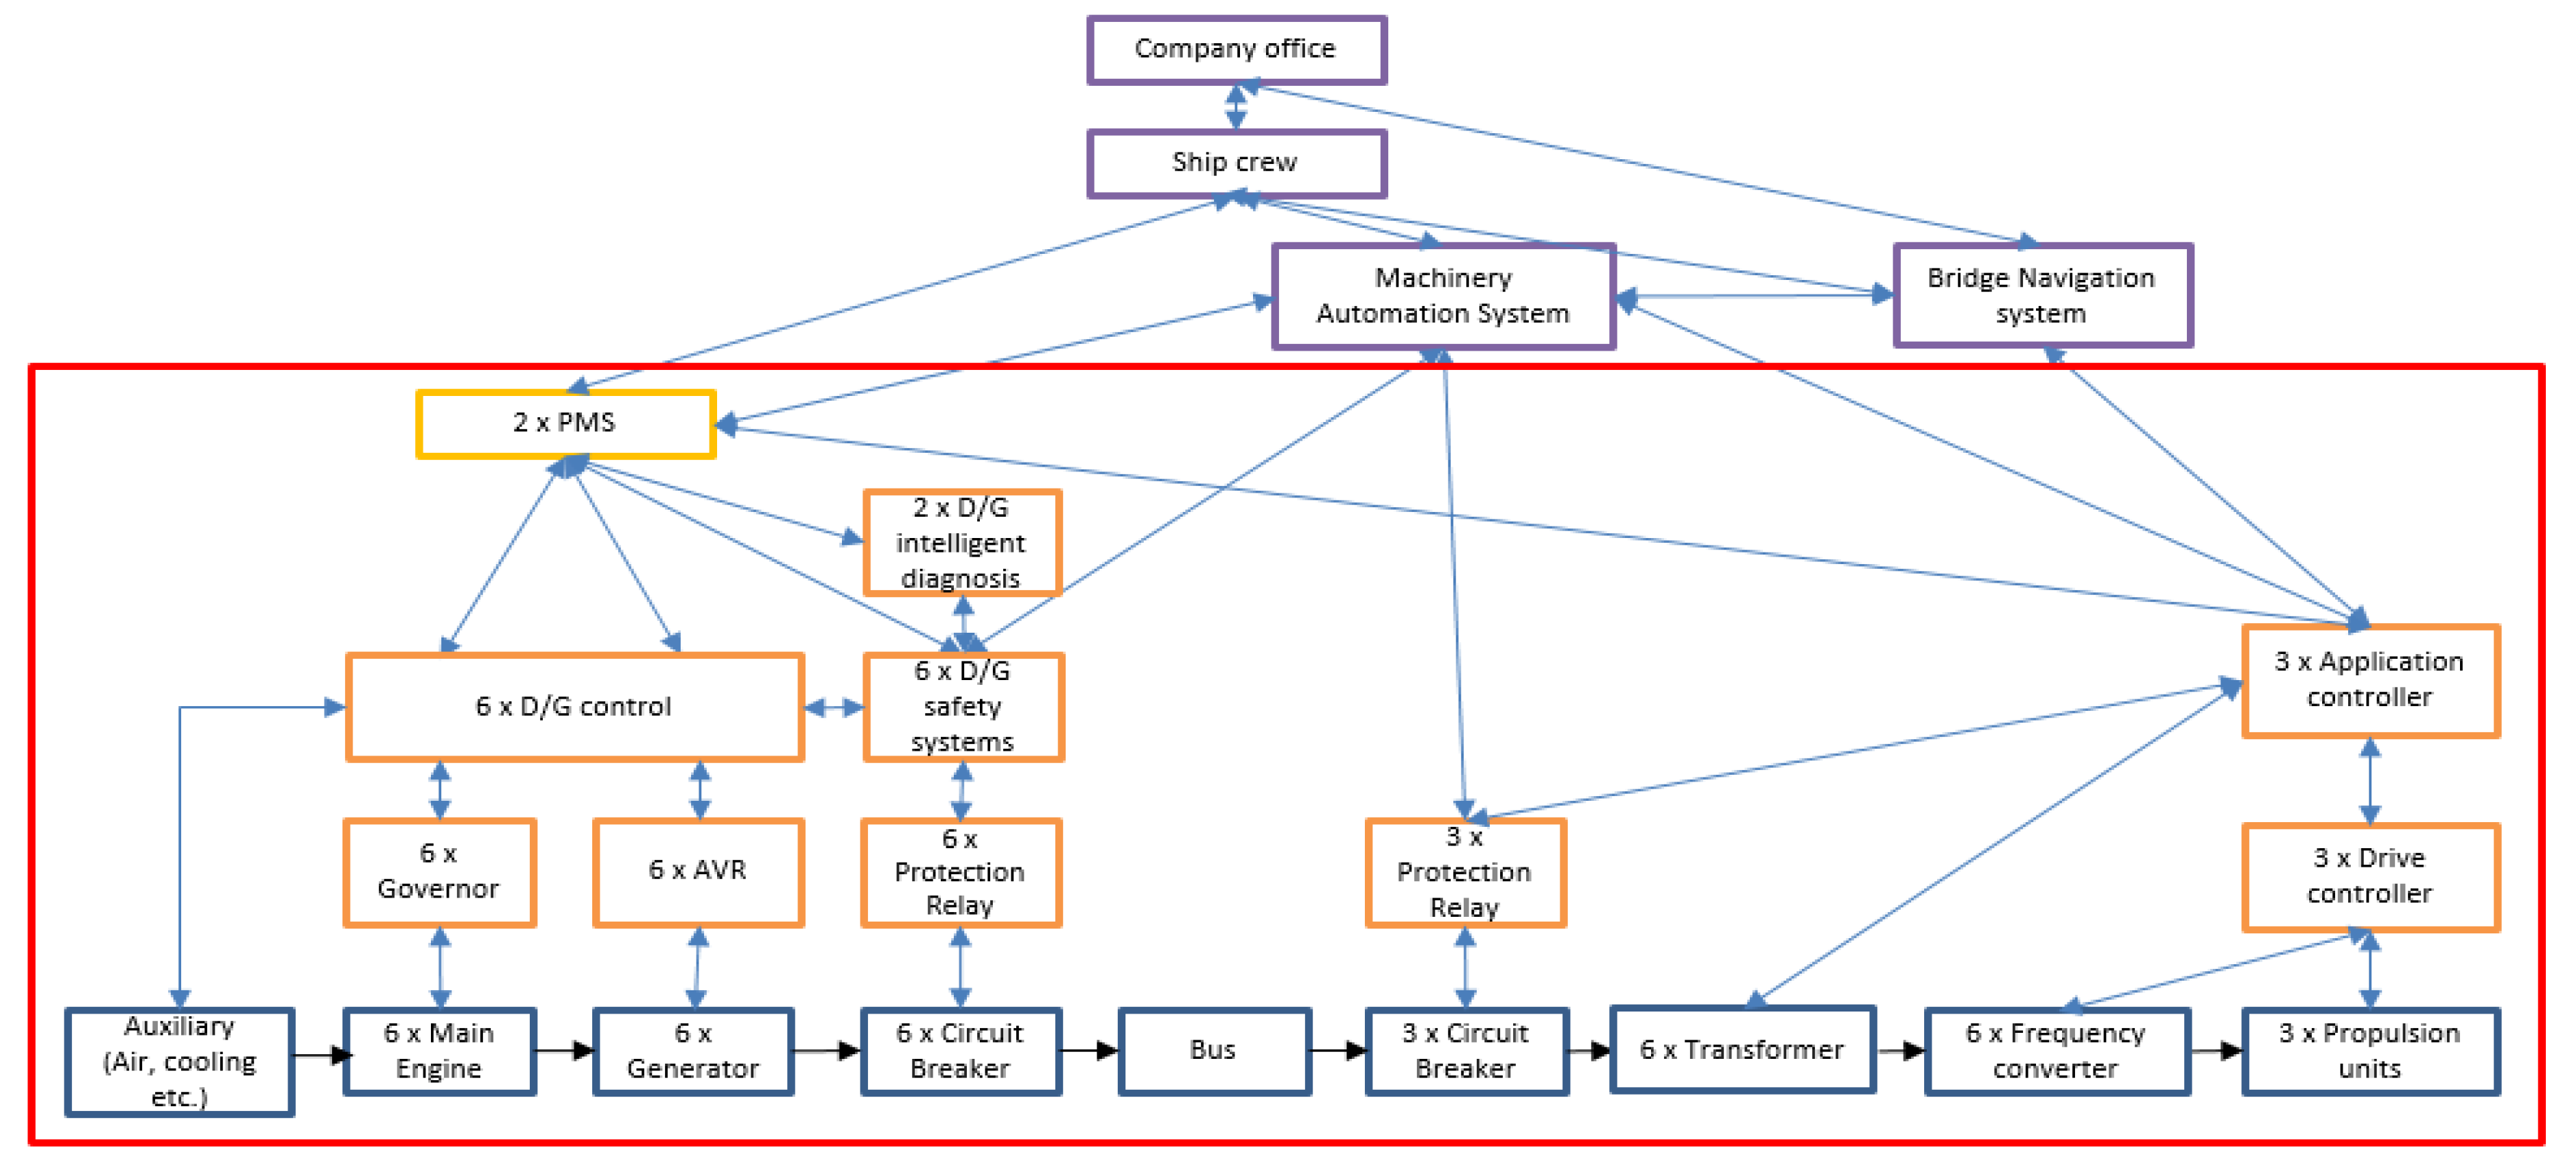
Figure 2.
Cruise ship power plant network control structure (red box is used to depict the boundaries of the investigated system).
Figure 2.
Cruise ship power plant network control structure (red box is used to depict the boundaries of the investigated system).

Figure 3.
Methodology flowchart.
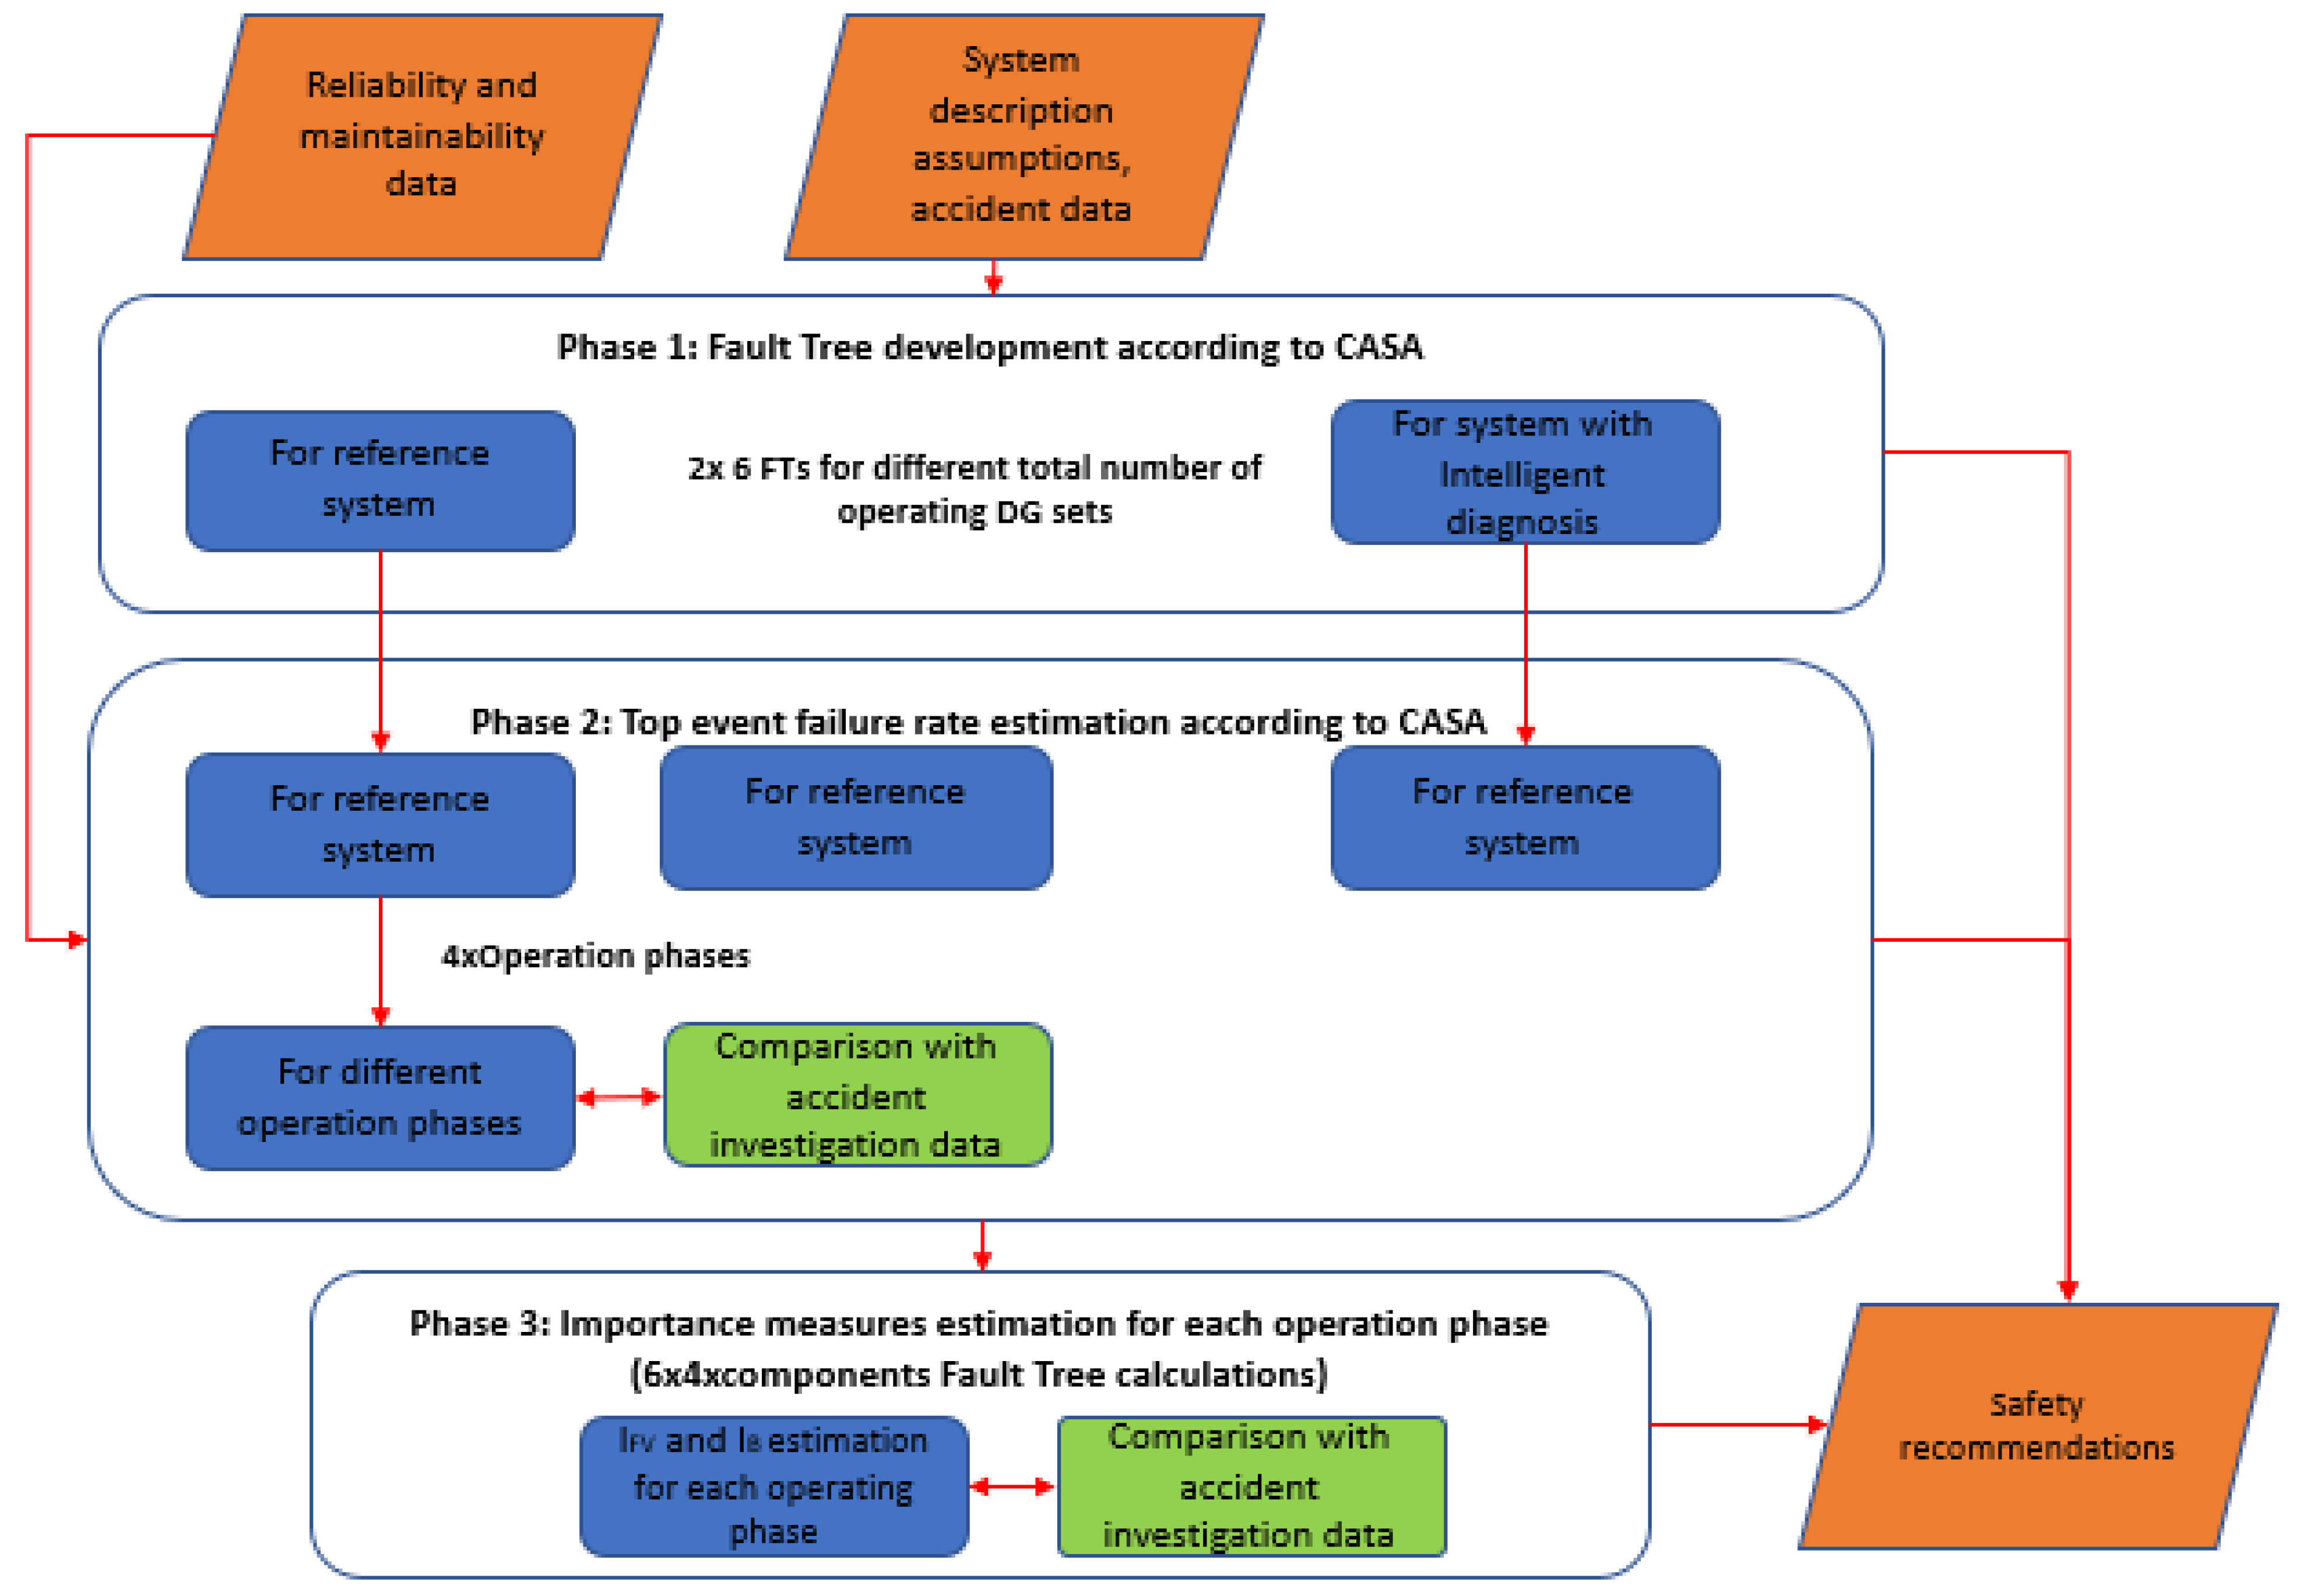
Figure 4.
Developed DEP system control structure; (a) Analysed system overall control structure; (b) Refined engine governor control structure.
Figure 4.
Developed DEP system control structure; (a) Analysed system overall control structure; (b) Refined engine governor control structure.

Figure 5.
Distribution of causal factors.

Figure 6.
ESI’s “Event Tree” for first (H-1) and third (H-3) sub hazards.

Figure 7.
Result of synthesis of Event Trees.

Figure 8.
An extract from the refined Fault Tree.
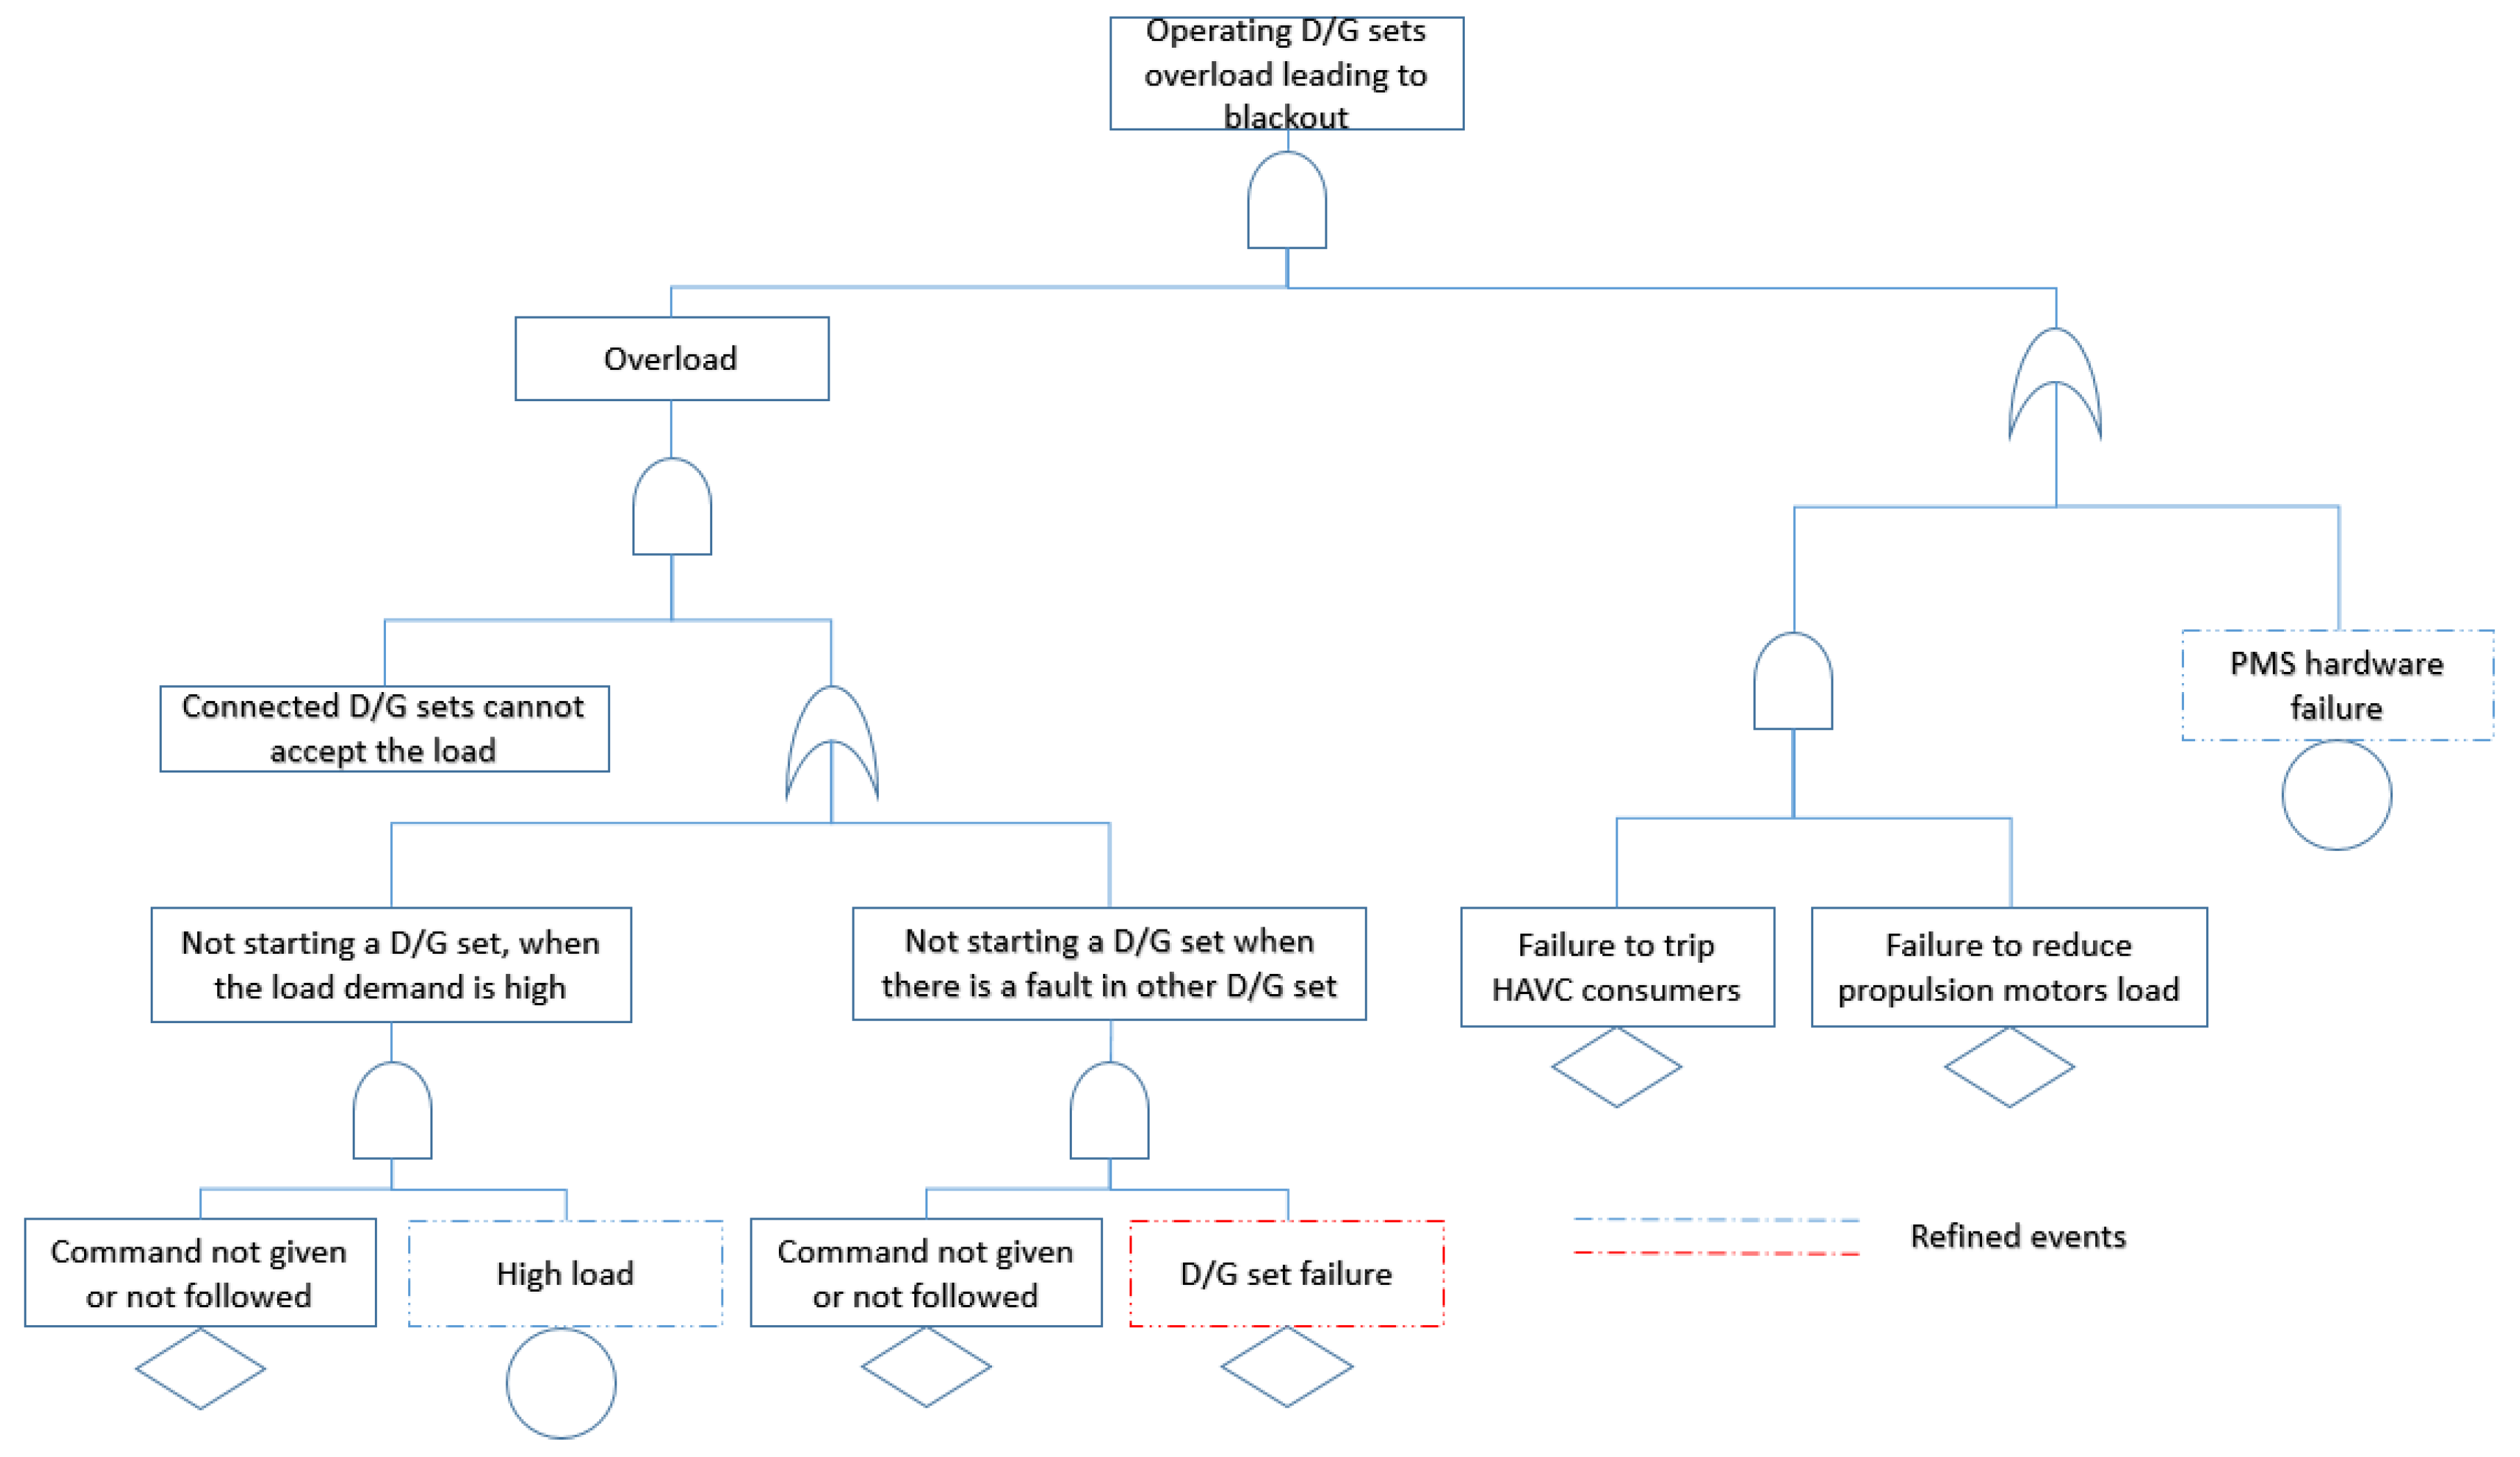
Figure 9.
Fault Tree showing the main engine failures leading engine to shut down.
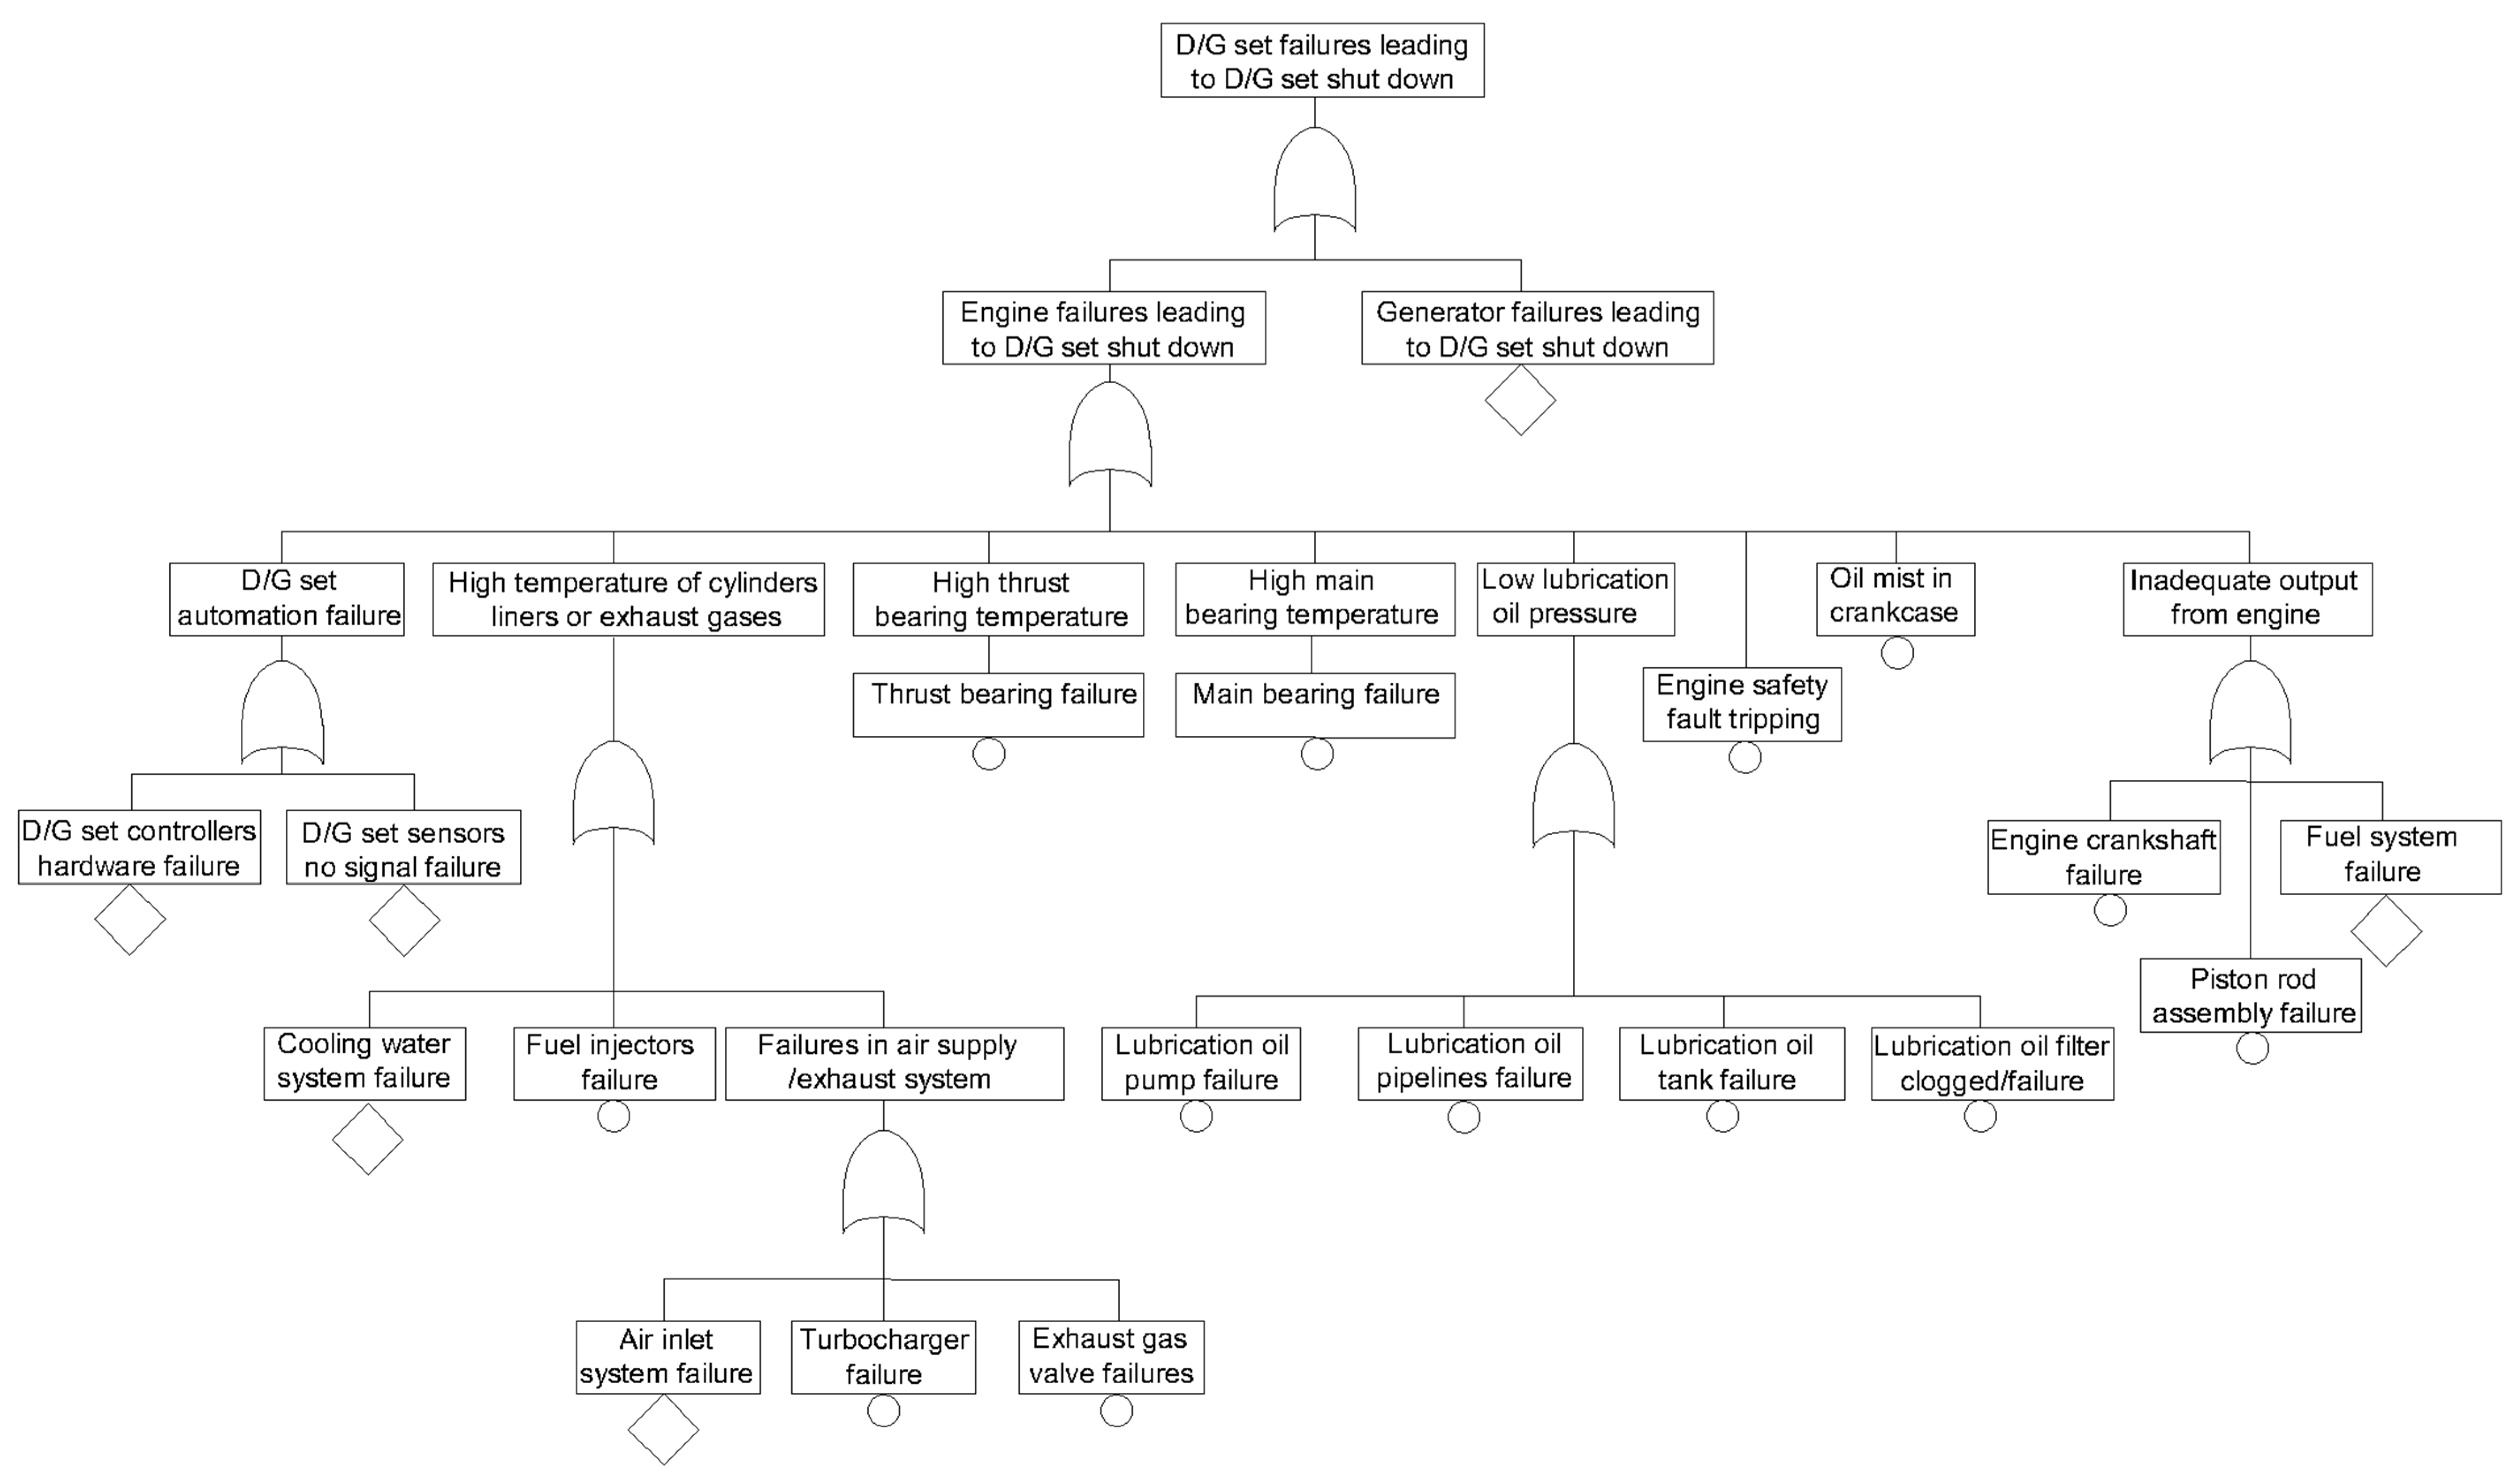
Figure 10.
Blackout failure rate ( for different total number of DG sets operating (a) 1–6 totally DG sets operating; (b) 2–6 totally DG sets operating (to be noted that the failure rate is much higher for 1 operating DG set).
Figure 10.
Blackout failure rate ( for different total number of DG sets operating (a) 1–6 totally DG sets operating; (b) 2–6 totally DG sets operating (to be noted that the failure rate is much higher for 1 operating DG set).

Table 1.
Used cruise ship propulsion system design parameters.
| Design Feature | Design Parameters | |
|---|---|---|
| Generic | Network architecture | Ring |
| Current type | Alternate Current | |
| Type of DG sets speed control | Droop | |
| Power plant component number | Diesel Generator (DG) sets | As per investigated system |
| Azipods propulsion motors | 3 | |
| Transformers per propulsion motor | 2 | |
| Switchboards | 3 | |
| Air Conditioning system compressor motors | 5 | |
| Bow thrusters | 4 | |
| Circuit breakers per DG set and consumers | 1 | |
| Bus-Tie Breakers | 6 (2 per connection) | |
| Power Management System (PMS) | 2 | |
| Component number for DG sets and propulsion motors | DG set controller, Automatic Voltage Regulator (AVR), Fuel governor per DG set | 1 |
| Speed sensors per DG set for speed control | 2 | |
| AVR sensors per DG set for voltage control | 1 | |
| Application controller per propulsion motor | 1 | |
| Drive controller per propulsion motor | 1 | |
| Azipods, Bow-thrusters and DG sets maximum loads | Maximum Continuous Rating (MCR) of DG sets | As per investigated system |
| Azipods propulsion motors maximum load | 14 MW | |
| Bow thrusters maximum load | 3 MW | |
| Maximum electrical load that can be tripped to avoid the operating DG set overload | 3 MW | |
| Maximum DG set overload limit [44] | 110% of MCR | |
| Maximum Step Load [39] | 33% of MCR |
Table 2.
Case studies’ details.
| Implemented Calculations | Case Study Number | Operation Phase/Comments | Details |
|---|---|---|---|
| Top event failure rate ()/Frequency ()/Undesired event failure rate in specific configuration () estimation | i. | General/Undesired event failure rate estimation with different total DG set number operating | No prewarning alarms effective |
| ii. | Full prewarning alarm effectiveness | ||
| iii. | 3% Maximum Continuous Rating (MCR) increase to the operating DG sets’ loading profile | ||
| iv. | 10% more frequent maintenance | ||
| v. | Intelligent diagnosis added to the system | ||
| vi. | 50% reduced tripped load (load of air conditioning compressor motors) | ||
| vii. | Reference system design | ||
| viii. | General | Top event failure rate /Frequency estimation | |
| ix. | Harbour | ||
| x. | Sailing | ||
| xi. | Manoeuvring | ||
| Importance analysis | xii. | General | Estimation of and metrics |
| xiii. | Harbour | ||
| xiv. | Sailing | ||
| xv. | Manoeuvring | ||
| xvi. | Harbour | ||
| xvii. | Sailing | ||
| xviii. | Manoeuvring |
Table 3.
Additional equations.
| Other components with preventative maintenance | (3) | ||
| Operating components | Parts with preventive maintenance where a single component failure out of identical will lead to event occurrence (based on [45]) | (4) | |
| Parts with preventive maintenance where all the identical components must fail for event occurrence (based on [45]) | (5) | ||
| Safety systems | Unavailability due to periodical maintenance of standby equipment where standby equipment are involved (based on [45]) | (6) |
Table 4.
Operational profile for the investigated cruise ship.
| a/a | Operation Phase | No. of Simultaneously Operating DG Sets | No. of Electric Power Consumers Engaged | |||||||
|---|---|---|---|---|---|---|---|---|---|---|
| 1 | 2 | 3 | 4 | 5 | 6 | |||||
| Operational Time | PM | BT | ||||||||
| 1 | General (aggregated) | 21% | 19% | 35% | 22% | 2% | 1% | 100% | 3 | 1 |
| 2 | Harbour | 74% | 22% | 4% | 0% | 0% | 0% | 28% | 0 | 0 |
| 3 | Sailing | 0% | 17% | 48% | 31% | 3% | 1% | 69% | 3 | 0 |
| 4 | Manoeuvring | 17% | 41% | 39% | 3% | 0% | 0% | 3% | 2 | 1 |
Table 5.
The identified list of sub hazards, safety constraints and existing safety measures for the investigated system.
Table 5.
The identified list of sub hazards, safety constraints and existing safety measures for the investigated system.
| a/a | Sub Hazards | Safety Constraints | Existing Safety Measures |
|---|---|---|---|
| H-1 | Unavailability of DG sets | DG sets must be always available to be connected when requested by the system | Redundancy in DG sets |
| H-2 | Imbalanced power generation | The system must always avoid imbalance in power generation | Intelligent generator diagnosis system by tripping a faulty DG set |
| H-3 | Operating DG set overload | The system must always avoid operating at conditions with overload | Fast electrical load reduction, DG set size selection |
| H-4 | Electrical load transients in the network | The system must be resilient to the presence of the transients in the network and prevent their existence in the system | Tripping function settings proper selection, design parameters of DG sets, control over propulsion motors during the start |
| H-5 | Electrical disturbances such as short circuits | The system must prevent the occurrence of short circuits and not allow the short circuit and arc fault to be uncontrolled | Protection relays, arc detection systems |
Table 6.
Comparison of in different operation phases.
| Operation Phases | ||
|---|---|---|
| General (100%) (case study viii) | 4.515 × 10⁻⁵ | 0.3955 |
| Harbour (ship at berth) (28%) (case study ix) | 1.691 × 10⁻⁴ | 1.481 |
| Sailing (69%) (case study x) | 3.225 × 10⁻⁷ | 0.003 |
| Manoeuvring (3%) (case study xi) | 3.646 × 10⁻⁵ | 0.319 |
| Friis-Hansen et al. [66] (Sailing) | 1.141 × 10⁻⁵ | 0.1 |
| Accident investigation reports (General) | 9.704 × 10⁻⁵ | 0.850 |
Table 7.
Top critical failures in the investigated system.
| Failures | ||
|---|---|---|
| General phase | Lubricating oil pump failure | 0.136 |
| High-temperature water cooling pump failure | 0.086 | |
| Low-temperature water cooling pump failure | 0.086 | |
| Shaft failure leading to engine stop | 0.054 | |
| Thrust bearings temperature sensors failure | 0.052 | |
| AVR hardware system failure leading to the DG set tripping | 0.051 | |
| Fuel quick closing valve faulty operation | 0.046 | |
| Generator safety faulty tripping the DG set | 0.046 | |
| Engine safety faulty tripping the DG set | 0.046 | |
| Failure in automation system—PMS stopping DG set without other set allocation | 0.046 | |
| Sailing phase | DG set fuel racks failure | 0.540 |
| Failure to reduce the propulsion motors load by the PMS | 0.219 | |
| Failure to reduce the propulsion motors load in time by PMS | 0.219 | |
| Failure to reduce the propulsion motors load by application controller | 0.219 | |
| Failure to reduce the propulsion motors load in time by application controller | 0.219 | |
| Governor speed sensors erroneous measurement | 0.133 | |
| Leakages in fuel pipes | 0.085 | |
| Load (current and voltage) sensors on azipods propulsion motors failure | 0.041 | |
| Engine safety system tripping engine with delay during failure occurrence | 0.027 | |
| AVR hardware system failure | 0.026 |
Table 8.
Comparison of the calculated results with results from P&I clubs and accident investigation reports for the distribution of causal factors.
Table 8.
Comparison of the calculated results with results from P&I clubs and accident investigation reports for the distribution of causal factors.
| Operation Phases | ||||||
|---|---|---|---|---|---|---|
| Failure Category | UK P&I CLUB [31] | Accident Investigation Reports | General | Harbour | Manoeuvring | Sailing |
| Mechanical | 8% | 35% | 49% | 46% | 49% | 5% |
| Automation | 22% | 7% | 5% | 5% | 5% | 0% |
| Electrical | 22% | 13% | 6% | 6% | 6% | 46% |
| Fuel | 22% | 13% | 7% | 8% | 7% | 5% |
| Control | 26% | 32% | 33% | 35% | 33% | 44% |
Table 9.
Calculated indicating the system’s top sensitive failures.
| Failures | ||
|---|---|---|
| General phase | Generator safety system current sensors failure | 0.630 |
| Thrust bearings temperature sensors failure | 0.630 | |
| Catastrophic engine piston failure | 0.332 | |
| Short circuit in DG sets | 0.212 | |
| AVR hardware system failure | 0.212 | |
| Fresh water cooling system temperature sensors failure | 0.212 | |
| DG set controller hardware failure | 0.212 | |
| Governor hardware failure | 0.212 | |
| Lubricating oil pressure sensors failure | 0.212 | |
| Differential current fault in DG set | 0.212 | |
| Sailing phase | Load (current and voltage) sensors on azipods propulsion motors failure | 0.047 |
| Erroneous electrical power measurement on DG sets (current and voltage sensors failure) | 0.011 | |
| DG set fuel racks failure | 0.007 | |
| Governor speed sensors erroneous measurement | 0.004 | |
| Electrical transient is not acceptable by the system | 0.003 | |
| DG set circuit breaker not operating | 0.002 | |
| Erroneous speed measurement on propulsion motors | 0.001 | |
| Failure to reduce the propulsion motors load by the PMS | 0.001 | |
| Failure to reduce the propulsion motors load in time by the PMS | 0.001 |
Publisher’s Note: MDPI stays neutral with regard to jurisdictional claims in published maps and institutional affiliations. |
© 2021 by the authors. Licensee MDPI, Basel, Switzerland. This article is an open access article distributed under the terms and conditions of the Creative Commons Attribution (CC BY) license (https://creativecommons.org/licenses/by/4.0/).
Share and Cite
MDPI and ACS Style
Bolbot, V.; Theotokatos, G.; Boulougouris, E.; Psarros, G.; Hamann, R. A Combinatorial Safety Analysis of Cruise Ship Diesel–Electric Propulsion Plant Blackout. Safety 2021, 7, 38. https://0-doi-org.brum.beds.ac.uk/10.3390/safety7020038
AMA Style
Bolbot V, Theotokatos G, Boulougouris E, Psarros G, Hamann R. A Combinatorial Safety Analysis of Cruise Ship Diesel–Electric Propulsion Plant Blackout. Safety. 2021; 7(2):38. https://0-doi-org.brum.beds.ac.uk/10.3390/safety7020038
Chicago/Turabian StyleBolbot, Victor, Gerasimos Theotokatos, Evangelos Boulougouris, George Psarros, and Rainer Hamann. 2021. "A Combinatorial Safety Analysis of Cruise Ship Diesel–Electric Propulsion Plant Blackout" Safety 7, no. 2: 38. https://0-doi-org.brum.beds.ac.uk/10.3390/safety7020038
Note that from the first issue of 2016, this journal uses article numbers instead of page numbers. See further details here.