
Representativeness of Czech In-Depth Accident Data


CDV-Transport Research Center, Líšeňská 33a, 636 00 Brno, Czech Republic
*
Author to whom correspondence should be addressed.
Safety 2021, 7(2), 40; https://0-doi-org.brum.beds.ac.uk/10.3390/safety7020040
Submission received: 27 January 2021
/
Revised: 10 April 2021
/
Accepted: 30 April 2021
/
Published: 18 May 2021
Abstract
:Road accident occurrence is often the result of driving system malfunctions, and road safety improvements need to focus on all basic driving components—the vehicle, road infrastructure, and road users. Only focusing on one type of improvement does not necessarily lead to increased road safety. Instead, improved road safety requires comprehensive measures that consider all factors using in-depth accident analysis. The proposed measures, based on the findings from in-depth data that have general applicability, are necessary to determine whether data gained from in-depth studies adequately represent national statistics. This article aims to verify the representativeness of the Czech In-Depth Accident Study at a national level. The main contribution of this article lies in the use of a weighting method (specifically, a raking procedure) to generalise research results and render them applicable to a whole population. The obtained results could be beneficial at the national level, in the Czech Republic, and also on the supranational level. The applicability of this method on accident data is verified; thus, the method can be applied also in other countries or can be used to verify the applicability of conclusions from the Czech in-depth study also on a European or worldwide level.
1. Introduction
Injuries arising from traffic accidents are an important aspect of public health protection. They require effective and sustainable prevention measures. Data from in-depth accident analysis are one of the relevant sources supporting decision-making regarding the formulation of effective measures leading to a reduction in accident rates. Such data provides an overview of all the factors related to a specific accident. The investigation should reveal the real causes of the accident, regardless of legal accountability issues. The focus of the analysis concerns road infrastructure, the technical details of the vehicles involved, damage of the vehicles involved, and the road users (including psychological analysis and sustained injuries).
In-depth analyses of traffic accidents are conducted by a range of organisations around the world (National Automotive Sampling System—NASS, in the USA; Applus IDIADA company in Spain; Road Accident Sampling System India—RASSI; Centre for Automotive Safety Research—CASR, in Australia; Federal Highway Research Institute—BAST, in Germany, etc.). Even though the safety requirements of individual countries are very similar, the international comparison of the data from in-depth studies is rather problematic, due to differences in the data structure and their definition. The differences could also be seen in road infrastructure or vehicle fleet.
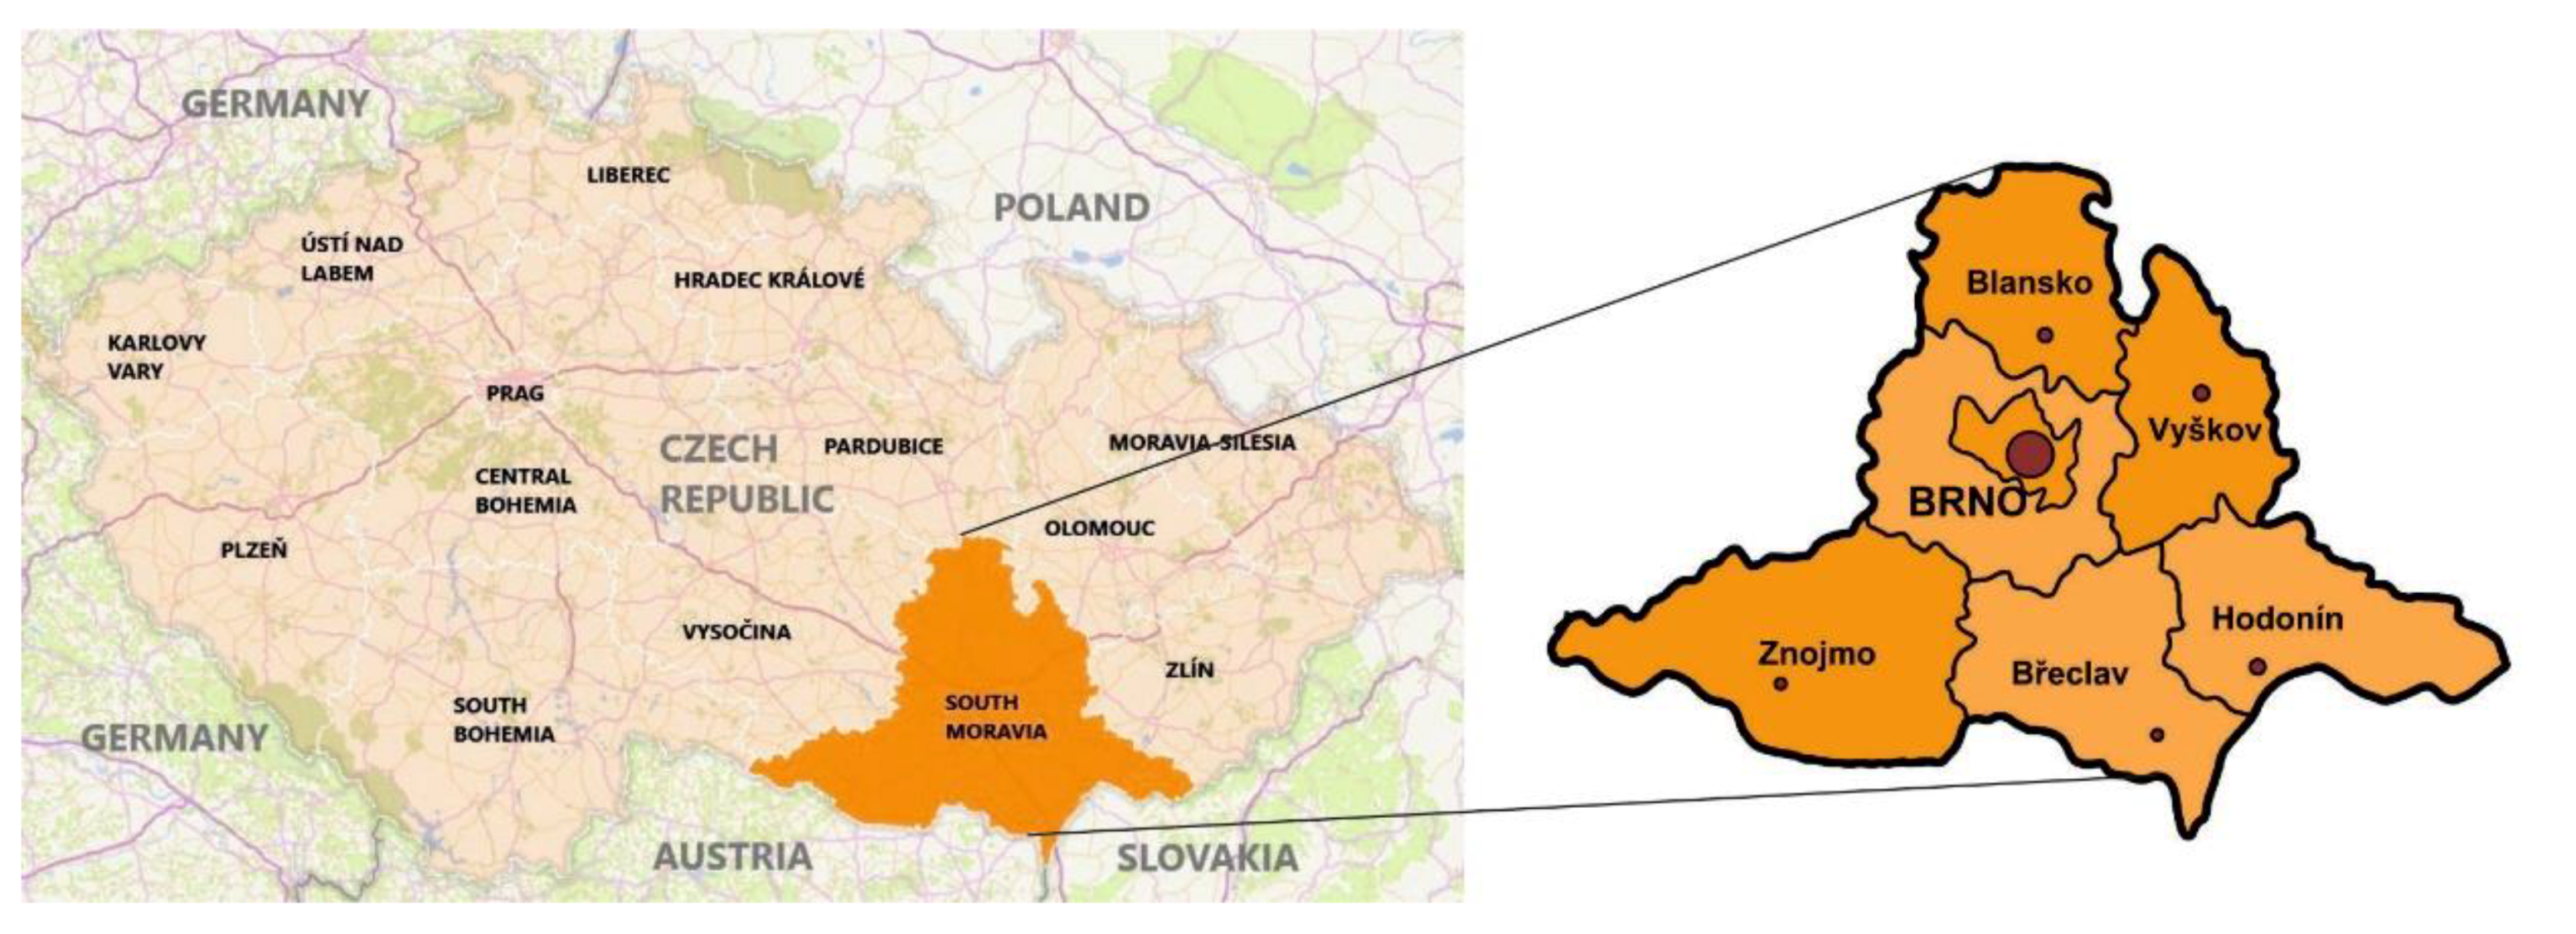
For the harmonisation of the in-depth data, several projects were conducted—in 2003–2008, the European Commission financed the SafetyNet project, which was followed up in 2010–2012 by the DaCoTa project. In 2010 European automobile manufacturers founded IGLAD [1]. Data from in-depth studies can help to efficiently direct countermeasures or serve as an argument for legislation adjusting—e.g., based on the conclusions from CASR in-depth study, the Australian government decided to lower the speed limit in urban areas in their country to 50 km/h [2,3,4]. Data from in-depth studies are also beneficial for vehicle manufacturers as they provide information about safety systems functions in real-world situations. Data from in-depth studies are used to validate safety systems and analyse their benefits, e.g., autonomous emergency braking [5]. German in-depth accident analysis data were used to develop the Advanced Automatic Collision Notification (AACN) system, that estimate injury outcome based on selected crash parameters. An estimation of injury severity aims at aiding emergency services to decide on appropriate action [6]. Data from real traffic accidents are used to develop new safety equipment—e.g., by Volvo Trucks, Audi and Skoda Cars [7,8]. In-depth accident data allows injury mechanism analysis. Many studies have been carried out regarding the analysis of accidents involving pedestrians based on the in-depth data [9,10,11,12]. The detailed accident analysis, including statistical modelling, could provide information about factors that significantly influenced injury severity or accident occurrence [13,14,15,16,17]. In the Czech Republic (CR), the performance of in-depth analyses follows long-term research carried out from the first half of the 1970s and the subsequent clinical analysis of accidents that followed on from that in the 1980s at the Transport Research Institute. At present, in-depth accident analysis is performed as part of the Czech In-depth Accident Study (CzIDAS) conducted by the Transport Research Centre (CDV). CzIDAS is carried out in the South Moravian Region, i.e., in the city of Brno and its surroundings (an area of approx. 7200 km2, containing 1.2 million citizens; Figure 1). The CzIDAS team at the CDV investigates more than 100 traffic accidents per year.
For the verification of the applicability of the proposed measures from in-depth studies at the national or supranational level, the representativeness of in-depth data needs to be validated. The differences exist between the distributions of variable data from in-depth studies and national statistics. The distortion of results can be prevented by adjusting the differences with the aid of a weighting procedure [18]. After the procedure application, the marginal sums should at least partially correspond to the population. As demonstrated by the authors of [19], weighting procedures can substantially improve the in-depth accident data accuracy. Weighting occurs with the aid of one or more auxiliary variables.
This article analyses the situation in the Czech Republic, i.e., the comparison of data gained by the CzIDAS with national statistics released by the Police of the Czech Republic. The police statistics cannot contain all information about the course of an accident. The system used to categorise the causes of traffic accidents primarily expresses the legal aspect of their origin, i.e., it first and foremost determines who is responsible for causing the traffic accident through a violation of the law. In connection to the initiatives for worldwide harmonisation of in-depth data, it is necessary to find and propose methodology with the described procedure and minimum knowledge requirements for detailed national statistics, that could be reproduced in other countries carrying out the in-depth studies. In some countries, due to strict legislation, obtaining detailed national accident data could be problematic.
The article will present the data collection method used, the selection of the population and the chosen weighting method. The resulting similarity or dissimilarity in the distribution of data sets will be tested so that during future research, variables not included in official statistics can be applied to the whole population of accident data.
2. Methods
2.1. Selection of Investigated Accidents
A representative sample is a sample whose results can be generally applied to a wider population [20]. A representative sample should reflect the characteristics of the population from which it has been taken, or the difference between the sample and the population should be as low as possible [21]. There are two ways in which a sample can be obtained.
The first method is to take the sample randomly from the investigated population—probability sampling. With probability sampling, every member of the population has the same probability of being selected; examples of this type of sampling include simple random sampling, stratified random sampling and group sampling. The random nature of probability sampling guarantees the representativeness of the sample.
The second sampling method is nonrandom—nonprobability sampling. There are various examples of such a method, including quota sampling, snowball sampling and convenience sampling, which are all methods that do not fulfil the condition of randomness. To predict the population behaviour from the sample behaviour, the structure of that sample must imitate the population composition as precisely as possible. Methods enabling a representative sample to be obtained even from nonprobability sampling are currently under constant development.
As part of the CzIDAS, selected traffic accidents occurring in the South Moravian Region with personal injuries (at least one injured participant) are analysed. The twelve-hour shifts are planned every month so that every individual day (Monday–Sunday) and both periods (nighttime and daytime) is covered during the month. The accidents announced on these days are included in the accident selection. The coverage of individual days during the month by shifts allows the simple and random sampling of accidents involving injuries in the South Moravian Region. The data from 1145 traffic accidents were collected in 2011–2019 by the CzIDAS team in South Moravian Region. The accident population constitutes of all accidents from South Moravia with personal injuries. The population of accidents with injuries from the South Moravian Region in 2011–2019 contains 20,318 entries. The national Police database of accidents contains in total 189,291 accidents involving injuries in the same period (2011–2019).
If the population were taken as all accidents involving injuries that occur throughout the Czech Republic, it would not be possible to achieve a truly random sample. Due to the data collection process, the whole population of accidents involving injuries would have to be from the South Moravian Region. Accidents that did not occur in the South Moravian Region would not have a chance of being sampled, i.e., it would be a nonprobability sampling process. Specifically, our data set would constitute a “convenience sample” where is not representativeness guaranteed [22].
2.2. The Road Network in the Czech Republic
The road infrastructure in the Czech Republic comprises motorways and standard roads, which can be divided into classes according to their importance—national roads, regional roads and local roads. The total length of all the roads and motorways in the Czech Republic is approximately 130,700 km (of which local roads account for 57%). In the South Moravian Region, there are approx. 10,700 km of roads (of which 58% are local roads).
2.3. Weighting Methods
Various weighting methods exist, including cell-weighting, poststratification, raking and hypercube weighting. Cell weighting will be more accurate as every cell is given an accurate target. However, in practice, it is almost impossible to derive accurate targets for most of these cells. Hypercube clustering is frequently used to identify weighting factors, but small sample or empty cells in datasets are problematic. Poststratification tends to result in smaller variance estimates, can improve the efficiency of estimators and correct for differential nonresponse across strata, but need enough data in each poststratum. Raking is generally less accurate—the main advantage is higher flexibility in the amount of required information [23,24,25,26,27,28].
Weighting is widely used to compare the conclusions of individual in-depth projects with each other—e.g., comparison of data from India (RASSI data) with US NASS-CDS data (maintained by the NHTSA) [29] or the comparison between data from the European Motorcycle Accident In-Depth Study (MAIDS) and the UK On The Spot (OTS) study [30].
A current trend is to render the conclusions derived from in-depth data applicable at the European or even global level. The aim of studies has also been to analyse the possibilities for the extrapolation of national data (e.g., GIDAS) to European level data [31,32]. Data from GIDAS has good predictive power, particularly in the case of severe accidents (accidents with at least one severely or fatally injured person), though the same quality was not achieved for minor accidents (i.e., accidents with uninjured or slightly injured participants) [32].
The comparison of the motor-vehicle accident risk of EU and US vehicles was also carried out with the aid of weighting. In the first step, each in-depth national dataset was weighted to represent that country, using weights and weighting approaches developed specifically for those datasets, while in the second step, EU weighting factors were derived by the application of decision tree categories. The total weights for the description of the EU standard population through the in-depth data samples were computed by the multiplication of the national and EU weights [28].
As demonstrated by many of the abovementioned studies, the weighting methods as same as variables used for weighting differ, due to the different methodology of data collection in presented papers. Variables used for comparison need to have the same categories in both datasets—especially using injury severity could be problematic, although they have been used in some studies. Information about injury may be distorted unless the participant gives consent to provide medical data. Data from in-depth also use more accurate injury data—classification system AIS or ISS.
2.4. The Raking Procedure
The raking procedure is a commonly used method. Its main advantage is that it requires less information about the population (one does not have to know all combinations of characteristics, though one needs to have crosstab tables available for the population source). This method can also be used for smaller samples. The raking procedure alters an unbalanced sample via the correction of the sample sum (and proportion) with known sums in the population using the marginal distribution of weighted variables in cases where the full cross-classification of these variables is unavailable or impractical. Raking is more flexible when several variables used at once.
An iterative proportional fitting algorithm was originally designed by Deming and Stephen [33,34] was used to estimate the raking weights. The algorithm sets the initial weighting factors wi for each cross-classification term to wi = 1, i = 1, 2, …, n and alters the weighting factors for the first cross-classification term so that the weighted sample becomes representative in relation to the population for that cross-classification. The resulting weighting factors are similarly altered for the next cross-classification term. This disturbs the representativeness of the other cross-classification terms, and so the process is repeated successively for every cross-classification term until the weighting factors converge [35]. The convergence of this approach was discussed in [36,37].
The presented procedure can be described more closely using two variable cross-classifications of the sample, which has J rows and K columns. The sums of the rows and columns are then labelled as and The population sums are labelled in the same way, as and . The first steps of the IPTF algorithm are
The adjustment factors are applied to the individual weights. The general formula for individual iterations can be written in the following manner:
The above procedure of adjusting one dimension at a time is repeated until the cell estimates converge.
DeBell and Krosnick [38] provide recommendations regarding the selection of the variable to be used in the raking procedure. A set of variables should be chosen that have been measured with low error and a low quantity of unknown data, and which are simultaneously comparable with data from reliable sources, such as the Police of the Czech Republic [36]. Weighting should also be used if fundamental differences are observed between the distributions of sample and population categories (higher than 5%). If the differences are lower than 2%, weighting is not necessary. The algorithm used in the raking procedure was created in the programme R using the Anesrake library [39,40].
2.5. Design Effect
A disadvantage of weighting is that it lowers the precision of estimates, which consequently has the effect of raising the dispersion of the estimate. This design effect caused by weighting can be substantial, but should not exceed 1.5. If the design effect is greater than 1.5, calibration may cost too much in terms of efficiency (standard errors). The design effect should gain values that are close to 1. The design effect is used to estimate the effectiveness of weighting methods on a sample and gives us an idea about weighting loss, i.e., growth in the variance of the sample estimation in the raking procedure [41]. Loss is calculated as follows:
where wi labelled weighting factors for each i = 1, 2, …, n.
3. Results
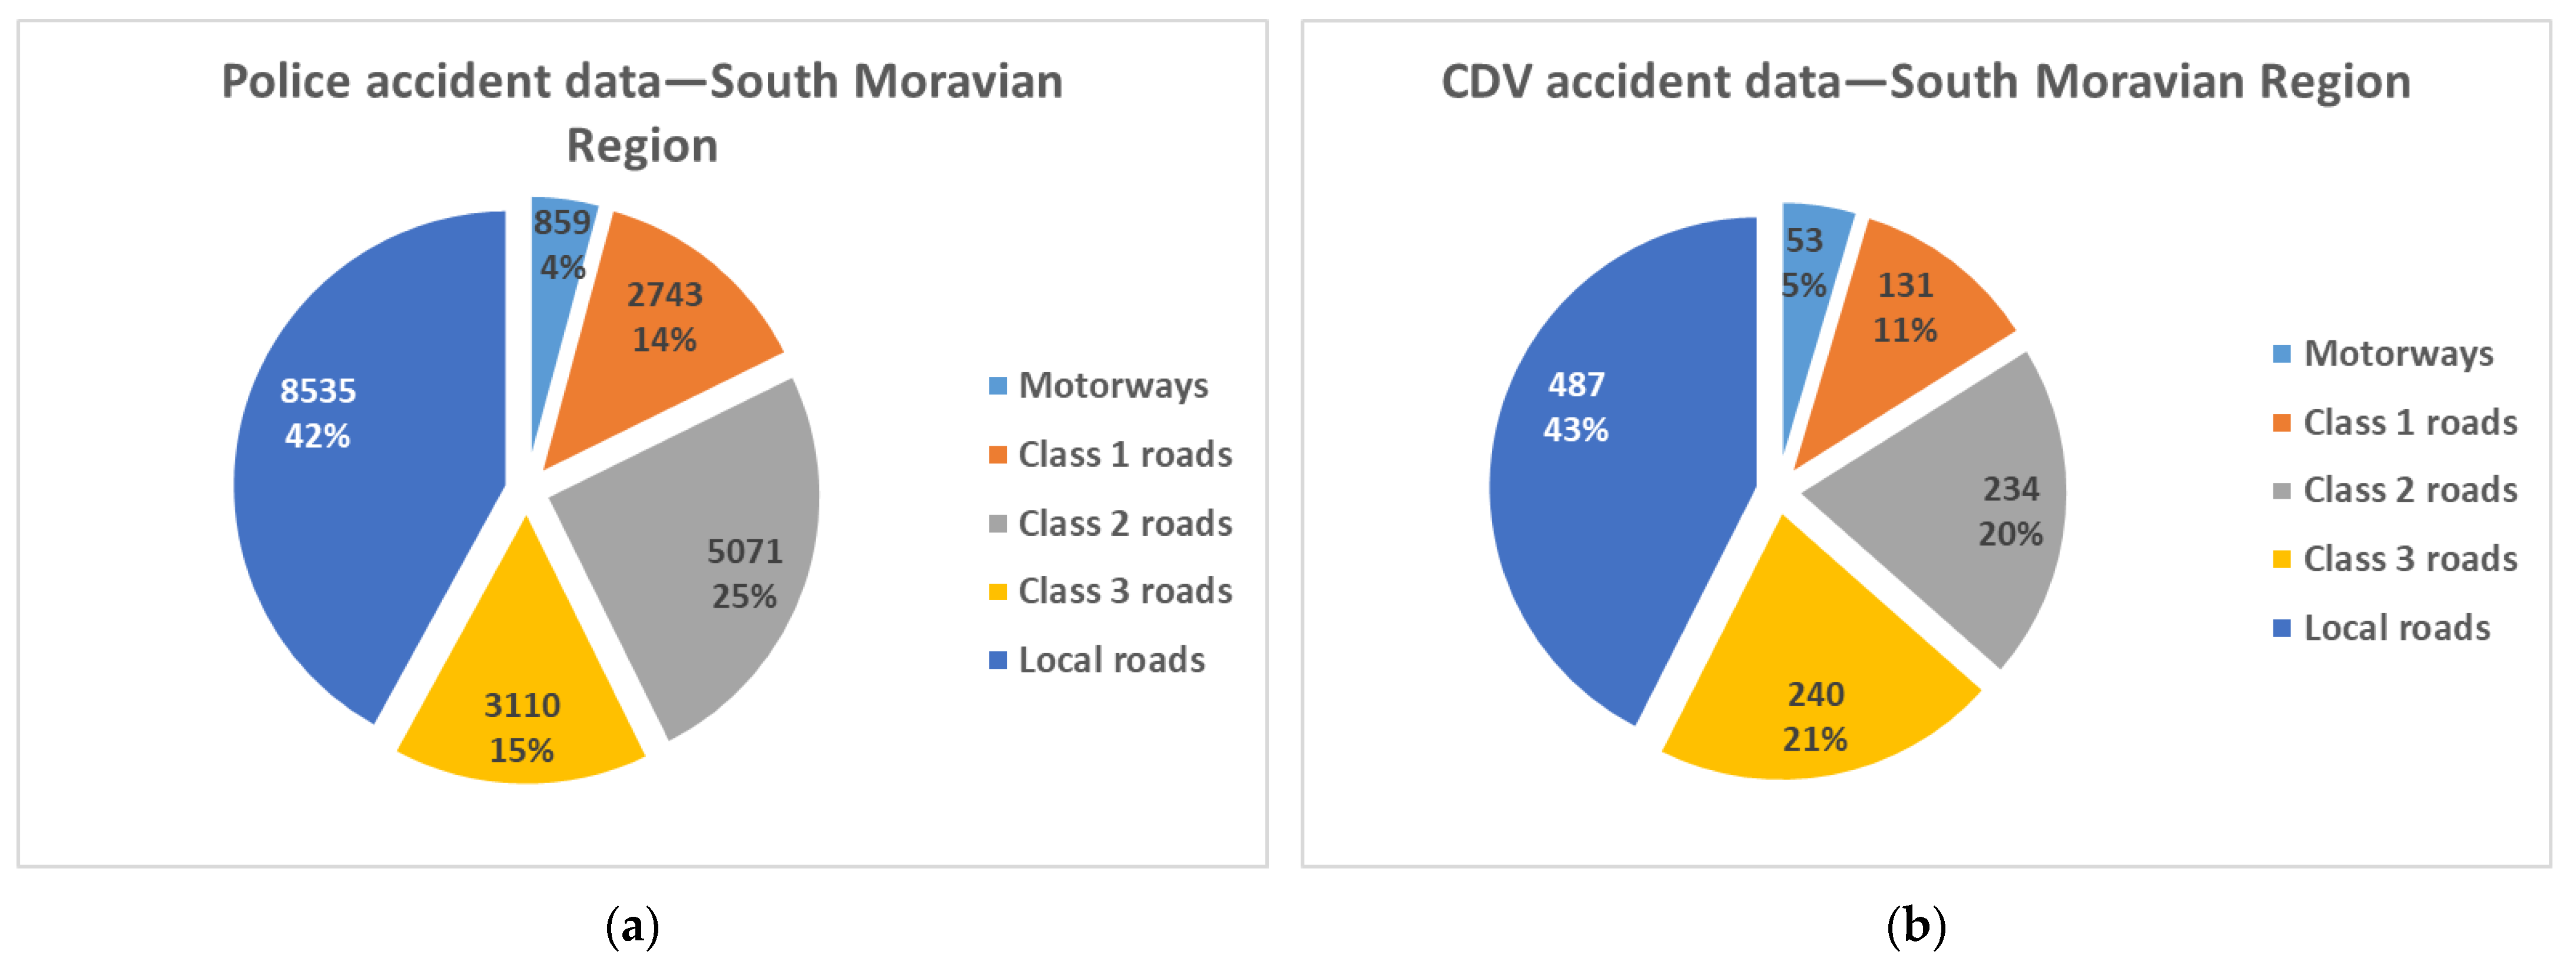
The raking weights are determined using the following variables as weighting factors: The accident site road type (five categories), accident time (four categories) and injury severity (three categories). The accident daytime (day or night) was used as a test variable to determine the weighting impact. The following graphs compare CDV and police data on traffic accidents in the South Moravian Region (SMR).
The largest proportion of accidents in the South Moravian Region occur on local roads (Figure 2). With regard to the sample size, the accident frequency on local roads is similar in CDV and police database. The total difference between the distributions was evaluated via the chi-squared test (χ2 = 35.080, df = 4, p-value = 0.000 < 0.05). The p-value lower than 0.05 shows the existence of a major difference between the distributions. The probability that the observed differences and dependences arose by chance is lower than 5%.
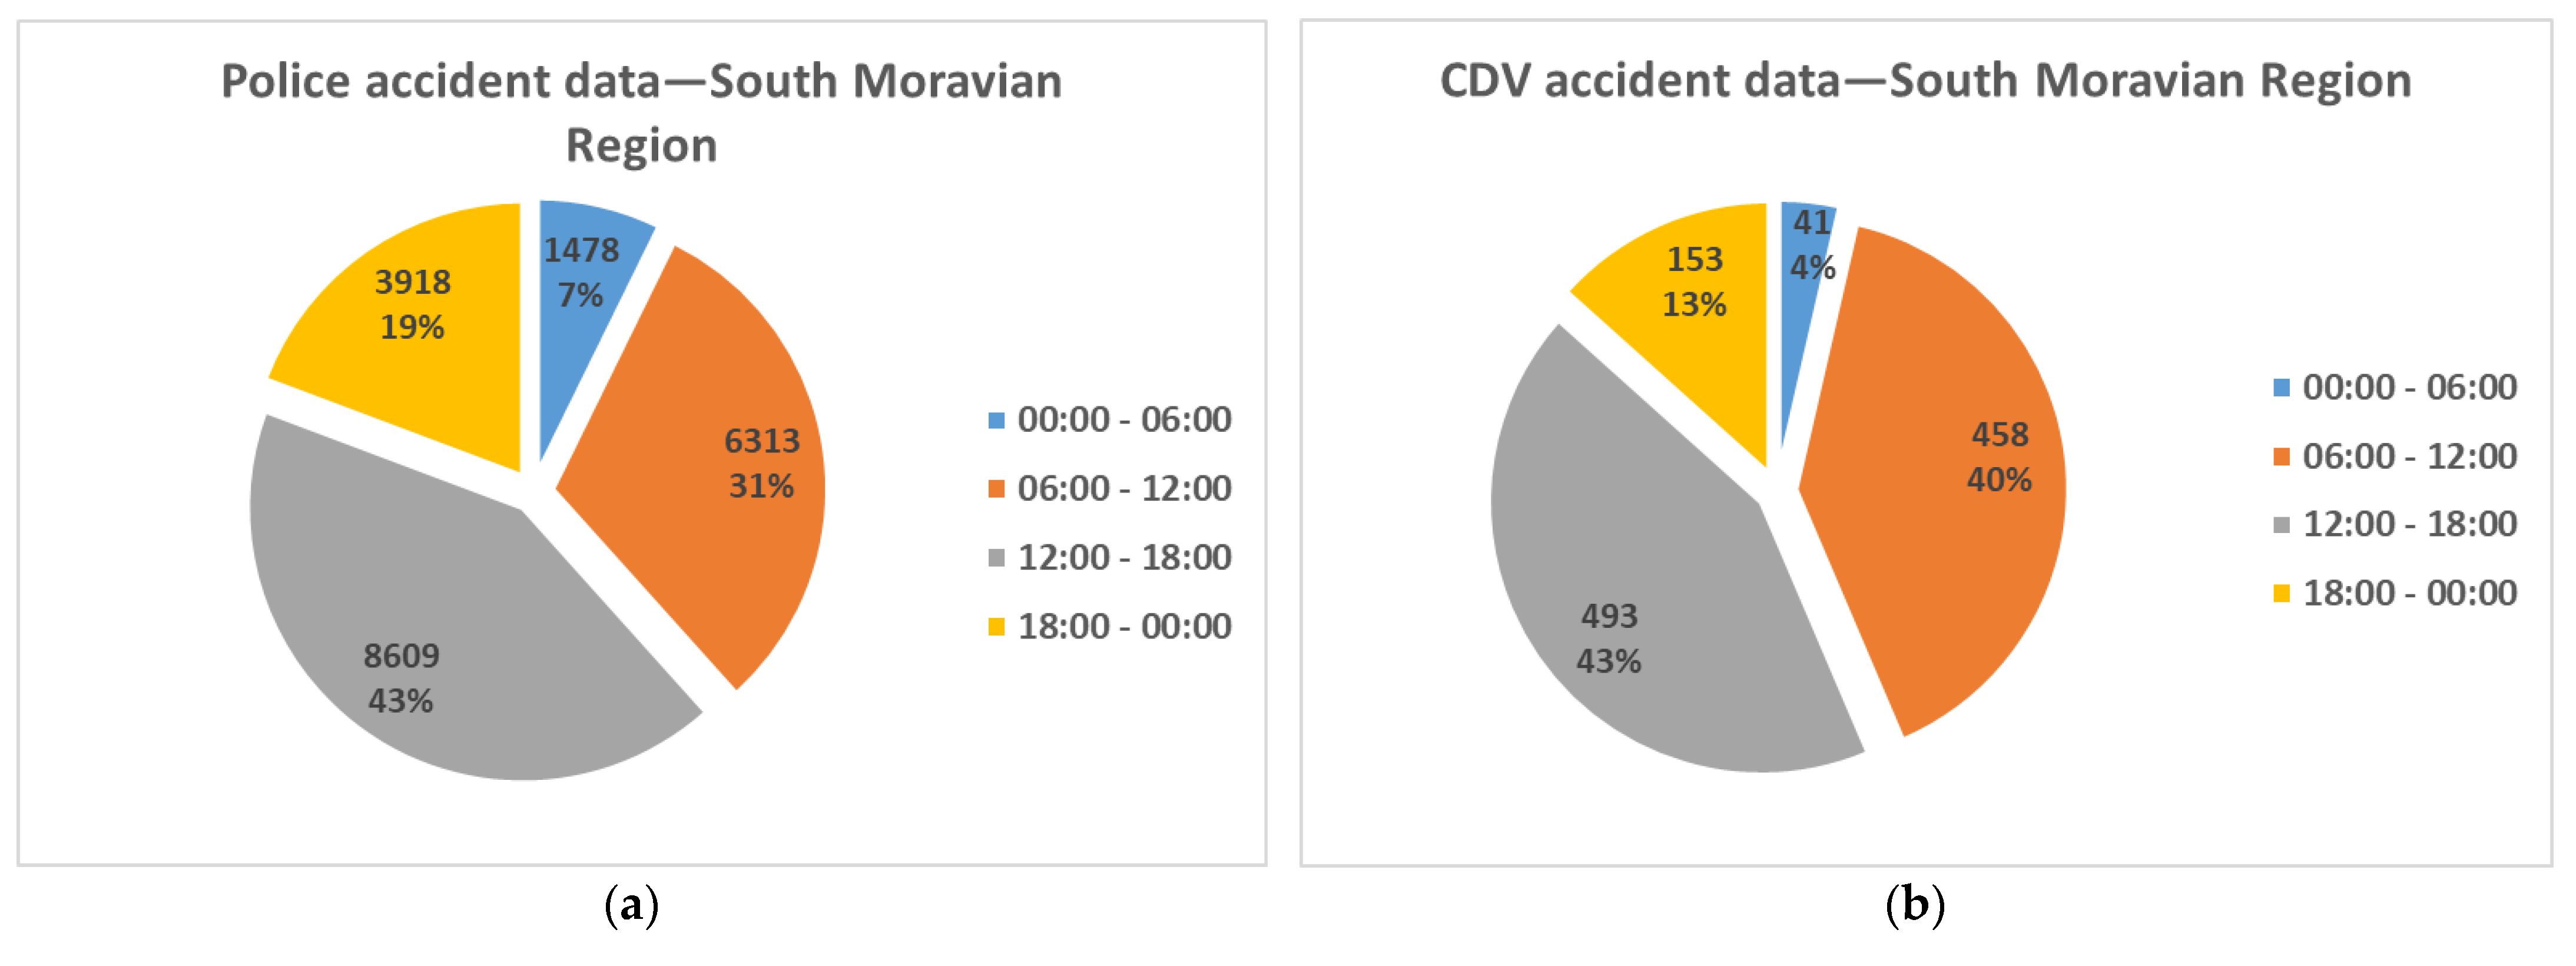
Figure 3 shows that around 3/4 of all accidents occurs between 06:00 and 18:00. The chi-square test indicates statistically significant differences (χ2 = 68.441, df = 3, p-value = 0.000 < 0.05). One of the biggest data sets differences is for the morning period between 06:00 and 12:00, where there is a 9% difference between the distributions. Another marked difference (6%) is for the nighttime period between 00:00 and 06:00. The distributions difference proved the chi-squared test.
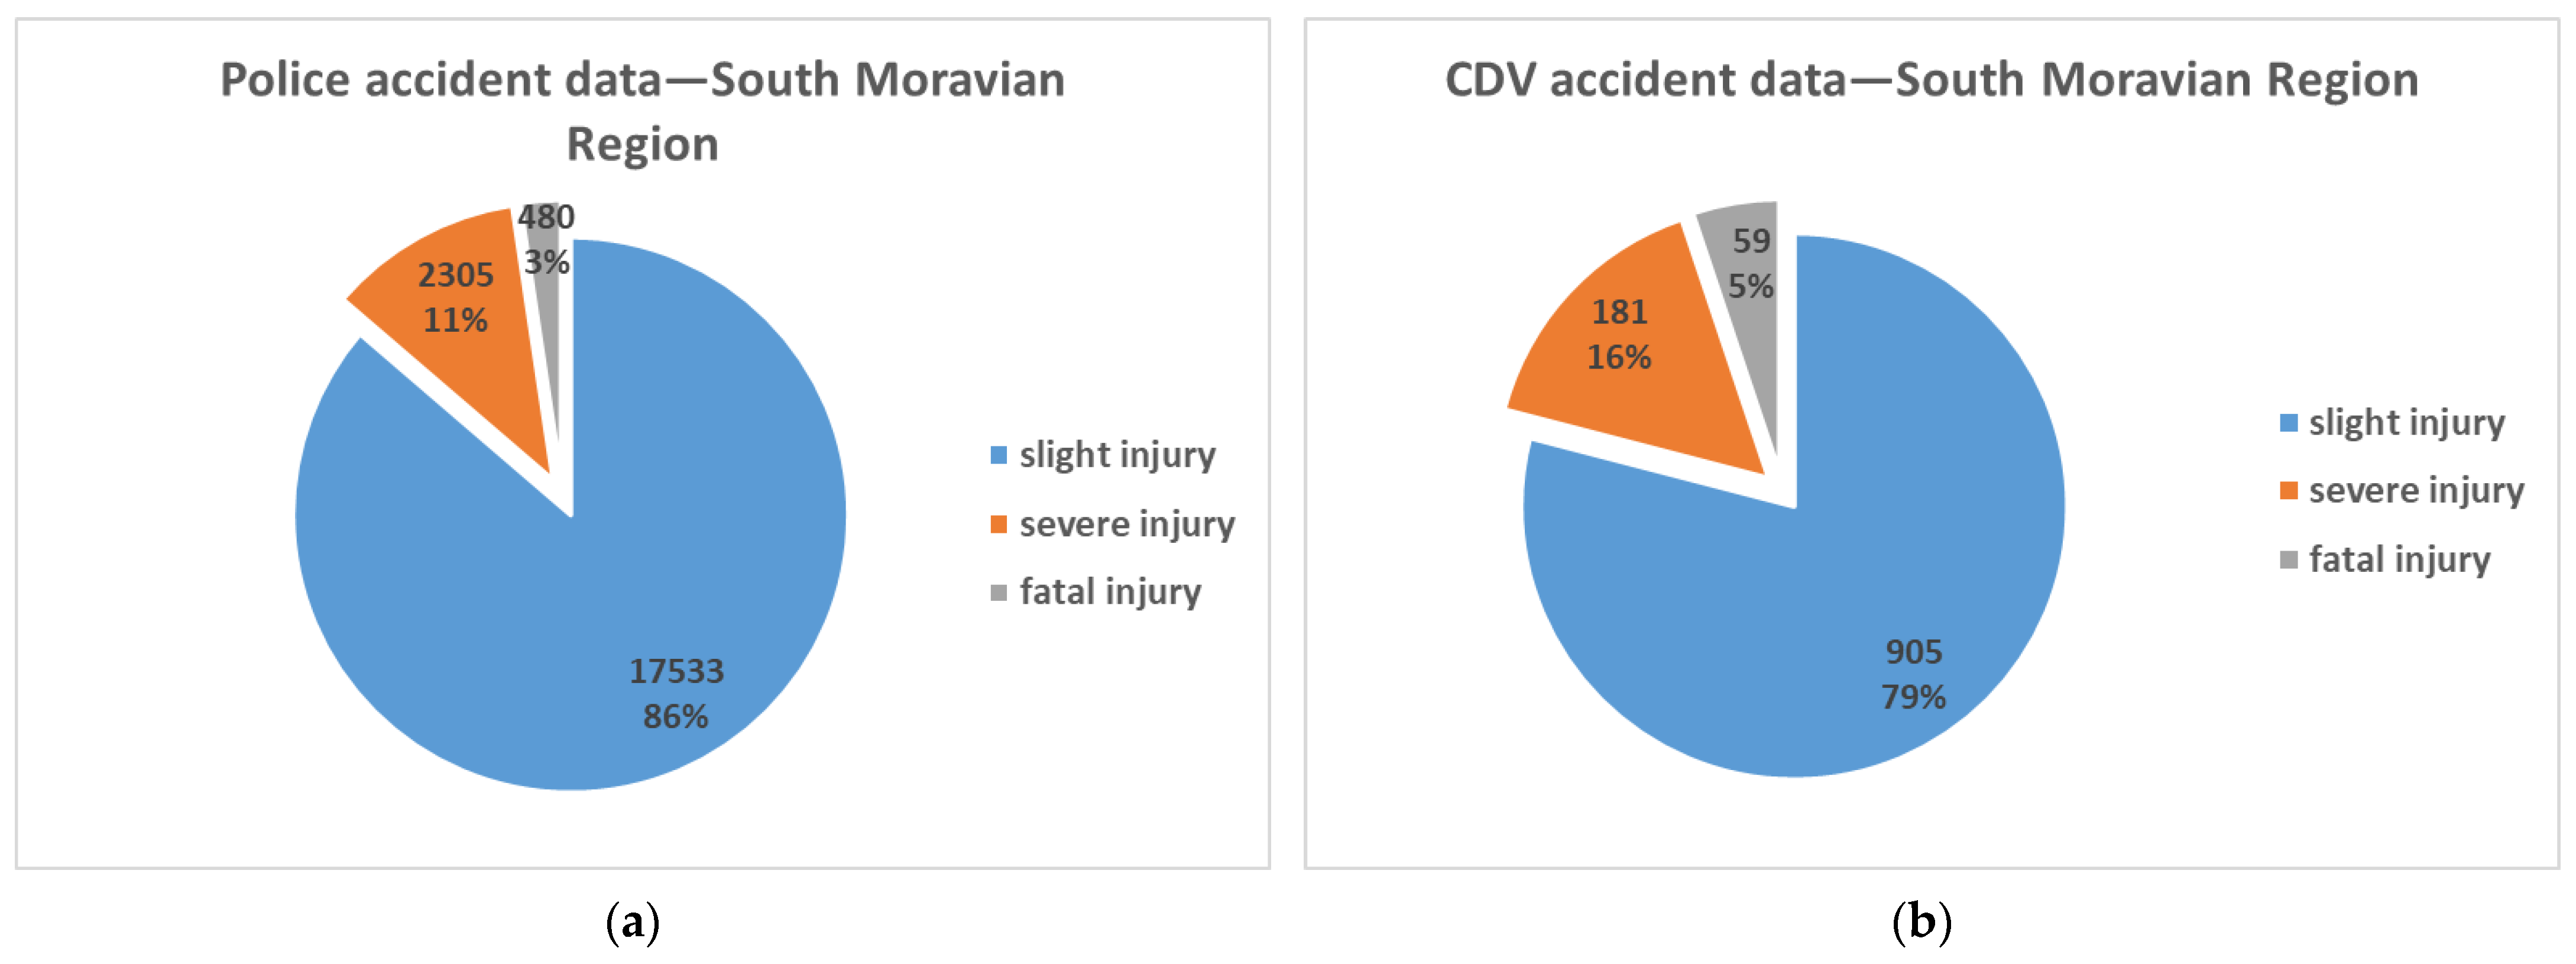
The Figure 4 illustrate the comparison of the injury severity (Chi-squared test (χ2 = 58.888, df = 2, p-value = 0.000 < 0.05)). Minor injuries are slightly underestimated in the Czech in-depth study database, due to the arrival time of investigation time at the accident place. Accidents with only very minor injuries (e.g., abrasions) are often investigated by Police quickly, before the research team arrival.
The weights used in the raking procedure converge when the variables stated in the previous section are used, and the resulting design effect is 1.15. The loss during the use of the weighting method is thus The resulting weights vector is in Table 1. These weights compensate for the deviation between the distributions of accidents in the population and the sample. For example, for class II roads from 00:00–06:00 and slight injury, the resulting weight is 2.51, which means that in the CDV sample were relatively fewer accidents for this group than in the whole population. The accidents representation in this group is for this reason adjusted by the aforementioned weight. For class III roads from 06:00–12:00, the resulting times are lower than 1, which suggests oversampling occurred compared to the population. For these groups, correction is performed in the opposite direction. The largest correction for all types of road occurs at a time from 00:00 to 06:00, when there are a low number of accidents compared to the other times.
Complete convergence was achieved after 15 iterations.
The resulting weights are then applied to each record so that the representativeness of the data rises, while accidents occurring at each time and on each type of road and each injury severity corresponded with their known occurrence in the population. For the weighting effect determination, the resulting weights were tested using the variable accident daytime (day/night). Subsequently were the resulting weighted values compared with the known police data for the SMR presented in Table 2.
The comparison of the unweighted CDV data and the police data shows a difference of around 5%. After applying the weighting method is the difference lowered to only 1%, so the weighting produced the desired effect. The findings need to be statistically verified via a test applied to the accident location variable.
When comparing the distributions of accident locations in the unweighted CDV data and police data using the chi-squared test, it was discovered that a substantial difference exists between these distributions. The comparison of weighted CDV data and police data indicate no statistically significant differences (p-value > 0.05). The positive effect of weighting is thereby proved—proportionally comparable data with Police data for South Moravian Region have been gained.
The whole process of weighting was also applied using police data from the whole Czech Republic (CR) using CDV data from the South Moravian Region. The process described above is displayed in Figure 5.
Analogously when the unweighted CDV data is compared with police data from the whole CR, there is a visible difference (5%), which is verified by the chi-squared test (p-value < 0.05). After weighting, the difference is only 0.1%, which is also proved by the chi-squared test p-value (Table 3).
4. Discussion and Summary
Although a number of countries (Germany, Britain, Spain, Belgium, Finland, etc.) carry out an in-depth accident analysis, very few of them deal with the question of the obtained data representativeness. The applicability of measures from in-depth studies at the national and supranational level needs to be determined whether that data is sufficiently representative. The weighting methods and also variables used for weighting may differ, due to the different methodology of data collection. The main aim of the article is to verify the representativeness of Czech In-Depth Accident data and to discover suitable methods that enable the general application of measures suggested by the very detailed analysis of traffic accidents to the whole population of accidents in the Czech Republic. The raking procedure was used for the weighting because this method has an advantage over poststratification methods when dealing with data from relatively small sample size and offers the option to incorporate more variables [27].
Weighting is performed using one or more selected auxiliary variables. For the comparison, it is necessary to find compatible variables that have the same categories and low quantity of unknown data and are simultaneously comparable with Police accident data. This approach enables the minimisation of errors. Some of the categories of variables in the CzIDAS database are more detailed than those from the police database and need to be grouped when comparing the two databases. The variables road type (five categories), accident time (four categories) and injury severity (three categories) were used as weighting factors. Firstly, only two variables (road type and accident time) were used for weight determination. The injury severity addition leads to more accurate results in fewer iterations. The accident daytime period (day/night) was used as a test variable upon which the influence of weighting was tested. The resulting weighted values were then compared with known police data.
This is the first study that confirms the usability of proposed measures from the Czech in-depth study to the national level using a similar assumption as Lavallé and Hautzinger used, that the weighting procedure would prevent distortion of results [5,17]. The resulting comparison shows that the weighted data collected by the CzIDAS team are comparable with police data, both from the South Moravian Region and from the whole CR. After the data sets weighting, the difference between the police data and the data from CzIDAS is only 1%. It was also demonstrated, just as in [19], that weighting fundamentally improved the CzIDAS data precision. The difference or similarity between distributions proved the chi-squared test.
Data from the Czech in-depth study is currently used to provide road safety campaigns and preventive activities in road safety. The results obtained in this paper confirm the applicability of Czech in-depth data into the National Road Safety Strategy and other government documents related to road safety. Based on the in-depth analysis of selected accident risk sites were some of the accident locations adjusted. Moreover, the effectiveness of some proposed countermeasures could be calculated using in-depth data, e.g., reducing fatalities with regard to the new vehicle safety system. Police reported accident data mostly does not include information about safety systems or vehicle identification number (which could be linked with vehicle safety system), so the determination of this benefit is limited. Vehicle identification numbers involved statistics, e.g., in selected states in the USA [42].
Based on the proposed methodology, the applicability of measures based on the Czech in-depth study was verified on a national level. For the applicability of CzIDAS measures to the supranational/European level, further research activities need to be realised. The limitation of this study primarily lies in comparison with regard to the selected variables. For the comparison were used only variables contained in both datasets and variables with a low rate of uncertainty. It was not possible to carry out a comparison for more variables, because of the different structure of both data sets and the possibility of dissimilarities arising between the gained variables due to the different methods used in their collection. One of the other possible uses of weighting methods is the expansion of CzIDAS data to the population and variables not collected by the Police of the Czech Republic.
5. Conclusions
The final comparison of the CzIDAS database with that of the Police of the Czech Republic shows that the data collected by the CzIDAS team are comparable with police data. Moreover, the Czech in-depth database concerning its size is representative, and the conclusions and recommendations obtained from the in-depth study can be applied on a national level. This allows investigators to move beyond that which is possible with normally available data from police statistics and supplement them with additional findings that factually characterise the circumstances and causes of traffic accidents. Detailed data about human factor failure (e.g., causes of inattention not included in Police statistics), vehicle technology (e.g., airbag or safety features in a vehicle not included in Police statistics) and infrastructure (e.g., most common infrastructure design errors) can be interpreted and generalised on the whole accident population. As shown by some of the previous research activities (e.g., GIDAS), the applicability of in-depth data, e.g., enables calculation of the reduction of the fatal consequence when implementing new legislative regulation or obligation to an equipped vehicle with new safety features.
The obtained results could be beneficial not only at the national level in the Czech Republic. The applicability of this method on accident data was verified so the method can be applied also in other countries or can be used to verify the applicability of conclusions from the Czech in-depth study also on a European or worldwide level. New proposed measures, based on future CzIDAS research activities, will react to the real causes of accidents in a much more sensitive manner and eliminate them with better-targeted approaches.
Author Contributions
Conceptualization, R.Z., K.B.; methodology R.Z., K.B.; validation R.Z., K.B.; formal analysis R.Z., K.B., V.V.; investigation R.Z., K.B., V.V.; writing-original draft preparation R.Z., K.B.; writing—review and editing—R.Z., K.B., V.V., J.F.; visualization R.Z., K.B.; supervision: V.V., J.F.; project administration V.V., J.F.; funding acquisiton V.V., J.F. All authors have read and agreed to the published version of the manuscript.
Funding
This article was produced with the financial support of the Ministry of Education, Youth and Sports within National Sustainability Programme I, project of Transport R&D Centre (LO1610), on the research infrastructure acquired from the Operational Programme Research and Development for Innovations (CZ.1.05/2.1.00/03.0064).
Institutional Review Board Statement
Not applicable.
Informed Consent Statement
Not applicable.
Data Availability Statement
The data that support the findings of this study are available from Police of the Czech Republic and CzIDAS but restrictions apply to the availability of these data, which were used under license for the current study, and so are not publicly available. Data are however available from the authors upon reasonable request and with permission of Police of the Czech Republic and CzIDAS.
Conflicts of Interest
The authors declare that no conflicts of Interest.
References
- Ockel, D.; Bakker, J.; Schöneburg, R. An initiative towards a simplified international in-depth accident database. In Proceedings of the 23rd Enhanced Safety of Vehicles Conference (ESV 2013): Research Collaboration to Benefit Safety of All Road Users, Seoul, Korea, 27–30 May 2013. [Google Scholar]
- Baldock, M.R.J.; Woolley, J.E.; Ponte, G.; Wundersitz, L.N.; Lindsay, V.L. In-Depth Crash Investigation at the Centre for Auto-motive Safety Research. In Proceedings of the 3rd International Conference on ESAR “Expert Symposium on Accident Research”, Hannover, Germany, 5–6 September 2008; pp. 15–23. [Google Scholar]
- Kloeden, C.N.; McLean, A.J.; Moore, V.M.; Ponte, G. Travelling Speed and the Risk of Crash Involvement (CR172); Federal Office of Road Safety, Transport and Communications: Canberra, Australia, 1997; Volume 1,2.
- Kloeden, C.N.; McLean, A.J. Rural speed and crash risk. In Proceedings of the Australasian Road Safety Research, Policing and Education Conference, Melbourne, Australia, 19–20 November 2001; Volume 2, pp. 163–168. [Google Scholar]
- Anderson, R.; Doecke, S.; Mackenzie, J.; Ponte, G. Potential benefits of autonomous emergency braking based on in-depth crash reconstruction and simulation. In Proceedings of the 23rd International Conference on Enhanced Safety of Vehicles, Seoul, Korea, 27–30 May 2013. [Google Scholar]
- Lubbe, N.; Kiuchi, T. Injury Estimation for Advanced Automatic Collision Notification (AACN) in Germany. In Proceedings of the 6th International Conference on ESAR “Expert Symposium on Accident Research”, Hannover, Germany, 20–21 June 2014. [Google Scholar]
- Volvo Trucks. European Accident Research and Safety Report 2013; Technical Report 2013; Volvo Trucks: Gothenburg, Sweden, 9 January 2013. [Google Scholar]
- Gschwendtner, K.; Ernstberger, A.; Angerpointner, K.; Blum, K.; Donner, E.; Weber, S. Interdisciplinary accident research and research projects of AARU Audi Accident Research Unit. In Proceedings of the 7th International Conference on ESAR “Expert Symposium on Accident Research”, Hannover, Germany, 9–10 June 2016. [Google Scholar]
- Hamdane, H.; Serre, T.; Anderson, R.; Yerpez, J. Relevant factors for active pedestrian safety based on 100 real accident reconstructions. Int. J. Crashworthiness 2016, 21, 51–56. [Google Scholar] [CrossRef]
- Ottea, D.; Jänscha, M.; Haasper, C. Injury protection and accident causation parameters for vulnerable road users based on German In-Depth Accident Study GIDAS. Accid. Anal. Prev. 2012, 44, 149–153. [Google Scholar] [CrossRef] [PubMed]
- Wang, B.; Yang, J.; Dietmar, O.; Peng, Y. Prediction of Long Bone Fractures via Reconstruction of Pedestrian Accidents Using Multi-Body System and FE Models. J. Mech. Med. Biol. 2015, 15, 1550016. [Google Scholar] [CrossRef]
- Novák, J.; Křenek, J.; Kaniová, K.; Hlavůněk, I.; Tecl, J.; Kyselý, M.; Valentová, V.; Motl, J.; Striegler, R. Metodika Komplexní Analýzy Střetu Vozidla s Chodcem; Centrum Dopravního Výzkumu, v.v.i.: Brno, Czech Republic, 2015; p. 58. [Google Scholar]
- Fountas, G.; Anastasopoulos, P.C.; Mannering, F.L. Analysis of vehicle accident-injury severities: A comparison of segment- versus accident-based latent class ordered probit models with class-probability functions. Anal. Methods Accid. Res. 2018, 18, 15–32. [Google Scholar] [CrossRef]
- Behnood, A.; Mannering, F. Determinants of bicyclist injury severities in bicycle-vehicle crashes: A random parameters approach with heterogeneity in means and variances. Anal. Methods Accid. Res. 2017, 16, 35–47. [Google Scholar] [CrossRef]
- Chen, D.A.; Fuller, D. Analyzing road surface conditions, collision time, and road structural factors associated with bi-cycle collisions from 2000 to 2010 in Saskatoon. J. Transp. Health 2014, 1, 40–44. [Google Scholar] [CrossRef]
- Liu, P.; Fan, W. Analysis of head-on crash injury severity using a partial proportional odds model. J. Transp. Saf. Secur. 2019, 1–21. [Google Scholar] [CrossRef]
- Liu, P.; Marker, S. Evaluation of contributory factors’ effects on bicycle-car crash risk at signalized intersections. J. Transp. Saf. Secur. 2019, 12, 82–93. [Google Scholar] [CrossRef]
- Lavallé, P.; Beaumont, J.-F. Why We Should Put Some Weight on Weights. Surv. Methods Insights Field 2015. [Google Scholar] [CrossRef]
- Hautzinger, H.; Pfeiffer, M.; Schmidt, J. Expansion of GIDAS sample data to the regional level: Statistical methodology and practical experiences. In Proceedings of the 1st International Conference on ESAR “Expert Symposium on Accident Research”, Hannover, Germany, 3–4 September 2004; pp. 38–43. [Google Scholar]
- Urbánek, T.; Denglerová, D.; Širůček, J. Psychometrika: Měření v Psychologii; Portál: Praha, Czech Republic, 2001. [Google Scholar]
- Anderson, D.R.; Sweeney, D.J.; Williams, T.A. Modern Business Statistics with Microsoft Excel, 1st ed.; Cincinnati, O., Ed.; Cengage Learning: Boston, MA, USA, 2003. [Google Scholar]
- Lavrakas, P. Encyclopedia of Survey Research Methods; SAGE Publications Ltd: Thousand Oaks, CA, USA, 2008. [Google Scholar]
- Marsden, P.V.; Wright, J.D. Handbook of Survey Research; Academic Press: Bingley, UK, 2010. [Google Scholar]
- Barboza, I.; Williams, R. Post-stratification and Response Bias in Survey Data with Applications in Political Science. In Proceedings of the Artículo Presentado en Annual Meeting of the Midwest Political Science Association, Chicago, Illinois, 7 April 2005. [Google Scholar]
- Little, R.J.A. Post-stratification: A modeler’s perspective. J. Am. Stat. Assoc. 1993, 88, 1001–1012. [Google Scholar] [CrossRef]
- Battaglia, M.P.; Izrael, D.; Hoaglin, D.C.; Frankel, M.R. Tips and tricks for raking survey data (aka sample balancing). Abt Assoc. 2004, 1, 4740–4744. [Google Scholar]
- Grande, E.D.; Chittleborough, C.R.; Campostrini, S.; Tucker, G.; Taylor, A.W. Health Estimates Using Survey Raked-Weighting Techniques in an Australian Population Health Surveillance System. Am. J. Epidemiol. 2015, 182, 544–556. [Google Scholar] [CrossRef] [PubMed]
- Flannagan, C.A.; Bálint, A.; Klinich, K.D.; Sander, U.; Manary, M.A.; Cuny, S.; McCarthy, M.; Phan, V.; Wallbank, C.; Green, P.E.; et al. Comparing motor-vehicle crash risk of EU and US vehicles. Accid. Anal. Prev. 2018, 117, 392–397. [Google Scholar] [CrossRef] [PubMed]
- Bhuvanesh, M.; Padmanaban, J.; Goldberger, S. Development of Accident Reconstruction Using In-Depth Accident Investi-gation Data in India. In Proceedings of the IRCOBI Conference Proceedings, Lyon, France, 9–11 September 2015. [Google Scholar]
- McCarthy, M.; Walter, L.; Hutchins, R.; Tong, R.; Keigan, M. Comparative Analysis of Motorcycle Accident Data from OTS and MAIDS; Published Project Report 168; TRL Ltd.: Wokingham, UK, 2007. [Google Scholar]
- Niebuhr, T.; Kreiss, J.P.; Achmus, S. GIDAS-Aided quantification of the effectiveness of traffic safety measures in EU 27. In Proceedings of the 18th Conference on the Enhanced Safety of Vehicles, Nagoya, Japan, 19–22 May 2003. [Google Scholar]
- Kreiss, J.P.; Pastor, C.; Dobberstein, J. Extrapolation of GIDAS accident data to Europe. In Proceedings of the 24th International Technical Con-ference on the Enhanced Safety of Vehicles (ESV), Gothenburg, Sweden, 8–11 June 2015. [Google Scholar]
- Deming, W.E.; Stephan, F.F. On a least squares adjustment of a sampled frequency table when the expected marginal totals are known. Ann. Math. Stat. 1940, 11, 427–444. [Google Scholar] [CrossRef]
- Battaglia, M.P.; Izrael, D.; Hoaglin, D.C.; Frankel, M.R. Practical Considerations in Raking Survey Data. Surv. Pract. 2009, 2, 1–10. [Google Scholar] [CrossRef] [Green Version]
- Bethlehem, J.G. Weighting Nonresponse Adjustments Based on Auxiliary Information. In Survey Nonresponse; Wiley: New York, NY, USA, 2002. [Google Scholar]
- Ruschendorf, L. Convergence of the Iterative Proportional Fitting Procedure. Ann. Stat. 1995, 23, 1160–1174. [Google Scholar] [CrossRef]
- Kurras, S. Symmetric Iterative Proportional Fitting. In Proceedings of the 18th International Conference on Artificial Intelligence and Statistics (AISTATS), San Diego, CA, USA, 9–12 May 2015; pp. 526–534. [Google Scholar]
- Debell, M.; Krosnick, J.A. Computing weights for American national election study survey data. In nes012427. Ann Arbor, MI, Palo Alto, CA: ANES Technical Report Series; Stanford University: Stanford, CA, USA, 2009. [Google Scholar]
- R Core Team. R: A Language and Environment for Statistical Computing. R Foundation for Statistical Computing, Vienna, Austria. Available online: http://www.R-project.org/ (accessed on 11 March 2021).
- Pasek, J.A. ANES Raking Implementation; Version 0.80; R Foundation for Statistical Computing: Vienna, Austria, 2018. [Google Scholar]
- Kish, L. Survey Sampling; Wiley: New York, NY, USA, 1965. [Google Scholar]
- Cicchino, J.B. Real-world effects of rear automatic braking and other backing assistance systems. J. Saf. Res. 2019, 68, 41–47. [Google Scholar] [CrossRef] [PubMed]
Figure 1.
Area of the Czech Republic in which the in-depth analysis of traffic accidents is carried out.
Figure 1.
Area of the Czech Republic in which the in-depth analysis of traffic accidents is carried out.

Figure 2.
Comparison of police data on accidents involving injuries in the South Moravian Region for individual roads (a) with accidents investigated by the CDV (b) (2011–2019).
Figure 2.
Comparison of police data on accidents involving injuries in the South Moravian Region for individual roads (a) with accidents investigated by the CDV (b) (2011–2019).

Figure 3.
Comparison of police (a) and CDV data (b) on the time of day when accidents took place in the South Moravian Region (2011–2019).
Figure 3.
Comparison of police (a) and CDV data (b) on the time of day when accidents took place in the South Moravian Region (2011–2019).

Figure 4.
Comparison of police (a) and CDV data (b) accident severity in the South Moravian Region (2011–2019).
Figure 4.
Comparison of police (a) and CDV data (b) accident severity in the South Moravian Region (2011–2019).

Figure 5.
Relationship of In-depth to Police database.


Table 1.
The resulting vector of weights for every cross-classification term.
| Injury Severity | Accident Time | Weights | ||||
|---|---|---|---|---|---|---|
| Motorway | Class I Road | Class II Road | Class III Road | Local Road | ||
| Slight | 00:00–06:00 | 1.67 | 2.55 | 2.51 | 1.50 | 1.93 |
| 06:00–12:00 | 0.70 | 1.06 | 1.05 | 0.63 | 0.81 | |
| 12:00–18:00 | 0.91 | 1.38 | 1.36 | 0.81 | 1.05 | |
| 18:00–00:00 | 1.29 | 1.97 | 1.94 | 1.15 | 1.49 | |
| Severe | 00:00–06:00 | - | 1.63 | 1.61 | - | 1.24 |
| 06:00–12:00 | 0.45 | 0.68 | 0.67 | 0.40 | 0.52 | |
| 12:00–18:00 | 0.58 | 0.89 | 0.87 | 0.52 | 0.67 | |
| 18:00–00:00 | 0.82 | 1.26 | 1.24 | 0.74 | 0.95 | |
| Fatal | 00:00–06:00 | 0.86 | - | 1.30 | 0.77 | - |
| 06:00–12:00 | 0.36 | 0.55 | 0.54 | 0.32 | 0.42 | |
| 12:00–18:00 | - | 0.72 | 0.71 | 0.42 | 0.54 | |
| 18:00–00:00 | - | 1.02 | 1.00 | 0.60 | 0.77 | |
Table 2.
Resulting weighted values for the accident daytime variable in the South Moravian Region.
| Police Data for the SMR | Unweighted CDV Data | Weighted CDV Data | ||||
|---|---|---|---|---|---|---|
| Number of Accidents | Percentual Representation | Number of Accidents | Percentual Representation | Number of Accidents | Percentual Representation | |
| Night | 4232 | 20.8% | 170 | 14.8% | 225.6 | 19.7% |
| Day | 16,086 | 79.2% | 975 | 85.2% | 919.4 | 80.3% |
| Σ | 20,318 | 100% | 1145 | 100% | 1145 | 100% |
CDV vs. Police chi-squared test (χ2 = 23.788, df = 1, p-value = 0.000 < 0.05). Weighted CDV data vs. Police chi-squared test (χ2 = 0.784, df = 1, p-value = 0.376 > 0.05).
Table 3.
Resulting weighted values for the accident daytime variable in the Czech Republic.
| Police Data for the CR | Unweighted CDV Data | Weighted CDV Data | ||||
|---|---|---|---|---|---|---|
| Number of Accidents | Percentual Representation | Number of Accidents | Percentual Representation | Number of Accidents | Percentual Representation | |
| Night | 38,892 | 19.5% | 170 | 14.8% | 222.1 | 19.4% |
| Day | 150,399 | 79.5% | 975 | 85.2% | 922.9 | 80.6% |
| Σ | 189,291 | 100% | 1145 | 100% | 1145 | 100% |
CDV vs. Police chi-squared test (χ2 = 22.671, df = 1, p-value = 0.000 < 0.05). Weighted CDV data vs. Police chi-squared test (χ2 = 0.934, df = 1, p-value = 0.334 > 0.05).
Publisher’s Note: MDPI stays neutral with regard to jurisdictional claims in published maps and institutional affiliations. |
© 2021 by the authors. Licensee MDPI, Basel, Switzerland. This article is an open access article distributed under the terms and conditions of the Creative Commons Attribution (CC BY) license (https://creativecommons.org/licenses/by/4.0/).
Share and Cite
MDPI and ACS Style
Zůvala, R.; Bucsuházy, K.; Valentová, V.; Frič, J. Representativeness of Czech In-Depth Accident Data. Safety 2021, 7, 40. https://0-doi-org.brum.beds.ac.uk/10.3390/safety7020040
AMA Style
Zůvala R, Bucsuházy K, Valentová V, Frič J. Representativeness of Czech In-Depth Accident Data. Safety. 2021; 7(2):40. https://0-doi-org.brum.beds.ac.uk/10.3390/safety7020040
Chicago/Turabian StyleZůvala, Robert, Kateřina Bucsuházy, Veronika Valentová, and Jindřich Frič. 2021. "Representativeness of Czech In-Depth Accident Data" Safety 7, no. 2: 40. https://0-doi-org.brum.beds.ac.uk/10.3390/safety7020040
Note that from the first issue of 2016, this journal uses article numbers instead of page numbers. See further details here.