
Integrated IEW-TOPSIS and Fire Dynamics Simulation for Agent-Based Evacuation Modeling in Industrial Safety


Department of Industrial Engineering, Faculty of Engineering, Ubon Ratchathani University, Ubonratchathani 34190, Thailand
*
Author to whom correspondence should be addressed.
Safety 2021, 7(2), 47; https://0-doi-org.brum.beds.ac.uk/10.3390/safety7020047
Submission received: 21 February 2021
/
Revised: 16 May 2021
/
Accepted: 21 May 2021
/
Published: 7 June 2021
Abstract
:Emergency events in the industrial sector have been increasingly reported during the past decade. However, studies that focus on emergency evacuation to improve industrial safety are still scarce. Existing evacuation-related studies also lack a perspective of fire assembly point’s analysis. In this research, location of assembly points is analyzed using the multi-criteria decision analysis (MCDA) technique based on the integrated information entropy weight (IEW) and techniques for order preference by similarity to ideal solution (TOPSIS) to support the fire evacuation plan. Next, we propose a novel simulation model that integrates fire dynamics simulation coupled with agent-based evacuation simulation to evaluate the impact of smoke and visibility from fire on evacuee behavior. Factors related to agent and building characteristics are examined for fire perception of evacuees, evacuees with physical disabilities, escape door width, fire location, and occupancy density. Then, the proposed model is applied to a case study of a home appliance factory in Chachoengsao, Thailand. Finally, results for the total evacuation time and the number of remaining occupants are statistically examined to suggest proper evacuation planning.
1. Introduction
Fire emergency is considered a major catastrophic event causing loss and injury to human life and property. The Federal Emergency and Management Agency [1] reported more than 1.3 million fires, more than 3600 deaths, more than 15,000 injuries, and an estimated $25.6 billion loss in economic damage in the United States in 2018. The rapid damage and increasing trend from these fires urge not only the private sector but also the government sector around the globe to plan better for managing safety and mitigating these emergencies [2,3]. The emergency management literature can be categorized based on the four-phase planning of the emergency management cycle related to the pre- and post-operations [4]. The first phase is the mitigation phase with an aim to reduce the impact of the emergency occurrence. Next, the second phase is called the preparedness phase, and the aim is to prepare for an emergency response. The third phase, the response phase, is concerned with immediate response when the emergency has occurred. The recovery phase is the fourth phase with a purpose to revert a tragic situation to a normal state. A number of recent research studies have suggested that studies focusing on post-emergency management are needed [5,6,7].
In this study, the assembly point and fire emergency are assessed during the pre-emergency operation, whereas an evacuation analysis is conducted during the post-emergency operation. In particular, a computer-based simulation technique is used to analyze complex situations with high uncertainties in the industrial safety. While most mathematical models can be used to assist in strategic decision-making at a macro level, computer simulation models are more suitable for complex operational problems [8]. The methodology employed in this study is based on the use of the multi-criteria decision analysis (MCDA) tool by using Technique for Order Preference by Similarity to the Ideal Solution (TOPSIS) combined with Information Entropy Weight (IEW) to analyze the selection of the assembly point, which is later used as an exit point for the evacuation simulation model in an integrated way. In addition, the input file to create a fire emergency scenario is prepared using PyroSim, which is a graphical user interface for the Fire Dynamics Simulator (FDS). In particular, PyroSim can be used to create fire simulations to predict smoke movement and temperature during a fire in the study area. Then, the location of the selected assembly point and analyzed fire characteristics are combined and used to verify and validate the development of an agent-based simulation model, which is modeled using PathFinder to plan for an evacuation.
The case study used to verify and validate the proposed model is based on the actual data related to the home appliance industry located in Chachoengsao, Thailand. One particular manufacturing building is selected to simulate a fire emergency and the evacuation plan is then analyzed. The designed experiment was conducted on factors related to the agent and building characteristics: (1) fire perception of evacuees, (2) evacuees with physical disabilities, (3) escape door width, (4) fire location, and (5) occupancy density. The simulation results are then obtained for the total evacuation time and the number of remaining evacuees in each period. Finally, these results are statistically analyzed to understand how varying factor impacts key managerial decisions.
The remaining sections are organized as follows. We overview the literature review in Section 2. Then, an analysis of assembly point selection are presented in Section 3. Next, our integrated fire dynamic simulation and agent-based evacuation modeling are discussed in Section 4. Finally, Section 5 provides research conclusion and future research directions.
2. Literature Review
Recent studies related to fire emergency management and evacuation planning are next reviewed, which can be further divided into pre-emergency as well as post-emergency management. In particular, while fire protection strategy and an assembly point analysis are related to the pre-emergency management, fire modeling and evacuation modeling studies are concerning the post-emergency analysis. In addition, factors examined during the post-emergency evacuation study as well as MCDA technique deemed important during an emergency management are further reviewed (Table 1).
There are a number of studies that investigate the pre-emergency strategies for the fire protection design (e.g., Mawhinney [9], Kironji [10], Mróz et al. [11], Tomar and Khurana [12], and Rahardjo and Prihanton [13]) and the assembly point analysis (e.g., Raja Prasad and Prasad Rao [14], Unal and Uslu [15], Hoscan and Cetinyokus [16], and Şenik and Uzun [17]). For example, Kironji [10] assessed fire protection systems, such as the automatic sprinkler system, fire protection alarm, and escape route, for a commercial high-rise building. The authors suggested different mitigation strategies related to the inspection and maintenance of fire protection systems. Tomar and Khurana [12] evaluated the impact of passive fire protection for a fire case study of road tunnel. Both the impact of peak heat release rate and the temperature inside the tunnel are investigated. Recently, Rahardjo and Prihanton [13] proposed recommendations concerning critical challenges for fire safety. Factors concerning the access for fire officers, the connection to neighborhood road, and the condition of fire suppression system were discussed.
Additionally, Unal and Uslu [15] applied the geographic information system (GIS) to analyze location of emergency shelters to be used as an assembly point for evacuees. Various factors related to area size, accessibility, and capacity are examined. Hoscan and Cetinyokus [16] proposed the analytic hierarchy process-based model to examine criteria for selecting an assembly point in the event of industrial accidents. Various criteria related to mitigation strategy, coordination, transportation, and physical properties are evaluated. Then, the authors applied the hazard modeling program called ALOHA to verify and validate their model. Şenik and Uzun [17] have recently analyzed the site selection problem for assembly points and temporary shelter areas. Criteria related to the proximity to healthcare organization, proximity to main roads, and proximity to existing building were analyzed and the ArcGIS was used to verify their study.
A number of researchers propose models that focus on the patterns of fires for different post-emergency situations. For example, Deckers et al. [18] proposed a car park fire simulation model and conducted a designed experiment to control smoke and heat levels using horizontal ventilation. In addition, Suard et al. [19] developed a simulation model of fire-induced doorway flows and evaluated the model in a small-scale enclosure. Zhao et al. [20] conducted a simulation study by analyzing fire-induced smoke movement in the stairwell of a high-rise building. The authors suggested that the pressure inside and outside the stairwell is varied with height. Huang et al. [21] developed the model to analyze the fire detection process in a chamber under various fire scenarios. Regardless, there is a need to enhance a perspective for post-fire emergency analysis, which is a core activity during the response and recovery phases of the emergency management cycle.
In addition, simulation models have also been developed to encounter an evacuation problem in various emergencies in the post-emergency activities. For instance, Ding et al. [22] analyzed the evacuation strategies to evaluate a combination of stairs and elevators to evacuate from a high-rise building. Liu et al. [23] proposed the model to analyze the interrelationships between layouts of the classroom and proper migration strategies. Wu and Mizuno [24] developed a dynamic simulation model for large-scale evacuation from an ultra-high-rise building. The crowd dynamic simulation model developed by Chen et al. [25] was proposed to analyze a case study of a subway fire evacuation. Longer evacuation time was found to increase when the level of crowd dispersion increases.
Recent simulation studies have integrated both fire analysis during the preparedness phase and fire evacuation during the response phase of an emergency management cycle. For example, Tang and Ren [26] developed an integrated indoor fire simulation and an evacuation model in which factors related to the building environment are assessed. Furthermore, Yang et al. [27] proposed a fire and evacuation simulation model for subway stations and analyzed the influence of various factors related to an emergency evacuation. The simulation model developed by Tsang et al. [28] was proposed to tackle fire emergency and evacuation strategy in the event of high occupant loads in a rock cavern. Nevertheless, there is a need to include mathematical analysis to incorporate alternatives of assembly points to guide evacuees from inside the building to a safe spot outside.
A research community has suggested that an integration of MCDA tools with other analytical methods is needed [37,38]. In addition, an application in emerging research areas is encouraged. In the research area of emergency management, Marzouk and Al Daour [29] proposed a simulation model to plan for evacuating construction workers under various conditions. The authors applied TOPSIS technique, one of the well-known MCDA tools, to analyze the appropriate construction evacuation options. Regardless, studies applying MCDA tools in the area of emergency management are relatively scarce and integrating MCDA tools with simulation modeling framework has not been found. In particular, we highlight gaps in the existing research and discuss our proposed study as follows.
- Our simulation model assesses the fire emergency during the pre-emergency and evaluates the post-emergency evacuation problem in an integrated way. In addition, fire patterns are analyzed based on different fire locations in the building to estimate the visibility data, which are essential for proper analysis of the evacuation plan.
- There is an increasing trend for models that evaluate evacuee characteristics. In this study, various aspects related to both building and evacuees are analyzed. In particular, different fire perception of evacuees, evacuees with physical disabilities, escape door width, fire locations, and occupancy density are assessed.
- Although simulation models have been proposed for emergency operations, they lack an integrated aspect with MCDA tools. In this study, IEW and TOPSIS techniques are integrated with the proposed simulation model to analyze appropriate assembly points located outside the building.
- In our study, we investigated integrated fire patterns and evacuation modeling using an actual case study of the home appliance factory in which the concrete floor plans and data are verified and validated with the exemplified company.
3. Methodology
3.1. Case Study
We next discuss the case study of a home-appliance factory, which manufactures electrical and electronic products for consumers. In particular, the electrical and electronic industry is considered vulnerable to fire as there is a large quantity of raw materials that are flammable. In addition, the case-study company is selected, given a comparably large size, high number of employees, and availability for data collection. Specifically, the factory layout comprises five main industrial buildings and there are four assembly points located outside the buildings (Figure 1). The three-story building located at the main area (Figure 1a) is used to simulate the fire emergency and evacuation plan in this study. During a regular production time, there are approximately 1000 occupants working in the simulated building. In addition, during an overtime period, an estimated 700 occupants are in the building. Additionally, the peak occupancy period is when intensive meetings and events are organized, in which approximately 1300 people are occupying the building.
In addition, Figure 1b shows the layout of the simulated building, in which the fire emergency occurs. In particular, two fire sources are dispersedly simulated at the first floor and the third floor. That is, shown in Figure 1b, is an area of the first floor with an open ceiling and production machines and flammable materials. In addition, the second fire location is simulated on the third floor near the fire escape route, which will likely affect the fire escape route. Four positions of the possible assembly points are also presented in Figure 1b. Additionally, different location of fire exits of the building are presented in Figure 1c.
3.2. Experiment Design
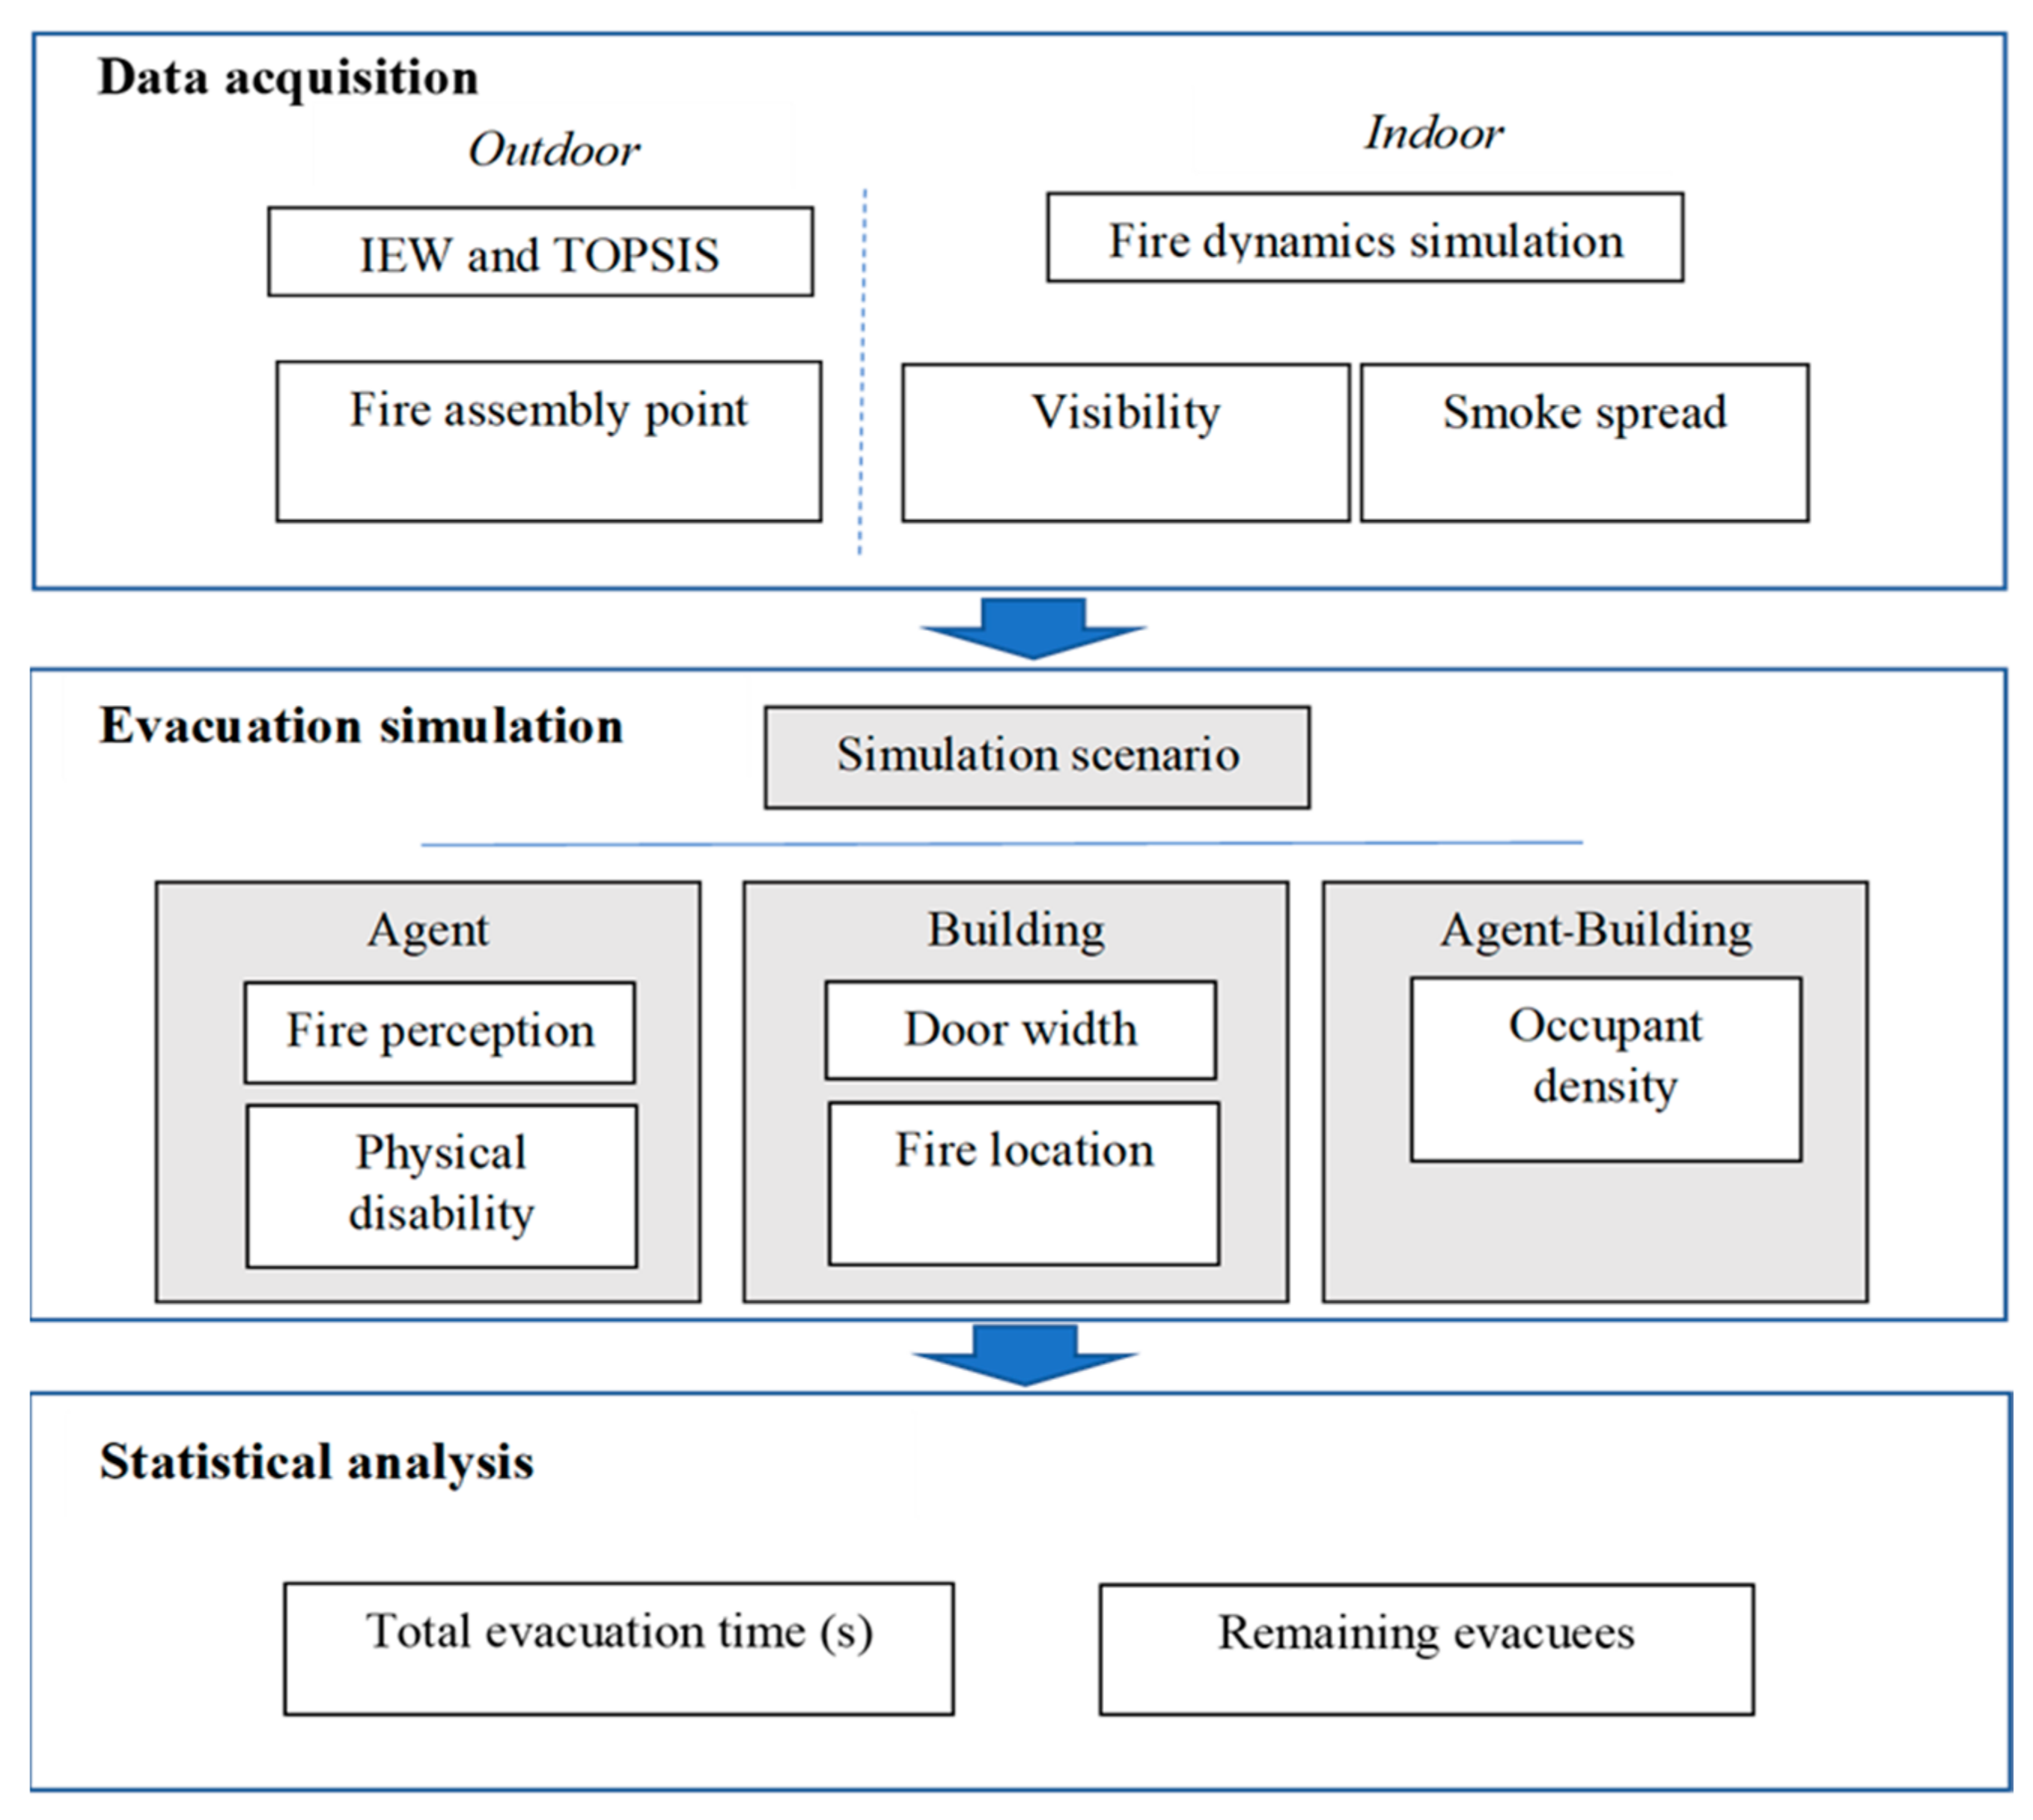
In this study, the experimental plan is conducted as shown in Figure 2. Initially, assembly points are analyzed using IEW and TOPSIS techniques and are later used as the outdoor exit location of the evacuation simulation model. In addition, a fire dynamic simulation model is developed to collect visibility and smoke-spread data from a hypothetical fire emergency in the building. Then, these obtained data are used to compute the speed factor data, which are used as input data for the agent-based evacuation simulation model. In particular, evacuees represent agents in the system, in which the behavior will be observed. Next, the second part of a designed experiment is to develop the evacuation simulation model, in which five main evacuation-related factors are analyzed. In particular, two agent-related factors (i.e., fire perception and physical disability), two building-related factors (i.e., escape door width and fire location), and one more agent factor (i.e., occupancy density) representing an interaction between agent and building characteristics are investigated. Finally, simulation output data related to the total evacuation time and the remaining number of occupants over each period are statistically analyzed.
We next discuss five factors associated with agent and building characteristics as well as related model characteristics as follows (Table 2).
- Fire perception: The first factor is relevant to the awareness of the building evacuee (agent) to the fire emergency. This factor can be used to judge how much information is known to occupants, which is classified into two levels: (1) “100% perception” level implies that all evacuees have a complete acknowledgment of the fire emergency and can respond immediately, which assumes to be within 10 s; and (2) “80% perception” level implies that about 20% of all evacuees lacks data on fire emergency and is assumed to respond after 2 min. In particular, when an occupant is close to the fire area and can easily perceive the fire, he or she will be able to recognize the fire occurrence and respond to the alarm time within 10 s. In contrast, if an occupant stays far away in other areas, delay action may occur and the response time is set to be within 2 min [39].
- Physical disability: This comprises two levels: (1) “No persons with disability” level implies that there are no occupants with disabilities in the building, and (2) “1% with disability” level means that about 1% of occupants use a wheelchair and requires special attention. We used 1% based on the industrial regulation required for people with disabilities [40].
- Escape door width: The escape door pertains to the building characteristic, and we separated this factor into two levels: (1) “80 cm” level is the current width of all the building’s escape doors for the current building, and (2) “110 cm” level implies that the doors’ width is increased to 110 cm to aid occupants during evacuation and to follow recent regulation [41].
- Fire location: This building characteristic represents different locations of fire emergency in the building, which are divided into two levels: (1) “First floor” level is when the simulated fire is reported from the first floor near the inflammable material and (2) “Third floor” level illustrates a simulated fire on the third floor near the sever room. Different fire sources should be chosen for the simualtion model to illustrate the impact of fire source from varied locations [42]. In this study, fire locations are selected based on the discussion with the stakeholders of the case-study company, in which previous accidents had occurred at the case-study building. Additionally, the two chosen fire locations exhibits varied aspects of inflammable material, distance to the escape door, ceilling height, limited area, and possible damage that may occur.
- Occupancy density: This factor is used to illustrate an interaction between the agent and building characteristics in terms of agent density and building usage, which are classified into three levels: (1) “Low density” level represents the condition that the number of building occupants is sparse such as during overtime; (2) “Normal density” level presents the number of building occupants during the regular working time; and (3) “High density” denotes the time that the production is at the full capacity, and the number of occupants is high due to various organized events.
In an initial designed experiment, each factor is independently evaluated for its impact for the evacuation process. That is, the base scenario (i.e., Scenario 0) is when all occupants are assumed to have 100% fire awareness, no occupants with disabilities in the building, the width of all escape doors is 80 cm, the fire origin is reported on the first floor of the building, and a normal density of occupants with 1000 evacuees. Next, six scenarios are independently compared with the base scenario in which each factor is analyzed as shown in Table 3. That is, the first, second, and third scenarios illustrate when fire perception, physical disability, and the escape door width are evaluated. In addition, the fourth and the fifth scenarios illustrate when the occupant density is at low and high density, respectively. Additionally, the sixth scenario shows the impact of replacing the fire location from the first to the third floor. For each scenario, 10 trials are run, and the average total evacuation time and the average number of remaining occupants are analyzed. Then, all the key factors are to be further simultaneously evaluated using factorial design to understand the interaction among factors.
3.3. Analysis of Fire Assembly Point Using IEW and TOPSIS
We next discuss the selection problem of fire assembly points for the home appliance factory, which will be later used to verify and validate the proposed simulation model. There are various criteria concerning a decision to choose fire assembly points, [43,44] which may conflict with each other. Thus, the selection problem for fire assembly points can be considered a type of MCDA problem. Initially, we analyzed criteria associated with a decision to select assembly points using the IEW technique. Then, the obtained weights are combined with the TOPSIS technique to analyze alternatives of the assembly points.
3.3.1. IEW Technique
Criteria analysis can be conducted using a number of analytical methods to obtain relative weights. Typically, subjective opinions from the decision maker may be evaluated and analyzed with common MCDA tools such as Borda Count and Analytic Hierarchy Process (AHP) [45]. However, expert judgment may be sensitive to the interpretation of an individual decision maker. In contrast, the IEW technique can be used to determine the relative weights by using existing data and is, thus, employed in this study [46,47]. We next discuss the IEW method shown in Equations (1)–(4).
Step 1: Scale a normalize decision matrix called a projection value () in which is decision-making information for alternative i with respect to criterion j (Equation (1)).
Step 2: Compute the Entropy value (e) for each criterion j, where is a number of alternatives as shown in Equation (2).
Step 3: Compute the degree of divergence () for each criterion j (Equation (3)), which represents information concentration. In particular, the higher the degree of convergence, the more important the criterion being considered.
Step 4: Compute the relative weight of each criterion j as shown in Equation (4).
3.3.2. TOPSIS Technique
The TOPSIS technique is based on the concept that the chosen alternative should have the shortest geometric distance from the positive ideal solution (PIS) and the longest geometric distance from the negative ideal solution (NIS) [48,49]. In particular, PIS (NIS) is an alternative that has the best (worst) score among all considered criteria. The TOPSIS method is further elaborated in Equations (5)–(12).
Step 1: Create a decision-making matrix and then normalize the matrix () by scaling data to be unitless, which will be later used to compare different data between criteria (Equation (5)).
Step 2: Based on the relative weight obtained from Equation (4) and the normalized scale in Equation (5), compute the weighted normalized decision matrix () as shown in Equation (6)
Step 3: Compute the PIS and NIS values, which are shown as and in Equations (7) and (8), respectively. In addition, set () is the set of criteria having a positive (negative) impact, in which a higher (lower) value is desired.
Step 4: Compute the separation measure for each alternative, where () is the separation measure from the PIS (NIS) as shown in Equations (9) and (10), respectively.
Step 5: Compute the relative closeness () value that approaches the best alternative as shown in Equations (11) and (12). In particular, the resulting value will be between 0 and 1, where 0 (1) represents the alternative solution that has the worst (best) condition. That is, 0 (1) implies that the solution has the longest (shortest) distance from PIS and shortest (longest) to NIS.
3.3.3. Analysis of Assembly Points
An analysis of assembly points using an integrated IEW and TOPSIS technique is next discussed. According to [43,44], at least two assembly points should also be allocated for an emergency management in the event of a possibly inaccessible location. In this case study, there are four alternatives for assembly points surrounding the home appliance factory (Figure 1b), which are (1) the front of the factory, (2) the canteen area near the guardhouse, (3) the bus parking area, and (4) the back area near the warehouse. In addition, the locations of the three main flammable sources, a medical room, and associated road directions are shown within the factory area.
Next, seven criteria used in the analysis of the assembly point are labeled A to G, where A is the distance between the simulated fire source and each assembly point (meter), B is the capacity of each assembly point (square meter), C is the distance from the closest flammable source to each assembly point (meter), D is the distance between an exit outside the factory and each assembly point (meter), E is the width of the internal road to the assembly point (meter), F is the number of evacuation routes connected to each assembly point (meter), and G is the distance between the medical room and each assembly point (meter). Obtained data for each alternative i and criterion j are presented in Table 4. Taking the first alternative of assembly points located in front of the factory, for instance, the distance between the simulated emergency building and this location is 350 m. In addition, this location secures a capacity of 1500 m2 with a 130 m distance from the flammable point. The distance between an exit from the factory area and this assembly point is also found to be 60 m with a width of 8 m for the roadway. There are also two evacuation routes connected to this location, and the distance to the medical room is found to be 250 m.
Analyzed results obtained from the IEW technique are shown in Table 4. In particular, the first three most important criteria are found to be Criterion D (0.50), Criterion C (0.15), and Criterion G (0.13). Next, TOPSIS analysis is conducted and the values for and are obtained to compute the relative proximity () for each alternative of the assembly point (Table 5). Then, all alternatives can be ranked, such that the best location of an assembly point is found to be at the canteen near the guardhouse (i.e., Location 2 with of 0.91), followed by the front of the factory (i.e., Location 1 with of 0.87), the bus parking area (i.e., Location 3 with of 0.44), and the back area near the warehouse (i.e., Location 4 with of 0.02). Thus, the assembly point at the canteen near the guardhouse will be used to verify and validate the developed evacuation simulation model.
4. Simulation Model and Results
We next present our proposed simulation model using integrated FDS and agent-based evacuation modeling for the home appliance factory. Initially, the FDS model is developed using the interface of PyroSim program. Then, given the visibility and smoke impact from the fire emergency and desired location of the assembly point, the proposed evacuation simulation model is developed using the PathFinder program.
4.1. Fire Simulation Model
4.1.1. Fire Location and Design
The fire emergency is simulated for two fire locations to assess the severity of the simulated fires. In this study, Polyurethane reaction is considered, which is a typical fuel type found in the case-study building. Moreover, the mesh size is computed following the user guide for FDS [50]. That is, the characteristic fire diameter () is presented in Equation (13), where is the heat release rate (kW), is the density (kg/m3), is the specific heat of gas (kJ/kg.K), is the ambient temperature (K), and is the acceleration of gravity (m/s2). In particular, the smaller the characteristic fire diameter, the smaller the cell size should be to adequately resolve the fire dynamics. Then, the mesh cell size is estimated from the computed characteristic fire diameter, which is found to be 0.11 m for fine cell size and 0.44 m for coarse cell size, respectively. According to Degler et al. [51], setting fine cell size for all grids may take much longer run time. Thus, the multiple mesh is set in this study with approximately 7 million grid cells. That is, approximately 90% of all cells are cells that far from the fire source, and thus are set to coarse cell size with the size of 0.4 × 0.4 × 0.4 m. In contrast, the less of all cells near the fire source are set to fine cell size with the size of 0.1 × 0.1 × 0.1 m.
In addition, the fire scene building of the case study consists of several zones in which the first-floor area with an open ceiling and the three-story area (Figure 1b) are used to simulate fire sources. These two areas are also connected with a common roof of the entire building. The aim of the proposed fire simulation model is to analyze the fire dispersion and movement of smoke over time and the effect of fire on the visibility and movement of evacuees. The first location of the simulated fire source on the first-floor area is located approximately in the middle of the production building of the case study, in which machines are operated for plastic injection. In addition, nearby fire source operations and materials are inclusive of the stamping operation, raw materials warehouse, and metal folding parts. Since the first floor area is well ventilated and has an open ceiling, good smoke distribution from the fire is expected. In contrast, the second location of the fire source simulated on the third floor of the three-story production building is hypothesized to ignite at the server room located at the corner of the building. Thus, given the limited area of the room and a low ceiling, smoke is likely to be denser and affect the evacuation time for occupants, especially those residing on the third floor.
4.1.2. Fire Simulation Result
The spread of smoke from fire based on the simulated fire simulation model for both the first and third floor locations of the building is comparatively shown in Figure 3. Clearly, the smoke spread at different periods will adversely impact the visibility and movement of evacuees. The fire smoke occurred at the first position (i.e., the first floor area in the middle of the production building) and spread over time (Figure 3a–d), limited only at the site of the incident during the first 10 s (Figure 3a). After 200 s (3.3 min), smoke spread further and filled the plastic injection department (Figure 3b). Figure 3c shows that the smoke begins to spread from the plastic injection department to the raw material warehouse area after approximately 400 s (6.6 min). Finally, after around 600 s (10 min), smoke spread to both the raw material warehouse and the metal folding area (Figure 3d).
Considering that the smoke spread over time from the second position of the third floor layout ignited at the server room (Figure 3e–h), the smoke spread is limited only in the server room after 10 s (Figure 3e). Then, the smoke started to spread to adjacent rooms, corridor, and the staircase after 200 s (3.3 min) (Figure 3f). After approximately 400 s (6.6 min), the smoke spread further in other meeting rooms (Figure 3g). Finally, after 600 s (10 min), the smoke covered most of the office and meeting rooms. In addition, the spread of smoke also covered over 95% of the floor of the incident and found in other floors (Figure 3h).
Given the fire characteristics and smoke pattern of both fire locations, the smoke spread from the first fire source is mainly limited at the ground level. Although the distribution of smoke is also found in other rooms, the smoke observed is light due to the height of the room. Thus, a wide area of space will benefit evacuees to evacuate properly from the fire. On the other hand, the smoke spread observed from the second fire source was found to be heavily distributed in the hallway, the staircases, and other rooms. As a result, the fire ignited at the server room of the third floor will likely more affect evacuees compared with the first case due to the condition of the area and a low ceiling.
In addition, the risk curve is constructed based on the visibility data, given smoke generated from fire as shown in Figure 4. In particular, different detectors are equipped in the developed model for varied areas close to the fire source to detect the visibility level over time, which is affected by a smoke distribution. As seen in the figure, the visibility range for fire case 1 (first-floor) starts to drop below 30 m at about 170 s, continue to drop below 5 m at about 280 s, and reach below 3 m at about 440 s. In contrast, the visibility range for fire case 2 (third-floor) immediately drops below 3 m within 80 s. Thus, an increased risk is observed for the fire case 2. We note that the visibility data are later used to assess each evacuee’s speed factor in the evacuation simulation model, in which the agent movement and chosen evacuation routes will be determined based on the fire effect. In this study, the evacuee speed is computed from Equation (14) following an analysis from Fridolf et al. [52], where denotes the visibility data obtained from the visibility measurement device.
4.2. Evacuation Simulation Model
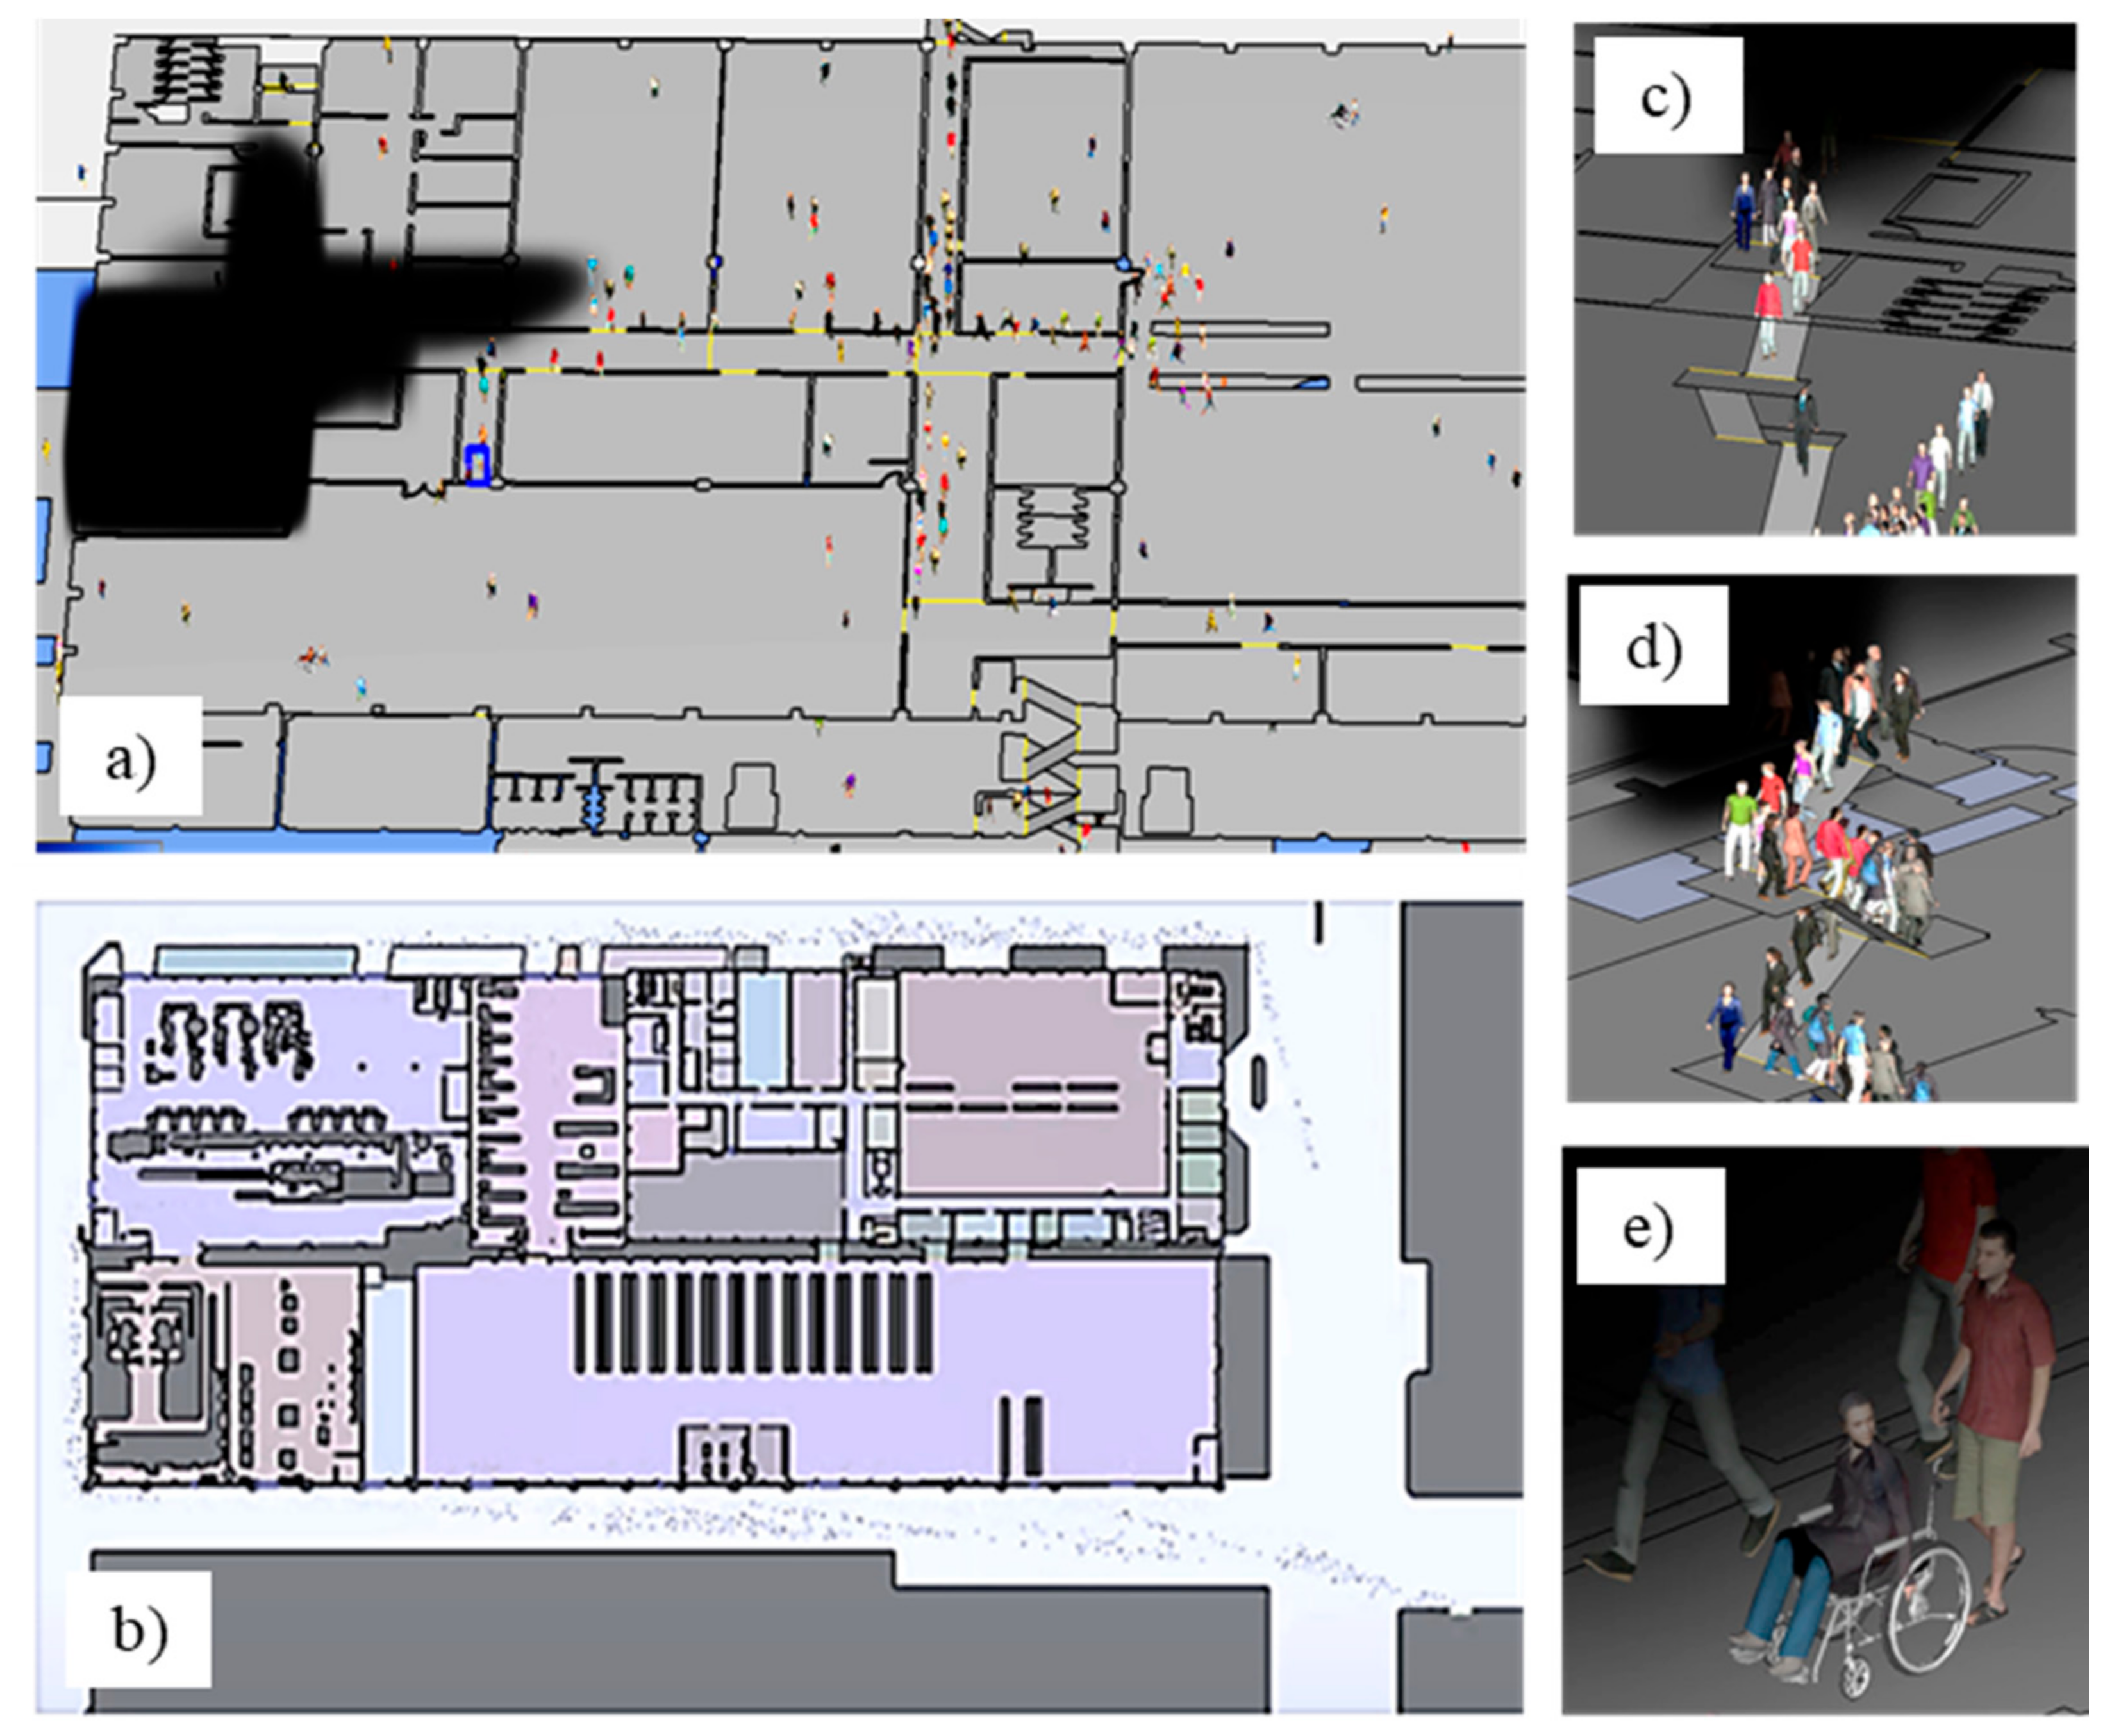
The fire smoke and visibility data from the FDS model as well as the analyzed assembly point from the MCDA analysis are further used coupled with the evacuation simulation model. In particular, the evacuees from the building will find escape routes from the building leading to the safe assembly point outside the building. The model is further verified by exploring model behavior from running the simulation model [53,54,55,56,57,58] (Figure 5). In particular, Figure 5a,b show the evacuation inside and outside the simulated building. In addition, Figure 5c–e illustrate the agent–building interactions with using door, stair, and wheelchair, respectively. Next, the outcomes from the evacuation model are collected to validate the model for the total evacuation time and the remaining evacuee for each period.
4.2.1. Assumptions for the Evacuation Model
In this study, assumptions concerning the developed simulation model for the evacuation problem are as follows.
- This study employs the two-phase evacuation process with the indoor evacuation and outside the building. The first phase is concerned with the indoor evacuation to exemplify the post-emergency planning, while the second phase is to illustrate the connection to the planned assembly point during the pre-emergency planning.
- During the indoor evacuation, an evacuee will attempt to find the nearest fire door first to quickly exiting the building after experiencing the fire. However, the choice of exit door will be affected by the fire smoke incurred in the building. That is, the speed factor of an evacuee will be affected by the fire smoke, in which he or she may switch to another exit door that is farther away if a near exit is heavily influenced by smoke.
- During the outdoor evacuation, an evacuee will take the shortest path to reach the outdoor assembly point after exiting the case-study building. An evacuee, who leaves via the exit door of the building, will not walk into the building again even though cutting through the building is a closer route to the assembly point.
- The analyzed assembly point during the pre-emergency planning will be set as a final exit of an evacuee after evacuating the building. Although the risk from fire is not considered for evacuation outside the building, the choice of building’s exit door of an evacuee due to fire smoke will eventually affect the time to travel to the planned assembly point. Thus, the total evacuation time of an evacuee from the initial position inside the building to the outdoor assembly point will be analyzed.
4.2.2. Total Evacuation Time
We next discuss the total evacuation time, which is computed from the time that the last evacuee can reach the outdoor assembly point through the two-phase evacuation process—inside and outside the building. In particular, an evacuee will evacuate from the building given the post-emergency from fire. Then, he or she will continue to travel to the planned assembly point analyzed during the pre-emergency planning. That is, initial conditions are set following the base scenario to evaluate the impact of total evacuation time to varied locations of assembly points (Table 6). The average data from total evacuation time show that evacuees will reach the assembly point 2 (i.e., 471.4 s) first, followed by the assembly point 3 (i.e., 543.1 s), the assembly point 4 (550.1 s), and the assembly point 1 (609.6 s), respectively. Compared to the results obtained from the integrated IEW and TOPSIS, the first ranked assembly point is found to be the same at the assembly point 2. Thus, this assembly point is further used for the analysis. It is worth noting that the ranked lists differ due to various factors being considered in the analysis of both the MCDA and simulation approaches.
Additionally, the average data for total evacuation time are analyzed for all six scenarios in the designed experiment as presented in Table 7. Simulation results show that the mean total evacuation time for scenario 0 is 471.4 s with a standard deviation of 13.2 s. Next, the average total evacuation time of the last evacuee for scenarios 1, 2, and 5 is found to be longer than the base scenario (i.e., 544.9, 513.8, and 497.6 vs. 471.4), whereas the time for scenarios 3 and 4 are found to be shorter than the base scenario (i.e., 447.6 and 384.6 vs. 471.4). The analyzed result in scenario 6 shows that the total evacuation time based on the last occupant is longer than the base scenario with an expected value (standard deviation) of 489.8 (18.9) seconds. Although evacuees at other floors can evacuate more quickly from the building, fire from the third floor will cause a delay to evacuees as shown by the longer mean total evacuation time. Thus, the longer total evacuation time from the fire source on the third floor poses more harm and should be handled properly, which will be further evaluated next.
4.2.3. Remaining Evacuees
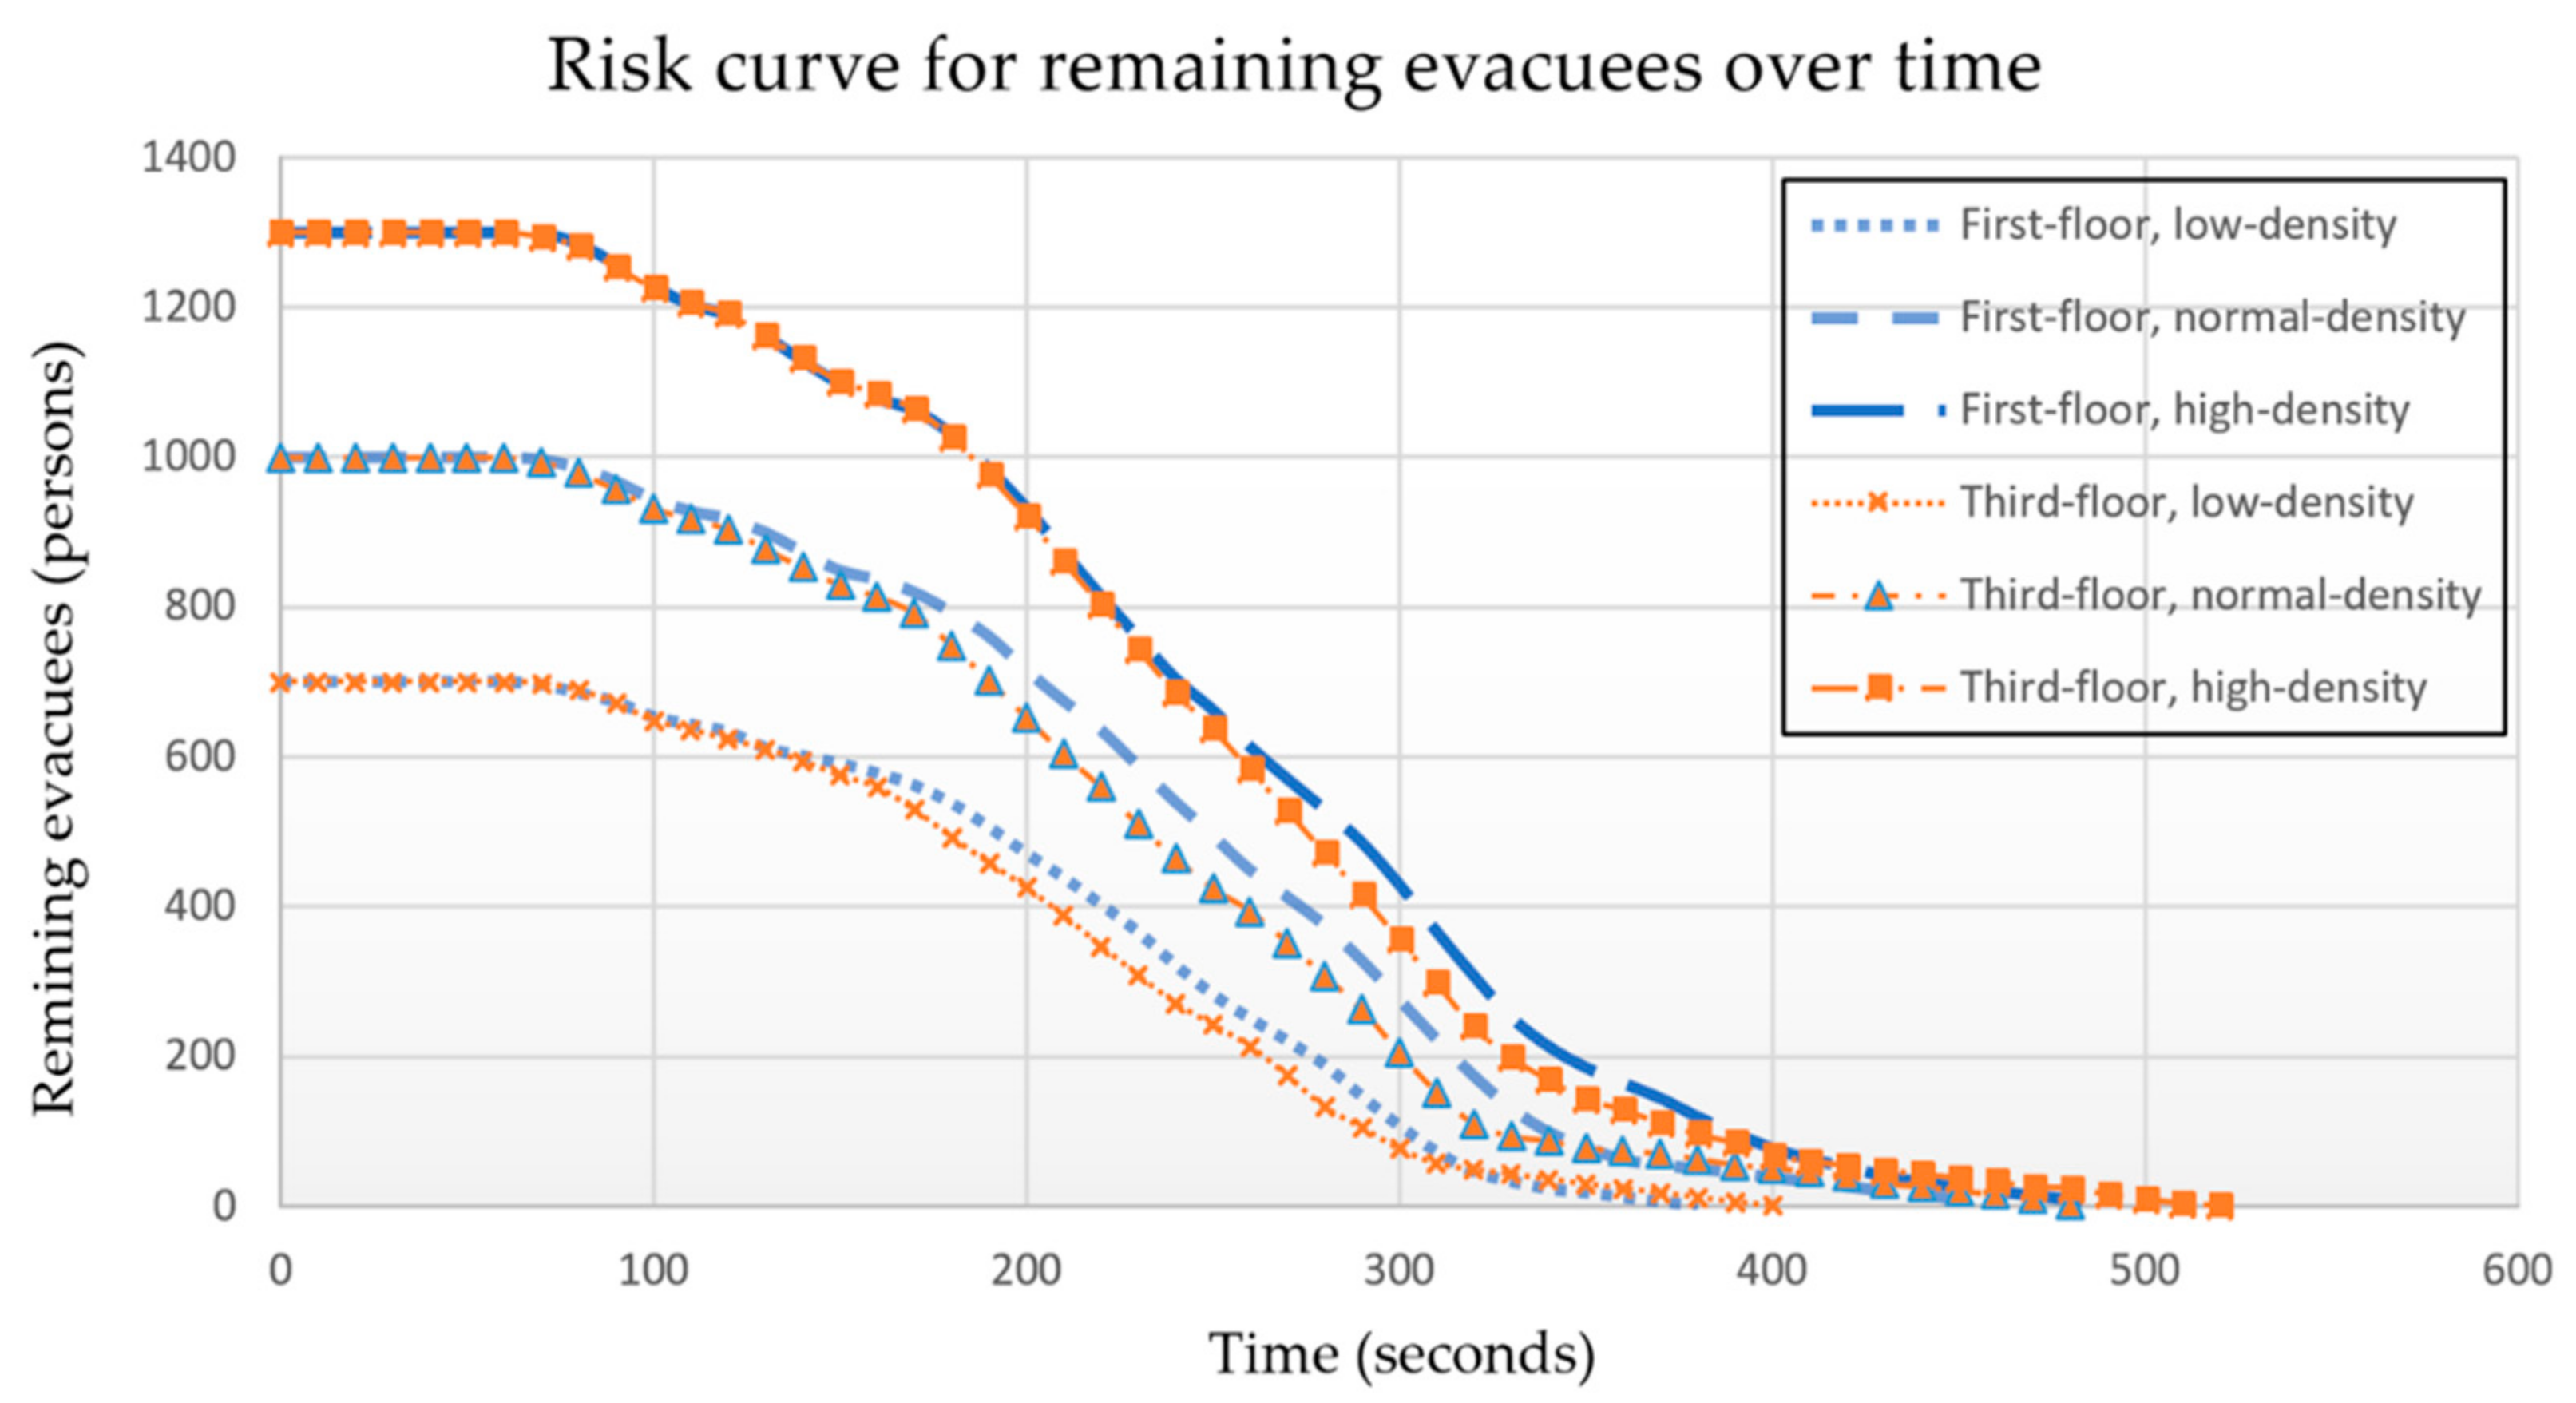
We next analyze the remaining evacuees as illustrated in Figure 6. In particular, Figure 6 shows the risk curve resulting from varied evacuee density and fire positions over time following the designed experiment. Analyzed results show that at approximately 50% of the remaining evacuees, the number of remaining evacuees is higher for the first-floor fire. In contrast, all the evacuees can safely leave the building faster in the case of the first-floor fire. This observation suggests that when the fire occurs at the third floor, evacuees residing at the first and second floors of the building can evacuate quickly. However, the last group of evacuees residing at the first floor will take longer time.
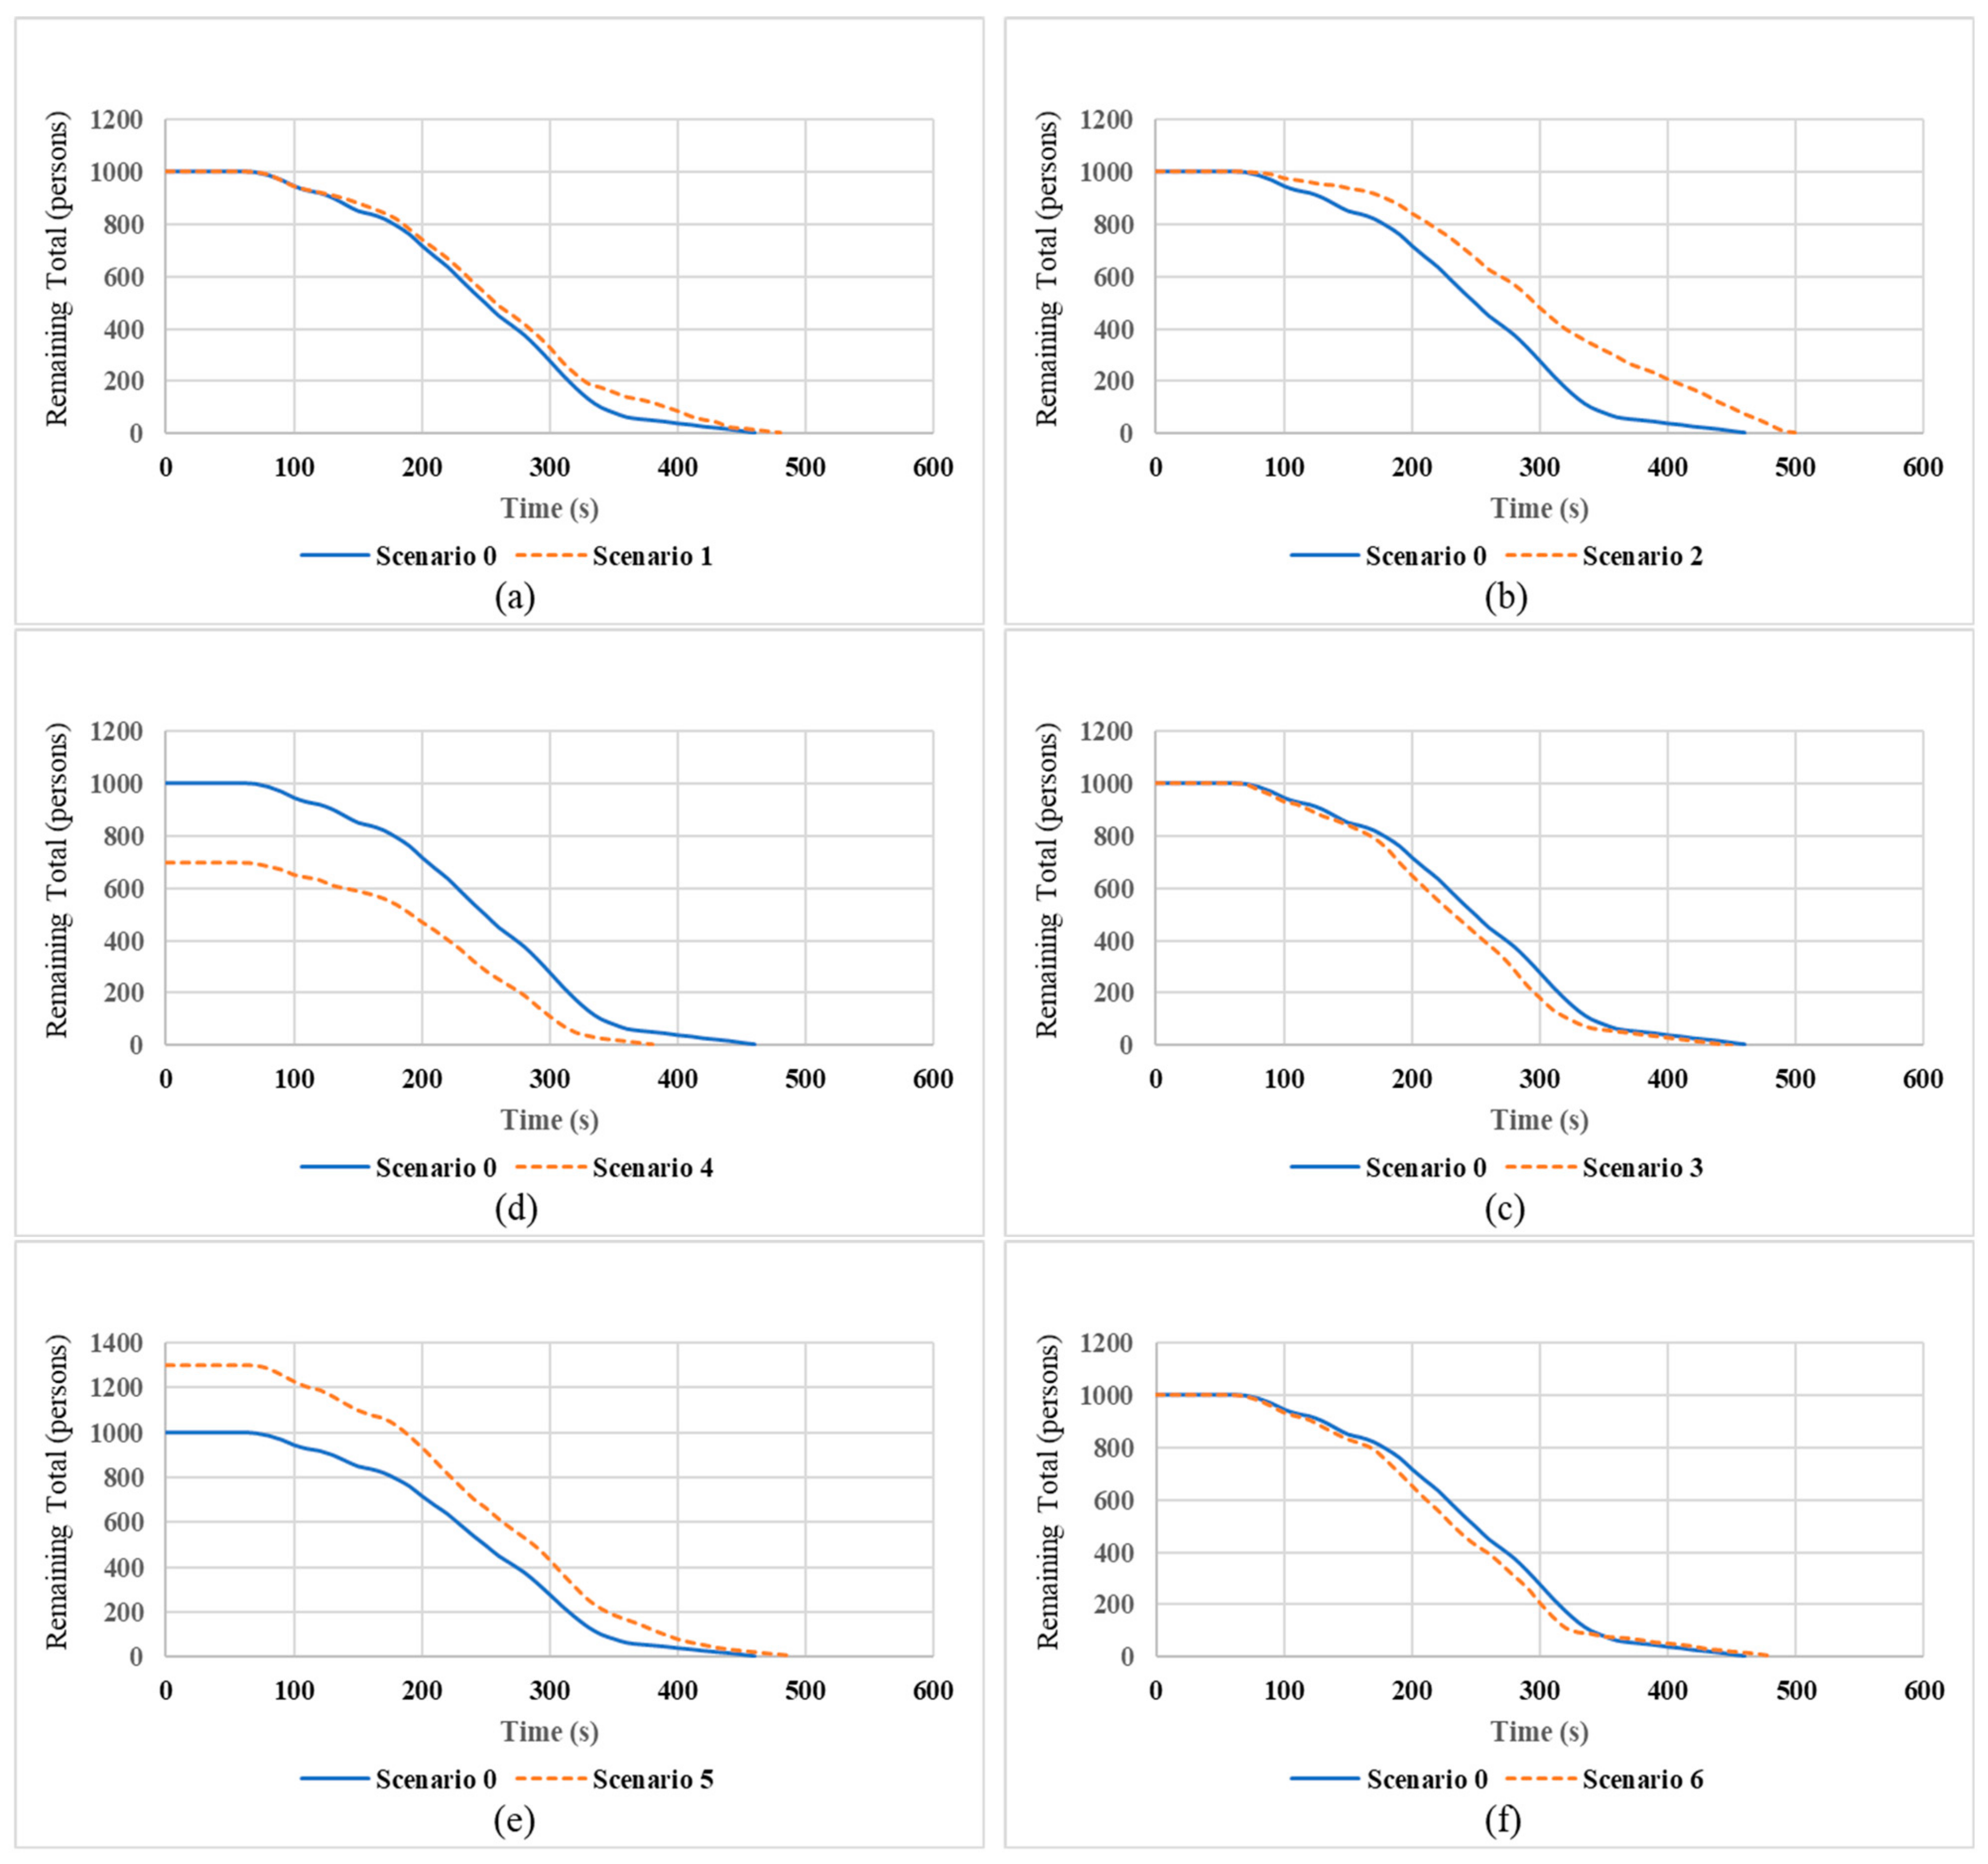
In addition, the average remaining evacuees are also analyzed by comparing each experimental scenario with the base scenario (Figure 7). Figure 7a shows a comparison of the remaining evacuees between scenario 1 (i.e., 80% perception) and the base scenario (i.e., 100% perception). Fifty percent of the evacuees from scenario 0 can evacuate at around 250 s, which is faster than from scenario 1. In addition, all the evacuees can safely leave the building after 460 s, implying that evacuees with a better fire perception level will be able to evacuate from the area faster. Next, when comparing the base scenario with scenario 2 (i.e., 1% with disability), the remaining evacuees with persons with disability are left with 50% of all evacuees at 290 s, which is much longer than the base scenario (Figure 7b). The impact of the escape door width is also illustrated in scenario 3 (i.e., 110 cm) in which 50% of all evacuees can evacuate faster after 230 s (Figure 7c).
Next, both scenarios 4 (Figure 7d) and 5 (Figure 7e) illustrating the case of 700 evacuees and 1300 evacuees confirm that a lower density of evacuees requires a shorter time to evacuate 50% (i.e., 190 s), whereas a higher density of evacuees will take a longer time (230 s). Finally, scenario 6 (Figure 6f) shows a fluctuating pattern when the impact from the fire location is evaluated. Although 50% of all evacuees in scenario 6 can safely evacuate at 230 s, the last evacuee from scenario 6 takes a longer time (480 s) than the base scenario.
4.3. Statistical Analysis
Initial ANOVA analysis of the designed experiment with a statistically significant difference of 0.05 shows that all factors related to the number of evacuees with low fire perception levels, the escape door width, and the varied occupant density are significantly different from the time required in the base scenario. The total evacuation time when the fire source is at the first floor (i.e., fire case 1) is also significantly less than if it is at the third floor (i.e., fire case 2).
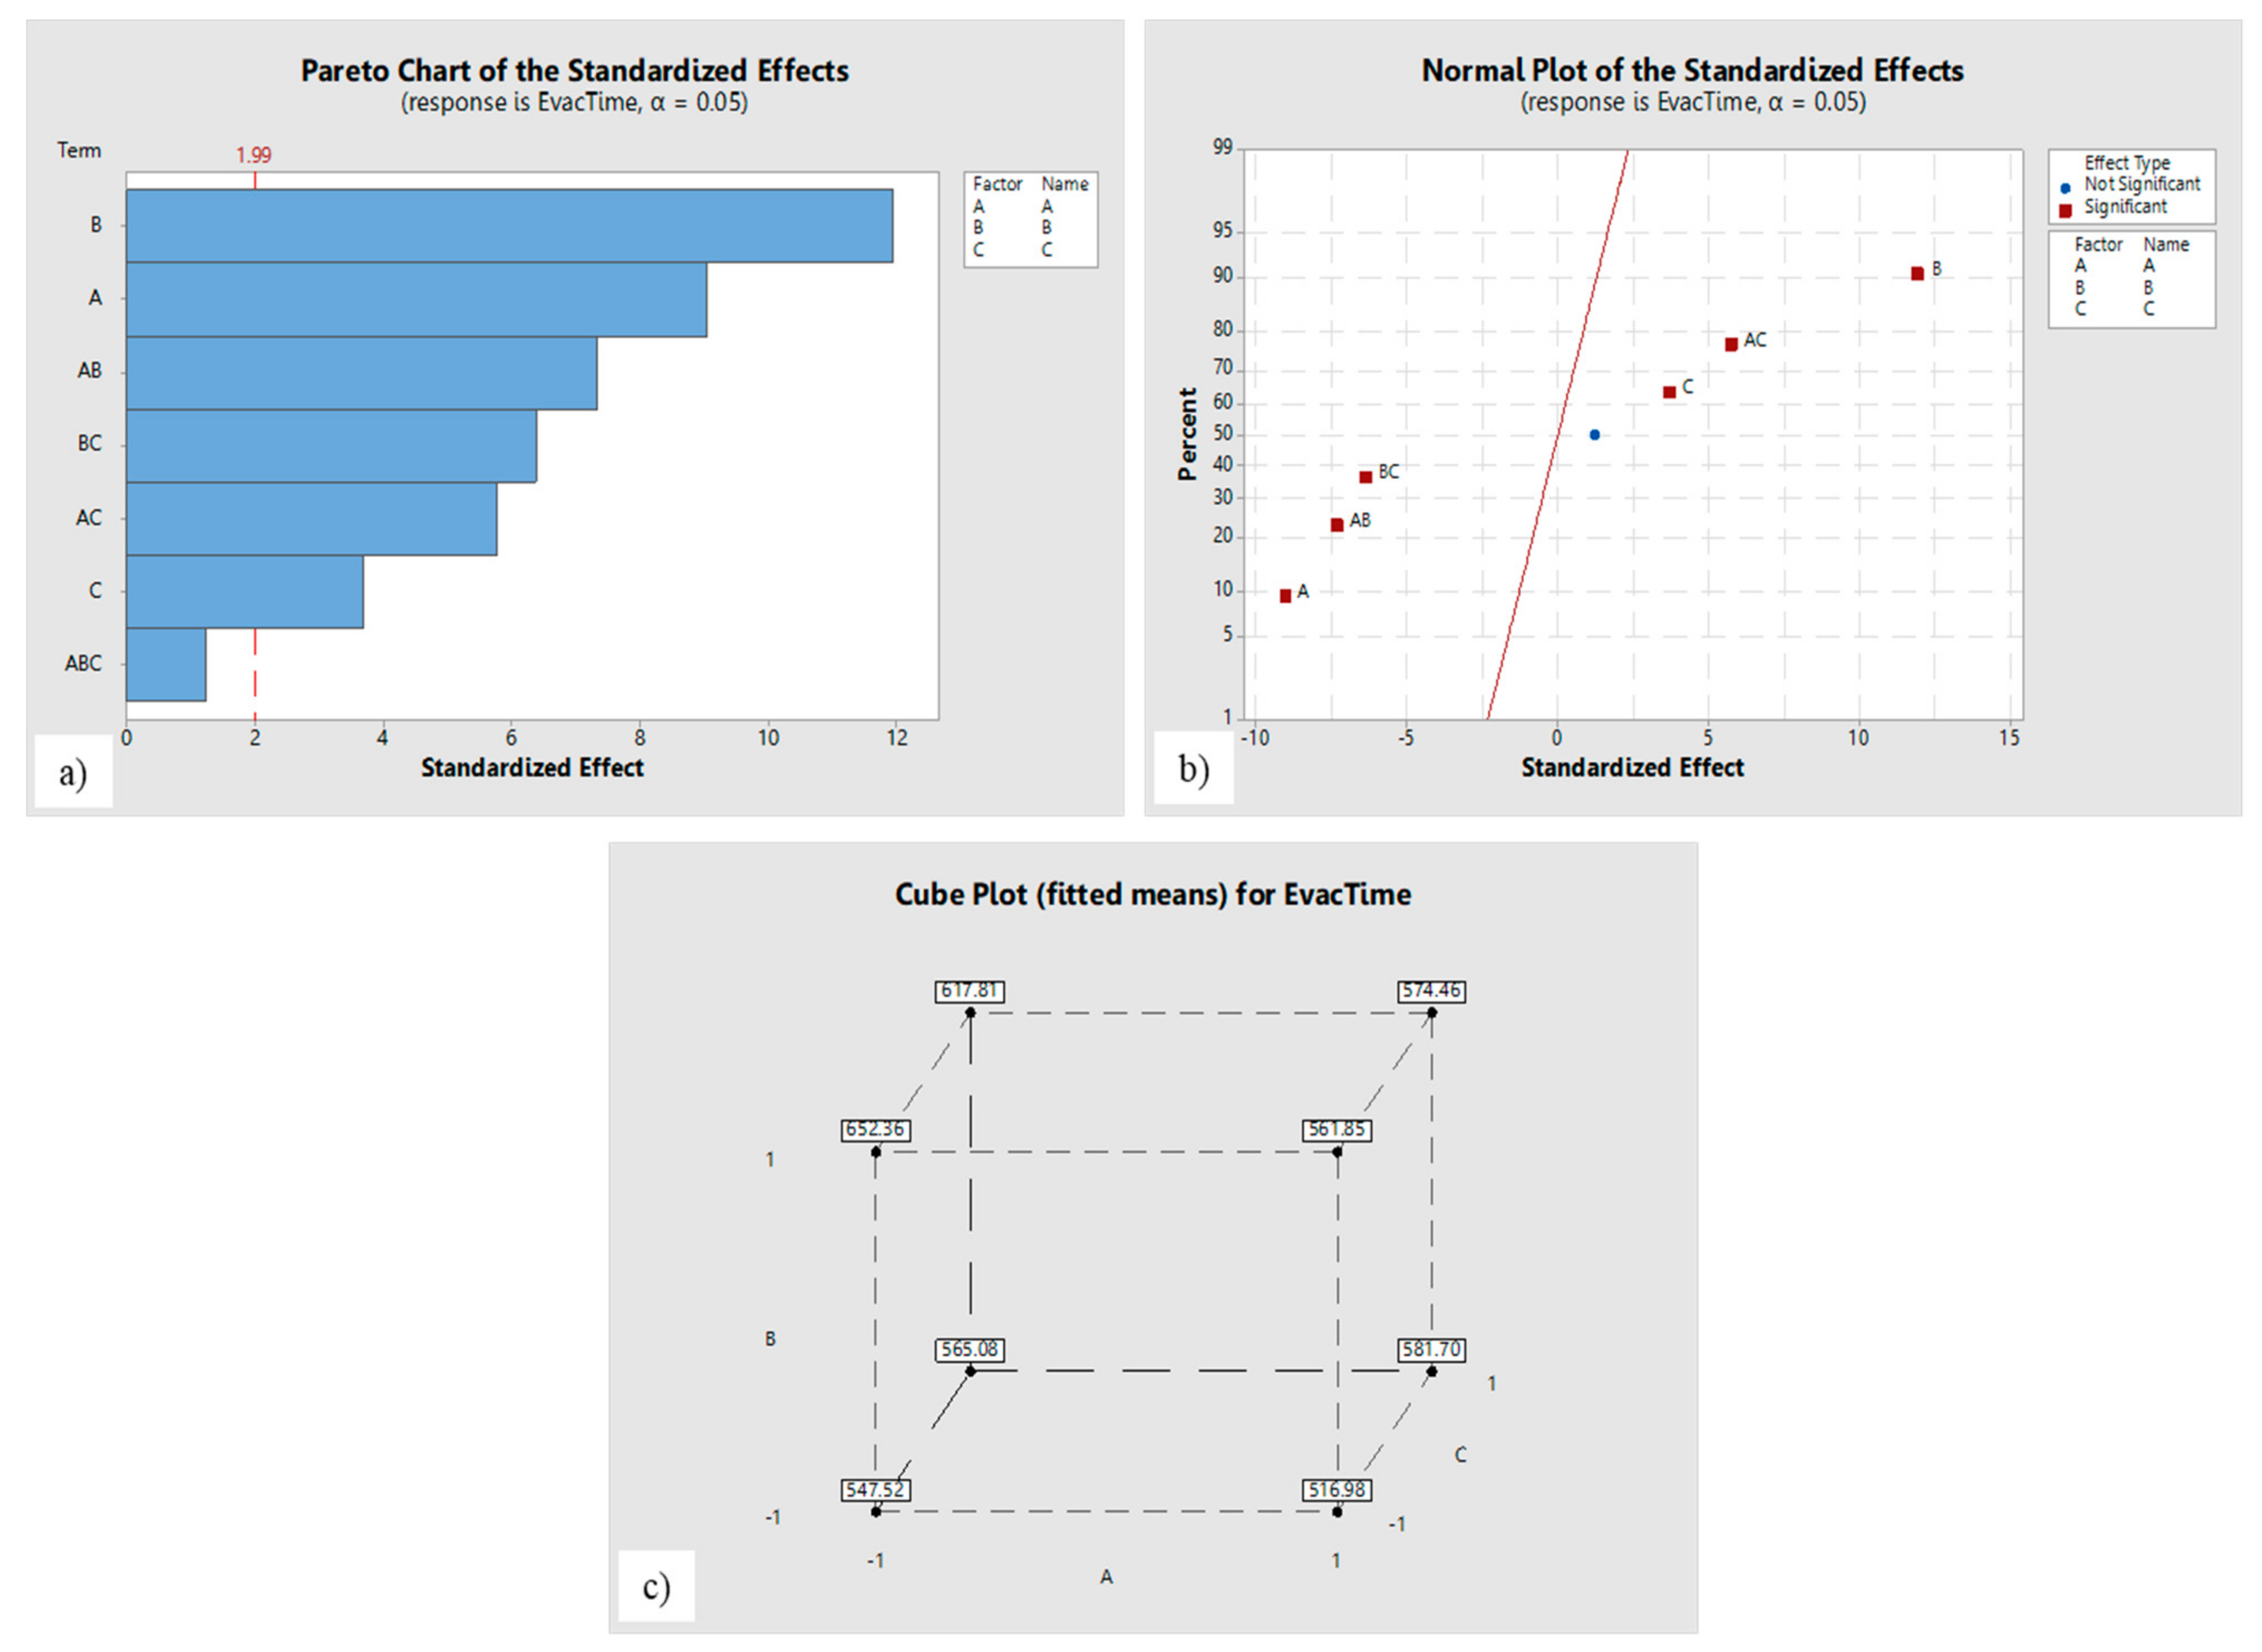
We further analyze the full factorial design with interactions for the total evacuation time based on the worst-case scenario of high-density evacuees and fire source at the third floor as shown in Table 8. That is, when the fire perception (i.e., factor A), the physical disability (i.e., factor B), and the door width (i.e., factor C) are simultaneously investigated; the results show that these factors are statistically significant. In addition, the interactions among the pair of fire perception and physical disability, the pair of fire perception and door width, and the pair of physical disability and door width are found to be statistically significant (Figure 8). That is, Figure 8a,b illustrate the Pareto chart and the normal plot for the effects, respectively. In addition, Figure 8c presents the cube plot showing the interactions of factors that affect the total evacuation time. Finally, the regression model is analyzed as shown in Equation (14) with the R-square of 83.61% to aid prediction of the total evacuation time under worse-case scenario of the fire emergency.
5. Conclusions and Future Research
Existing models in the fire emergency management are scarce and often lack an integrated perspective. In this research, the integrated IEW and TOPSIS technique was initially proposed to analyze the best location of an assembly point under multiple criteria. An analysis of the fire assembly point shows that the most preferred assembly point in this case study is the canteen area near the guardhouse. A selected assembly point was later used to verify and validate the simulation model to evacuate occupants from the building to the safety of the outside. In addition, the FDS model was also developed to model fire emergency, and the results are integrated into the agent-based model to analyze evacuation planning. Important factors for evacuation planning based on fire perception, physical disability, fire location, the width of the escape door, and occupancy density were also analyzed.
An analysis of our designed experiment was performed for different scenarios, and key outputs were obtained for the total evacuation time of the last evacuee and the remaining evacuee for each period. Under different fire sources, the fire ignited at the room on the third floor near the main corridor appears to affect evacuees, especially those who reside on the third floor. The smoke in the area will affect the visibility of occupants, which will essentially impact not only the speed of evacuees but also a redirection of evacuees toward a more smoke-free route. Simulation results are also concerned with a certain degree of uncertainty. Thus, statistical analysis is needed to confirm the confidence in interpreting results obtained from the simulation model. In this study, Analysis of Variance (ANOVA) is used for such purpose. In particular, statistical analysis using factorial design confirms that enhancing the escape door width will result in a faster evacuation time. Ensuring the fire perception of all evacuees also helps speed the time for evacuation. Furthermore, planning for evacuating persons with disability also require more time, which should be properly managed.
This study provides a practical case study for fire-emergency management. However, a number of future research directions are further suggested. Experimental plans can be enhanced to incorporate diverse mitigation policies. For example, it is interesting to explore how evacuation scenarios can be designed and adjusted to assess other possible fire locations in the building. In addition, other modeling aspects, such as the external wind condition may also be included and analyzed in the future. It is also interesting to evaluate pre-emergency mitigation strategies (e.g., smoke detector system, fire sprinkler system, and support of the fire department) and further integrate with the post-emergency planning. Additionally, possible risk factors concerning the outdoor evacuation may also be incorporated to evaluate evacuation behavior and safety outside the building. Finally, a combination of decision-making tools to assist in evaluating evacuation policies as well as various commercial software that support both fire and evacuation analysis may also be a subject of future studies.
Author Contributions
W.C. contributed to the model development, analysis of the results, and writing of the manuscript. K.R. verified the model and results as well as supervised the project. All authors have read and agreed to the published version of the manuscript.
Funding
This research received no external funding.
Institutional Review Board Statement
Not applicable.
Informed Consent Statement
Not applicable.
Data Availability Statement
Data available on request.
Acknowledgments
The authors are grateful and would like to thank the three anonymous reviewers for their valuable comments and suggestions that help us to improve our research presentation.
Conflicts of Interest
The authors declare no conflict of interest.
References
- Federal of Emergency and Management Agency. U.S. Fire Statistics. Available online: https://www.usfa.fema.gov/data/statistics/ (accessed on 10 February 2020).
- Kasereka, S.; Kasoro, N.; Kyamakya, K.; Goufo, E.F.D.; Chokki, A.P.; Yengo, M.V. Agent-Based Modelling and Simulation for evacuation of people from a building in case of fire. Procedia Comput. Sci. 2018, 130, 10–17. [Google Scholar] [CrossRef]
- Brushlinsky, N.N.; Ahrens, M.; Sokolov, S.V.; Wagner, P. World Fire Statistics. In Center of Fire Statistics; National Committee CTIF of Germany: Berlin, Germany, 2016. [Google Scholar]
- Alexander, D.E. Principles of Emergency Planning and Management; Oxford University Press on Demand: Oxford, UK, 2002. [Google Scholar]
- McLoughlin, D. A Framework for Integrated Emergency Management. Public Adm. Rev. 1985, 45, 165. [Google Scholar] [CrossRef]
- Ransikarbum, K.; Mason, S.J. Multiple-objective analysis of integrated relief supply and network restoration in humanitarian logistics operations. Int. J. Prod. Res. 2016, 54, 49–68. [Google Scholar] [CrossRef]
- Ransikarbum, K.; Mason, S.J. Goal programming-based post-disaster decision making for integrated relief distribution and early-stage network restoration. Int. J. Prod. Econ. 2016, 182, 324–341. [Google Scholar] [CrossRef]
- Kincaid, J.P.; Hamilton, R.; Tarr, R.W.; Sangani, H. Simulation in Education and Training. In Applied System Simulation; Springer: Boston, MA, USA, 2003; pp. 437–456. [Google Scholar]
- Mawhinney, J.R. Fixed Fire Protection Systems in Tunnels: Issues and Directions. Fire Technol. 2013, 49, 477–508. [Google Scholar] [CrossRef]
- Kironji, M. Evaluation of Fire Protection Systems in Commercial Highrise Buildings for Fire Safety Optimization: A Case of Nairobi Central Business District. Int. J. Sci. Res. Publ. 2015, 5, 1–8. [Google Scholar]
- Mróz, K.; Hager, I.; Korniejenko, K. Material Solutions for Passive Fire Protection of Buildings and Structures and Their Performances Testing. Procedia Eng. 2016, 151, 284–291. [Google Scholar] [CrossRef] [Green Version]
- Tomar, M.S.; Khurana, S. Impact of passive fire protection on heat release rates in road tunnel fire: A review. Tunn. Undergr. Space Technol. 2019, 85, 149–159. [Google Scholar] [CrossRef]
- Rahardjo, H.A.; Prihanton, M. The most critical issues and challenges of fire safety for building sustainability in Jakarta. J. Build. Eng. 2020, 29, 101133. [Google Scholar] [CrossRef]
- Raja Prasad, S.V.S.; Prasad Rao, Y.V.S.S.S.V. Optimization of Emergency Management System in a Construction Organization in India. Int. J. Res. Ind. Eng. 2012, 1, 26–38. [Google Scholar]
- Unal, M.; Uslu, C. Gis-Based Accessibility Analysis of Urban Emergency Shelters: The Case of Adana City. Int. Arch. Photogramm. Remote. Sens. Spat. Inf. Sci. 2016, 42, 95–101. [Google Scholar] [CrossRef] [Green Version]
- Hoscan, O.; Cetinyokus, S. Determination of emergency assembly point for industrial accidents with AHP analysis. J. Loss Prev. Process. Ind. 2021, 69, 104386. [Google Scholar] [CrossRef]
- Şenik, B.; Uzun, O. An assessment on size and site selection of emergency assembly points and temporary shelter areas in Düzce. Nat. Hazards 2021, 105, 1587–1602. [Google Scholar] [CrossRef]
- Deckers, X.; Haga, S.; Tilley, N.; Merci, B. Smoke control in case of fire in a large car park: CFD simulations of full-scale configurations. Fire Saf. J. 2013, 57, 22–34. [Google Scholar] [CrossRef] [Green Version]
- Suard, S.; Koched, A.; Pretrel, H.; Audouin, L. Numerical simulations of fire-induced doorway flows in a small scale enclosure. Int. J. Heat Mass Transf. 2015, 81, 578–590. [Google Scholar] [CrossRef]
- Zhao, G.; Beji, T.; Merci, B. Study of FDS simulations of buoyant fire-induced smoke movement in a high-rise building stairwell. Fire Saf. J. 2017, 91, 276–283. [Google Scholar] [CrossRef]
- Huang, Y.; Chen, X.; Zhang, C. Numerical simulation of the variation of obscuration ratio at the fire early phase with various soot yield rate. Case Stud. Therm. Eng. 2020, 18, 100572. [Google Scholar] [CrossRef]
- Ding, Y.; Yang, L.; Weng, F.; Fu, Z.; Rao, P. Investigation of combined stairs elevators evacuation strategies for high rise buildings based on simulation. Simul. Model. Pr. Theory 2015, 53, 60–73. [Google Scholar] [CrossRef]
- Liu, R.; Jiang, D.; Shi, L. Agent-based simulation of alternative classroom evacuation scenarios. Front. Arch. Res. 2016, 5, 111–125. [Google Scholar] [CrossRef] [Green Version]
- Wu, G.-Y.; Mizuno, M. The numerical analysis of mass evacuation in Taipei 101 with control volume model. Simul. Model. Pr. Theory 2019, 96, 101937. [Google Scholar] [CrossRef]
- Chen, Y.; Wang, C.; Yap, J.B.H.; Li, H.; Zhang, S. Emergency evacuation simulation at starting connection of cross-sea bridge: Case study on Haicang Avenue Subway Station in Xiamen Rail Transit Line. J. Build. Eng. 2020, 29, 101163. [Google Scholar] [CrossRef]
- Tang, F.; Ren, A. GIS-based 3D evacuation simulation for indoor fire. Build. Environ. 2012, 49, 193–202. [Google Scholar] [CrossRef]
- Yang, P.; Li, C.; Chen, D. Fire emergency evacuation simulation based on integrated fire–evacuation model with discrete design method. Adv. Eng. Softw. 2013, 65, 101–111. [Google Scholar] [CrossRef]
- Tsang, H.; Fong, N.; Chow, W. A simulation study on fire safety aspects of rock cavern accommodating high occupant load. Tunn. Undergr. Space Technol. 2020, 103, 103430. [Google Scholar] [CrossRef]
- Marzouk, M.; Al Daour, I. Planning labor evacuation for construction sites using BIM and agent-based simulation. Saf. Sci. 2018, 109, 174–185. [Google Scholar] [CrossRef]
- Tan, L.; Hu, M.; Lin, H. Agent-based simulation of building evacuation: Combining human behavior with predictable spatial accessibility in a fire emergency. Inf. Sci. 2015, 295, 53–66. [Google Scholar] [CrossRef]
- Lu, K.; Mao, S.; Wang, J.; Lu, S. Numerical simulation of the ventilation effect on fire characteristics and detections in an aircraft cargo compartment. Appl. Therm. Eng. 2017, 124, 1441–1446. [Google Scholar] [CrossRef]
- Hong, L.; Gao, J.; Zhu, W. Self-evacuation modelling and simulation of passengers in metro stations. Saf. Sci. 2018, 110, 127–133. [Google Scholar] [CrossRef]
- Li, M.-X.; Zhu, S.-B.; Wang, J.-H.; Zhou, Z. Research on Fire Safety Evacuation in a University Library in Nanjing. Procedia Eng. 2018, 211, 372–378. [Google Scholar] [CrossRef]
- Rozo, K.R.; Arellana, J.; Santander-Mercado, A.; Jubiz-Diaz, M. Modelling building emergency evacuation plans considering the dynamic behaviour of pedestrians using agent-based simulation. Saf. Sci. 2019, 113, 276–284. [Google Scholar] [CrossRef]
- Zhang, L.; Wu, X.; Liu, M.; Liu, W.; Ashuri, B. Discovering worst fire scenarios in subway stations: A simulation approach. Autom. Constr. 2019, 99, 183–196. [Google Scholar] [CrossRef]
- Wang, Z.; Lu, K.; Feng, L.; Tao, Y.; Wang, J.; Ding, Y.; Shi, C. Simulation on smoke re-circulation transition in an urban street canyon for different fire source locations with cross wind. Saf. Sci. 2020, 127, 104716. [Google Scholar] [CrossRef]
- Cegan, J.C.; Filion, A.M.; Keisler, J.M.; Linkov, I. Trends and applications of multi-criteria decision analysis in en-vironmental sciences: Literature review. Environ. Syst. Decis. 2017, 37, 123–133. [Google Scholar] [CrossRef]
- Ransikarbum, K.; Pitakaso, R.; Kim, N. A Decision-Support Model for Additive Manufacturing Scheduling Using an Integrative Analytic Hierarchy Process and Multi-Objective Optimization. Appl. Sci. 2020, 10, 5159. [Google Scholar] [CrossRef]
- Shi, L.; Xie, Q.; Cheng, X.; Chen, L.; Zhou, Y.; Zhang, R. Developing a database for emergency evacuation model. Build. Environ. 2009, 44, 1724–1729. [Google Scholar] [CrossRef]
- Shields, T. Fire and Disabled People in Buildings. J. R. Soc. Health 1994, 114, 304–308. [Google Scholar] [CrossRef]
- De-Ching, H.; Shen-Wen, C.; Chien-Hung, L.; Po-Ta, H.; Yi-Ting, S.; Huei-Ru, S. A Study for the Evacuation of Hospital on Fire during Construction. Procedia Eng. 2011, 11, 139–146. [Google Scholar] [CrossRef] [Green Version]
- Park, J.; Kwark, J. Experimental Study on Fire Sources for Full-Scale Fire Testing of Simple Sprinkler Systems Installed in Multiplexes. Fire 2021, 4, 8. [Google Scholar] [CrossRef]
- Kerry Fire and Rescue Service. Guidance Document–Fire Assembly Points. 2013. Available online: http://www.kerryfireandrescue.ie/ (accessed on 10 February 2020).
- Fire Action. Fire Evacuation Procedures: Choosing an Assembly Point. 2016. Available online: https://www.fireaction.co.uk/news/fire-evacuation-procedures-part-1-choosing-assembly-point/ (accessed on 10 February 2020).
- Puchongkawarin, C.; Ransikarbum, K. An Integrative Decision Support System for Improving Tourism Logistics and Public Transportation in Thailand. Tour. Plan. Dev. 2020, 1–16. [Google Scholar] [CrossRef]
- Huang, J. Combining entropy weight and TOPSIS method for information system selection. In Proceedings of the 2008 IEEE Conference on Cybernetics and Intelligent Systems, Chengdu, China, 21–24 September 2008; pp. 1281–1284. [Google Scholar]
- Zeng, F.; Yin, Y.; Shen, F.; Yin, X.; Yang, L. Comprehensive Evaluation of Sustainable Development of Real Estate Industry Based on Information Entropy Weight Method. In IOP Conference Series: Earth and Environmental Science; IOP Publishing: Guiyang, China, 2019; Volume 310, p. 022066. [Google Scholar]
- Yoon, K.P.; Hwang, C.L. Multiple Attribute Decision Making: An Introduction; Sage Publications: Thousand Oaks, CA, USA, 1995; Volume 104. [Google Scholar]
- Behzadian, M.; Otaghsara, S.K.; Yazdani, M.; Ignatius, J. A state-of the-art survey of TOPSIS applications. Expert Syst. Appl. 2012, 39, 13051–13069. [Google Scholar] [CrossRef]
- McGrattan, K.; Hostikka, S.; McDermott, R.; Floyd, J.; Weinschenk, C.; Overholt, K. Fire Dynamics Simulator User’s Guide; NIST Special Publication: Gaithersburg, MD, USA, 2013; Volume 1019.
- Degler, J.; Eliasson, A.; Anderson, J.; Lange, D.; Rush, D. A-Priori Modelling of the Tisova Fire Test as Input to the Experimental Work; ASFE: Dubrovnik, Croatia, 2015; Volume 60. [Google Scholar]
- Fridolf, K.; Nilsson, D.; Frantzich, H.; Ronchi, E.; Arias, S. Walking Speed in Smoke: Representation in Life Safety Verifications. In Proceedings of the 12th International Performance-Based Codes and Fire Safety Design Methods Conference, Oahu, HI, USA, 23–27 April 2018. [Google Scholar]
- Ransikarbum, K.; Kim, N.; Ha, S.; Wysk, R.A.; Rothrock, L. A Highway-Driving System Design Viewpoint Using an Agent-Based Modeling of an Affordance-Based Finite State Automata. IEEE Access 2017, 6, 2193–2205. [Google Scholar] [CrossRef]
- Ransikarbum, K. Analysis of Traffic Flow at a Red Light Intersection using Computer Simulation technique. Thai J. Oper. Res. TJOR 2020, 8, 1–14. [Google Scholar]
- Chanthakhot, W.; Ransikabum, K. Numerical Simulation for Fire Emergency Planning in a Home Appliances Factory. Proceeding of the Research, Invention, and Innovation Congress (RI2C), Bangkok, Thailand, 11–13 December 2019; pp. 1–5. [Google Scholar]
- Ransikarbum, K.; Kim, N.; Wysk, R.A.; Rothrock, L. Validation of affordance-based finite state automata modeling. In Proceedings of the IIE Annual Conference, Orlando, FL, USA, 30 May–3 June 2009; p. 66. [Google Scholar]
- Kim, J.; Ransikarbum, K.; Kim, N.; Paik, E. Agent-based Simulation Modeling of Low Fertility Trap Hypothesis. In Proceedings of the 2016 ACM SIGSIM Conference on Principles of Advanced Discrete Simulation, Calgary, AB, Canada, 15–18 May 2016; pp. 83–86. [Google Scholar]
- Wattanasaeng, N.; Ransikarbum, K. Model and Analysis of Economic- and Risk-Based Objective Optimization Problem for Plant Location within Industrial Estates Using Epsilon-Constraint Algorithms. Computatioin 2021, 9, 46. [Google Scholar] [CrossRef]
Figure 1.
Home appliance factory (a) actual layout (b) simulated building with fire emergency (c) exit door location.
Figure 1.
Home appliance factory (a) actual layout (b) simulated building with fire emergency (c) exit door location.
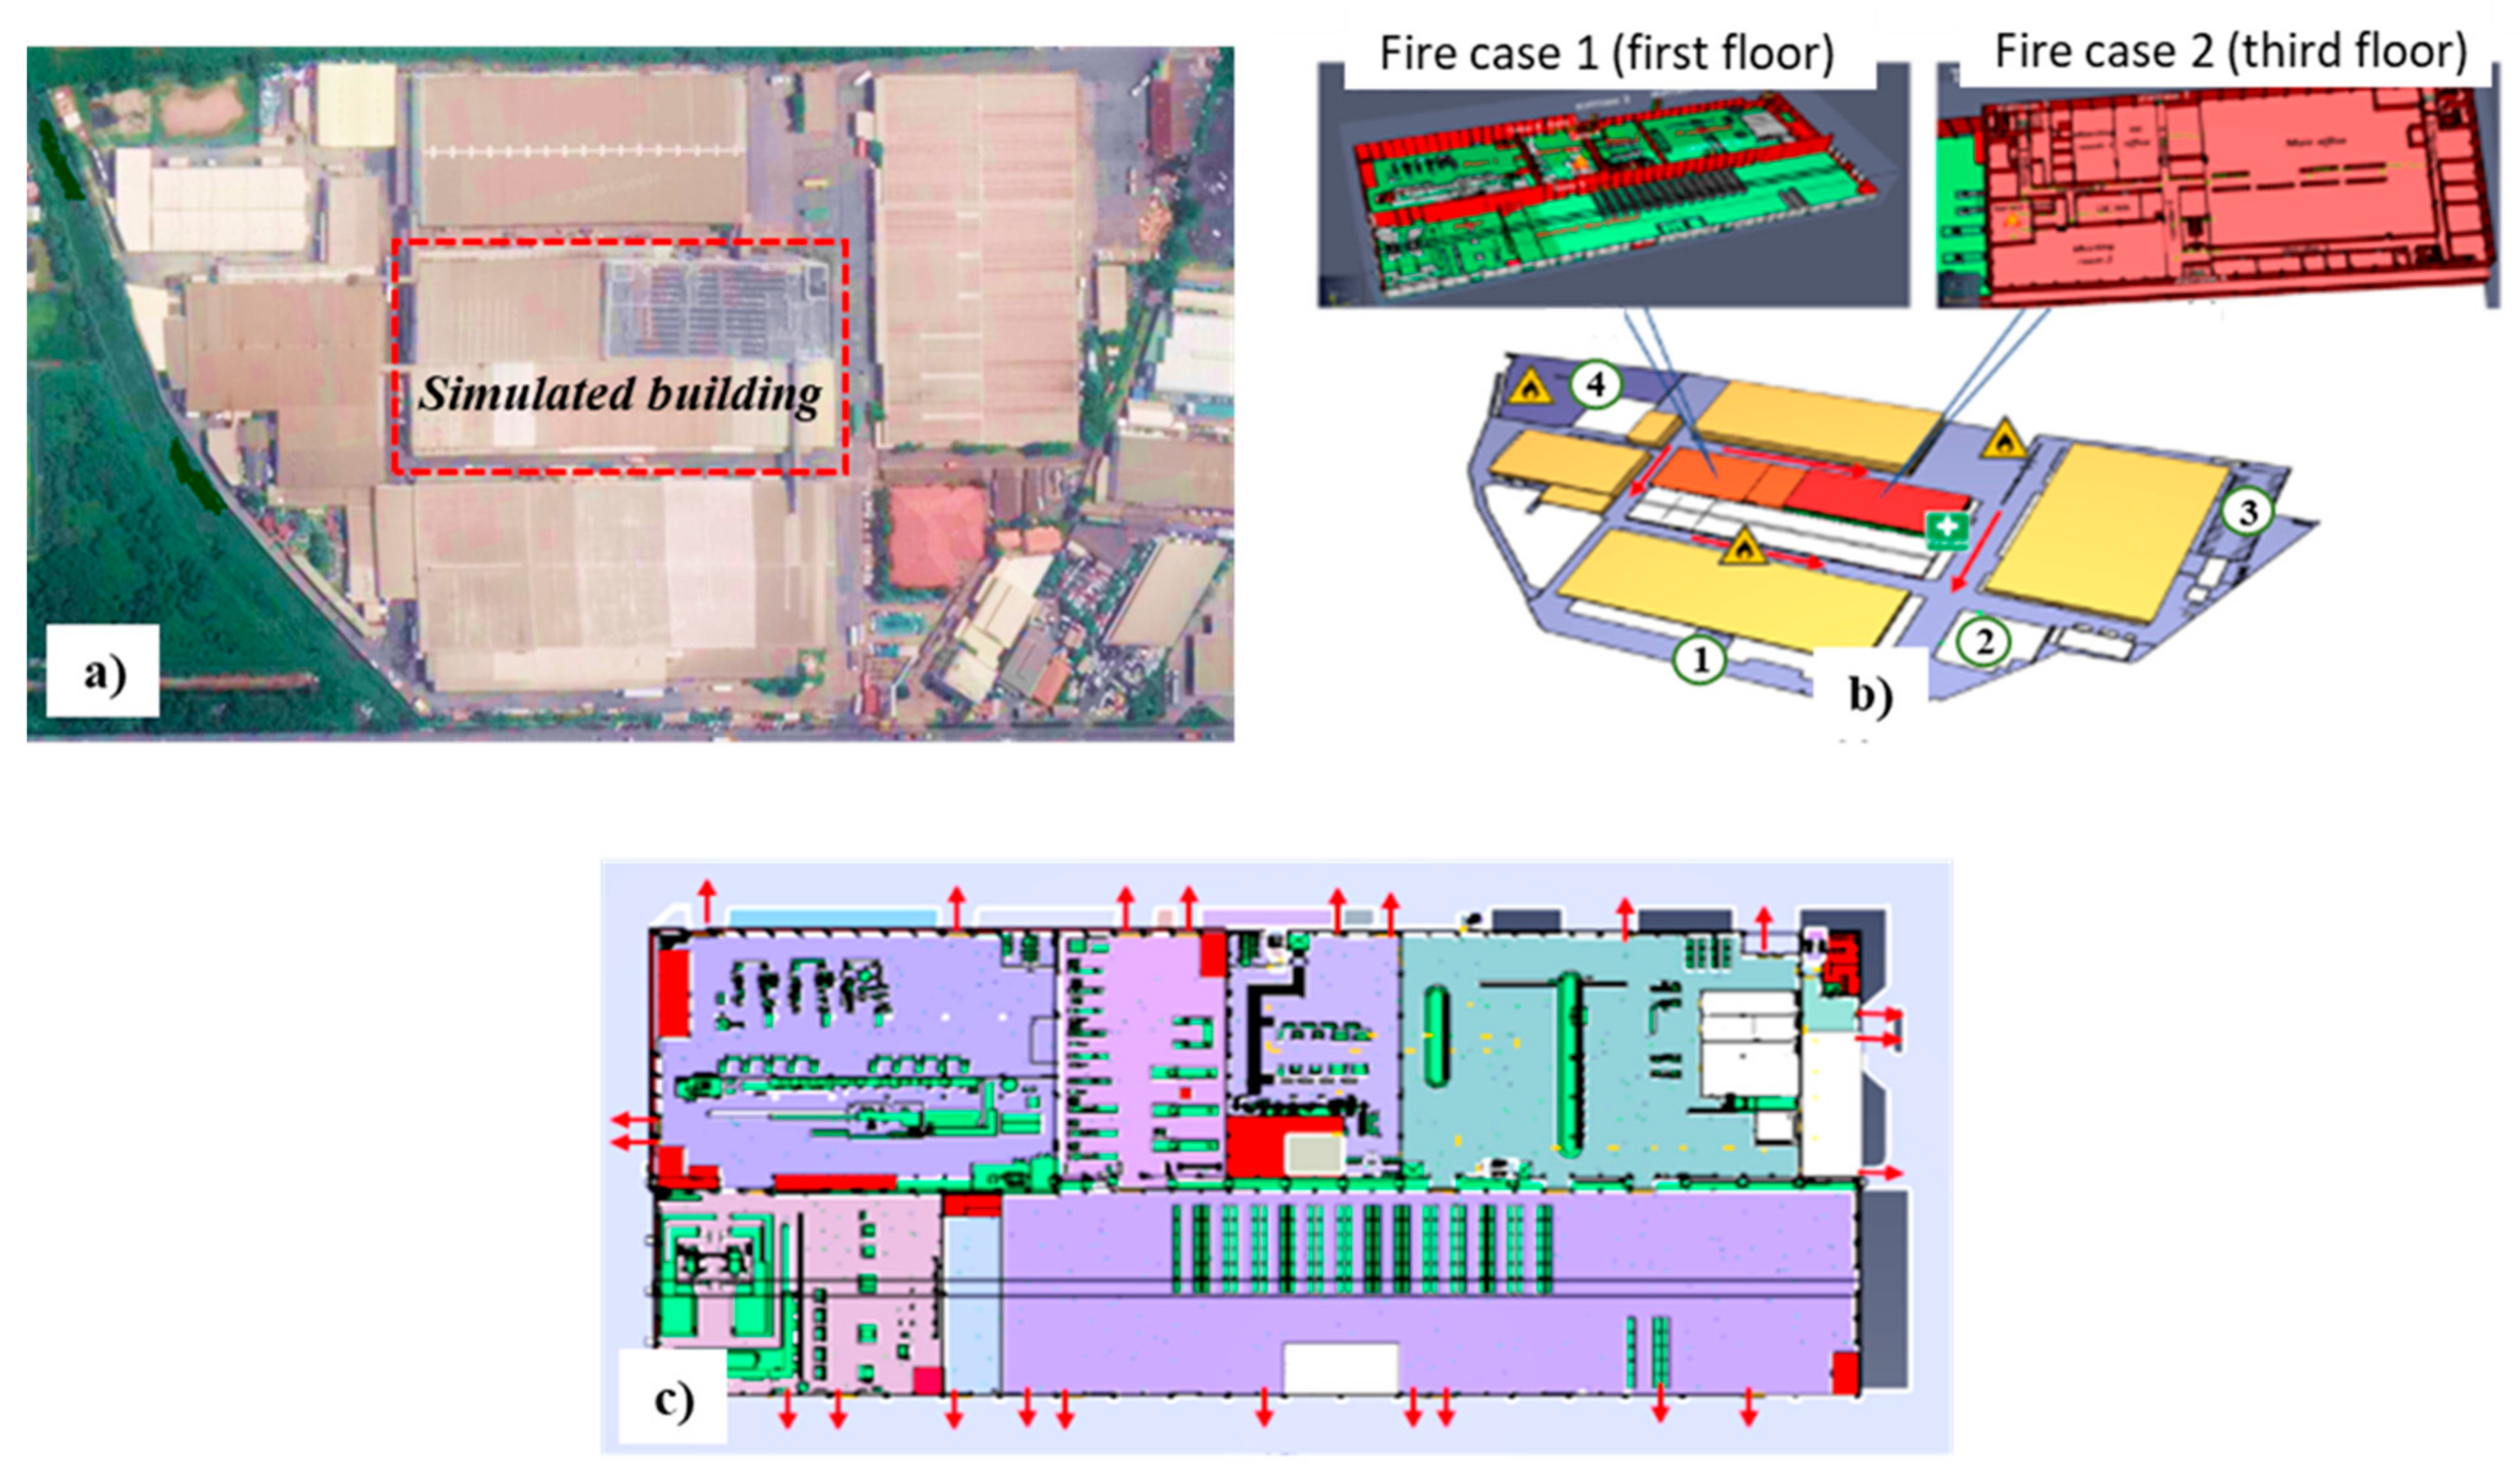
Figure 2.
Experimental plan of the proposed research.

Figure 3.
Smoke spread from fire (a–d) case 1 and (e–h) case 2.
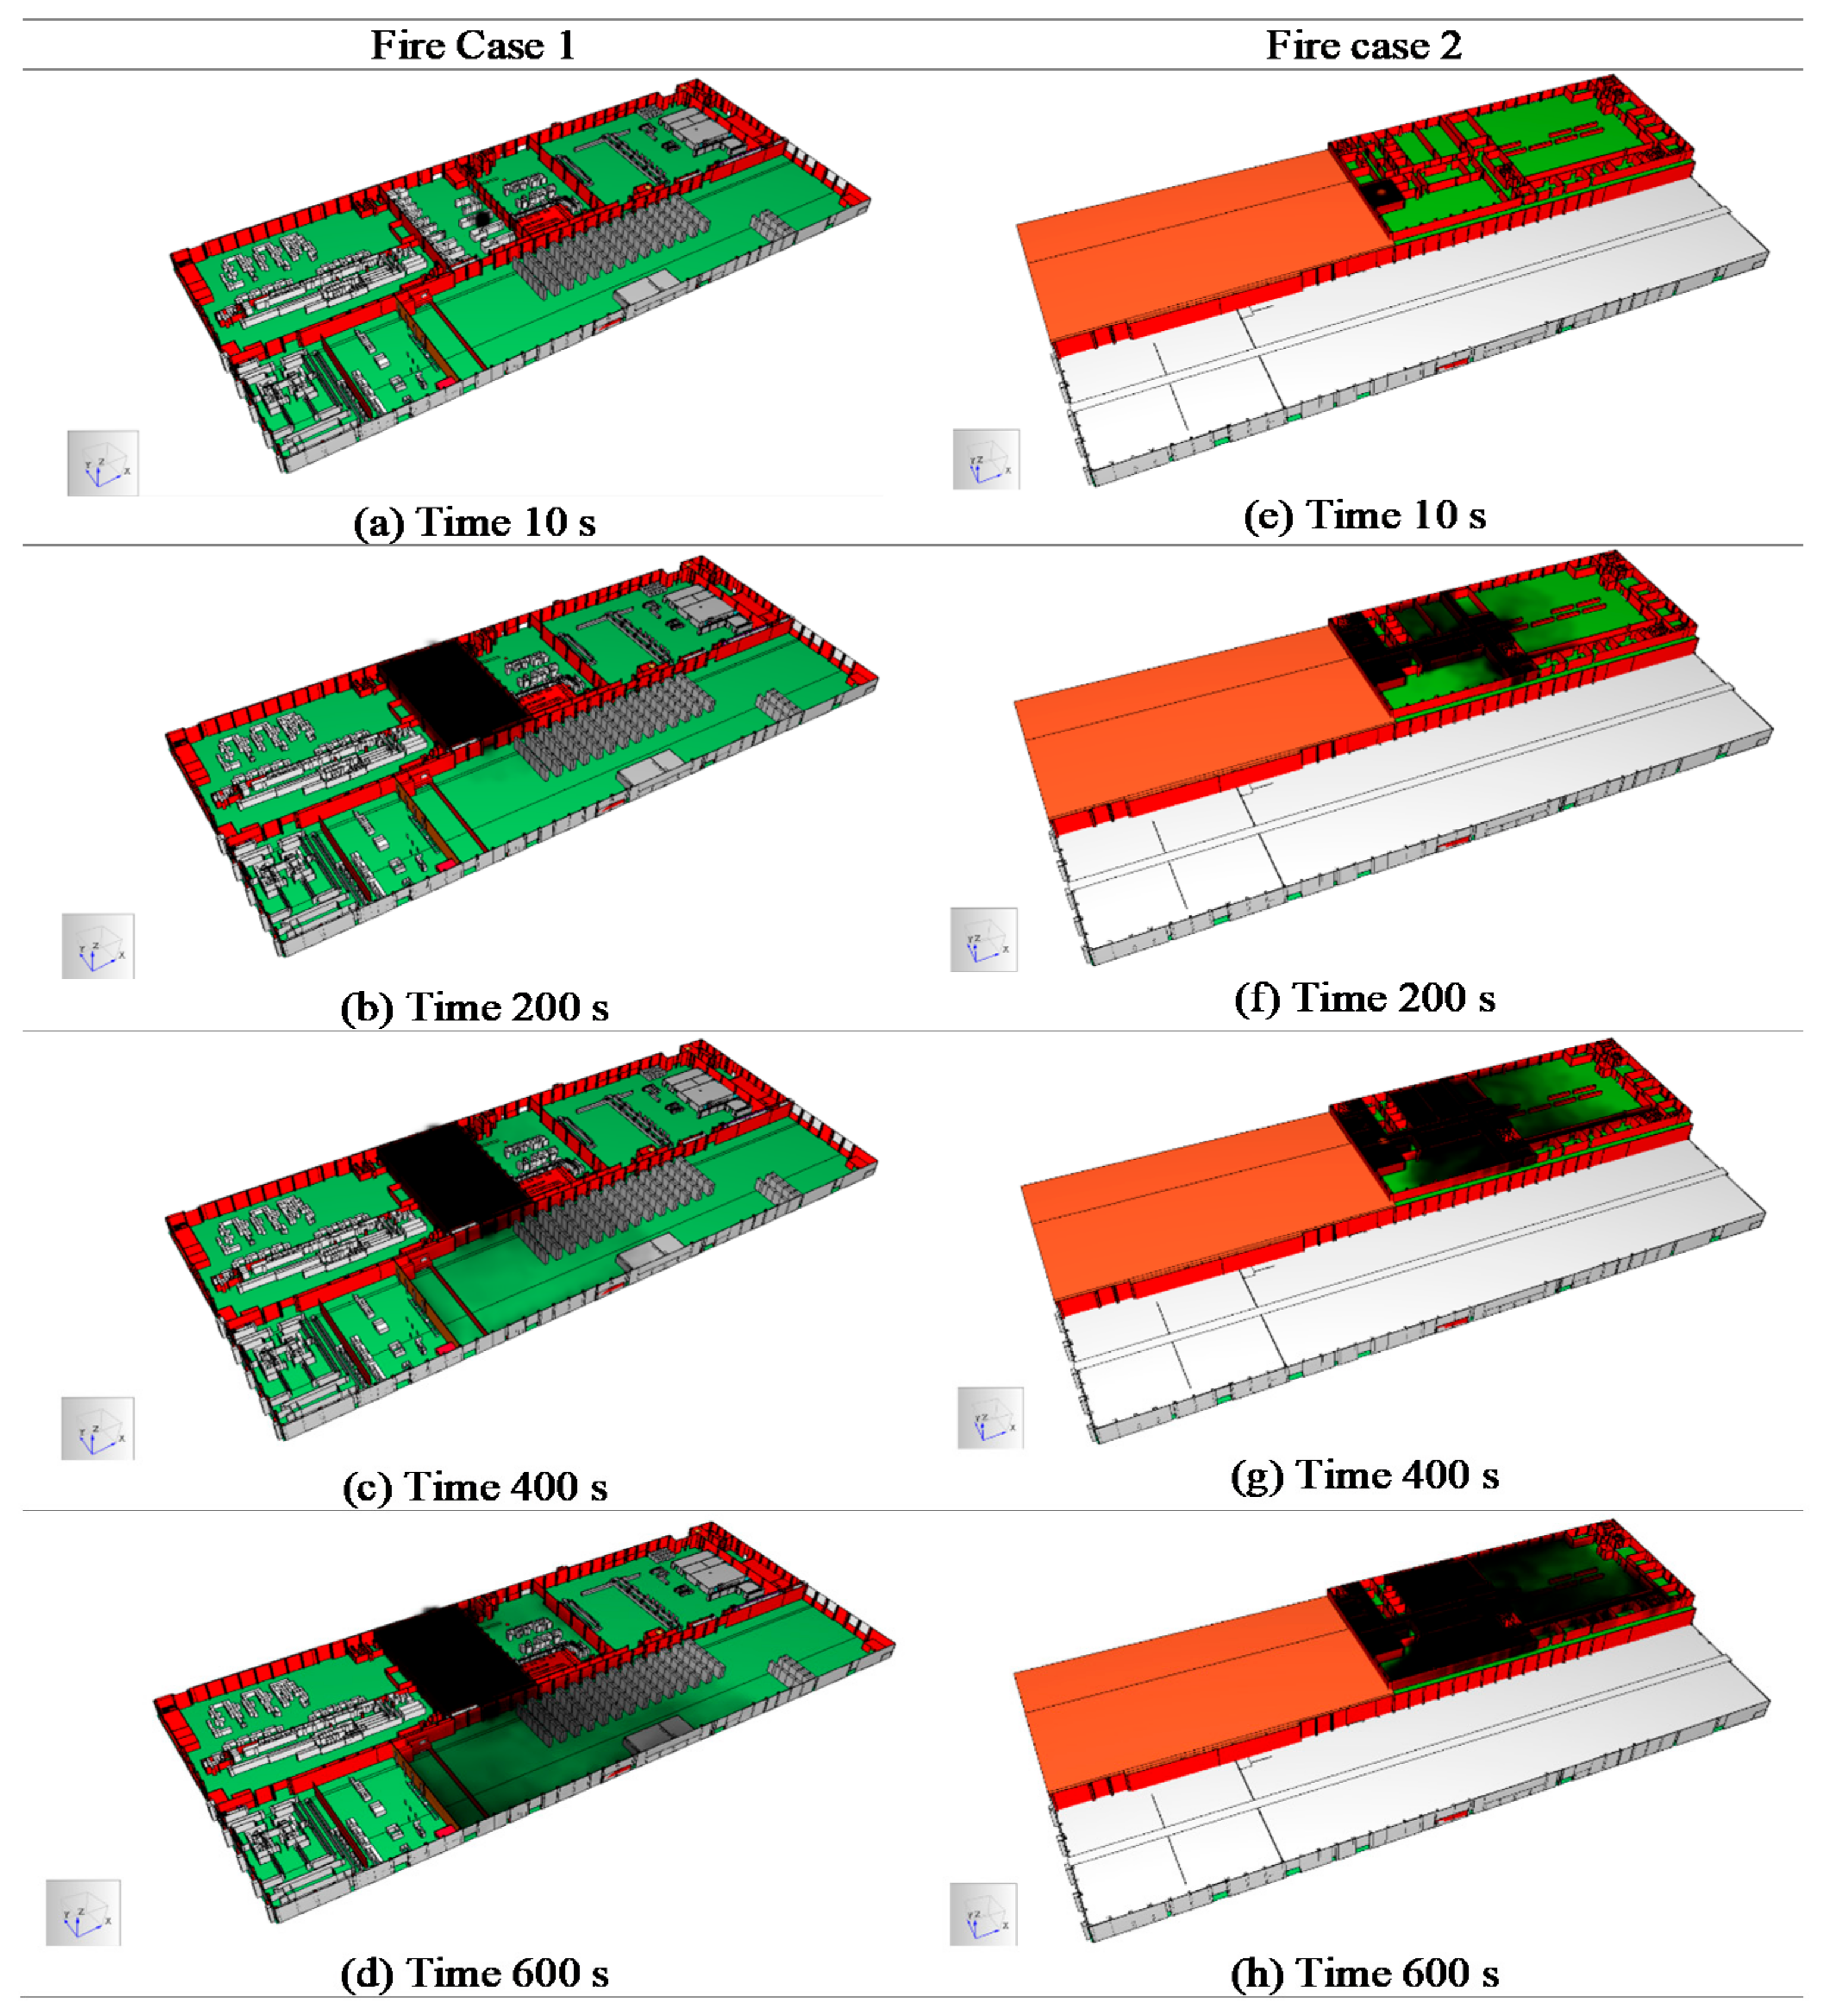
Figure 4.
Risk curve for visibility data over time.

Figure 5.
Agent evacuation (a) inside the building (b) outside the building (c) with door (d) with stair (e) with wheelchair.
Figure 5.
Agent evacuation (a) inside the building (b) outside the building (c) with door (d) with stair (e) with wheelchair.

Figure 6.
Risk curve for remaining evacuees over time.

Figure 7.
Remaining evacuees for experimental design. (a) scenario 0 vs. scenario 1; (b) scenario 0 vs. scenario 2; (c) scenario 0 vs. scenario 3; (d) scenario 0 vs. scenario 4; (e) scenario 0 vs. scenario 5; (f) scenario 0 vs. scenario 6.
Figure 7.
Remaining evacuees for experimental design. (a) scenario 0 vs. scenario 1; (b) scenario 0 vs. scenario 2; (c) scenario 0 vs. scenario 3; (d) scenario 0 vs. scenario 4; (e) scenario 0 vs. scenario 5; (f) scenario 0 vs. scenario 6.

Figure 8.
Analysis of factorial design with (a) Pareto chart (b) normal plot (c) cube plot.

Table 1.
Summary of literature review.
| Existing Studies | Pre-Emergency | Post-Emergency | Key Factors of the Evacuation Model | Integrative MCDA | ||
|---|---|---|---|---|---|---|
| Fire Protection | Assembly Point | Fire Model | Evacuation Model | |||
| Mawhinney [9] | ✓ | |||||
| Kironji [10] | ✓ | AHP | ||||
| Mróz et al. [11] | ✓ | |||||
| Tomar and Khurana [12] | ✓ | |||||
| Rahardjo and Prihanton [13] | ✓ | |||||
| Raja Prasad and Prasad Rao [14] | ✓ | |||||
| Unal and Uslu [15] | ✓ | |||||
| Hoscan and Cetinyokus [16] | ✓ | AHP | ||||
| Şenik and Uzun [17] | ✓ | |||||
| Deckers et al. [18] | ✓ | |||||
| Suard et al. [19] | ✓ | |||||
| Zhao et al. [20] | ✓ | |||||
| Huang et al. [21] | ✓ | |||||
| Ding et al. [22] | ✓ | Occupant load, Stair | ||||
| Liu et al. [23] | ✓ | Occupant, Distance | ||||
| Wu and Mizuno [24] | ✓ | Occupant speed, flow | ||||
| Chen et al. [25] | ✓ | Occupant behavior, Stair | ||||
| Tang and Ren [26] | ✓ | ✓ | Fire, Building data | |||
| Yang et al. [27] | ✓ | ✓ | Fire, Occupant load, Stair, Fire duration | |||
| Tsang et al. [28] | ✓ | ✓ | Fire, Occupant load | |||
| Marzouk and Al Daour [29] | ✓ | Occupant, Project | TOPSIS | |||
| Tan et al. [30] | ✓ | Knowledge, Route | ||||
| Lu et al. [31] | ✓ | |||||
| Hong et al. [32] | ✓ | Occupant, Stair, Escalator | ||||
| Li et al. [33] | ✓ | ✓ | Fire, Occupant behavior | |||
| Rozo et al. [34] | ✓ | Occupant, Ramp, Stair | ||||
| Zhang et al. [35] | ✓ | |||||
| Wang et al. [36] | ✓ | |||||
| This study | ✓ | ✓ | ✓ | Fire location, Escape door, Occupant density, Occupant’s perception and physical condition | IEW/TOPSIS | |
Table 2.
Factors and levels for the experiment.
| Factors | Level | Simulation Model Setting |
|---|---|---|
| (1) Fire Perception | (1) 100% perception | Set initial delay time based on [39] |
| (2) 80% perception | Set initial delay time based on [39] | |
| (2) Physical Disability | (1) No disabled person | Set occupant profile as regular |
| (2) Yes (1% disabled) | Set occupant as disabled person with wheelchair | |
| (3) Escape Door Width | (1) 80 cm | Set the width of the escape door to 80 cm |
| (2) 110 cm | Set the width of the escape door to 110 cm | |
| (4) Fire Location | (1) First floor | Set the fire location at the injection area (1st floor) |
| (2) Third floor | Set the fire location at the Server room (3rd floor) | |
| (5) Occupancy Density | (1) Low density | Set the number of occupants to 700 persons |
| (2) Normal density | Set the number of occupants to 1000 persons | |
| (3) High density | Set the number of occupants to 1300 persons |
Table 3.
Experiment design for each scenario.
| Scenario | Agent | Building | Agent–Building | ||
|---|---|---|---|---|---|
| Fire Perception | Physical Disability | Door Width (cm) | Fire Location | Density of Evacuee | |
| Scenario 0 (Base) | 100% | No | 80 | First floor | Normal |
| Scenario 1 | 80% | No | 80 | First floor | Normal |
| Scenario 2 | 100% | Yes | 80 | First floor | Normal |
| Scenario 3 | 100% | No | 110 | First floor | Normal |
| Scenario 4 | 100% | No | 80 | First floor | Low |
| Scenario 5 | 100% | No | 80 | First floor | High |
| Scenario 6 | 100% | No | 80 | Third floor | Normal |
Table 4.
Alternative and criteria analysis from IEW and TOPSIS.
| Criteria | Desired Criterion | Alternative Data | IEW Result | PIS and NIS | ||||||
|---|---|---|---|---|---|---|---|---|---|---|
| 1 | 2 | 3 | 4 | PIS | NIS | |||||
| A | Min | 350 | 200 | 380 | 370 | 0.98 | 0.02 | 0.04 | 0.01 | 0.03 |
| B | Max | 1500 | 1200 | 2500 | 1800 | 0.97 | 0.03 | 0.06 | 0.04 | 0.02 |
| C | Max | 130 | 210 | 200 | 60 | 0.93 | 0.07 | 0.15 | 0.09 | 0.03 |
| D | Min | 60 | 100 | 380 | 610 | 0.77 | 0.23 | 0.50 | 0.04 | 0.42 |
| E | Max | 8 | 8 | 6 | 6 | 0.99 | 0.01 | 0.02 | 0.01 | 0.01 |
| F | Max | 2 | 3 | 2 | 1 | 0.95 | 0.05 | 0.10 | 0.07 | 0.02 |
| G | Min | 250 | 120 | 326 | 430 | 0.94 | 0.06 | 0.13 | 0.03 | 0.10 |
Table 5.
and ranking from IEW and TOPSIS.
| Assembly Point | Ranking | |||
|---|---|---|---|---|
| 1 | 0.06 | 0.38 | 0.87 | 2 |
| 2 | 0.03 | 0.37 | 0.91 | 1 |
| 3 | 0.23 | 0.17 | 0.44 | 3 |
| 4 | 0.39 | 0.01 | 0.02 | 4 |
Table 6.
Total evacuation time from 10 runs for Scenario 0 to assembly points.
| Scenario 0 (Base) Run Number | Locations of Assembly Points | |||
|---|---|---|---|---|
| Assembly Point 1 | Assembly Point 2 | Assembly Point 3 | Assembly Point 4 | |
| 1 | 598.5 | 480.7 | 550.6 | 546.3 |
| 2 | 601.4 | 478.5 | 554.2 | 538.6 |
| 3 | 602.9 | 482.6 | 525.5 | 544.2 |
| 4 | 628.8 | 475.5 | 562.6 | 558.5 |
| 5 | 608.5 | 465.5 | 535.3 | 556.0 |
| 6 | 606.6 | 438.7 | 543.4 | 578.2 |
| 7 | 610.8 | 465.4 | 552.2 | 542.4 |
| 8 | 613.8 | 469.2 | 534.4 | 542.1 |
| 9 | 610.2 | 480.4 | 539.6 | 545.9 |
| 10 | 615.1 | 477.5 | 533.7 | 552.4 |
| Average | 609.6 | 471.4 | 543.1 | 550.4 |
Table 7.
Analyzed total evacuation time to assembly point 2 for all scenarios.
| Scenario | Total Evacuation Time (Seconds) | |||
|---|---|---|---|---|
| Average | Standard Deviation | Min | Max | |
| Scenario 0 (Base) | 471.4 | 13.1 | 438.7 | 482.6 |
| Scenario 1 | 544.9 | 12.4 | 532.4 | 568.5 |
| Scenario 2 | 513.8 | 10.3 | 497.6 | 528.0 |
| Scenario 3 | 447.6 | 9.5 | 436.0 | 468.1 |
| Scenario 4 | 384.6 | 19.2 | 362.6 | 422.1 |
| Scenario 5 | 497.6 | 9.2 | 483.0 | 512.0 |
| Scenario 6 | 489.8 | 18.9 | 452.7 | 517.5 |
Table 8.
Analysis of variance for factorial design of total evacuation time.
| Source | DF | Adj SS | MS F-Value | p-Value |
|---|---|---|---|---|
| Model | 7 | 122,670 | 52.46 | 0.000 |
| Linear | 3 | 79,479 | 26,492.9 | 0.000 |
| A | 1 | 27,299 | 27,298.7 | 0.000 |
| B | 1 | 47,629 | 47,628.8 | 0.000 |
| C | 1 | 4551 | 4551.1 | 0.000 |
| 2-Way Interactions | 3 | 42,680 | 14,226.5 | 0.000 |
| A*B | 1 | 17,982 | 17,982.0 | 0.000 |
| A*C | 1 | 11,120 | 11,120.3 | 0.000 |
| B*C | 1 | 13,577 | 13,577.3 | 0.000 |
| 3-Way Interactions | 1 | 512 | 512.1 | 0.220 |
| A*B*C | 1 | 512 | 512.1 | 0.220 |
Remark: * p < 0.05; A (Fire perception); B (Physical disability); C (Door width).
Publisher’s Note: MDPI stays neutral with regard to jurisdictional claims in published maps and institutional affiliations. |
© 2021 by the authors. Licensee MDPI, Basel, Switzerland. This article is an open access article distributed under the terms and conditions of the Creative Commons Attribution (CC BY) license (https://creativecommons.org/licenses/by/4.0/).
Share and Cite
MDPI and ACS Style
Chanthakhot, W.; Ransikarbum, K. Integrated IEW-TOPSIS and Fire Dynamics Simulation for Agent-Based Evacuation Modeling in Industrial Safety. Safety 2021, 7, 47. https://0-doi-org.brum.beds.ac.uk/10.3390/safety7020047
AMA Style
Chanthakhot W, Ransikarbum K. Integrated IEW-TOPSIS and Fire Dynamics Simulation for Agent-Based Evacuation Modeling in Industrial Safety. Safety. 2021; 7(2):47. https://0-doi-org.brum.beds.ac.uk/10.3390/safety7020047
Chicago/Turabian StyleChanthakhot, Wattana, and Kasin Ransikarbum. 2021. "Integrated IEW-TOPSIS and Fire Dynamics Simulation for Agent-Based Evacuation Modeling in Industrial Safety" Safety 7, no. 2: 47. https://0-doi-org.brum.beds.ac.uk/10.3390/safety7020047
Note that from the first issue of 2016, this journal uses article numbers instead of page numbers. See further details here.