
How Does Selective Reporting Distort Understanding of Workplace Injuries?


1
Savanna Energy, Toowoomba, QLD 4350, Australia
2
Safety Science Innovation Lab, HLSS, Griffith University, Macrossan Building N16, 170 Kessels Road, Nathan Campus, Brisbane, QLD 4111, Australia
*
Author to whom correspondence should be addressed.
Safety 2021, 7(3), 58; https://0-doi-org.brum.beds.ac.uk/10.3390/safety7030058
Submission received: 19 February 2021
/
Revised: 25 June 2021
/
Accepted: 4 August 2021
/
Published: 8 August 2021
(This article belongs to the Special Issue Methods and Instruments for Evaluating and Measuring Safety)
Abstract
:This study introduces and applies a new method for studying under-reporting of injuries. This method, “one-to-one injury matching”, involves locating and comparing individual incidents within company and insurer recording systems. Using this method gives a detailed measure of the difference in injuries recognised as “work-related” by the insurer, and injuries classified as “recordable” by the company. This includes differences in the volume of injuries, as well as in the nature of the injuries. Applying this method to an energy company shows that only 19% of injuries recognised by the insurer were recognised by the company as recordable incidents. The method also demonstrates where claiming behaviour and claims management have created systematic biases in the disposition of incidents. Such biases result in an inaccurate picture of the severity and nature of incidents, over-estimating strike injuries such as to the hand, and underestimating chronic and exertion injuries such as to the back.
1. Introduction
Using the number of reported injuries as a measure of safety is both widespread and often criticised. Criticisms of reported injuries for measuring safety include:
- Injury rates are driven by the most common and least serious injuries, and can be misleading about the risk of a fatality or major accident [3].
- The number and nature of reported injuries are more sensitive to variations in reporting and classification than they are to real differences in safety performance [4].
This paper seeks to test and explore the third of these criticisms, namely that LTIFR data are far more indicative of changes in claiming behaviour and claims management than of changes in OHS performance [ibid]. The method presented in this paper provides a means to measure claiming behaviour and claims management against actual outcomes. The method measures whether or not the incidents classified as “Recordable” accurately reflects the nature of all injures, or if, at a minimum, “Recordable Injuries” are the most significant of the injuries experienced in a workplace and warrant a higher classification than other injuries.
Many researchers have investigated the nature and extent of reporting bias in safety. A variety of methods have been used to estimate what proportion of workplace injuries are reported. One method is simply to ask workers if they have been injured, and if so, whether they reported it. Shannon and Lowe [5] surveyed 2500 Canadian workers and found that of 143 who incurred an injury, 57 did not file a compensation claim. Pransky et al. [6] surveyed 110 workers in a single US company, and concluded that whilst 30% of workers experienced conditions that should have been recorded, less than 5% actually reported these conditions.
More sophisticated efforts to estimate under reporting involve comparing independent sources of injury data. For example, De Silva et al. [7] compared workers compensation claim data to safety inspectorate data to conclude that 80% of accidents for which a construction worker makes a claim are not reported by the employer to the safety inspectorate. Stout and Bell [8] summarised ten state-based studies comparing different government sources of fatality data, and concluded that any single source of data captures only between 37% and 81% of workplace fatalities.
Whilst the existing body of work makes a compelling case that many actual workplace injuries are not captured as reported injuries, this does not tell us the full nature of the problem. The mere fact of under-reporting does not prevent those injuries that are reported from being a useful source of information. Companies work with the data they have, not the data that they are missing. However, companies that use injury data as a safety indicator rely on the assumption that reported injuries are a consistent and representative sample of all injuries. If there is a systematic difference between reported and actual injuries, or if the relationship between reported and actual injuries changes between reporting periods, then the reported injury data will be actively misleading. Rather than assist companies to prioritise and evaluate their safety efforts, such data will direct resources away from real problems and effective interventions, and towards “ghost” data artefacts.
This study applies a new method, “one-to-one injury matching”. The name “one-to-one” represents the direct comparison of data, for one incident, from two different data sources. In this case, from a company’s internal reporting system and an external source of data such as Work Cover. The important part of this one-to-one analysis is that the two data sources represent different points of view. In this case, the IMS system represents the measurement behaviour of business and industry, where the Work Cover data represent the view of the incident by an insuring body. Since the two points of view are not governed by the same political or economic drivers, the comparison of the two provides insight into the measurement behaviour embedded within the data. Unlike previous attempts to measure under-reporting, which operate at a population level, our method directly compares the same exact injury as it appears (or does not appear) in different data sets. The advantage of one-to-one injury matching is that it allows us to examine which types of injuries are under-reported. It also allows us to identify differences in how injuries have been classified, such as where an injury is considered severe in one system but minor in another. This form of under-reporting has not, to our knowledge, been previously captured in the academic literature about injury reporting.
The method laid out here has the potential to answer four sub-questions. Throughout these questions, we use the term “recorded” rather than “reported”, because our method does not distinguish between injuries that are never reported to anyone within the company and injuries that are reported to a supervisor, but not ultimately recorded by the company. Further, “Recordable Injuries” has a specific definition within industry to represent the injuries that are supposed to present the most significant of operating injuries. Our sub-questions are:
- Can we measure what proportion of injuries that require medical treatment are recordable?
- Can we quantify the relationship between the severity of injuries and whether they are recordable?
- Can we measure the relationship between the risk classification of injuries, the actual severity of injuries, and whether the injuries are considered recordable?
- Can we measure the relationship between the mechanism and body part of injuries, and whether they are considered recordable?
Together, these questions address the overall goal of the method we are presenting, which is to determine whether we can measure bias in the severity and type of injuries that are recorded and are likely to distort a company’s understanding of injury risk.
2. Methods
2.1. Data Collection
For demonstrative purpose, the method was applied at an energy company in Australia. Workplace injury insurance in Australia is provided by a single government-owned insurer in each state, except for certain activities that are covered by national insurers, and some businesses that self-insure. Data were acquired from both the energy company and the state insurer.
Energy company data were drawn from the Incident Management System (IMS); this system is a proprietary incident tracking tool used by the company. On top of the details surrounding an incident, it is a general industry practice to rate incidents according to risk. Risk assessment is a key tenant of the relevant legislation, particularly in that the legislation defines what is “reasonably practicable” in terms of “the likelihood of the hazard or the risk concerned occurring and the degree of harm that might result from the hazard or risk” [9]. Incidents, including both actual injuries and near misses, are similarly assigned a “risk rating” based on a matrix of likelihood and severity. This practice allows management to review incidents to ensure that they are addressing serious risks and doing what is reasonably practicable in ensuring health and safety. IMS data used for this study were:
- Risk rating of a given incident
- Incident type (recordable or not recordable)
- Incident classification (Lost Time, Near Miss, Non-work related, First Aid, etc.)
- Body part injured
- Mechanism of Injury
State insurer data were extracted from a report that the insurer makes privately available to each employer. The insurer data used from this report included:
- Body Part Injured
- Mechanism of Injury
- Claim Type
- Claim Status
- Total Payments
- Estimated Damage Costs
- Estimated Legal Costs
- Actual Damage Costs
- Actual Legal Costs
In addition, the insurer data included uniquely identifying information that could be cross-referenced to identify the matching record in the company Incident Management System.
All claims from 2018 and 2019 were included in the study.
2.2. Data Matching and Cleaning
A single record was created for each unique injury. Where there was a direct match between an IMS record and an insurer record, the combined record contained information from both systems, with the following modifications:
- Where both the insurer data and the IMS data included a body part injured, and these were not consistent, the insurer data were used. The number of categories used for body parts was reduced to combine similar injuries. For example, insurer data contained separate categories for thumb, left index finger, palm, and right hand—these were collapsed into a single “hand injury” category.
- In some cases, the insurer data included two records for the same injury, due to separate statutory and common-law claims. These records were combined, with the cost recorded as the total for the two claims.
- Where a claim was closed, only the actual costs were included in the combined record. Where a claim was open, the greater of the estimated and actual costs was included in the combined record.
Where an insurer record existed with no matching IMS record, the injury classification was recorded as “not work related”. This was to maintain consistency with an existing company practice where IMS records would be created and marked “not work related” when an insurance claim was made without a pre-existing IMS entry. An injury would not have been entered into the IMS if it was not reported at the time it occurred. Injuries that were not captured at the time they occurred represent a different under-reporting problem than the classification issue addressed in this study. For the purpose of this analysis, there are two possible ways for a “not work related” incident to be recorded in the IMS. Either it was created at the time it occurred but was viewed by the business as “not directly caused by the operation”, or it was generated at the time of the insurance claim and reviewed by the business retrospectively.
The fact that a business classifies certain incidents as “not work related”, when Work Cover accepts those same cases as being “work related”, represents an obvious definition difference between the two data sources. The comparison of data elements related to those individual incidents is discussed in the analysis. As a matter of fact and of law in the jurisdiction, injuries may be work related without a specific causal incident. However, such injuries are often only notified to the company after an insurance claim is made. While these researchers were unable to specifically quantify those that were added to the IMS after they actually occurred, the vast majority of incidents classified as “not work related” were entered and classified within the IMS system prior to this analysis.
Where an IMS record existed with no matching insurer record, the first researcher made a judgement whether the incident constituted a recordable injury. Most IMS records without insurer records were obviously not injury-related—for example, the IMS records events such as equipment failures and speeding violations. Only 1 IMS record was judged to be a recordable injury with no matching insurer data. This record was assigned a claim value of AUD 0.
2.3. Analysis of Severity
Every workplace injury has a unique profile of pain, medical treatment, effects on the worker’s family and social relationships, short and long-term impact on quality of life, and short and long-term impact on the ability to work. In order to account for workplace injuries, management and financial systems classify injuries into socially constructed categories [10]. Once the categorised injuries are aggregated into total numbers of injury at each severity, the choice of categorisation system can have a significant impact on what is hidden or revealed about the pattern of injuries [10].
There is no universally correct or objective method for assessing the severity of an injury [11]. The methods most discussed in the academic literature focus on injury severity as a predictor of mortality risk (see, e.g., Brown et al. [12]), but obviously, in workplace safety, an injury can be “severe” even if there is no risk of death.
The one-to-one statistical method is interested in a measure of severity that is quantifiable and generally unaffected by any systematic pressure that may exist within a business. For this purpose, the estimated or actual cost of an insurance claim is a reasonable estimate. To some extent, the employer is directly interested in the insurance claim cost, since this can influence future premiums. Insurance claim cost is also largely determined by the elements of severity that an employer is interested in:
- The amount of medical care;
- The short-term loss of work capacity;
- The long-term loss of ability to work and enjoy life.
Insurance claims have also been shown to increase monotonically with other measures of severity [13]. The two most important characteristics of this measure of severity, for the purpose of the one-to-one method, are that the measure is mathematically concrete and completely unaffected by any political pressures a company may have when risk assessing or classifying and injury.
Categorisation of the data was completed by adding any statutory and common law payments associated with a given case and assigning the case a severity rating based on one of four groups:
- Low: any cases where the total cost was less than or equal to AUD 1000;
- Medium: any cases where the total cost was above AUD 1000 and less than or equal to AUD 10,000;
- High: any cases where the total cost was above AUD 10,000 and less than or equal to AUD 50,000;
- Very High: any cases where the total cost was above AUD 50,000.
In the jurisdiction where the method was applied, there are some confounding factors that influence the size of the insurance claim. For example, insurance claims can be greater if the earning potential of the injured worker is higher, or if negligence is proven against the employer. These confounds are accounted for by using severity ratings rather than raw values. Inspection of individual cases showed that differences in salary or in liability would move a claim within a severity band, but would not change the band.
2.4. Sample Company
The company used to demonstrate the method is a drilling and completions service provider operating onshore oil and gas rigs. Mobile rigs work on gas wells in remote locations, moving the entire plant every few days. The risks managed on the rigs include process risks associated with underground pressure, plant and heavy machinery, remote locations, and heavy transport risks.
The most common causes of injury seen by this company include sprains and strains, falls, exertion injuries, pinch or strike point injuries, and exposure to heat and cold. Incidents are handled with thorough investigations following a Systematic Causal Analysis Technique (SCAT) methodology. Risk assignments are conducted by the Site Safety Manager at the time of an incident utilising a company risk matrix and verified by a Safety Advisor thereafter. Both the Site Safety Manager and Safety Advisor are trained and competent in Risk Analysis.
2.5. Data Limitations
This study was initiated in partnership with one energy provider. It would have been ideal to have it span across multiple companies or an entire industry. Attempts were made to invite other participants within the industry to join in the study.
Many businesses guard this sort of information for competitive reasons, and due to fear of political and economic fallout within an industry should their company be branded as “unsafe”. The publication of this analysis, with the one participating company, represents a significant commitment by that organisation toward creating a safer industry by sharing data that many would not. A wider study would be necessary to demonstrate that the measurement behaviour seen here is indicative of most businesses and industries that apply “Recordable Incident” reporting. Publicly sharing these data and methodology will create an opportunity to apply the methodology to a wider cohort in the future, both within the energy industry and beyond, and be a significant step towards a productive conversation about the true nature of reporting in industries that often keep their most intimate safety data closely protected.
3. Analysis and Results
3.1. Relationship between Injury Severity and whether an Injury Is Recorded
After collecting, matching, and categorising the data as reported in the methods section above, a total of 53 cases were available for comparison. Fifty-two of these cases were claimed and accepted by the insurer, meaning that they had some level of medical treatment that an external governing body deemed as related to work. It is unknown why one injury was recorded but has no matching insurance record.
Table 1 shows all incidents in the IMS for the study period, classified according to how they were treated at the time the occurred, and how they appear in the insurance data. All of the incidents analysed further in this paper represent accepted insurer cases, meaning they all had some level of medical treatment that an external governing body deemed related to work.
In the jurisdiction for this study, there is no legal or regulatory definition for a “recordable” incident. An injury can be eligible for an insurance claim without reaching the threshold for notification to the regulator.
A “recordable incident” is defined using the United States Department of Labour definition [14], which includes all injuries requiring medical treatment beyond first aid, or resulting in time lost from work. (The participating Australian business is a branch of a multi-national organisation that follows the US reporting definitions globally.) All injuries that result in an insurance claim qualify as recordable according to that definition. The concept of a “recordable injury” is intended to ensure that the most significant incidents are separately recorded for business purposes such as evaluating the safety performance of individuals, business units, and the company.
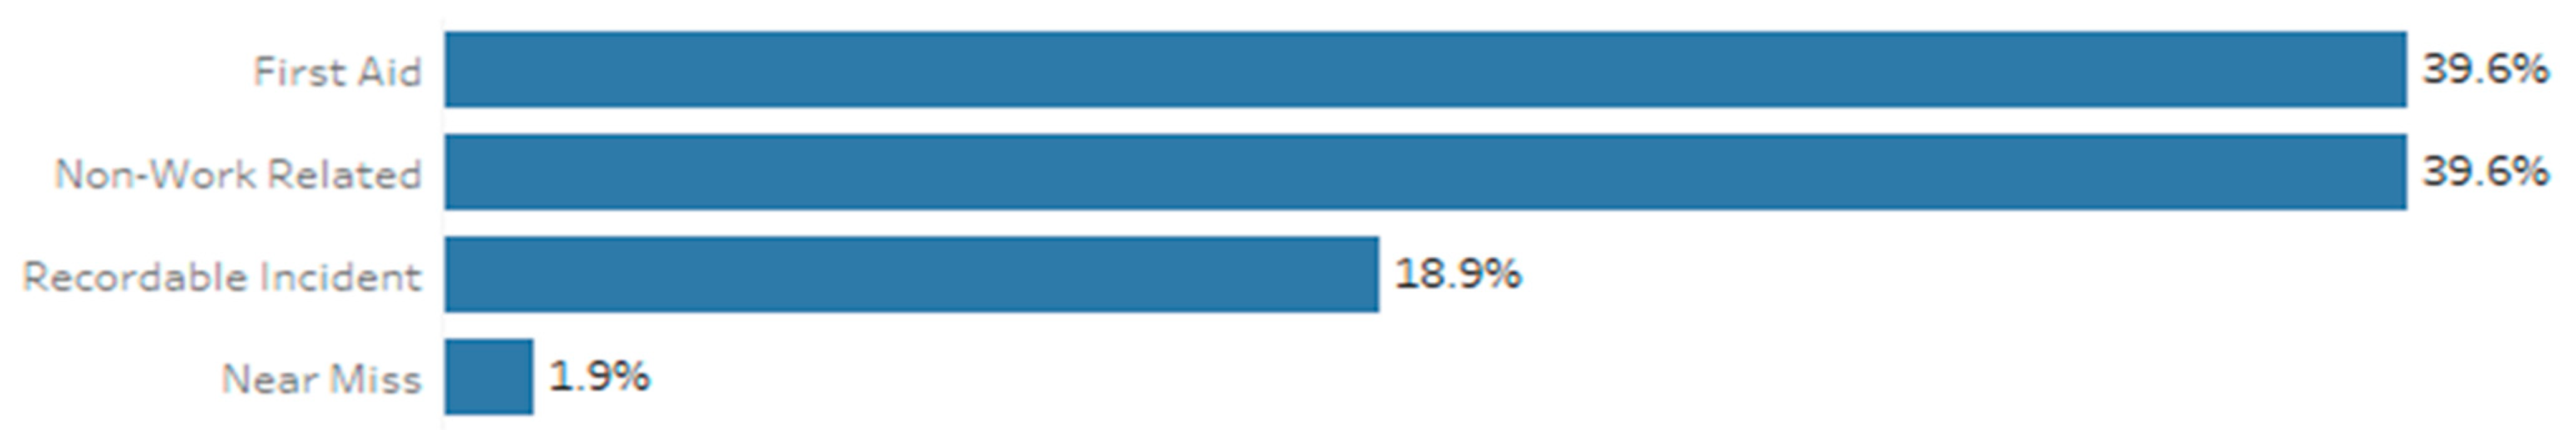
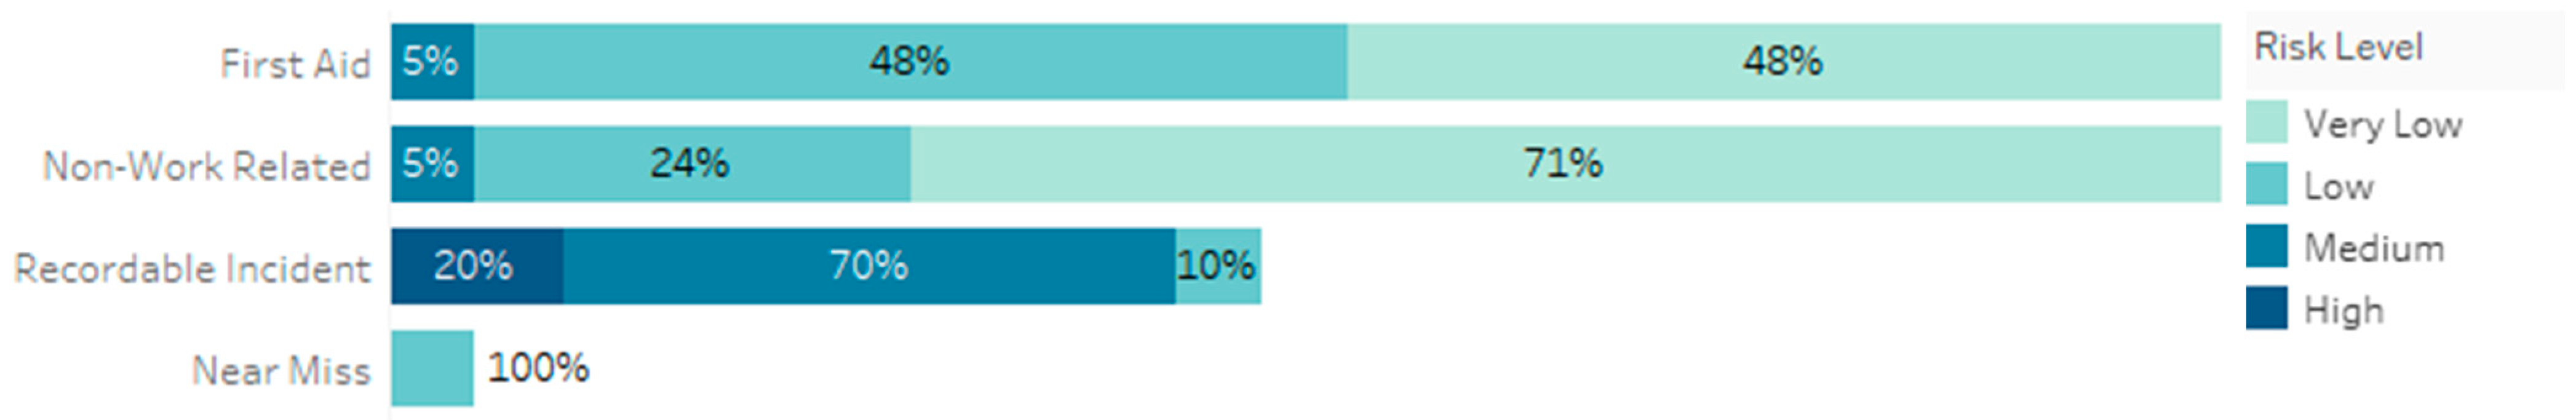
As Figure 1 shows, using the one-to-one injury matching method, only 19% (10 of 53) insurance claim injuries were considered recordable. Of the remainder, 39% were not recognised at the time as work-related injuries, and another 39% were recognised as injuries (i.e., classified as “first aid”), but the need for further medical treatment was not recognised. The remaining incident was recorded as a “near miss” despite the later insurance claim.
Previous research that suggests that only around 20% of injuries are recorded [6,7]. The one-to-one method finding of 18.9% recordable injuries as compared to Work Cover cases is consistent with that finding. The one-to-one method was able to go one step deeper and demonstrate the existence of incidents within the IMS system, and two different sources of misclassification (First Aid, and Non-Work Related). This method could be subsequently used to challenge the prevailing assumption that under-reporting is primarily due to workers not reporting to the company.
Table 2 and Figure 2 refine Table 1 and Figure 1 by indicating the actual severity outcomes for each injury, as defined in Section 2.3.
The one-to-one method demonstrates the ability to draw conclusions previously unavailable from standard LTIFR methodology.
Firstly, the method can measure whether or not the actual severity of an injury influences whether the injury will be reported. In the sample company, High and Very High severity injuries are more likely to be recorded than Low and Medium severity injuries (25% versus 15%).
Secondly, the method can measure whether under-recording is still prevalent even in the most severe injuries. Our sample company demonstrated that only 17% of High severity injuries (1 of 6) and 33% of Very High severity injuries (2 of 6) were considered recordable.
Thirdly, if the intent of defining “recordable” injuries is to capture the most severe injuries in this category, we can effectively measure whether or not the categorisation is succeeding. In our sample company, an injury marked as recordable is just as likely to be less than Medium severity as it is to be above Medium severity (3 of 10 in each case).
Fourthly, the one-to-one method can show where the predominant reason for not categorising High and Very High severity injuries as recordable is that they are considered “Not Work Related”. Of the 12 High and Very High severity injuries, 3 were categorised as “recordable”, 1 was categorised as “first aid”, and 8 were categorised as not work related.
3.2. Relationship between Recorded Severity and Insurance Claim Severity
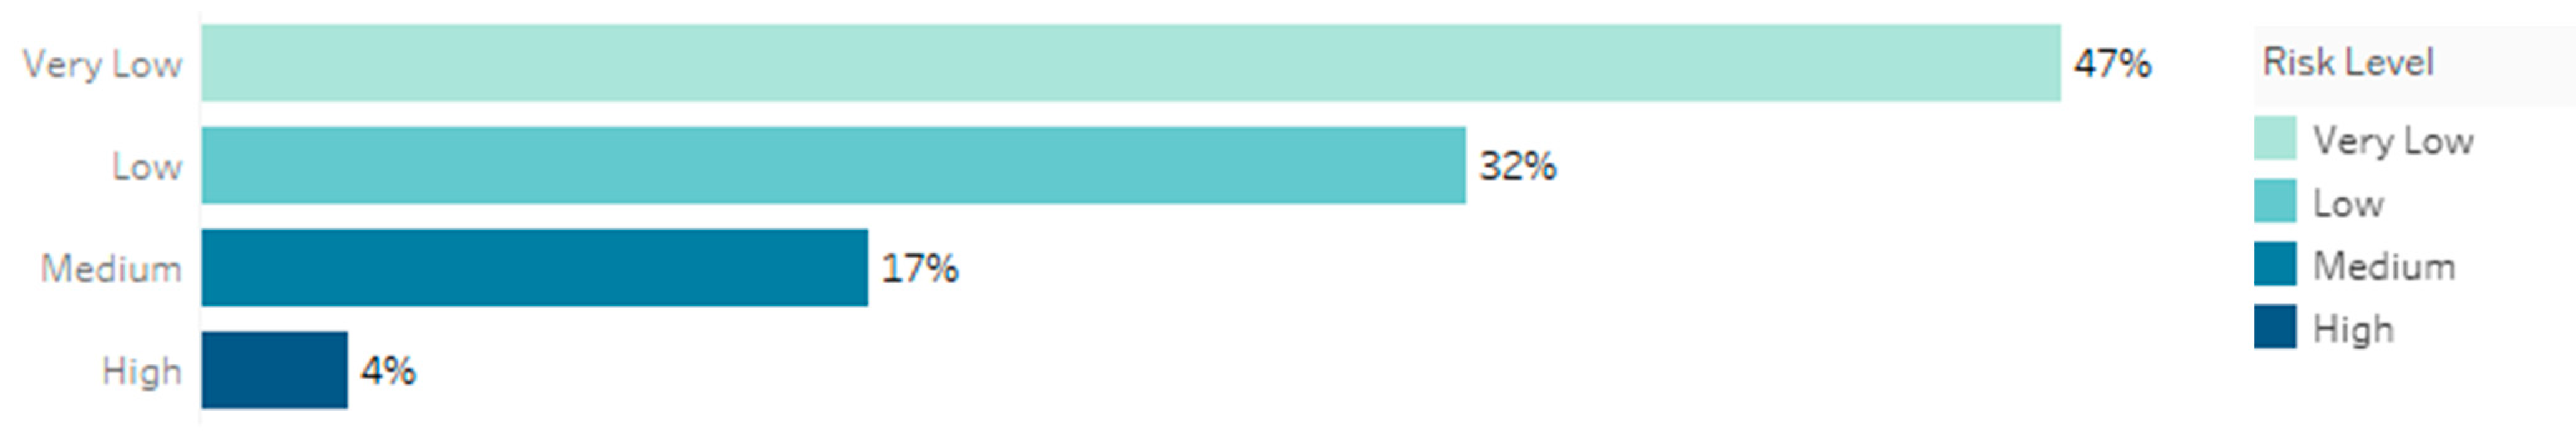
Figure 3 shows the distribution of cases across the severity categories determined from the insurance claim data.
Figure 4 shows the same set of cases as originally classified in the IMS system. These risk ratings were originally assigned by the Site Safety Manager at the time of an incident, and reviewed by a Health and Safety advisor during an investigation.
The categories in Figure 4 are defined in a business risk matrix with measurement criteria. They are intended to serve a similar purpose—a logarithmically growing four-point categorisation scale based on the outcome of an incident. At the population level, Figure 3 and Figure 4 show similar distributions.
However, when examined using the one-to-one method, it is clear that the injury severity outcomes and the risk ratings are not referring to the same incidents. Table 3 below compares the insurance claim severities to the original IMS severity classifications. Inter-rater reliability (Cohen’s Kappa) is 1%, indicating very low agreement.
Figure 5 reproduces Table 3 with colours indicating the ultimate insurance severity of the injuries compared to their original classifications, pictorially illustrating that there is a complete lack of agreement. In this case, using the one-to-one method has the potential to allow us to measure whether our risk ratings for actual events matches the actual outcomes. Note that these differences cannot be explained by the hypothesis that IMS severities reflect potential rather than actual severity, since Figure 3 and Figure 4 do not show IMS severities trending higher than insurance severities.
Table 4 and Figure 6 compare the IMS risk classifications to the IMS categories. Cause and effect cannot be interpreted from these data since categories and severities are determined at the same time, but these data show a strong relationship between initial severity assignment and whether an incident is deemed as recordable. The vast majority of incidents classified as medium or high severity are classified as recordable (9 of 11), and the vast majority of incidents classified as Very Low or Low severity are not classified as recordable (41 of 42).
3.3. Relationship between Severity and Injury Location
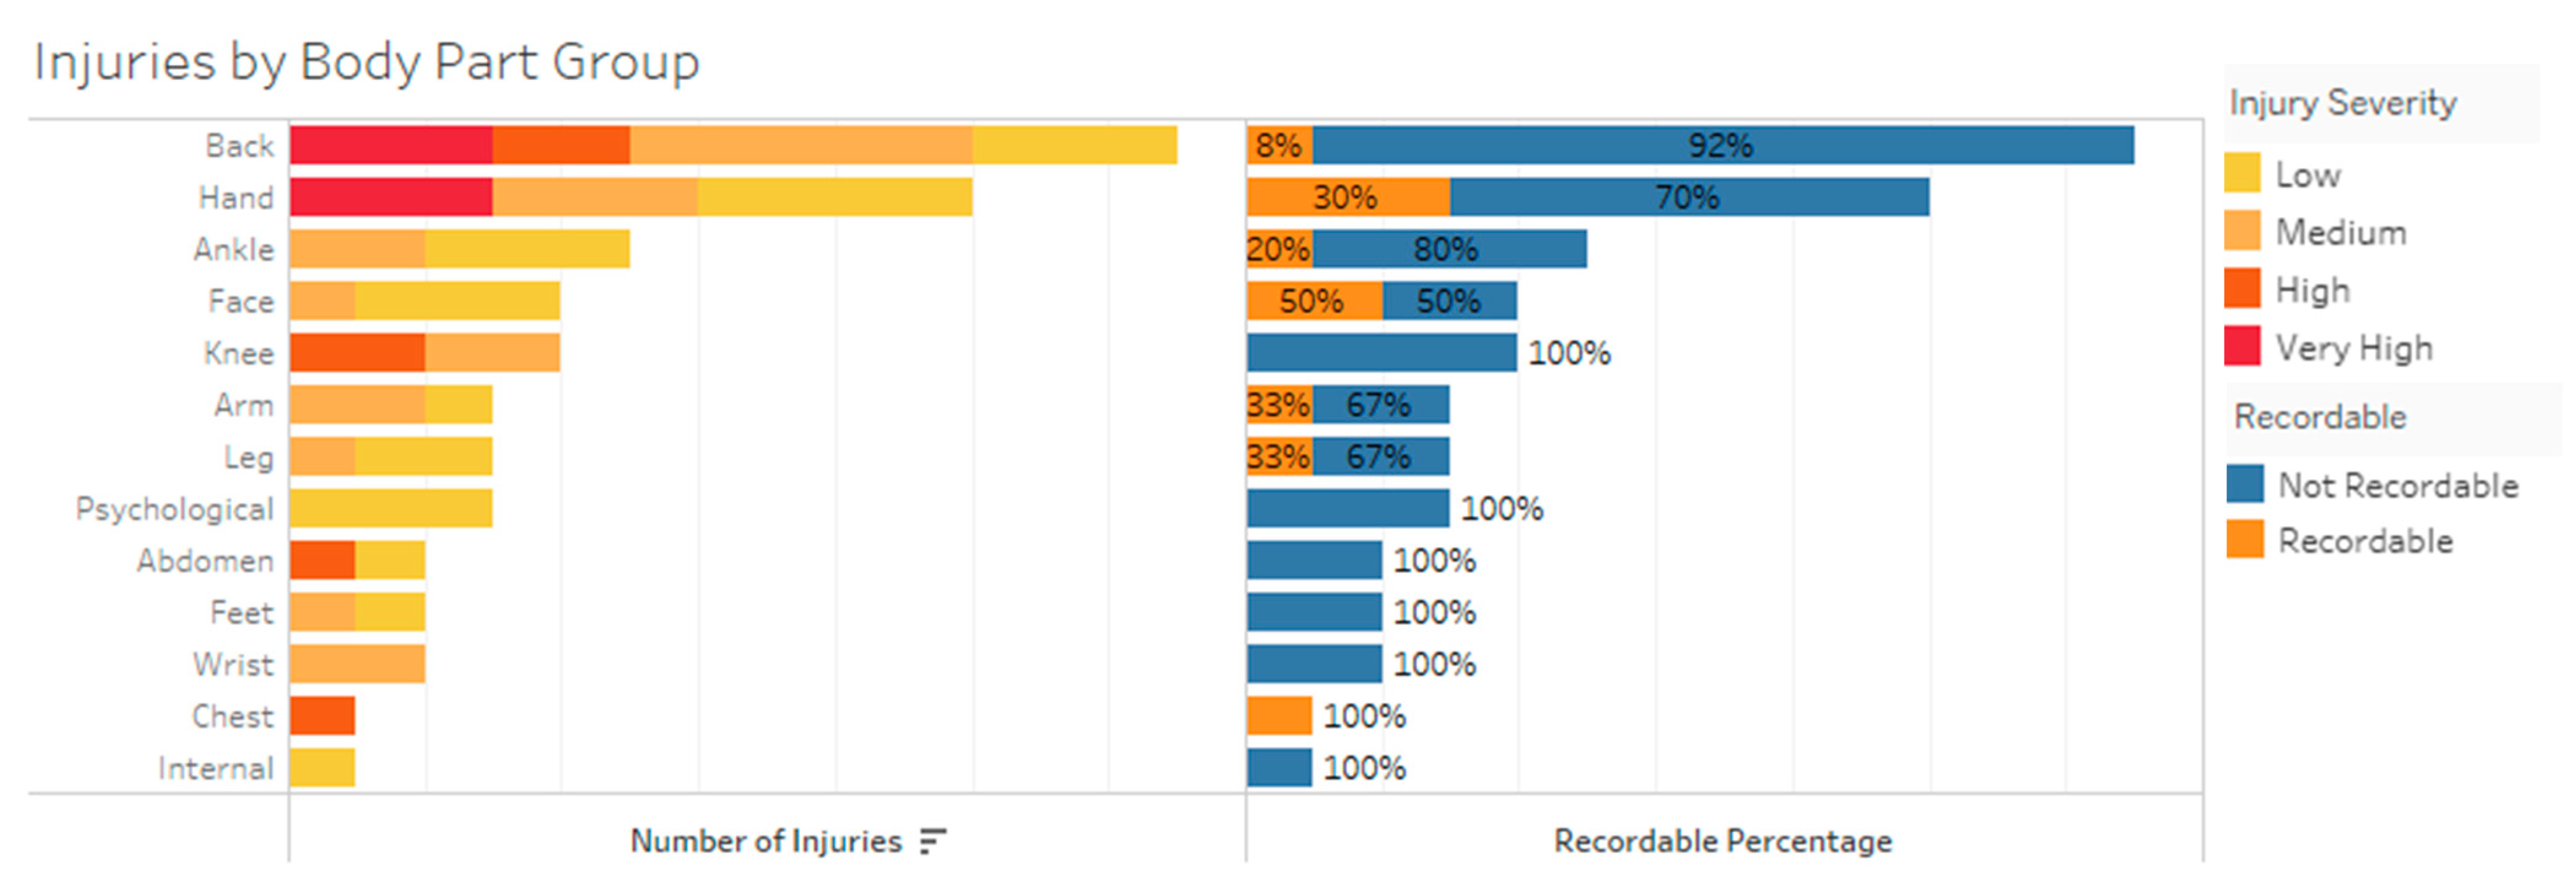
Table 5 and Figure 7 below both show the number of injuries to each body part. For our sample company, back and hand injuries are both more numerous and more severe than other injuries. Figure 7 also adds data from Table 6 on the rate of recordable injuries for any given body part, allowing us to compare the frequency and severity of injury to specific body parts with the likelihood of those injuries being classified as recordable.
Figure 8 below is the same format as Figure 7 but broken down by injury mechanism. The one-to-one method allows us to see a clear difference in terms of what types of injuries are disposed as Recordable. Whilst overall 19% of injuries were originally disposed as Recordable for our sample company, 30% of hand injuries are Recordable, and 8% of back injuries are Recordable. Further, the severity of a hand injury determines whether it will be disposed as Recordable, with 100% of High or Very High hand injuries recorded. However, for our sample company, the severity of a back injury appears inversely related to it being recorded, with 0% High or Very High back injuries recorded. Knee, abdomen, and psychological injuries also appear to be under-recorded, although the very low numbers in these categories prevent firm conclusions. This level of detail in what the nature and severity of incidents that were not considered recordable is, to our understanding, unique to the one-to-one injury matching method.
3.4. Relationship between Mechanism of Injury and Recordable Classification
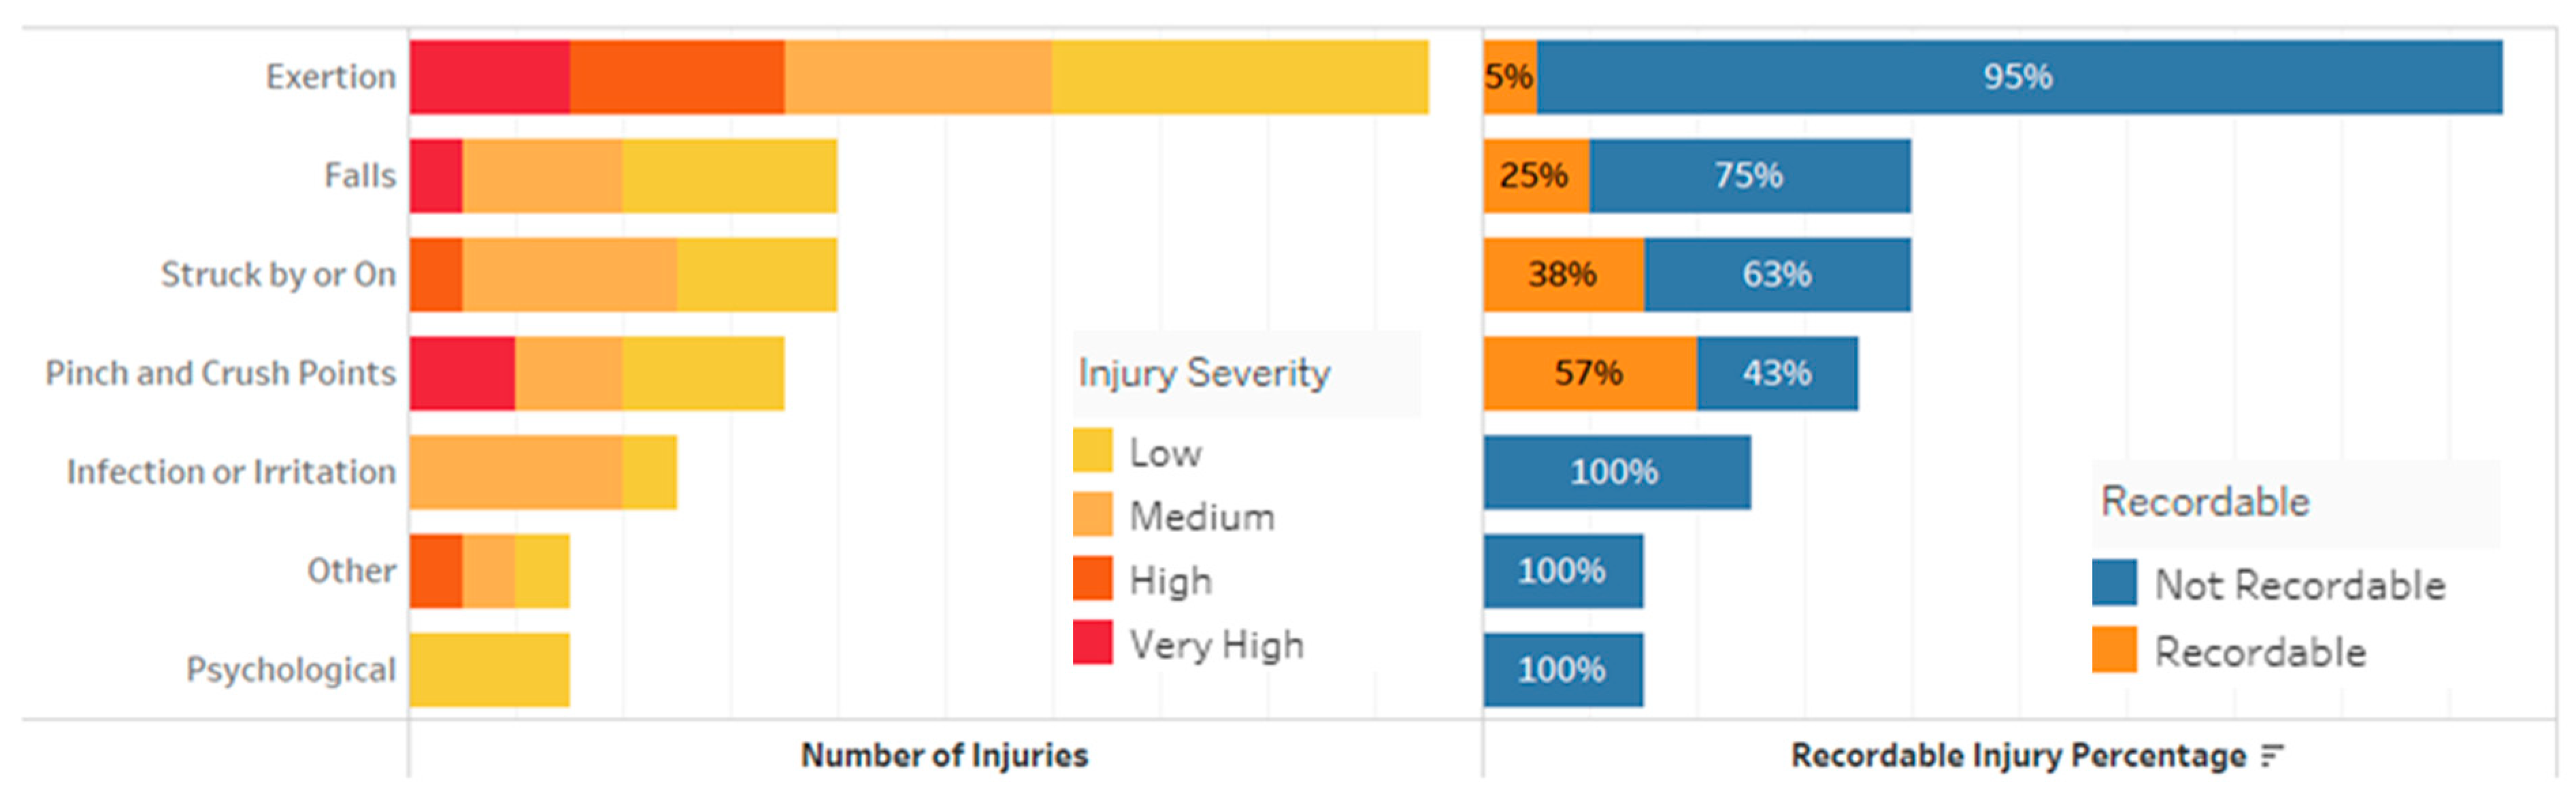
Table 7 and Figure 8 show the injuries sorted by the mechanism of injury. For our sample company, the one-to-one method is able to demonstrate a clear bias in terms of what types of injuries are disposed as Recordable. Of Pinch and Crush injuries, 57% were originally disposed as Recordable, 38% of injuries caused by strike are Recordable, and 5% of exertion injuries are Recordable.
4. Discussion
The purpose of this study was to determine whether or not we can measure bias in the severity and type of injuries that are recorded and see more clearly where it is likely to distort a company’s understanding of injury risk. In this section, we interpret the sample data with respect to this goal.
4.1. We Can Reliably Measure Why Only a Small Subset of Injuries That Receive Medical Treatment Are Disposed as Recordable Incidents
Only 19% of insurance claim cases in this study were originally disposed as Recordable injuries. All of these were accepted as work-related by the insurer, with some level of medical treatment or lost time. Using the one-to-one method, we were able to clearly identify two ways that injuries were incorrectly disposed for our sample company:
- By being considered “first aid only” injuries, despite the need for more serious medical treatment; or
- By being considered “not work related”, despite the eventual insurer decision that the injury was caused by work.
It is tempting to explain these findings as the company trying to “hide” injuries. However, the correlation of this finding with past research (as described in the introduction) makes this unlikely. For 20% of insured injuries becoming recordable to be caused by “hiding” injuries, and then correlate with historical findings, all industries would have to be undertaking to hide injuries and would have to be succeeding at approximately the same rates. The consistency of research in under-reporting suggests that a more systematic problem exists that is consistent across industries and companies. What this study demonstrates is that using the one-to-one method for analysis allows us to find specific potential causes of systematic classification problems.
The advantage of the “one-to-one injury matching” methodology is that we have the ability to probe the specific unrecorded cases and provide an alternate explanation. It appears that the definitions of “work-related”, “first-aid” and “medical treatment” within industry have significantly departed from the insurer definitions. These narrower definitions can be seen in the patterns of injury types that are classified as Recordable.
Assuming that the insurer definition of “work-related” encompass injuries that are within the power of the company to prevent or mitigate, then departure from this definition could be measured by the one-to-one injury matching method. Assuming that the insurer definitions of medical treatment are accurate—a reasonable supposition since they are based on the actual care provided—then the method could be used to determine if care was affecting classification of injuries, or vice versa.
It is beyond the scope of this study to confirm why the industry definitions have become narrower. It is reasonable to infer that there is systemic pressure to reduce the number of recordable injuries, and, as discussed above, it is unlikely that this pressure comes from the insurer or the regulator. Our interpretation is that the pressure stems from the use of recordable injuries as a performance measure, both within companies and along supply chains. We have demonstrated that the one-to-one injury matching method would have the ability to measure the extent to which definitions have narrowed.
4.2. We Can Measure whether the Actual Severity of an Injury Is the Determining Factor in whether an Injury Is Disposed as Recordable
Applied to our sample company, we were able to use the method to demonstrate that High and Very High severity injuries are somewhat more likely to be disposed as recordable than less severe injuries. However, numerous cases involving significant medical cost and lost time were considered “not work related” or were disposed as “first aid only”.
Whilst the exact figures could not be included in this study due to commercial confidentiality, the total cost of “not work related” injuries exceeds the total cost of “recordable” injuries, and “first aid only” injuries were cumulatively less expensive than “recordable” injuries. We have clearly demonstrated that using the one-to-one injury matching method, we are able to measure the extent to which our most severe injuries are, or are not, classified as recordable.
4.3. We Can Measure whether or Not Risk Assessment Ratings Generated within the Business Had a Reliable Connection with the Actual Outcomes of Injuries
Using our method, when comparing the “Risk Rating” of an incident with the actual outcome, there was no recognisable connection between risk ratings and actual impacts. Cohen’s Kappa of 1% suggests that any matches were due to random chance.
There is, however, a close relationship between the risk rating and whether or not an injury is disposed as recordable. These data afford two possibilities, depending on the direction of causality:
- That the severity of injuries is being systematically under-estimated, resulting in incorrect decisions not to categorise the injuries as recordable; or
- That under-recording is happening for some other reason, and then being justified by assigning matching severity classifications.
The one-to-one injury method was able to measure specific “blind spots” where incidents have a severe actual outcome, but are recorded by the business as low risk.
Injury reports are the only “hard” data a company has to confirm and improve their risk assessment processes. This finding demonstrates the real practical harm from incorrect disposition of incidents. Whilst a causal connection cannot be confirmed from this study, it can be reasonably inferred that the company is not just misleading itself about the total number and severity of injuries, it is also distorting its understanding of where the greatest risks of injury exist.
4.4. We Can Measure whether or Not the Mechanism of Injury and the Body Part Injured Are Significant Determinants to What Is Reported as High Risk and Recordable
Using the one-to-one method, we were able to demonstrate a strong pattern around which injuries are disposed as recordable. This has the potential to back our inference of distorted risk understanding on a larger scale. For our sample company, whilst hand injuries are more likely than most injuries to be recordable, back injuries are significantly less likely. Several other body parts, all also associated with exertion or chronic injury, have a high likelihood of being incorrectly disposed.
Using the one-to-one method for our sample company allowed us to measure a significant safety blind-spot created by a bias in classification of injuries based on mechanism. The ability to measure this sort of bias could be key for businesses that depend on these data for safety programs. For our sample company, according to the recordable data, we would focus our efforts on hand injuries and pinch/crush point mechanisms, which we would then corroborate with our risk assessments to tell ourselves we are working on the right thing.
5. Conclusions and Implications for Measurement Practice
Our method of analysis, “one-to-one injury matching”, allow us to measure the relationship between treatment of injuries internal to a company and by external stakeholders. The method is capable of quantifying bias in the determination of what is considered an injury and how severe it is.
In safety management, we pay attention to what is reported, and we report what we consider to deserve the most attention. Selection bias in reporting has the potential to create an echo-chamber in which some of the most serious threats to safety are misunderstood. The one-to-one injury matching method is able to provide a reliable measurement of the efficacy of recordable injuries as a representative of all injuries, and provide actionable insights as to where there are classification biases.
Recordable injuries are the cornerstone of safety performance measurement in many industries; if clear biases exist in the classification of Recordable injuries, we need to acknowledge them and understand them. Early application of the one-to-one injury matching method suggest that our current systems steer us away from certain causes and types of injuries. Based on larger studies, industry-wide approaches to safety reporting and classification need to be developed to ensure we collectively address systematic biases in our reporting while neither jeopardising nor rewarding individual businesses based on the extent of bias in their metrics.
Without a measurable definition of actual incident severity, it is possible that industry has an altered perception of risk that is more aligned with “recordable injury” definitions than actual injury outcomes. We have demonstrated a means by which to measure risk and classification against actual outcomes that would allow us to measure exactly how far our definitions have departed from actual outcomes. A practical and tangible definition of severity, such as the actual cost of medical treatment and lost time, as was used in this analysis, ensures that measurement bias is not affecting our understanding of risk. Without considering the actual and tangible outcomes of injuries, systematic bias is likely to contaminate injury measurement.
Lack of an actual impact measure of injuries limits the overall reliability of lost-time injury reporting; it also limits our ability to learn from lower severity incidents. Without a clear definition of severity, we have a diatomic system that treats moderate severity injuries as either statistically equivalent to a fatality, or statistically irrelevant, with no in-between. Instead of learning from these moderate severity incidents, companies face strong internal pressure to treat them as non-events (in this study, either “first aid” or “not work related”). We demonstrated that by using the one-to-one injury matching method, we could measure the extent to which we have classified incidents correctly according to their actual outcomes. Expanding on the use of actual outcomes from injuries may help us to better acknowledge moderate incidents, allowing organisations to spend more time managing safety instead of managing incident classifications.
The nature of one-to-one injury matching means that it must be applied by individual companies that employ the people who were injured. A larger study across multiple companies could be undertaken with this methodology and further work is needed to confirm whether the specific patterns of bias revealed in this case study are generalisable across the energy sector and beyond. However, until this work is performed, the default assumption for any company should be that reportable injuries are not representative of the severity and nature of actual injuries.
Author Contributions
Conceptualisation, K.G., S.D., and A.R.; methodology, K.G. and A.R.; formal analysis, K.G. and A.R.; investigation, K.G.; writing—original draft preparation, K.G. and A.R; writing—review and editing, S.D. All authors have read and agreed to the published version of the manuscript.
Funding
This research received no external funding.
Data Availability Statement
3rd Party Data—Restrictions apply to the availability of these data. Data was obtained from Savanna Energy Australia and are available from the authors with the permission of Savanna Energy Australia.
Conflicts of Interest
The authors declare no conflict of interest.
References
- Hallowell, M.; Quashne, M.; Salas, R.; MacLean, B.; Quinn, E. Statistical Invalidity of TRIR; Construction Safety Research Alliance: Boulder, CO, USA, 2020; Available online: http://matt.colorado.edu/papers/StatisticalInvalidityOfTRIR.pdf (accessed on 2 December 2020).
- Amalberti, R. The paradoxes of almost totally safe transportation systems. Saf. Sci. 2001, 37, 109–126. [Google Scholar] [CrossRef]
- Rae, D. Risk and Safety Indicators. In Handbook of Safety Principles; John Wiley & Sons, Ltd.: Hoboken, NJ, USA, 2017; pp. 142–163. [Google Scholar]
- Hopkins, A. The limits of lost time injury frequency rates. In Beyond Lost Time Injuries: Positive Performance Indicators for OHS—Part 1: Issues; Australian Government Publishing Service: Canberra, Australia, 1994. [Google Scholar]
- Shannon, H.S.; Lowe, G.S. How many injured workers do not file claims for workers’ compensation benefits? Am. J. Ind. Med. 2002, 42, 467–473. [Google Scholar] [CrossRef] [PubMed]
- Pransky, G.; Snyder, T.; Dembe, A.; Himmelstein, J. Under-reporting of work-related disorders in the workplace: A case study and review of the literature. Ergonomics 1999, 42, 171–182. [Google Scholar] [CrossRef] [PubMed]
- De Silva, N.; Rathnayake, U.; Kulasekera, K. Under-reporting of construction accidents in Sri Lanka. J. Eng. Des. Technol. 2018, 16, 850–868. [Google Scholar] [CrossRef]
- Stout, N.; Bell, C. Effectiveness of source documents for identifying fatal occupational injuries: A synthesis of studies. Am. J. Public Health 1991, 81, 725–728. [Google Scholar] [CrossRef] [PubMed]
- Safe Work Australia. Guide to the Work Health and Safety Act; 2019; Available online: https://www.worksafe.qld.gov.au/__data/assets/pdf_file/0023/22289/guide-to-work-health-and-safety-act-2011.pdf (accessed on 3 October 2020).
- O’Neill, S.; McDonald, G.; Deegan, C.M. Lost in translation. Account. Audit. Account. J. 2015, 28, 180–209. [Google Scholar] [CrossRef]
- Maslin, C. An Investigation into the Measurement of Workplace Injury Severity. Labour Employ. Work N. Z. 2006, 438–442. [Google Scholar] [CrossRef] [Green Version]
- Brown, J.B.; Gestring, M.L.; Leeper, C.M.; Sperry, J.L.; Peitzman, A.B.; Billiar, T.R.; Gaines, B.A. The value of the injury severity score in pediatric trauma. J. Trauma Acute Care Surg. 2017, 82, 995–1001. [Google Scholar] [CrossRef] [PubMed]
- Sears, J.M.; Blanar, L.; Bowman, S.M.; Adams, D.; Silverstein, B.A. Predicting Work-Related Disability and Medical Cost Outcomes: Estimating Injury Severity Scores from Workers’ Compensation Data. J. Occup. Rehabil. 2013, 23, 19–31. [Google Scholar] [CrossRef] [PubMed]
- Occupational Safety and Health Administration. Code of Federal Regulations 29 Part 1904 Recording and Reporting Occupational Injuries and Illness; United States Department of Labor: Washington, DC, USA, 2014. [Google Scholar]
Figure 1.
Injuries sorted by original classification.

Figure 2.
Original incident classifications coloured by actual severity.
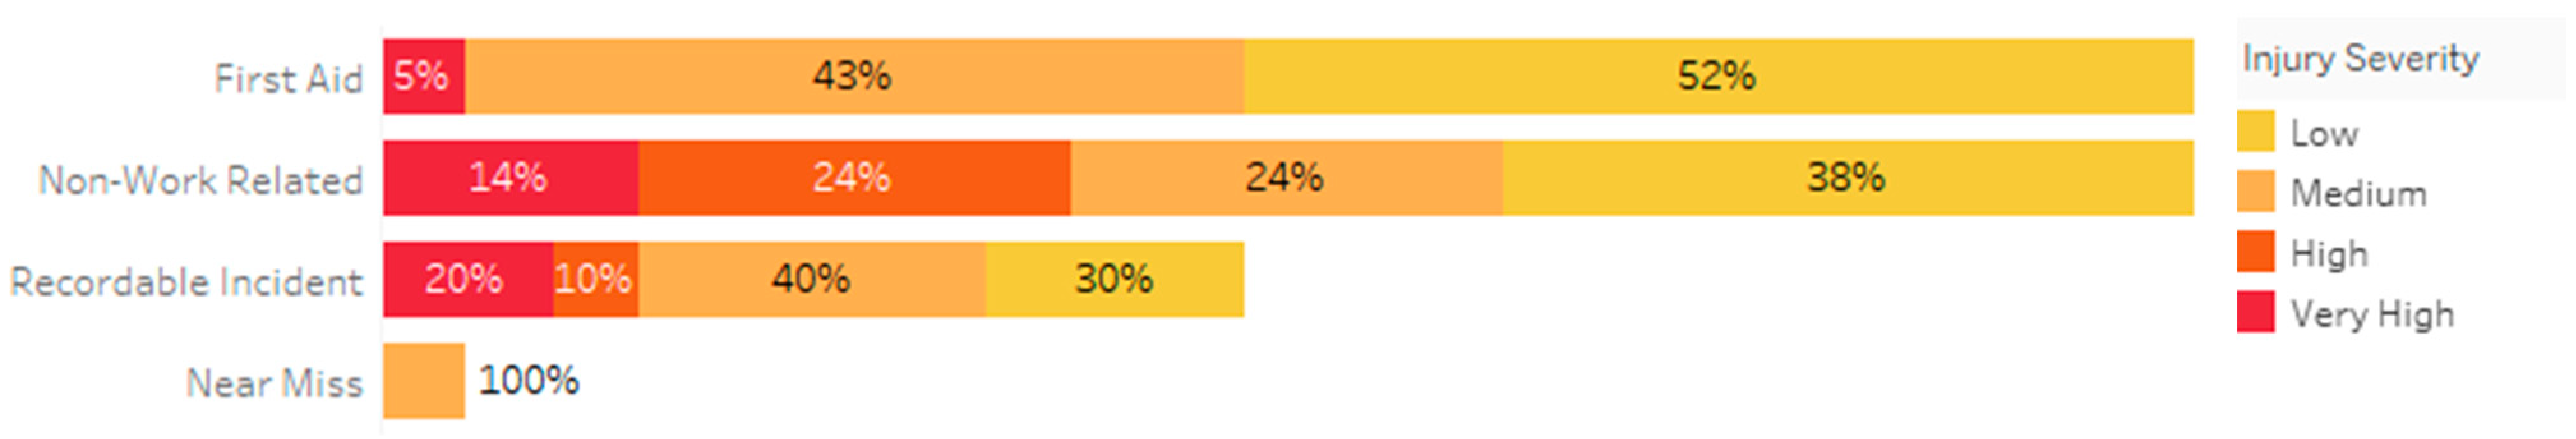
Figure 3.
Percentage of injuries by insurance claim severity.
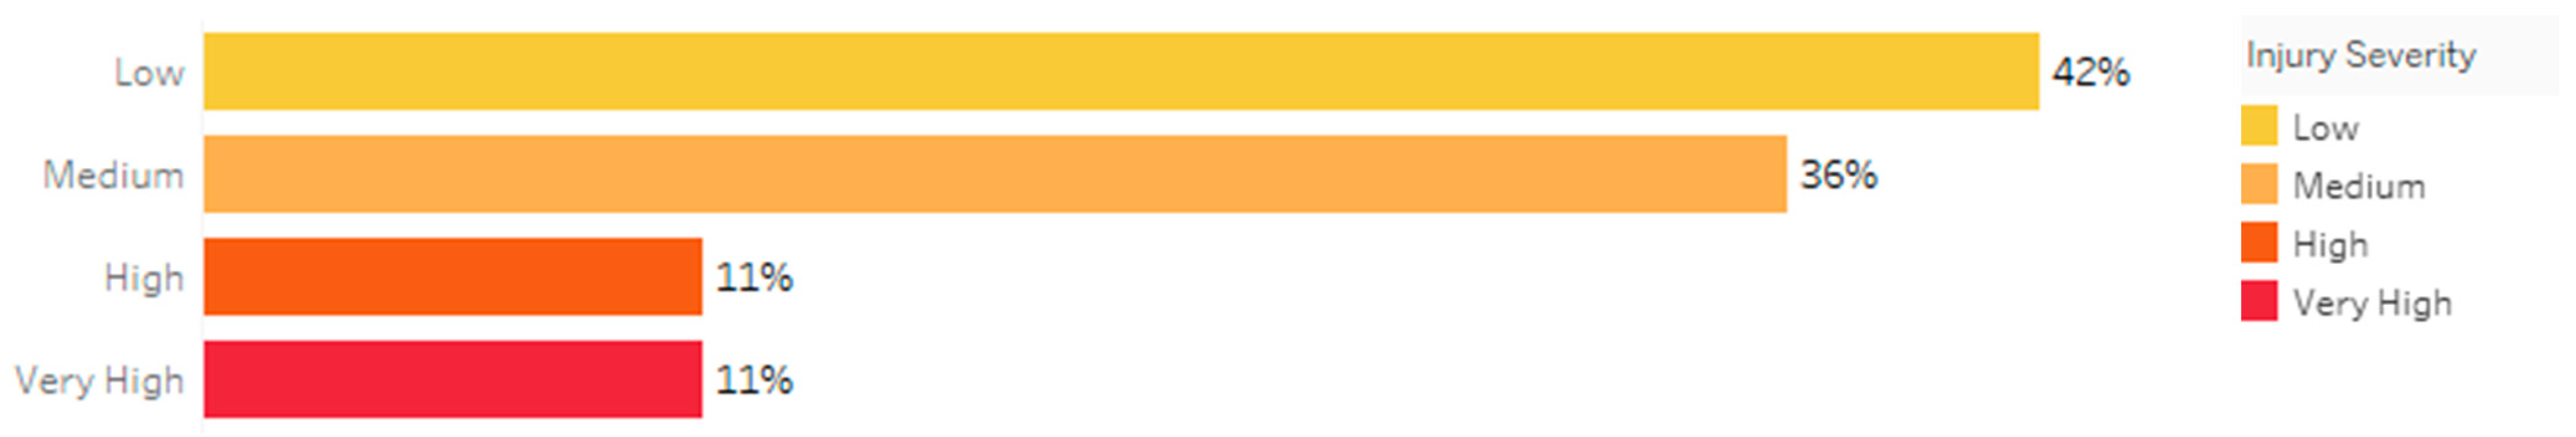
Figure 4.
Percentage of injuries by IMS risk rating.

Figure 5.
Percentage of injuries by IMS risk rating, coloured by actual insurance severity.
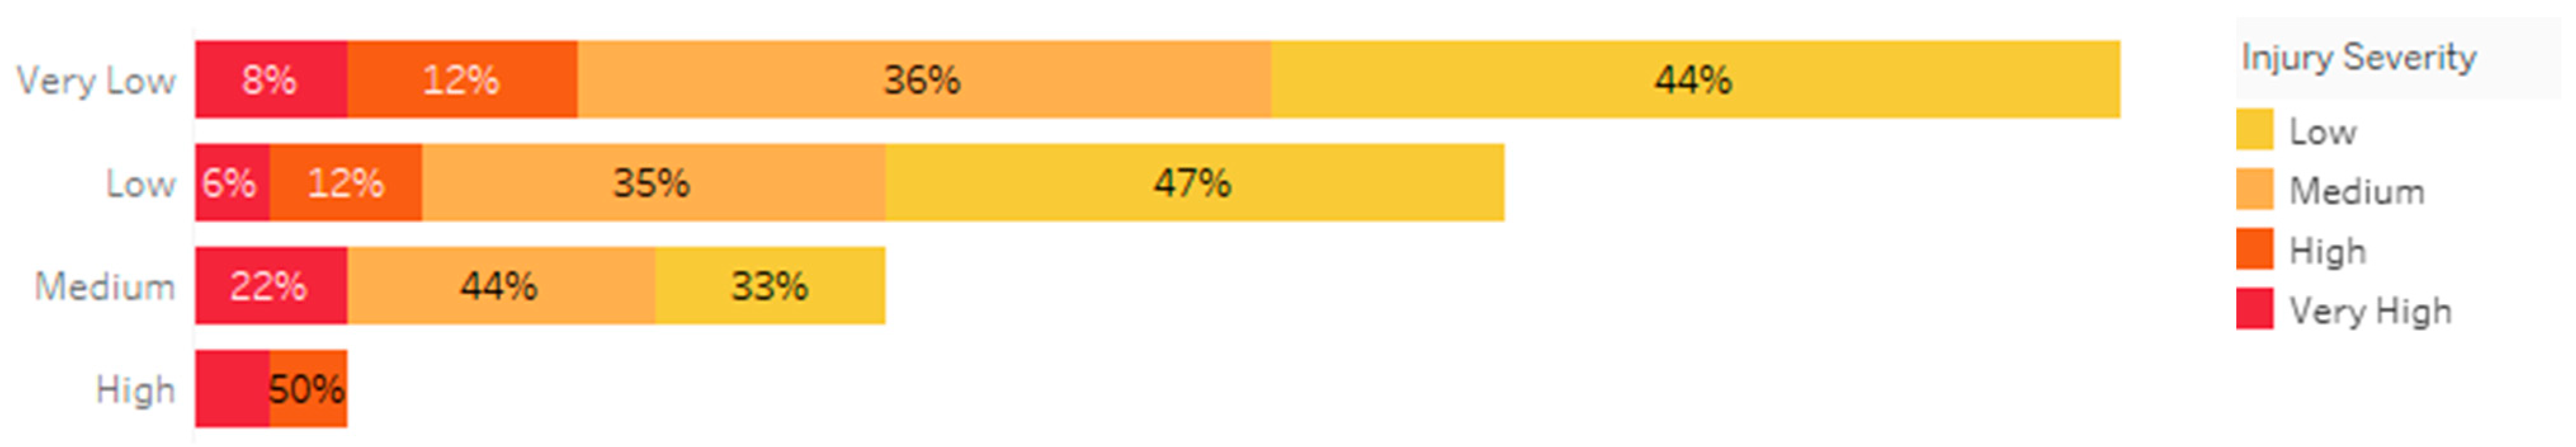
Figure 6.
Percentage of injuries by incident classification.

Figure 7.
Volume of injuries by body part (coloured by insurance claim severity) beside recordable classification.
Figure 7.
Volume of injuries by body part (coloured by insurance claim severity) beside recordable classification.

Figure 8.
Volume of injuries by mechanism (coloured by insurance claim severity) beside recordable classification.
Figure 8.
Volume of injuries by mechanism (coloured by insurance claim severity) beside recordable classification.


Table 1.
Contingency table of insurance records and IMS classifications.
| IMS Classification | No Matching Insurance Record | Matching Insurance Record |
|---|---|---|
| First Aid | 122 | 21 |
| Non-Work Related | 218 | 21 |
| Recordable Incident | 1 | 10 |
| Near Miss | 135 | 1 |
| 3rd Party | 73 | |
| Environmental (Spill) | 140 | |
| Equipment Damage | 504 | |
| Motor Vehicle | 51 | |
| Total | 1244 | 53 |
Table 2.
Contingency table of injury severities and IMS classifications.
| Actual Severity (Based on Insurance Claim) | |||||
|---|---|---|---|---|---|
| IMS Classification | No Claim | Low | Medium | High | Very High |
| First-aid | 122 | 11 | 9 | 0 | 1 |
| Not work related | 218 | 8 | 5 | 5 | 3 |
| Recordable | 1 | 2 | 4 | 1 | 2 |
| Near Miss | 135 | 1 | |||
| Total | 476 | 21 | 19 | 6 | 6 |
Table 3.
Contingency table of injury severity classifications.
| IMS Severity | |||||
|---|---|---|---|---|---|
| Very Low | Low | Medium | High | ||
| Insurance Claim Severity | Low | 11 | 8 | 3 | |
| Medium | 9 | 6 | 4 | ||
| High | 3 | 2 | 1 | ||
| Very High | 2 | 1 | 2 | 1 | |
Table 4.
Contingency table of IMS categories and severity classifications.
| IMS Severity | |||||
|---|---|---|---|---|---|
| Very Low | Low | Medium | High | ||
| IMS Category | First aid | 10 | 10 | 1 | 0 |
| Non-work related | 15 | 5 | 1 | 0 | |
| Recordable incident | 0 | 1 | 7 | 2 | |
| Near miss | 0 | 1 | 0 | 0 | |
Table 5.
Injury severity and location.
| Insurance Claim Severity | ||||
|---|---|---|---|---|
| Injury Location | Low | Medium | High | Very High |
| Back | 3 | 5 | 2 | 3 |
| Hand | 4 | 3 | 3 | |
| Ankle | 3 | 2 | ||
| Face | 3 | 1 | ||
| Knee | 2 | 2 | ||
| Arm | 1 | 2 | ||
| Leg | 2 | 1 | ||
| Psychological | 3 | |||
| Abdomen | 1 | 1 | ||
| Feet | 1 | 1 | 1 | |
| Wrist | 2 | |||
| Chest | 1 | |||
| Internal | 1 | |||
Table 6.
Injuries by body part, severity, and disposition.
| Insurance Claim Severity | |||||
|---|---|---|---|---|---|
| Low | Medium | High | Very High | ||
| Recordable Incident | Back | 1 | |||
| Hand | 1 | 2 | |||
| Ankle | 1 | ||||
| Face | 2 | ||||
| Arm | 1 | ||||
| Leg | 1 | ||||
| Chest | 1 | ||||
| First Aid | Back | 3 | 3 | ||
| Hand | 2 | 1 | 1 | ||
| Ankle | 2 | ||||
| Face | 1 | 1 | |||
| Knee | 1 | ||||
| Arm | 1 | ||||
| Leg | 1 | 1 | |||
| Feet | 1 | ||||
| Wrist | 1 | ||||
| Internal | 1 | ||||
| Near Miss | Back | 1 | 3 | ||
| Not work related | Back | 2 | |||
| Hand | 2 | 1 | |||
| Ankle | 1 | 1 | |||
| Knee | 1 | 2 | |||
| Arm | 1 | ||||
| Psychological | 3 | ||||
| Abdomen | 1 | 1 | |||
| Feet | 1 | ||||
| Wrist | 1 | ||||
Table 7.
Injuries by mechanism and recordable classification.
| Recordable Classification | |||
|---|---|---|---|
| Not Recordable | Recordable | ||
| Exertion | Low | 7 | |
| Medium | 4 | 1 | |
| High | 4 | ||
| Very High | 3 | ||
| Falls | Low | 3 | 1 |
| Medium | 2 | 1 | |
| Very High | 1 | ||
| Struck by or on | Low | 2 | 1 |
| Medium | 3 | 1 | |
| High | 1 | ||
| Pinch and Crush Points | Low | 2 | 1 |
| Medium | 1 | 1 | |
| Very High | 2 | ||
| Infection or Irritation | Low | 1 | |
| Medium | 4 | ||
| Other | Low | 1 | |
| Medium | 1 | ||
| High | 1 | ||
| Psychological | Low | 3 | |
Publisher’s Note: MDPI stays neutral with regard to jurisdictional claims in published maps and institutional affiliations. |
© 2021 by the authors. Licensee MDPI, Basel, Switzerland. This article is an open access article distributed under the terms and conditions of the Creative Commons Attribution (CC BY) license (https://creativecommons.org/licenses/by/4.0/).
Share and Cite
MDPI and ACS Style
Geddert, K.; Dekker, S.; Rae, A. How Does Selective Reporting Distort Understanding of Workplace Injuries? Safety 2021, 7, 58. https://0-doi-org.brum.beds.ac.uk/10.3390/safety7030058
AMA Style
Geddert K, Dekker S, Rae A. How Does Selective Reporting Distort Understanding of Workplace Injuries? Safety. 2021; 7(3):58. https://0-doi-org.brum.beds.ac.uk/10.3390/safety7030058
Chicago/Turabian StyleGeddert, Kevin, Sidney Dekker, and Andrew Rae. 2021. "How Does Selective Reporting Distort Understanding of Workplace Injuries?" Safety 7, no. 3: 58. https://0-doi-org.brum.beds.ac.uk/10.3390/safety7030058
Note that from the first issue of 2016, this journal uses article numbers instead of page numbers. See further details here.