
Improving Airline Pilots’ Visual Scanning and Manual Flight Performance through Training on Skilled Eye Gaze Strategies


1
ISAE-SUPAERO, Université de Toulouse, 31400 Toulouse, France
2
CLLE, Université de Toulouse, CNRS, UT2J & ENAC, 31400 Toulouse, France
*
Authors to whom correspondence should be addressed.
Safety 2021, 7(4), 70; https://0-doi-org.brum.beds.ac.uk/10.3390/safety7040070
Submission received: 28 April 2021
/
Revised: 10 September 2021
/
Accepted: 8 October 2021
/
Published: 14 October 2021
(This article belongs to the Special Issue Human Performance and Aviation Safety: New Challenges for Neuroergonomics and Artificial Intelligence)
Abstract
:Poor cockpit monitoring has been identified as an important contributor to aviation accidents. Improving pilots’ monitoring strategies could therefore help to enhance flight safety. During two different sessions, we analyzed the flight performance and eye movements of professional airline pilots in a full-flight simulator. In a pre-training session, 20 pilots performed a manual approach scenario as pilot flying (PFs) and were classified into three groups according to their flight performance: unstabilized, standard, and most accurate. The unstabilized pilots either under- or over-focused various instruments. Their number of visual scanning patterns was lower than those of pilots who managed to stabilize their approach. The most accurate pilots showed a higher perceptual efficiency with shorter fixation times and more fixations on important primary flight instruments. Approximately 10 months later, fourteen pilots returned for a post-training session. They received a short training program and performed a similar manual approach as during the pre-training session. Seven of them, the experimental group, received individual feedback on their own performance and visual behavior (i.e., during the pre-training session) and a variety of data obtained from the most accurate pilots, including an eye-tracking video showing efficient visual scanning strategies from one of the most accurate pilots. The other seven, the control group, received general guidelines on cockpit monitoring. During the post-training session, the experimental group had better flight performance (compared to the control group), and its visual scanning strategies became more similar to those of the most accurate pilots. In summary, our results suggest that cockpit monitoring underlies manual flight performance and that it can be improved using a training program based mainly on exposure to eye movement examples from highly accurate pilots.
1. Introduction
In the cockpit, visual scanning is a necessary choreography that aims at monitoring the state of the different systems and maneuvering the aircraft toward the desired attitudes. The instruments (e.g., attitude indicator, speed, altimeter, and engine parameters) and the external environment (by clear weather) must be frequently monitored in order to build and maintain up-to-date situational awareness. Performing efficient visual scanning is complex, and the issue of improper monitoring in the cockpit is not new: it was identified by the National Transportation Safety Board (NTSB) as being involved in 84% of major accidents in the United States from 1978 to 1990 [1]. It has been shown that pilots are sometimes surprisingly unaware of basic flight indicators [2]. A study from the “Loss of Control Action Group” showed that poor monitoring was a contributing factor in at least 10 crashes, resulting in a total of 651 casualties [3]. In fact, since the NTSB study period (1978–1990), 17 new accidents involving monitoring problems were identified in 2015 [4]. These findings suggest that improving onboard surveillance will require further effort in the future, in particular through the development of both initial and recurrent training programs. The importance of appropriate monitoring led to “the conversion of the term pilot not flying (PNF) to pilot monitoring (PM)”; see [5]. Major aviation safety institutions, such as the IATA in 2016, have issued recommendations to enhance pilots’ cockpit monitoring and awareness [6,7]. Despite this subdivision of roles in the cockpit, both pilot flying (PF) and PM perform the monitoring task, and the literature shows that PF and PM demonstrate distinct visual scanning during a flight [8,9].
In 2013, the Federal Aviation Administration (FAA) required airlines to incorporate an explicit training program to improve monitoring skills [6], and the Bureau Enquêtes-Accidents (BEA, the French accident investigation agency) has recommended studying pilots’ monitoring with eye tracking. In particular in the PARG study [10], the BEA encourages the use of eye-tracker systems to finely analyze crews’ visual scanning strategies. Interestingly, during the PARG study [10], an extensive survey conducted on 931 pilots showed that the majority are in need of a better description of what “standard” visual scanning in the cockpit should be. In this sense, another recent survey [11] revealed that 75% of pilots reported that the publication of information on the required visual scanning patterns for the different flight phases could be helpful toward enhancing their monitoring skills. In line with the FAA recommendations issued in 2013, advocating the implementation of cockpit monitoring training programs and taking note of the BEA recommendations on the use of eye tracking to better understand pilots’ visual scanning, we assume that a major axis of improvement of monitoring skills relies on the introduction of eye tracking in the pilots’ training program.
1.1. Manual Flight Control and Visual Scanning Strategies
Manual control of aircraft has been described as a psycho-motor and highly skilled task requiring continuous adjustments, mainly through adequate fine-motor inputs, by the human pilot to a control yoke or a sidestick [12]. The pilot must continuously control and monitor cross-coupled flight parameters (e.g., speed, altitude, deviations from the desired flight path, etc.). The sensing of flight data, its interpretation and processing, and the subsequent physical adjustments of the flight control to achieve the desired flight path have been described as a “closed-loop” control task. The pilot receives feedback from various sources (e.g., motion of the aircraft and cockpit instruments) via biological sensory systems and complex brain mechanisms that are engaged to integrate and interpret these different cues. If needed, motor actions are performed to reach the desired orientation of the aircraft [13]. Pilots who are manually flying are continuously performing this closed-loop processing [14]. According to [15], pilots develop a mental model that acts as a mechanism of mental projection, enabling the anticipatory control of the system. These mental models are simplifications of the actual system (heuristic) that allows a pilot to quickly and accurately anticipate how the aircraft will behave. Manual control is subject to erosion due to a lack of practice, related to less manual flying and more use of automation, in particular in long-haul pilots that have fewer chances to actually manipulate the controls [16].
Effective cockpit monitoring is a key element of manual flight control. It helps to keep pilots in the loop by continuously updating their situational awareness about the current state of the aircraft [17]. Cockpit monitoring can be described as the methodical and meaningful visual scanning of instruments, necessary to control the aircraft trajectory or to make appropriate changes in aircraft attitude. Effective cockpit monitoring enables pilots to quickly correct potential flight path deviations. During their ab initio training, pilots learn to fly in Instrument Meteorological Conditions (IMC), i.e., poor visibility conditions that require flying the aircraft by relying on cockpit instruments only. When flying in IMC, the manual control of the aircraft largely relies on visual monitoring performed by the PF in the cockpit. Bellenkes, Wickens and Kramer [18], and Katoh [19] showed that the visual scanning patterns are clearly specific to each flight phase.
1.2. Visual Scanning Strategies and Flight Experience
Visual scanning strategies (frequency and duration of fixations, visual scanning patterns, etc.) are greatly influenced by pilots’ expertise, e.g., [17,18,19,20]. Gegenfurtner, Lehtinen, and Säljö [21] conducted a review of eye-tracking research in various fields such as radiology, driving, sport, and chess. They highlighted that, compared to less experienced individuals, experts generally demonstrate shorter fixation times during their task. In the context of surgery [22], the expert surgeons showed an efficient “target-oriented” visual behavior. More specifically, they often maintained their gaze on the target (abdominal area) while manipulating the tool, whereas novices were more varied in their behaviors and tended to track the movement of the tool until it reached the target. Several studies in the aeronautical domain showed that pilots’ visual scanning strategies also change with the level of experience [23,24,25]. Interestingly, according to Bellenkes et al. [18], the gaze duration of experts is shorter, and the fixations on instruments are more frequent. Kasarskis, Stehwien, and Hickox [26] also noticed that expert pilots perform more fixations with shorter dwell times than novices and have more structured visual scanning patterns than novices. Their more advanced visual scanning strategies were associated with a higher landing performance.
During a navigation scenario in a helicopter simulator, Sullivan, Yang, Day, and Kennedy [27] highlighted that the overall median pilot fixation times were reduced by 28 ms every 1000 h of flight. They also found that the number of transitions between the Areas Of Interest (AOI) (outside world and navigation chart) increased significantly with experience. In their review on eye movements in medicine and chess, Reingold and Sheridan [28] labeled this greater perceptual effectiveness of experts as the “superior perceptual encoding of domain related patterns”. This capacity of the experienced eye to process information ‘at a glance’ is fascinating, but one might assume that discriminating different fixation times among highly experienced airline pilots is certainly difficult. Thus, the determination of what areas are relevant for experienced pilots probably provides more useful information. Gegenfurtner et al. [21] have shown that experts are more focused on relevant regions while spending less time on them. This visual “information reduction” strategy [29] helps to optimize the processing of visual information by separating relevant and irrelevant information, which has also been found in other aviation-related studies [18]. Schriver, Morrow, Wickens, and Talleur’s [30] study also supports the idea that pilots’ ocular behavior is strongly impacted by experience and practice. They compared the attention distribution among expert and novice pilots during a problem-solving task performed in a flight simulator. Faster decisions in experts were associated with more relevant fixations, for example in the direction of failures when they occurred. Van Meeuwen et al. [31] compared the visual scanning strategies of air traffic controllers with different levels of expertise and showed that experts had more efficient scanning strategies. Novices focused more on the airspace in which planes were required to fly whereas experts considered this area irrelevant because they rapidly identified the exact point of conflict between the two planes.
Given the natural improvement of the visual scanning strategies with increased experience, it could be interesting to develop a training program based on the visualization of eye fixations from highly accurate pilots. In this sense, the works from Jarodzka, Scheiter, Gerjets, and Van Gog [32] and Wolff, Jarodzka, Van den Bogert, and Boshuizen [33] suggest that the modeling of perceptual processes from experts is interesting from a training point of view. Eye-tracking recordings could be used as examples of good/bad visual scanning strategies for monitoring the cockpit. Given the fact that experts prefer to gaze at relevant information [31,34], show more efficient scan paths [31], or seem to fixate for less time on information [27], such training could integrate examples that include these types of metrics.
1.3. Showing Visual Scanning Strategies Examples from Highly Accurate Pilots to Improve Monitoring Skills
Tracking the direction of the other’s gaze is a natural and innate ability to learn [35]. Studies have shown that we are highly sensitive to other people’s gaze [36]. Following another’s gaze can guide attention toward a particular object in the environment. In this sense, the expert’s eye can guide the learners’ attention toward relevant information or the current goal. Van Meeuwen et al. [31] hypothesized that Eye Movement Modeling Examples (EMME) could be used for the teaching of visual problem solving strategies in complex visual domains. The visual attention of the learner is guided by the example, as in a state of joint attention [37]. Joint attention is the phenomenon characterized as automatically looking at an object someone else is looking at [38]. Based on that principle, but in a different manner, eye-tracking video recordings of flight scenario’s with the superimposition of eye fixations on the visual scene could be used as a material for individual feedback (viewing their own visual scanning) and for example-based learning programs (viewing visual scanning from highly accurate pilots). Combined with a summary of visual scanning data (e.g., charts with the percentage of dwell times on the various instruments and those from accurate pilots), less accurate pilots could compare their visual scanning to those of more experienced/accurate ones and identify their visual scanning weakness. The principle of training visual scanning was studied many years ago by Shapiro and Raymond [39] in a video game context. Two groups of players learned visual scanning, either efficiently (designed to reduce eye movements and optimize visual scanning) or inefficiently (designed on the contrary to increase the number of eye movements). The group that was subjected to efficient learning demonstrated better performance than the group who received the inefficient training, minimized their eye movements, and optimized their scanpaths. The group who received an inefficient training had the same performance as an untrained control group. More recently, EMME for the training of novices has been successfully applied to collaborative problem solving [40], reading [41], computer programming [42], observation in medicine [43,44], inspection of visual scenes [45], surgical procedures [46], or aircraft inspection tasks [47]. However, examples where EMME was not superior to traditional training methods can also be seen. For example, in the study by Van Gog et al. [48] using procedural puzzle problem solving, verbal explanations of traditional instructions made EMME redundant in attention guiding. EMME seems to be less efficient for procedural problem-solving skills but would probably be more useful when information is transient, subtle, or highly dynamic and only available for a short period of time, as EMME provides quick attention guidance [49]. In the US Air Force, F16 instructors used eye-tracking technology in real time to improve the awareness of the pilots of their own visual scanning patterns [50]. Interestingly, 82% of the instructors reported that this technology improved the efficiency of training in the flight simulator. In addition, 100% of the instructors believed that eye tracking could be used during initial training to correct precociously inadequate visual scanning strategies. More recently, expert air traffic controllers’ scanpaths have been used as a teaching method to enhance novices’ performance in a conflict detection task [51]. More precisely, novices in the treatment group were exposed to experts’ scanpaths, overlaid on the radar screen during a conflict detection task. Novices in this treatment group outperformed novices from two other groups (“control” and “instruction only”). In addition, the scanpaths of the treatment group tended to become more similar to those of the experts.
1.4. Objectives and Hypotheses
Manual flight performance is largely dependent on efficient cockpit monitoring. Thus, developing a training program for pilots based on the visualization of both one’s own eye movements and eye movements from highly accurate pilots could be an efficient means to improve cockpit monitoring skills. We conducted two separate experimental sessions in an Airbus A320 full-flight simulator, during which pilots performed different approach scenarios with varying levels of automation. In the present study, we focused on a scenario where pilots performed an approach without automation, i.e., manually. The experimental timeline of the two experimental sessions is presented in Figure 1 (only the manual approach scenario considered in this paper is displayed).
During the first session (“pre-training session”), we examined the flight performance and the visual scanning strategies of 20 airline pilots (10 Captains and 10 First Officers forming ten professional flying crews) during the approach phase. There were two main objectives in this first session. The first objective was to contrast PFs according to their flight performance. On the basis of the performance (in particular vertical and lateral deviations regarding the flight path), PFs were separated in three different performance profiles: unstabilized pilots (who decided to go around because they did not manage to stabilize their approach), standard pilots, and the most accurate pilots. Secondly, the ocular behavior of these three performance profiles was examined, allowing the identification of visual scanning strategies associated with a good flight performance. We assumed that PFs with a lesser flight performance would demonstrate sub-optimal visual scanning strategies, with possible under- or over- focalization on critical flight instruments.
During the second (“post-training”) session, 14 of the 20 initial pilots returned and were divided in two distinct groups: the experimental group and the control group, according to the type of training they received. The experimental group was submitted to the training program that included a summary of the visual scanning data of the most accurate pilots, as well as the eye-tracking video recordings showing the visual scanning dynamics of one of the most accurate pilots of the first session. We assumed that the visualization of this video after the presentation of the summary data would help participants be more aware of the differences between their own visual behaviors (such as over- or under-focus on some instruments) and those of an expert. They also received personalized feedback on their own performance and visual scanning strategies (also in the form of eye-tracking recordings). The control group received a generic training that included guidelines on cockpit monitoring. Shortly after the training, both the experimental group and the control group performed a similar flight scenario to the one in the pre-training session. The main objective of this second session was to evaluate the impact of each type of training on flight performance and visual scanning strategies.
We had two hypotheses: we assumed that the experimental group would demonstrate better performance and visual scanning strategies (similar or close to the most accurate pilots) than the control group; and we also assumed that only the pilots from the experimental group would demonstrate a progression (i.e., in comparison to the pre-training session) in their performance and visual scanning strategies.
2. Method
2.1. Ethics Statement
This study was conducted according to the principles expressed in the Declaration of Helsinki. All pilots were volunteers, not rewarded, and provided informed written consent before participation. The experiment took place in the flight simulator dedicated to the pilots’ regular training and was approved by the Air France local committee as well as by the CERNI (Ethics Committee of the University of Toulouse, France, IRB00011835-2020-03-03-210).
2.2. Participants of the Pre-Training Session
Ten crews, consisting of twenty professional airline pilots (10 Captains and 10 First Officers) were recruited to perform the pre-training session. They all held an Airbus A320 type rating. Due to the possible impact of the fleet type on manual flight skills [16], only pilots performing medium-haul flights at the time of the experiment were selected. All participants were male, with a mean age of 42.3 years (SD = 3.8 years) for Captains and of 29.2 years (SD = 2.7 years) for First Officers, and all had a minimum of 1000 flight h (FH). Respectively, they had an average of 11,500 FH (SD = 1300 FH) and 3500 FH (SD = 340 FH) total. Both Captains and First Officers had a relatively important flying experience, allowing us to average their results without introducing too much intersubject variability in the sample (i.e., with very inexperienced First Officers). Participants were randomly assigned to compose each of the ten crews. They were briefed on the flight scenario (airport, aircraft weight and configuration, flight plan, etc.), but they were not introduced to the exact purpose of the research.
2.3. Participants of the Post-Training Session
Approximately ten months after the pre-training session, 7 of the 10 original crews returned (7 Captains and 7 First Officers) to perform the post-training session. They were all still qualified for Airbus A320. This sample had a mean age of 44.7 years (SD = 4.1 years) for Captains and of 31.3 years (SD = 2.7 years) for First Officers. They had an average of 12,273 FH (SD = 1189 FH) and 4189 FH (SD = 378 FH), respectively. They were not rewarded for their participation. Pilots were pseudo-randomly assigned to two distinct groups: the experimental group and the control group, according to the type of training they received at the beginning of the post-training session. Moreover, participants were pseudo-randomly assigned to each of the 7 crews (different crews than in the first study). In order to balance these two groups, they each included the 2 most accurate pilots (indeed, pilots were categorized as a function of their flight performance during the pre-training session). In addition, no crew was composed of the two most accurate pilots or two unstabilized pilots. Moreover, the performance of the participants constituting these two groups were not initially different during the pre-training session: non-parametric Mann–Whitney tests revealed no significant difference neither for the vertical deviation (W = 14.5, p = 1.0) nor for the lateral deviation (W = 11.5, p = 0.58). They were briefed on the flight scenario (airport, aircraft weight and configuration, flight plan, etc.), but they were not introduced to the exact purpose of the research.
2.4. Scenarios and Flight Performance Measures
2.4.1. Scenario and Flight Performance Measures of the Pre-Training Session
All pilots performed the same flight scenario twice, once as PF and once as PM, in a random order. In this manner, all pilots performed the flight as PF (flight performance analysis concerned the PFs). The flight scenario started with a take-off from Toulouse runway (32R) and finished with a landing on the same runway. After take-off, flight crews were instructed to climb to 5000 ft, turn left, and intercept the ILS. Then, they were cleared for the approach, performed with standard visibility conditions (runway visual range of 550 m) and with a significant crosswind (15 knots). Upon reaching the altitude of 5000 ft, automation was disconnected and reverted to full manual (without flight directors, without autopilot, and without autothrust). This low automation level strongly increased task complexity and instrument visual scanning effort [52]. Flight crews were required to fly in compliance with the flight crew operating manual and operator requirements regarding stabilization criteria. If stabilization was not met during the approach (more than one dot of deviation on the lateral and vertical deviations scales), pilots would perform a go-around. Feedback on the position of the aircraft during the landing was also provided by a Precision Approach Path Indicator (PAPI) on the left side of the runway. In this paper, analyses were focused on the approach phase, from 2500 to 250 ft. Pilots also performed four other flight scenarios with varying automation levels. These data will be presented in a subsequent paper.
Experiments were conducted in a full-flight Airbus 320 simulator (Thomson) provided by Air France group. This simulator is used for the regular training of professional flight crews. Four flight parameters were recorded in order to characterize flight performance during the approach phase. These flight parameters were provided by the flight simulator at the end of the flight scenario and were not available if the crew interrupted the approach. Absolute lateral and vertical aircraft deviations were used to determine the PF’s performance profiles. This information is provided by the instrument landing system (ILS), a ground instrument that indicates the aircrafts’ spatial position to the pilots. In the cockpit, the spatial position of the aircraft is displayed via two scales, each graduated with two dots on each side of the center of the scale (the “localizer” for the lateral deviation and the “glide slope” for the vertical deviation). On each scale, a diamond moves to indicate the deviation. When the diamond is exactly at the center of the scale, the deviation is null. Speed (target value = 138 knots, stabilization range between −5 and +10 knots), height above the runway threshold at landing (target value = 50 ft, stabilization range between 30 and 70 ft), and the touchdown distance (stabilization range = between 300 and 600 m after the runaway threshold) were also recorded to confirm the performance profile classification. It must be noted that PF performance might also depend on PM behavior; for example, the ability of the latter to detect and rapidly announce (callout) any path deviations can have an impact on the PF actions. We did not control for this effect, but we assume that it had a relatively low impact on the results as the PF should detect any deviations before any announcement from the PM. In fact, during our experiment, such announcements from the PM only occurred just previous to the initiation of go-around maneuvers (flight performance for this situation was not analyzed).
2.4.2. Scenario and Flight Performance Measures of the Post-Training Session
Experiments were conducted in the same full-flight Airbus 320 simulator (Thomson). Identical flight parameters as the pre-training session were recorded. A different airport (but with similar installation and weather conditions, except an opposite wind direction to avoid familiarization) was chosen to avoid any training effect related to the first pre-training session. All pilots performed the same flight twice, once as PF and once as PM, in a random order (as a reminder, flight performance analysis concerned the PFs). The flight scenario started with a take-off from Bordeaux runway 23 and finished by a landing on the same runway. Stabilization criteria were very close to the pre-training session: speed target value = 143 knots (stabilization range between −5 and +10 knots), height above the runway threshold at landing target value = 50 ft (stabilization range between 30 and 70 ft), and touchdown distance stabilization range = between 300 and 600 m after the runaway threshold. Again, analyses were focused on the approach phase, from 2500 to 250 ft. Pilots also performed four other flight scenarios with varying automation levels. These data will be presented in a subsequent paper.
2.5. Eye-Tracking Measurements
2.5.1. Pre-Training Session
Two 50 Hz Pertech head-mounted eye trackers (0.25° of accuracy) were used to record the eye movements of the two pilots for the duration of the entire flight scenario, from thrust application during the take-off up until the roll-out after landing (when aircraft speed diminishes to below 50 knots). The two eye trackers’ clocks were synchronized. An eight-point calibration was performed before the first flight scenario. The quality of the calibration was checked at the very start of the experiment and between each flight scenario by asking the participants to look at a series of instruments while the experimenter visually checked that this corresponded well with the focus of attention displayed by the system. Eye-tracking data were collected via the EyeTechpilot software from Pertech. Eye-tracking videos (the visual scene with the point of fixation in superimposition) were also recorded since it was to be an essential part of the training material for the subsequent post-training session. The post-processing head-motion correction was conducted via the EyeTechMotion software, and eye movement analysis was conducted with EyeTechLab software, both provided by Pertech. Head-motion correction eliminates head-motion from the eye movement data, allowing automatic world-referenced analysis. Estimated horizontal and vertical head movements are subtracted from corresponding pupil positions. This step is performed by EyeTechMotion via an image processing of the eye-tracking video, facilitated by small infrared LEDs attached to the cockpit. Each participant’s head motion correction was successful for at least 98% of the data points. We visually checked the results of the head motion correction rigorously to ensure that no abnormal shift of the fixation point had been introduced during this step. Fixations were identified using the EyeTechLab built-in algorithm. The detection threshold that defined a fixation was set to 100 ms. Nine AOI were used (see Figure 2), and they corresponded to (1) Speed Indicator, (2) Attitude Indicator (AI), (3) Heading/Lateral Deviation scales (HLD), (4) Altitude/Vertical Speed/Vertical Deviation scales (AVSVD), (5) the Flight Mode Annunciator (FMA), (6) the Navigation Display (ND), (7) the Electronic Centralized Aircraft Monitor system (ECAM, including engine thrust display N1), (8) the System Display system (SD), and (9) the outside world (windows). For information, the primary flight display that integrates AOIs #1 to #6, is an 18 × 18 cm square, representing a visual angle of 10.34° at a typical viewing distance of 95 cm. Due to limitations in the eye-tracker accuracy, AOIs #3 and #4 were composed of two and three different instruments, respectively (the instruments are too close to each other to be distinguished by the eye tracker with a sufficient level of confidence).
We studied PFs’ visual behavior from 2500 to 250 ft (250 ft was the average altitude of go-around for the unstabilized pilots, thus data after this threshold would not have been comparable for these pilots since they aborted the approach). The average duration of the considered period was 107.72 s. This period of the approach is particularly interesting because the lower the altitude, the more accurately an aircraft must be flown. This period of the flight requires rigorous manual control and instrument monitoring. We analyzed PFs’ visual scanning patterns using a homemade algorithm coded with the MATLAB software (MathWorks); the script is available in Supplementary Material. Below this altitude, the approach phase is completed, and visual flare is initiated. A visual scanning pattern was defined as a set of at least one transition from an AOI to another AOI. We considered the visual scanning pattern “over” when the same AOI was fixated more than two times consecutively. At first, the algorithm computes the smallest scanning patterns (number of transitions = 1, e.g., A–B). After each iteration, the algorithm searches for a higher number of transitions (n + 1) (e.g., A–B–A). We did not distinguish different visual scanning patterns when the same set of AOIs was gazed at in an opposite order. Indeed, the variation of the primary flight parameters (at the core of the manual piloting) are highly cross-coupled (i.e., variation of the attitude impacts the speed and reciprocally). Thus, a glance sequence “A–B” was considered as equivalent to “B–A”.
For example, the following sequence “A–B–A–B–B–A–C” contains 4 different visual scanning patterns for a total of 8 AOI transitions:
- “A–B”: 4 occurrences (including “B–A” transitions);
- “A–C”: 1 occurrence;
- “A–B–A”: 2 occurrences (including “B–A–B”);
- “B–A–C”: 1 occurrence
In the previous example, a transition from B to B appears. This can happen when a pilot turns his gaze to an AOI (B), then gazes at an undefined location, and then comes back to the same AOI (B) again: in this case, the algorithm “concatenated” the two defined AOIs (i.e., the algorithm does not take the undefined location into account).
The use of both dwell times and visual scanning patterns gave a more comprehensive understanding of the visual scanning strategies. Our analyses were focused on the PF: a comparison between PF and PM visual scanning strategies will be presented in a subsequent paper.
2.5.2. Post-Training Session
Two 50 Hz Tobii Pro Glasses 2 head-mounted eye trackers (0.50° of accuracy) were used to record eye movements of the two pilots. The two eye trackers’ clocks were synchronized. This different eye-tracking system was used during the second session because Pro Glasses 2 allows for a one-point calibration, which was considered to be more convenient for the pilots. The difference in accuracy between the two systems might have an impact when AOIs are very close together, but we did not consider these particular instruments separately (e.g., heading and lateral deviation scales were merged). The one-point calibration was performed before the first flight scenario. The same precautions were taken as during the pre-training session to ensure the highest quality of data collection as possible. Data collection and post-processing were conducted via the Tobii Pro Lab software. Head-motion correction was performed using this software and did not require any infrared markers with this eye tracker. Each participant’s head-motion correction was successful for at least 98% of the data points. We visually checked the results of the head-motion correction rigorously to ensure that no abnormal shift of the fixation point was introduced during this step. Fixations were identified using the Tobii Pro Lab built-in algorithm. The detection threshold that defined a fixation was set to 100 ms. The same metrics were analyzed as during the pre-training session (dwell times and visual scanning patterns) from 2500 to 250 ft (average duration = 106.02 s), and the same cockpit AOIs were defined. Again, our analyses were focused on the PF. A comparison between PF and PM visual scanning strategies will be presented in a subsequent paper.
2.6. Training Program
The training was conducted just before the post-training simulator session (see Figure 1 for the experimental timeline). It was focused on the visual monitoring in the cockpit (the content depended on the pilots’ group as detailed below) and lasted approximately 10 min. It was not part of the recurrent training given by any airline company.
2.6.1. The Experimental Group
Each pilot from the experimental group first received individual feedback using a slideshow on their pre-training session (when they previously acted as PF during the approach), including:
- A bar plot with their flight performance during the approach (lateral and vertical deviations, speed, height above the runway threshold, and touchdown distance), see Figure S1;
- A first-person point of view, eye-tracking video (the raw video generated by the eye-tracking system, with a moving circle showing the current fixation point) showing their own visual scanning performing the approach (duration 2.5 min—between 2500 ft and touchdown), see Figure S2;
- A bar plot showing the percentages of their own dwell times on each of the 9 cockpit AOIs during the approach, see Figure S3.
Each pilot also viewed a variety of data obtained from the most accurate pilots (from the pre-training session), including:
- On the previously mentioned bar plot, the percentage of dwell times on each of the 9 cockpit AOIs of the most accurate pilots and the efficient gaze allocation interval, see Figure S3;
- A first-person point-of-view eye-tracking video, showing eye fixations during the approach from one of the most accurate pilots (one who did not belong to the experimental group to avoid showing one of the participants their own visual circuit) performing the approach, see Figure 4 (top) and Figure S5.
All information that was presented on the slideshow presentation was self-explanatory. No further verbal content was delivered. To increase the involvement of the pilots in the training program, they were instructed that they would be tested on the characteristics of the efficient gaze allocation and visual scanning patterns presented in the program. We did not analyze the results of this test. This training program lasted approximately 10 min, including the test.
2.6.2. The Control Group
Each pilot from the non-experimental group received a general briefing, including:
- A generic video about aircraft attitude changes maneuvers and associated visual scanning strategies used during pilots’ initial training (duration 3.5 min), see Figure S6;
- A first-person point-of-view video of an airline pilot who did not participate in the experiment, performing a standard approach without any indication of the gaze fixation point (same point of view as the eye-tracking video, made using a head-mounted GoPro camera, duration 2.5 min), see Figure 4 (bottom) and Figure S7.
The training provided to the control group aimed at providing knowledge about cockpit monitoring, just as in the experimental group but without using any individual feedback and eye-tracking material. At the beginning of the session, pilots in the control group were also instructed that they would be tested. We did not analyze the results of this test. This training program also lasted approximately 10 min, including the test.
3. Results
3.1. Results of the Pre-Training Session
Since the pre-training session included two sub-samples with too few pilots to perform inferential statistics (i.e., the four most accurate pilots and five unstabilized pilots), we report the descriptive analyses only. Individual eye-tracking data of the pre-training session are presented in Supplementary Material in Table S1 (percentage of dwell times on each AOI for all PFs), Table S2 (total dwell times in seconds on each AOI for all PFs), and Table S3 (percentage of the four efficient visual scanning patterns for all PFs).
3.1.1. Flight Performance and Categorization of the Performance Profiles
Fifteen out of the twenty PFs (75%) successfully performed a stabilized approach. The five others (25%) decided to go around. Based on the lateral and vertical trajectory deviations (as measured with the localizer and the glide slope information), we separated the pilots into three performance profiles. Classically, a stabilized approach (in IMC condition) requires maintaining a lateral and a vertical deviation below one dot. Fifteen pilots (PFs) flew the approach with an average of less than one dot of deviation; see Figure 5. Among them, considering both lateral and vertical deviations (both parameters’ deviation averaged), four pilots maintained average lateral and vertical deviations close (≤) to 0.1 dot (SD = 0.1). These four pilots were labeled the most accurate pilots; the 11 other pilots who also performed a stabilized approach had an average lateral and vertical deviations of approximately 0.6 dot (SD = 0.3). These pilots were labeled standard pilots. Finally, the five pilots who did not manage to stabilize their approach and decided to go around (at approximately 250 ft) were labeled unstabilized pilots (no landing performance was available for these unstabilized pilots since they aborted the landing and initiated a go-around).
We further analyzed flight performance with the three other flight parameters (i.e., speed, height above the runway threshold, and touchdown point). As expected, the other performance metrics were also better for the most accurate pilots vs. standard pilots (see Figure 6). The most accurate pilots had a mean speed above the threshold of 137 knots (SD = 2.21), a mean height of 51.2 ft (SD = 2.1), and a mean landing distance of 418 m (SD = 136) (the closer the landing distance is to 300 m, the better the performance); the standard pilots had a mean speed above the threshold of 141 knots (SD = 4.19), a mean height of 52.8 ft (SD = 10), and a mean landing distance of 437 m (SD = 387).
3.1.2. Defining an Efficient Visual Scanning Strategy
Assuming that efficient visual scanning strategies are associated with adequate flight performances during the approach/landing, we defined an efficient gaze allocation on each instrument based on both dwell times and most frequent visual scanning patterns by the most accurate pilots. More specifically, an efficient gaze allocation during the approach/landing consisted of:
- Being within an interval spanning over the mean percentage of accurate pilot dwell times on each instrument (AOI) plus/minus two standard deviations (outliers’ method), labeled efficient dwell times interval. Percentages of dwell times outside this interval were considered as sub-optimal visual scanning strategies;
- Performing comparable visual scanning patterns to the most accurate pilots, in particular, their four most frequent visual scanning patterns labeled as ‘efficient visual scanning patterns’.
3.1.3. Overall Average Dwell Time on AOIs and Pilots’ Performance Profile
Irrespective of the pilots’ performance profile, the overall average dwell time on the AOIs (i.e., irrespective of the AOI, considering all cockpit instruments and windows) was 204 ms (SD = 5.97). Average dwell time was 167 ms (SD = 4.04) for the most accurate pilots, 186 ms (SD = 5.08) for the standard pilots, and 274 ms (SD = 2.92) for the unstabilized pilots (see Figure 7).
3.1.4. Percentage of Dwell Times on the Instruments and Pilots’ Performance Profile
Apart from the windows, all pilots spent most of their time gazing at the attitude, the HLD, and the AVSVD (see Figure 8). These instruments are the three main sources of information needed to maintain a correct flight path. All five unstabilized pilots differed from the efficient gaze allocation as they either under- or over-focused on various critical AOIs (see Figure 8). The mean percentage of their dwell times on at least one of these AOIs differed by more than two standard deviations compared to the most accurate pilots. At the individual level, three pilots (pilots 7, 11, and 17) under-focused on the attitude indicator (a striking example is pilot 7 who spent only 2.9% of the time on the attitude indicator, see Table S2), one pilot over-focused on the HLD (pilot 11); one pilot (pilot 4) over-focused on both the attitude indicator and the AVSVD; three pilots (pilots 4, 7, and 19) under-focused on the HLD, and one pilot (pilot 19) over-focused on the attitude indicator. The variability of their percentage of dwell times was two times larger in comparison to the 15 others pilots that successfully stabilized their approach (i.e., SD = 26.3% vs. 3.77% for the attitude indicator; SD = 7.8% vs. 2.5% for the HLD; and SD = 10.5% vs. 3.5% for the AVSVD). Please see Table S1 for individual percentage of dwell times per AOI and Table S2 for individual total dwell times per AOI (in seconds).
3.1.5. Visual Scanning Patterns and Pilots’ Performance Profile
We examined the number of visual scanning patterns (i.e., the total produced, not the number of different visual scanning patterns produced) as a function of the performance profiles (Figure 9). The most accurate pilots produced a larger number of visual scanning patterns. Conversely, the unstabilized pilots had the lower number of visual scanning patterns. This result likely reflects the capacity of the most accurate pilots to monitor the cockpit more efficiently (i.e., higher visual scanning frequency of the instruments), which is consistent with their shorter average dwell times mentioned previously.
The four most frequent visual scanning patterns of the most accurate pilots, otherwise called efficient visual scanning patterns, were structured around the attitude indicator (AI), i.e., with at least one fixation via this critical instrument. These patterns were:
- Speed indicator—attitude indicator—speed indicator (visual scanning pattern A, otherwise labeled speed, includes three AOIs);
- AVSVD—attitude indicator—AVSVD (visual scanning pattern B, otherwise labeled vertical deviation, includes three AOIs);
- HLD—attitude indicator—HLD (visual scanning pattern C, otherwise labeled lateral deviation, includes three AOIs);
- Speed indicator—attitude indicator—ECAM (displaying the engine thrust)—attitude indicator—HLD—attitude indicator—AVSVD—attitude indicator (visual scanning pattern D, otherwise labeled general attitude, includes eight AOIs).
Compared to the most accurate pilots, the unstabilized pilots demonstrated a lower proportion of each of the efficient visual scanning patterns and a higher proportion of the other visual scanning patterns (see Table 1).
3.2. Results of the Post-Training Session
Given the small sample size of each group and the non-normality of the majority of the studied variables (Shapiro–Wilk normality test), we used a non-parametric inferential statistical test. As we performed statistical tests using R software (R Core Team, 2014), we reported the “W” statistic provided by this software for the Mann–Whitney U test. Paired comparisons were analyzed using the Wilcoxon signed-rank test, and the Bonferroni multiple comparison correction was applied. Individual eye-tracking data of the post-training session are presented in Supplementary Material in Table S4 (percentage of dwell times on each AOI for all PFs of the control group), Table S5 (total dwell times in seconds on each AOI for all PFs of the control group), Table S6 (percentage of dwell times on each AOI for all PFs of the experimental group), Table S7 (total dwell times on each AOI for all PFs of the experimental group), Table S8 (percentage of the four efficient visual scanning patterns for all PFs of the control group), and Table S9 (percentage of the four efficient visual scanning patterns for all PFs of the experimental group).
3.2.1. Flight Performance
Vertical deviations were significantly lower for the experimental group (M = 0.36 dot, SD = 0.15) than for the control group (M = 0.60 dot, SD = 0.20), W = 36, p = 0.04; see Figure 10). The difference was non-significant for the lateral deviation, W = 23.5, p = 0.77. For information, 13 out of the 14 PFs (92.8%) successfully performed a stabilized approach. All seven PFs from the experimental group successfully performed a stabilized approach. One PF out of seven from the control group (14.2%) failed to stabilize the approach and decided to go around. At an individual level, the two pilots in the experimental group who performed an unstabilized approach during the pre-training session this time met the lateral and vertical stabilization criteria (less than one dot of deviation).
Considering the three other flight performance parameters, the differences were non-significant between the two groups (W = 28.0, p = 0.35; W = 28.5, p = 0.32; W = 30.0, p = 0.23, for the speed at threshold, height at threshold, and landing distance, respectively). However, a visual inspection of the dispersion of the individual data highlighted that pilots of the experimental group had a speed at threshold closer to the target than the control group (see Figure 11).
3.2.2. Overall Average Dwell Times on AOIs and Training Group
Irrespective of group, the overall average dwell time on the AOIs (i.e., irrespective of the AOI, considering all cockpit instruments and windows) was 197 ms (SD = 11.52) during the post-training session. The average dwell times were 187 ms (SD = 5.61) for the experimental group and 199 ms (SD = 14.8) for the control group. The difference was not significant (p > 0.05).
3.2.3. Percentage of Dwell Times on the Instruments and Training Group
Apart from the windows, inside the cockpit, pilots spent (irrespective of group) most of their time gazing at the following three AOIs: the attitude indicator, the vertical parameters (AVSVD), and the lateral parameters (HLD). All paired comparisons with other AOIs were significant, Wilcoxon p < 0.05, (Bonferroni corrections for multiple comparisons); see Figure 12. At the group level, there was no significant difference between the experimental group and the control group, W = 2366.5, p = 0.73.
At the individual level, in the experimental group, no pilot differed markedly from the efficient gaze allocation interval (as a reminder: defined using an interval spanning over the mean percentage of dwell times on each AOI of the most accurate pilots of the pre-training session plus/minus two standard deviations). Interestingly in this group, the two unstabilized pilots (i.e., unstabilized during the post-training session) demonstrated dwell times within the efficient gaze allocation range. For example, pilot 11 who under-focused on the attitude indicator and the AVSVD during the pre-training session (10.6% and 1.9%, respectively) considerably increased the dwell times on these AOIs after the training (34.9% and 11.9%, respectively).
In the control group, the pilot (pilot 19) who performed a go-around due to excessive vertical deviation markedly over-focused the attitude indicator and the AVSVD; see Table S4. This pilot was considered an unstabilized pilot during the pre-training session.
3.2.4. Visual Scanning Patterns and Training Group
The experimental group did not significantly increase their number of visual scanning patterns more than the control group between the pre-training session and the post-training session, W = 14.0, p = 0.21 (see Figure 13). However, at the individual level, it should be noticed that the two pilots (pilots 7 and 11) in the experimental group who performed an unstabilized approach during the pre-training session (i.e., they were unstabilized pilots) increased their number of visual scanning patterns by 384% and 300%, respectively.
Concerning the specific efficient visual scanning patterns identified in the pre-training session, the change rate of the frequency of the visual scanning pattern D (related to the general attitude) between pre- and post-training sessions was significantly larger for the experimental group than the control group, W = 8.0, p = 0.04 (see Figure 14). The change rate for the other patterns did not differ significantly among groups (p > 0.05). At the individual level, the two unstabilized pilots (pilots 7 and 11) who performed a go-around during the pre-training session (and that managed to stabilize the approach during this post-training session) showed a large increase in frequency for at least three efficient visual scanning patterns. More precisely, pilot 7 increased the frequency of all efficient patterns (160%, 484%, 169%, and 710% for patterns A, B, C, and D, respectively), and pilot 11 increased the frequency of three patterns (234%, 472%, and 249% for patterns A, C, and D, respectively). Moreover, the frequency of the other visual scanning patterns decreased (i.e., possibly less relevant patterns) for these two pilots (62% and 81%).
4. Discussion
Poor visual scanning is a major contributor to accidents [1]. One typical example is the Turkish Airlines flight 1951 crash. During the approach, the aircraft was about 610 m (2000 ft) above ground level, when the left-hand (captain’s) radio altimeter suddenly changed from 590 m (1950 ft) to −2.4 m (−8 ft). The autopilot “interpreted” this as the aircraft being near to the ground and as a result, the autothrottle reduced thrust to idle and increased the pitch of the aircraft to generate sufficient lift. The aircraft literally began the landing flare at 150 m (500 ft). The Dutch Safety Board’s final report [53] mentioned that both the reduction in speed and the excessively high pitch attitude of the aircraft were not recognized until the approach to stall warning (stick shaker). The crew’s excessive workload at this time, due to a late checklist procedure, was a worsening factor. The aircraft eventually crashed in a field at a distance of approximately 1.5 km (0.8 nm) from the runway threshold. Using the Causal model for Air Transport Safety (CATS), Ale et al. [54] modeled the genesis of this accident. Their results indicated that the probability of a collision with the ground in the case of insufficient monitoring when combined with instrument failure increases by a factor of almost 600.
The main objective of the study was to investigate the links between manual flight performance and visual scanning strategies and to evaluate the efficiency of a new training program based on personalized feedback and eye-tracking material, designed to improve professional pilots’ visual scanning strategies. Assuming that better flight performance is associated with efficient visual scanning strategies, we used the dwell times and visual scanning patterns of the most accurate pilots in a pre-training session as training material for an experimental group during a subsequent post-training session. The experimental group received both individual feedback on their pre-training session and feedback on how the accurate pilots performed in the pre-training session (among other things, a first-person point-of-view eye-tracking recording showing the ocular behavior of one of the accurate pilots during the approach). To summarize the results, during the pre-training session, the pilots with poor flight performance (unstabilized pilots) had average longer dwell times, either under- or over-focused various cockpit instruments and displayed a markedly lower number of visual scanning patterns than the most accurate pilots. During the post-training session, the experimental group pilots had better flight performance (specifically considering vertical deviation from recommended flight path) compared to the pilots from a control group that had received generic training about cockpit monitoring. Moreover, the visual scanning strategies of the pilots from the experimental group tend to resemble those of the most accurate pilots; in particular, they performed one of the efficient visual scanning patterns more frequently than the control group.
4.1. Flight Performances
All 20 pilots (from 10 crews) performed the manual approach scenario as PF. The approach was performed in poor weather conditions and without any automation. Among the 20 PFs, 15 successfully performed a stabilized approach and landed in accordance with standard stabilization requirements. Within them, we identified the four most accurate pilots via the analysis of the lateral and vertical path deviations during the final phase of the approach (short final). The 11 others were labeled standard pilots. Five pilots failed to stabilize the approach and performed a go-around, and they were labeled unstabilized pilots. In fact, the decision to go around was a good one as minimum stabilization requirements were not achieved. Consequently, we did not observe procedure violation during the experiment. It must be noted that dangerous continuation of an unstabilized approach can sometimes be observed in an operational setting [55] and is a causal factor of 40% of landing accidents [56].
After the training, landing performance (in particular vertical deviations) by the experimental group was significantly better compared to the control group. The performance of the experimental group became more similar to the performance of the most accurate pilots in the first session. Most likely, the training program of the training group had a beneficial impact on flight performance. Among the 14 pilots in the post-training session, only one from the control group did not stabilize the approach and performed a go-around. This pilot also performed a go-around during the pre-training session. Similar effects on learning outcomes have also been observed when providing EMMEs for the processing of illustrated texts [57].
4.2. Visual Scanning of the Instruments
In our current study, the overall average dwell time spent on the AOIs (all cockpit instruments and windows) was 204 ms during the pre-training session and 197 ms during the post-training session. This is compatible with the results from [27] found in helicopter pilots. Indeed, in their study, the pilots performing helicopter overland navigation tasks demonstrated median dwell durations of 231 ms. Interestingly, in the study of [27], median dwell time decreases with expertise, while our results showed that the most accurate pilots spend markedly less time on AOIs (167 ms) than standard (186 ms) and unstabilized (274 ms) pilots. This faster information intake likely contributes to the capacity of the most accurate pilots to produce more numerous visual scanning patterns, as they can extract information more rapidly (“at a glance”) during fixations. This latter result supports the idea that the most accurate pilots, such as experts, own greater perceptual effectiveness [28].
An overall analysis of the percentage of dwell times showed that the proportion of time spent on each instrument was consistent with the literature [58,59,60]. In particular, the percentage of time spent gazing at the attitude indicator was the most important. At the individual level, it ranged between 19.7% and 32.2% (considering standard and most accurate pilots) during the approach. This is in line with a recent review of eye-tracking studies in aviation which stated that usually the most viewed instrument is the attitude indicator [23]. Importantly, the ocular behavior of the five unstabilized pilots was more variable than in the two other subgroups. Their percentage of dwell times differed by more than two standard deviations from the mean of the most accurate pilots, at least for one critical cockpit instrument. In particular, this was the case for the attitude indicator, the lateral parameters (HLD), and the vertical parameters (AVSVD). As a consequence, the unstabilized pilots under- or over-focused on these primary instruments to the detriment of others. A noticeable example is pilot 7 who spent only 2.9% of the approach gazing on the attitude indicator, see Table S2.
In addition, their number of visual scanning patterns was markedly lower than those of the most accurate pilots. The unstabilized pilots demonstrated an average number of 90 visual scanning patterns compared to 407 visual scanning patterns for the most accurate pilots. This latter result suggests that the most accurate pilots were able to scan their instruments more rapidly and frequently, shifting their gaze from one to another with a higher frequency. This more efficient scanning is supported by their previously mentioned shorter average fixation times on AOI. This better distribution of the attention toward the different instruments helped them building and maintaining better situational awareness. This higher frequency of scanning of the cockpit instruments probably explains, at least in part, their better landing performance (lower flight path deviations). In addition, the most accurate pilots tended to direct their gaze more at relevant AOIs, as their four most recurrent visual scanning patterns all included important primary flight instruments: the speed indicator, the attitude indicator, and the lateral and vertical parameters. The unstabilized pilots tended to perform less visual scanning patterns toward these important instruments. Overall, these results support the assumption that lower flight performance is largely underpinned by sub-optimal gaze allocation in the cockpit. It is worth noting that the fact that the four most recurrent visual scanning patterns were focused around the attitude indicator is compatible with the idea that monitoring expertise should not be resumed to a singular scanning pattern over the whole cockpit. Indeed, according to Mumaw [61], “while the research literature on eye-tracking shows that there are a few recognizable scanning patterns within the “basic T” indications when performing a manual approach, no one has identified a meaningful scanning pattern across the full-flight deck interface”.
During the post-training session, we did not find any significant overall differences in terms of dwell times on cockpit instruments between the experimental group and the control group. In the experimental group, at an individual level, no pilot differed markedly from the efficient gaze interval, including the unstabilized pilots that over- or under- focused on at least two instruments during the pre-training session. Interestingly in this group, the two unstabilized pilots (i.e., unstabilized during the post-training session) demonstrated dwell times within the efficient gaze allocation range. In the control group, the only pilot who performed a go-around due to excessive vertical deviation again markedly over-focused the attitude indicator and the AVSVD.
Concerning the visual scanning patterns, group level analyses showed that pilots from the experimental group significantly increased their proportion of one of the efficient visual scanning patterns, namely the visual scanning pattern related to the general attitude instruments (D). This increase in proportion of “good” visual scanning patterns was particularly notable for the two unstabilized pilots in this group: they considerably increased their proportion of at least three of the four efficient visual scanning patterns and decreased their proportion of “other” patterns.
On a more general note, the interaction between the pilots and automation can be viewed as a joint cognitive system [62], which is a human-technology co-agency and interaction. In a socio-technical environment such as the cockpit, humans, device interfaces, and artifacts all affect transformations of information flow [63]. In this view, a failure from the pilots to properly monitor the instruments creates a loss of distributed situation awareness at the system scale (e.g., Stanton, Salmon, and Walker, 2015). The cockpit design also has implications in the way the pilots interpret information and produce meaning from the artifacts (e.g., cockpit instruments). For example, reading the speed indicator requires higher levels of cognitive activity, interpretation, and can be viewed as an interpretation-based interaction [64].
4.3. Limitations and Remarks
Several limits of this study should be mentioned. There was a long delay between the two sessions. Studies generally indicate that training is more efficient when the feedback is delivered immediately after the performance, e.g., [65], particularly concerning psychomotor tasks [66]. In a study involving pilots, Denny, Allard, Hall, and Rokeach [67] showed that performances were inverse to the debriefing delay. Clariana, Wagner, and Murphy [68] also drew the same conclusions: immediate feedback about task performances implies a better understanding of the task characteristics. In the driving context, Chapman, Underwood, and Roberts [69] developed a training intervention that raised awareness of novice drivers about their visual scanning patterns and stressed the need to scan multiple locations in the visual scene for detecting potential sources of danger. Two groups of drivers were evaluated three times during the year after gaining their driving license. Before the second testing, one of the groups received the training intervention, whereas the other group only received a questionnaire about their own driving history and experiences. The intervention produced significant changes in the drivers’ search patterns, yet not all changes were still detectable at the third and final phase of testing three to six months after the intervention. Thus, this type of method would benefit from being maintained over time.
Another limit concerned the accuracy of the eye-tracking systems. It was not possible to differentiate between the heading and the lateral deviation scale (i.e., the localizer); similarly, the altitude could not be differentiated from the vertical deviation scale (glide slope) and vertical speed. In addition, the algorithm created to compute the visual scanning patterns reported sequences several times. For example, any of the sub-sequences in an 8-transition sequence would by necessity occur at least as often as the 8-long sequence. However, we chose to obtain a picture of all types of scanning patterns for each sequence size. Future study might explore the different ways to quantify the visual scanning patterns while avoiding potential overlapping.
In addition, the low number of participants due to the difficulty of recruiting professional pilots, in particular considering the performance profiles subgroups (e.g., only five unstabilized pilots), limited the possibility to perform inferential statistics and thus to better generalize some of our results. A future replication study should attempt to recruit a larger number of pilots.
On a general note, one might keep in mind that our training program and all eye-tracking results are based on the fixation point, just as commonly performed in most aviation-related studies [8,9,70,71]. According to Just and Carpenter’s “eye-mind” hypothesis [20], the location of a person’s gaze corresponds to the most immediate thought in a person’s mind. However, one cannot exclude that the focus of attention does not always correspond to the fixation point or that some information is processed in parafoveal vision [72]. For example, the pilot can fixate on the center of the attitude indicator and might process other information at the same time, for example speed information which is very close.
Finally, one must keep in mind that improving flight performance does not only rely on improving the way pilots perform their visual scanning. Other factors such as mental workload, fatigue, or stress must be considered.
5. Conclusions
We showed in this study that sub-optimal monitoring of flight instruments was associated with lower flight performance. Lower performance could be attributed to under- or over-focalization on some instruments, longer dwell times and a lower number of visual scanning patterns (indicating a lower scanning frequency), and less frequent visual scanning patterns that integrate important primary flight parameters. The results also suggest that it is possible to improve the visual scanning strategies with a training that incorporates personalized feedback and eye-tracking video recordings showing “adequate cockpit scanning” examples from highly accurate pilots. The use of videos as a debriefing tool to strengthen learning strategies [65] is not new, but very few studies have tried to use eye-tracking recordings as training material with professional airline pilots. Eye-tracking recordings and synthetic eye-tracking data (on a graph) seem to be an efficient way to teach efficient visual information intake, a process that is largely automatic and unconscious [25]. Therefore, our results suggest that the introduction of such a training using a replay of in-flight ocular behavior (recorded during a real flight or a simulator session) and charts showing eye-tracking data could help pilots to increase their awareness on inadequate visual scanning strategies (lack of consultation of critical information, under- or over-focalization, etc.). Moreover, it could be interesting to use this technology with pilots who face hand-flying difficulties after a significant period of inactivity. The real-time usage of eye-tracking also seems promising. A study of Dubois et al. [73] assessed the interest of using eye tracking during military pilot training. The authors trained 15 ab initio military pilots to monitor outside, avoiding focusing too much the cockpit instruments. A system masked the cockpit when a “head-down” position lasting more than two seconds was detected. The results showed that masking greatly reduced the two-second violation rule.
Interestingly, depending on the training material, ocular behavior can be influenced in different ways. For example, in the Shapiro and Raymond [39] study, the group of participants who received the efficient oculomotor training were administered a training designed to minimize eye movements and optimize scanpaths during a video game. This group showed higher performance and fewer foveations, considered, in this context, as better ocular behavior (lower dispersion of the attention). By contrast, in our study, we did not design the training program to minimize eye movements. The video examples of eye tracking from the most accurate pilots showed a high distribution of the attention (without under- or over-focalization on some instruments), and we raised the importance of the four efficient visual scanning patterns with schematic representations. As expected in the experimental group, the under- or over-focalization disappeared, and the number of efficient visual scanning patterns increased, in particular among pilots who initially performed an unstabilized approach during the pre-training session. The way to improve visual scanning could be different whether the goal is to learn visual scanning from scratch or to modify already acquired visual scanning strategies.
In this study, we chose to focus on manual control during the approach because this is one of the flight phases during which pilots intensively focus on a small set of core flight instruments to manage flight path deviations. We propose a better codification and teaching of the visual scanning patterns during this phase. The largest portion of other flight phases is performed under autopilot and requires a much less rigorous and more variable scanning of a larger number of displays. Our method may transfer to specific flight tasks, such as failure management, but we do not believe that it may apply to all flight tasks or flight phases (an extreme illustration being the meal break). In the future, it might be interesting to investigate the distinct contribution of personalized feedback and the use of eye-tracking material to the observed performance improvement. Indeed, in our study, both concepts were used with the experimental group. In addition, other studies might focus on different aspects of the flying activity. Shapiro and Raymond [39] showed that the best way to improve psychomotor performance is to work on separate components of the tasks. For example, it would be possible to help pilots regain a correct flight path from an unstabilized situation by showing appropriate visual scanning strategies. In addition, fighter pilots could be trained with eye-tracking recordings to specifically improve their aiming skills. Eye tracking might also be used in operational settings; for example, pilots could review their ocular behavior after an in-flight incident. One-point calibration techniques are fast and convenient, and pilots may easily accept modern eye-tracker systems, in particular if they are discretely embedded in the cockpit. Finally, future experiments might explore the tight relationship between the perception of the instruments’ information and the actual actions on the flight control inputs to manage flight path deviations. Such studies may help distinguish whether poor individual flight performance is related to the inappropriate attention to the appropriate instruments or to low effectiveness of control inputs (for example, pilot-induced oscillations are more likely due to the latter). The fine-grained examination of these links between perception and action would require a high temporal resolution flight simulator together with a perfectly accurate synchronization of the flight simulator and the eye-tracking system.
Supplementary Materials
The following are available online at https://www.mdpi.com/article/10.3390/safety7040070/s1, Figure S1: Top, vertical and lateral deviations of the considered participant compared to the most accurate pilots. Bottom, other performance metrics of the considered participant compared to the most accurate pilots, Figure S2: Eye tracking video showing the gaze behavior of the considered participant. The red circle indicated by the arrow represents the current fixation point, Figure S3: Bar chart showing the percentage of dwell times spent by the most accurate pilots on each of the 9 AOIs and by the considered pilots. Error bars of the dark gray bars represent the efficient interval. Dwell times of the considered pilot are represented with the light gray bar, Figure S4: Representation of the four efficient visual patterns, as shown to the eye tracking group. These visual patterns were related to the speed (visual pattern A), the vertical deviation (visual pattern B), the lateral deviation (visual pattern C), and the general attitude of the aircraft including the engine (visual pattern D). Patterns represented in solid lines (A, B, C) are more frequent than the one represented with dashed lines (D), Figure S5: Eye tracking video showing the gaze behavior of one of the most accurate pilots. The red circle indicated by the arrow represents the current fixation point, Figure S6: Each pilot from the control group were presented with a generic video about aircraft attitude changes maneuvers and associated visual scan strategies used during pilots’ initial training, Figure S7: Video of the approach without gaze allocation of the pilot (without the moving red circle). The video was recorded with a head-mounted GoPro camera and had the same point of view as the eye tracking video, Table S1: Percentage of dwell times on each cockpit AOI for all PFs during the pre-training session. (Undefined = undefined locations plus loss of gaze). HLD = Heading and Lateral Deviation, AVSVD = Altitude, Vertical Speed and Vertical Deviation, Table S2: Total dwell times (s) on each cockpit AOI for all PFs during the pre-training session. (Undefined = undefined locations plus loss of gaze). HLD = Heading and Lateral Deviation, AVSVD = Altitude, Vertical Speed and Vertical Deviation, Table S3: Percentage of the four efficient visual scanning patterns and other patterns for all PFs during the pre-training session, Table S4: Percentage of dwell times on each cockpit AOI for the PFs of the control group during the post-training session. (Undefined = undefined locations plus loss of gaze). HLD = Heading and Lateral Deviation, AVSVD = Altitude, Vertical Speed and Vertical Deviation, Table S5: Dwell times (s) on each cockpit AOI for the PFs of the control group during the post-training session. (Undefined = undefined locations plus loss of gaze). HLD = Heading and Lateral Deviation, AVSVD = Altitude, Vertical Speed and Vertical Deviation, Table S6: Percentage of dwell times on each cockpit AOI for the PFs of the experimental group during the post-training session. (Undefined = undefined locations plus loss of gaze). HLD = Heading and Lateral Deviation, AVSVD = Altitude, Vertical Speed and Vertical Deviation, Table S7: Dwell times (s) on each cockpit AOI for the PFs of the experimental group during the post-training session. (Undefined = undefined locations plus loss of gaze). HLD = Heading and Lateral Deviation, AVSVD = Altitude, Vertical Speed and Vertical Deviation, Table S8: Percentage of the four efficient visual scanning patterns and other patterns for the control group during the post-training session, Table S9: Percentage of the four efficient visual scanning patterns and other patterns for the experimental group during the post-training session.
Author Contributions
Conceptualization, O.L., N.M. and M.C.; methodology, N.M., M.C. and O.L.; software, O.L.; formal analysis, O.L., N.M. and M.C.; data curation, O.L.; writing—review and editing, O.L., N.M. and M.C.; supervision N.M. and M.C. All authors have read and agreed to the published version of the manuscript.
Funding
This research received no external funding.
Data Availability Statement
Flight data and eye-tracking data are confidential. An example of a full-flight eye-tracking video from a pilot during the post-training session is available from Zenodo (https://zenodo.org/record/4724863#.YIlPPd2xWpp, accessed on 7 October 2021). In Supplementary Material, we provide the full training material, individual eye-tracking data (fixation times, percentage of fixations times, and percentage of efficient scanning patterns), and the Matlab script created to identify the visual scanning patterns.
Acknowledgments
The authors would like to thank the Air France group for their logistical support. The authors are also grateful for Jennifer Eaglestone’s help with proofreading the English language.
Conflicts of Interest
The authors report no financial interests or potential conflict of interest.
References
- National Transportation Safety Board (NTSB). A Review of Flightcrew-Involved, Major Accidents of US Air Carriers, 1978 through 1990; National Transportation Safety Board: Washington, DC, USA, 1994. [Google Scholar]
- Mumaw, R.J.; Billman, D.; Feary, M. Factors That Influenced Airplane State Awareness Accidents and Incidents; CAST SE-210 Output 2; National Aeronautics and Space Administration: Washington, DC, USA, 2019. [Google Scholar]
- Loss of Control Action Group. Monitoring Matters, Guidance on the Development of Pilot Monitoring Skills; CAA Paper 2013/02; Civil Aviation Authority: London, UK, 2013. [Google Scholar]
- Sumwalt, R.; Cross, D.; Lessard, D. Examining how breakdowns in pilot monitoring of the aircraft flight path. Int. J. Aviat. Aeronaut. Aerosp. 2015, 2, 8. [Google Scholar] [CrossRef] [Green Version]
- Standard Operating Procedures for Flight Deck Crewmembers; Federal Aviation Administration (FAA): Washington, DC, USA, 2003.
- Federal Aviation Administration (FAA). Operational Use of Flight Path Managements Systems; Final Report of the Performance-Based Operations Aviation Rulemaking Committee; Commercial Aviation Safety Team Flight Deck Automation Working Group: Washington, DC, USA, 2013. [Google Scholar]
- International Air Transport Association (IATA). Guidance Material for Improving Flight Crew Monitoring; International Air Transport Association: Geneva, Switzerland, 2016. [Google Scholar]
- Dehais, F.; Behrend, J.; Peysakhovich, V.; Causse, M.; Wickens, C.D. Pilot flying and pilot monitoring’s aircraft state awareness during go-around execution in aviation: A behavioral and eye tracking study. Int. J. Aerosp. Psychol. 2017, 27, 15–28. [Google Scholar] [CrossRef] [Green Version]
- Reynal, M.; Colineaux, Y.; Vernay, A.; Dehais, F. Pilot flying vs. pilot monitoring during the approach phase: An eye-tracking study. In Proceedings of the International Conference on Human-Computer Interaction in Aerospace, Paris, France, 14–16 September 2016; p. 7. [Google Scholar]
- Adam, G.; Condette, J. Study on Aeroplane State Awareness during Go-Around; Bureau d’Enquetes et d’Analyses pour la Securite de L’Aviation Civile: Le Bourget, France, 2013. [Google Scholar]
- Lefrancois, O.; Matton, N.; Gourinat, Y.; Peysakhovich, V.; Causse, M. The role of pilots’ monitoring strategies in flight performance. In Proceedings of the European Association for Aviation Psychology Conference (EAAP32), Cascais, Portugal, 26–30 September 2016. [Google Scholar]
- Haslbeck, A.; Hoermann, H.-J. Flying the needles: Flight deck automation erodes fine-motor flying skills among airline pilots. Hum. Factors 2016, 58, 533–545. [Google Scholar] [CrossRef] [PubMed] [Green Version]
- Benson, A.J. Spatial Disorientation—A Perspective; Royal Air Force Centre of Aviation Medecine: Bedfordshire, UK, 2003. [Google Scholar]
- Puentes, A. The Manual Flight Skill of Airline Pilots; San Jose State University: San Jose, CA, USA, 2011. [Google Scholar]
- Ebbatson, M. The Loss of Manual Flying Skills in Pilots of Highly Automated Airliners; Cranfield University: Cranfield, UK, 2009. [Google Scholar]
- Haslbeck, A.; Zhang, B. I spy with my little eye: Analysis of airline pilots’ gaze patterns in a manual instrument flight scenario. Appl. Ergon. 2017, 63, 62–71. [Google Scholar] [CrossRef]
- Lounis, C.; Peysakhovich, V.; Causse, M. Visual scanning strategies in the cockpit are modulated by pilots’ expertise: A flight simulator study. PLoS ONE 2021, 16, e0247061. [Google Scholar] [CrossRef]
- Bellenkes, A.H.; Wickens, C.D.; Kramer, A.F. Visual scanning and pilot expertise: The role of attentional flexibility and mental model development. Aviat. Space Environ. Med. 1997, 68, 569–579. [Google Scholar] [PubMed]
- Katoh, Z. Saccade amplitude as a discriminator of flight types. Aviat. Space Environ. Med. 1997, 68, 205–208. [Google Scholar]
- Just, M.A.; Carpenter, P.A. Eye fixations and cognitive processes. Cognit. Psychol. 1976, 8, 441–480. [Google Scholar] [CrossRef]
- Gegenfurtner, A.; Lehtinen, E.; Säljö, R. Expertise differences in the comprehension of visualizations: A meta-analysis of eye-tracking research in professional domains. Educ. Psychol. Rev. 2011, 23, 523–552. [Google Scholar] [CrossRef]
- Law, B.; Atkins, M.S.; Kirkpatrick, A.E.; Lomax, A.J. Eye Gaze Patterns Differentiate Novice and Experts in a Virtual Laparoscopic Surgery Training Environment; ACM: New York, NY, USA, 2004; pp. 41–48. [Google Scholar]
- Ziv, G. Gaze behavior and visual attention: A review of eye tracking studies in aviation. Int. J. Aviat. Psychol. 2016, 26, 75–104. [Google Scholar] [CrossRef]
- Yang, J.H.; Kennedy, Q.; Sullivan, J.; Fricker, R.D. Pilot performance: Assessing how scan patterns & navigational assessments vary by flight expertise. Aviat. Space Environ. Med. 2013, 84, 116–124. [Google Scholar] [PubMed] [Green Version]
- Robinski, M.; Stein, M. Tracking Visual Scanning Techniques in Training Simulation for Helicopter Landing. J. Eye Mov. Res. 2013, 6, 1–17. [Google Scholar]
- Kasarskis, P.; Stehwien, J.; Hickox, J.; Aretz, A.; Wickens, C. Comparison of expert and novice scan behaviors during VFR flight. In Proceedings of the 11th International Symposium on Aviation Psychology, Daton, OH, USA, 2–5 May 2001. [Google Scholar]
- Sullivan, J.; Yang, J.H.; Day, M.; Kennedy, Q. Training simulation for helicopter navigation by characterizing visual scan patterns. Aviat. Space Environ. Med. 2011, 82, 871–878. [Google Scholar] [CrossRef] [PubMed] [Green Version]
- Reingold, E.M.; Sheridan, H. Eye movements and visual expertise in chess and medicine. In The Oxford Handbook of Eye Movements; Oxford University Press: New York, NY, USA, 2011; pp. 523–550. ISBN 978-0-19-953978-9. [Google Scholar]
- Haider, H.; Frensch, P.A. The role of information reduction in skill acquisition. Cognit. Psychol. 1996, 30, 304–337. [Google Scholar] [CrossRef] [PubMed] [Green Version]
- Schriver, A.T.; Morrow, D.G.; Wickens, C.D.; Talleur, D.A. Expertise differences in attentional strategies related to pilot decision making. Hum. Factors 2008, 50, 864–878. [Google Scholar] [CrossRef]
- van Meeuwen, L.W.; Jarodzka, H.; Brand-Gruwel, S.; Kirschner, P.A.; de Bock, J.J.; van Merriënboer, J.J. Identification of effective visual problem solving strategies in a complex visual domain. Learn. Instr. 2014, 32, 10–21. [Google Scholar] [CrossRef]
- Jarodzka, H.; Scheiter, K.; Gerjets, P.; Van Gog, T. In the eyes of the beholder: How experts and novices interpret dynamic stimuli. Learn. Instr. 2010, 20, 146–154. [Google Scholar] [CrossRef] [Green Version]
- Wolff, C.E.; Jarodzka, H.; van den Bogert, N.; Boshuizen, H.P.A. Teacher vision: Expert and novice teachers’ perception of problematic classroom management scenes. Instr. Sci. 2016, 44, 243–265. [Google Scholar] [CrossRef] [Green Version]
- Charness, N.; Reingold, E.M.; Pomplun, M.; Stampe, D.M. The perceptual aspect of skilled performance in chess: Evidence from eye movements. Mem. Cognit. 2001, 29, 1146–1152. [Google Scholar] [CrossRef]
- Van Hecke, A.V.; Mundy, P. Neural systems and the development of gaze following and related joint attention skills. In Gaze-Following Its Development and Significance; Taylor and Francis: Milton Park, UK, 2007. [Google Scholar]
- Symons, L.A.; Lee, K.; Cedrone, C.C.; Nishimura, M. What are you looking at? Acuity for triadic eye gaze. J. Gen. Psychol. 2004, 131, 451. [Google Scholar]
- Van Marlen, T.; Van Wermeskerken, M.; Jarodzka, H.; Van Gog, T. Effectiveness of eye movement modeling examples in problem solving: The role of verbal ambiguity and prior knowledge. Learn. Instr. 2018, 58, 274–283. [Google Scholar] [CrossRef]
- Brennan, S.E.; Chen, X.; Dickinson, C.A.; Neider, M.B.; Zelinsky, G.J. Coordinating cognition: The costs and benefits of shared gaze during collaborative search. Cognition 2008, 106, 1465–1477. [Google Scholar] [CrossRef]
- Shapiro, K.L.; Raymond, J.E. Training of efficient oculomotor strategies enhances skill acquisition. Acta Psychol. 1989, 71, 217–242. [Google Scholar] [CrossRef]
- Velichkovsky, B.M. Communicating attention: Gaze position transfer in cooperative problem solving. Pragmat. Cogn. 1995, 3, 199–223. [Google Scholar] [CrossRef]
- Salmerón, L.; Delgado, P.; Mason, L. Using eye-movement modelling examples to improve critical reading of multiple webpages on a conflicting topic. J. Comput. Assist. Learn. 2020, 36, 1038–1051. [Google Scholar] [CrossRef]
- Bednarik, R.; Schulte, C.; Budde, L.; Heinemann, B.; Vrzakova, H. Eye-movement modeling examples in source code comprehension: A classroom study. In Proceedings of the 18th Koli Calling International Conference on Computing Education Research, Koli, Finland, 22–25 November 2018; pp. 1–8. [Google Scholar]
- Jarodzka, H.; Balslev, T.; Holmqvist, K.; Nyström, M.; Scheiter, K.; Gerjets, P.; Eika, B. Conveying clinical reasoning based on visual observation via eye-movement modelling examples. Instr. Sci. 2012, 40, 813–827. [Google Scholar] [CrossRef] [Green Version]
- Litchfield, D.; Ball, L.J.; Donovan, T.; Manning, D.J.; Crawford, T. Viewing another person’s eye movements improves identification of pulmonary nodules in chest x-Ray inspection. J. Exp. Psychol. Appl. 2010, 16, 251. [Google Scholar] [CrossRef] [PubMed]
- Nalanagula, D.; Greenstein, J.S.; Gramopadhye, A.K. Evaluation of the effect of feedforward training displays of search strategy on visual search performance. Int. J. Ind. Ergon. 2006, 36, 289–300. [Google Scholar] [CrossRef]
- Leff, D.R.; James, D.R.C.; Orihuela-Espina, F.; Kwok, K.-W.; Sun, L.W.; Mylonas, G.; Athanasiou, T.; Darzi, A.W.; Yang, G.-Z. The impact of expert visual guidance on trainee visual search strategy, visual attention and motor skills. Front. Hum. Neurosci. 2015, 9, 526. [Google Scholar] [CrossRef] [Green Version]
- Sadasivan, S.; Greenstein, J.S.; Gramopadhye, A.K.; Duchowski, A.T. Use of Eye Movements as Feedforward Training for a Synthetic Aircraft Inspection Task; ACM: New York, NY, USA, 2005; pp. 141–149. [Google Scholar]
- Van Gog, T.; Jarodzka, H.; Scheiter, K.; Gerjets, P.; Paas, F. Attention guidance during example study via the model’s eye movements. Comput. Hum. Behav. 2009, 25, 785–791. [Google Scholar] [CrossRef]
- Salmerón, L.; Llorens, A. Instruction of digital reading strategies based on eye-movements modeling examples. J. Educ. Comput. Res. 2019, 57, 343–359. [Google Scholar] [CrossRef]
- Wetzel, P.A.; Anderson, G.M.; Barelka, B.A. Instructor use of eye position based feedback for pilot training. In Proceedings of the Human Factors and Ergonomics Society Annual Meeting, Santa Monica, CA, USA, 5–9 October 1998; SAGE Publications: Los Angeles, CA, USA, 1998; 42, pp. 1388–1392. [Google Scholar]
- Kang, Z.; Landry, S.J. Using scanpaths as a learning method for a conflict detection task of multiple target tracking. Hum. Factors 2014, 56, 1150–1162. [Google Scholar] [CrossRef]
- Weir, D.H.; McRuer, D.T. Pilot Dynamics for Instrument Approach Tasks: Full Panel Multiloop and Flight Director Operations; National Aeronautics and Space Administration: Washington, DC, USA, 1972. [Google Scholar]
- Dutch Safety Board (DSB). Turkish Airlines, Crashed during Approach, Boeing 737-800, Amsterdam Schiphol Airport, 5 February 2000; Dutch Safety Board: The Hague, The Netherlands, 2010. [Google Scholar]
- Ale, B.J.; Bellamy, L.; Cooper, J.; Ababei, D.; Kurowicka, D.; Morales, O.; Spouge, J. Analysis of the Crash of TK 1951 Using CATS. Reliab. Eng. Syst. Saf. 2010, 95, 469–477. [Google Scholar] [CrossRef]
- Causse, M.; Péran, P.; Dehais, F.; Caravasso, C.F.; Zeffiro, T.; Sabatini, U.; Pastor, J. Affective decision making under uncertainty during a plausible aviation task: An FMRI study. Neuroimage 2013, 71, 19–29. [Google Scholar] [CrossRef] [PubMed] [Green Version]
- Reducing the Risk of Runway Excursion; Flight Safety Foundation: Alexandria, VA, USA, 2009.
- Mason, L.; Pluchino, P.; Tornatora, M.C. Eye-movement modeling of integrative reading of an illustrated text: Effects on processing and learning. Contemp. Educ. Psychol. 2015, 41, 172–187. [Google Scholar] [CrossRef]
- Weir, D.H.; Klein, R.H. Measurement and analysis of pilot scanning behavior during simulated instrument approaches. J. Aircr. 1971, 8, 897–904. [Google Scholar] [CrossRef]
- Fitts, P.M.; Jones, R.E.; Milton, J.L. Eye movements of aircraft pilots during instrument-landing approaches. Aeronaut. Eng. Rev. 1950, 9, 24–29. [Google Scholar]
- Pennington, J.E. Single Pilot Scanning Behavior in Simulated Instrument Flight; National Aeronautics and Space Administration: Washington, DC, USA, 1979. [Google Scholar]
- Mumaw, R.J.; Billman, D.; Feary, M. Analysis of Pilot Monitoring Skills and a Review of Training Effectiveness; NASA/TM-20210000047; National Aeronautics and Space Administration: Washington, DC, USA, 2020. [Google Scholar]
- Hollnagel, E.; Woods, D.D. Joint Cognitive Systems: Foundations of Cognitive Systems Engineering; CRC Press: Boca Raton, FL, USA, 2005; ISBN 0-429-12222-5. [Google Scholar]
- Adriaensen, A.; Patriarca, R.; Smoker, A.; Bergström, J. A Socio-technical analysis of functional properties in a joint cognitive system: A case study in an aircraft cockpit. Ergonomics 2019, 62, 1598–1616. [Google Scholar] [CrossRef]
- Henriqson, E.; van Winsen, R.; Saurin, T.A.; Dekker, S.W. How a cockpit calculates its speeds and why errors while doing this are so hard to detect. Cogn. Technol. Work 2011, 13, 217–231. [Google Scholar] [CrossRef]
- Rothstein, A.L. Bridging the gap: Application of research on video-tape feedback and bowling. Mot. Ski. Theory Pract. 1976, 35–62. [Google Scholar]
- Dee Gallagher, J.; Thomas, J.R. Effects of varying post-KR intervals upon children’s motor performance. J. Mot. Behav. 1980, 12, 41–46. [Google Scholar] [CrossRef]
- Denny, M.; Allard, M.; Hall, E.; Rokeach, M. Supplementary report: Delay of knowledge of results, knowledge of task, and intertrial interval. J. Exp. Psychol. 1960, 60, 327. [Google Scholar] [CrossRef]
- Clariana, R.B.; Wagner, D.; Murphy, L.C.R. Applying a connectionist description of feedback timing. Educ. Technol. Res. Dev. 2000, 48, 5–22. [Google Scholar] [CrossRef]
- Chapman, P.; Underwood, G.; Roberts, K. Visual search patterns in trained and untrained novice drivers. Transp. Res. Part F Traffic Psychol. Behav. 2002, 5, 157–167. [Google Scholar] [CrossRef]
- Haslbeck, A.; Schubert, E.; Gontar, P.; Bengler, K. The relationship between pilots’ manual flying skills and their visual behavior: A flight simulator study using eye tracking. Adv. Hum. Asp. Aviat. 2012, 561–568. [Google Scholar]
- Sarter, N.B.; Mumaw, R.J.; Wickens, C.D. Pilots’ monitoring strategies and performance on automated flight decks: An empirical study combining behavioral and eye-tracking data. Hum. Factors 2007, 49, 347–357. [Google Scholar] [CrossRef] [PubMed]
- Alamán, J.R.; Causse, M.; Peysakhovich, V. Attentional span of aircraft pilots: Did you look at the speed? In Proceedings of the 1st International Workshop (ETAVI 2020), Toulouse, France, 17 March 2020. [Google Scholar]
- Dubois, E.; Blättler, C.; Camachon, C.; Hurter, C. Eye movements data processing for ab initio military pilot training. In Proceedings of the 9th International Conference on Intelligent Decision Technologies (KES-IDT 2017), Algarve, Portugal, 21–23 June 2017; Springer: New York, NY, USA, 2017; pp. 125–135. [Google Scholar]
| 1 | Lateral deviation pattern (C) |
Figure 1.
Experimental timeline of the two experimental sessions.

Figure 2.
Illustration of the nine different Areas Of Interests (AOIs), from the First Officer’s point of view. First officer’s (right seat) AOIs are represented in green and the Captain’s (left seat) AOIs are represented in red. Shared AOIs (by both the First Officer and the Captain) are represented in blue.

Figure 3.
Representation of the four efficient visual scanning patterns, as displayed to the experimental group. These visual scanning patterns were related to (as presented Table 1) the speed (visual scanning pattern (A)), the vertical deviation (visual scanning pattern (B)), the lateral deviation (visual scanning pattern (C)), and the general attitude of the aircraft including engine (visual scanning pattern (D)). Patterns represented in solid lines (A–C) are more frequently performed than the pattern represented with dashed lines (D).

Figure 4.
Top picture: Illustration of a first-person point-of-view eye-tracking video recording, showing eye fixations during the approach (the red circle indicated by an arrow in the center of the attitude indicator) from one of the most accurate pilots (administered to the experimental group). Bottom picture: Illustration of the first-person point-of-view video during approach (recorded with a head-mounted GoPro camera) without any indication of eye fixation (administered to the control group).

Figure 5.
Flight performance during the approach (pre-training session). Absolute lateral and vertical deviations (in dots, the arbitrary unit of the flight simulator; lower is better) for the 15 pilots (most accurate and standard pilots) who successfully performed a stabilized approach (dots represent individual data). The most accurate pilots had particularly low trajectory deviations (average lateral and vertical deviations ≤ to 0.1 dot). Some of them had a vertical of lateral deviation of 0 since they were below the error detection threshold of the flight simulator. The 5 unstabilized pilots are not represented since they aborted the landing. Each average flight path deviation displayed is in the range of accepted limitations, as it was equal or less than 1 dot.

Figure 6.
Additional flight performance during the approach (pre-training session). Mean speed, height, and landing distance for the 15 pilots (accurate and standard pilots) who successfully performed a stabilized approach (dots represent individual data). Solid lines indicate parameter tolerances for meeting stabilization and represent accepted limitations. The dashed lines indicate target speed and height. The 5 unstabilized pilots are not represented since they aborted the landing.

Figure 7.
Average dwell time in the AOI (s) for each pilots’ performance profile (pre-training session, dots represent individual data).
Figure 7.
Average dwell time in the AOI (s) for each pilots’ performance profile (pre-training session, dots represent individual data).

Figure 8.
Percentage of dwell times on each cockpit AOI during the approach (pre-training session) for the most accurate and the unstabilized pilots (dots represent individual data). Undefined = undefined locations plus loss of gaze: the value is low, showing the high quality of the eye-tracking data and the fact that few fixations occurred outside the defined AOI. AI = Attitude Indicator; HLD = Heading/Lateral Deviation scales; AVSVD = Altitude/Vertical Speed/Vertical Deviation scales; FMA = Flight Mode Annunciator; ND = Navigation Display; ECAM = Electronic Centralized Aircraft Monitor system; and SD = System Display system. The dashed error bars indicate the interval spanning over the mean percentage of dwell times on each AOI of the most accurate pilots, plus/minus two standard deviations (labeled efficient dwell times interval).

Figure 9.
Number of visual scanning patterns according to the three pilot’s performance profiles (dots represent individual data) during the approach (pre-training session). The most accurate pilots produced a higher number of visual scanning patterns, followed by the standard pilots, and the unstabilized pilots.

Figure 10.
Absolute lateral and vertical deviations in dots (lower is better) during the approach (post-training session) for the experimental group and the control group (dots represent individual data). The pilot who did not manage to stabilize the approach has not been included since he aborted the landing.

Figure 11.
Flight performance during the approach (post-training session). Mean speed, height, and landing distance during landing for the control and experimental groups (dots represent individual data). Solid lines indicate parameter tolerances to meet stabilization criteria. The dashed lines indicate target speed and height. The pilot who did not manage to stabilize the approach has not been included since he aborted the landing.

Figure 12.
Percentage of dwell times on each cockpit AOI for the control and experimental groups (dots represent individual data). Undefined = undefined locations plus loss of gaze: the value is low, showing the high quality of the eye-tracking data and the fact that few fixations occurred outside the defined AOI. The dashed error bars indicate the interval spanning over the mean percentage of dwell times on each AOI for the accurate pilots plus/minus two standard deviations (as measured during the pre-training session).

Figure 13.
Evolution of the number of visual scanning patterns between the pre- and the post-training session for the control and experimental groups (dots represent individual data).
Figure 13.
Evolution of the number of visual scanning patterns between the pre- and the post-training session for the control and experimental groups (dots represent individual data).

Figure 14.
Evolution of the four efficient visual scanning patterns (A–D) and the other visual scanning patterns for the control and the experimental groups between pre- and post-training sessions.
Figure 14.
Evolution of the four efficient visual scanning patterns (A–D) and the other visual scanning patterns for the control and the experimental groups between pre- and post-training sessions.


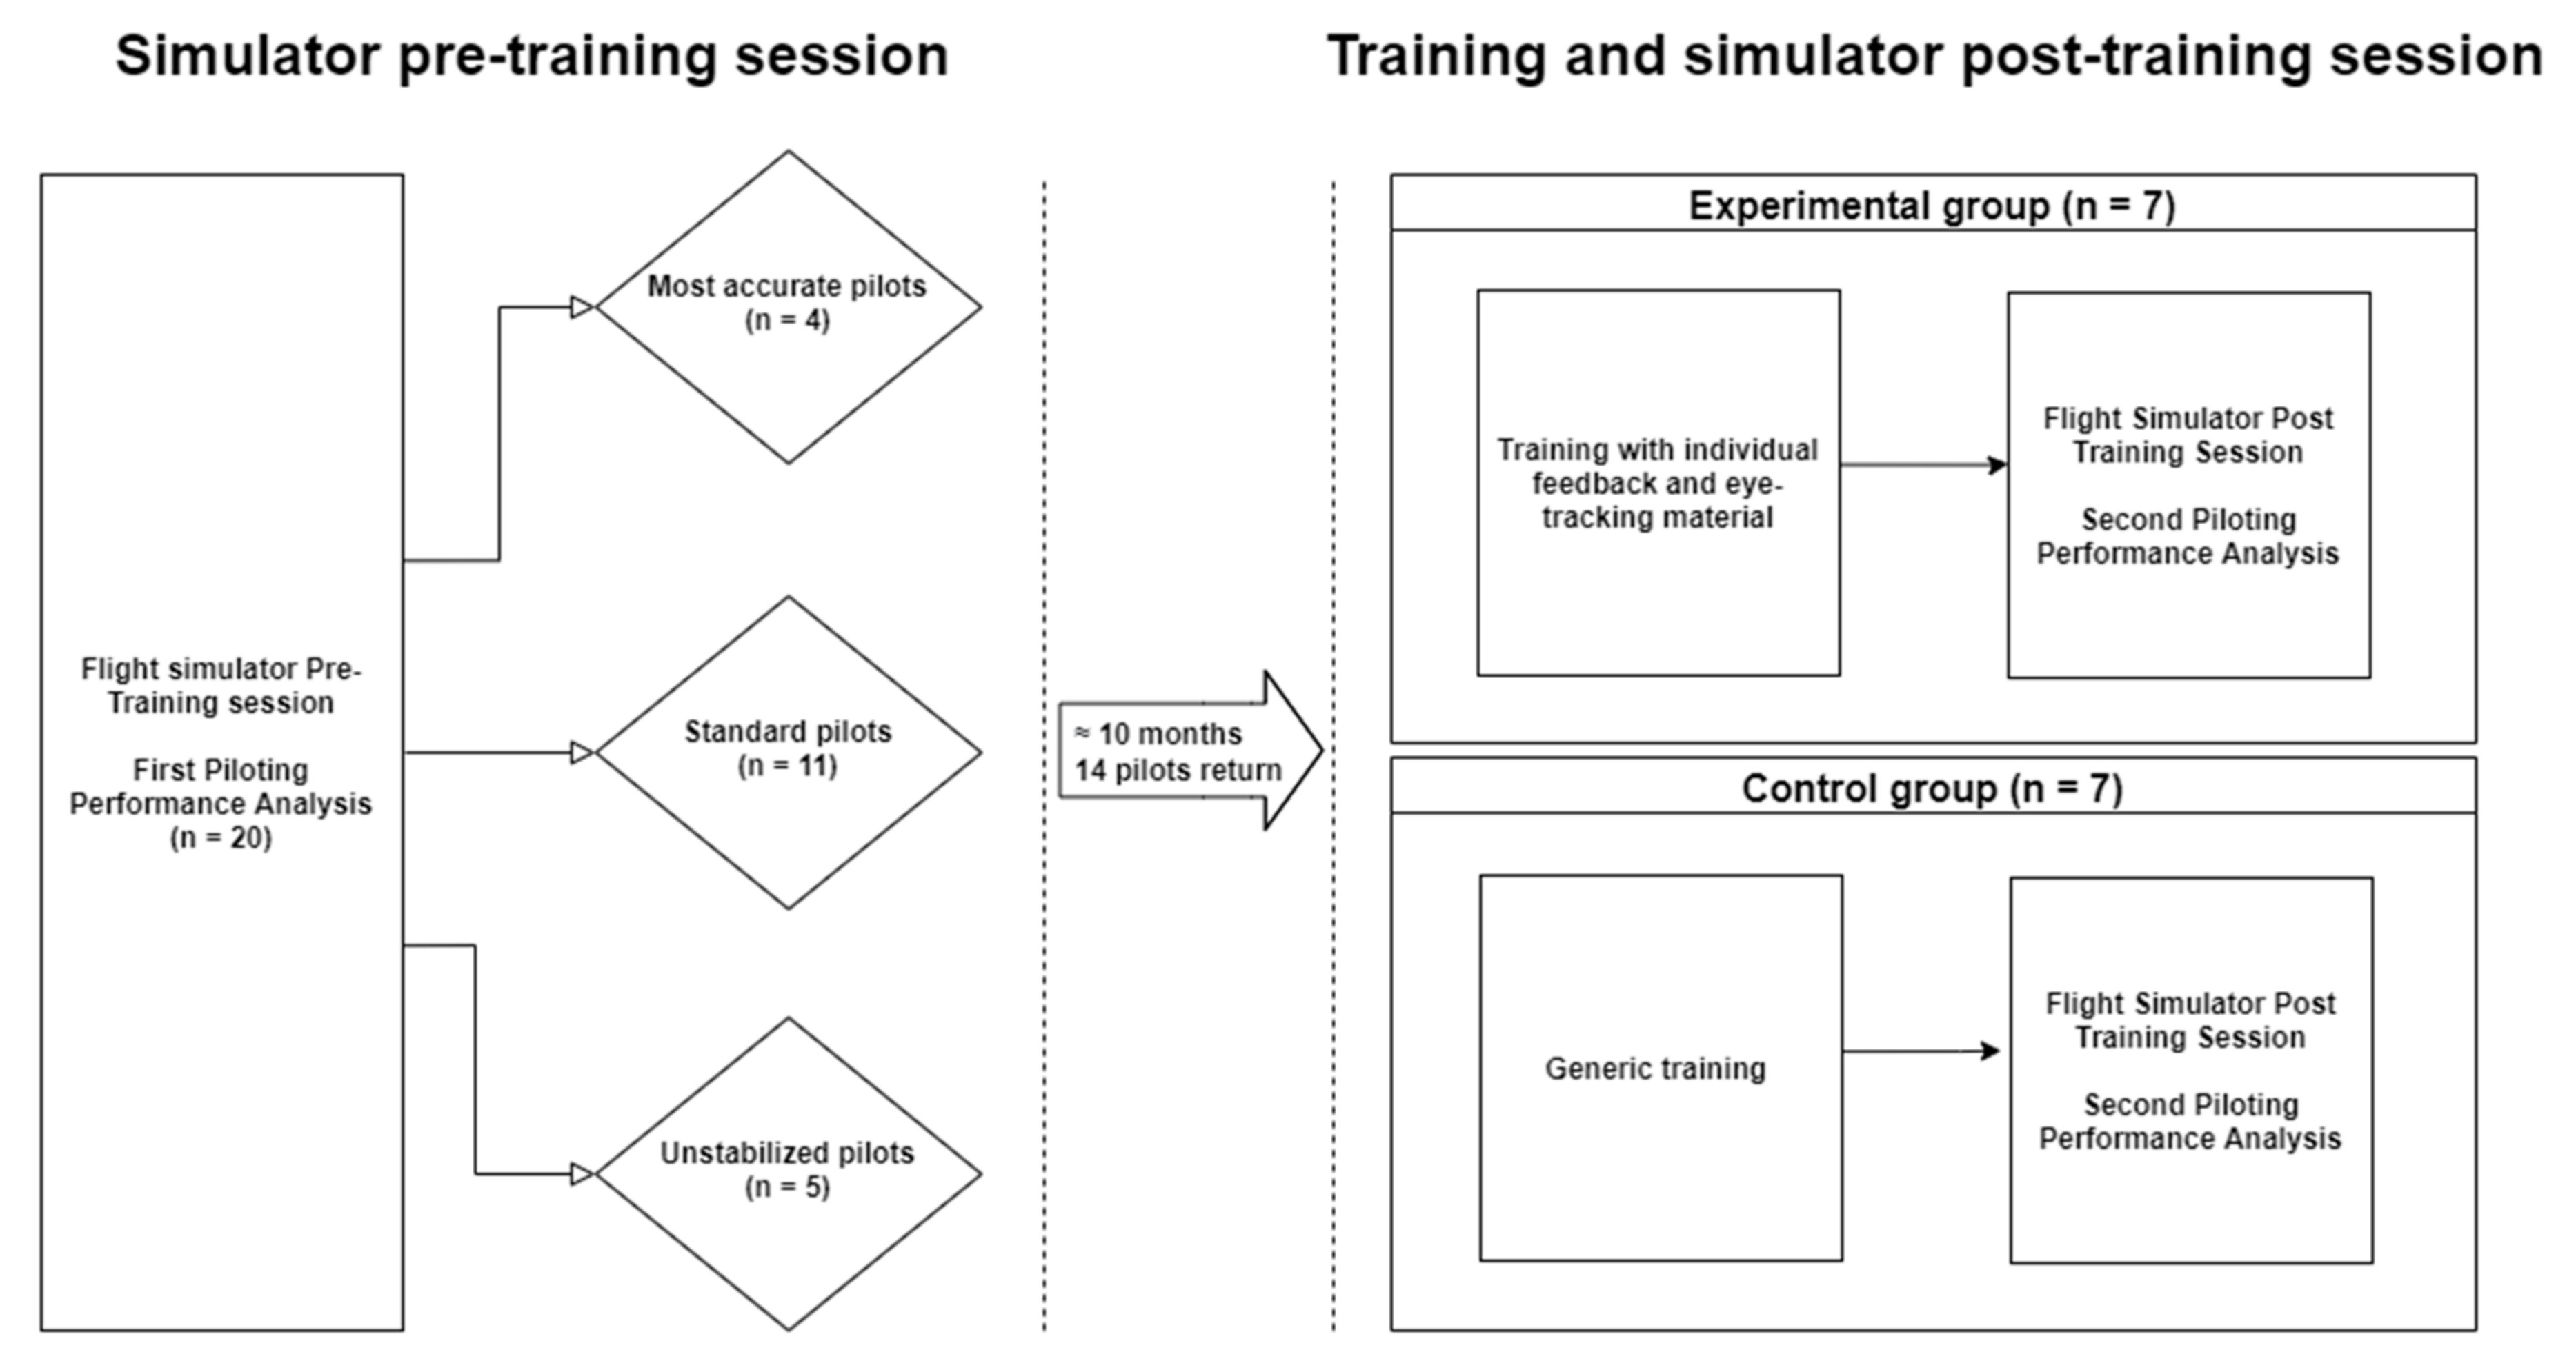
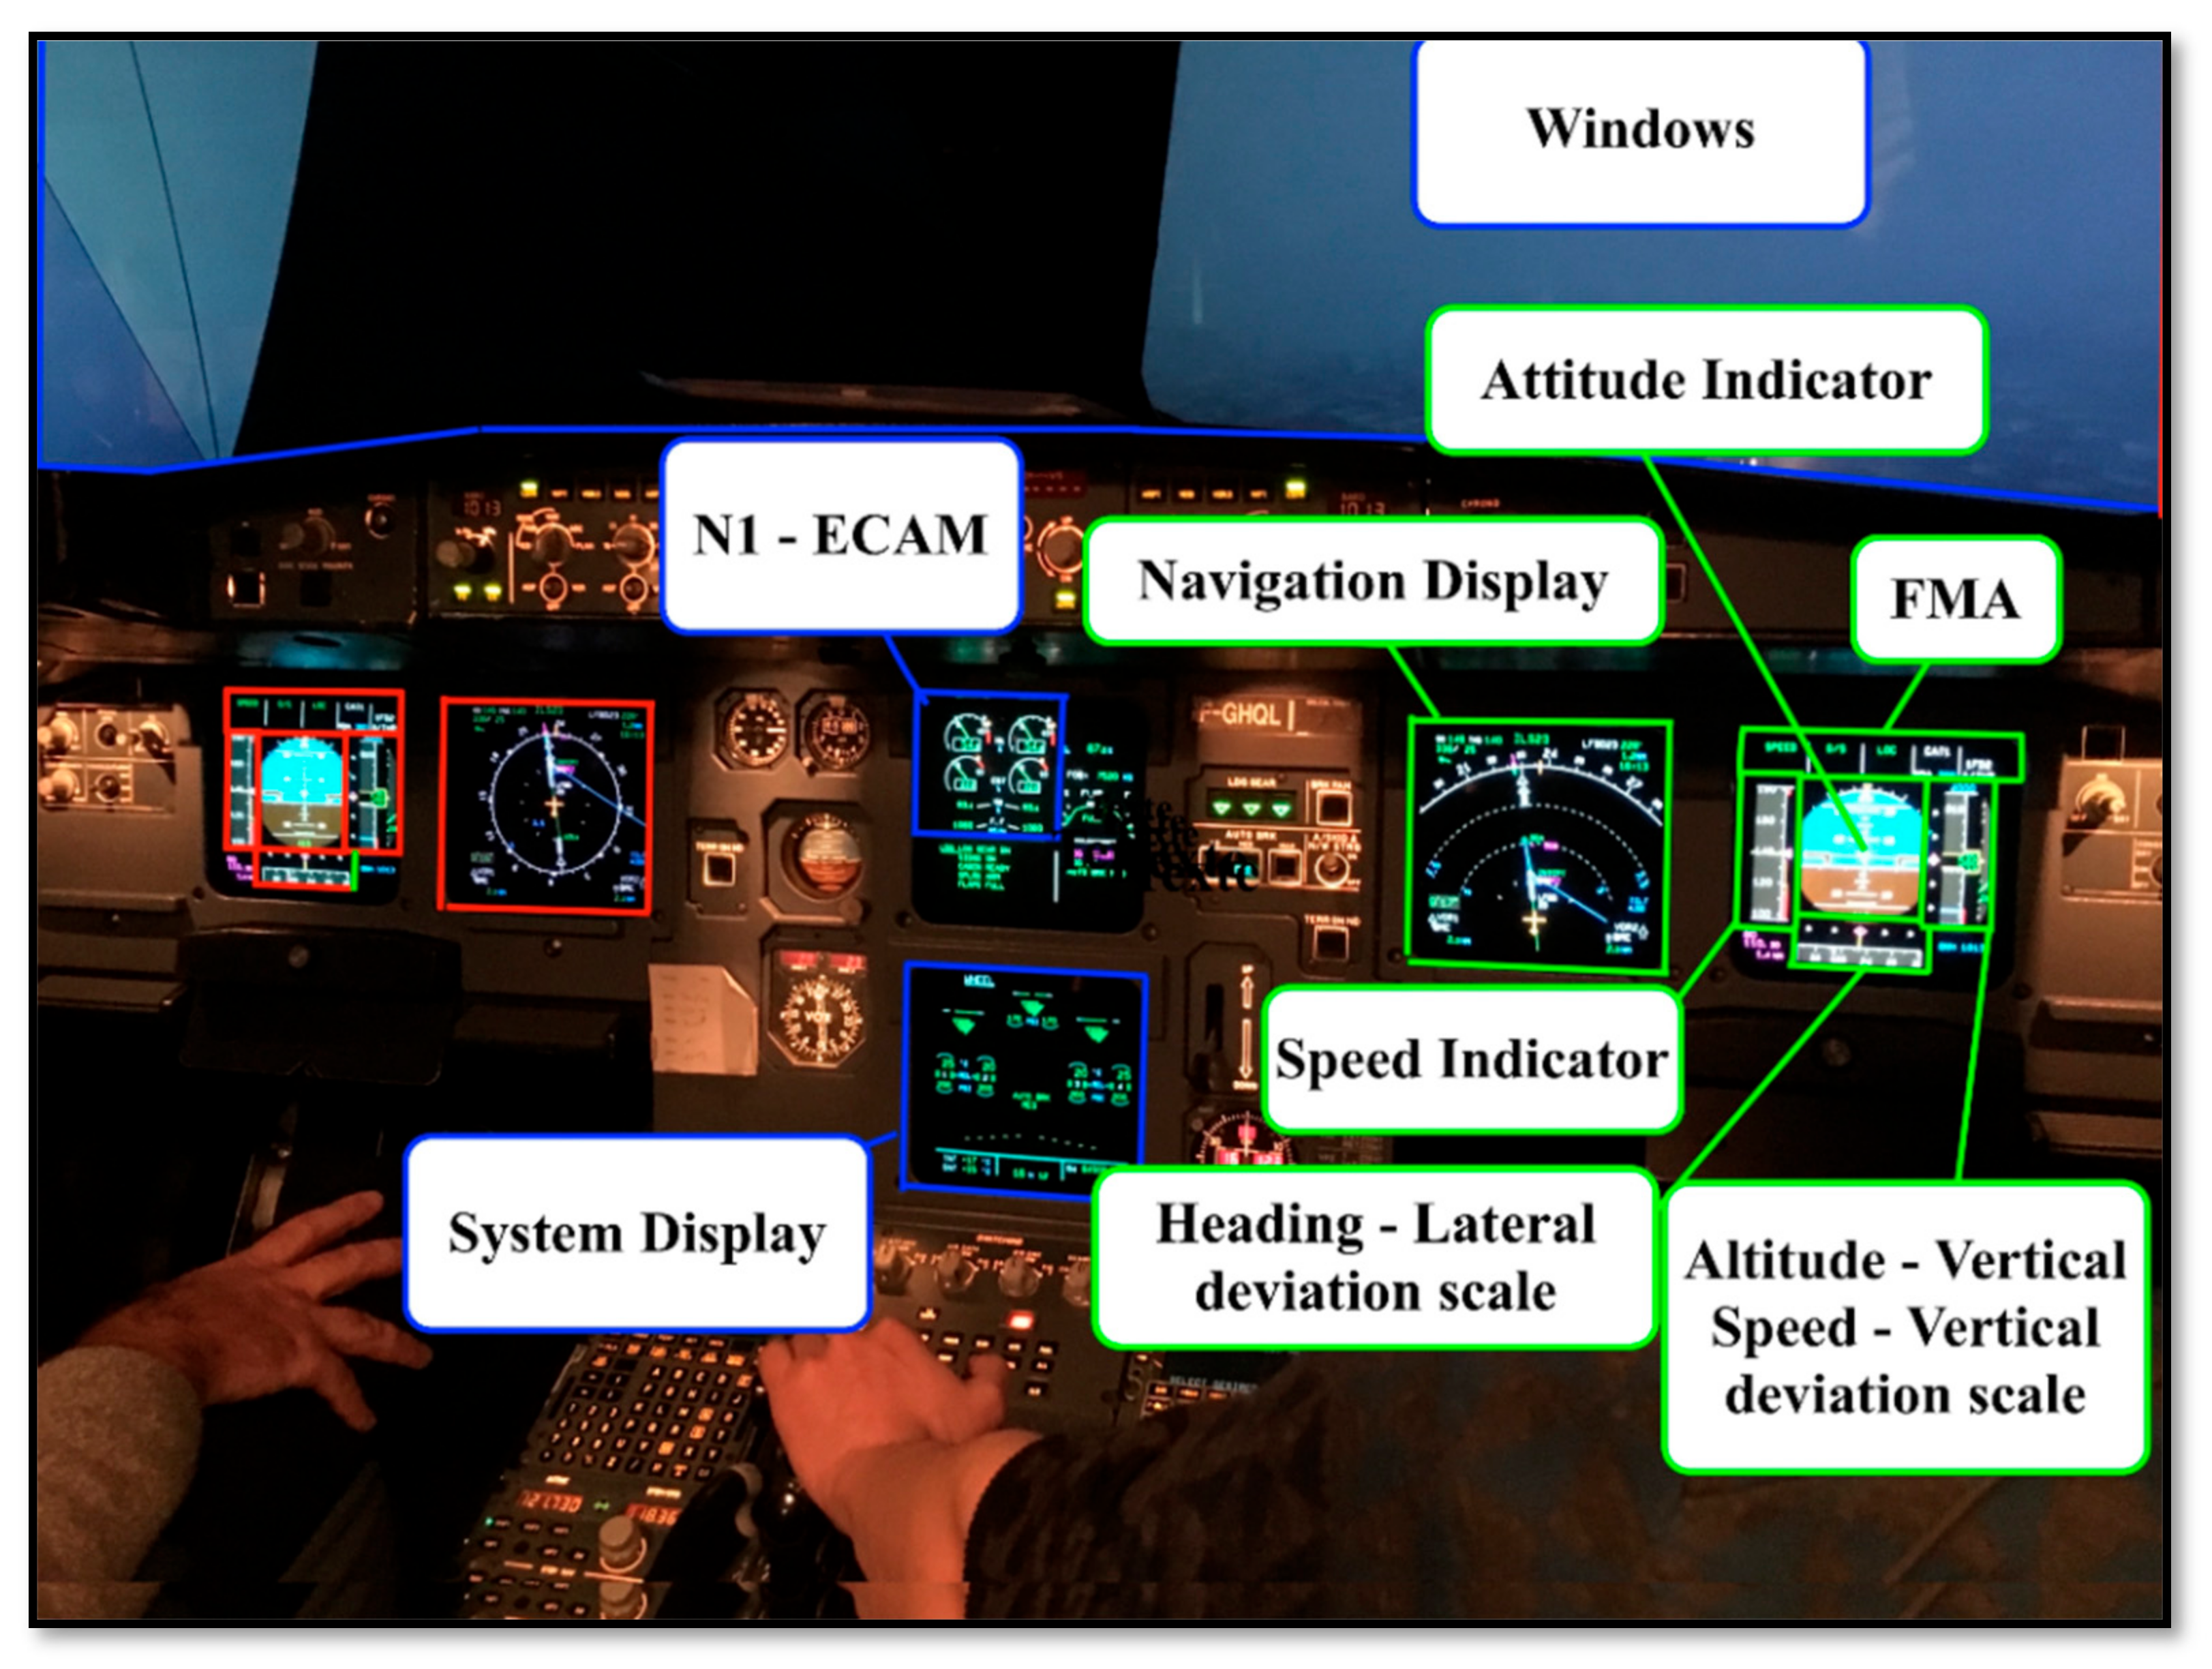
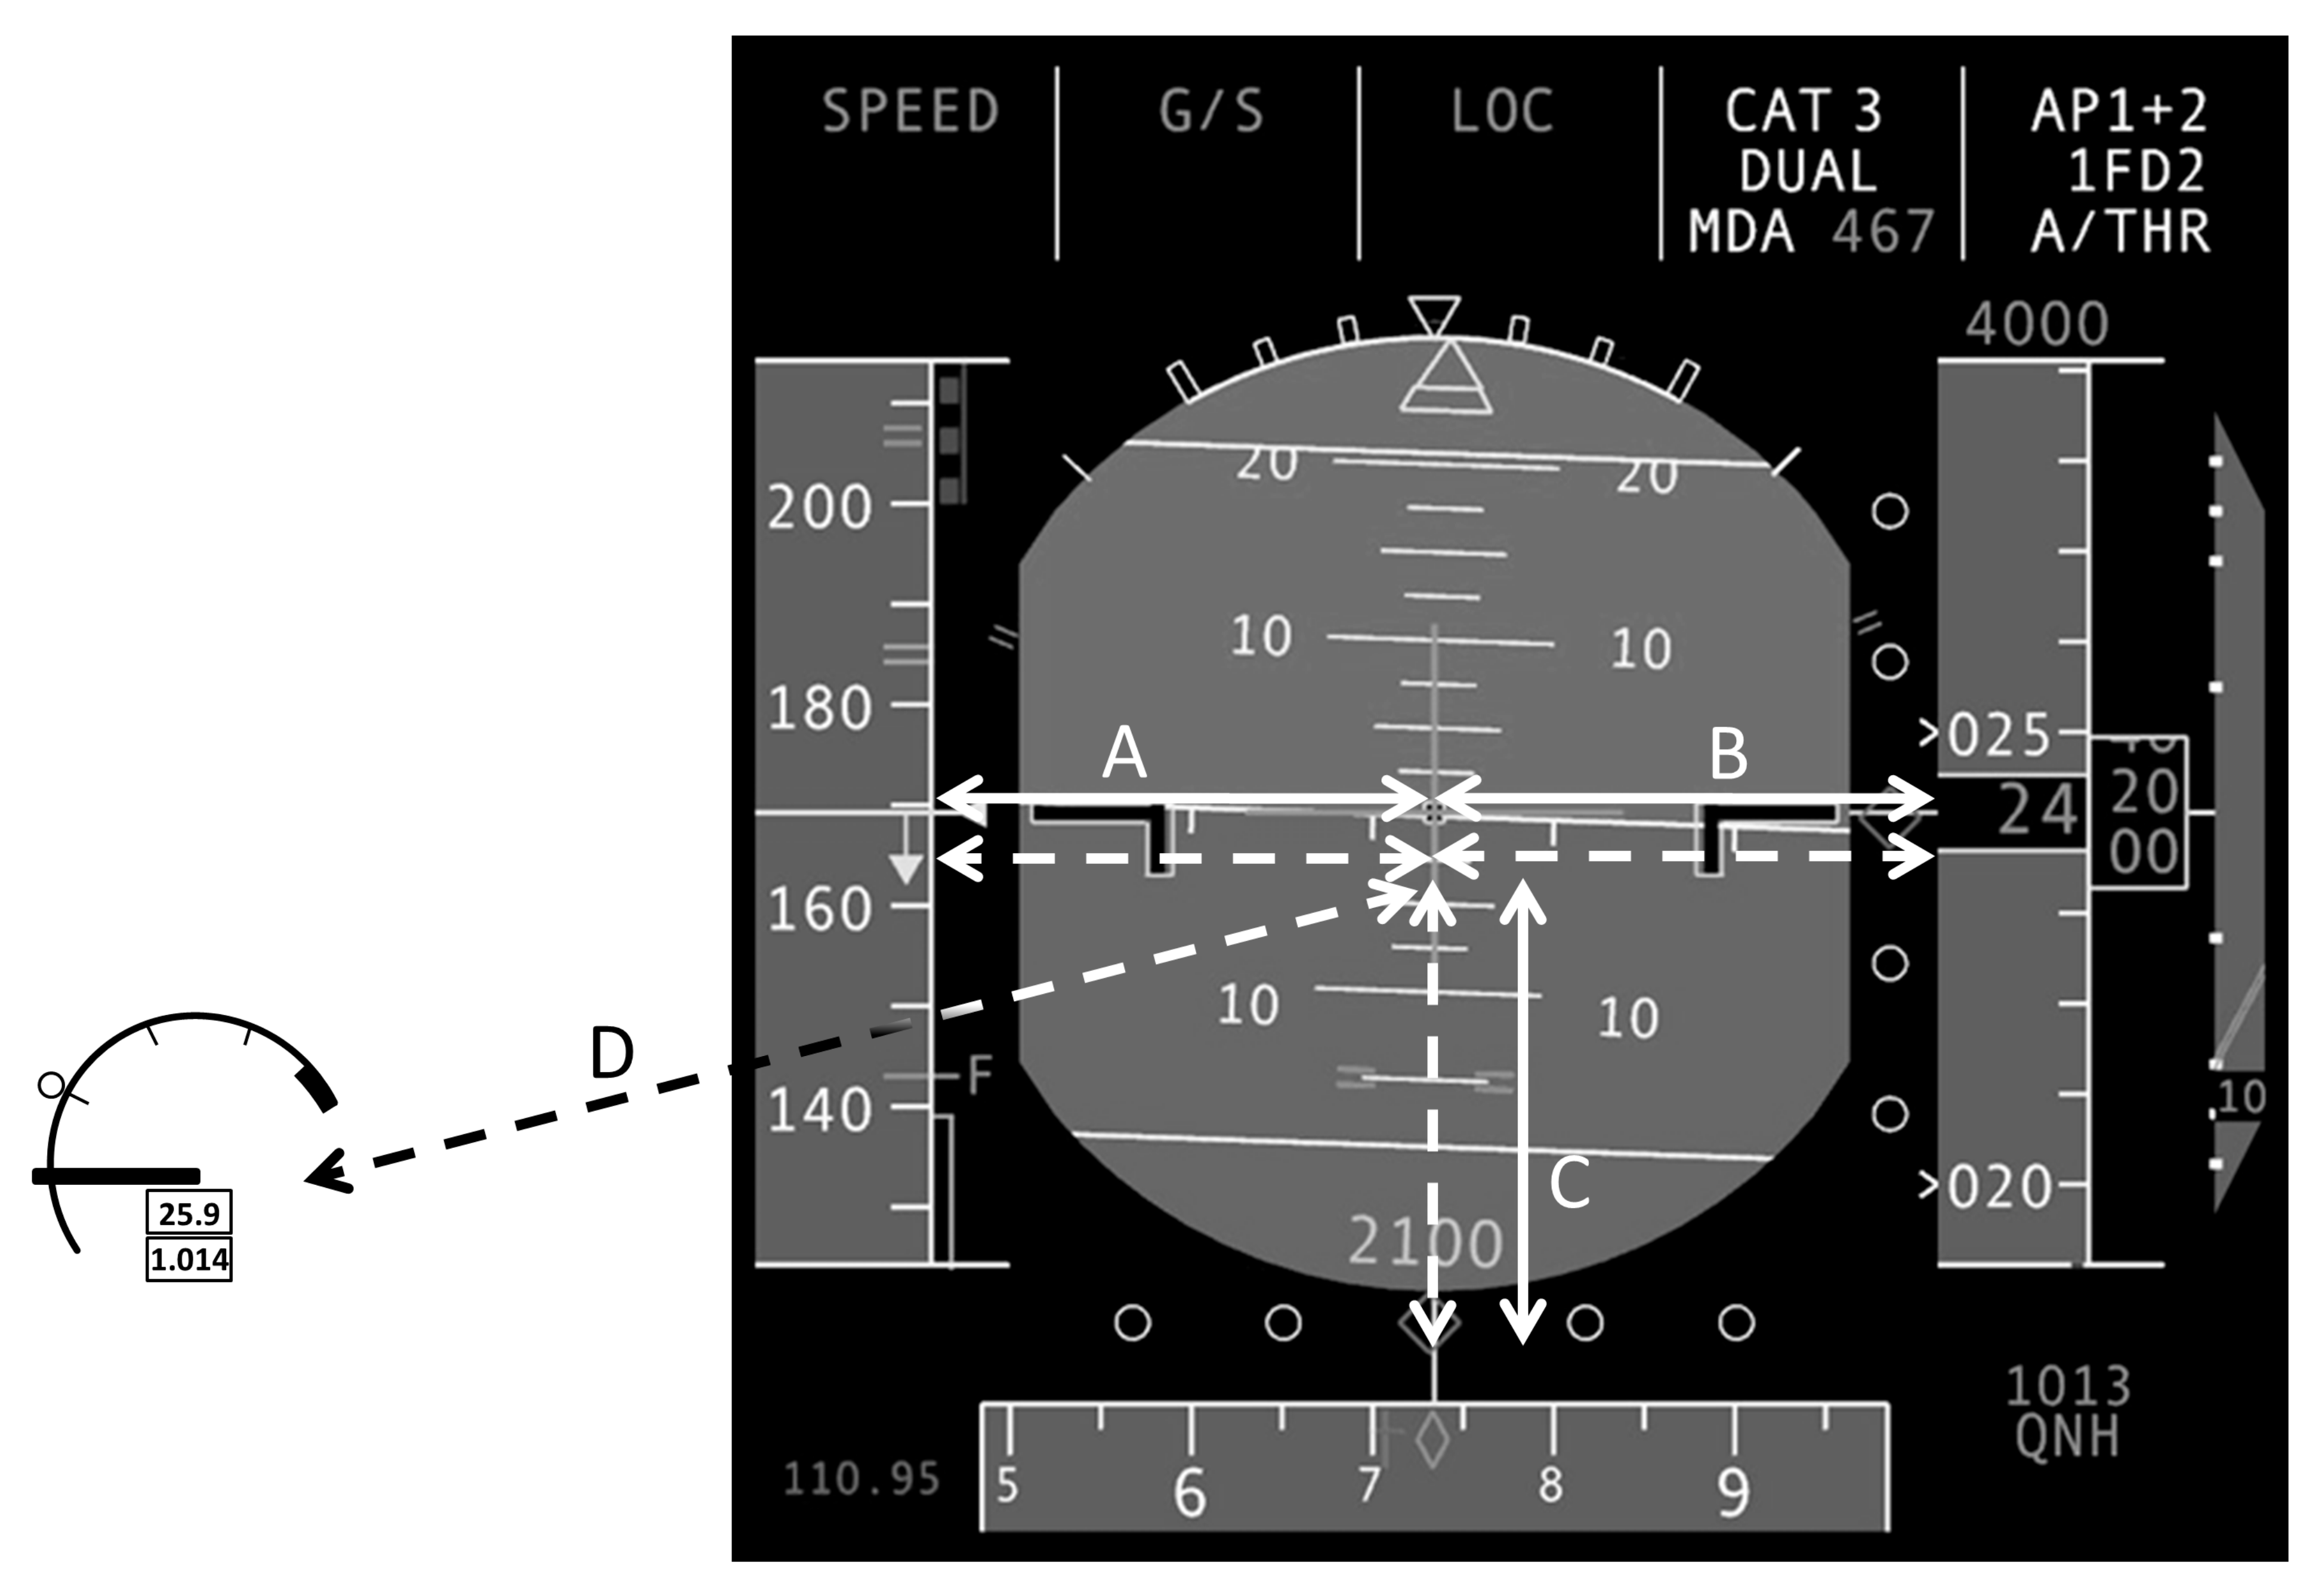
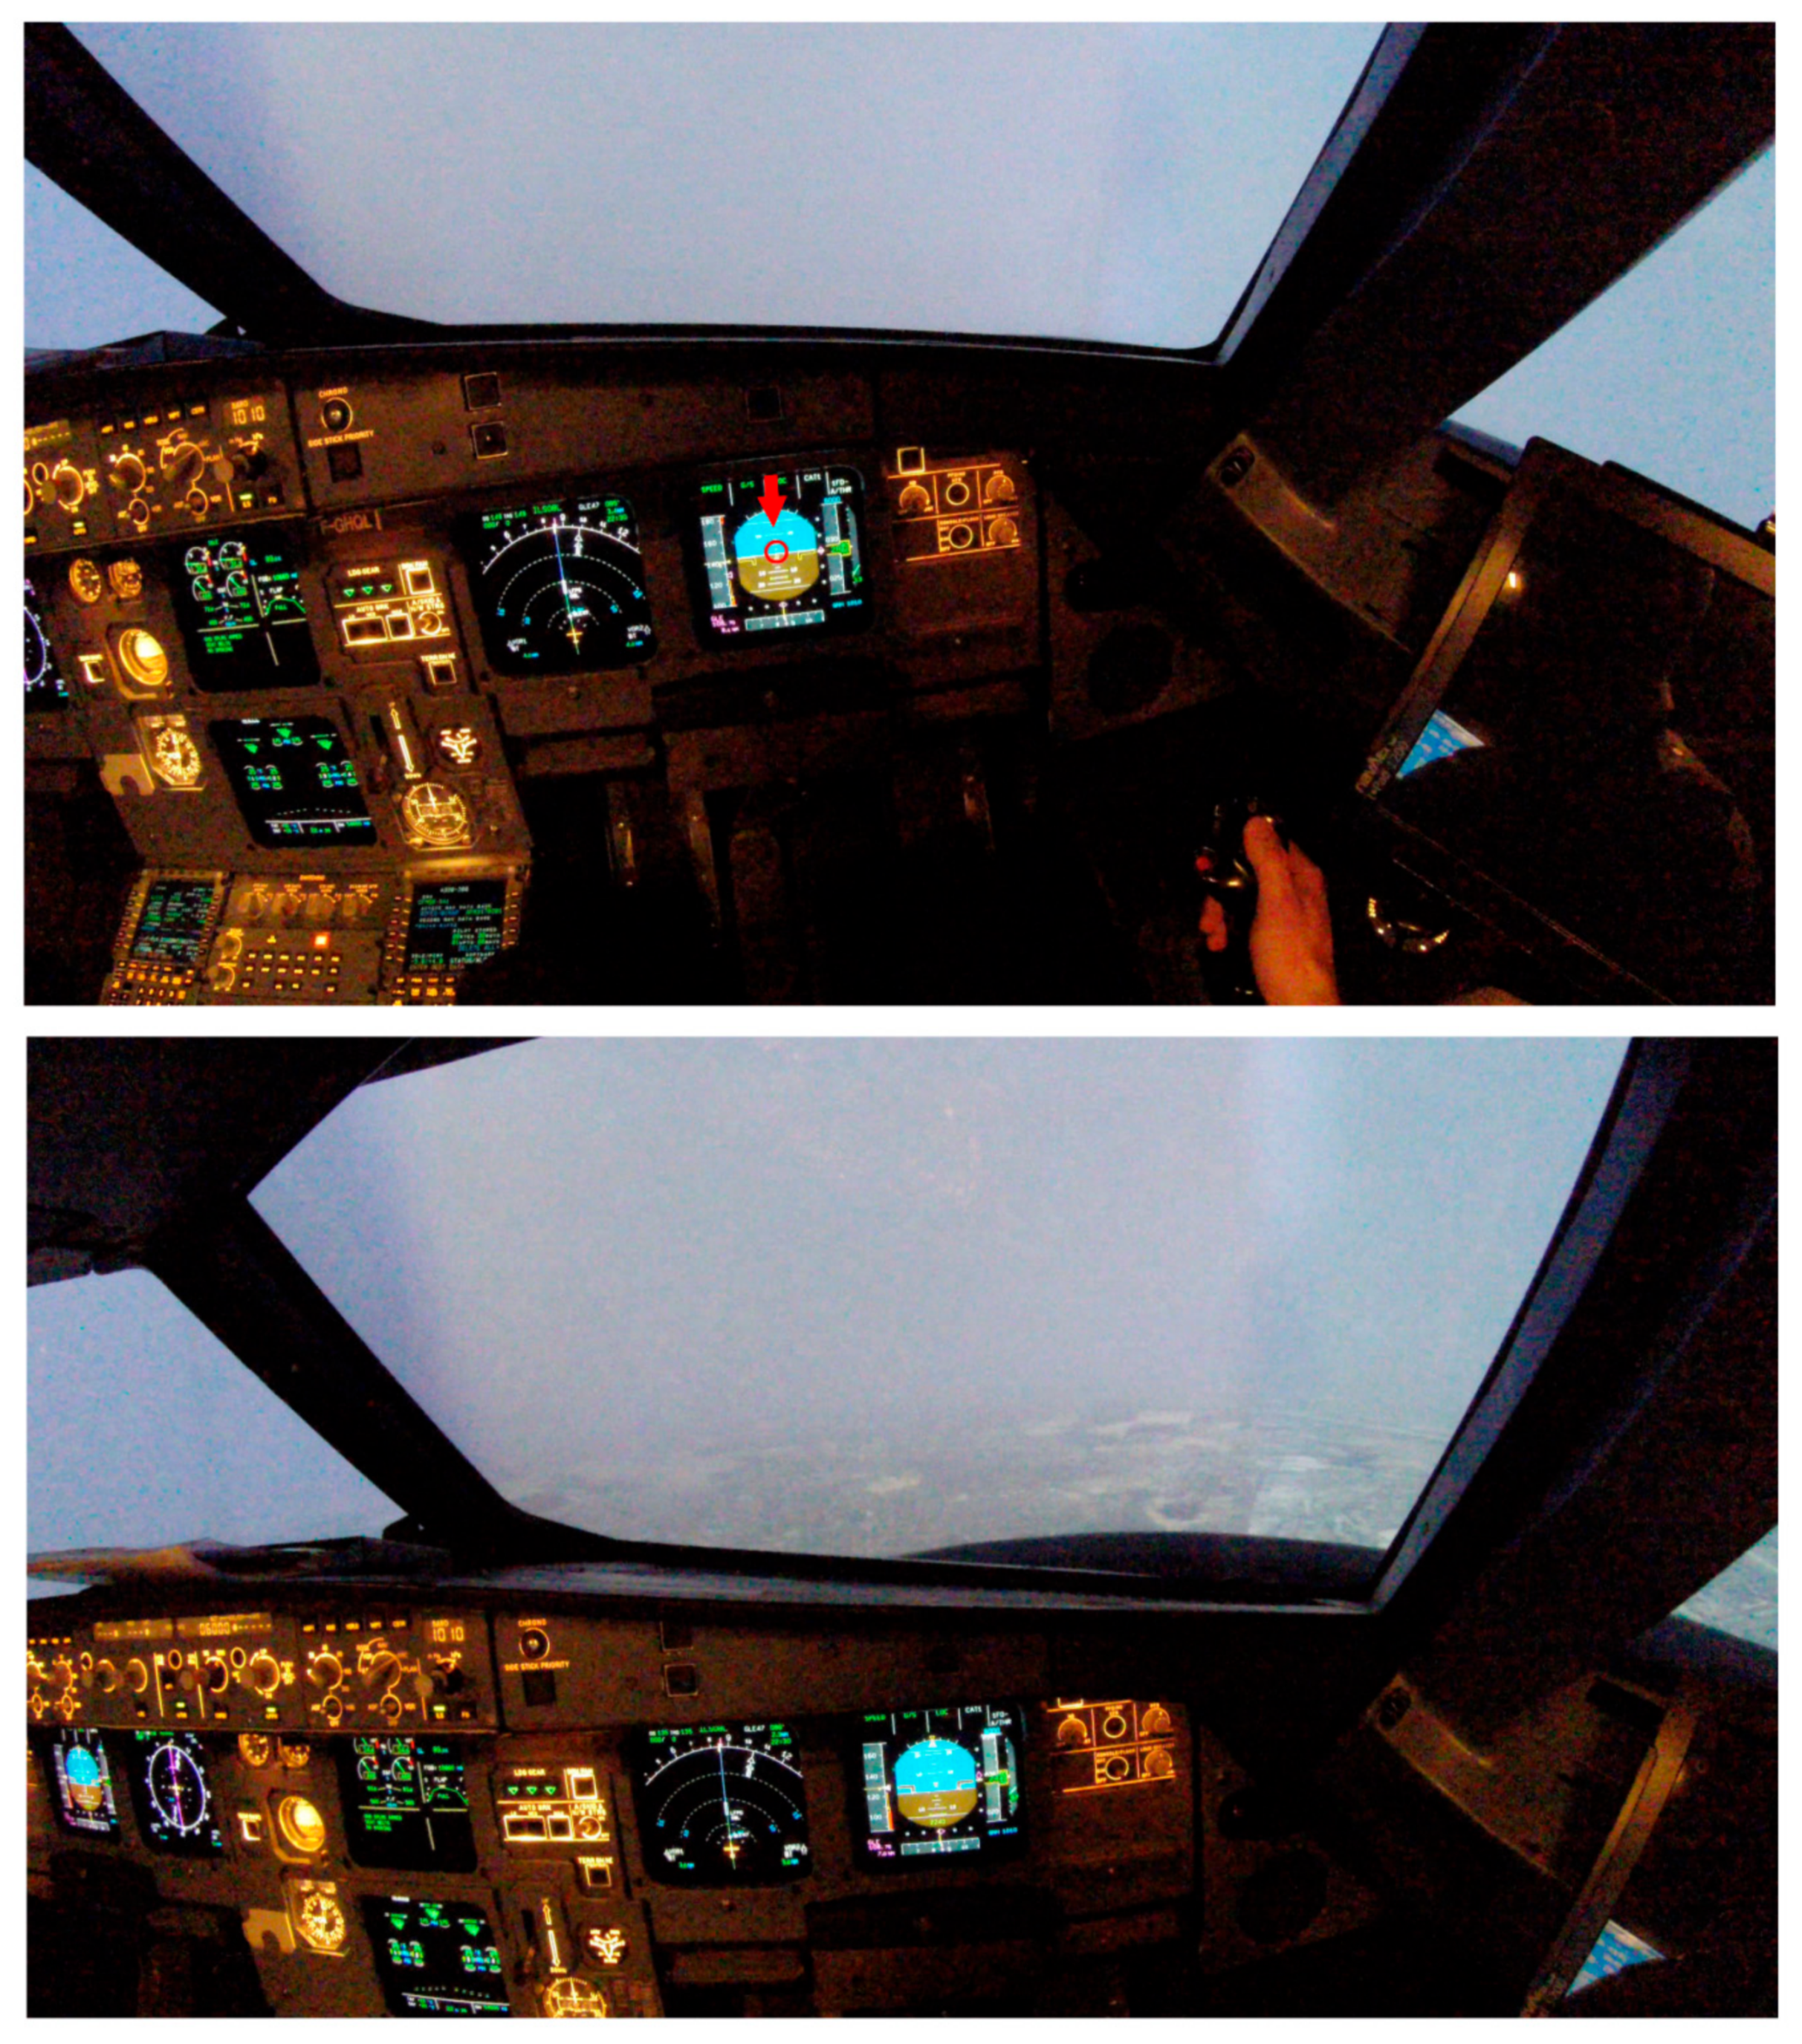
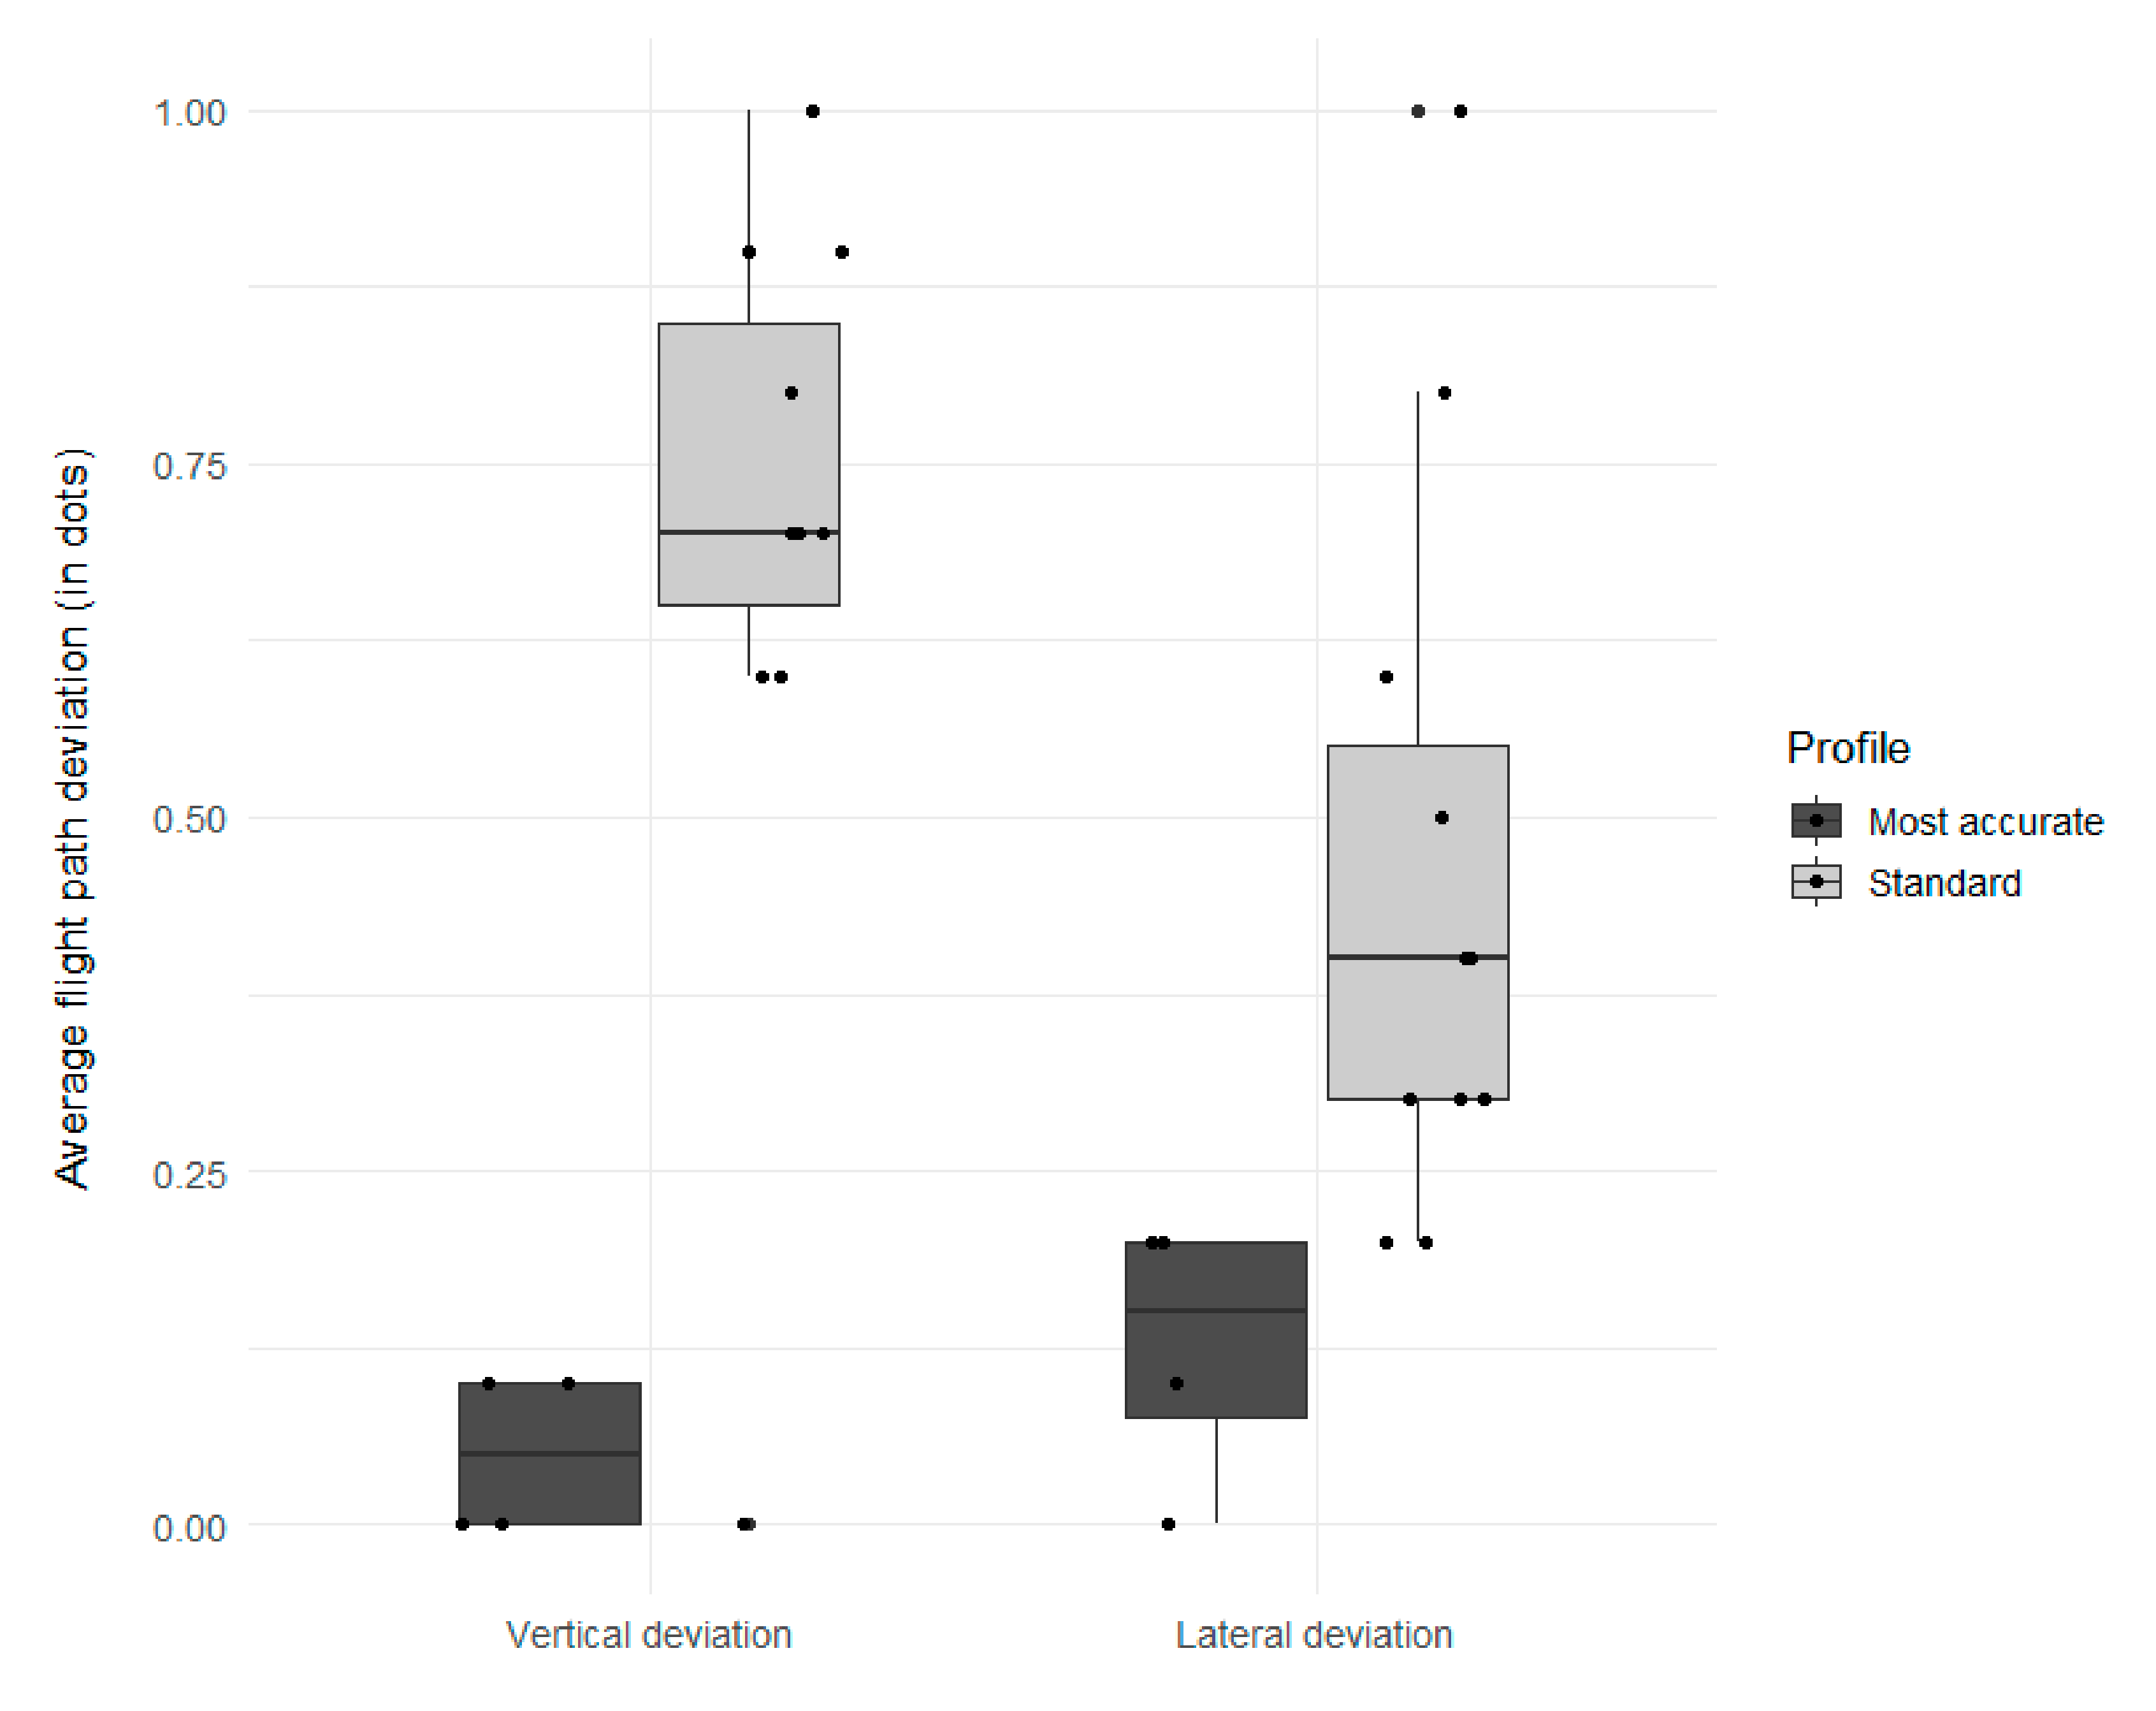
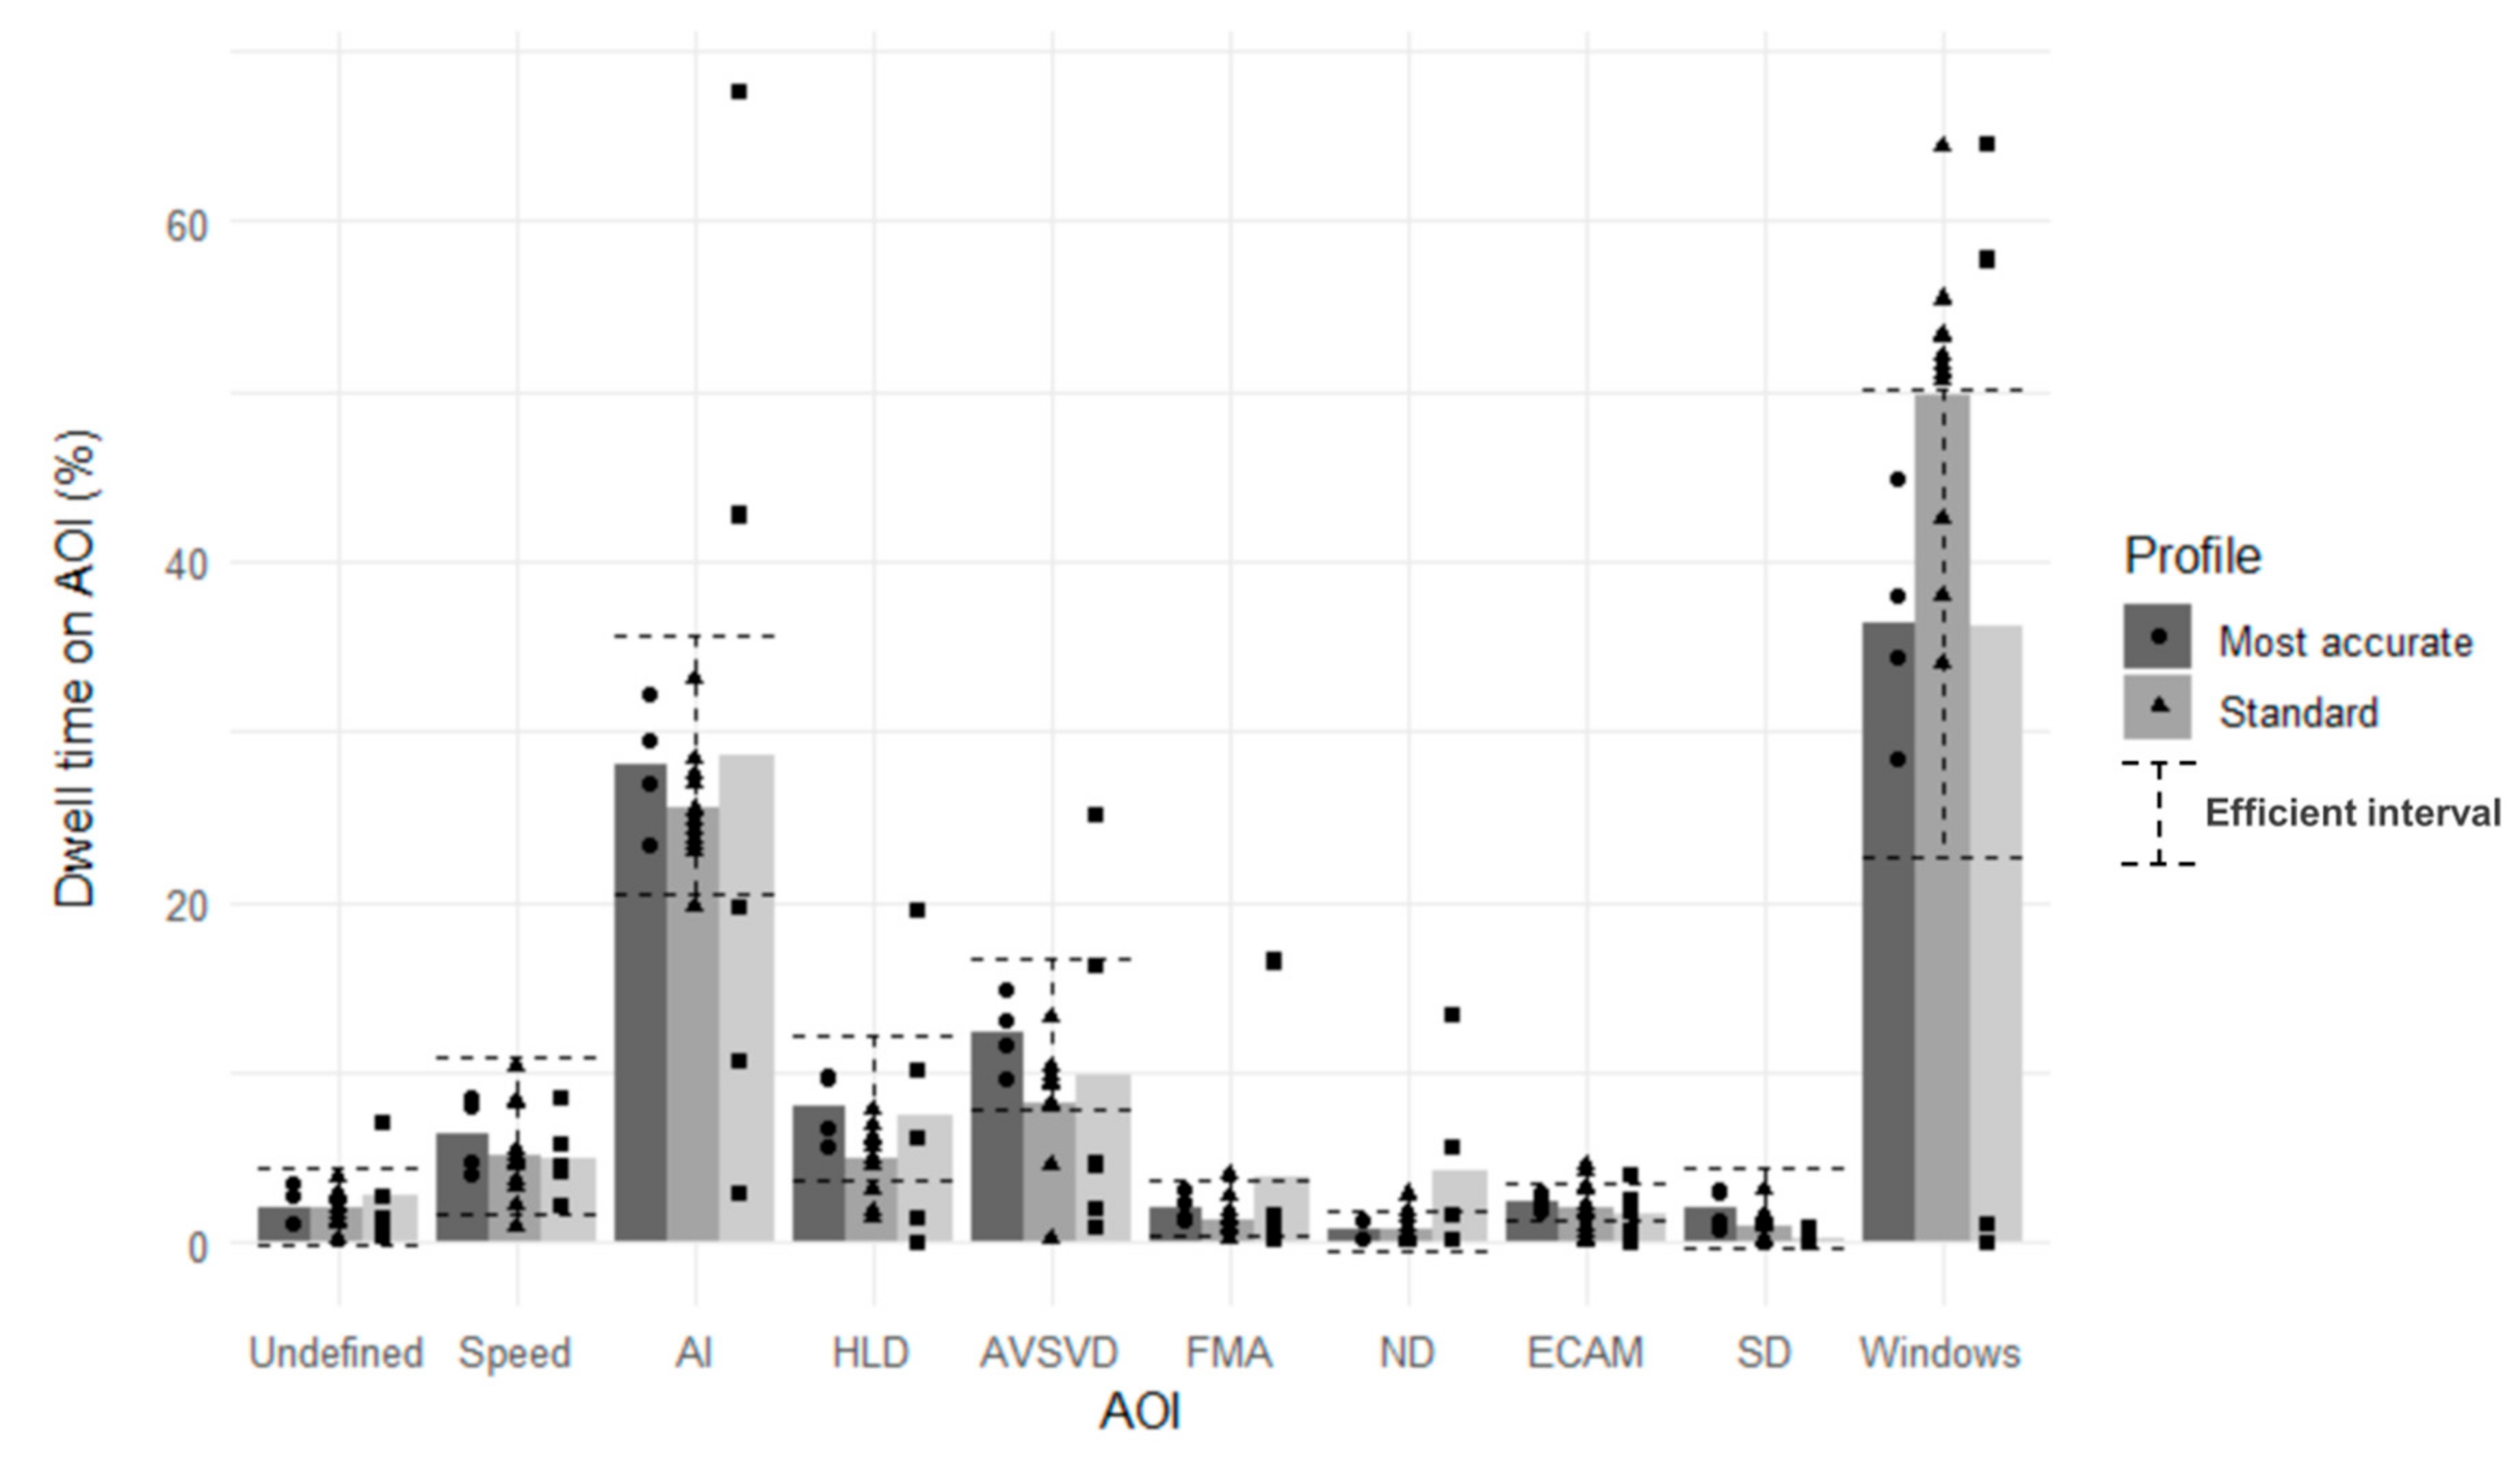
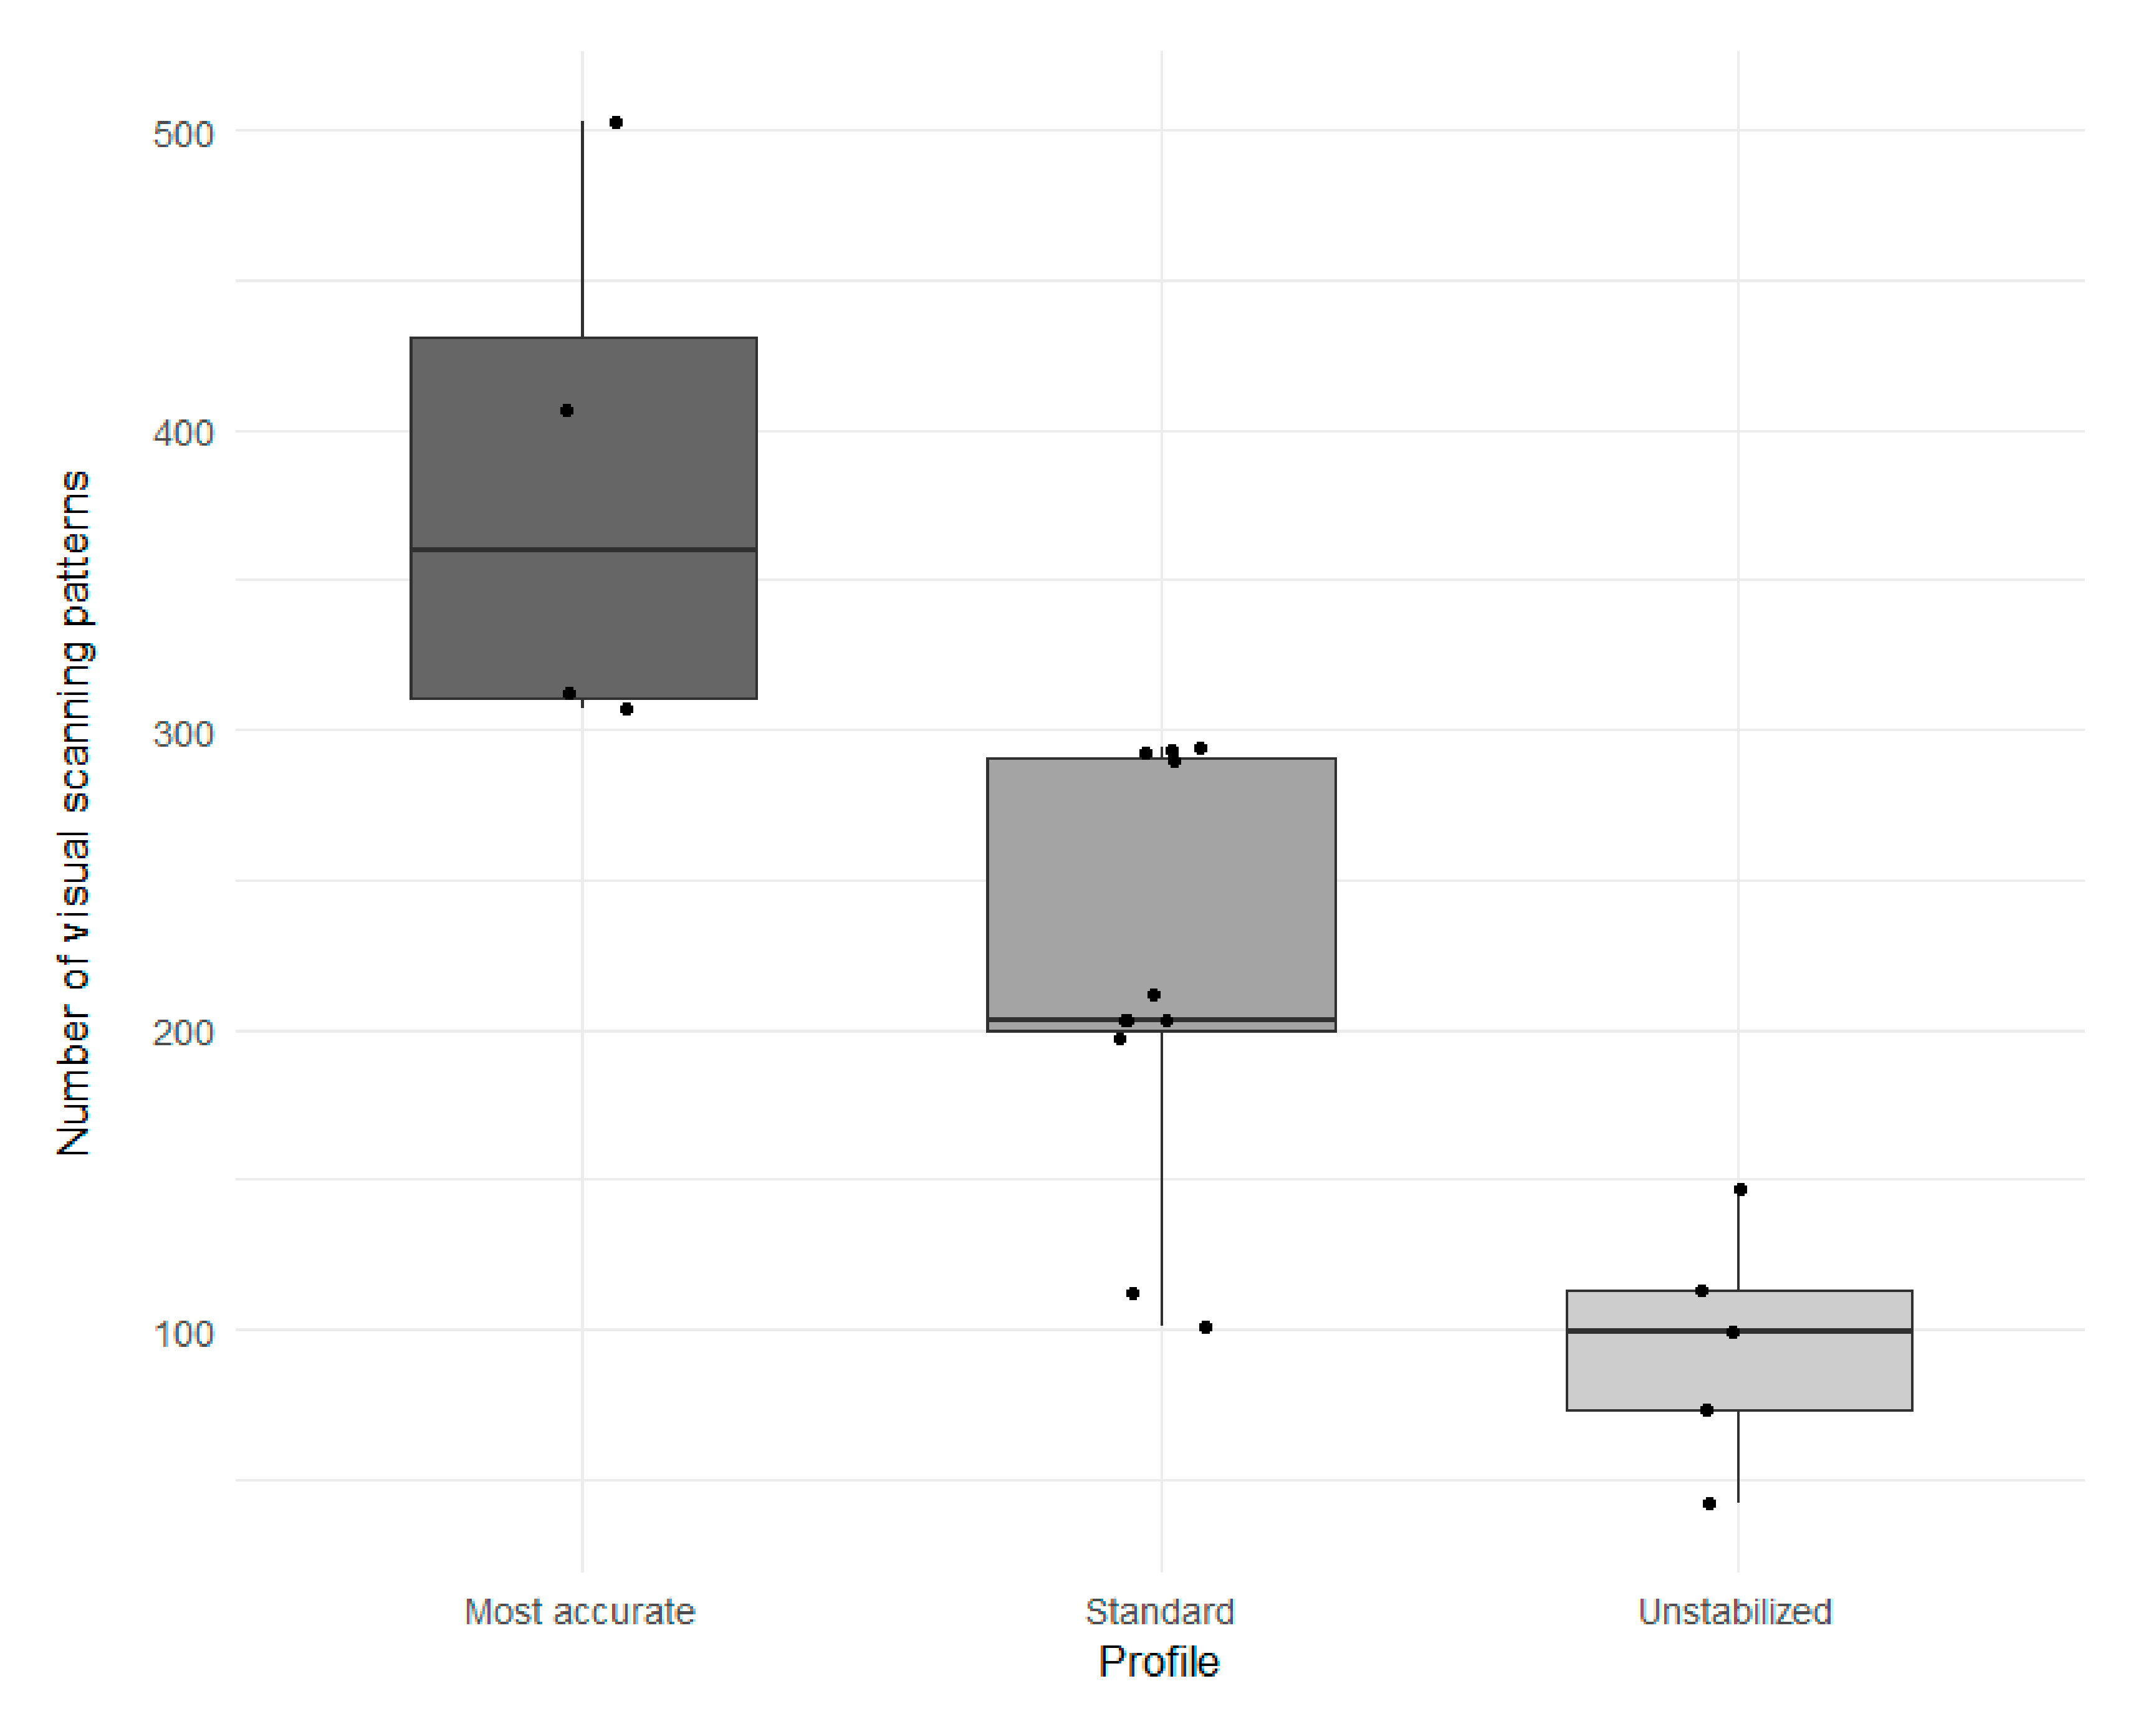
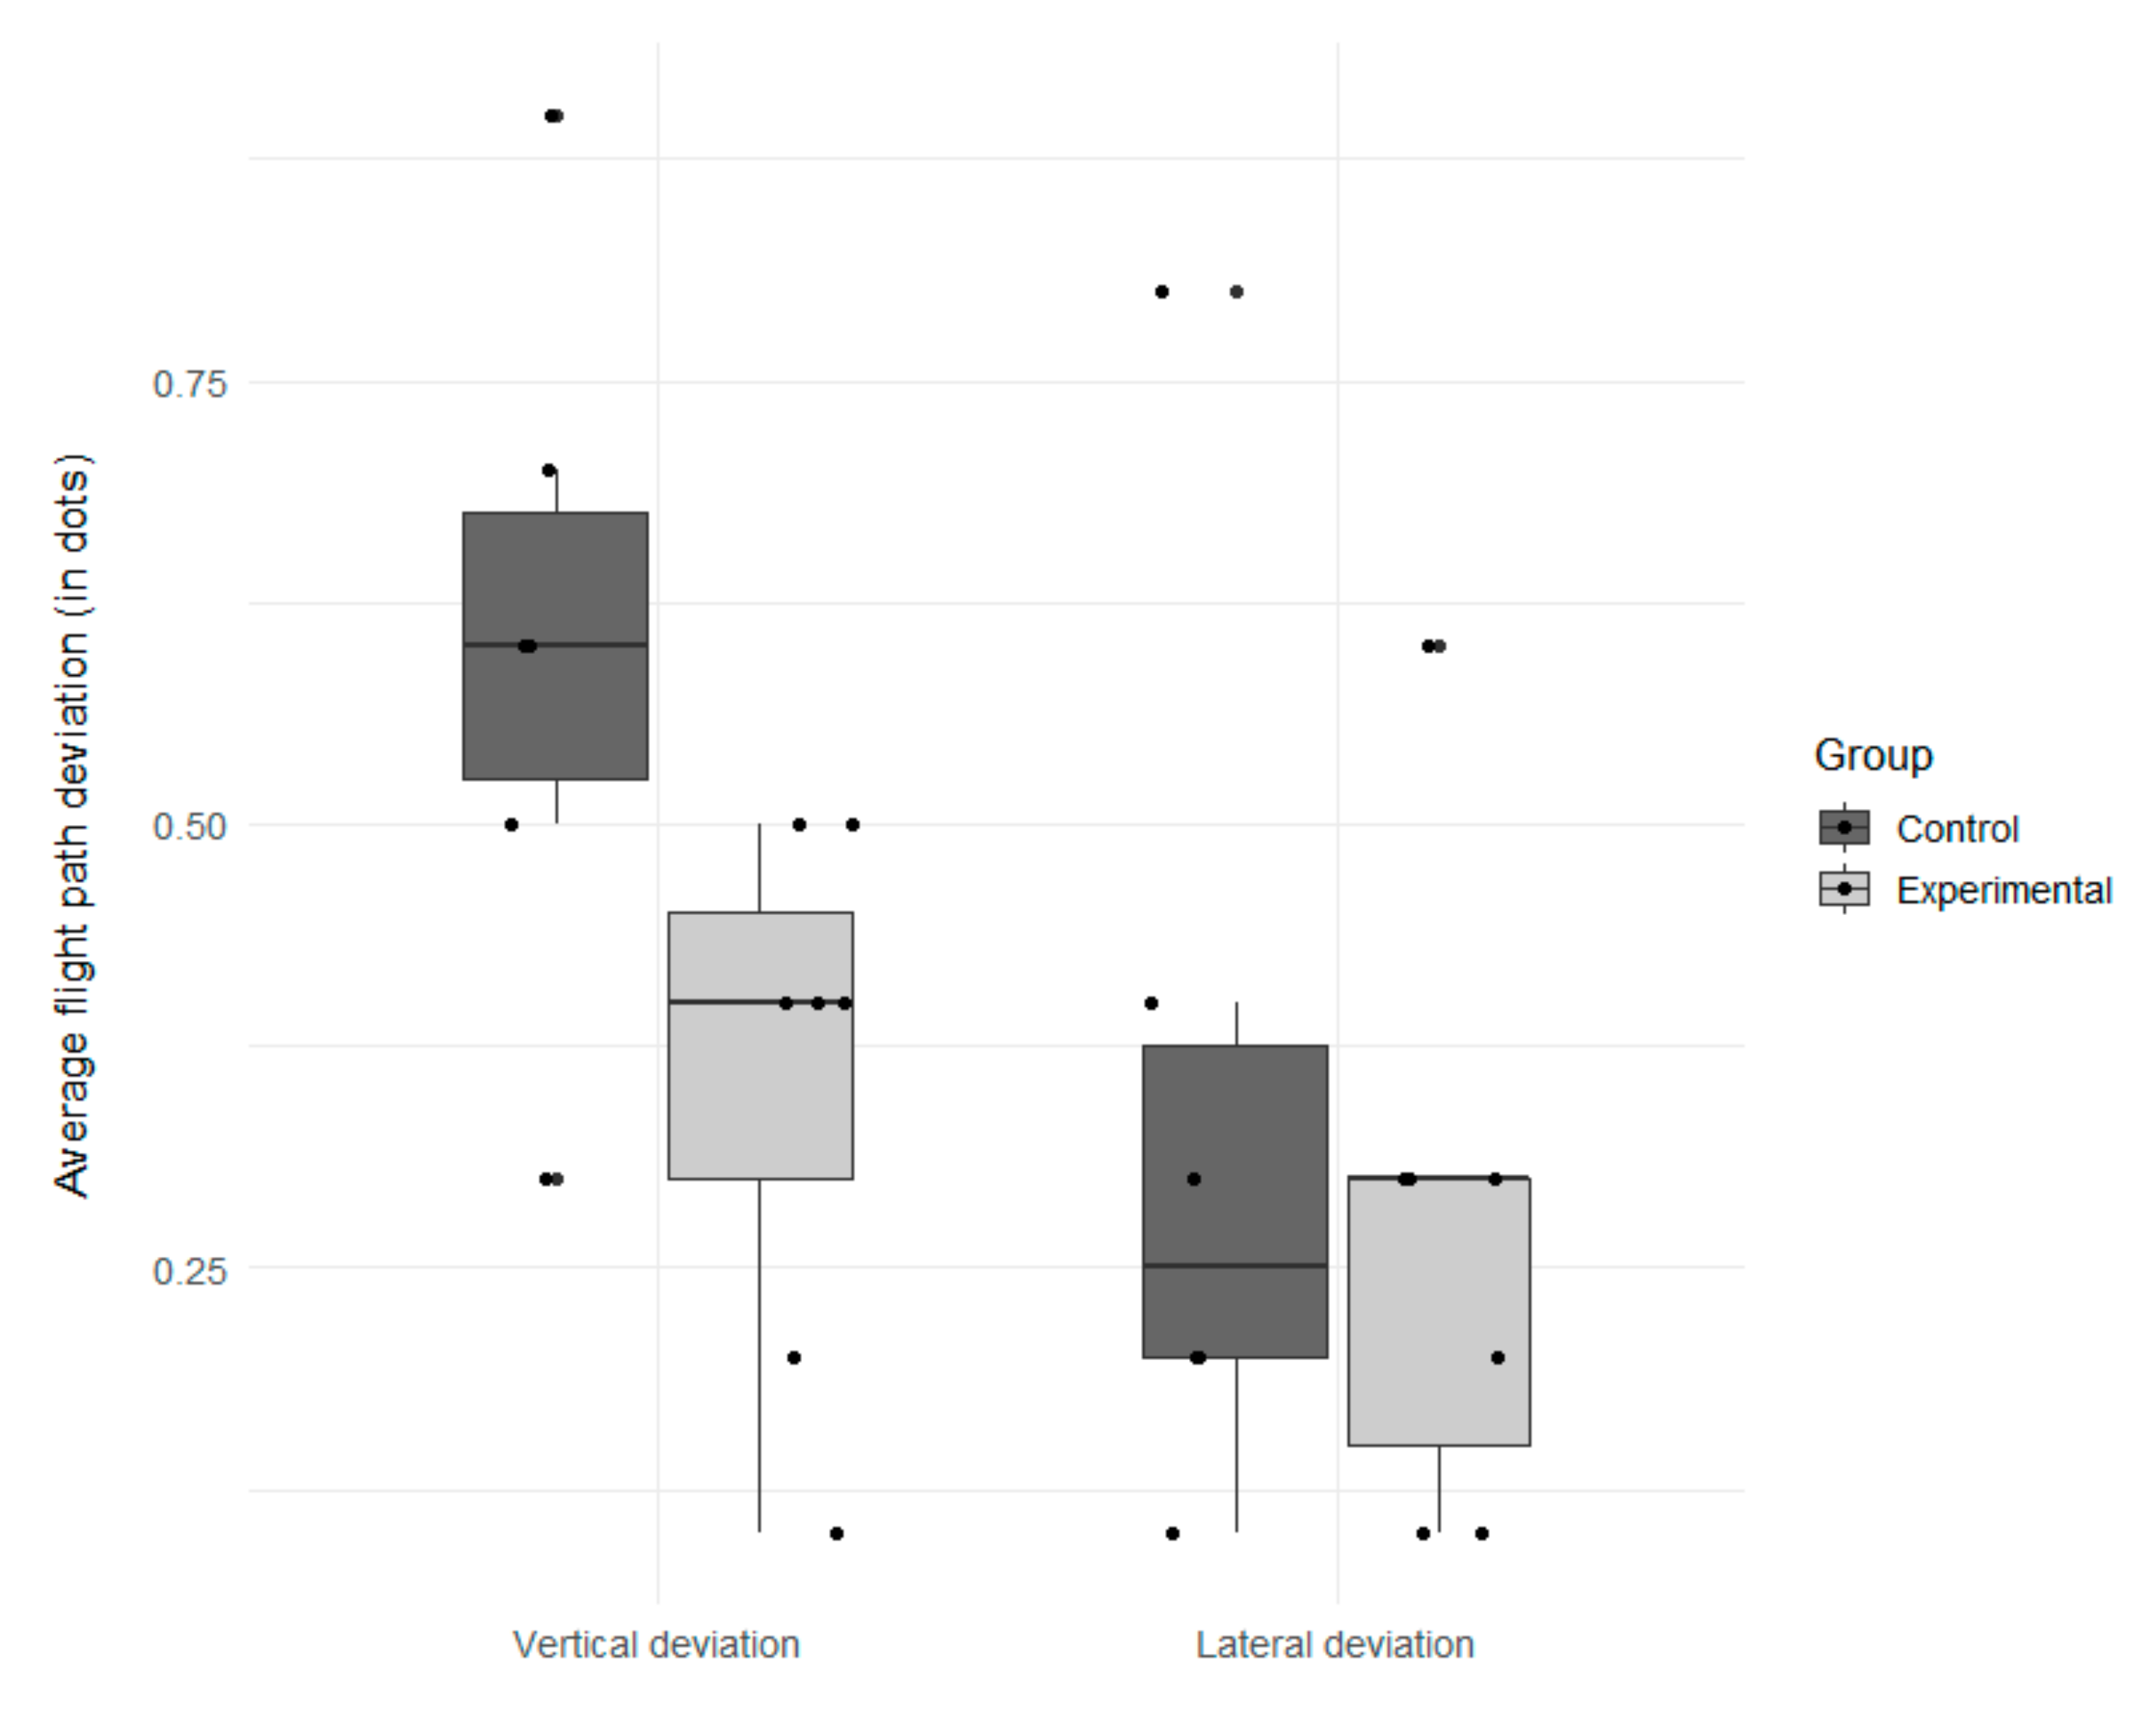
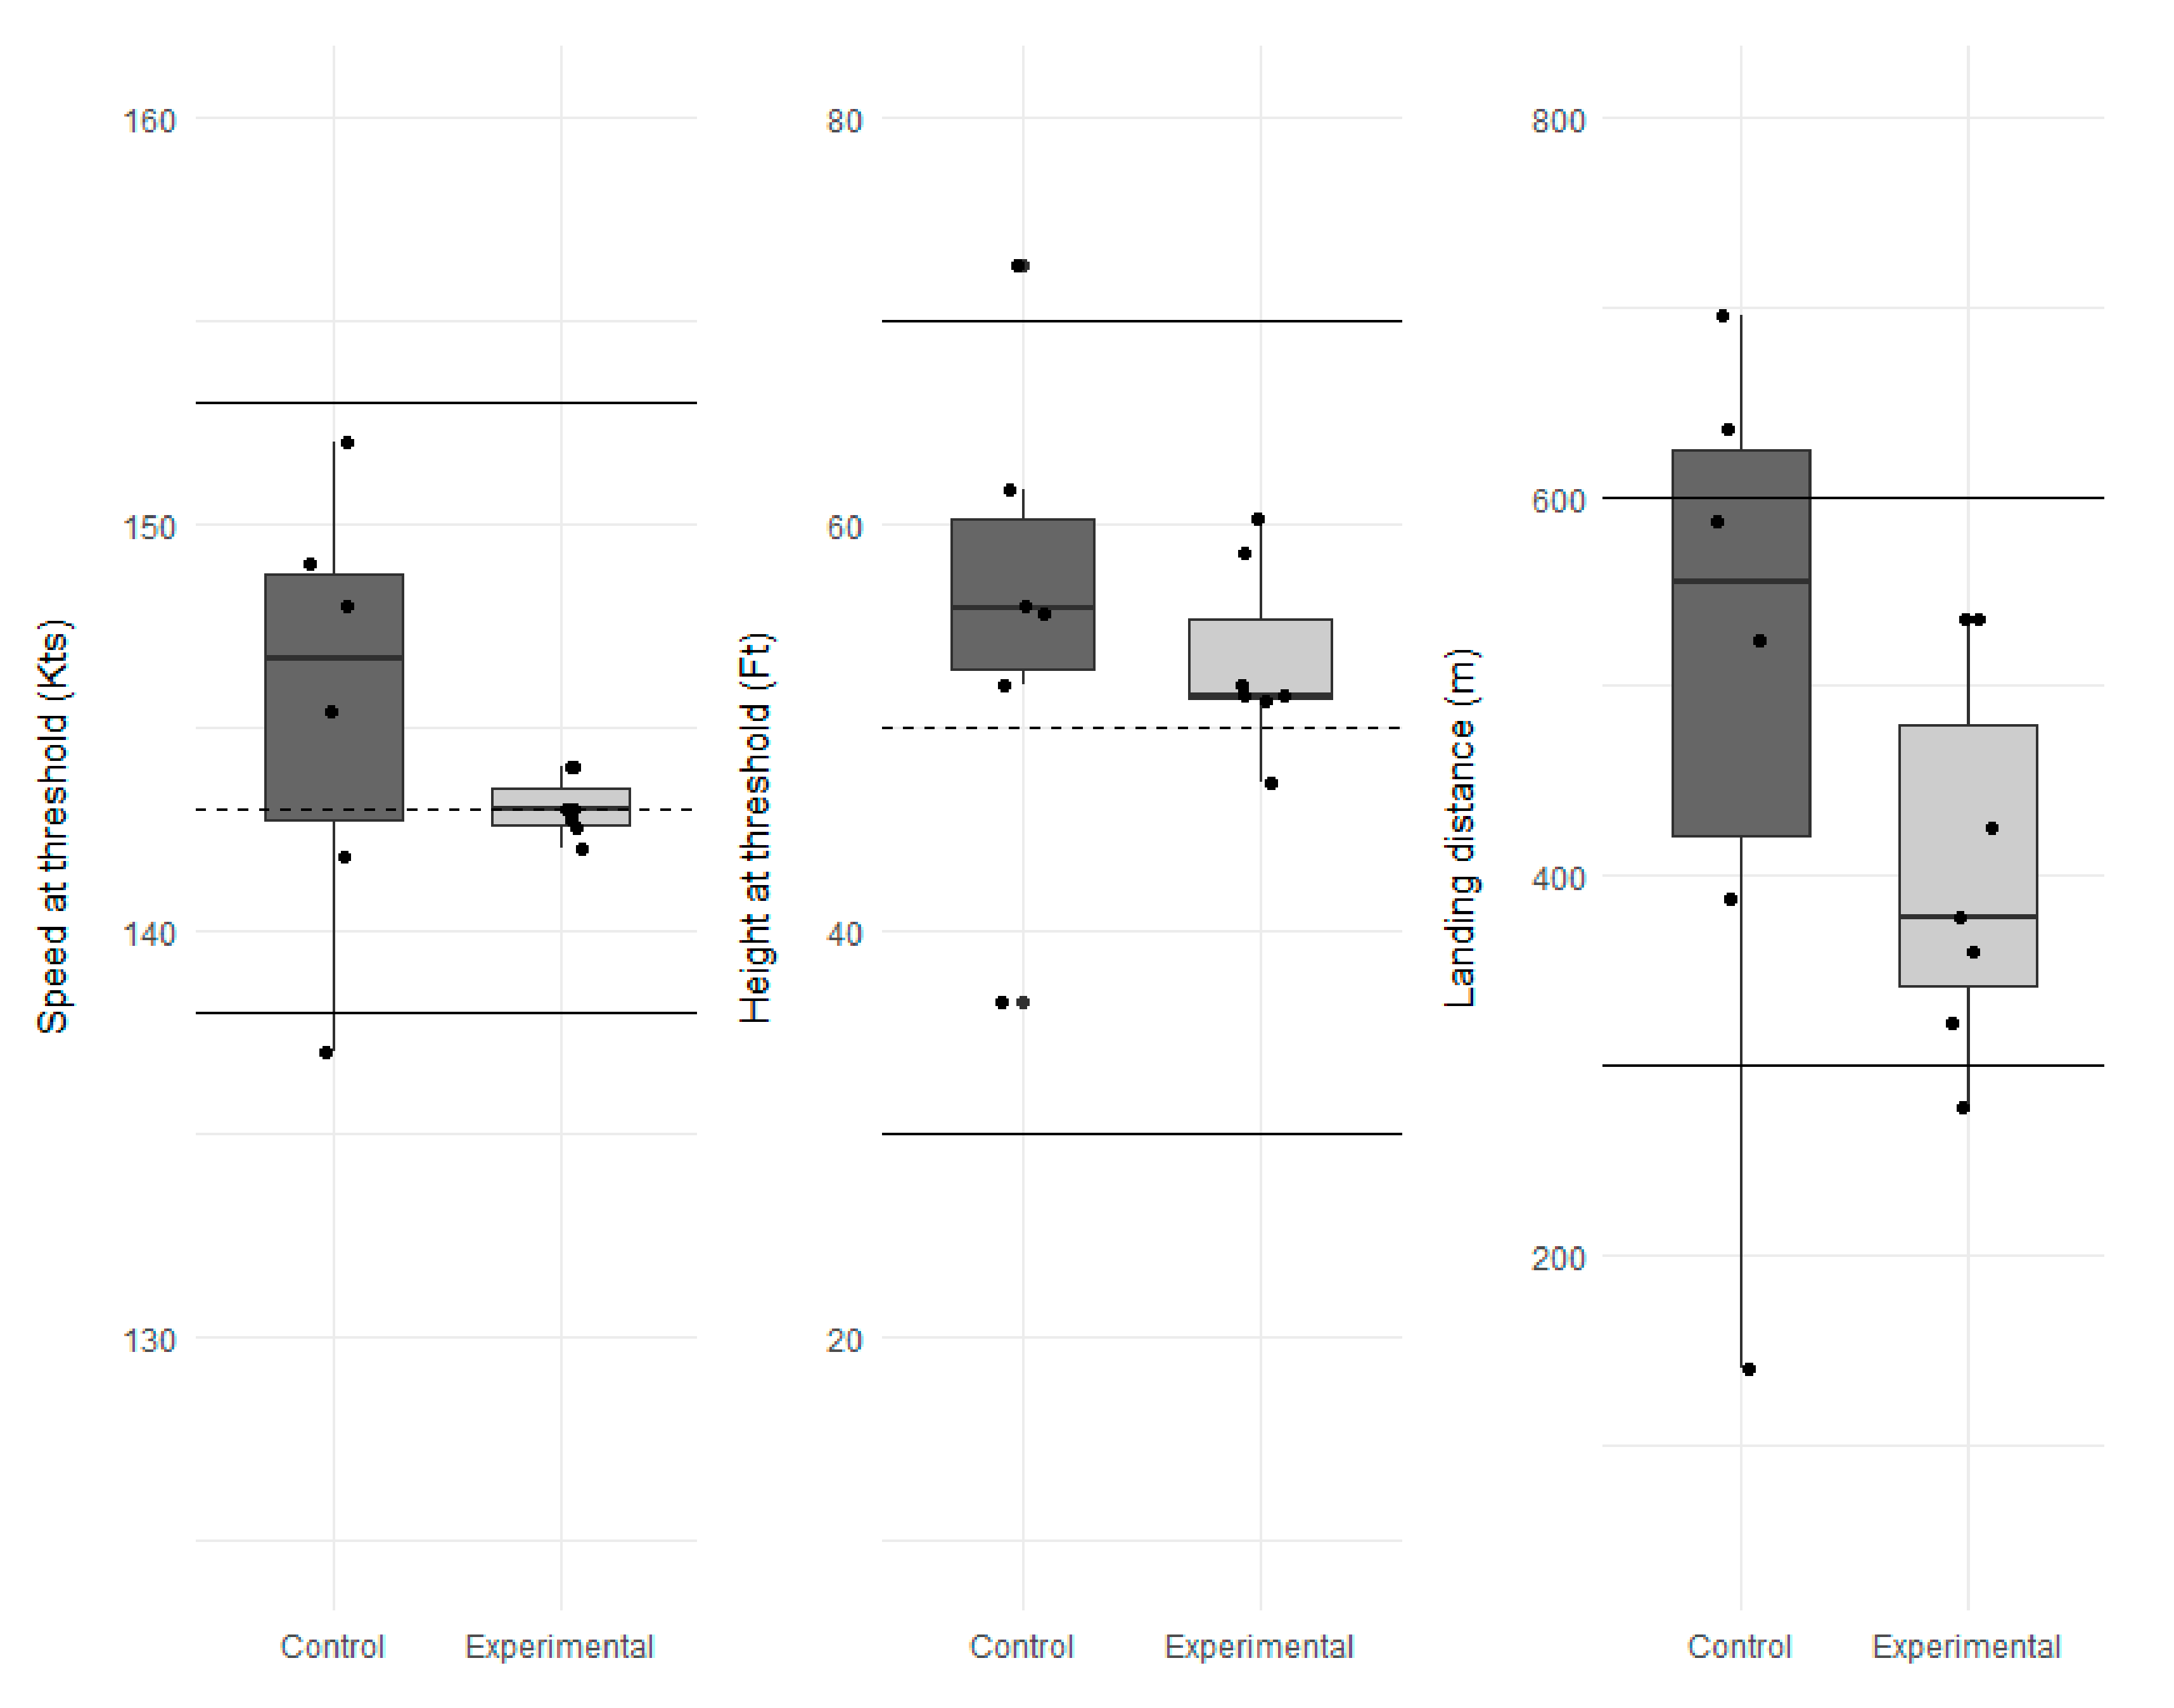
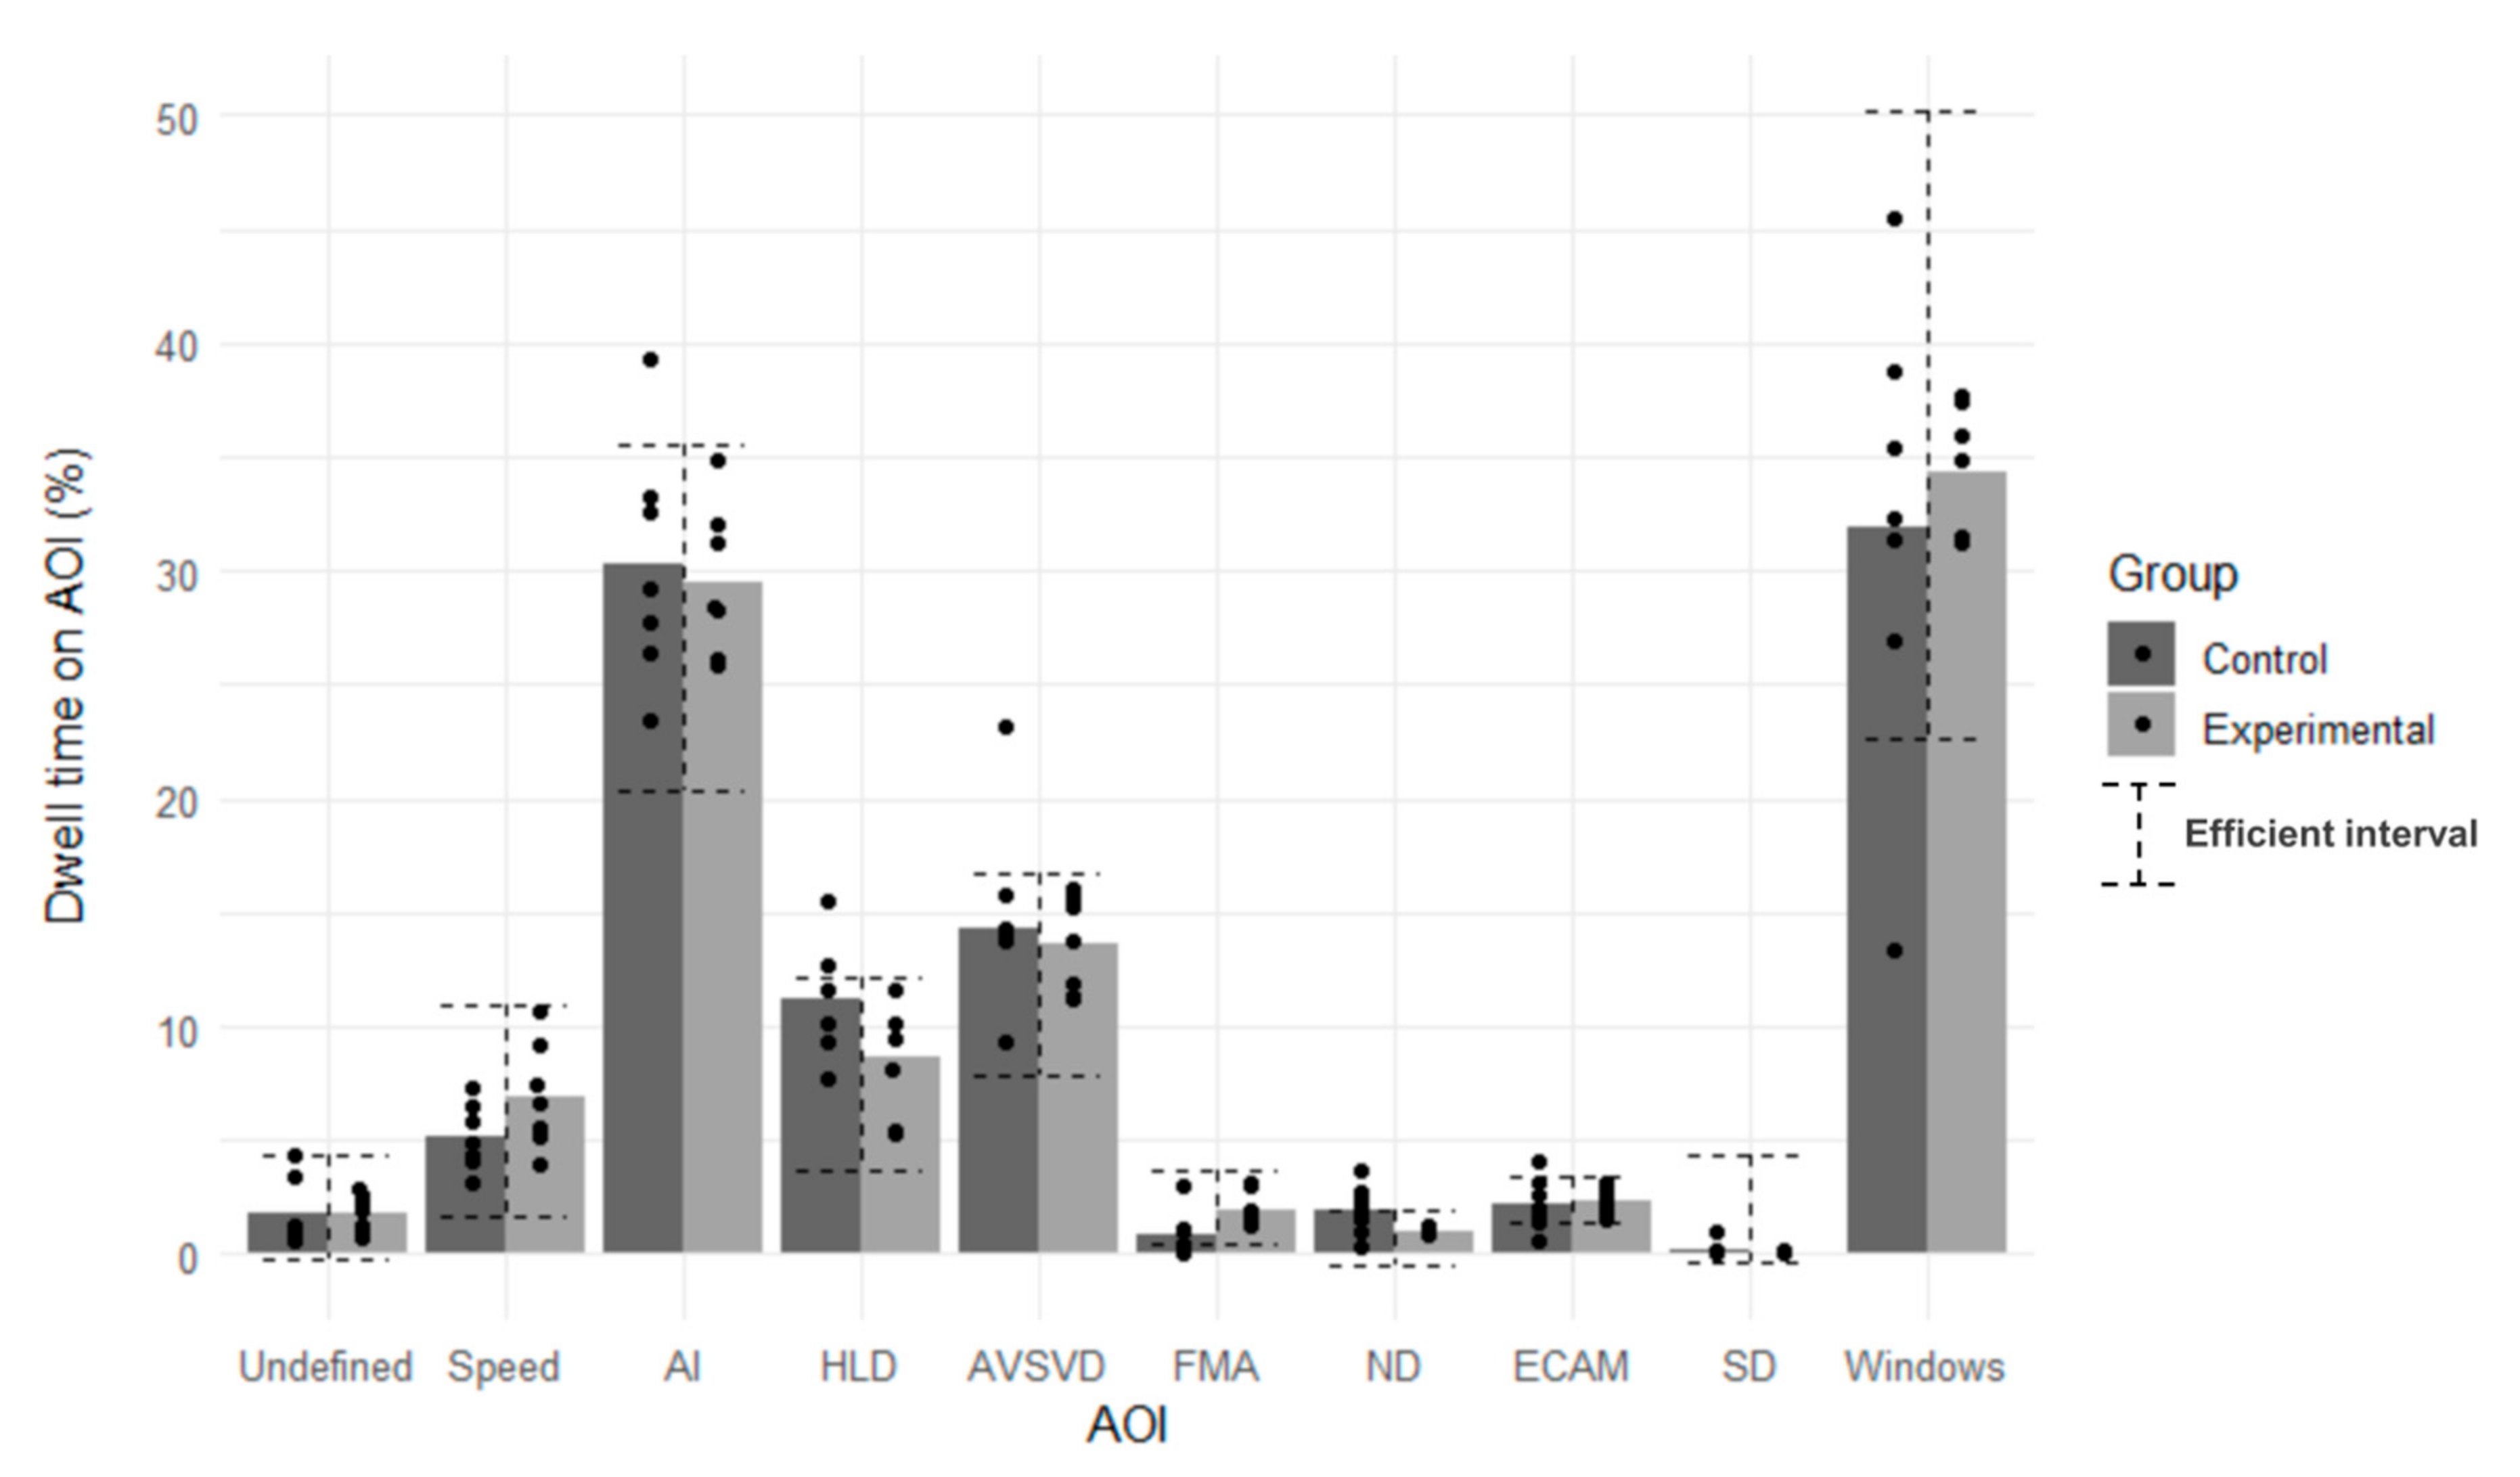
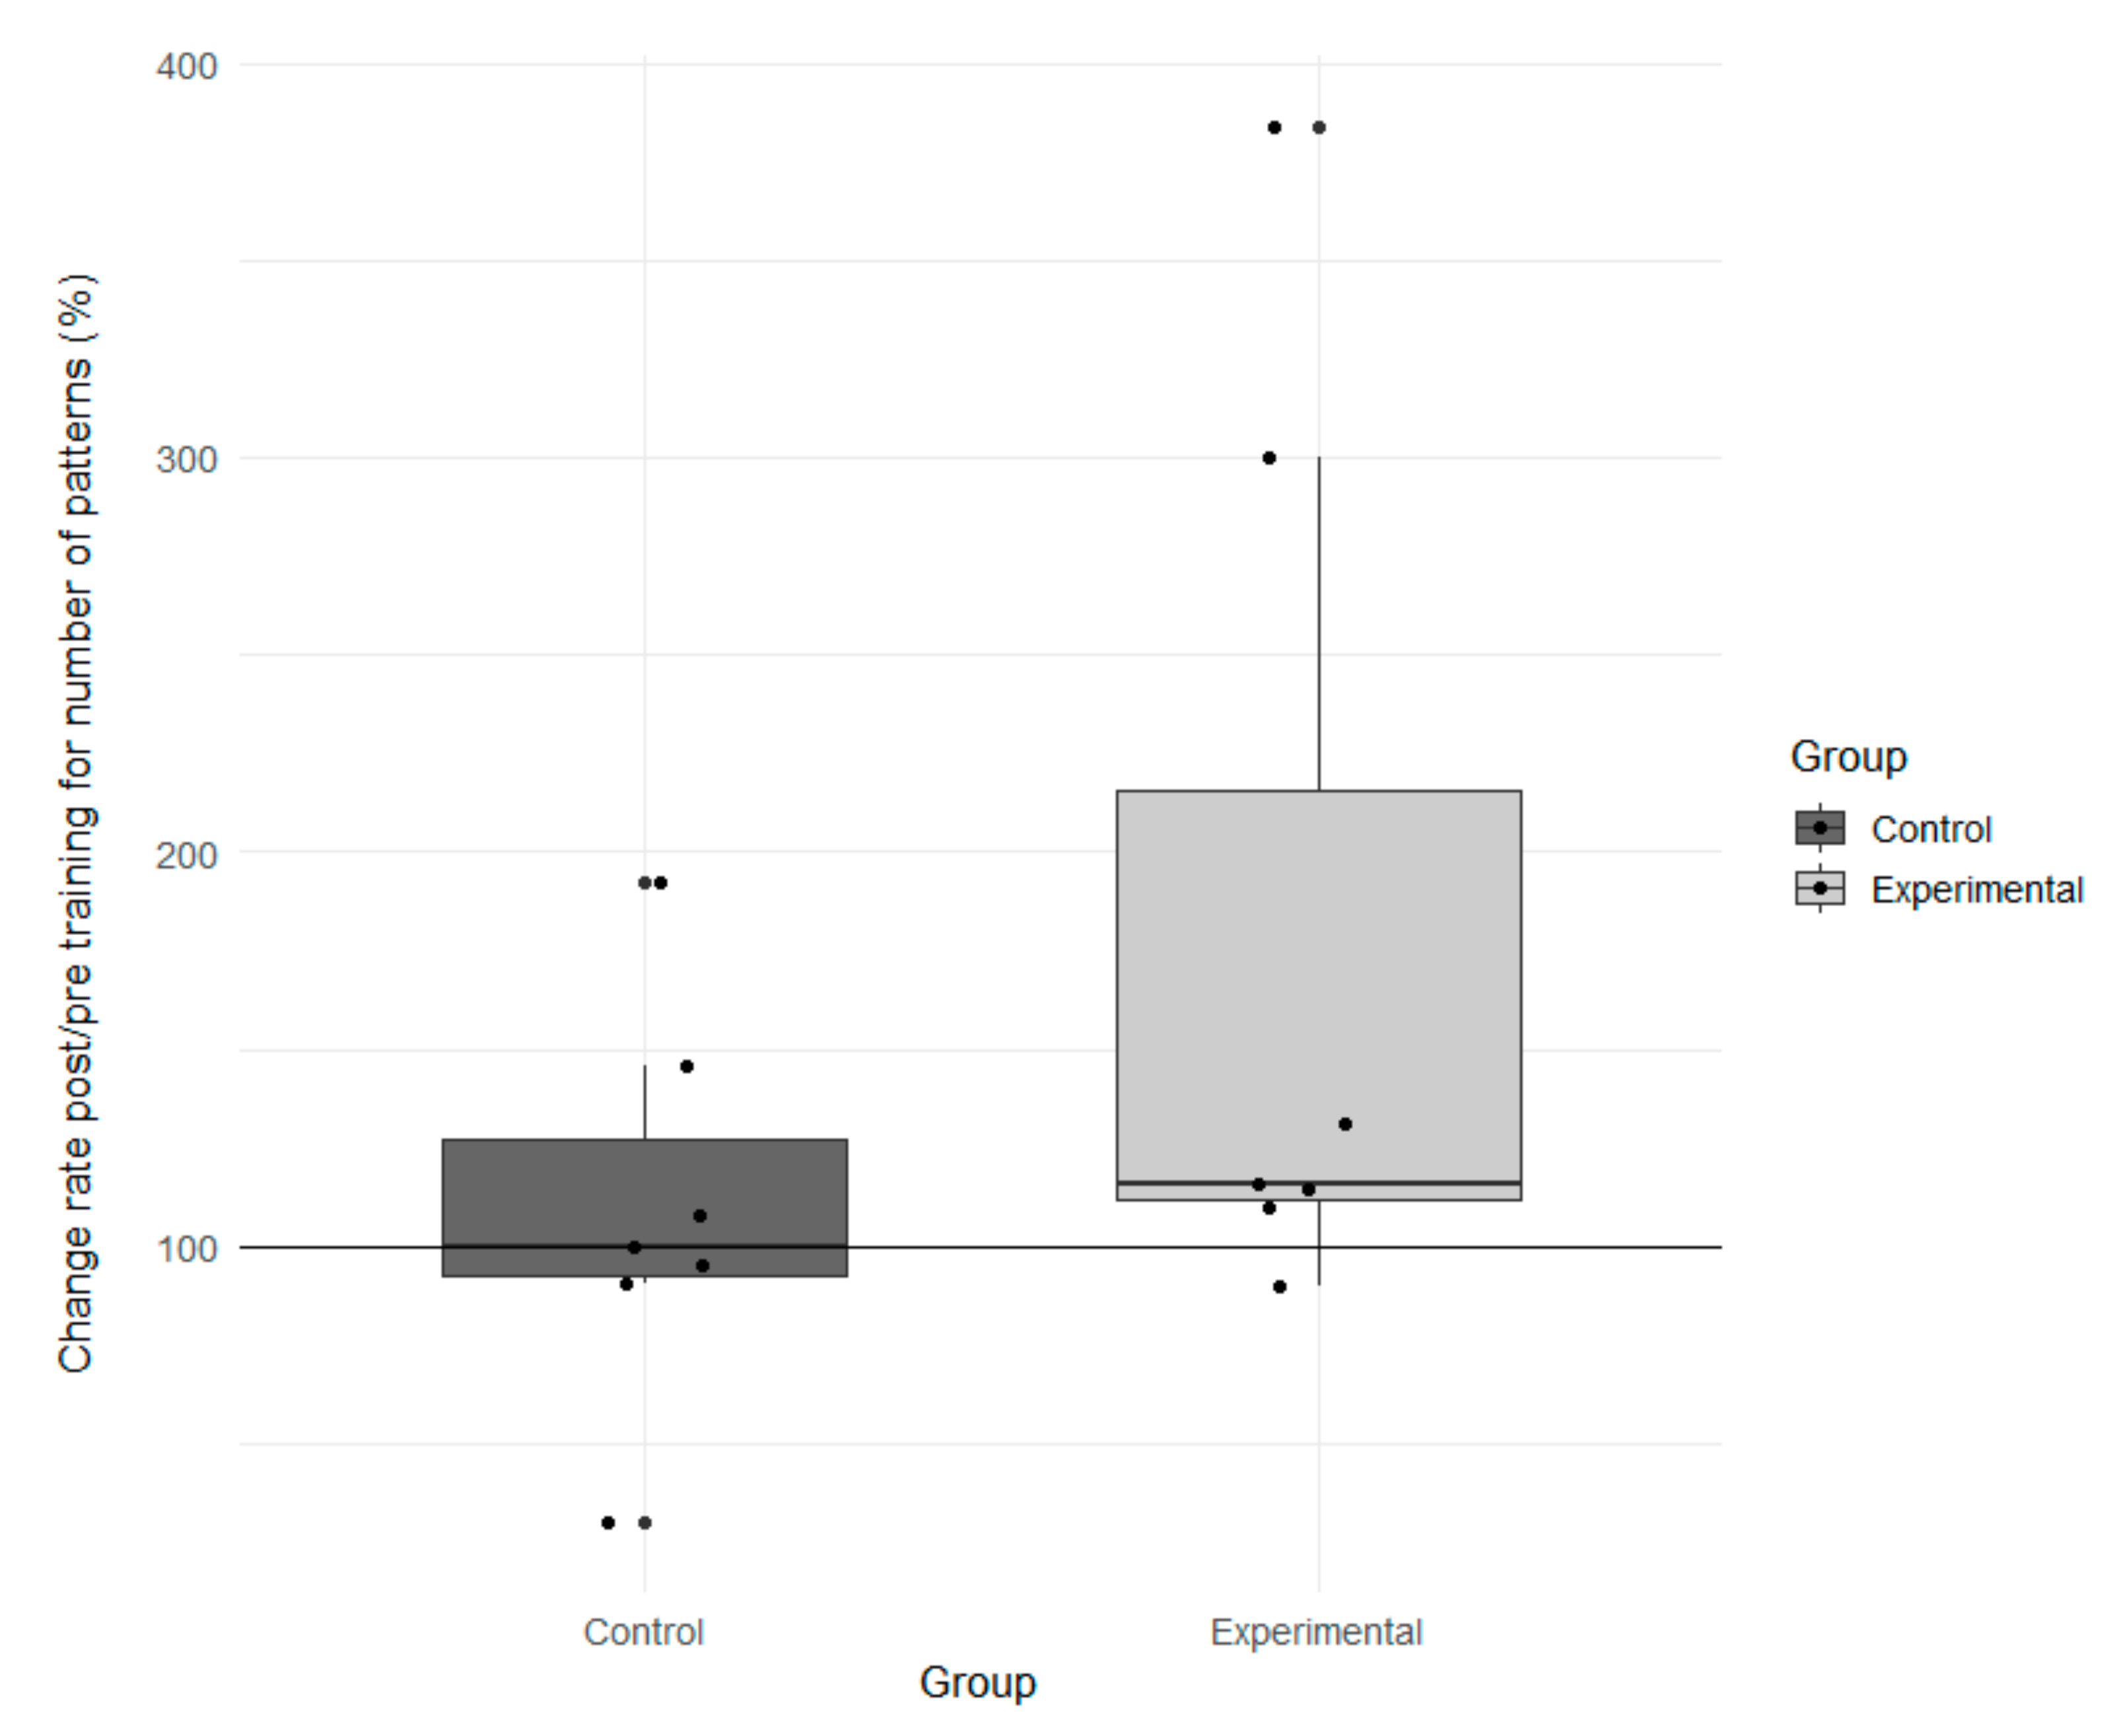
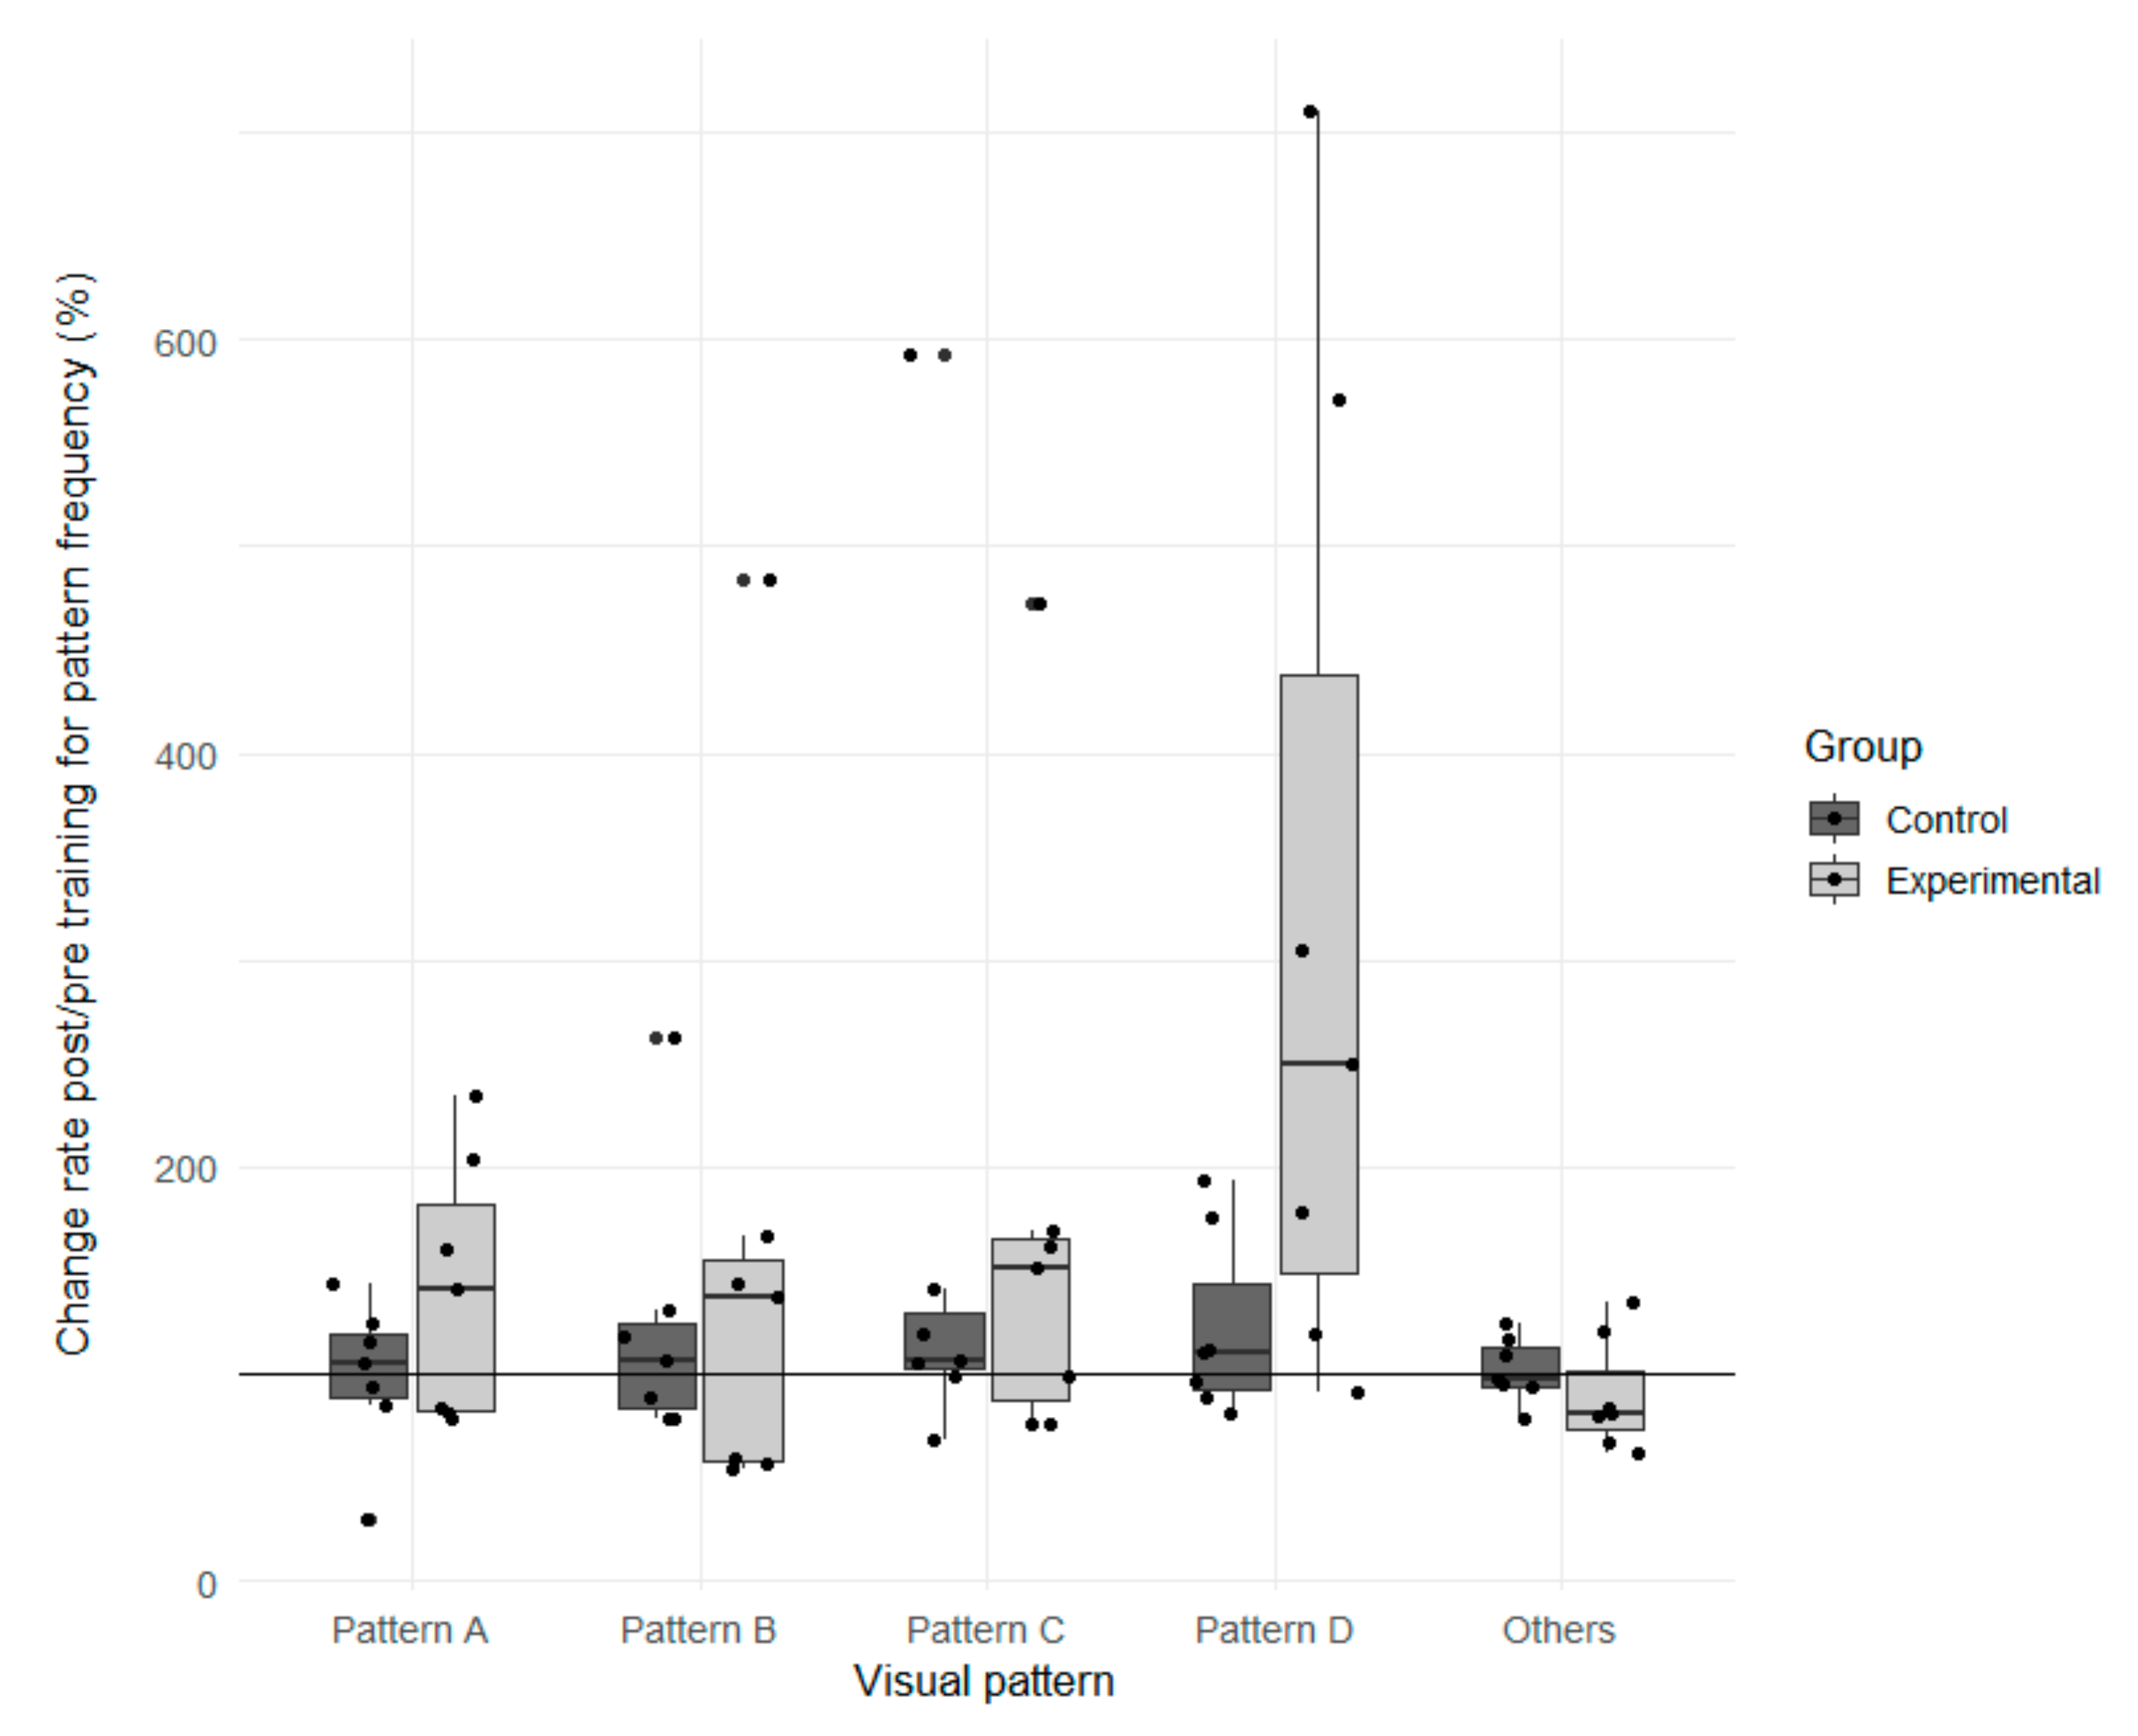
Table 1.
Mean (SD) proportion of the four efficient visual scanning patterns according to the three pilot’s performance profiles. See Table S3 in Supplementary Material for individual percentages.
Table 1.
Mean (SD) proportion of the four efficient visual scanning patterns according to the three pilot’s performance profiles. See Table S3 in Supplementary Material for individual percentages.
| Visual Scanning Patterns | Pilots’ Performance Profiles | ||
|---|---|---|---|
| Unstabilized Pilots | Standard Pilots | Most Accurate Pilots | |
| Speed pattern (A) | 4.9% (3.0%) | 8.2% (2.6%) | 13.2% (3.1%) |
| Vertical deviation pattern (B) | 7.3% (5.3%) | 8.6% (2.9%) | 12.8% (2.3%) |
| Lateral deviation pattern (C) | 4.7% (3.6%) | 10.5% (3.0%) | 13.4% (3.5%) |
| General attitude pattern (D) | 3.0% (2.0%) | 7.1% (2.5%) | 13.7% (2.5%) |
| Other patterns | 80.1% (5.9%) | 66.2% (6.8%) | 45.3% (6.3%) |
Publisher’s Note: MDPI stays neutral with regard to jurisdictional claims in published maps and institutional affiliations. |
© 2021 by the authors. Licensee MDPI, Basel, Switzerland. This article is an open access article distributed under the terms and conditions of the Creative Commons Attribution (CC BY) license (https://creativecommons.org/licenses/by/4.0/).
Share and Cite
MDPI and ACS Style
Lefrançois, O.; Matton, N.; Causse, M. Improving Airline Pilots’ Visual Scanning and Manual Flight Performance through Training on Skilled Eye Gaze Strategies. Safety 2021, 7, 70. https://0-doi-org.brum.beds.ac.uk/10.3390/safety7040070
AMA Style
Lefrançois O, Matton N, Causse M. Improving Airline Pilots’ Visual Scanning and Manual Flight Performance through Training on Skilled Eye Gaze Strategies. Safety. 2021; 7(4):70. https://0-doi-org.brum.beds.ac.uk/10.3390/safety7040070
Chicago/Turabian StyleLefrançois, Olivier, Nadine Matton, and Mickaël Causse. 2021. "Improving Airline Pilots’ Visual Scanning and Manual Flight Performance through Training on Skilled Eye Gaze Strategies" Safety 7, no. 4: 70. https://0-doi-org.brum.beds.ac.uk/10.3390/safety7040070
Note that from the first issue of 2016, this journal uses article numbers instead of page numbers. See further details here.