
Older Driver Safety: A Renewed Perspective in a Survey Study in Illinois, U.S.

1
Oates Associates Inc., Collinsville, IL 62234, USA
2
Department of Civil Engineering, Southern Illinois University Edwardsville, Edwardsville, IL 62025, USA
*
Author to whom correspondence should be addressed.
Safety 2021, 7(4), 83; https://0-doi-org.brum.beds.ac.uk/10.3390/safety7040083
Submission received: 11 May 2021
/
Revised: 11 December 2021
/
Accepted: 13 December 2021
/
Published: 16 December 2021
Abstract
:Older adults (aged 65 or older) are at higher risk of involvement in motor vehicle crashes. Many studies have been conducted on older road users’ safety, but how older people’s driving behavior and demographic characteristics, and warnings of side effects of prescription medication, are associated with their crash risk has not been fully investigated. Aimed to address this knowledge gap, a mail survey of older drivers in Illinois, U.S. was conducted. Information on respondents’ driving behaviors, demographic characteristics, physical conditions, medication use, crash experience, etc. was gathered. Response distributions, odds ratios, and logistic regression models were employed to analyze the survey data. The results showed that most respondents kept a high level of mobility despite driving difficulty and medication use. Older drivers’ crash risk is mainly affected by external factors (driving exposure, alcohol consumption, and medication use) rather than their demographic characteristics and driving difficulty. Warnings from physicians on the side effects of prescription drugs had no significant effects on older drivers’ crash risk. Given the importance of mobility to older adults, the focus needs to be placed on providing a safe roadway system and safe driving advice for older drivers, particularly those who are on medication.
1. Introduction
Compared to younger groups, the older population aged 65 or above are at higher risk of involvement in motor vehicle crashes due to the deterioration in their physical and health conditions [1,2]. In 2018, the U.S. had 16% (52.4 million) older population aged 65 and older, while the older population accounted for 19% (6907) of total fatalities in motor vehicle crashes, and almost 276,000 were treated for motor vehicle injuries [3]. As the older population in the U.S. keeps increasing, with an expected number of 73.1 million (21%) by 2030 [4], safety and mobility issues of the older population will become more important. Therefore, how to mitigate older people’s motor vehicle crashes while keeping their mobility and independence has gained more attention among transportation agencies, researchers, and practitioners.
Many studies have been conducted on the safety of older road users, but they mainly focused on the correlation/association of aging-related physical and medical conditions with older people motor vehicle crashes or driving performance. Past studies can generally be grouped into crash data analyses, experimental studies, and survey studies. Previous crash data analysis research reported that the likeliness of older drivers (70 years or older) being killed in a crash is over three times the likeliness of middle-aged (35–54 years) drivers [5]. Fatalities of the older population are not only dependent on the crash intensity but also on their susceptibility to chest injuries, reaction to medications, etc. [6]. Drivers with a medical condition, such as heart disease and arthritis, have a higher chance of being involved in crashes [7]. Inadequate surveillance and misjudgment of the gap between vehicles have been identified as the most critical errors made by older drivers (70 years and older) involved in crashes with reference to middle-aged drivers (35–54 years) [8]. Influencing factors on older adult fatal crashes include time of day, lighting and weather condition, speed limit, driver’s characteristics (condition and gender), driving maneuvers (prior movement and lane departure), visibility of traffic control, roadway characteristics (e.g., surrounding land use, type and classification, and geometry complexity), distracted driving, and speeding [9,10,11,12,13]. Linking the national crash data with medication usage data over 1998–2000, it has been found that over 60% of older drivers involved in crashes used at least one medication causing driving impairments [14], and taking impairing medications increases the crash risk by 1.43 times while compared with not taking medications [15,16,17]. Using the U.S. National Highway Traffic Safety Administration Drug and Alcohol Crash Risk Study data, a recent study found that cannabis was associated with increased crash risk among older drivers [18].
Experiment studies were usually used to test the impacts of medications and physical impairments on older people’s driving performance. Past studies indicate a distinct age-related decline in cognitive and driving performance, and older people showed inconsistent driving simulator performance in terms of speed adaptation and lane-keeping behaviors [19]. Benzodiazepine usage was found to significantly impact driving abilities, whereas antidepressants and hypoglycemic medication usage have non-significant impacts on driving [17]. Prior research also suggests that visual impairment and waning motor skills are associated with self-regulation of older adults, such as a reduction in the number of days driven in a week or avoiding driving [20,21,22,23,24,25]. However, self-regulation varies individually and is not enough to ensure safe driving as some impaired drivers may believe that they are capable of driving and would drive even when not fit [22]. A recent naturalistic study found very weak correlations between older people’s decreasing function (poorer TMT (Trail-Making Test) and Rapid Pace Walk Times) and their lower exposure to traffic (milage/number of days driven)/worse behind-the-wheel performance (higher error scores) [26].
Several studies have employed survey questionnaires to gather self-reported data of older people that are not included in crash records. Research has found that chronic back issues and usage of nonsteroidal anti-inflammatory drugs lead to an increase in crash risk [27]. Kidney or stroke-related medical problems and medication resulted in difficulties in driving, while physical impairments lead to a decrease in the frequency of driving among the older population [28]. Low attentional, cognitive, and motor skills and the presence of multiple medical conditions were significant predictors of crash involvement [29]. Additionally, older people tend to avoid unfavorable driving conditions such as night driving, bad weather (e.g., rain, snow, and hail), high-speed roads, rush hour, etc. [22]. A survey study conducted in New Zealand reported that policies that target all older drivers and lead to licensing and mobility restrictions cannot be justified from a safety basis [30].
Older people safety has been researched for over two decades and has received more attention recently as the older population keeps increasing. Many previous studies have attributed older people crashes to aging, physical deterioration, medication usage, visual impairment, cognitive inefficiency, and unfavorable roadway and traffic control conditions. However, how older people driving habits, travel patterns, and demographic characteristics are associated with their crashes or crash risks has not been fully evaluated. Additionally, whether warnings from physicians on side effects of prescription drugs reduce older adults’ crash risk needs to be studied. Further, older people’s driving behaviors, patterns, and exposure evolve over time. There is a need to acquire the recent information to reveal any new patterns in the traveling and driving of older people as well as their mobility needs. In addition, it is important to know how older drivers of these days perceive roadway safety issues and their suggestions on how to improve driving safety. This will provide useful information for appropriate engineering solutions on infrastructure design and operations to improve older driver safety. Additionally, no safety studies targeting older drivers in Illinois, U.S. have been conducted.
Aimed to address the above knowledge gap, a survey study was conducted to gather older drivers’ demography, driving exposure, physical conditions, and medication usage data in Illinois, U.S., and the gathered data were analyzed using statistical models. The anonymous survey acquired consensual responses from the participants in an unfiltered way. Additionally, it provided inputs from the older drivers’ perspective on risky driving conditions and countermeasures to improve older people safety.
2. Materials and Methods
This section presents the methods used in developing the survey questionnaire, sampling, circulation, data compilation, and data analyses. A traditional mail-in survey approach was employed considering the participants are older people who may not have access to computers or the internet. Both descriptive analyses of survey response distributions and statistical models were used to analyze the survey data to identify significant influencing factors on older driver safety.
2.1. Questionnaire
To ensure the efficiency of the data collection and the accuracy of the data collected, the questionnaire was prepared to obtain precise answers by avoiding open-ended questions and laying out the most applicable answers in multiple-choice questions. The questionnaire includes five sections as below. Appendix A presents the survey instrument.
- Demographic characteristics (e.g., age, gender, education, and county)
- Driving exposure (e.g., number of days and types of roadways)
- Driving behavior and habit (e.g., driving conditions try to avoid)
- Physical conditions and medications (e.g., physical difficulties and medicine usage), and
- Driving safety (e.g., crash and near-crash experience).
2.2. Sampling
With the help from the IL Secretary of State office, licensed drivers’ registration information was used to identify older drivers for the survey. Note that some licensed older drivers may already cease driving or seldom drive by themselves. The survey did not discriminate older drivers who actively drive and who do not because this study also gathered information on older drivers’ opinions on risky driving conditions and how to improve older people safety. Those who do not actively drive could enter their true driving exposure. This information would help identify the proportion of older drivers who do not actively drive and examine the association between their inactive driving behavior with physical conditions and medical use.
To ensure a high degree of representativeness and eliminate possible bias from simple random sampling that ignores the unbalanced population among different counties, a proportional sampling method was applied in the study. In this sampling method, a finite population is categorized into various subgroups and a random sampling procedure is applied to obtain a sample from each subgroup proportional to its size. First, it was determined that survey questionnaires will be mailed to 1200 older drivers (a sample size of 1200) for this study, then the complete list of licensed older drivers (the population) was obtained from the Secretary of State office, and the population was further divided into three age groups (65–74, 75–84, and 85 and older) within each county and categorized as male and female within each age group. Subsequently, the 1200 samples were assigned to each subcategory by age group and gender proportional to their sizes. Last, random sampling techniques were employed to obtain the representative sample from a pool of older drivers in each category based on the sample size assigned to it.
2.3. Circulation
With the help of the Illinois Department of Transportation and the IL Secretary of State office, the mailing addresses of sampled older drivers were obtained. Paper copies of survey questionnaires were sent to the sampled group via mail with a pre-paid return envelope enclosed. The survey lasted for about two months, from September through October 2019. A total of 417 returned responses were received. All responses to the survey were voluntary and anonymous.
All participants were informed the risks, benefits, and alternatives of the survey before they participated in the study. The study was conducted in accordance with the Declaration of Helsinki, and the protocol was approved by the Institutional Review Board of Southern Illinois University Edwardsville (SIUE) (protocol code # 130) on 18 September 2018.
2.4. Data Compiling
The returned paper copies of survey responses were reviewed and labeled by the research team first. All responses were labeled with an ID number from 1 to 417. It turned out that 365 responses of the total 417 were complete. Then, hard copies of survey responses were digitized and coded in an Excel file for the subsequent analyses. The survey questionnaire structure was reflected in the Excel file and all multiple-choice options were included.
Responses were entered into the Excel file following the order of their ID numbers. A binary number was used to code responses to each option of multi-choice questions, where ‘1’ meant the success or presence of a parameter, while ‘0’ meant the failure or absence of a parameter in the study.
2.5. Data Analyses
First, frequency distributions of responses to survey variables were developed to rank the responses. Then, odds ratios were determined to quantify the association between the occurrence of selected survey variables. Last, a logistic regression analysis was conducted to model the impacts of survey variables on older driver crash or near-crash risk. Logistic models handle discrete outcomes well and have been widely used in safety data analysis (e.g., [9,31]). In the study, the outcomes are crash/near-crash and non-crash. The data used in the analysis were gathered from mailed-back survey questionnaires, which were anonymous and for research purposes only. Given that over 400 survey responses were received, model overfitting was not an issue in the study. The focus of the analysis was to identify survey variables that significantly impact older drivers’ crash risk. Incomplete responses and responses where participants were not involved in driving activities were removed from the survey data for the logistic regression analysis.
2.5.1. Odds Ratios
An odds ratio is a statistic that describes the association of an event with the presence or absence of another event. It is defined as the ratio of the odds of event A in the presence of event B and the odds of event A in the absence of event B (Equation (1)). Two events A and B are independent only if the odds ratio equals 1. An odds ratio greater than 1 indicates a positive association between A and B, while less than 1 indicates a negative association [32].
Odds Ratios = (Odds of event A in presence of B)/(Odds of event A in absence of B)
The association of various survey variables with four survey parameters, difficulty in driving, vehicle miles traveled, number of days driven in a week, and crash/near-crash experience, was quantified by calculating their odds ratios. For simplicity, categorical survey variables with more than two levels were collapsed into binary variables. For instance, responses for driving difficulty were merged and categorized into a high or low level of difficulty, where to avoid three or more types of unfavorable driving conditions was considered a high level of difficulty, whereas to avoid two or fewer types of unfavorable driving conditions was labeled as a low level of difficulty. Similarly, annual miles traveled was categorized into low and high annual miles traveled using a cut-off value of 5000 m per year. The number of days driven per week was collapsed into 1–2 days a week and more than 2 days a week.
2.5.2. Logistic Regression
A multiple logistic regression model was applied to analyze the survey data. The model has the format as shown in Equation (2) [31].
where
Logit (Pi) = log(Pi/1 − Pi) = β0 + β1 X1 +⋯+βj Xj +⋯βn Xn + ε
Pi = response probability,
β = model coefficient,
Xi = explanatory variables, and
ε = model error.
In the model, the crash or near-crash occurrence was the dependent variable (crash/near-crash was coded as “1” and no crash/near-crash was coded as “0”), while other survey response variables were the explanatory variables. All explanatory variables are categorical variables. In the model, a dichotomous variable was used to code explanatory variables with two categories, while dummy variables were created to convert explanatory variables with more than two categories into a series of dichotomous variables. The maximum likelihood method was used to estimate multiple logistic model coefficients. A positive model coefficient indicates an increase in the risk of a crash or near-crash event, whereas a negative coefficient means a decrease in the risk. The χ2 test p-value of each coefficient was used to test the significance of the variable associated with that coefficient. The null and alternative hypotheses of χ2 test are below:
H0.
explanatory variable Xi has non-significant effects on older drivers’ crash risk;
Ha.
explanatory variable Xi has significant effects on older drivers’ crash risk.
As previously mentioned, paper copies of the survey questionnaire were mailed to 1200 older drivers sampled using a proportional sampling technique based on the population by gender and age group in each county in Illinois. A total of 417 responses out of 1200 sent out surveys were received. After the data screening, 365 complete responses were used for the odd ratios analysis and fitting the logistic model. However, the 365 responses were not proportional to the population in each subgroup by gender and age as originally designed. The data may have a low degree of representativeness of the population. To ascertain the viability of the data and eliminate possible bias in the analysis results, sample weights were introduced while performing the odd ratio and logistic regression analyses. The weight of each factorial cell by gender and age group was determined as the product of the ratio of the number of received responses over the original sample size and the ratio of the original assigned sample size in that factorial cell over the received responses in that factorial cell, as shown in Equation (3) [33]. The survey response data were adjusted using the calculated weights before performing the statistical analyses. The logistic regression analysis was conducted using the statistical software package SPSS. To incorporate the weights in the analysis, a new variable W_var was added in the input data, and the code of “weight = W_var” was used in SPSS.
Weight = (Number of received responses)/(Original sample size)*(Original assigned sample size in a factorial cell)/(Actual received responses in a factorial cell)
2.5.3. Collinearity Analysis of Explanatory Variables
The survey data contain many data items that may be correlated with each other. If those data are used directly as explanatory variables in the modeling, their correlation may distort the analysis results. Therefore, a collinearity analysis was conducted before the logistic modeling to identify independent explanatory variables to be used in the model.
The statistical software package SPSS was employed to conduct the collinearity analysis. The Variance Inflation Factor (VIF) and tolerance value for each variable were determined. The VIF measures the impact of collinearity among the variables in any kind of regression model, which is close to the reciprocal of the tolerance value. Usually, the VIF value lies between 1–10, and a VIF value less than 3 gives high confidence about the independence of the variable associated with it.
3. Results
This section presents the analysis results of the survey data. It includes the frequency distributions and rankings of survey responses, odds ratios of selected survey variables, independent explanatory variables determined from the collinearity analysis, and the logistic regression analysis results.
3.1. Frequency Distribution
Table 1 presents the frequency distribution of responses to survey questions on demographic features, physical attributes, medication usage, driving exposure, and driving habits. College-educated female drivers (65 to 74) were the most responsive study group among all. It was common for older drivers to experience difficulty in performing regular activities and are under prescription medication due to age-related diseases and physical deterioration. However, most older drivers still maintained high mobility by driving every day. This indicates that the majority of older drivers would like to continue driving as long as they are able to drive safely. In addition, older drivers are conservative drivers, who tend to avoid high-speed and non-familiar roads. Unlike young adult drivers, driving under influences (DUIs) are not common in older drivers. Only 8% of older drivers who participated in the survey reported they drove under influence.
3.2. Ranking
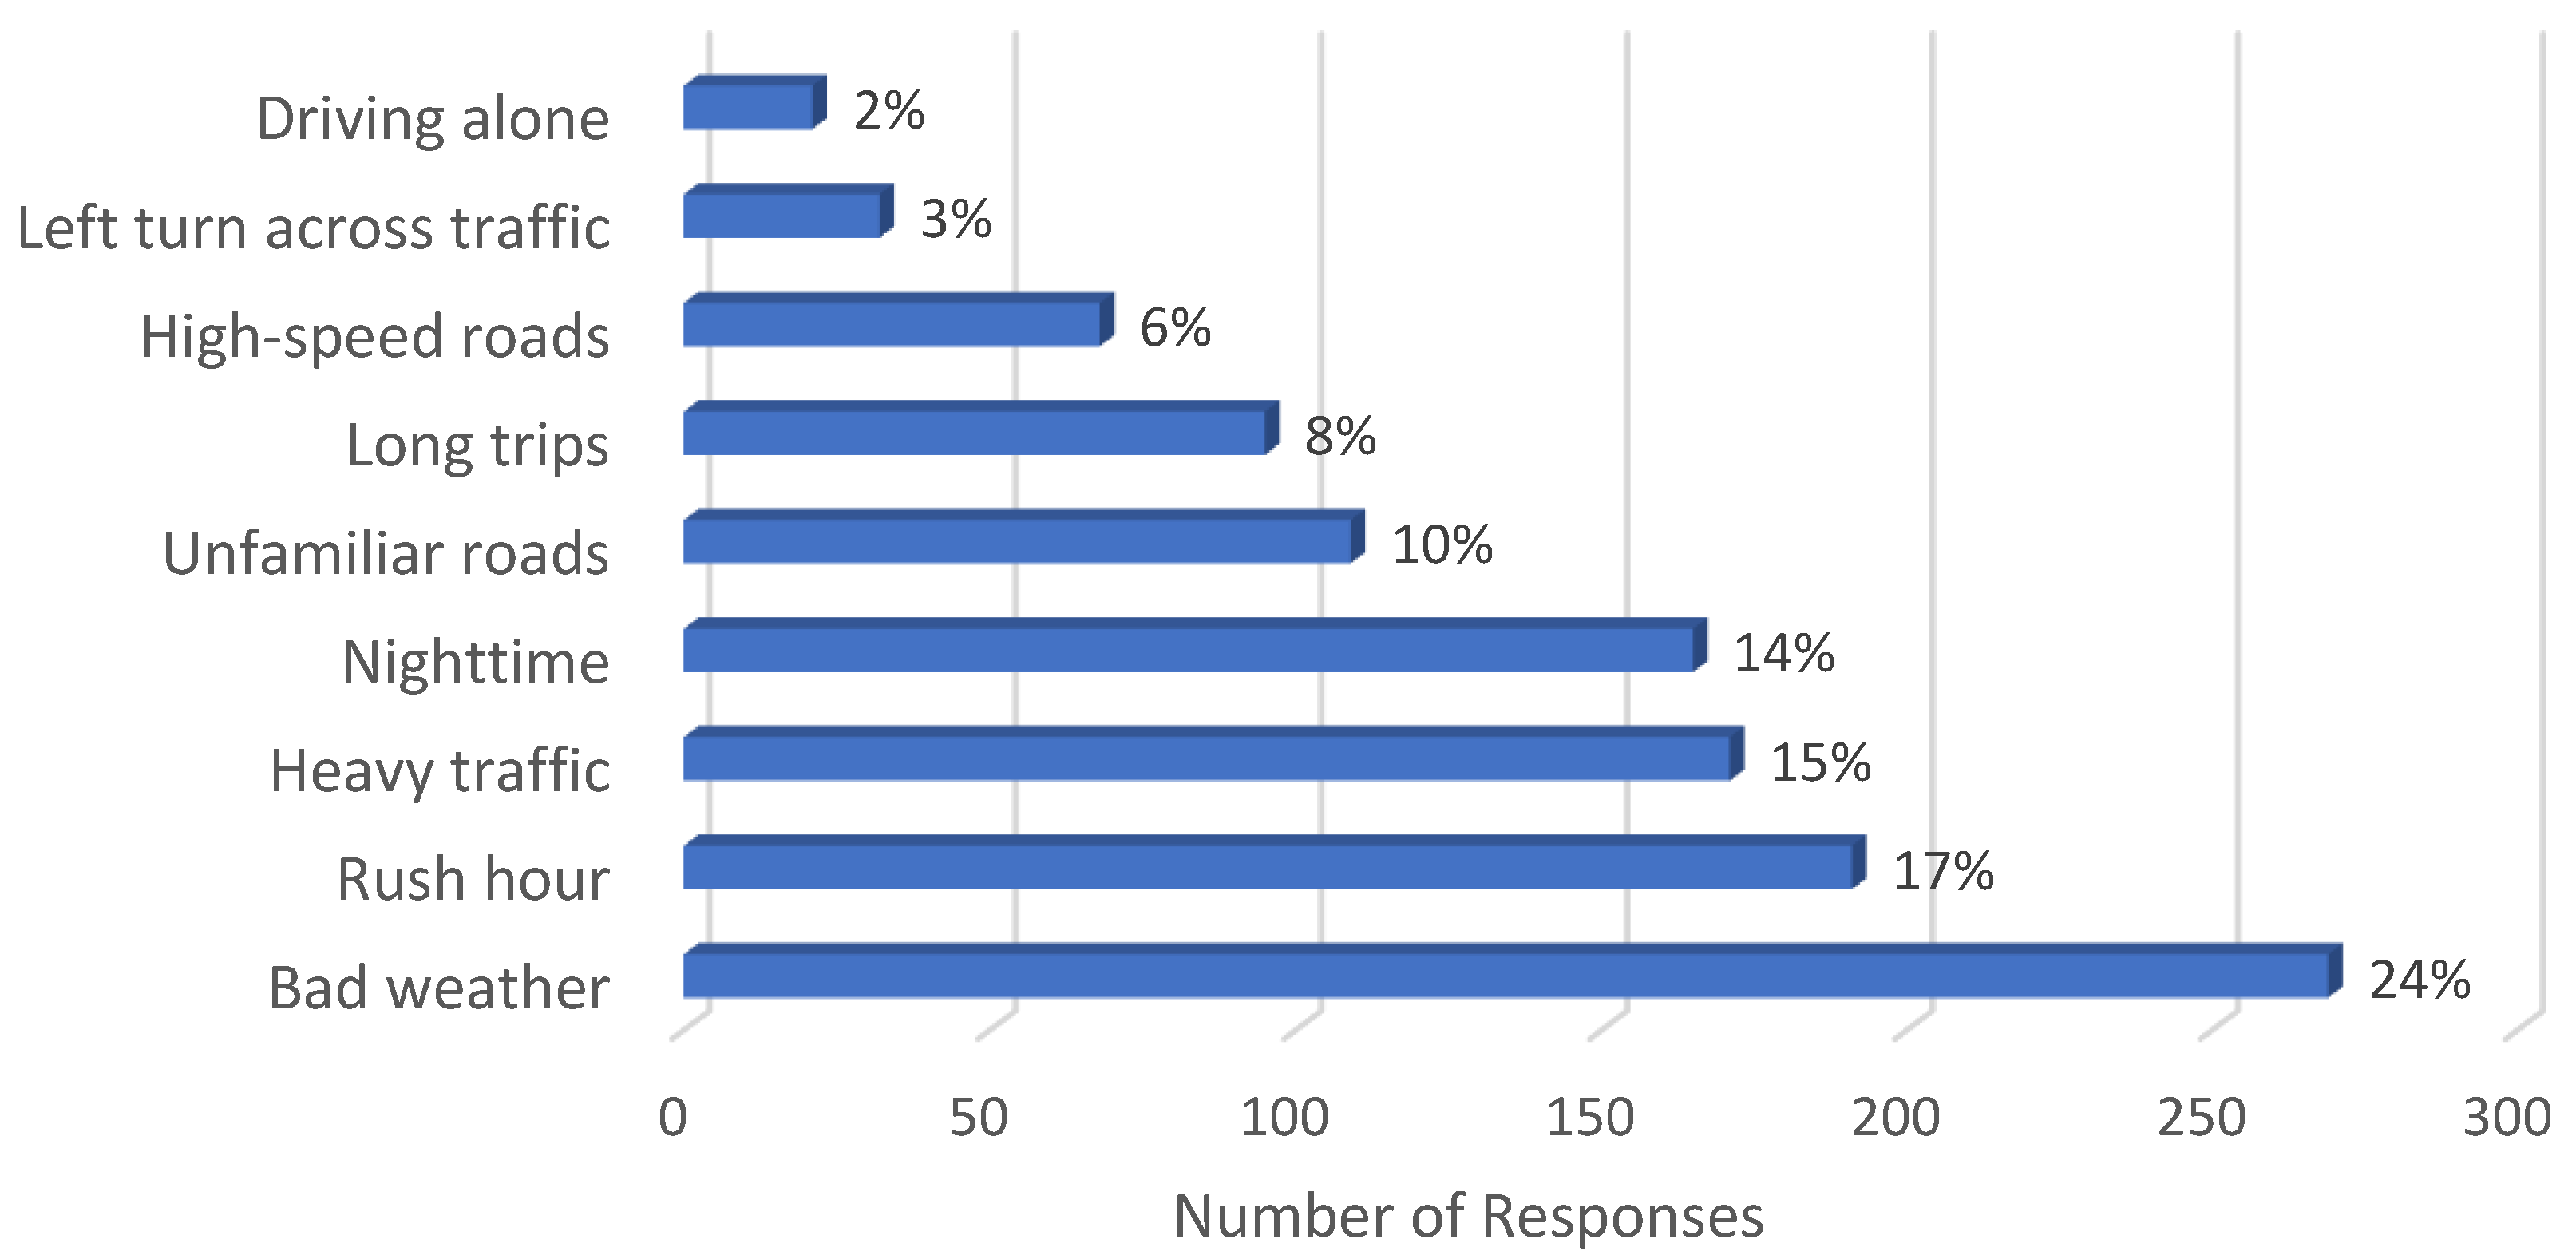
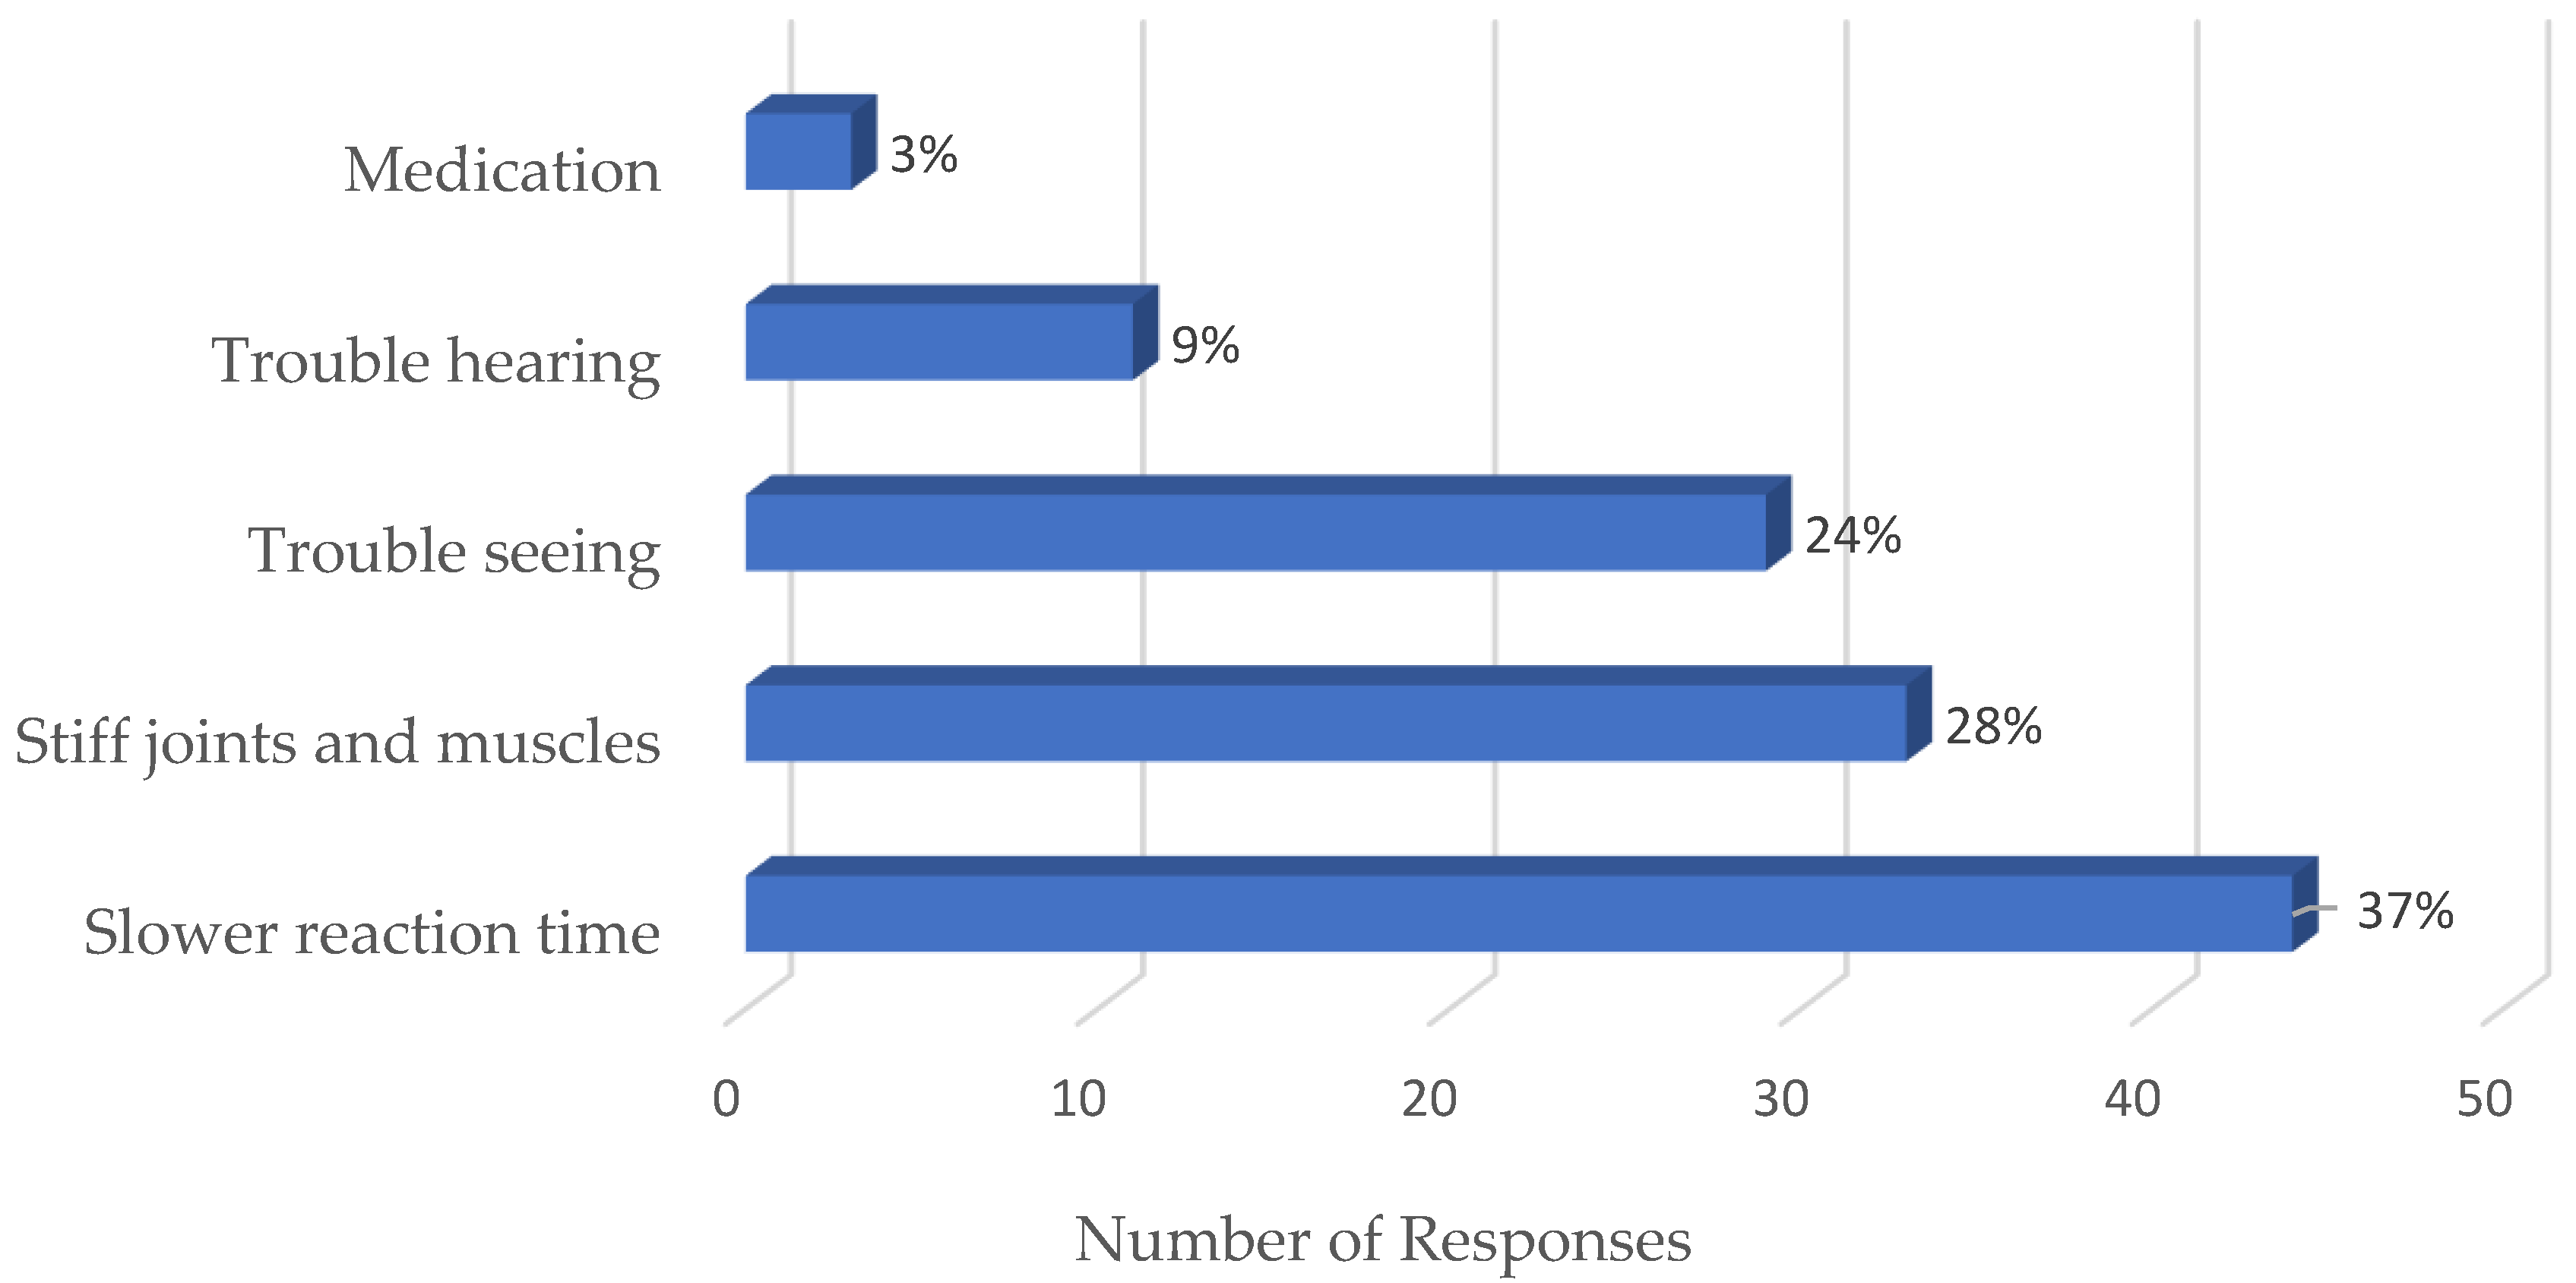
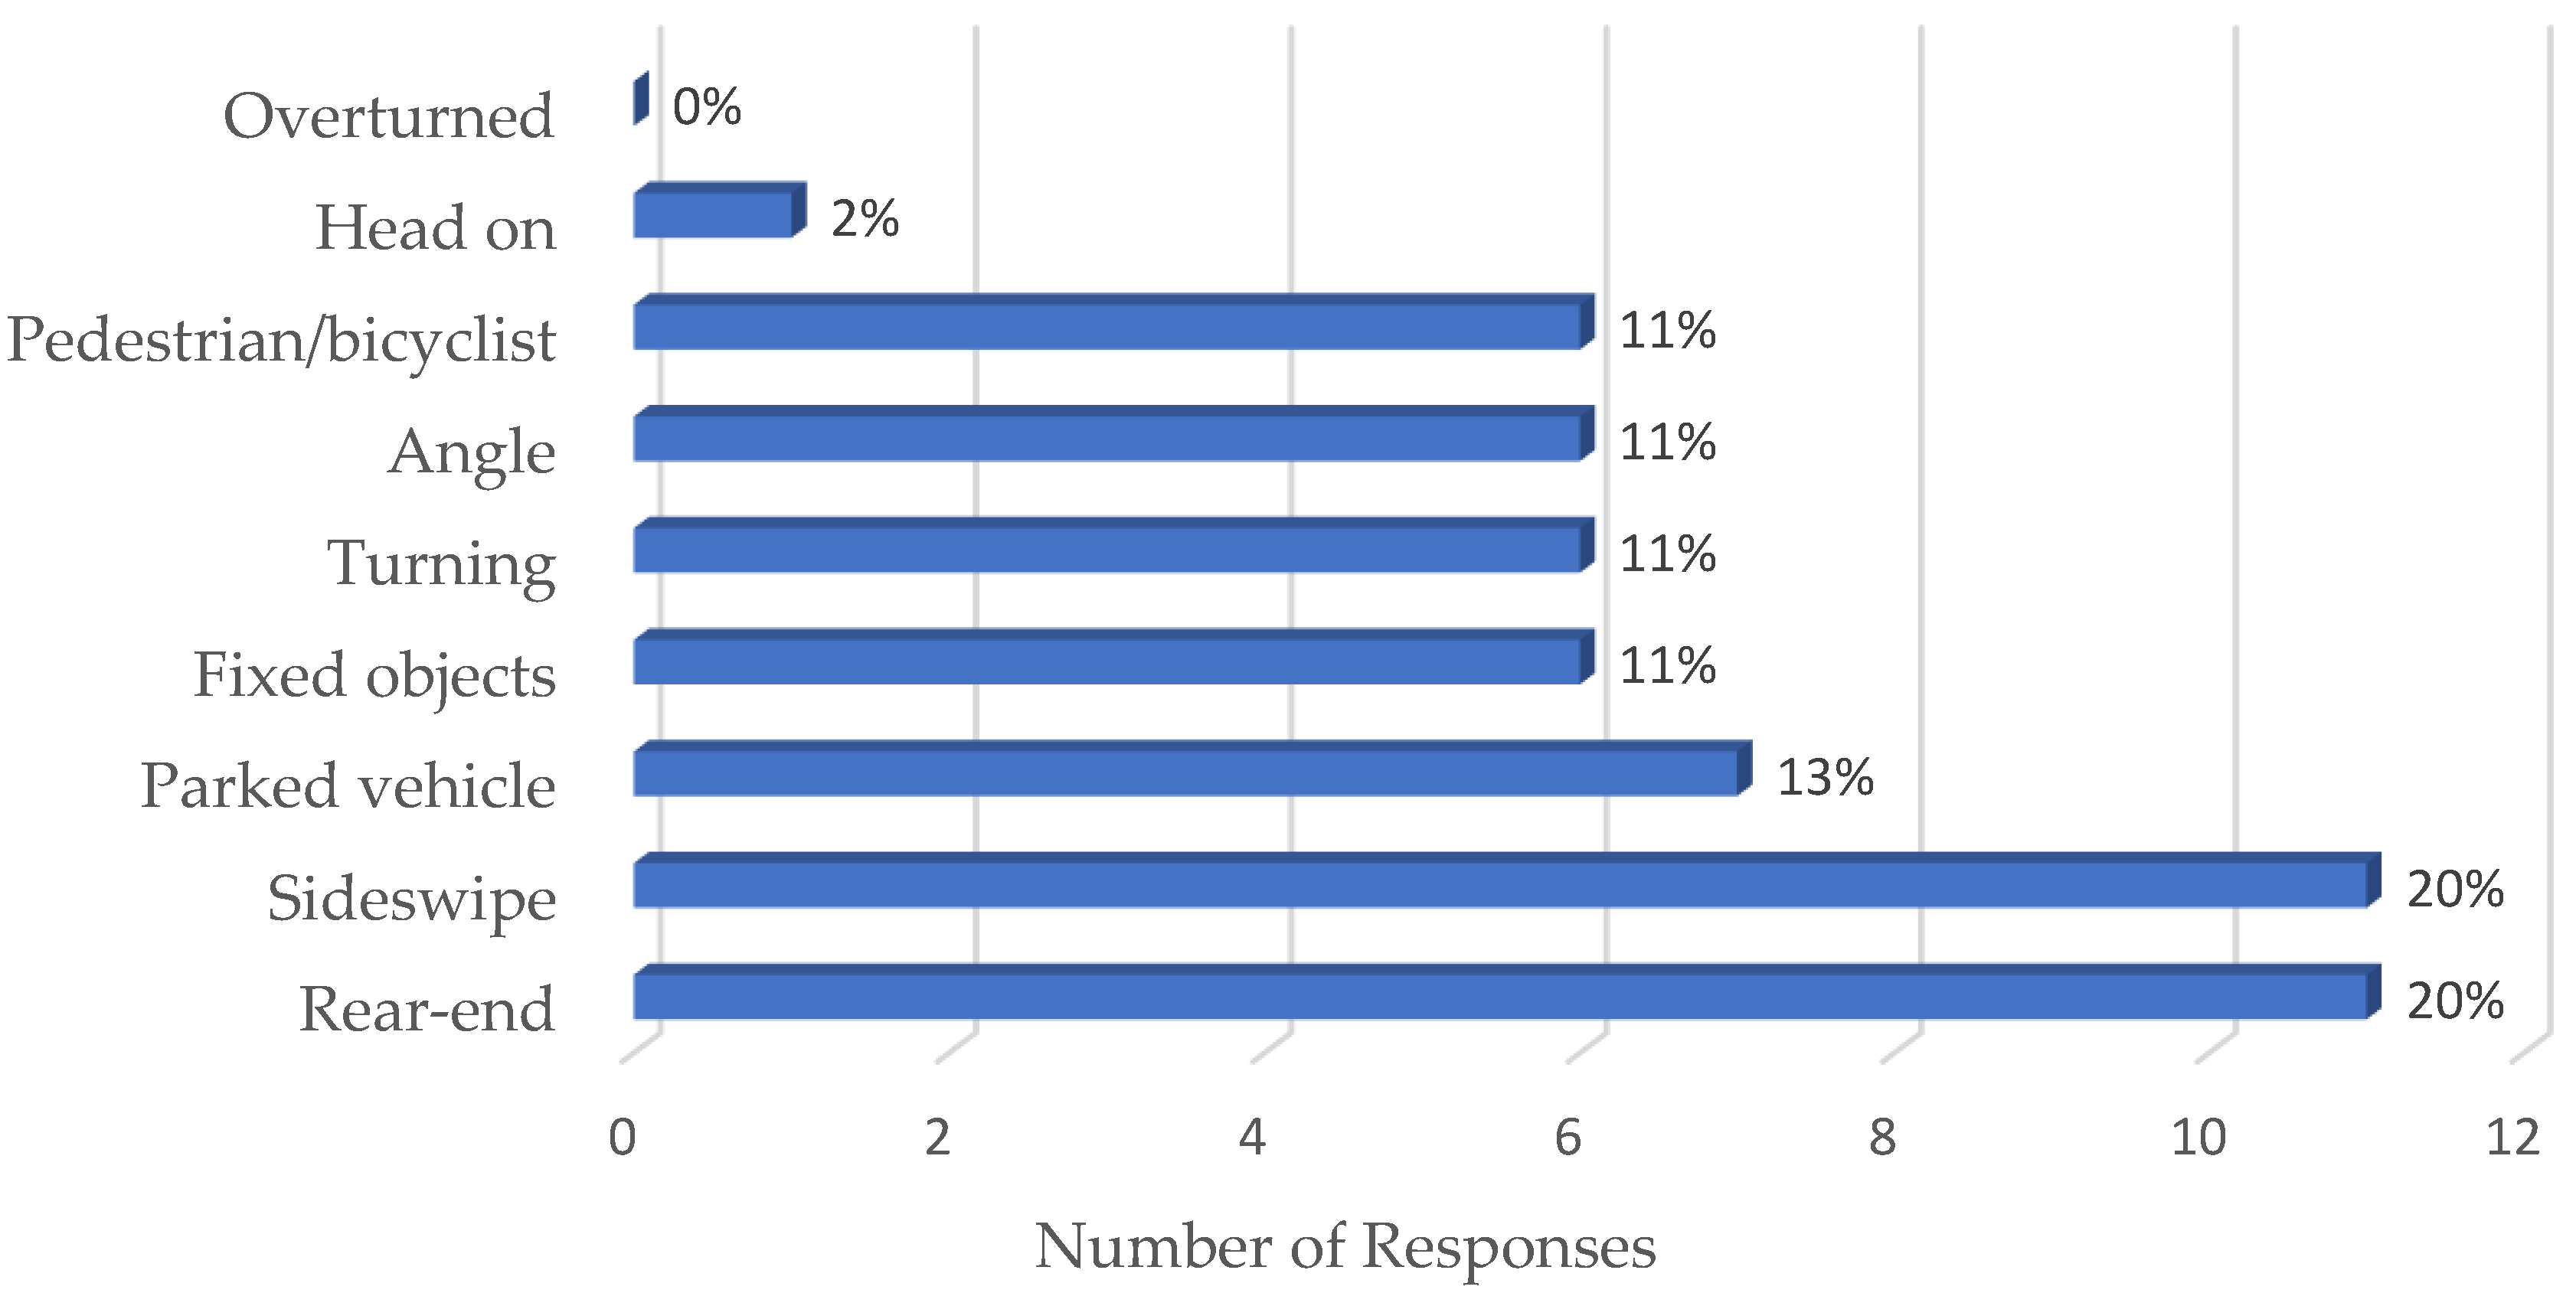
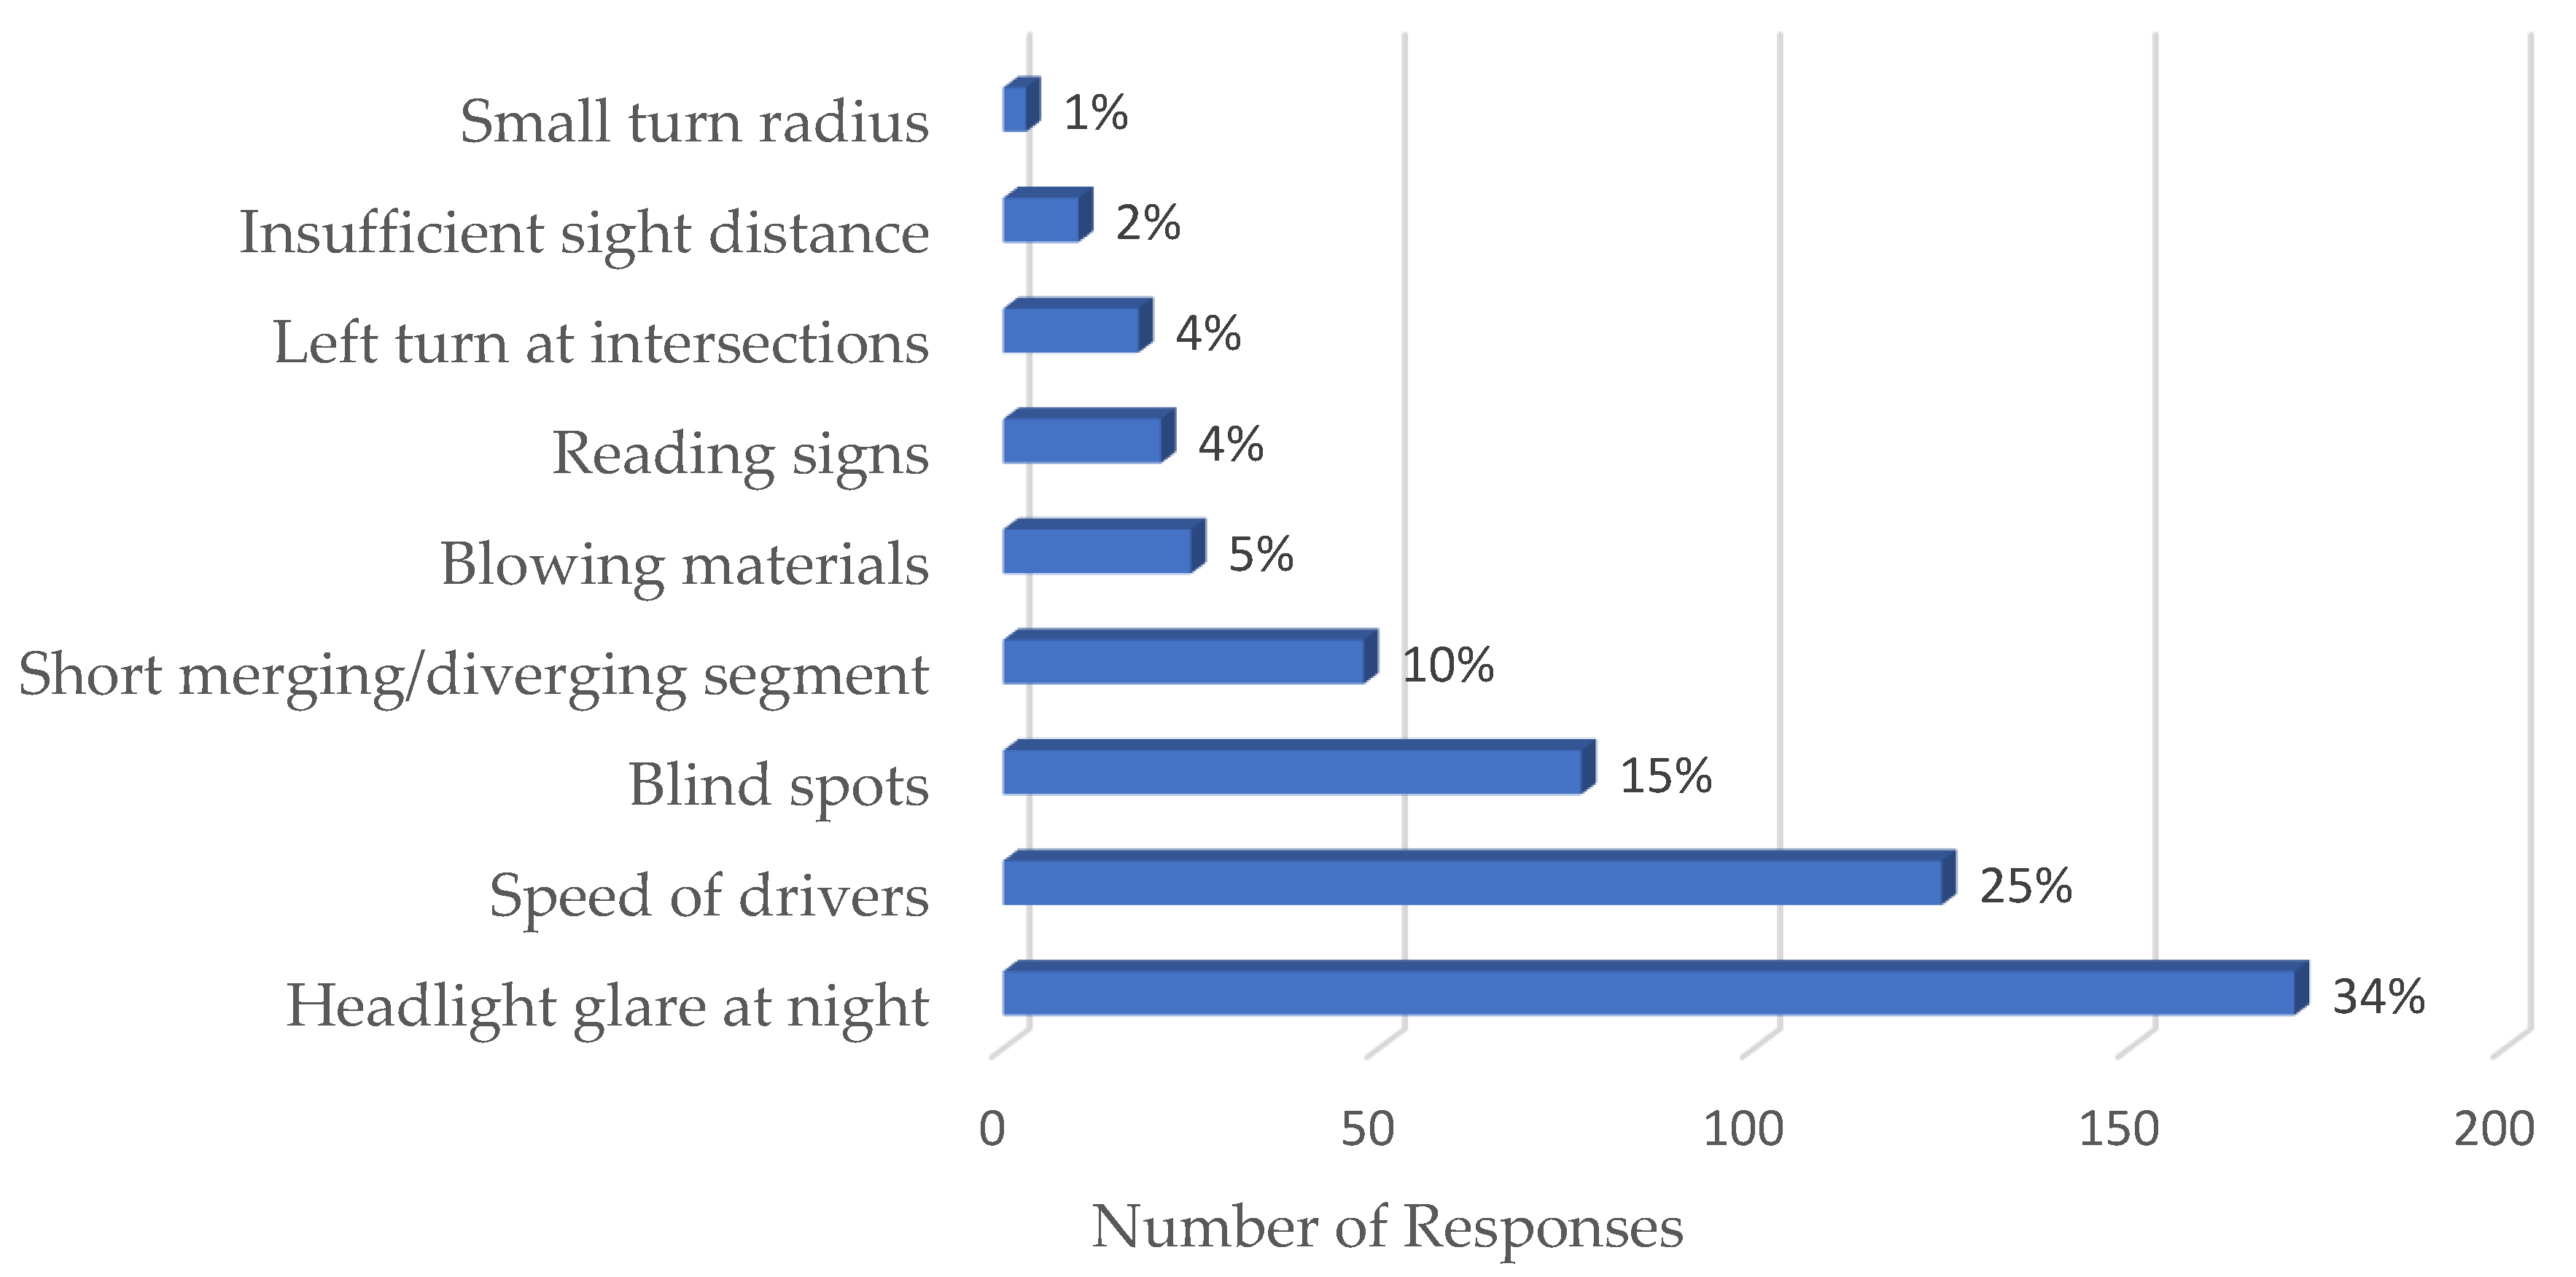
Rankings of survey responses on driving condition, mobility difficulty, driving ability impairment, near-crash, and risk circumstances were listed in Figure 1, Figure 2, Figure 3 and Figure 4. The results showed that bad weather, rush hour, and heavy traffic are the top unfavorable driving conditions that older drivers tend to avoid. These driving conditions were considered challenging because they demand increased attention and quick response in comparison to clear weather, non-rush hour, and free-flow conditions. Slow reaction time, stiff joints/muscles, and vision impairments were the top driving ability impairments reported by survey respondents, which are all related to the aging physical conditions of older people. Rear-end and sideswipe were the most-reported collision types that older drivers encountered, which may be due to slow reaction time and vision deterioration caused by aging. Headlight glare at night and speed of drivers were the top-reported risk circumstances, which are in alignment with the results from the driving conditions that older people tried to avoid.
3.3. Odds Ratios
Table 2, Table 3, Table 4 and Table 5 present the odds ratio values calculated to quantify the association between various survey variables with driving difficulty, miles traveled annually, the number of days driven in a week, and crash/near-crash experience. The results in Table 2 showed that drivers aged 75 and older experienced higher driving difficulty compared to those aged 65–74. Older female drivers faced more difficulty than their male counterparts when driving. Older drivers who often drive on local roads reported higher driving difficulty than those who usually use highways/freeways, indicating that older drivers who experience more driving difficulties tend to avoid driving on high-speed roads. In addition, older drivers with higher education reported less diving difficulty.
The odds ratio results for miles traveled annually (Table 3) and the number of days driven in a week (Table 4) matched in most cases because both variables measured older people’s driving exposure. Overall, older drivers with higher education attainment had higher exposure in both miles traveled and days driven compared to those with up to high school education. Drivers aged 75 and older tended to drive fewer miles and fewer days than those aged 65–74. Older male drivers drove more miles than their female counterparts, but the two groups had similar driving frequencies. Older drivers who usually drove on freeway/highways were prone to driving more miles but less frequently than those who often used local roads.
As expected, older male drivers and older drivers on prescription medication or with alcohol use experienced more crash or near-crash events (Table 5). Additionally, older drivers with a college education and drove on highways/freeways were involved in fewer crash or near-crash events compared to their counterparts. Surprisingly, the odds ratio results showed that warnings from physicians on the side effects of prescription medicines were associated with more crash or near-crash events among older drivers. The odds ratio results quantified the association between selected variables and crash/near-crash experiences but did not provide enough information to determine if any association with crash/near-crash experiences was statistically significant. Therefore, logistic regression analysis was conducted in the study to further analyze the survey data.
3.4. Independent Explanatory Variable
Table 6 presents the VIF and tolerance values obtained from the collinearity analysis of survey variables. Herein, the dependent variable is crash/near-crash events, while all other survey variables are potential explanatory variables in the analysis. The results show that the two variables, driving days in a week and roadway types, have VIF values larger or close to 3.0, suggesting that they are not independent. Therefore, survey responses on the number of days driven in a week and roadway types used were removed from the dataset for the logistic regression analysis.
3.5. Logistic Regression
Table 7 presents the model coefficients, standard errors, Chi-squared statistics, and associated Chi-squared test p-values obtained from the logistic regression analysis. Only three variables, miles driven within 5000–10,000 m annually (at 0.05 significance level), alcohol consumption (at 0.05 significance level), and medication use (at 0.1 significance level), were found having significant impacts on crash or near-crash risk among older drivers. Older drivers drove 5000–10,000 m per year had a significantly higher chance of being involved in crashes/near-crashes than those drove less than 5000 m annually. This revealed that higher exposure led to a high-crash/near-crash risk. The positive coefficients for miles driven of 10,000–15,000 m and more than 15,000 m indicated that older drivers who drove more than 10,000 m per year also had a higher chance to be involved in a crash or near-crash than those drove less than 5000 m per year, but the difference is not significant. The non-significance may be due to the small number of older drivers who drove more than 10,000 m annually.
The logistic regression analysis results confirmed that alcohol and prescription drug use significantly increased crash/near-crash risk among older drivers. Note that although only a small percentage of survey respondents reported DUIs, the logistic regression analysis still identified DUI as a significant influential variable on older driver crash risk, indicating the severe adverse impact of DUI on driving safety. The p-value for medication use is 0.053, which is not as significant as the other two variables. This might be due to the different levels of adverse impact that different prescription medicine has on older drivers. Further research is needed to examine the driving impairment of various medicines reported by the survey respondents. The result for medication warnings was consistent with that from the odds ratios analysis. A positive coefficient was obtained for the variable, but its p-value indicated that a warning of the side effects of prescription drugs had no significant effects on older drivers’ crash risk.
The impacts of other explanatory variables on older drivers’ crash/near-crash risk obtained from model coefficients associated with them were consistent with the results from the odds ratio analysis. However, the p-values indicated those explanatory variables are all non-significant. The results imply that older drivers are vulnerable regardless of their gender, race, education, etc.
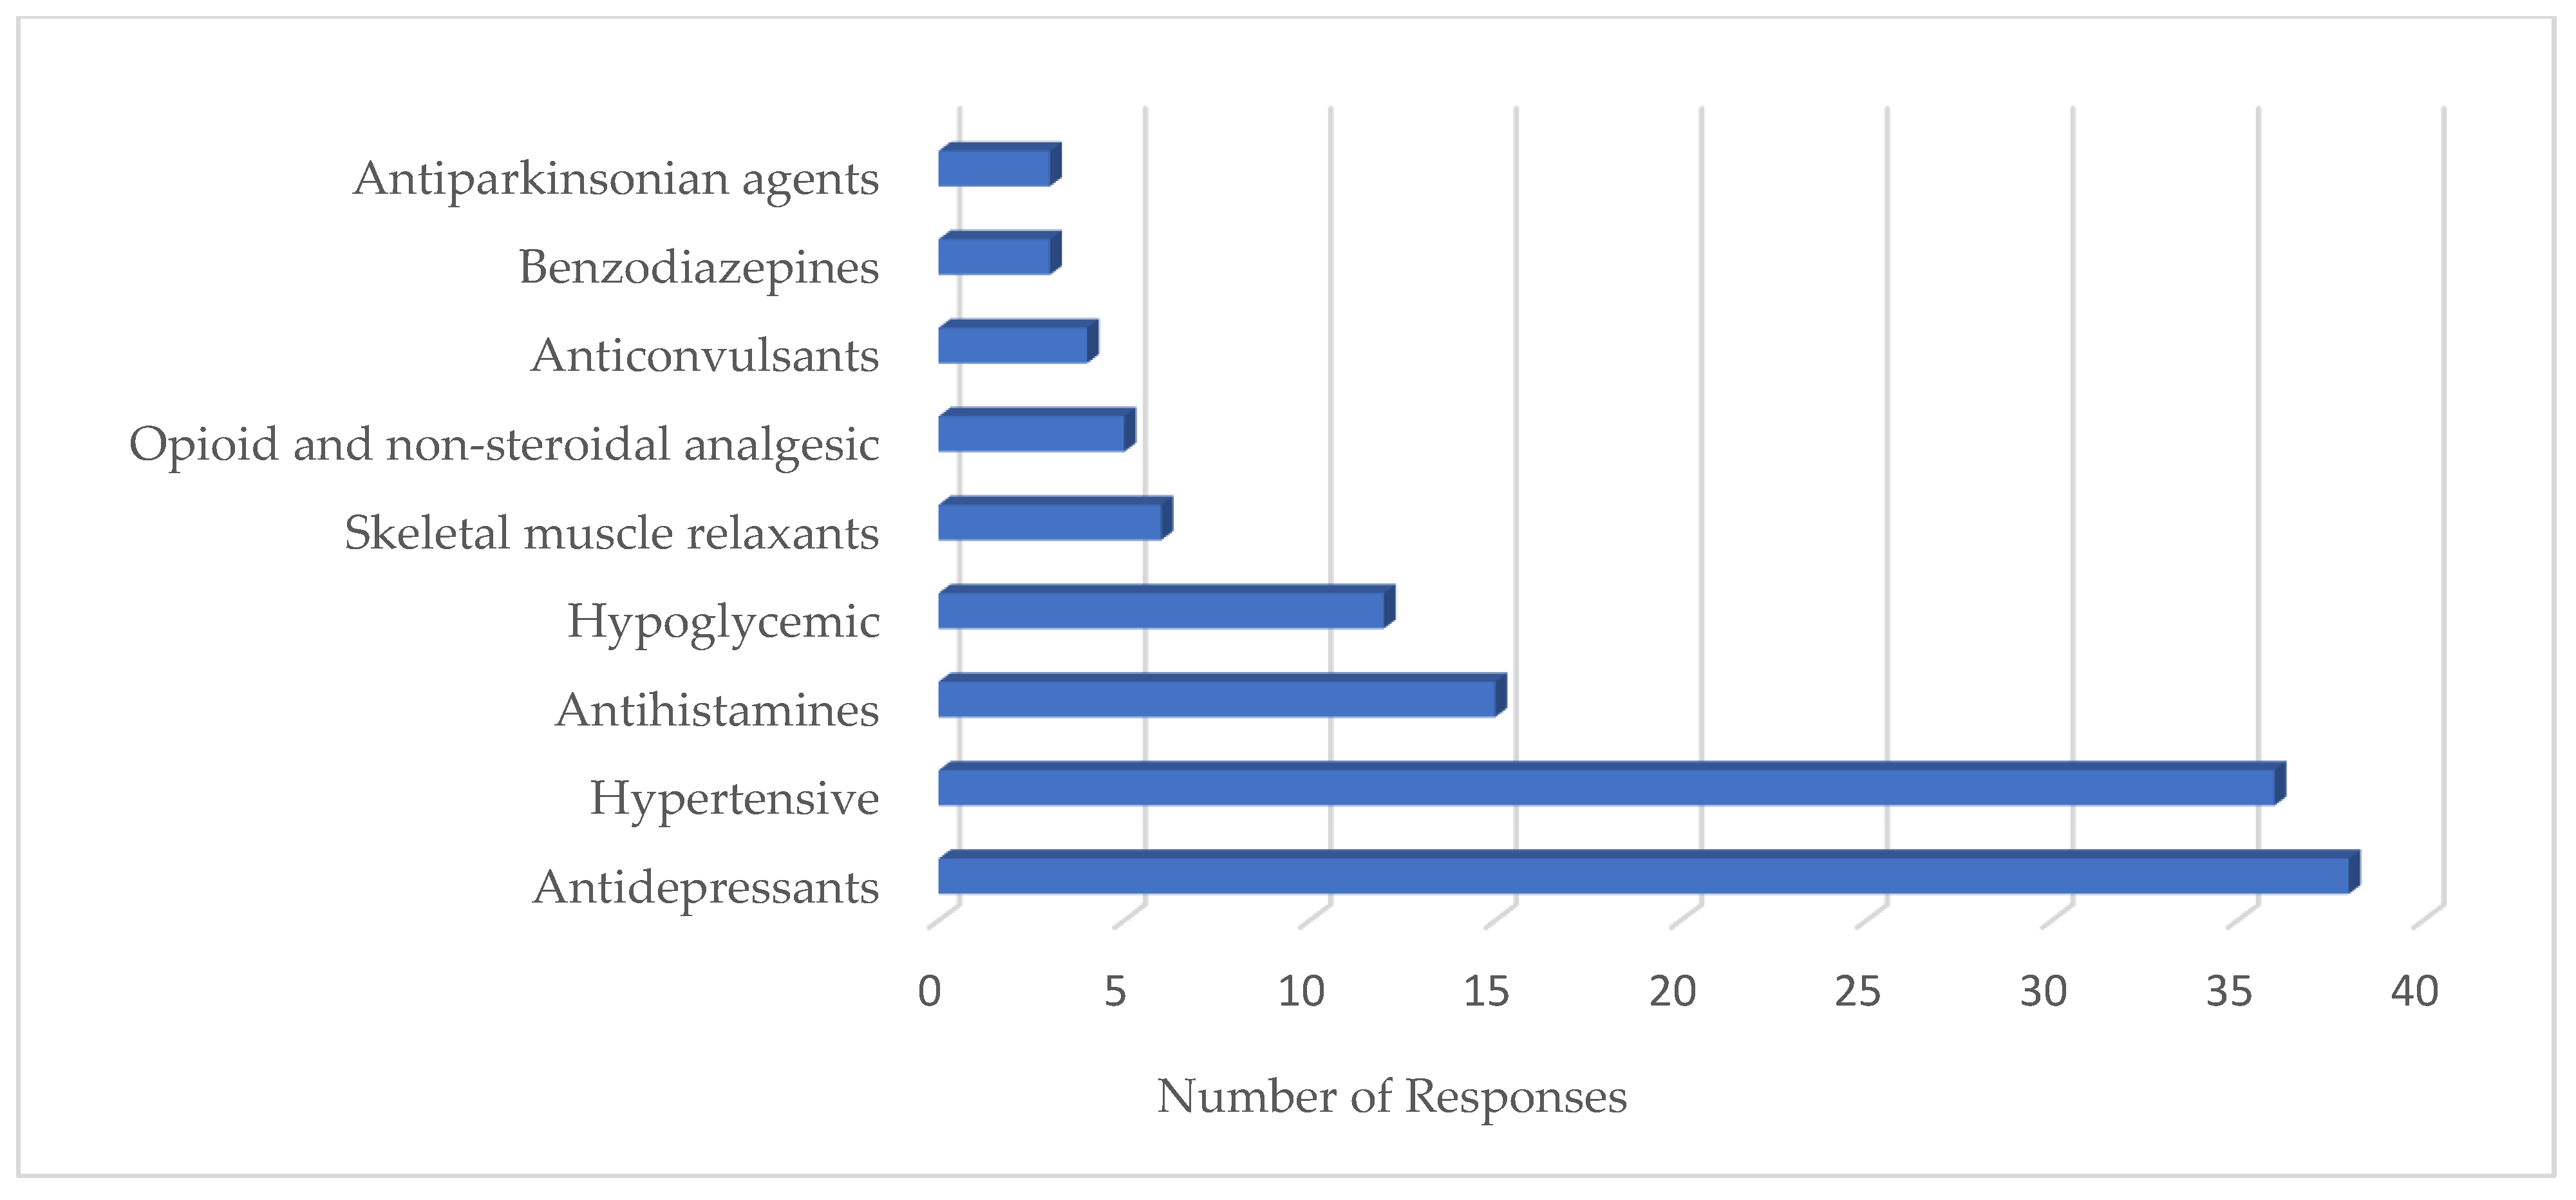
Figure 5 presents the ranking of prescription medicine use reported by survey respondents. Antidepressants and hypertensives were the top prescription drugs used by older drivers, followed by antihistamines and hypoglycemics. Note that an older driver could be on multiple prescription drugs at the same time. The drug-use frequency was not high compared to the total number of responses. Still, the logistic regression model identified prescription drug use as a significant variable, indicating that the adverse impact of medicine on older driver safety cannot be overemphasized.
4. Discussion
The survey results revealed that although it is common for older drivers to experience difficulty in performing daily activities and are on prescription drug(s), the majority (90%) of respondents still drove 3–5 days or every day in a week. This indicates the strong mobility needs of the older population. Past studies have proved that mobility is of fundamental importance to older adults’ independence, physical and psychological health, and quality of life [34,35,36]. With the advance of technologies and automation of motor vehicles, new safety and operational features (e.g., cameras, sensors, cruise control) have been equipped on vehicles by default, which lowered the bar for older people to drive safely. The trends in older driver crashes have shown that fatal crash involvements for adults aged 70 and older in the U.S. remain down from their 1997 peak, even as the number of licensed older drivers and the miles they drive have increased, which is likely attributed to health improvement and vehicles with improved crash worthiness and safety features [37]. Older drivers with impairments usually self-regulate to reduce their exposure to live traffic. On the other hand, restriction policies and laws are in place to restrict older people’s driving activities based on their ages or impairments (e.g., [38,39]). Although those safety measures are effective in mitigating motor vehicle crashes involving older adults by reducing their exposure to traffic, the focus needs to be placed on providing a roadway network and a traffic control system that considers older people’s characteristics and needs, rather than restricting them from driving. A study from New Zealand has shown that licensing and mobility restrictions policies target all older drivers cannot be justified from a safety basis [30].
Older adults’ demographic characteristics (age, gender, education, and race) and driving difficulty were found associated with their crash risk, which are consistent with conclusions from some past studies (e.g., [9,20]). However, statistical analyses only identified driving exposure, alcohol consumption, and medication usage as significant influencing factors on older drivers’ crash risk. This indicates that the crash risk of older drivers is mainly affected by external factors rather than by their internal characteristics. Therefore, older drivers’ motor vehicle crashes may be mitigated through the proper administering and advising of prescription medicines (e.g., advice on safe driving for those on prescription drugs), enforcement of restriction laws on driving under influences (e.g., enforcement of restriction on blood alcohol concentration), and engineering solutions to improve the design and operation of roadways and traffic controls by considering older people’s characteristics and needs (e.g., increasing the length of merging/diverging lanes).
The rankings of responses showed that bad weather, rush hour, and heavy traffic were the top driving conditions older drivers tended to avoid, and rear-end and sideswipe were the top collision types that older drivers encountered. Given that those conditions and collision types are commonly avoided or experienced by young and middle-aged drivers [40], those results did not provide much specific information on mitigating older people motor vehicle crashes. The results on perceived risky circumstances by older drivers provided valuable insights in this regard. Headlight glare at night, the speed of drivers, blind spots, and short merging/diverging segments are the most reported risky circumstance by older drivers. These are related to median design/roadway lighting, sight distance, design speed, and roadway geometry. Therefore, enhanced roadway design that considers older people’s characteristics and speed limit enforcement will improve older drivers’ safety. The finding will provide insights to help bridge the gap identified in previous studies (e.g., [41]) of lacking definitive findings or recommendations for infrastructure changes to increase the safety of older drivers.
This study identified medication usage as a significant factor on older drivers’ crash risk. The adverse impacts of prescription drugs have long been recognized [23,24,28]. However, an increase in crash risk was found associated with warnings from physicians on the side effects of prescription medicine, although the increase was not statistically significant. A total of ten classes of medication were reported used by survey respondents. Many past studies have examined how prescription medicines affect drivers’ performance. However, only being aware of the adverse effects is of limited help for older people’s safe driving. Given the mobility needs of older people and that a large portion of them is on medication, the more useful information might be when and how to drive safely after taking prescription drugs. Future research needs to focus on the evolvement of adverse side effects of prescription medicines on driving performance over time and the association between the extent of side effects and crash risk under various roadway, traffic control, and environmental conditions.
Even though results obtained from the statistical analyses are reliable, data gathered from the survey that were used in the statistical analyses have limitations and the analysis findings should be carefully inferred and used together with other data or models. Information obtained from a self-reporting survey can be faulty, as people tend to portray themselves as righteous even in an anonymous survey. Additionally, possible memory-related problems due to aging may distort the older driver survey data. Further investigation using non-self-reported data (e.g., non-intrusive data collection of driving exposure, cross-referenced healthcare data.) would be helpful to improve the reliability of the concluded results. In addition, the study targeted older drivers in Illinois, U.S. The results obtained from the study may not be generalized to older drivers in other regions and counties.
5. Conclusions
The survey of older drivers showed that it was common for them to experience driving difficulty and a large portion of older drivers used prescription drugs regularly. Still, most older drivers maintained a high degree of mobility by driving 3–5 days or every day in a week, indicating that older people want to continue driving as long as they are able to drive safely. Given the importance of mobility to older people’s independence, health, and quality of life, to improve older drivers’ safety, the focus needs to be placed on providing a safe roadway system that considers older people’ characteristics rather than older people’ self-regulation and driving restriction policies/laws that target older adults.
The sample of older drivers showed strong evidence that driving exposure, driving under influences, and medication use increase their crash risk. Older drivers’ demographic characteristics (age, gender, education, and race) and driving difficulty were also associated with their crash risk, but the association is not statistically significant. This indicates that the crash risk of older drivers is mainly affected by external factors rather than their internal characteristics. Older drivers’ motor vehicle crashes may be mitigated through properly administering and advising on prescription medicines, enforcing restriction laws on driving under influences, and engineering solutions to improve the design and operation of roadways and traffic controls by considering older people’s characteristics and needs.
Warnings from physicians on the side effects of prescription drugs had no significant impacts on older drivers’ crash risk. Further investigation is needed to examine the evolvement of side effects over time after taking medicines and how to mitigate older people’s motor vehicle crashes through proper advising of the side effects of medicines and suggestions on safe driving after taking medicines. The study results suggest that improving older driver safety needs joint efforts from transportation agencies, health departments, and law enforcement. The findings from this study are valuable in further refining the understanding of older people’s, particularly older drivers’, safety problems and can help formulate safety countermeasures to mitigate motor vehicle crashes involving older adults, while keeping their independence, health, and quality of life.
Author Contributions
Conceptualization, Y.Q.; methodology, Y.Q.; data collection, R.P.; formal analysis, R.P. and Y.Q.; writing—original draft preparation, R.P.; writing—review and editing, Y.Q. All authors have read and agreed to the published version of the manuscript.
Funding
This research was funded by the Illinois Department of Transportation through Illinois Center for Transportation, grant number R 27-201.
Institutional Review Board Statement
The study was conducted according to the guidelines of the Declaration of Helsinki and approved by the Institutional Review Board of Southern Illinois University Edwardsville (SIUE) (protocol code # 130) on 18 September 2018.
Informed Consent Statement
Content was waived due to the protocol qualified a exempt status according to IRB review results.
Data Availability Statement
All data collected and used in the research are available from the corresponding author upon reasonable request.
Acknowledgments
It would be impossible to do the research without the unconditional support and assistance from the numerous officials and staff of the Illinois Center for Transportation, Illinois Department of Transportation (IDOT), and Illinois Secretary of State Office. The authors would also like to acknowledge Mehdi Nassirpour from the IDOT, Daniel R. Leonard from the University of Illinois, and Md Al Adib Sarkerfrom SIUE for their support in this project.
Conflicts of Interest
The authors declare no conflict of interest.
Appendix A
Survey on Motor Vehicle Crashes among Older People
The Illinois Department of Transportation (IDOT) is interested in your opinion on driving safety and mobility issues, particularly the safety and mobility of older population in Illinois. Your answers to the following questions are totally voluntary and anonymous. Please complete the survey and put it in the drop box or mail it back using the prepaid envelop provided.
Demographic Characteristics
1. Your Gender: ☐ Male ☐ Female
2. Your Age: ☐ 34 or less ☐ 35–64 ☐ 65–74 ☐75–84 ☐ 85 or older
3. Your Ethnicity: ☐ Caucasian ☐ African American ☐ Asian ☐ Hispanic ☐ Other
4. Your Education: ☐ Up to high school ☐ Some college ☐ College degree and above
5. Your Zip Code: ____________________________
Driving Exposure
6. How often do you drive in a week?
☐ Every day ☐ 3–5 days ☐ 1–2 days ☐ only weekend ☐ Other_____________
7. How many miles did you drive last year?
☐ Less than 5000 ☐ 5000-10,000 ☐ 10,001–15,000 ☐ More than 15,000
8. What type of vehicle do you drive most often?
☐ Passenger Car ☐ Pickup Truck ☐ SUV ☐ Mini-Van ☐ Other____
9. What type of roadway do you travel most often?
☐ Local roads (up to 35 mph) ☐ Highway (40–45 mph) ☐ Freeway (65 mph and above)
Driving Behavior and Habit
10. How often do you use seat belts while driving?
☐ Most of the time ☐ About half the time ☐ Rarely ☐ Never
11. How often do you drive over 5 mph faster than the posted speed limit?
☐ Most of the time ☐ About half the time ☐ Rarely ☐ Never
12. In the past 60 days, have you driven a motor vehicle within 2 h after drinking alcoholic beverages?
☐ Yes ☐ No
13. Which driving conditions do you usually try to avoid (check all those apply)?
☐ Night driving ☐ Bad weather ☐ High speed roads ☐ Heavy traffic ☐ Drive alone
☐ Left turn across traffic ☐ Long trips ☐ Unfamiliar roads ☐ Rush hour ☐ Other_______________
Physical Conditions and Medications
14. Did you experience fall in last year?
☐ 3 times or more ☐ 2 times ☐ 1 time ☐ None
15. Do you experience difficulty in any of the following daily life activities?
☐ Bathing self ☐ Dressing and undressing ☐ Using restroom ☐ Feeding self
☐ Getting in and out of bed ☐ Walking between rooms ☐ None
16. Do you experience any of the following mobility difficulty?
☐ Using stairs ☐ Walking more than ¼ mile ☐ Carrying heavy objects ☐ None
17. What do you believe impairs your driving abilities the most?
☐ Stiff joints and muscles ☐ Trouble seeing ☐ Trouble hearing
☐ Slower reaction time ☐ Medication ☐ Other___________
18. Are you currently on prescription drugs of any of the following medication classes?
☐ Barbiturates ☐ Benzodiazepines ☐ Hypnotics ☐ Antidepressants ☐ Opioid and nonsteroidal analgesics ☐ Anticonvulsants ☐ Antipsychotics ☐ Antiparkinsonian agents ☐ Skeletal muscle relaxants ☐ Antihistamines ☐ Anticholinergic medications ☐ Hypoglycemic agents ☐ Other_______________
19. Do you aware of or have you been warned by any healthcare provider on the possible driving impairing side effect of prescribed drugs you take?
☐ Yes ☐ No
Driving Safety
20. Have you experienced any crash or near-miss crash in the following type in last two years?
☐ Overturned ☐ Fixed objective ☐ Parked vehicle ☐ Turning ☐ Rear-end
☐ Sideswipe ☐ Head-on ☐ Angle ☐ Pedestrian/bicyclist ☐ Other_______________
21. What circumstance do you think as a risk when your drive (check all that apply)?
☐ Reading signs ☐ Insufficient sight distance ☐ Headlight glare at night
☐ Blowing materials ☐ Embankment ☐ Left turn at intersections
☐ Short merging/diverging segment ☐ Small turn radius ☐ Other_______________
22. What improvement in roadway design and operation do you think will improve driving safety (check all that apply)?
☐ Bigger font on signs ☐ Longer left turn signal ☐ Longer non-parking zone at intersections ☐ Longer turn radius ☐ Advanced warning of curves and embankments
☐ Longer merging/diverging segments ☐ Enhanced crosswalks ☐ Other______________
References
- Center for Disease Control and Prevention. Available online: https://www.cdc.gov/motorvehiclesafety/older_adult_drivers/Index (accessed on 10 May 2020).
- Tefft, B.C. Rates of Motor Vehicle Crashes, Injuries and Deaths in Relation to Driver Age, United States, 2014–2015. AAA Foundation for Traffic Safety. 2017. Available online: https://aaafoundation.org/rates-motor-vehicle-crashes-injuries-deaths-relation-driver-age-united-states-2014-2015/ (accessed on 25 August 2019).
- National Center for Statistics and Analysis. Available online: https://crashstats.nhtsa.dot.gov/Api/Public/ViewPublication/812928 (accessed on 8 September 2020).
- Vespa, J.; Armstrong, D.M.; Medina, L. Demographic Turning Points for the United States: Population Projections for 2020 to 2060 Population Estimates and Projections Current Population Reports; U.S. Census Bureau: Washington, DC, USA, 2020.
- Cicchino, J.B.; McCartt, A.T. Trends in older driver crash involvement rates and survivability in the United States: An update. Accid. Anal. Prev. 2014, 72, 44–54. [Google Scholar] [CrossRef]
- IIHS-HLDI. Older People. 2019. Available online: https://www.iihs.org/topics/fatality-statistics/detail/older-people#yearly-snapshot (accessed on 6 May 2020).
- Mcgwin, G.; Sims, R.V.; Pulley, L.; Roseman, J.M. Relations among Chronic Medical Conditions, Medications, and Automobile Crashes in the Elderly: A Population-based Case-Control Study. Am. J. Epidemiol. 2000, 152, 424–431. [Google Scholar] [CrossRef] [PubMed] [Green Version]
- Cicchino, J.B.; McCartt, A.T. Critical older driver errors in a national sample of serious U.S. crashes. Accid. Anal. Prev. 2015, 80, 211–219. [Google Scholar] [CrossRef] [PubMed]
- Lombardi, D.A.; Horrey, W.J.; Courtney, T.K. Age-related differences in fatal intersection crashes in the United States. Accid. Anal. Prev. 2017, 99, 20–29. [Google Scholar] [CrossRef]
- Monyo, D.E.; Haule, H.J.; Kitali, A.E.; Sando, T. Are Older Drivers Safe on Interchanges? Analyzing Driving Errors Causing Crashes. Transp. Res. Rec. J. Transp. Res. Board 2021, 2675, 635–649. [Google Scholar] [CrossRef]
- Doulabi, S.; Hassan, H.M. Analyzing Older Drivers’ Crash Severity in Louisiana. In Proceedings of the 2021 Tran-SET Conference, Virtual, Transportation Consortium of South-Central States, Jonesboro, AR, USA, 3–4 June 2021. [Google Scholar]
- Adanu, E.K.; Lidbe, A.; Tedla, E.; and Jones, S. Factors Associated with Driver Injury Severity of Lane Changing Crashes involving Younger and Older Drivers. Accid. Anal. Prev. 2021, 149, 105867. [Google Scholar] [CrossRef]
- Alshehri, A.; Dissanayake, S. Analysis of Risk Factors in Fatal Intersection Crashes Involving Older Drivers in the Midwestern Region. In Proceedings of the International Conference on Transportation and Development, Chicago, IL, USA, 8–10 June 2021; pp. 251–260. [Google Scholar]
- LeRoy, A.A.; Pharm, D.; Morse, M.L. Multiple Medications and Vehicle Crashes: Analysis of Databases; Final Report; No. DOT HS 810 858; U.S. Department of Transportation National Highway Traffic Safety Administration: Washington, DC, USA, 2008.
- Hill, L.L.; Lauzon, V.L.; Winbrock, E.L.; Li, G.; Chihuri, S.; Lee, K.C. Depression, antidepressants and driving safety. Inj. Epidemiol. 2017, 4, 10. [Google Scholar] [CrossRef] [PubMed] [Green Version]
- Baker, T.K.; Falb, T.; Voas, R.; Lacey, J. Older women drivers: Fatal crashes in good conditions. J. Saf. Res. 2003, 34, 399–405. [Google Scholar] [CrossRef] [PubMed]
- Owsley, C.; McGwin, G.; Sloane, M.; Wells, J.; Stalvey, B.T.; Gauthreaux, S. Impact of cataract surgery on motor vehicle crash involvement by older adults. J. Am. Med. Assoc. 2002, 288, 841–849. [Google Scholar] [CrossRef]
- Johnson, M.B.; Mechtler, L.; Ali, B.; Swedler, D.; Kelley-Baker, T. Cannabis and Crash Risk among Older Drivers. Accid. Anal. Prev. 2021, 152, 105987. [Google Scholar] [CrossRef]
- Depestele, S.; Ross, V.; Verstraelen, S.; Brijs, T.; Brijs, K.; Van Dun, K.; Meesen, R. The Impact of Cognitive Functioning on Driving Performance of Older Persons in Comparison to Younger Age Groups: A Systematic Review. Transp. Res. Part F Traffic Psychol. Behav. 2020, 73, 433–452. Available online: https://0-www-sciencedirect-com.brum.beds.ac.uk/science/article/pii/S1369847820304769?via%3Dihub (accessed on 12 November 2019). [CrossRef]
- Ray, W.A.; Thapa, P.B.; Shorr, R.I. Medications and the older driver. Clin. Geriatr. Med. 1993, 9, 413–438. [Google Scholar] [CrossRef]
- Rubin, G.S.; Ng, E.S.W.; Bandeen-Roche, K.; Keyl, P.M.; Freeman, E.; West, S.K. A prospective, population-based study of the role of visual impairment in motor vehicle crashes among older drivers: The SEE study. Investig. Opthalmol. Vis. Sci. 2007, 48, 1483–1491. [Google Scholar] [CrossRef] [PubMed]
- Molnar, L.J.; Charlton, J.L.; Eby, D.W.; Langford, J.; Koppel, S.; Kolenic, G.E. Factors Affecting Self-Regulatory Driving Practices Among Older Adults. Traffic Inj. Prev. 2013, 15, 262–272. [Google Scholar] [CrossRef] [PubMed]
- Okonkwo, O.C.; Wadley, V.G.; Ball, K.; Vance, D.E.; Crowe, M. Dissociations in visual attention deficits among persons with mild cognitive impairment. Aging Neuropsychol. Cogn. 2008, 15, 492–505. [Google Scholar] [CrossRef]
- Okonkwo, O.C.; Crowe, M.; Wadley, V.G.; Ball, K. Visual attention and self-regulation of driving among older adults. Int. Psychogeriatr. 2008, 20, 162–173. [Google Scholar] [CrossRef]
- Keall, M.D.; Frith, W.J. Older Driver Crash Rates in Relation to Type and Quantity of Travel. Traffic Inj. Prev. 2004, 5, 26–36. [Google Scholar] [CrossRef] [PubMed]
- Staplin, L.; Lococo, K.H.; Mastromatto, T.; Sifrit, K.J. Older Drive Performance Across Six Naturalistic Studies; Final Report; No. DOT HS 813 181; National Highway Traffic Safety Administration: Washington, DC, USA, 2021.
- Foley, D.J.; Wallace, R.B.; Eberhard, J. Risk factors for motor vehicle crashes among older drivers in a rural community. J. Am. Geriatr. Soc. 1995, 43, 776–781. [Google Scholar] [CrossRef]
- Lyman, J.M.; Mcgwin, G.; Sims, R.V. Factors related to driving difficulty and habits in older drivers. Accid. Anal. Prev. 2001, 33, 413–421. [Google Scholar] [CrossRef]
- Oxley, J.A.; Charlton, J.L.; Koppel, S.N.; Scully, J.; Fildes, B.N. Crash Risk of Older Female Drivers–Contributing Factors. Annu. Proc. Assoc. Adv. Automot. Med. 2005, 49, 345–360. [Google Scholar]
- Langford, J.; Koppel, S.; Charlton, J.; Fildes, B.; Newstead, S. A Re-Assessment of Older Drivers as A Road Safety Risk. ATSS Res. 2006, 30, 27–37. [Google Scholar] [CrossRef] [Green Version]
- Kononen, D.W.; Flannagan, C.A.C.; Wang, S.C. Identification and validation of a logistic regression model for predicting serious injuries associated with motor vehicle crashes. Accid. Anal. Prev. 2011, 43, 112–122. [Google Scholar] [CrossRef] [PubMed]
- Szumilas, M. Explaining odds ratios. J. Can. Acad. Child Adolesc. Psychiatry 2010, 19, 227–229. [Google Scholar]
- Ciol, M.A.; Hoffman, J.M.; Dudgeon, B.J.; Shumway-Cook, A.; Yorkston, K.M.; Chan, L. Understanding the use of weights in the analysis of data from multistage surveys. Arch. Phys. Med. Rehabil. 2006, 87, 299–303. [Google Scholar] [CrossRef] [PubMed]
- Groessl, E.J.; Kaplan, R.M.; Rejeski, W.J.; Katula, J.A.; King, A.C.; Frierson, G.; Glynn, N.; Hsu, F.-C.; Walkup, M.; Pahor, M. Health-related quality of life in older adults at risk for disability. Am. J. Prev. Med. 2007, 33, 214–218. [Google Scholar] [CrossRef] [PubMed] [Green Version]
- Yeom, H.A.; Fleury, J.; Keller, C. Risk Factors for Mobility Limitation in Community-Dwelling Older Adults: A Social Ecological Perspective. Geriatr. Nurs. 2008, 29, 133–140. [Google Scholar] [CrossRef]
- Webber, M.S.C.; Porter, M.M.; Menec, V.H. Mobility in Older Adults: A Comprehensive Framework. Gerontology 2010, 50, 443–450. [Google Scholar] [CrossRef] [Green Version]
- Cox, A.E.; Cicchino, J.B. Continued Trends in Older Driver Crash Involve Rates in the United States: Data Through 2017–2018. J. Saf. Res. 2021, 77, 288–295. [Google Scholar] [CrossRef]
- Yang, J.; Yamamoto, T.; and Ando, R. The Impact of Mandating a Driving Lesson for Elderly Drivers in Japan Using Count Data Models: Case Study of Tokyo City. Accid. Anal. Prev. 2021, 153, 106015. [Google Scholar] [CrossRef]
- Molner, L.; Eby, D.W.; Zakrajsek, J.S.; Zanier, N.; Leslie, A.; Elliott, E.; Nriagu, E. Identifying Policy Approaches to Extending the Safe Mobility of Older Adults; Final Report; No. 01764812; AAA Foundation for Traffic Safety: Washington, DC, USA, 2021. [Google Scholar]
- Qi, Y.; Sarker, M.A.; Imran, M.; Pokhrel, R. Motor Vehicle Crashes among the Older Population; Final Report; No. FHWA-ICT-20-011; Illinois Center for Transportation: Springfield, IL, USA, 2020. [Google Scholar]
- Zafian, T.; Ryan, A.; Agrawal, R.; Samuel, S.; Knodler, M. Using SHAP2 NDS Data to Examine Infrastructure And Other Factors Contributing To Older Driver Crashes During Left Turns At Signalized Intersections. Accid. Anal. Prev. 2021, 156, 106141. [Google Scholar] [CrossRef]
Figure 1.
Ranking based on driving condition that older people try to avoid.

Figure 2.
Ranking based on driving ability impairment.

Figure 3.
Ranking based on crash or near-crash experience.

Figure 4.
Ranking based on risk circumstances.

Figure 5.
Prescription Medication Usage.


Table 1.
Response frequencies.
| Description | Total | |
|---|---|---|
| Age | 65 to 74 | 244 |
| 75 to 84 | 130 | |
| 85 or older | 38 | |
| Gender | Male | 188 |
| Female | 226 | |
| Difficulty | Using stairs | 61 |
| Walking more than ¼ mile | 67 | |
| Carrying heavy objects | 117 | |
| Roads | Local roads | 174 |
| Highway | 155 | |
| Freeway | 24 | |
| Alcohol | Use alcohol | 32 |
| Not use alcohol | 373 | |
| Days | Every day | 209 |
| 3–5 days | 151 | |
| 1–2 days | 43 | |
| Ethnicity | Caucasian | 353 |
| African American | 26 | |
| Asian | 11 | |
| Education | Some college | 137 |
| Up to high school | 114 | |
| College degree and above | 155 | |
| Medication | On medication | 130 |
| Not on medication | 168 | |
Table 2.
Odds Ratios for Driving Difficulty.
| Description | High Difficulty | Less Difficulty | Odds Ratio |
|---|---|---|---|
| 65 to 74 | 80 | 192 | 0.402 |
| 75 or Older | 88 | 85 | - |
| Male | 71 | 105 | 0.641 |
| Female | 97 | 92 | - |
| Up to Highschool | 52 | 53 | 1.217 |
| Some college | 116 | 144 | - |
| Local roads | 99 | 100 | 1.418 |
| Highway/Freeway | 67 | 96 | - |
Table 3.
Odds Ratios for Miles Travelled Annually.
| Description | Less than 5000 | More than 5000 | Odds Ratio |
|---|---|---|---|
| 65 to 74 | 49 | 143 | 0.413 |
| 75 or Older | 78 | 94 | - |
| Male | 47 | 129 | 0.496 |
| Female | 80 | 109 | - |
| Up to Highschool | 57 | 48 | 3.223 |
| Some college | 70 | 190 | - |
| Local roads | 93 | 106 | 3.591 |
| Highway/Freeway | 32 | 131 | - |
Table 4.
Odds Ratios for Days Driven in a Week.
| Description | 1–2 days | More than 2 Days | Odds Ratio |
|---|---|---|---|
| 65 to 74 | 16 | 176 | 0.589 |
| 75 or Older | 23 | 149 | - |
| Male | 19 | 157 | 1.02 |
| Female | 20 | 169 | - |
| Up to Highschool | 17 | 88 | 2.09 |
| Some college | 22 | 238 | - |
| Local roads | 19 | 180 | 0.8 |
| Highway/Freeway | 19 | 144 | - |
Table 5.
Odds ratios for near-crash or no-crash experience.
| Description | Near-Crash | No Crash | Odds Ratio |
|---|---|---|---|
| Male | 27 | 148 | 1.385 |
| Female | 22 | 167 | |
| Warning | 9 | 32 | 1.948 |
| No warning | 41 | 284 | |
| On medication | 20 | 83 | 1.894 |
| Not medication | 29 | 228 | |
| Alcohol | 8 | 21 | 2.676 |
| No alcohol | 42 | 295 | |
| 65–74 | 28 | 164 | 1.228 |
| 75 or older | 21 | 151 | |
| Up to high school | 12 | 93 | 0.778 |
| College | 37 | 223 | |
| Local roads | 25 | 173 | 0.855 |
| Highway/freeway | 24 | 142 |
Table 6.
Tolerance and VIF of different explanatory variables.
| Variables | Category | Tolerance | VIF |
|---|---|---|---|
| Gender | Male | 0.894 | 1.118 |
| Female | |||
| Age Group | 65–74 | ||
| 75–84 | 0.825 | 1.212 | |
| 85 and above | 0.725 | 1.380 | |
| Education | College Degree and above | ||
| Some College | 0.731 | 1.368 | |
| Up to High school | 0.668 | 1.497 | |
| Driving Days | Everyday | 0.292 | 3.421 |
| 3–5 days | 0.373 | 2.678 | |
| 1–2 days | |||
| Miles Driven | Less than 5000 | ||
| 5000–10,000 | 0.603 | 1.659 | |
| 10,001–15,000 | 0.525 | 1.904 | |
| More than15,000 | 0.555 | 1.803 | |
| Roadway Types | Local Roads | 0.202 | 4.945 |
| Highway | 0.215 | 4.646 | |
| Freeway | |||
| Alcohol Consumption | Yes | 0.877 | 1.141 |
| No | |||
| Medication Use | Yes | 0.873 | 1.146 |
| No | |||
| High Difficulty | Yes | 0.916 | 1.092 |
| No | |||
| Medication Warning | Yes | 0.880 | 1.136 |
| No |
Table 7.
Survey Data Logistic Regression Analysis Results.
| Variables | Category | DF | Estimate | Standard Error | Wald Chi-Squared | Pr > ChiSq |
|---|---|---|---|---|---|---|
| Intercept | 1 | −5.795 | 2.6737 | 4.698 | 0.030 | |
| Gender | Male | 1 | 0.290 | 0.3588 | 0.655 | 0.418 |
| Female | ||||||
| Age Group | 65–74 | |||||
| 75–84 | 1 | −0.091 | 0.4208 | 0.047 | 0.829 | |
| 85 and above | 1 | 0.399 | 0.5085 | 0.615 | 0.433 | |
| Education | College Degree and above | |||||
| Some College | 1 | 0.173 | 0.4094 | 0.178 | 0.673 | |
| Up to Highschool | 1 | 0.060 | 0.4750 | 0.016 | 0.899 | |
| Miles Driven | Less than 5000 | |||||
| 5000–10,000 | 1 | 0.974 | 0.4361 | 4.990 | 0.025 | |
| 10,001–15,000 | 1 | 0.799 | 0.5770 | 1.917 | 0.166 | |
| More than15,000 | 1 | 0.547 | 0.7246 | 0.570 | 0.450 | |
| High Difficulty | Yes | 1 | 0.345 | 0.3518 | 0.961 | 0.327 |
| No | ||||||
| Alcohol Consumption | Yes | 1 | 1.232 | 0.5481 | 5.055 | 0.025 |
| No | ||||||
| Medication Use | Yes | 1 | 0.731 | 0.3784 | 3.738 | 0.053 |
| No | ||||||
| Medication Warning | Yes | 1 | 0.648 | 0.4961 | 1.706 | 0.192 |
| No |
Publisher’s Note: MDPI stays neutral with regard to jurisdictional claims in published maps and institutional affiliations. |
© 2021 by the authors. Licensee MDPI, Basel, Switzerland. This article is an open access article distributed under the terms and conditions of the Creative Commons Attribution (CC BY) license (https://creativecommons.org/licenses/by/4.0/).
Share and Cite
MDPI and ACS Style
Pokhrel, R.; Qi, Y. Older Driver Safety: A Renewed Perspective in a Survey Study in Illinois, U.S. Safety 2021, 7, 83. https://0-doi-org.brum.beds.ac.uk/10.3390/safety7040083
AMA Style
Pokhrel R, Qi Y. Older Driver Safety: A Renewed Perspective in a Survey Study in Illinois, U.S. Safety. 2021; 7(4):83. https://0-doi-org.brum.beds.ac.uk/10.3390/safety7040083
Chicago/Turabian StylePokhrel, Roshan, and Yan Qi. 2021. "Older Driver Safety: A Renewed Perspective in a Survey Study in Illinois, U.S." Safety 7, no. 4: 83. https://0-doi-org.brum.beds.ac.uk/10.3390/safety7040083
Note that from the first issue of 2016, this journal uses article numbers instead of page numbers. See further details here.