
Lack of Agreement between Safety Priorities and Practices in Agricultural Operators: A Challenge for Injury Prevention


Department of Environmental, Agricultural, and Occupational Health, College of Public Health, University of Nebraska Medical Center, Omaha, NE 68198, USA
*
Author to whom correspondence should be addressed.
Safety 2022, 8(2), 39; https://0-doi-org.brum.beds.ac.uk/10.3390/safety8020039
Submission received: 16 March 2022
/
Revised: 17 May 2022
/
Accepted: 18 May 2022
/
Published: 23 May 2022
Abstract
:Despite training and prevention programs, injury rates in agriculture remain high, and safety compliance is a challenge. Our aim was to compare farm operators’ reported safety priorities to related behaviors. Surveys were mailed to 1600 agricultural operators; 326 returned complete data. We asked respondents about their safety priorities and practices related to machinery, chemicals, and structures. Kappa statistics, factor analysis, structural equation modeling, and profile analysis were used to understand how practices and priorities were related. Agreement between priorities and practices was low to moderate with high variability. Most discrepancies between the two were found in storing pesticides safely, keeping safety data sheets, using personal protective equipment, grain bin entry, and ladder safety. Machinery questions formed consistent constructs for practices and priorities, where practices predicted priorities more strongly than priorities predicted practices. Younger operators were less frequently exercising safe behaviors compared to older operators. Three safety compliance groups were identified: low compliance (15% of respondents), moderate (61%), and high (24%). Overall, operators reported that safety was a high priority, but their practices suggested otherwise. The promotion of safety culture has been suggested as an underutilized means in agriculture to address the complex issues that lead to unsafe practices, regardless of whether they are tied to limited resources, work organization, working environments, machinery, work habits, or general attention to safety. Effective new ways focusing on operator motivation are needed to bridge the gap between safety priorities and practices.
1. Introduction
The agriculture, forestry, and fishing sector has had the highest rates of fatal and non-fatal occupational injuries in the United States (US) during the past two decades [1]. Recent studies and systematic reviews have identified more than 20 risk factors for agricultural injuries [2,3]. Many sources and contributing factors have also been identified; machinery, falls, animals, and chemicals are commonly linked with agricultural injuries and illnesses. While much has been learned about the frequency, characteristics, and risk factors, injury rates have remained persistently high, and systematic reviews have shown only a few examples of successful interventions to reduce injury in agriculture [4]. In attempts to identify effective interventions, recent studies have focused on the role of work practices and behaviors, and have applied organizational safety climate/safety culture research methods that have been used for decades in other industry sectors [5,6]. The current study was conducted in collaboration with the “Safety Culture and Risk Management in Agriculture” COST Action network, adapting a safety behavior survey conducted in 12 European countries to the US agricultural environment [7,8].
Our “Survey of Safety Practices and Priorities on a Farm/Ranch” focused on three areas with well-documented injury risks: machinery, chemicals and pesticides, and buildings and structures. In 2020, the Bureau of Labor Statistics (BLS CFOI) reported 511 occupational fatalities in agriculture, 247 of which were transportation incidents, 34 slips and falls, 44 exposures to harmful substances or environments, and 145 contact with objects and equipment [1]. Out of the 18,750 non-fatal occupational injury and illness cases in 2020, 25% involved contact with object/equipment; 25% falls, slips, and trips; 16% overexertion; 6% transportation; 11% animals; and 15% harmful substances [1]. Earlier research indicates that from 1992 to 2010, 37% of the 5579 machinery-related deaths were in agriculture, forestry, and fisheries, the sector with the highest number of machinery-related deaths in the US [9]. Falls from elevation caused 5.8% of deaths in animal producers and 4.3% of deaths in crop producers in 12 Midwest US states between 2005 and 2012 [10]. In a report from the Iowa Certified Safe Farm Study, 21.1% of injuries were due to falling from a height or slipping or tripping on surfaces, 1.3% from chemical burns or irritation, and 6.3% from machinery [11]. While chemicals and pesticides are not frequent sources of acute injury, they remain a concern for chronic conditions. Aside from animal-related events, machinery, falls in built environments, and chemical exposures are some of the most common hazards in agriculture.
Despite the surfeit of workplace hazards, agricultural operators report many reasons for not exercising safe behaviors on their operations [12,13,14,15]. Often economic worries take precedence over health concerns, operators tend to be averse to outside regulation and control, and most agricultural operations are exempt from enforcement of OSHA safety regulations. Operator concerns are related to meeting the work demands in the short term without contemplation of future consequences [14]. Causes often cited for unsafe practices include socialization, demographic factors, market forces, weather, profitability, farmer’s beliefs, fatigue, farm size, stress, and previous accident involvement. Cole discussed the challenge of changing attitudes about a behavior, a prerequisite to changing the behavior itself [16]. Entrenched attitudes are hypothesized to be the reason most educational programs have failed to reduce the injury rate in agricultural work [17].
In hazardous working environments, job demands may contribute to workplace injuries and fatalities. Safety climate is a broad term for the workplace factors that influence perceptions of whether a safety behavior is expected to be performed and whether compliance with safety practices is rewarded. In a meta-analysis of 179 studies of 186,440 construction, health care, manufacturing, and transportation workers, a poor safety climate predicted unsafe behaviors [18]. Burnout was related to accidents and injuries but was not related to unsafe behaviors.
We conducted a survey of farm and ranch operators in 7 Midwestern states in the US in 2021 to assess safety practices and priorities. We used a restricted version of the theory of reasoned action as our model because it explains volitional behavior (practice) using a few salient concepts [19]. We focused on attitudes about behaviors (priorities) and behaviors (practices) without directly asking about intentions, the intervening variable. It was not our intention to replicate the TPB model with the 134 questions described by Colémont and Van den Broucke [7] but to identify discrepancies between attitudes and behaviors. We assumed that farmer attitudes about whether a safety behavior was important would reflect the intention to perform the safety behavior because it was a safety priority. We aimed to answer three questions: (1) Does endorsing a specific safety behavior as a priority translate to also exercising a related safety practice? (2) Did the survey questions accurately measure a cohesive latent safety concept for machinery-, chemical-, and structure-related safety hazards? (3) Is there an agricultural typology of operators, based on their safety practices? We first desired to understand to what extent safety practices aligned with corresponding safety priorities. Second, we wanted to conduct a question-centered analysis to see how well the scale captured the safety practices and priorities. If survey items formed a cohesive construct, then we wanted to test how practice and priority constructs were related to one another. Third, after testing the questions, we wanted to explore a person-centered analysis to examine whether we could identify groups exercising differing frequencies of safety practices. We hypothesized that priorities would predict safety practices and that we could identify a group that infrequently exercised safety practices but that some safety practices would be more frequently employed than others. We hypothesized that agricultural operators know what they should do to stay safe; it is often the execution of the practices that is intermittent based on situational assessment. This is the first study of agricultural operators that has assessed the agreement between stated priorities and practices, examined the cohesiveness of safety questions as constructs, and attempted to find subclasses of operators based on their safety behaviors, all within the same group of agricultural operators.
2. Materials and Methods
2.1. Sample
A random sample of 1600 names and addresses of farm or ranch operations was provided by Farm Market iD, a for-profit supplier of farm and ranch data, currently part of DTN Industries. Farm Market iD excluded previous survey recipients and used random nth selection to produce the desired number of operations. The Central States Center for Agricultural Safety and Health (CS-CASH) administered the survey using three mailings. The initial contact included a cover letter explaining the survey, a copy of the survey, a one-dollar bill as a small token of appreciation, and a self-addressed business reply envelope with pre-paid postage for the survey to be returned. The initial mailing was sent on 17 March 2021. About one week after the first mailing (24 March 2021), all farmers were mailed a postcard reminding them to complete the survey or expressing appreciation if they had already completed the survey. The third mailing was sent to all non-respondents on 7 April 2021 containing the same contents as the initial mailing except for the monetary incentive. Data collection ended on 14 May 2021. The study was deemed to be exempt by the University of Nebraska Medical Center Institutional Review Board (#452-11-EX) as part of an on-going surveillance system.
In total, 358 surveys were completed or partially completed and returned by 14 May 2021. The response rate of 22.4% was calculated using the American Association for Public Opinion Research’s (AAPOR) standard definition for Response Rate 2. Of the 1600 addresses sampled, 4.4% (n = 70) were determined to be ineligible (e.g., respondents who stated they do not farm; no such address; vacant; deceased) and 3.1% (n = 49) were undeliverable addresses with unknown eligibility. Refusals (e.g., blank survey returned; letter, phone call, or e-mail stating refusal to participate) and refused mail were obtained from 1.9% (n = 30) of the sample.
2.2. Measures
Demographic characteristics included gender (male = 1) and age (continuous). Information was obtained on the type of operation (farm = 1, ranch or both = 0), whether the respondent was an owner/family member or a non-family manager/employee (owner = 1), whether the operator spent the majority of work time doing farm work or working off the farm (farmer = 1), and how much of their total work time was spent working on their farm or ranch operation (vs. off-farm occupation) (1 = 100%, 2 = 75–99%, 3 = 50–74%, 4 = 25–49%, 5 = 0–24%). We asked whether the operation had hired employees (yes = 1), and if so, how many. The number of farm-related injuries the operator had experienced in 2020 and how much work time was lost due to the most serious injury were also asked to ascertain the operator’s experience with injuries. We asked respondents whether they had experienced five different work-related health outcomes (respiratory disease; hearing loss; skin disease; stress, anxiety, depression; and musculoskeletal pain or discomfort).
We aimed to measure two related constructs, safety practices and safety priorities, for three frequently reported sources of farm and ranch injuries. We chose to exclude animal handling safety practices since in our region, most of the operators are crop farmers and the animal handling questions would not apply to them. Safety practices employed on the operation were used to capture safety behaviors. Safety priorities were used as a surrogate for behavioral intention assuming that if an action was a priority, then there was an implied intent to exercise the practice related to the priority. We used five items each to measure the constructs of safety practices and safety priorities for machinery, chemical and pesticide handling, and working in buildings and structures. The practice questions were asked using the six possible response categories: never, rarely, sometimes, most of the time, all of the time, and does not apply. Four of the practice questions were reverse coded for the analysis so that effects were in the same direction to simplify interpretation. The priority questions were asked with the six possible response categories: strongly disagree, disagree, neither agree nor disagree, agree, strongly agree, and does not apply. The items were modified and shortened from a study of 283 Flemish agricultural operators in a survey with 134 questions based on the theory of planned behavior (TPB) [7], and a subsequent modified 81-item questionnaire with 1642 responses from 12 countries in Europe [8]. The survey form is available by request from the corresponding author.
2.3. Data Analysis
2.3.1. Descriptive Statistics
Of the 358 total survey responders, 32 (8.9%) did not respond to any of the safety practices or safety priority questions and were excluded from analyses, resulting in a final sample of 326 farm/ranch operators. Those who responded that a specific practice or priority did not apply to them were coded as missing on that response. Frequencies and percentages were used to summarize categorical personal and farm characteristics. Means and standard deviations were used to describe age and individual items related to the safety constructs.
2.3.2. Item Agreement
To understand the relationships between individual practices and priorities, we calculated the Kappa measure of agreement and its 95% confidence interval (CI) between related pairs of safety practices and safety behaviors. Due to the responses being ordinal, we used a weighted Cohen’s Kappa allowing for greater impacts for values further from the diagonal, which represents agreement [20]. Imputation was not used to fill in missing values in this analysis so sample sizes changed across safety pairs.
2.3.3. Factor Structure
The factor structure analysis is item-centered, meaning it captures how well the questions used in the survey are measuring the safety constructs. At least four items for each factor are required to achieve an overidentified model. We hypothesized that each of the five questions would be correlated with each of their expected constructs based on previous research [7], although the COVID-19 items added to the chemical and pesticide handling questions had not been previously tested. Each set of five items was subjected to exploratory factor analysis (EFA) to assess dimensionality. Maximum likelihood estimation followed by geominQ rotation was used to improve the interpretation of the EFA results, allowing for correlated items. When evidence for a factor structure was present, we conducted confirmatory factor analysis (CFA) and CFA with covariates (multiple indicators multiple causes or the MIMIC model) using weighted least squares regression on the polychoric correlation matrix [21]. Eigenvalues, scree plots, and fit statistics (Tucker–Lewis index (TLI) > 0.95, root mean square error of approximation (RMSEA) < 0.08) were used to assess the model fit [22]. A non-significant χ2 is an indicator that the data fits the model, and was used for assessing the model fit. When the model fit permitted, we tested whether farm operation vs. ranch/both, gender, occupation is primarily farming, time spent working on the farm, having paid workers on the operation, and respondent age was associated with the safety construct practice and priority. The Cronbach’s alpha for reliability (α) was computed for each set of items. If the items fit the constructs for each of the practices and priorities, a structural equation model (SEM) was used to test whether the priority construct predicted the safety practices construct or whether modeling practices as antecedent to priorities showed a better fit to the data.
2.3.4. Latent Profile Analysis
To capture the person-centered effects of the sample, we used latent profile analysis (LPA) to classify individuals into safety groups based on their responses to the safety practices items. We used single imputation to estimate missing values. Imputation was necessary to maintain the same sample size across 15 items, where 10 to 17 responses were missing across all 15 questions. We used the method of Akogul and Erisoglu to obtain the most probable class solution [23,24]. This method uses a set of fit measures, calculates a vector of scores representing the amount of support for each model, and uses a weighted average to identify the best fitting model. After obtaining the class assignments for each of our respondents, we tested whether any covariates were associated with the class assignments using chi-square tests, analysis of variance, and proportional odds models. We plotted the means of the responses for each item by assigned class based on class probabilities.
Descriptive analyses were conducted in SAS version 9.4. Psychometric and agreement analyses were conducted in R (The R Foundation, Indianapolis, U.S.) using the psych, lavaan, and fmsb packages. LPA was conducted in the tidyLPA package in R. Where appropriate, we applied an alpha = 0.05 to assess statistical significance.
3. Results
3.1. Sample
The sample was 64.4% male and 35.6% female (Table 1). The mean age was 63 (standard deviation (SD) = 13.6; range = 24–92). Nearly all were owners of the operation or a family-owned business (99%) and only 12% were strictly livestock producers. Nearly half of the respondents worked less than 25% of their total work time on the farm and 59% reported working an off-the-farm occupation. Only 11% reported having paid workers on the farm. Respondents reported 11 injuries (4.3%), which was the number who reported lost work time due to injury. Musculoskeletal pain or discomfort was the most frequently reported agriculture-related health condition at 27.6% (n = 81 of 294).
3.2. Agreement between Practices and Priorities
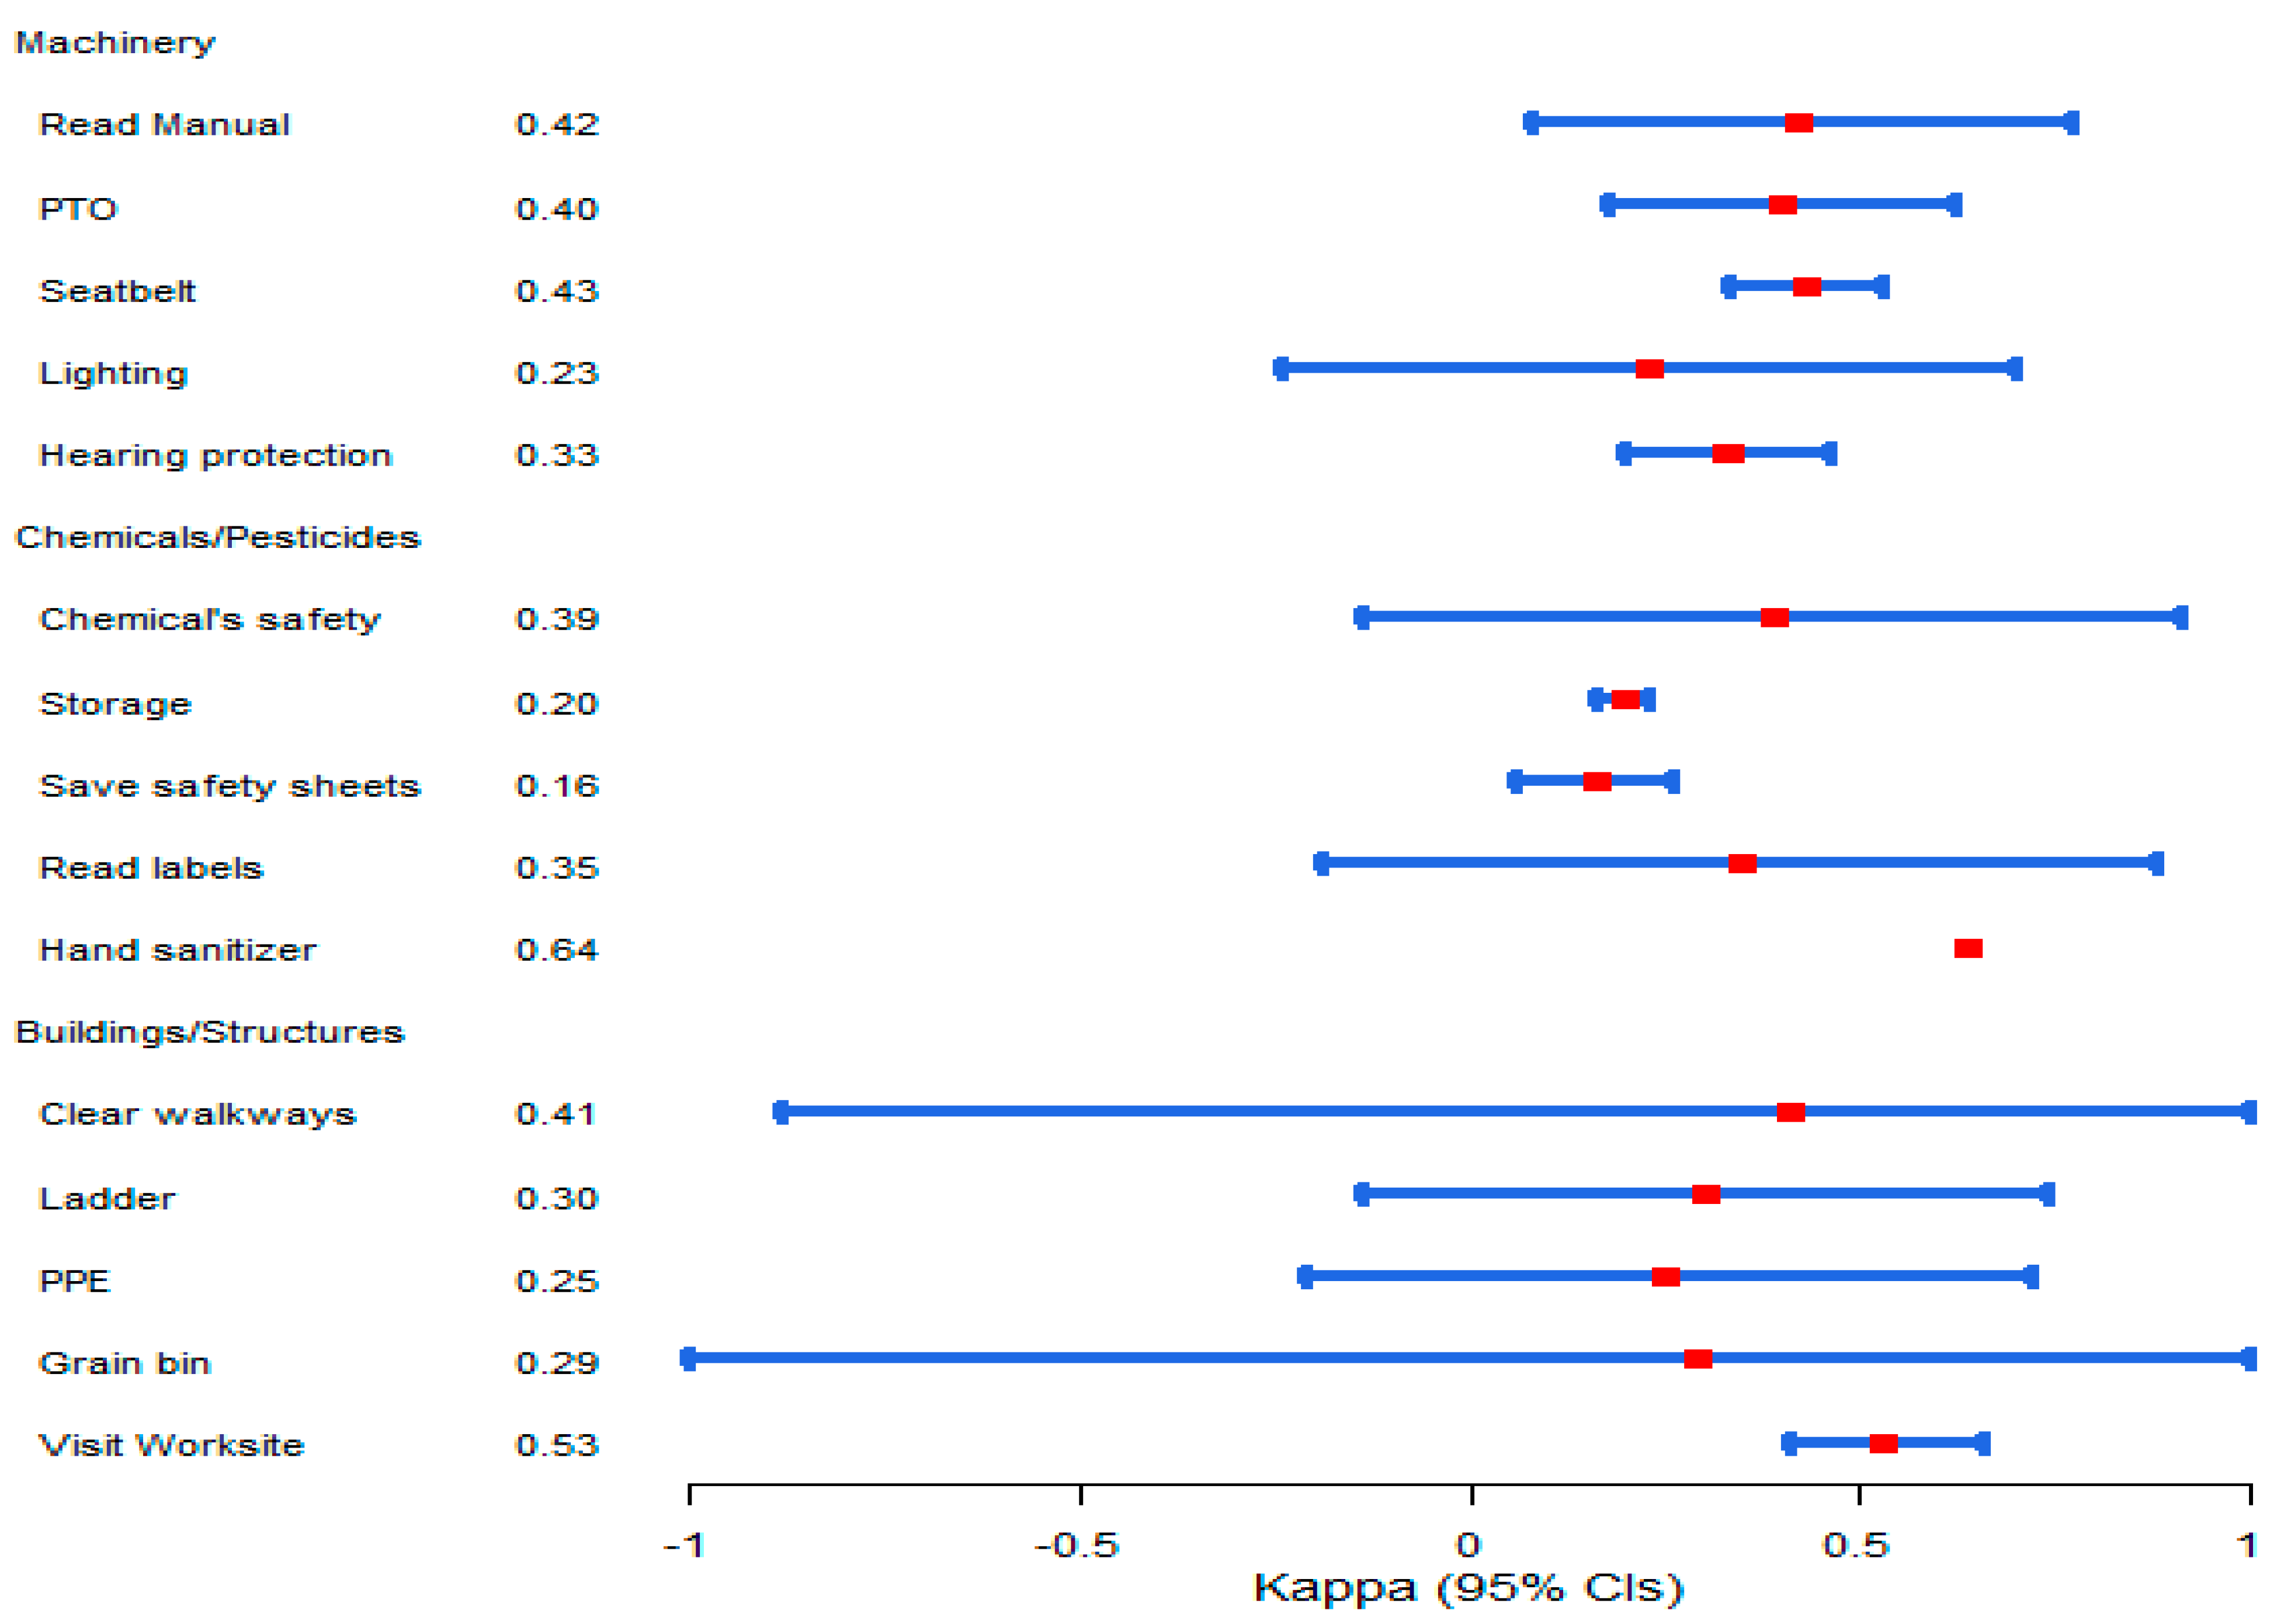
Agreement between safety priorities and safety practices was slight to moderate for the machinery items (Κ = 0.23–0.43), with high variability around the Kappa statistic for checking lighting and markings before taking a farm vehicle on the road (Figure 1). Slight to moderate agreement was observed for the safety practices and priorities related to pesticide and chemical use (Κ = 0.20–0.64). Using hand sanitizer showed the strongest agreement at 0.64 and showed no measurable variability around the Kappa statistic; the questions appeared to be interpreted as identical. For the safety practices and priorities related to buildings, the agreement was a bit higher, with some items being in the moderate level of agreement (Κ = 0.25–0.53); however, the variability was high.
3.3. Safety Practices
3.3.1. Descriptive Results
On average, respondents reported that they rarely work with equipment lacking a PTO shield (Table 2). Most of the time they read the safety instructions before using new machinery and check the lighting and marking features on equipment before taking it on the road. However, they also reported that they rarely wear a seatbelt in a tractor with rollover protection (ROPS) and only sometimes wear hearing protection around noisy machinery. The standard deviation for these mean responses was greater than one, indicating quite a range in reported behaviors on a scale of one to four. The standard deviation was greater for personal protection (seatbelt, hearing protection) compared to machinery-specific safety practices. Respondents felt it was important to think about safety when choosing a pesticide, to read the labels of the pesticides, and to use the recommended personal protective equipment (PPE). They also reported using hand sanitizer to protect against COVID-19 most of the time. Despite these positive safety behaviors, they only sometimes stored pesticides correctly and kept the safety data sheets for the chemicals. These two responses had the highest standard deviations about the mean. Operators reported keeping walkways clear most of the time and only sometimes carried tools with them onto ladders. They reported almost never going into a grain bin to unclog it. They rarely allowed children and visitors in the worksite. They only had PPE readily available at the worksite where it might be needed sometimes. The standard deviations were lowest on the structure-related safety practices questions compared to the machinery and chemical practices, but the use of PPE consistently showed the highest variability in responses.
3.3.2. Factor Analyses
The EFA results on each of the three safety practice constructs are shown in Table 3. The only set of questions that formed a unidimensional construct with acceptable psychometric properties was the machinery questions. The eigenvalues suggested a single dimension (eigenvalues: 1.90, 0.11), with a non-significant chi-square for model fit (χ2 = 6.72, p = 0.10) and acceptable level of error in the measurement (RMSEA = 0.05). The alpha for reliability was in the questionable range; however, Cronbach’s alpha is sensitive to the number of items in a scale and is not a measure of unidimensionality. Wearing a seatbelt was the strongest indicator of machine safety, whereas wearing hearing protection was the least correlated to the machinery safety trait. The CFA confirmed the EFA with excellent model fit and all p-values < 0.0001. In the MIMIC model, being male (β = −0.34, SE = 0.12, p = 0.005) was associated with not exercising machine safety practices.
The factor loadings from an EFA of the chemicals/pesticide questions were robust, but the model error was high (Table 3). Removing the hand sanitizer question improved the model fit. The CFA model with 4 items showed an adequate fit, with coefficients ranging from 0.66 to 0.81, TLI = 0.99, an insignificant chi-square test for model fit (p = 0.09), and an RMSEA = 0.08. The MIMIC models showed only that reporting farming as the primary occupation was positively associated with safer chemical safety practices (β = 0.24, SE = 0.11, p = 0.03).
Factor loadings for the buildings and structures questions were weakly correlated with the building safety construct. Keeping walkways clear of hazards was the strongest, with a factor loading of 0.93, followed by entering grain bins to unclog them (0.44). Furthermore, 3 of the remaining questions were less than the recommended 0.30 for retention in the model. These building safety items did not form a safety construct and, thus, a CFA was not conducted, and an SEM could not be used for analysis.
3.4. Safety Priorities
3.4.1. Descriptive Statistics
The variability in the responses to the priority questions was lower than that of the practice questions. Respondents generally agreed with the safety priorities shown in Table 4. They felt most strongly that lighting and marking of machinery prior to taking it on the road was important and working only with machinery with PTOs was a priority. They were less likely to agree that wearing a seatbelt in a tractor was an important priority. The means of the chemicals and pesticide safety priority questions were about four, indicating general agreement on their importance.
3.4.2. Factor Analysis
The factor loadings for each of the safety priorities were moderately strong, with the exception of using hand sanitizer to prevent COVID-19 (Table 5). The machinery priority model showed reasonably good psychometric properties but with a slightly elevated RMSEA. The chemicals model improved greatly after deleting the hand sanitizer question and formed a construct. The building safety priority model had a high amount of error and evidence that the data did not adequately fit the model. Confirmatory factor analysis was conducted only with the machinery and chemical constructs. Cronbach’s alpha showed acceptable internal consistency on all three subdomains of safety priorities.
The machinery priority factor fit the data with an excellent model fit and all regression coefficients were at least 0.70 and similar across all items. In the MIMIC model, not all models could be computed due to there being insufficient variance among the responses. Reporting a non-farm occupation (β = −0.22, SE = 0.10, p = 0.04) and working fewer hours on the farm (β = 0.09, SE = 0.04, p = 0.02) were associated with machine safety being a higher priority compared to those whose primary occupation was farming and/or worked a greater number of hours on the farm.
The chemical priority CFA model did not converge because the variance-covariance matrix was not positive definite. This occurs when there is insufficient variability in the data to model the variance. No further latent modeling was carried out on this construct. The building safety items had an unacceptable level of error, and no CFA or MIMIC models were estimated.
3.5. Structural Equation Model of Machinery Safety Practices and Priorities
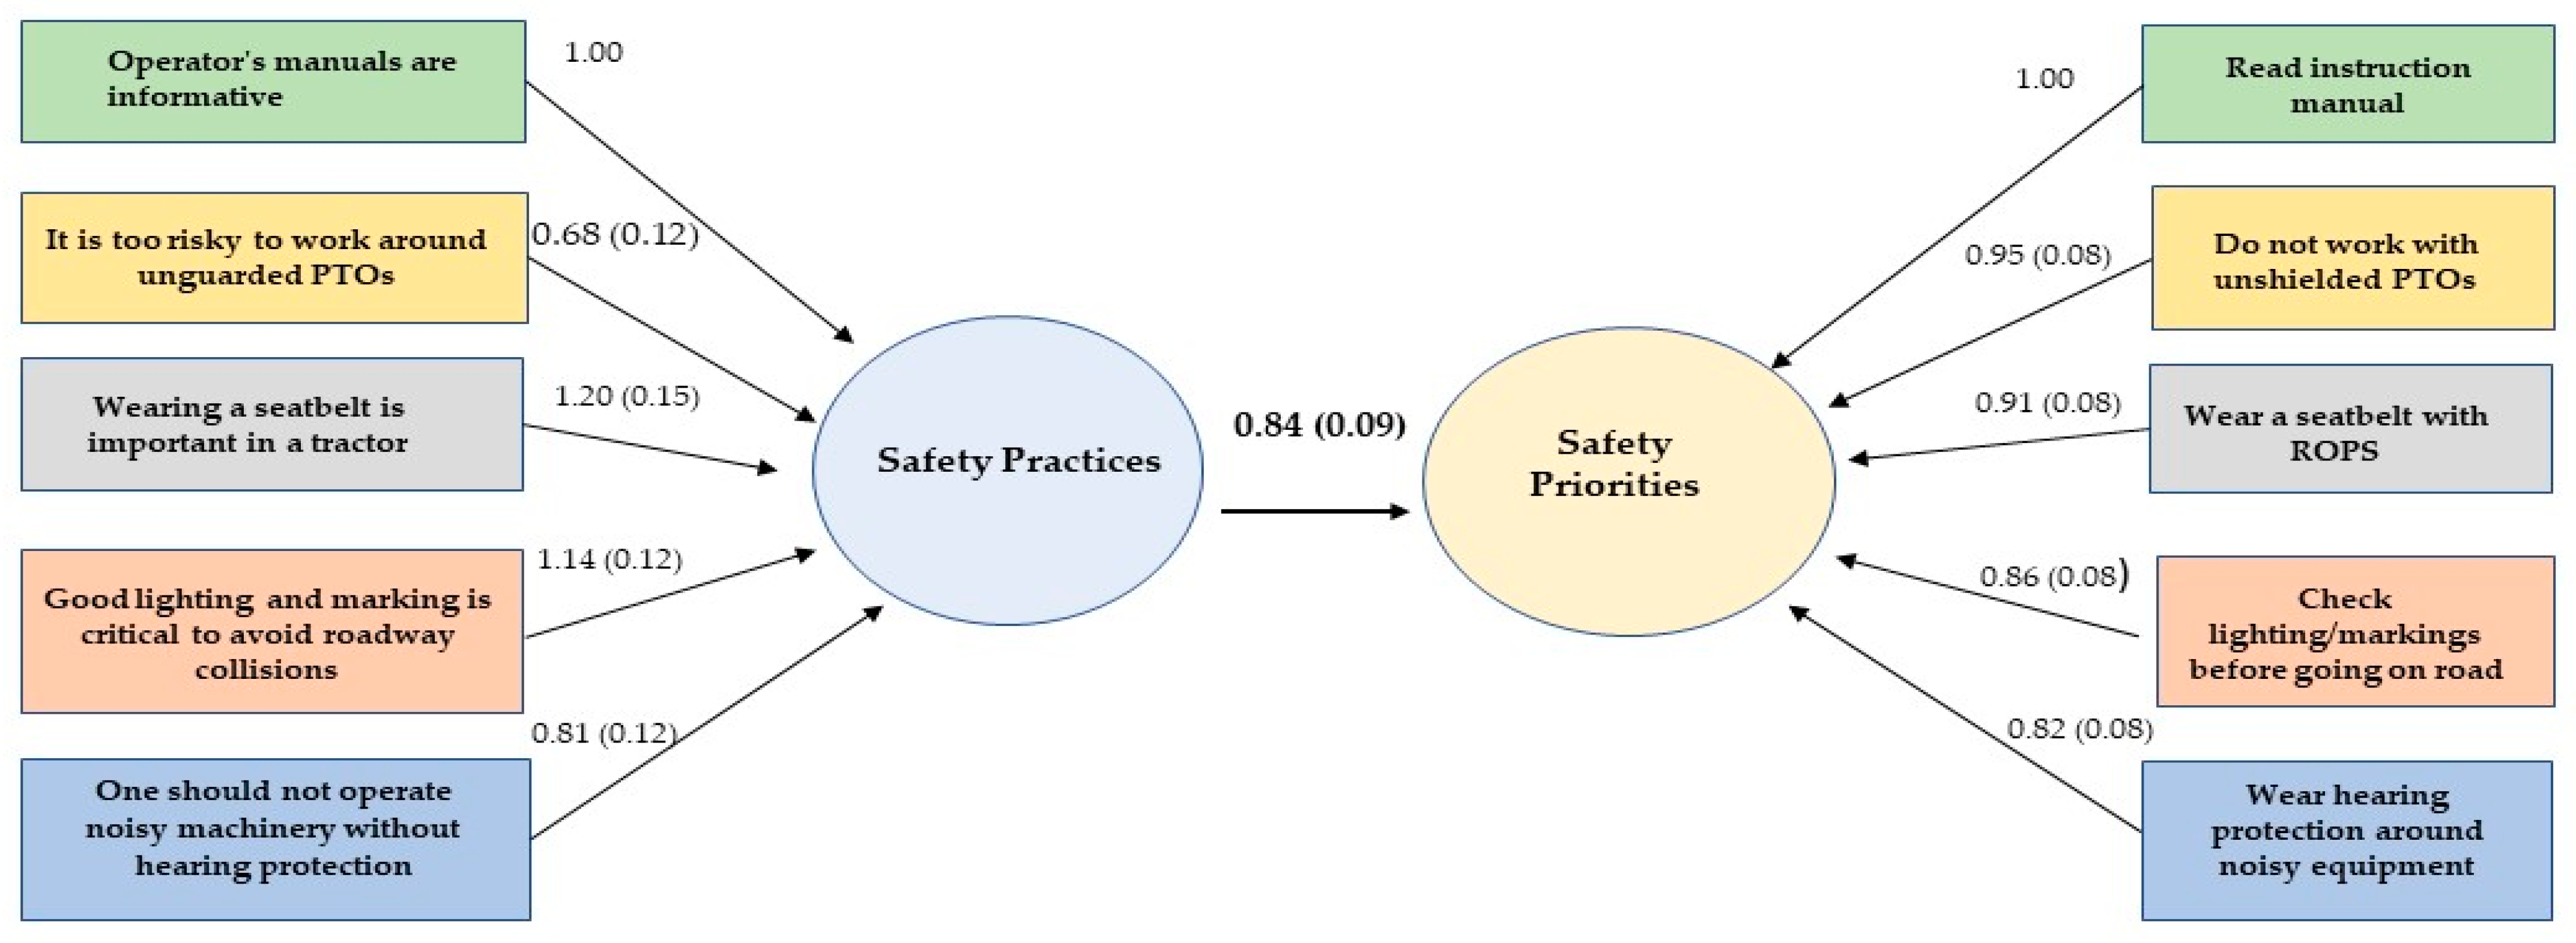
The model fit the data equally well with practices antecedent to priorities compared to priorities antecedent to practices in 188 observations; however, the association between practices and priorities was stronger when practices predicted priorities. The chi-square fit statistics was not significant (χ2 = 29.6, p = 0.49), TLI = 1.00, and the RMSEA = 0.058. Figure 2 shows the item loadings with standard errors, and the effect size between practices and priorities for the machinery constructs. All loadings were significant at p < 0.0001. The effect size for priorities as an antecedent to priorities was β = 0.57 (SE = 0.07, p < 0.0001). With the exception of lighting and marking on vehicles, all factor items for practices and their corresponding priorities were significantly correlated, with a range from 0.25 to 0.41.
Latent Profile Analysis
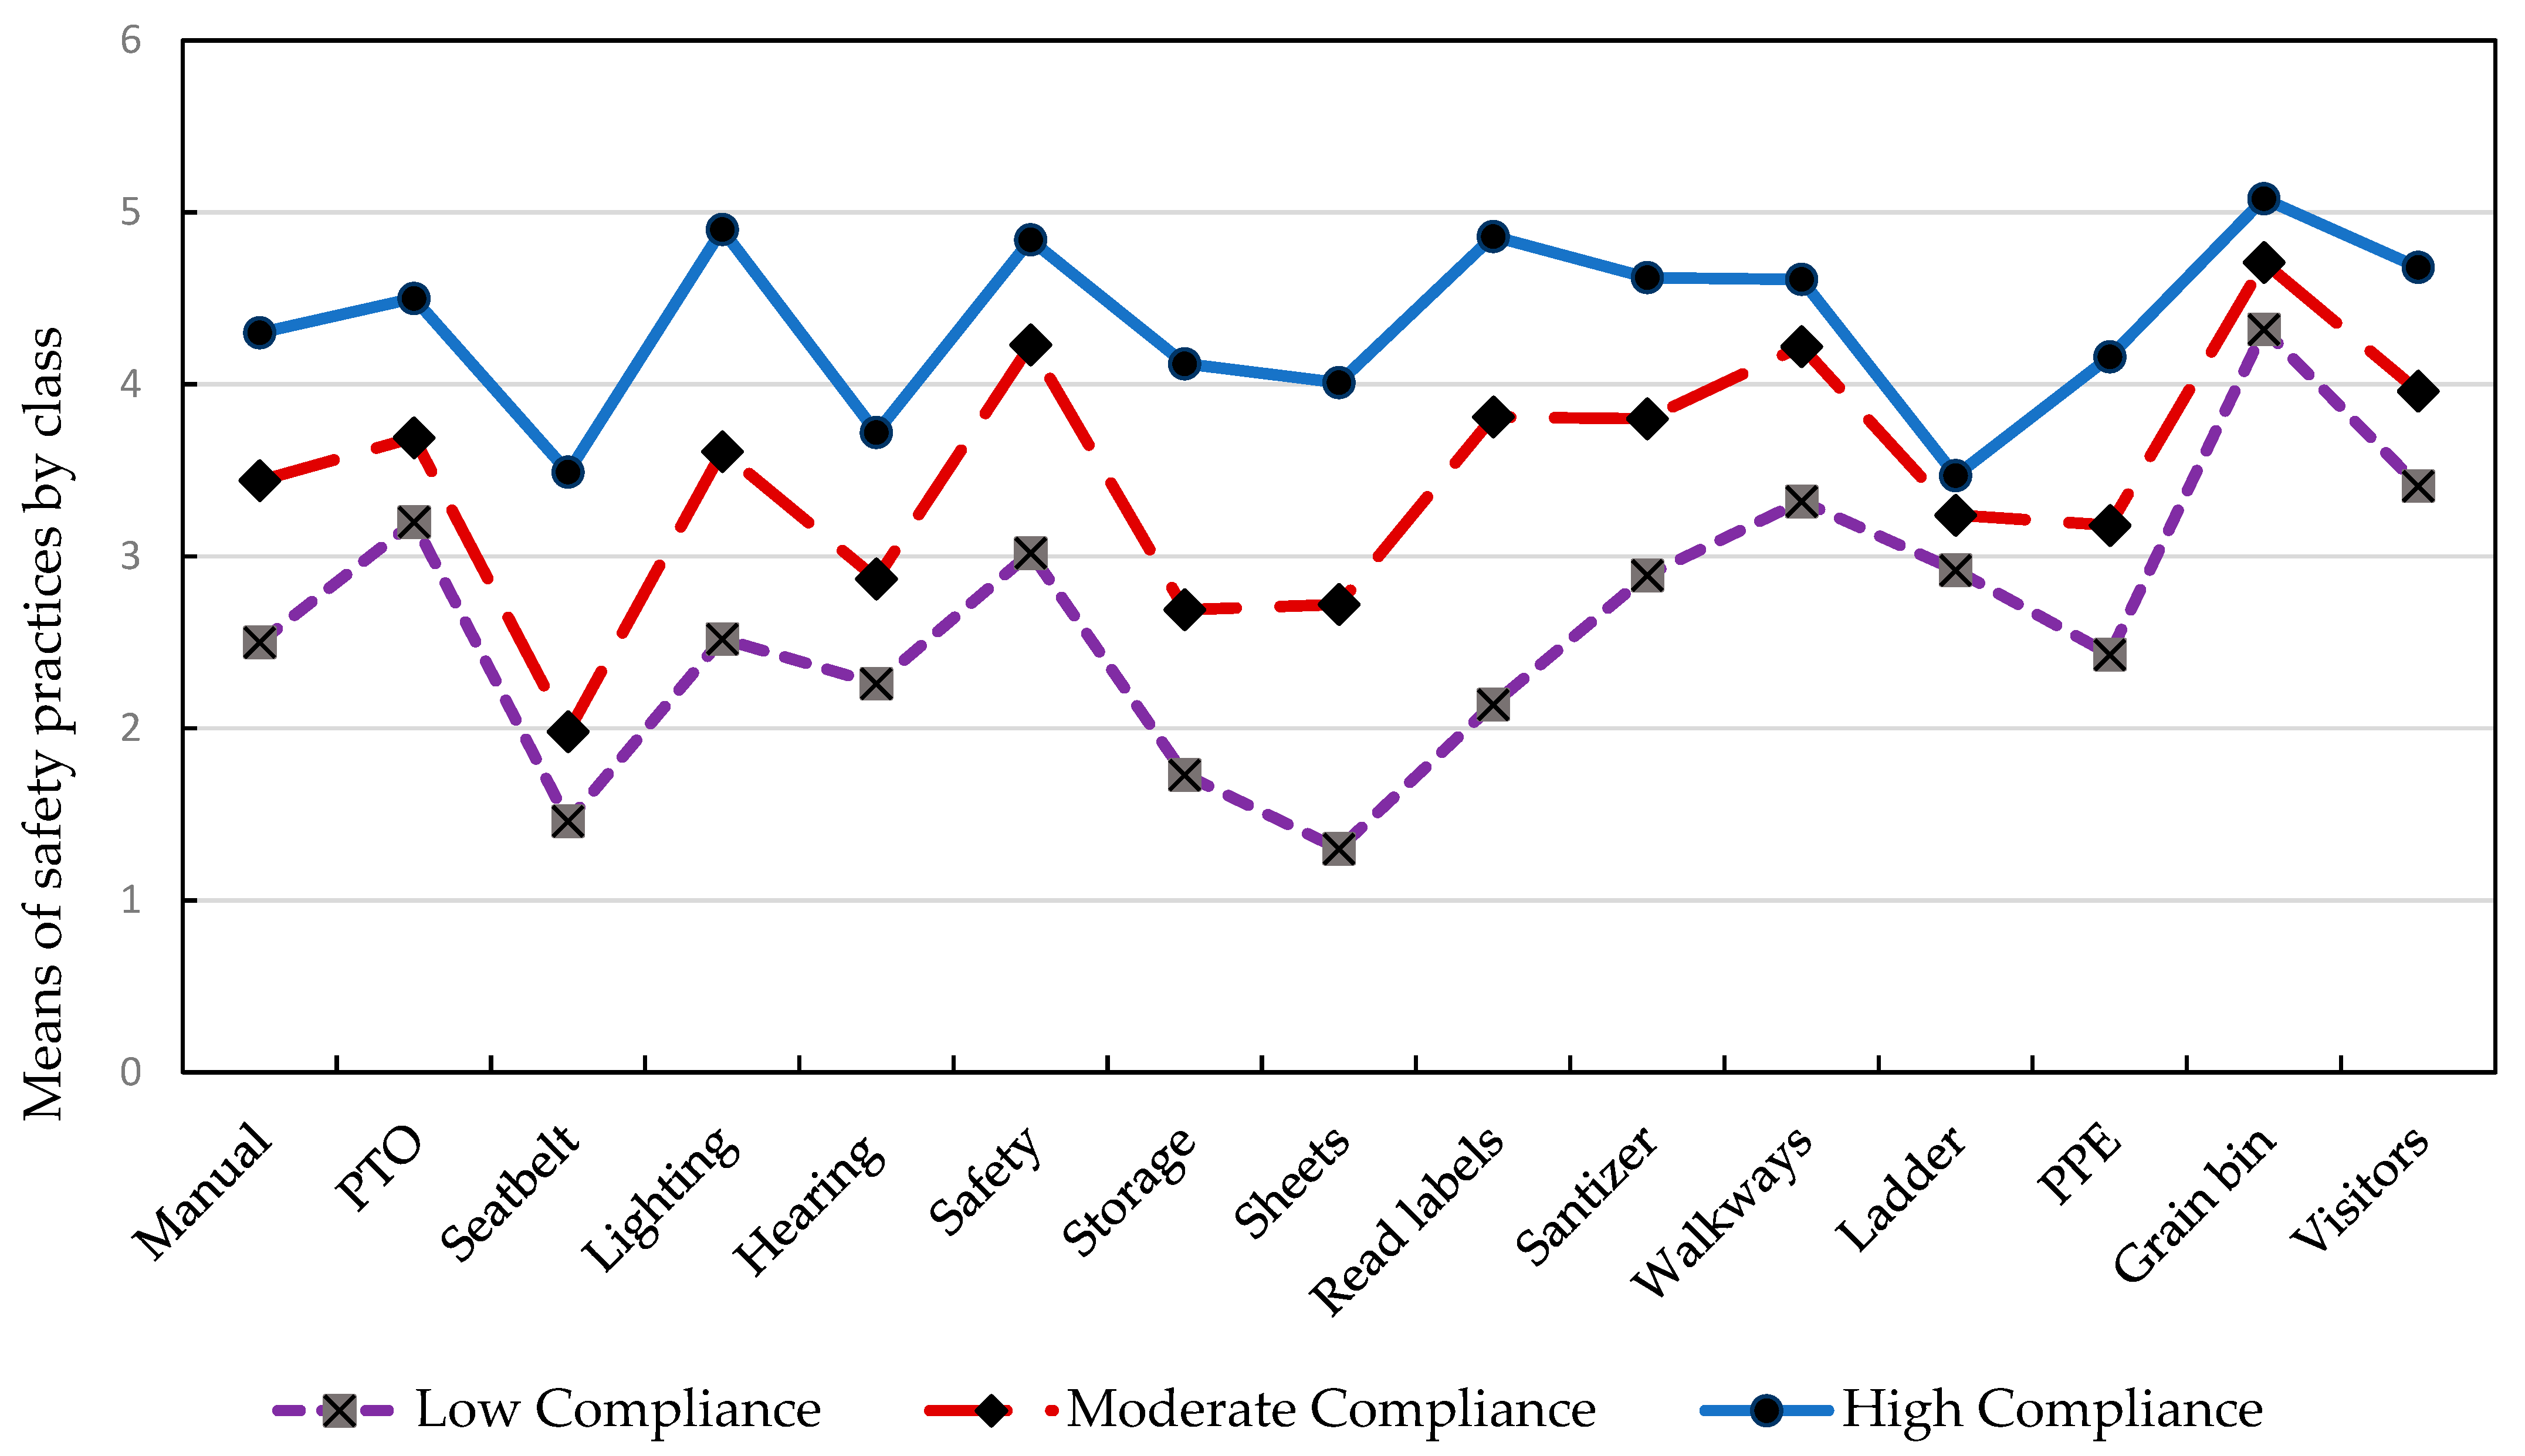
Responses to the 15 practice questions clustered into 3 classes. Although the method of Akogul and Erisoglu identified 4 classes as the best solution, 1 class contained fewer than 5% of the sample (n = 15) so a 3-class solution was the most practical solution (class 1: n = 49 (15.0%); class 2: n = 198 (60.7%); class 3: n = 79 (24.2%)). The entropy values were nearly identical for the two solutions (0.93 and 0.92). The entropy is a measure of how distinct each class is from another; greater than 0.80 is considered a good fit [25]. Plotting the means of the classes for each of the 15 safety practices shows parallel lines representing 3 levels of frequency of practicing a safety behavior (Figure 3). They appear to cluster by low, moderate, and high frequency of exercising a safety practice, and vary by the individual safety practice.
In bivariate analysis, class membership was significantly associated with age of the respondent (class 1, low compliance: mean = 58.9 (SD = 15.6); class 2, moderate compliance: mean = 63.0 (SD = 13.3); class 3, high compliance: mean = 65.8 (SD = 12.4); F[(2, 315) = 3.94, p = 0.02]). In Tukey-adjusted, post-hoc analyses, the age difference was between the low and high safety groups, where older operators were more likely to show greater safety compliance than younger operators (mean difference = 6.91, CI = 1.11, 12.7). Farm operators were more likely to be in a safer category compared to ranchers or mixed operators (p = 0.04) and male operators were more likely to be in a less safe category (p = 0.02). The proportional odds assumption was met when the class variable was modeled as the dependent variable, from lower compliance to greater compliance, with gender and age as explanatory variables. Increasing age (OR = 1.02, CI = 1.01, 1.04) and being female (OR = 0.55, CI = 0.34, 0.87) increased the probability of being in a higher safety compliance category. No other covariates were significantly statistically associated with class membership.
4. Discussion
Our study used a variety of approaches to demonstrate strong endorsement of desirable safety priorities, but operators did not consistently practice safe behaviors. It was somewhat surprising to see the magnitude of the discrepancy between knowledge about safety practices and consistently working safely in some of the practices we asked about. The discrepancies varied by work activity, indicating that it is not a lack of knowledge but a lack of consistently applying safety knowledge. Younger operators less frequently exercised safe behaviors compared to older operators. This difference might be due to greater stressors and the fact that they are more likely to work off the farm. It might also be the case that safety training lapses as they adapt to the norms of their operator peers and opt for time-saving shortcuts. Older farmers may have experience with injury and might be more risk averse due to the consequences of injury at older ages.
We identified distinct subgroups of farm and ranch operators based on how frequently they practiced certain safety behaviors. The same up and down patterns in safety practices were seen in all three groups, but some groups were consistently safer more often. Older operators were more likely to be safer than younger operators. The implications of this is that experience with injury or a better understanding of risks increases the importance of safety. There is a role for experienced operators to share their safety stories and provide mentoring to younger operators in farm/ranch safety trainings.
The agreement between priorities and practices was low to moderate, even though operators scored consistently high on recognizing safety priorities. The variability in the Kappa statistics suggested heterogeneity in the sample of operators and that the existence of subgroups was likely. The moderately safe group was the majority at 61%. The low safety group comprised 15% of the sample. There were clear differences between safety practices related to grain bins and ladder safety, where class agreement was high, and wearing a seatbelt when in a tractor with a ROPS and having safety data sheets available for chemicals and pesticides, where class agreement was low. Educational training on grain bin safety has increased awareness, but grain bin engulfment deaths have not decreased over the past decade and engulfment incidents are likely underreported [26]. As was observed in a 2018 study by Irwin and Poots, there was high variability in the frequency of exercising specific safety behaviors [27]. In that study, investigators used tractor scenarios and asked about working under certain conditions where safety might be compromised [27]. The reasons for doing or not doing an activity were often related to the perception of risk; some activities were assumed to be unsafe and were not undertaken. Despite the variability in the exercise of the safety practices we asked about, the parallel lines in the LPA plot suggest that these groups are distinct.
Safety education efforts have worked in farming communities, but the acquired knowledge has not reduced agricultural injuries [28,29]. The primary mechanism aimed at reducing injuries is training programs. Our study shows that there is a consensus around what are safe and unsafe farming practices and safety is a priority on the farm and ranch; however, there are groups of individuals who are not practicing safe behaviors [14]. The failure of the CFA models to converge for the chemical and building models of priorities is most likely due to the lack of variability in the responses, strongly suggesting that the operators agree on what is and is not a safety priority. In contrast to a previous study [16], our results suggest that changing attitudes is not the most likely barrier to exercising safe behaviors, but other factors intrinsic to farm work are more likely causing reduced compliance with optimal safety behaviors.
The SEM model result was contrary to what was expected. We hypothesized that priorities would show stronger effects on practices than the reverse. Although the model fit statistics were equally acceptable, the effect size was stronger when practices preceded priorities. Unfortunately, the sample size did not allow for the addition of covariates to this model. Intuitively, it is expected that priorities would determine practice. It is possible that in an older group of farmers, experience with injuries has reversed the direction of these effects; priorities may be based on prior experience. Possibly, the cumulative effects of unsafe behaviors with concomitant adverse outcomes create the priority for adopting the safety behavior.
In a study testing whether the TPB could be a useful model for explaining safety behavior in 283 Flemish farmers using 135 items related to TPB constructs, the CFA model did not reproduce the dimensions of TPB based on the fit indices [7]. The safety behavior items for pesticides showed an acceptable fit to the data, but the machine and fall prevention questions did not due to an elevated RMSEA. Our machine safety questions showed a better fit in a CFA, with similar results for pesticides, and the same results for fall prevention. If the priority questions are a measure of intention, we would expect to see similar results between the Flemish farmer in the machine, chemicals, and fall prevention questions and our related constructs. In the Flemish farmers, the models showed an acceptable fit, with the exception of an unacceptable RMSEA. In fact, the RMSEA was elevated for most of the constructs. In the current study, the CFA models did not converge for chemicals and fall prevention but showed a good fit for the machine questions. It does not appear to be reasonable to assume that intention and priorities are describing the same construct.
The machinery and chemicals practices questions generally showed good psychometric properties, but the building safety questions did not. It might be that the questions were not sufficiently correlated with one another to form a factor. Keeping walkways clear is, at face value, different from keeping PPE available. With the exception of PPE, the items were meant to include ways in which operators could fall, a major source of injury, but may not have been interpreted by operators similarly.
Although the EFA and CFA models did not always show a cohesive construct, the items did explain 26% to 45% of the variance in the practices construct and 52% to 58% of the variance in the priorities constructs. The alphas for reliability were also in ranges that are considered to be good for the safety priority questions. More work is needed to develop a safety scale for fall prevention and structure maintenance to measure prevention efforts targeting these types of injuries.
There is no clear evidence in the literature as to what extent safety practices need to be exercised to reduce injury. How the high frequency safety group might differ in risk from the moderate safety group is unknown. In this study, there were only 11 reported injuries and even though the low safety group had a crude injury frequency of 6.25% compared to 2.60% in the high safety group (3.06% for the moderate group), the numbers are too small to draw conclusions. This could be explained by the association of being a farm operator compared to being a rancher or running a mixed operation, which was associated with injury (p = 0.002). Neither age nor being male was statistically associated with injury. Exercising machine-related safety practices did not reduce the risk of injury in 3186 farm residents [30], but it might be a matter of how frequently the safety practices were employed, and that specific question was not asked in this study. Depending on perceived economic and time pressures, operators may not always employ safe behaviors if they feel it is in their best interest not to. Under stressful conditions, they may not recall whether they exercised a specific safety practice.
Variability was higher in questions associated with personal safety measures compared with those that were machinery specific. When assessing a situation in the decision of how to perform an activity, a farmer may calculate that the care of the tractor is a priority over personal health risks. This observation was previously reported [31]. There was also evidence that operators tended to be careless in the proper storage of chemicals and pesticides, although this was less so when farming was their primary occupation. This result might indicate a role for time pressures when operators are working off the farm or ranch, as the majority were in this study. PPE was often not used and was not available for use, which is also possibly related to the time pressure to complete a task.
In a recent report, investigators examined the association of personality factors (extraversion, openness, conscientiousness, neuroticism, agreeableness), safety attitudes (safety climate, safety motivation, and risk tolerance), and stressors (workload, work-life balance) with non-technical farming skills [13]. Non-technical skills are situational awareness, task management, and decision-making skills that are outside the farming tasks themselves. Investigators showed that situational awareness was statistically significantly associated with both neuroticism and conscientiousness, task management was associated with conscientiousness, and decision-making was associated with safety motivation and costs. Whether non-technical skills can be taught in the context of safety training is yet to be tested, and it may show effectiveness only in the presence of certain personality traits.
5. Conclusions
In summary, we found that our farm and ranch operator sample were generally in agreement about safety priorities but were in lower agreement about exercising them. Using three different methods to examine the relationship of priorities and practices, we showed that some practices, such as safe handling of chemicals, wearing PPE, and wearing a seatbelt, are uncommon, and hazardous activities involving machinery are not consistently exercised using recognized safe practices. Training programs need to reinforce the need for consistency in being safe. The reasons for non-compliance might also be reasons an injury occurs, particularly when rushing and hurrying. Additionally, we identified distinct groups of those who rarely, sometimes, and nearly always exercised safety behaviors. Certain safety practices may act as indicators of those who have a higher propensity for compliance, such as wearing a seatbelt when operating a tractor that has an ROPS. If personality traits and past experience with injuries are predictive of a greater motivation to be safe, we may not be capturing these important determinants in surveys, regardless of whether qualitative or quantitative data is collected. Concerning factors related to when safety is a priority and when it is not, future work should explore whether non-technical skills can be taught as part of every safety training program and further development of safety climate and safety motivation measures should be undertaken. The promotion of a safety culture/safety climate has been suggested as an underutilized means in agriculture to address the complex issues that lead to unsafe practices, regardless of whether they are tied to limited resources, work organization, working environments, machinery, work habits, or general attention to safety. Effective new ways of focusing on operator motivation are needed to bridge the gap between safety priorities and practices.
Author Contributions
C.L.B. contributed to the survey design, analysis, and interpretation of the data, and writing of the manuscript. C.L.B. attests to the accuracy and integrity of the reported work. R.H.R. provided expertise in survey design and wording of the survey questions, editing, and writing of the manuscript, and final approval of the submitted version. All authors have read and agreed to the published version of the manuscript.
Funding
This work was supported by the CDC/NIOSH [U54 OH010162].
Institutional Review Board Statement
This work was performed at the University of Nebraska Medical Center, Omaha NE, and was deemed exempt on March 9, 2018 by the University of Nebraska Institutional Review Board #452-11-EX due to being part of an ongoing injury surveillance system and not human subjects research.
Informed Consent Statement
Consent was explained in a cover letter to survey recipients explaining the purpose of the survey and describing confidentiality of their responses.
Data Availability Statement
Data is available upon reasonable request to the corresponding author.
Conflicts of Interest
The authors declare no conflict of interest.
References
- Bureau of Labor Statistics. Injuries, Illnesses, and Fatalities. 2021. Available online: https://www.bls.gov/iif/home.htm (accessed on 22 October 2021).
- Jadhav, R.; Achutan, C.; Haynatzk, G.; Rajaram, S.; Rautiainen, R. Risk factors for agricultural injury: A systematic review and meta-analysis. J. Agromed. 2015, 20, 434–449. [Google Scholar] [CrossRef] [PubMed]
- Jadhav, R.; Lander, L.; Achutan, C.; Haynatzki, G.; Rajaram, S.; Patel, K.; Rautiainen, R. Review and meta-analysis of emerging risk factors for agricultural injury. J. Agromed. 2016, 21, 284–297. [Google Scholar] [CrossRef] [PubMed]
- Lehtola, M.M.; Rautiainen, R.H.; Day, L.M.; Schonstein, E.; Suutarinen, J.; Salminen, S.; Verbeek, J.H. Effectiveness of interventions in preventing injuries in agriculture—A systematic review and meta-analysis. Scand. J. Work Environ. Health 2008, 34, 327–336. [Google Scholar] [CrossRef] [PubMed] [Green Version]
- Zohar, D. Safety climate in industrial organizations: Theoretical and applied implications. J. Appl. Psychol. 1980, 65, 96–102. [Google Scholar] [CrossRef] [PubMed]
- Hofmann, D.A.; Burke, M.J.; Zohar, D. 100 years of occupational safety research: From basic protections and work analysis to a multilevel view of workplace safety and risk. J. Appl. Psychol. 2017, 102, 375–388. [Google Scholar] [CrossRef] [PubMed]
- Colémont, A.; Van den Broucke, S. Measuring determinants of occupational health related behavior in Flemish farmers: An application of the Theory of Planned Behavior. J. Saf. Res. 2008, 39, 55–64. [Google Scholar] [CrossRef]
- Leppälä, J.; Griffin, P.; McNamara, J.; Rautiainen, R. (Eds.) Safety Culture and Risk Management in Agriculture: Sacurima Cost Action CA16123 Highlights and Conclusions. In Natural Resources and Bioeconomy Studies; Natural Resources Institute Finland: Helsinki, Finland, 2021; Volume 63. [Google Scholar]
- Marsh, S.M.; Fosbroke, D.E. Trends of occupational fatalities involving machines, United States, 1992–2010. Am. J. Ind. Med. 2015, 58, 1160–1173. [Google Scholar] [CrossRef]
- Swanton, A.R.; Young, T.L.; Peek-Asa, C. Characteristics of fatal agricultural injuries by production type. J. Agric. Saf. Health 2016, 22, 75–85. [Google Scholar] [CrossRef] [Green Version]
- Rautiainen, R.H.; Lange, J.L.; Hodne, C.J.; Schneiders, S.; Donham, K.J. Injuries in the Iowa Certified Safe Farm Study. J. Agric. Saf. Health 2004, 10, 51–63. [Google Scholar] [CrossRef]
- Hagel, L.; Pahwa, P.; Dosman, J.A.; Pickett, W. Economic worry and the presence of safety hazards on farms. Accid. Anal. Prev. 2013, 53, 156–160. [Google Scholar] [CrossRef]
- Irwin, A.; Poots, J. Predictors of attitudes toward non-technical skills in farming. J. Agromed. 2018, 23, 60–69. [Google Scholar] [CrossRef] [PubMed]
- Kidd, P.; Scharf, T.; Veazie, M. Linking stress and injury in the farming environment: A secondary analysis of qualitative data. Health Educ. Behav. 1996, 23, 224. [Google Scholar] [CrossRef] [PubMed]
- Lyman, S.; McGwin, G.; Enochs, R.; Roseman, J.M. History of agricultural injury among farmers in Alabama and Mississippi: Prevalence, characteristics, and associated factors. Am. J. Ind. Med. 1999, 35, 499–510. [Google Scholar] [CrossRef]
- Cole, H.P. Cognitive-behavioral approaches to farm community safety education: A conceptual analysis. J. Agric. Saf. Health 2002, 8, 145–159. [Google Scholar] [CrossRef]
- DeRoo, L.A.; Rautiainen, R.H. A systematic review of farm safety interventions. Am. J. Prev. Med. 2000, 18 (Suppl. 4), 51–62. [Google Scholar] [CrossRef]
- Nahrgang, J.D.; Morgeson, F.P.; Hofmann, D.A. Safety at work: A meta-analytic investigation of the link between job demands, job resources, burnout, engagement, and safety outcomes. J. Appl. Psychol. 2011, 96, 71–94. [Google Scholar] [CrossRef] [PubMed]
- Fishbein, M.; Ajzen, I. Belief, Attitude, Intention, and Behavior: An Introduction to Theory and Research; Addison–Wesley: Reading, MA, USA, 1975. [Google Scholar]
- Landis, J.R.; Koch, G.G. The measurement of observer agreement for categorical data. Biometrics 1977, 33, 159–174. [Google Scholar] [CrossRef] [Green Version]
- Proitsi, P.; Hamilton, G.; Tsolaki, M.; Lupton, M.; Daniilidou, M.; Hollingworth, P.; Archer, N.; Foy, C.; Stylios, F.; McGuinness, B.; et al. A multiple indicators multiple causes (MIMIC) model of behavioural and psychological symptoms in dementia (BPSD). Neurobiol. Aging 2011, 32, 434–442. [Google Scholar] [CrossRef]
- Hu, L.T.; Bentler, P.M. Cutoff criteria for fit indexes in covariance structure analysis: Conventional criteria versus new alternatives. Struct. Equ. Model. 1999, 6, 1–55. [Google Scholar] [CrossRef]
- Akogul, S.; Erisoglu, M. A comparison of information criteria in clustering based on mixture of multivariate normal distributions. Math. Comput. Appl. 2016, 21, 34. [Google Scholar] [CrossRef] [Green Version]
- Akogul, S.; Erisoglu, M. An approach for determining the number of clusters in a model-based cluster analysis. Entropy 2017, 19, 452. [Google Scholar] [CrossRef] [Green Version]
- Ramaswamy, V.; DeSarbo, W.S.; Reibstein, D.J.; Robinson, W.T. An empirical pooling approach for estimating marketing mix elasticities with PIMS data. Mark. Sci. 1993, 12, 103–124. [Google Scholar] [CrossRef]
- Cheng, Y.H.; Nur, M.; Field, B.; Ambrose, K.; Sheldon, E. 2020 Summary of U.S. Agricultural Confined Space-Related Injuries and Fatalities; Agricultural Safety and Health Program, Purdue University: West Lafayette, IN, USA, 2020; Available online: https://s3-us-west-2.amazonaws.com/grainnetcom/uploads/pdf/2020-Ag-CS-summary.pdf (accessed on 20 October 2021).
- Irwin, A.; Poots, J. Investigation of UK farmer Go/No-Go decisions in response to tractor-based risk scenarios. J. Agromed. 2018, 23, 154–165. [Google Scholar] [CrossRef] [PubMed]
- Lewis, M.Q.; Sprince, N.L.; Burmeister, L.F.; Whitten, P.S.; Torner, J.C.; Zwerling, C. Work-related injuries among Iowa farm operators: An analysis of the Iowa farm family health and hazard surveillance project. Am. J. Ind. Med. 1998, 33, 510–517. [Google Scholar] [CrossRef]
- Murphy, D.J.; Kiernan, N.E.; Chapman, L.J. An occupational health and safety intervention research agenda for production agriculture: Does safety education work? Am. J. Ind. Med. 1996, 29, 392–396. [Google Scholar] [CrossRef]
- Layde, P.M.; Nordstrom, D.L.; Stueland, D.; Brand, L.; Olson, K.A. Machine-related occupational injuries in farm residents. Ann. Epidemiol. 1995, 5, 419–426. [Google Scholar] [CrossRef]
- Sorensen, J.A.; Tinc, P.J.; Weil, R.; Droullard, D. Symbolic Interactionism: A framework for understanding risk taking behaviors in farm communities. J. Agromed. 2017, 22, 26–35. [Google Scholar] [CrossRef]
Figure 1.
Kappa for agreement (95% confidence intervals) between 15 safety practices and 15 safety priorities in farm and ranch operators in 7 Midwest states, 2021. (Kappa statistic in red; blue bars represent 95% confidence interval).
Figure 1.
Kappa for agreement (95% confidence intervals) between 15 safety practices and 15 safety priorities in farm and ranch operators in 7 Midwest states, 2021. (Kappa statistic in red; blue bars represent 95% confidence interval).

Figure 2.
Structural equation model of machinery safety practices predicting safety priorities in 326 farm and ranch operators in 7 Midwest states, 2021.
Figure 2.
Structural equation model of machinery safety practices predicting safety priorities in 326 farm and ranch operators in 7 Midwest states, 2021.

Figure 3.
Self-reported compliance with 15 safety practices in low, moderate, and high safety level groups in 326 farm and ranch operators in 7 Midwest states, 2021.
Figure 3.
Self-reported compliance with 15 safety practices in low, moderate, and high safety level groups in 326 farm and ranch operators in 7 Midwest states, 2021.


Table 1.
Demographic and farm/ranch operator characteristics in 326 respondents from 7 central states in the United States, 2021.
Table 1.
Demographic and farm/ranch operator characteristics in 326 respondents from 7 central states in the United States, 2021.
| Demographic or Operation Characteristic | n (%) |
|---|---|
| Gender | |
| Female | 116 (35.6) |
| Male | 210 (64.4) |
| Type of Operation | |
| Farm | 246 (75.4) |
| Ranch | 38 (11.7) |
| Both | 39 (12.0) |
| Missing | 3 (0.9) |
| Role in the farm/ranch operation | |
| Owner/spouse/family member | 323 (99.1) |
| Non-family manager/employee | 3 (0.9) |
| Majority (≥50%) of your worktime doing farm/ranch work or some other occupation? | |
| Farm/ranch work | 113 (34.7) |
| Other occupation | 192 (58.9) |
| Missing | 21 (6.4) |
| Percentage of time spent working on the farm/ranch | |
| 100% | 33 (10.1) |
| 75–99% | 37 (11.3) |
| 50–74% | 36 (11.0) |
| 25–49% | 59 (18.1) |
| 0–24% | 155 (47.6) |
| Missing | 6 (1.8) |
| Paid workers on farm/ranch | |
| Yes | 36 (11.0) |
| No | 288 (88.3) |
| Missing | 2 (0.6) |
| How many farm-related injuries did you have during 2020? | |
| None | 311 (95.4) |
| One | 9 (2.8) |
| Two | 1 (0.3) |
| Three or more | 1 (0.3) |
| Missing | 4 (1.2) |
| Work time lost as a result of most serious injury | |
| None | 65 (19.9) |
| <1 day | 4 (1.2) |
| 2–6 days | 3 (0.9) |
| 7–29 days | 2 (0.6) |
| 30 or more days | 2 (0.6) |
| Missing/uninjured | 250 (76.7) |
| Health conditions that could be related to work (% positive for each disorder) | |
| Respiratory disease | 20 (6.1) |
| Hearing loss | 82 (25.1) |
| Skin disease | 23 (7.1) |
| Stress, anxiety, or depression | 60 (18.4) |
| Musculoskeletal pain or discomfort | 81 (23.1) |
Table 2.
Means and standard deviations (SDs) of self-reported safety practices * on farm or ranch operations in the central states region of the US, 2021.
Table 2.
Means and standard deviations (SDs) of self-reported safety practices * on farm or ranch operations in the central states region of the US, 2021.
| Indicator of Safety Practice | n | Mean (SD) |
|---|---|---|
| Machinery-Related Safety Practices | ||
| Before using a new machine, I read the safety instructions in the manual. | 265 | 3.50 (1.13) |
| I work with tractors and PTO driven implements even if PTO shields are missing. | 249 | 2.20 (1.19) |
| I wear the seatbelt in a tractor that has a cab or a roll bar (ROPS). | 231 | 2.16 (1.37) |
| Before going on a road, I check the lighting and marking features on the equipment. | 233 | 3.74 (1.19) |
| I wear hearing protection (ear muffs or plugs) when operating noisy machinery. | 274 | 3.03 (1.36) |
| Chemical- and Pesticide-Related Safety Practices | ||
| I consider safety as an important factor when choosing a pesticide product. | 247 | 4.13 (0.96) |
| I store pesticides in a separate, marked, and locked storage room. | 229 | 2.72 (1.48) |
| I keep Safety Data Sheets readily available for all pesticides on the farm/ranch. | 217 | 2.73 (1.54) |
| I read the label and use all recommended protective gear when applying pesticides. | 239 | 3.82 (1.14) |
| I use hand sanitizers to reduce the risk of contracting the coronavirus. | 274 | 3.84 (1.28) |
| Building- and Structure-Related Safety Practices | ||
| I keep walkways and work areas clear of spills, tools, and clutter. | 293 | 4.15 (0.74) |
| I hold tools or materials in my hands when climbing a ladder. | 281 | 2.75 (0.91) |
| I store personal protective equipment ready for use in dusty or noisy worksites. | 254 | 3.28 (1.18) |
| If grain stops flowing, I will enter the bin to unclog it even if working alone. | 144 | 1.27 (0.79) |
| I take small children (including visitors) to worksites so they learn work skills early. | 194 | 2.04 (1.10) |
* 1 = Never, 2 = Rarely, 3 = Sometimes, 4 = Most of the time, 5 = All of the time.
Table 3.
Exploratory factor analysis (EFA) and model fit measures for each set of questions related to safety practices in farm and ranch operators in the central states region of the US, 2021.
Table 3.
Exploratory factor analysis (EFA) and model fit measures for each set of questions related to safety practices in farm and ranch operators in the central states region of the US, 2021.
| Indicator of Safety Practice | EFA |
|---|---|
| Machinery-Related Safety Practices | |
| Before using a new machine, I read the safety instructions in the manual. | 0.63 |
| I work with tractors and PTO driven implements even if PTO shields are missing. | 0.37 |
| I wear the seatbelt in a tractor that has a cab or a roll bar (ROPS). | 0.81 |
| Before going on a road, I check the lighting and marking features on the equipment. | 0.69 |
| I wear hearing protection (ear muffs or plugs) when operating noisy machinery. | 0.5 |
| Model Fit statistics: | |
| Proportion of variance explained | 0.38 |
| Chi-square statistic for model fit (p-value) | 6.72 (0.10) |
| Tucker–Lewis index | 0.97 |
| RMSEA (95% confidence interval) | 0.05 (0, 0.11) |
| Alpha for reliability (95% confidence interval) | 0.67 (0.61, 0.72) |
| Chemical- and Pesticide-Related Safety Practices | |
| I consider safety as an important factor when choosing a pesticide product. | 0.69 |
| I store pesticides in a separate, marked, and locked storage room. | 0.64 |
| I keep Safety Data Sheets readily available for all pesticides on the farm/ranch. | 0.76 |
| I read the label and use all recommended protective gear when applying pesticides. | 0.79 |
| I use hand sanitizers to reduce the risk of contracting the coronavirus. | 0.41 |
| Model Fit statistics: | |
| Proportion of variance explained | 0.45 |
| Chi-square statistic for model fit (p-value) | 15.0 (<0.0001) |
| Tucker–Lewis index | 0.88 |
| RMSEA (95% confidence interval) | 0.13 (0.08, 0.18) |
| Alpha for reliability (95% confidence interval) | 0.72 (0.67, 0.76) |
| Building- and Structure-Related Safety Practices | |
| I keep walkways and work areas clear of spills, tools, and clutter. | 0.93 |
| I hold tools or materials in my hands when climbing a ladder. | 0.25 |
| I store personal protective equipment ready for use in dusty or noisy worksites. | 0.39 |
| If grain stops flowing, I will enter the bin to unclog it even if working alone. | 0.44 |
| I take small children (incl. visitors) to worksites so they learn work skills early. | 0.16 |
| Model Fit statistics: | |
| Proportion of variance explained | 0.26 |
| Chi-square statistic for model fit (p-value) | 36 (<0.0001) |
| Tucker–Lewis index | 0.47 |
| RMSEA (95% confidence interval) | 0.17 (0.12, 0.22) |
| Alpha for reliability (95% confidence interval) | 0.39 (0.29, 0.50) |
Table 4.
Mean and standard deviation (SD) of self-reported safety priorities * on farm or ranch operations in the central states region of the US, 2020.
Table 4.
Mean and standard deviation (SD) of self-reported safety priorities * on farm or ranch operations in the central states region of the US, 2020.
| Indicator of Safety Priority | n | Mean (SD) |
|---|---|---|
| Machinery-Related Safety Priorities | ||
| I find safety instructions in operator’s manuals informative and useful. | 303 | 3.94 (0.85) |
| It is too risky to work around unguarded PTOs, even for a short period. | 299 | 4.10 (0.94) |
| Like cars and trucks, wearing a seatbelt is important in a tractor as well. | 279 | 3.51 (1.09) |
| Good lighting and marking is critical to avoid roadway collisions. | 297 | 4.41 (0.73) |
| One should not operate noisy machinery without hearing protection. | 307 | 4.06 (0.85) |
| Chemical- and Pesticide-Related Safety Priorities | ||
| If a pesticide has serious health concerns, it is better to choose a different product. | 292 | 4.08 (0.87) |
| Separate, marked, and locked storage reduces the risk of pesticide exposure. | 284 | 4.00 (0.83) |
| Safety Data Sheets contain information that every pesticide applicator should know. | 291 | 4.14 (0.74) |
| If the label recommends specific PPE, it is important to wear them. | 295 | 4.19 (0.76) |
| Hand sanitizers reduce the risk of contracting the coronavirus. | 304 | 3.91 (1.12) |
| Building- and Structure-Related Safety Priorities | ||
| Good housekeeping is very effective in reducing slips, trips, and falls. | 318 | 4.36 (0.64) |
| It is better not to carry materials when climbing ladders, even if it saves time. | 318 | 3.97 (0.88) |
| Storing PPE at hazardous work sites makes it easier to use them when needed. | 296 | 4.05 (0.83) |
| One should not enter a grain bin without proper confined space entry procedures. | 272 | 4.50 (0.70) |
| Having safe play areas for small children is better than taking them to worksites. | 301 | 4.24 (0.96) |
* 1 = Strongly disagree, 2 = Disagree, 3 = Neither disagree nor agree, 4 = Agree, 5 = Strongly agree.
Table 5.
Exploratory analysis for each of set of questions related to safety priorities in farm and ranch operators in the central states region of the US, 2021.
Table 5.
Exploratory analysis for each of set of questions related to safety priorities in farm and ranch operators in the central states region of the US, 2021.
| Indicator of Safety Priority | EFA |
|---|---|
| Machinery-Related Safety Priorities | |
| I find safety instructions in operator’s manuals informative and useful. | 0.73 |
| It is too risky to work around unguarded PTOs, even for a short period. | 0.71 |
| Like cars and trucks, wearing a seatbelt is important in a tractor as well. | 0.74 |
| Good lighting and marking is critical to avoid roadway collisions. | 0.72 |
| One should not operate noisy machinery without hearing | 0.71 |
| protection. | |
| Model Fit statistics: | |
| Proportion of variance explained | 0.52 |
| Chi-square statistic for model fit (p-value) | 7.13 (p = 0.003) |
| Tucker–Lewis index | 0.96 |
| RMSEA (95% confidence interval) | 0.09 (0.04, 0.14) |
| Alpha for reliability (95% confidence interval) | 0.79 (0.75, 0.83) |
| Chemical- and Pesticide-Related Safety Priorities | |
| If a pesticide has serious health concerns, it is better to choose a different product. | 0.68 |
| Separate, marked, and locked storage reduces the risk of pesticide exposure. | 0.71 |
| Safety Data Sheets contain information that every pesticide applicator should know. | 0.89 |
| If the label recommends specific PPE, it is important to wear them. | 0.92 |
| Hand sanitizers reduce the risk of contracting the coronavirus. | 0.47 |
| Model Fit statistics: | |
| Proportion of variance explained | 0.56 |
| Chi-square statistic for model fit (p-value) | 3.37 (0.08) |
| Tucker–Lewis index | 0.99 |
| RMSEA (95% confidence interval) | 0.06 (0, 0.11) |
| Alpha for reliability (95% confidence interval) | 0.78 (0.74, 0.82) |
| Building- and Structure-Related Safety Priorities | |
| Good housekeeping is very effective in reducing slips, trips, and falls. | 0.77 |
| It is better not to carry materials when climbing ladders, even if it saves time. | 0.79 |
| Storing PPE at hazardous work sites makes it easier to use them when needed. | 0.66 |
| One should not enter a grain bin without proper confined space entry procedures. | 0.84 |
| Having safe play areas for small children is better than taking them to worksites. | 0.74 |
| Model Fit statistics: | |
| Proportion of variance explained | 0.58 |
| Chi-square statistic for model fit (p-value) | 21 (p < 0.0001) |
| Tucker–Lewis index | 0.86 |
| RMSEA (95% confidence interval) | 0.19 (0.14, 0.24) |
| Alpha for reliability (95% confidence interval) | 0.81 (0.77, 0.84) |
Publisher’s Note: MDPI stays neutral with regard to jurisdictional claims in published maps and institutional affiliations. |
© 2022 by the authors. Licensee MDPI, Basel, Switzerland. This article is an open access article distributed under the terms and conditions of the Creative Commons Attribution (CC BY) license (https://creativecommons.org/licenses/by/4.0/).
Share and Cite
MDPI and ACS Style
Beseler, C.L.; Rautiainen, R.H. Lack of Agreement between Safety Priorities and Practices in Agricultural Operators: A Challenge for Injury Prevention. Safety 2022, 8, 39. https://0-doi-org.brum.beds.ac.uk/10.3390/safety8020039
AMA Style
Beseler CL, Rautiainen RH. Lack of Agreement between Safety Priorities and Practices in Agricultural Operators: A Challenge for Injury Prevention. Safety. 2022; 8(2):39. https://0-doi-org.brum.beds.ac.uk/10.3390/safety8020039
Chicago/Turabian StyleBeseler, Cheryl L., and Risto H. Rautiainen. 2022. "Lack of Agreement between Safety Priorities and Practices in Agricultural Operators: A Challenge for Injury Prevention" Safety 8, no. 2: 39. https://0-doi-org.brum.beds.ac.uk/10.3390/safety8020039
Note that from the first issue of 2016, this journal uses article numbers instead of page numbers. See further details here.