Gender Inequalities and Sex-Differential Mortality in Pre-War Greece: A Regional Perspective


1
Department of Geography, University of the Aegean, 81132 Mytilene, Greece
2
National Centre for Social Research, Institute of Social Research, 10551 Athina, Greece
*
Author to whom correspondence should be addressed.
Genealogy 2022, 6(1), 5; https://0-doi-org.brum.beds.ac.uk/10.3390/genealogy6010005
Submission received: 13 October 2021
/
Revised: 24 December 2021
/
Accepted: 27 December 2021
/
Published: 4 January 2022
(This article belongs to the Special Issue The History of Family in Late Modern and Contemporary Europe through the Eyes of Historical Demography)
Abstract
:Previous studies have indicated gender-based discriminatory practices as a result of son preference up to the first half of the 20th century in Greece. Demographic indices calculated from published vital statistics, such as sex ratios at birth and at childhood, were distorted to such an extent that certain scholars suggest that this distortion was due to sex-selective infanticide and neglect of the girls. Although we cannot exclude this possibility, the aim of this paper is to assess to what extent under-registration of female births (in the civil registration system) and under-enumeration of females (in censuses) accounted for the skewed sex ratios and to pinpoint that gender-based discrimination was not the same all over Greece. There were areas in insular Greece, notably the Ionian islands and the Aegean Archipelago, and one area in mainland Greece (Epirus) where demographic indices imply that gender inequalities were less acute. On the other hand, there were areas in mainland Greece, notably in Thessaly, where sex-differential mortality denotes extremely unequal treatment of girls.
1. Introduction
“A man must marry in order to have legitimate offspring to continue his estate and his cult, and to provide that worship necessary to the peace of the spirit which survived his death”. The above excerpt from the Roman Law of Marriage (Corbett 1930, p. 107) describes in the most eloquent way the object of marriage and its most important function, which was procreation, not only in the Roman society but in most past societies of the pre-transitional era. Additionally, in a patrilineal kinship system, an offspring that could perpetuate the family name and function as a legitimate heir of the family could be no other than a boy. The preference of sons has led to discriminatory practices that are still visible even today, not only in the social sphere but in the age and sex structure of populations. The unnaturally virile sex ratios in the two most populous countries of the world, China and India, are examples of discriminatory practices that leave their footprint on demographic indices since the 1980s (Yi et al. 1993; UNFPA 2011; Sahni et al. 2008).
As far as Greece is concerned demographic studies have indicated that gender-based discriminatory practices as a result of son preference existed at least up to the first half of the 20th century (Beltrán Tapia and Raftakis 2021; Gavalas 2015). In fact, demographic indices such as sex ratio at birth and at childhood are so skewed that some demographers are certain that this skewness is due to sex-selective infanticide and neglect of the female children (Beltrán Tapia and Raftakis 2021). Although one cannot exclude this possibility, the aim of this paper is twofold:
- (1)
- to assess the probability that the skewed sex ratio was partly attributable to under-registration of female births (in the civil registration system) and under-enumeration of females (in censuses).
- (2)
- to pinpoint that gender-based discrimination was not the same all over Greece. Regional differences on this issue were so big in the period before WWII that one could hardly believe that the ten Geographical Departments of Greece belonged to the same country.
Another way to investigate whether preferential treatment of sons was in place is by recording differentials in literacy status. A gender gap in education implies gender inequalities in every aspect of social and economic life. This relationship has been established bibliographically, especially for present-day developing countries (Sarmah and Hazarika 2015; Jütting et al. 2008). It would be interesting to examine if there is an association between sex differential mortality and sex differential literacy status in Greece in the 1920s. The hypothesis is that gender inequalities in literacy status may be a proximate determinant of the excess mortality of the less privileged sex.
It is known from the relevant literature that girls were discriminated as far as education issues are concerned, not by law but by the traditional familial mentality. Primary education (six-year attendance) became compulsory in Greece in 1913 for both sexes. However, the rate of school enrollment of girls was much lower than that of boys because in folk culture to educate a girl was an unnecessary and perilous luxury (Saliba 2002, p. 210). Some of the stereotypical notions of that era were that literacy was useful to women only to facilitate the exchange of love letters and that women had already “raised their head” too much and there was no need for them to obtain more arrogance by going to school (Theodoropoulou 1916, pp. 9–11).
In a like manner women were discriminated against in the work environment by earning smaller wages than their male counterparts for the same job, by being excluded from certain professions and by being dismissed if they were married (Pahi 2013; Papastefanaki 2019).
In this research work we make use of the 1928 census of Greece (Statistique Générale de la Grèce 1933), which is less gender-biased than previous censuses, to derive regional life tables by sex for the ten Geographical departments and, based on the sex-differential mortality and sex-differential literacy status in each Geographical Department, to pinpoint that gender-based discrimination was not the same all over Greece.
2. Materials and Methods
The first research question of this paper, that is whether under-registration and under-enumeration of females were partially responsible for the skewed sex ratios in Greece during the 1920s, will be answered by a critical review of the existing data of that era, that is the census returns and the published vital statistics. The level of under-registration of births will be assessed by comparing the registered number of births with estimates derived by Valaoras (1960).1
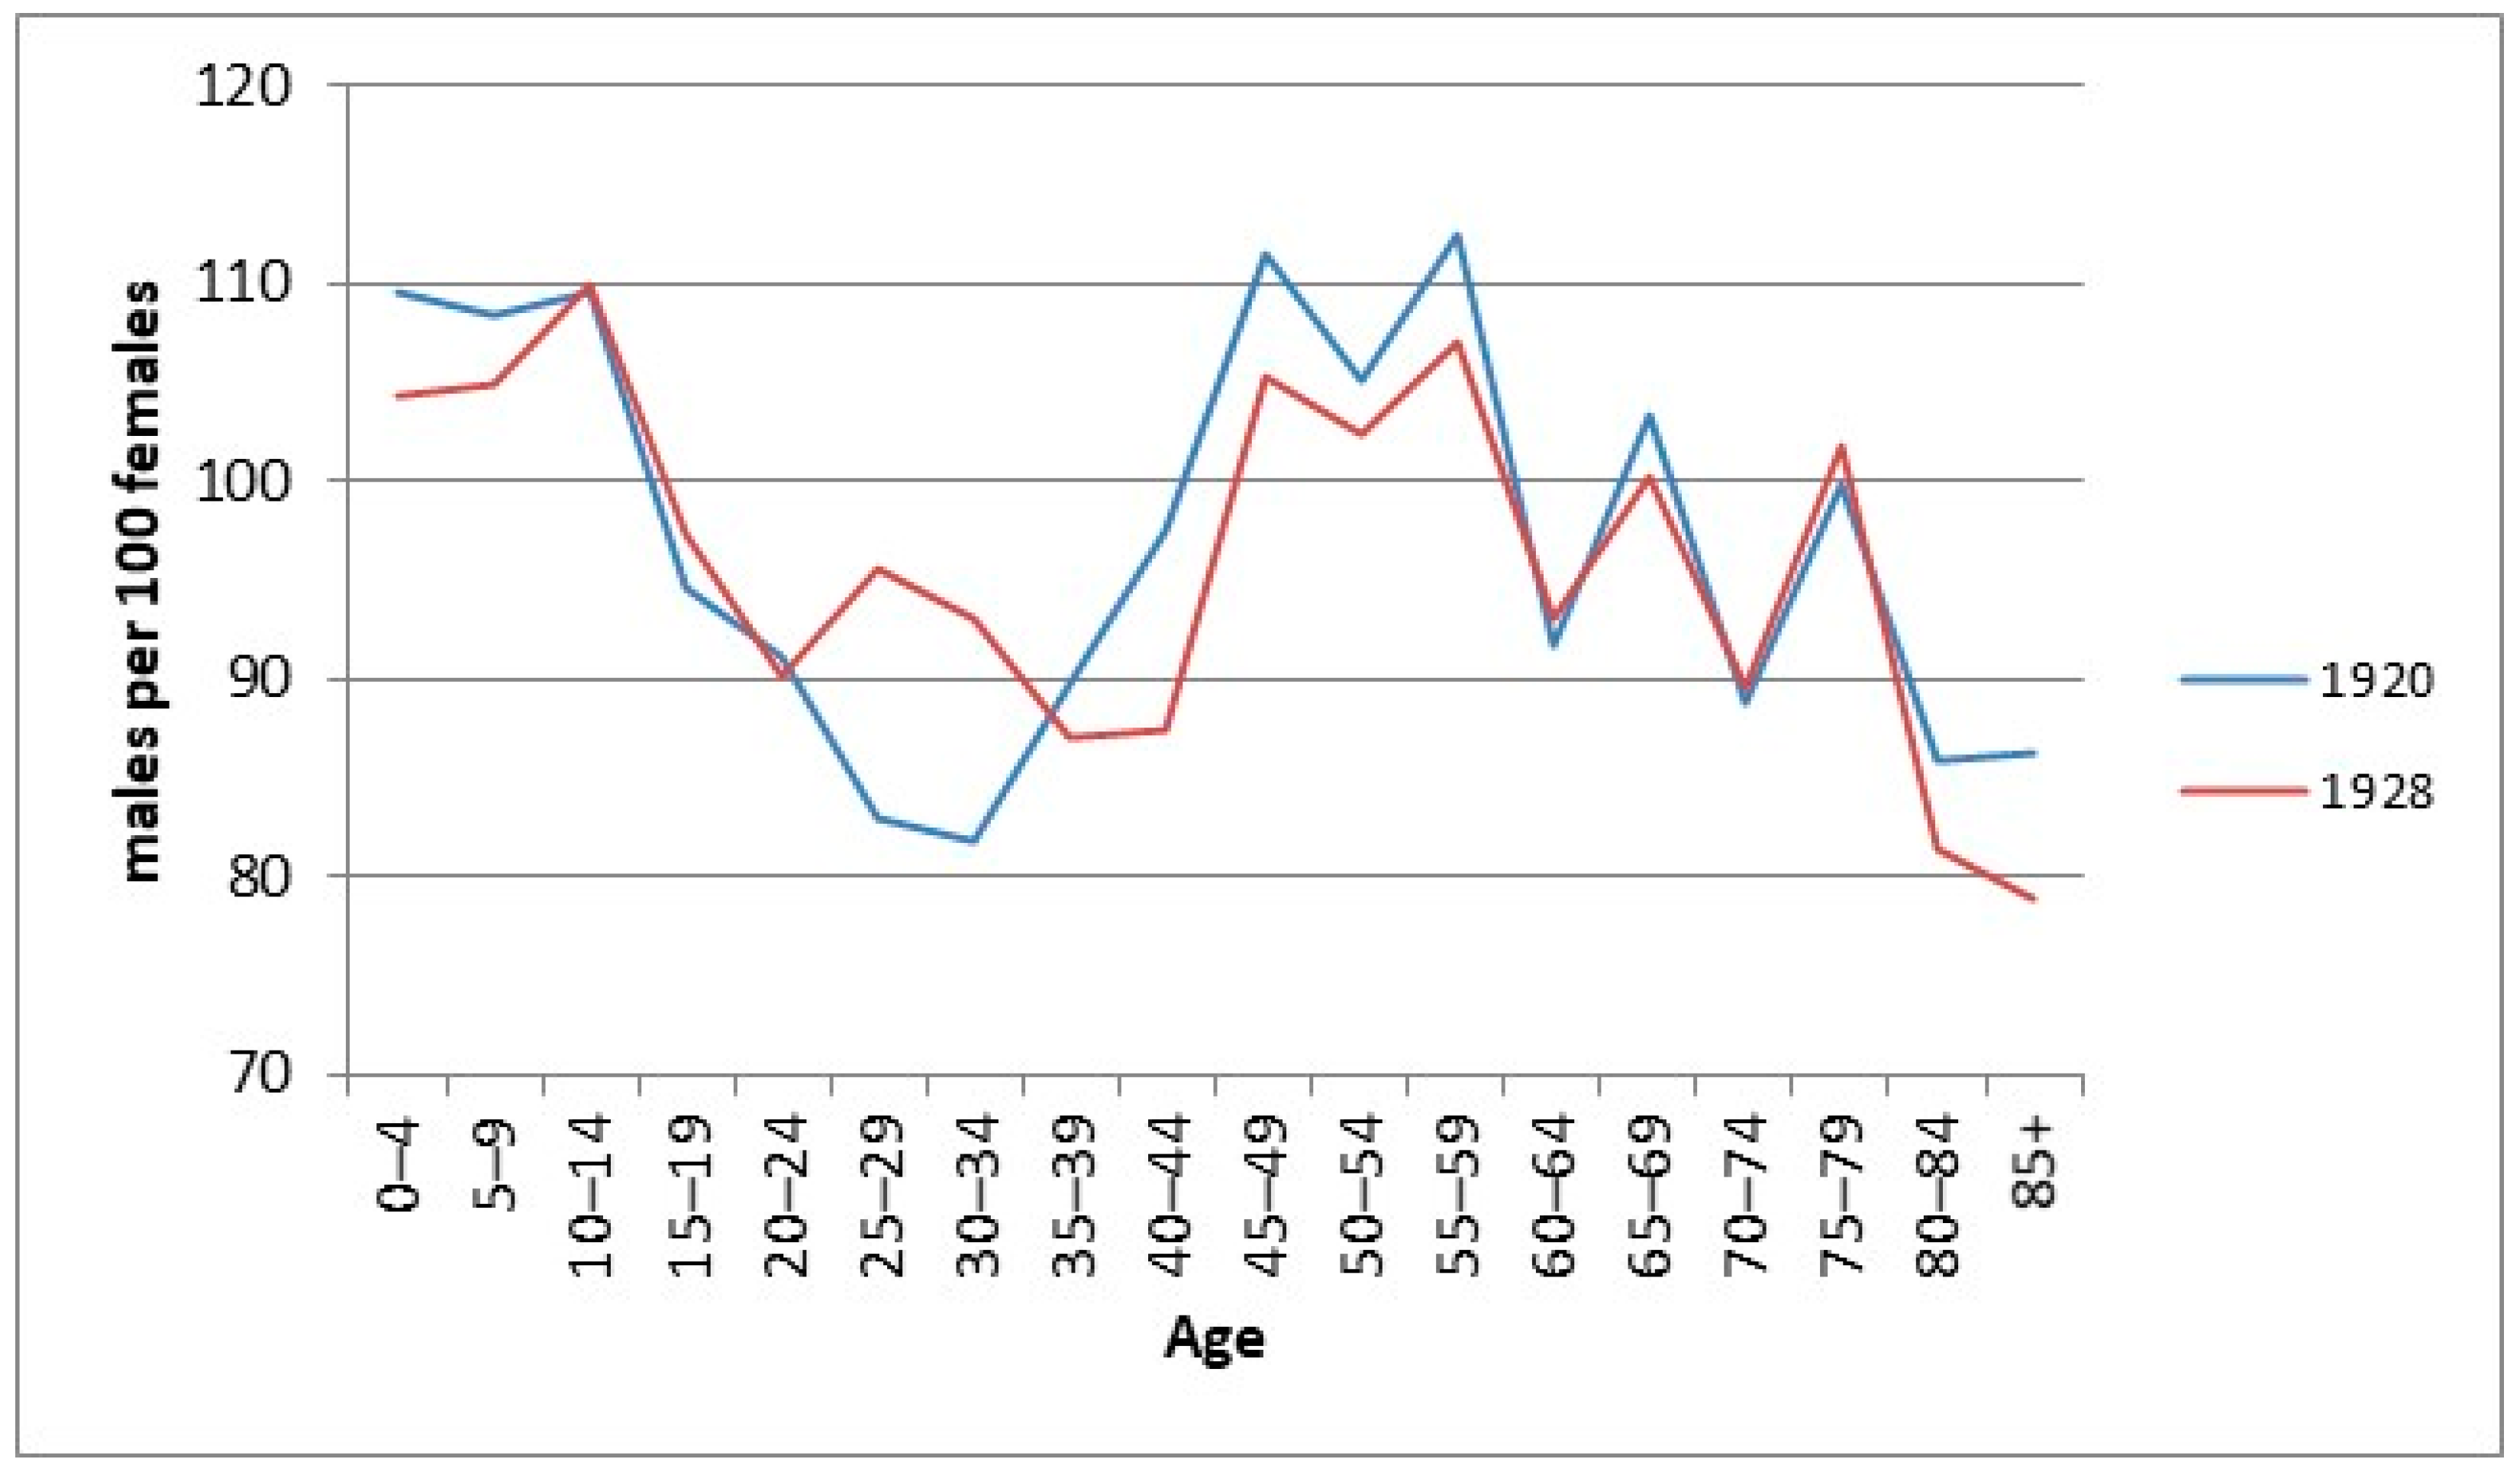
To answer the second research question, that is whether gender-inequalities presented a geographical variation within Greece, one can compare the mortality of females and males by age, and, if possible, the life expectancy of the two sexes by age. Yet, derivation of life tables for Greece in the pre-WWII period, based on published statistics (census returns and the registered deaths by age), is impeded by the poor quality of the civil registration and of the census returns as well. Figure 1 shows a very skewed sex ratio by age in the 1920 and 1928 census-returns. In the ages 0–4 there were 109.5 boys per 100 girls in 1920, a ratio higher than normally expected. In 1928 this ratio was normal (104.4) but it rose abruptly at the ages 10–14 (110 males per 100 females). The skewed sex ratio at the ages 10–14 could be either due to under-enumeration of girls or due to a lack of girls at these ages or due to age misreporting. On the other hand, there is a dearth of males in the ages 15 to 44. These were the main ages that military conscripts were drafted (as far as males are concerned) and it is possible that in the 1928 census (as well as in that of 1920) this dearth of males is justified by the historical context. Greece in the 1920s was exiting a series of wars (Balkan wars in 1912–1913, WW1 in 1914–1918, Asia Minor campaign in 1919–1922) and it is plausible that many young men tried to avoid military service for the fear of being sent to a new war (Siampos 1973, p. 57; Gavalas 2015, pp. 41–42). The avoidance of declaring ages between 15–44 may explain the excess of males in the adjacent age-groups 10–14 and 45–49. The erratic fluctuation of sex ratio from ages 45 onwards may be due to a tendency of women to round their ages in multiples of 10 (50, 60, 70 etc.) and, therefore, there are relatively more females in the age-groups 50–54, 60–64 etc., and relatively more males in the age-groups 45–49, 55–59, 65–69 etc. in both 1920 and 1928 census-returns.
Another issue that impedes the derivation of life tables from official statistics is the under-registration of deaths, which mainly affected infants (Hionidou 1993, p.57). It is likely that some infant deaths were not registered at all or (more frequently) infants aged close to 12 months (11, or 10 months) at the time of death had been reported as being one-year-old. This pattern of age misreporting would have resulted in registering fewer infant deaths and more toddler deaths (age-group 1–4) than the real ones. Moreover, under-registration of deaths was not occurring to the same degree in all Geographical Departments, but the different quality of death registration from one Department to another cannot be assessed. However, mortality patterns of populations by age and mortality level have been thoroughly studied and have been published in the form of model life tables (UN 1982; Coale et al. 1983).
Therefore, we decided to derive life tables for Greece and its ten Geographical Departments in 1928, based on the UN General model life tables (UN 1982). All life tables are based on predicted nqx values. Prediction is grounded on extrapolating the observed 5q5, 5q10, 5q50 and 5q70 values according to the UN General model life table pattern. The initial four observed nqx values were obtained by deriving life tables based on the observed nmx values, as these values were calculated from civil registers and census-returns (nmx = ndx/nPx). The predicted values (both nmx and nqx and the resultant ex), which are presented on Appendix A, are different from the observed ones since they conform to the model life table pattern. The software MORTPAK 4.3 (application BESTFT) was used for the derivation of the life tables.
The rationale behind the selection of these age-groups (5–9, 10–14, 50–54, 70–74) is that we consider them to be less prone to under-registration of deaths (in civil registers) and to under-enumeration (in censuses). As mentioned above, ages below 5 are affected by the under-registration and age-misreporting of infants. In ages 15–44 there was an artificial lack of males, the cause of which was also reported above. Therefore, we chose two age-groups after toddler-ship (5–9 and 10–14) and two age-groups after the military service drafting (50–54 and 70–74). These ages present a more plausible sex ratio, and presumably people of both sexes were registered more completely in those ages.
The reader should keep in mind that the primary purpose of the life tables in Appendix A is to compare sex differences in mortality at a regional level in Greece in 1928. Their accuracy is disputable (especially since the model life table that they were based upon, the so-called general model, is not specific to Greece). Yet, they were derived with the same methodology for every Geographical Department and, therefore, we consider them to be suitable for comparison among the ten regions that are referred to as “Geographical Departments” in 1928. For Greece there are more accurate life tables in the bibliography that are based on age-smoothing the census data and on correcting the under-registration of deaths (Siampos 1993, p. 472). However, those life tables concern only Greece as a whole and not its Geographical Departments.
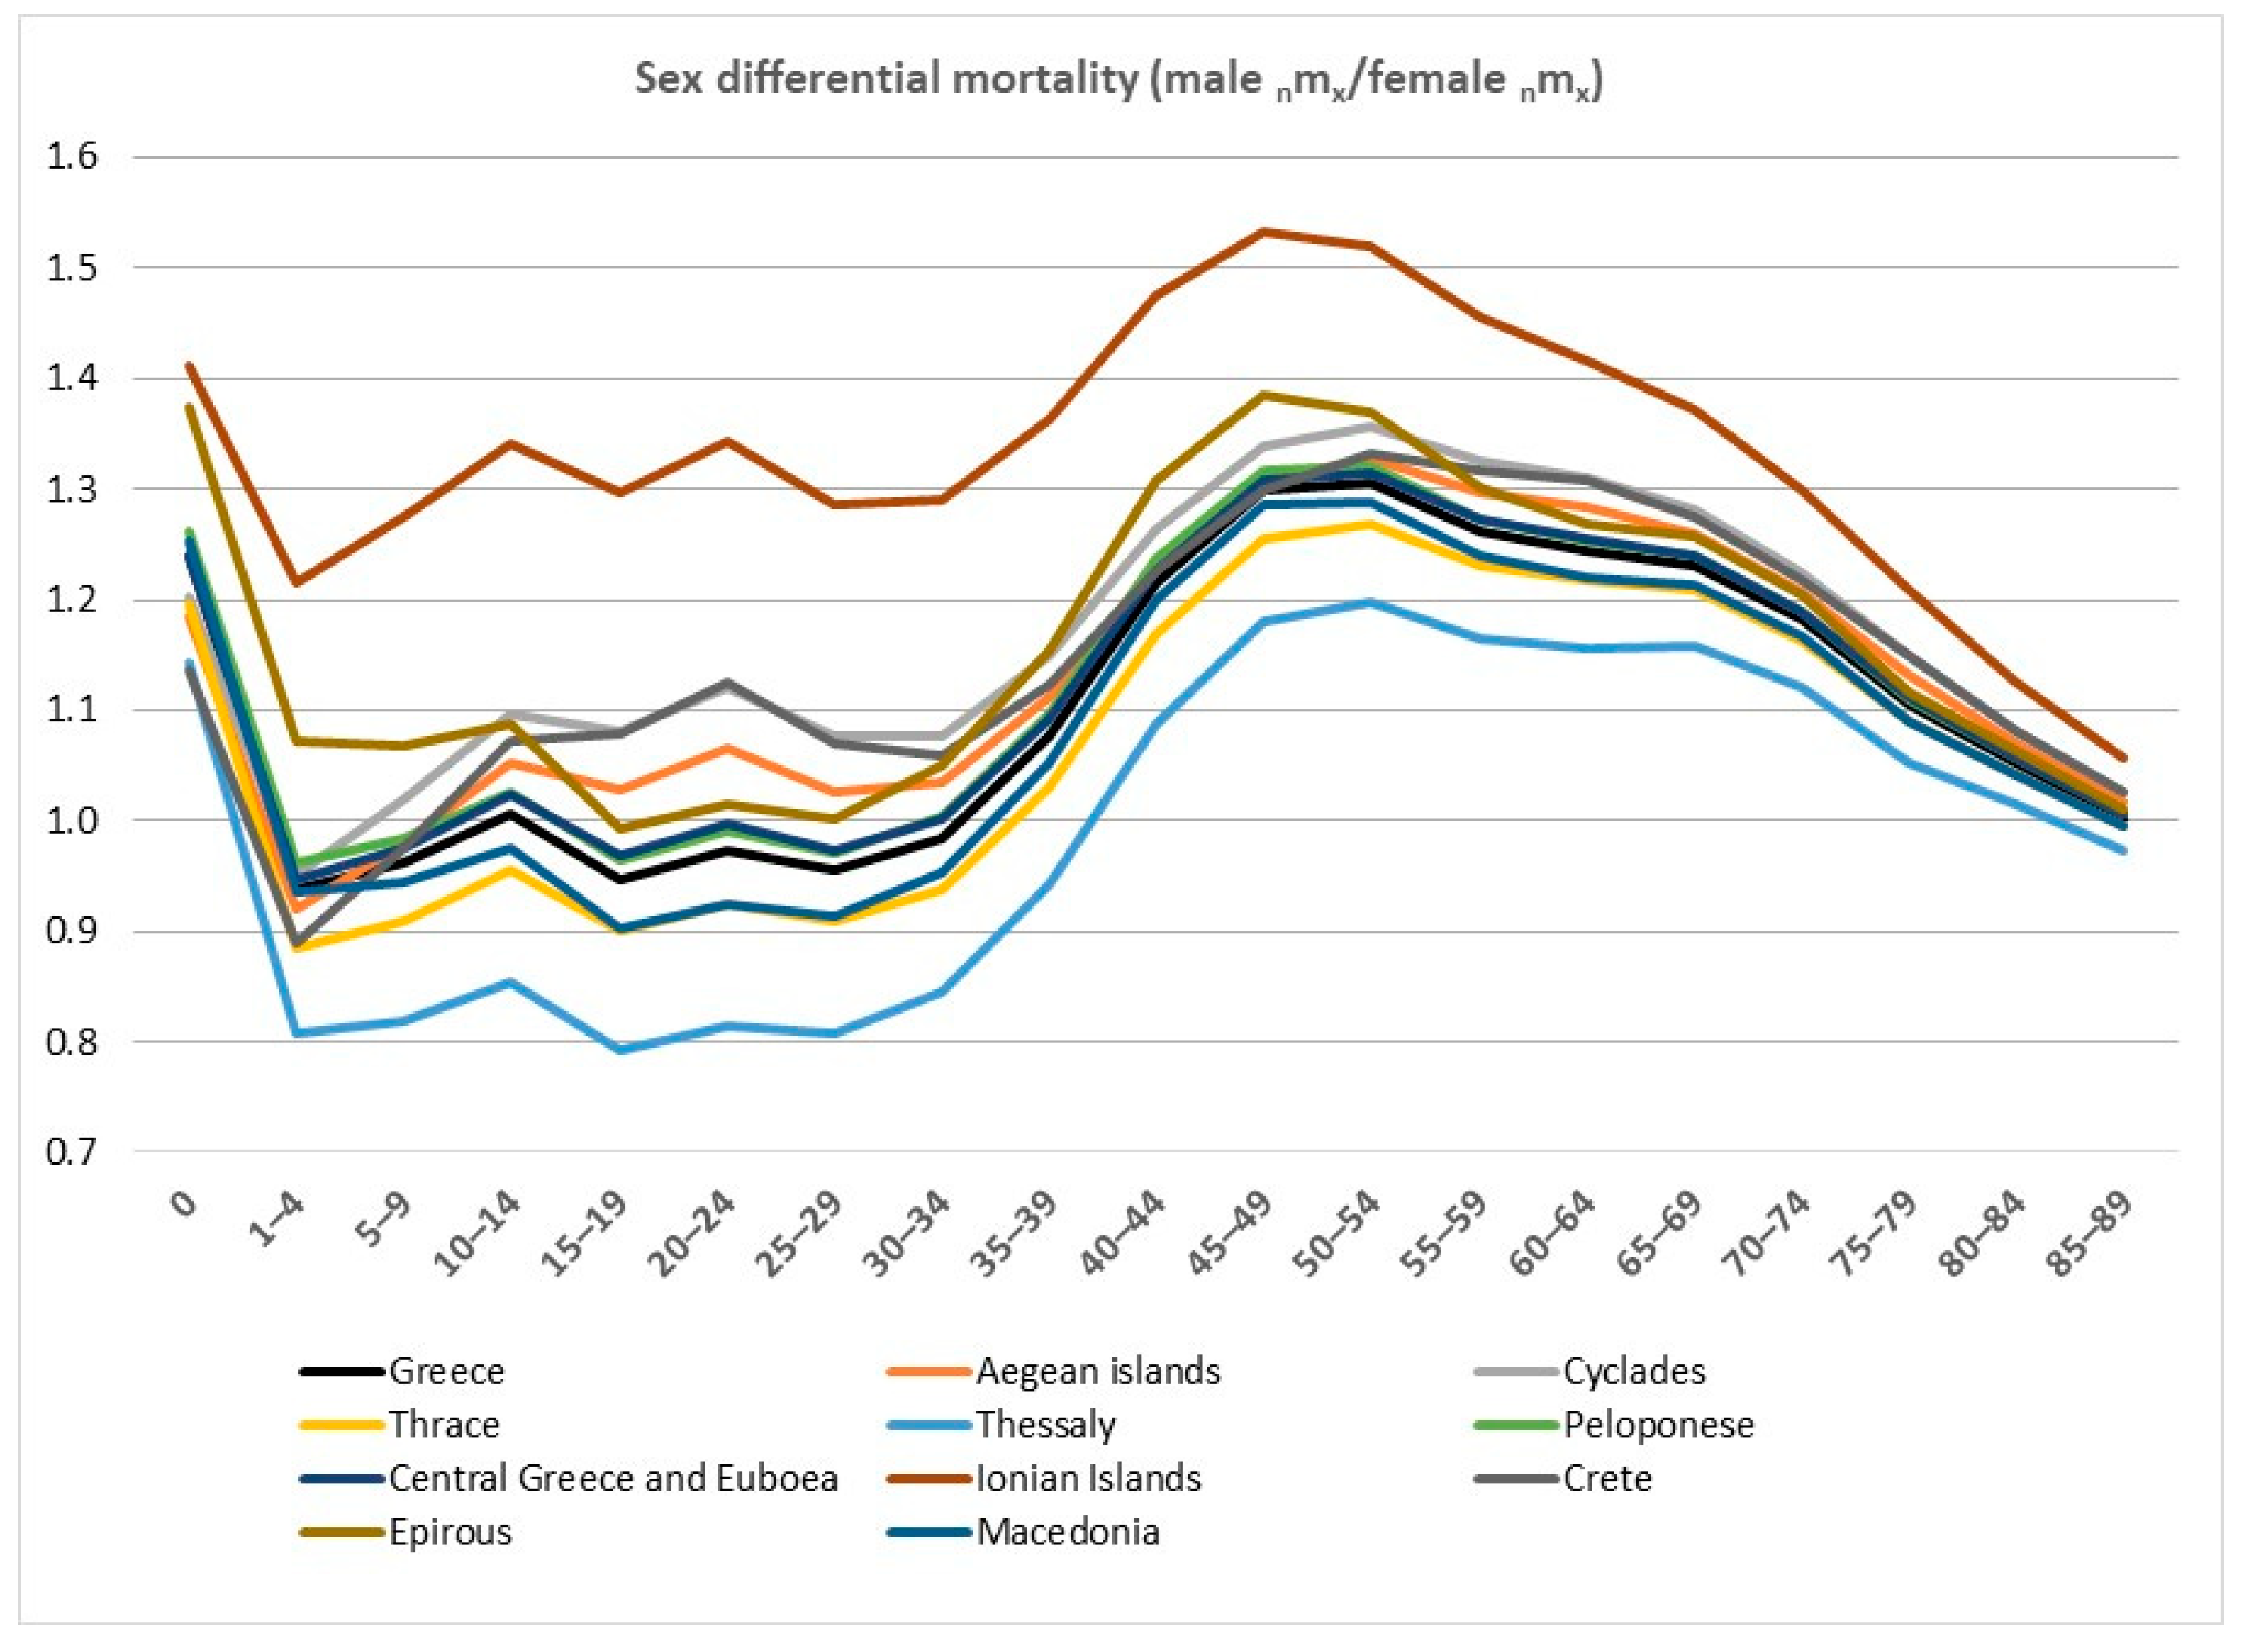
To assess the extent of gender inequalities, we calculated the ratio of male age-specific mortality rates over the female ones (male nmx/female nmx), and we called this ratio “age-specific index of sex-differential mortality”. If the two sexes are treated equally, male mortality rates are higher than the female ones from birth to the highest age attained (Coale 1991, p. 518) and therefore this index (male nmx/female nmx) should be greater than 1 in every age-group. This was the case for most European populations since the middle of the 19th century (Coale 1991, p. 518). If girls are neglected this ratio may fall below one in some age-groups, but in a non-erratic way, as far as there is no sex differential under-registration and under-enumeration. Even in populations where female discriminatory practices are in action, however, the index of sex differential mortality may be close to 1 and not below it. In other words, there is no exact reference benchmark in the absence of unequal treatment of the two sexes, against which (benchmark) one would compare the ratio male nmx/female nmx. Nevertheless, this limitation is not inhibitory for an analysis of sex-differential mortality. As mentioned above, a ratio (male nmx/female nmx) below 1 denotes descrimination against females, while a ratio close to 1 may or may not denote this2.
To rank Geographical Departments by gender inequalities the average of the age-specific sex-differential mortality indexes was calculated. In other words, the sum of the age-specific mortality ratios was divided by 19 (to standardize by the number of age-groups, which are 19). The greater the index, the greater the male mortality over the female one. If both sexes are treated equally this index should be well above 1 because of the innate biological advantage of females in every age-group. In present-day Greece (in 2016) the average of sex-differential mortality indices is 1.98, while in 1971 it was 1.53 and in 1928 it was 1.10 (calculations are based on life tables from Gavalas 2018).
3. Results
3.1. Is the Skewed Sex Ratio in Pre-War Greece Indicative of Gender-Based Disctimination?
Greek censuses and vital statistics of that period are of such poor quality that they render any attempt to derive reliable demographic indices futile. All the censuses taken prior to 1920 show an unlikely preponderance of males, despite the fact that the preceding male emigration and the continuous wars in the 1910s (Balkan wars, WW1 and the Asia Minor campaign) should have resulted in a strongly feminine sex ratio in the general population (Valaoras 1960, p. 116). Moreover, births up to the 1920s were systematically under-registered and the under-registration was greater for girls than for boys (Gavalas 2001, p. 241). The official publication of the vital statistics of Greece for 1921, trying to explain the unnaturally high sex ratio at birth (116 boys for every 100 girls), clearly stated: “This difference [in the sex ratio at birth] can be explained if we take into consideration that […] the female births are not registered so regularly as the male ones, because there are laws concerning the military recruitment and other issues that enforce more strictly the obligation of registering the birth of a male” (Ministère de l’ Economie Nationale-Direction de la Statistique (1924) Statistique du mouvement de la population pendant l’ année 1921. Athènes: Imprimerie Nationale, p. λδ’. Translated from Greek).
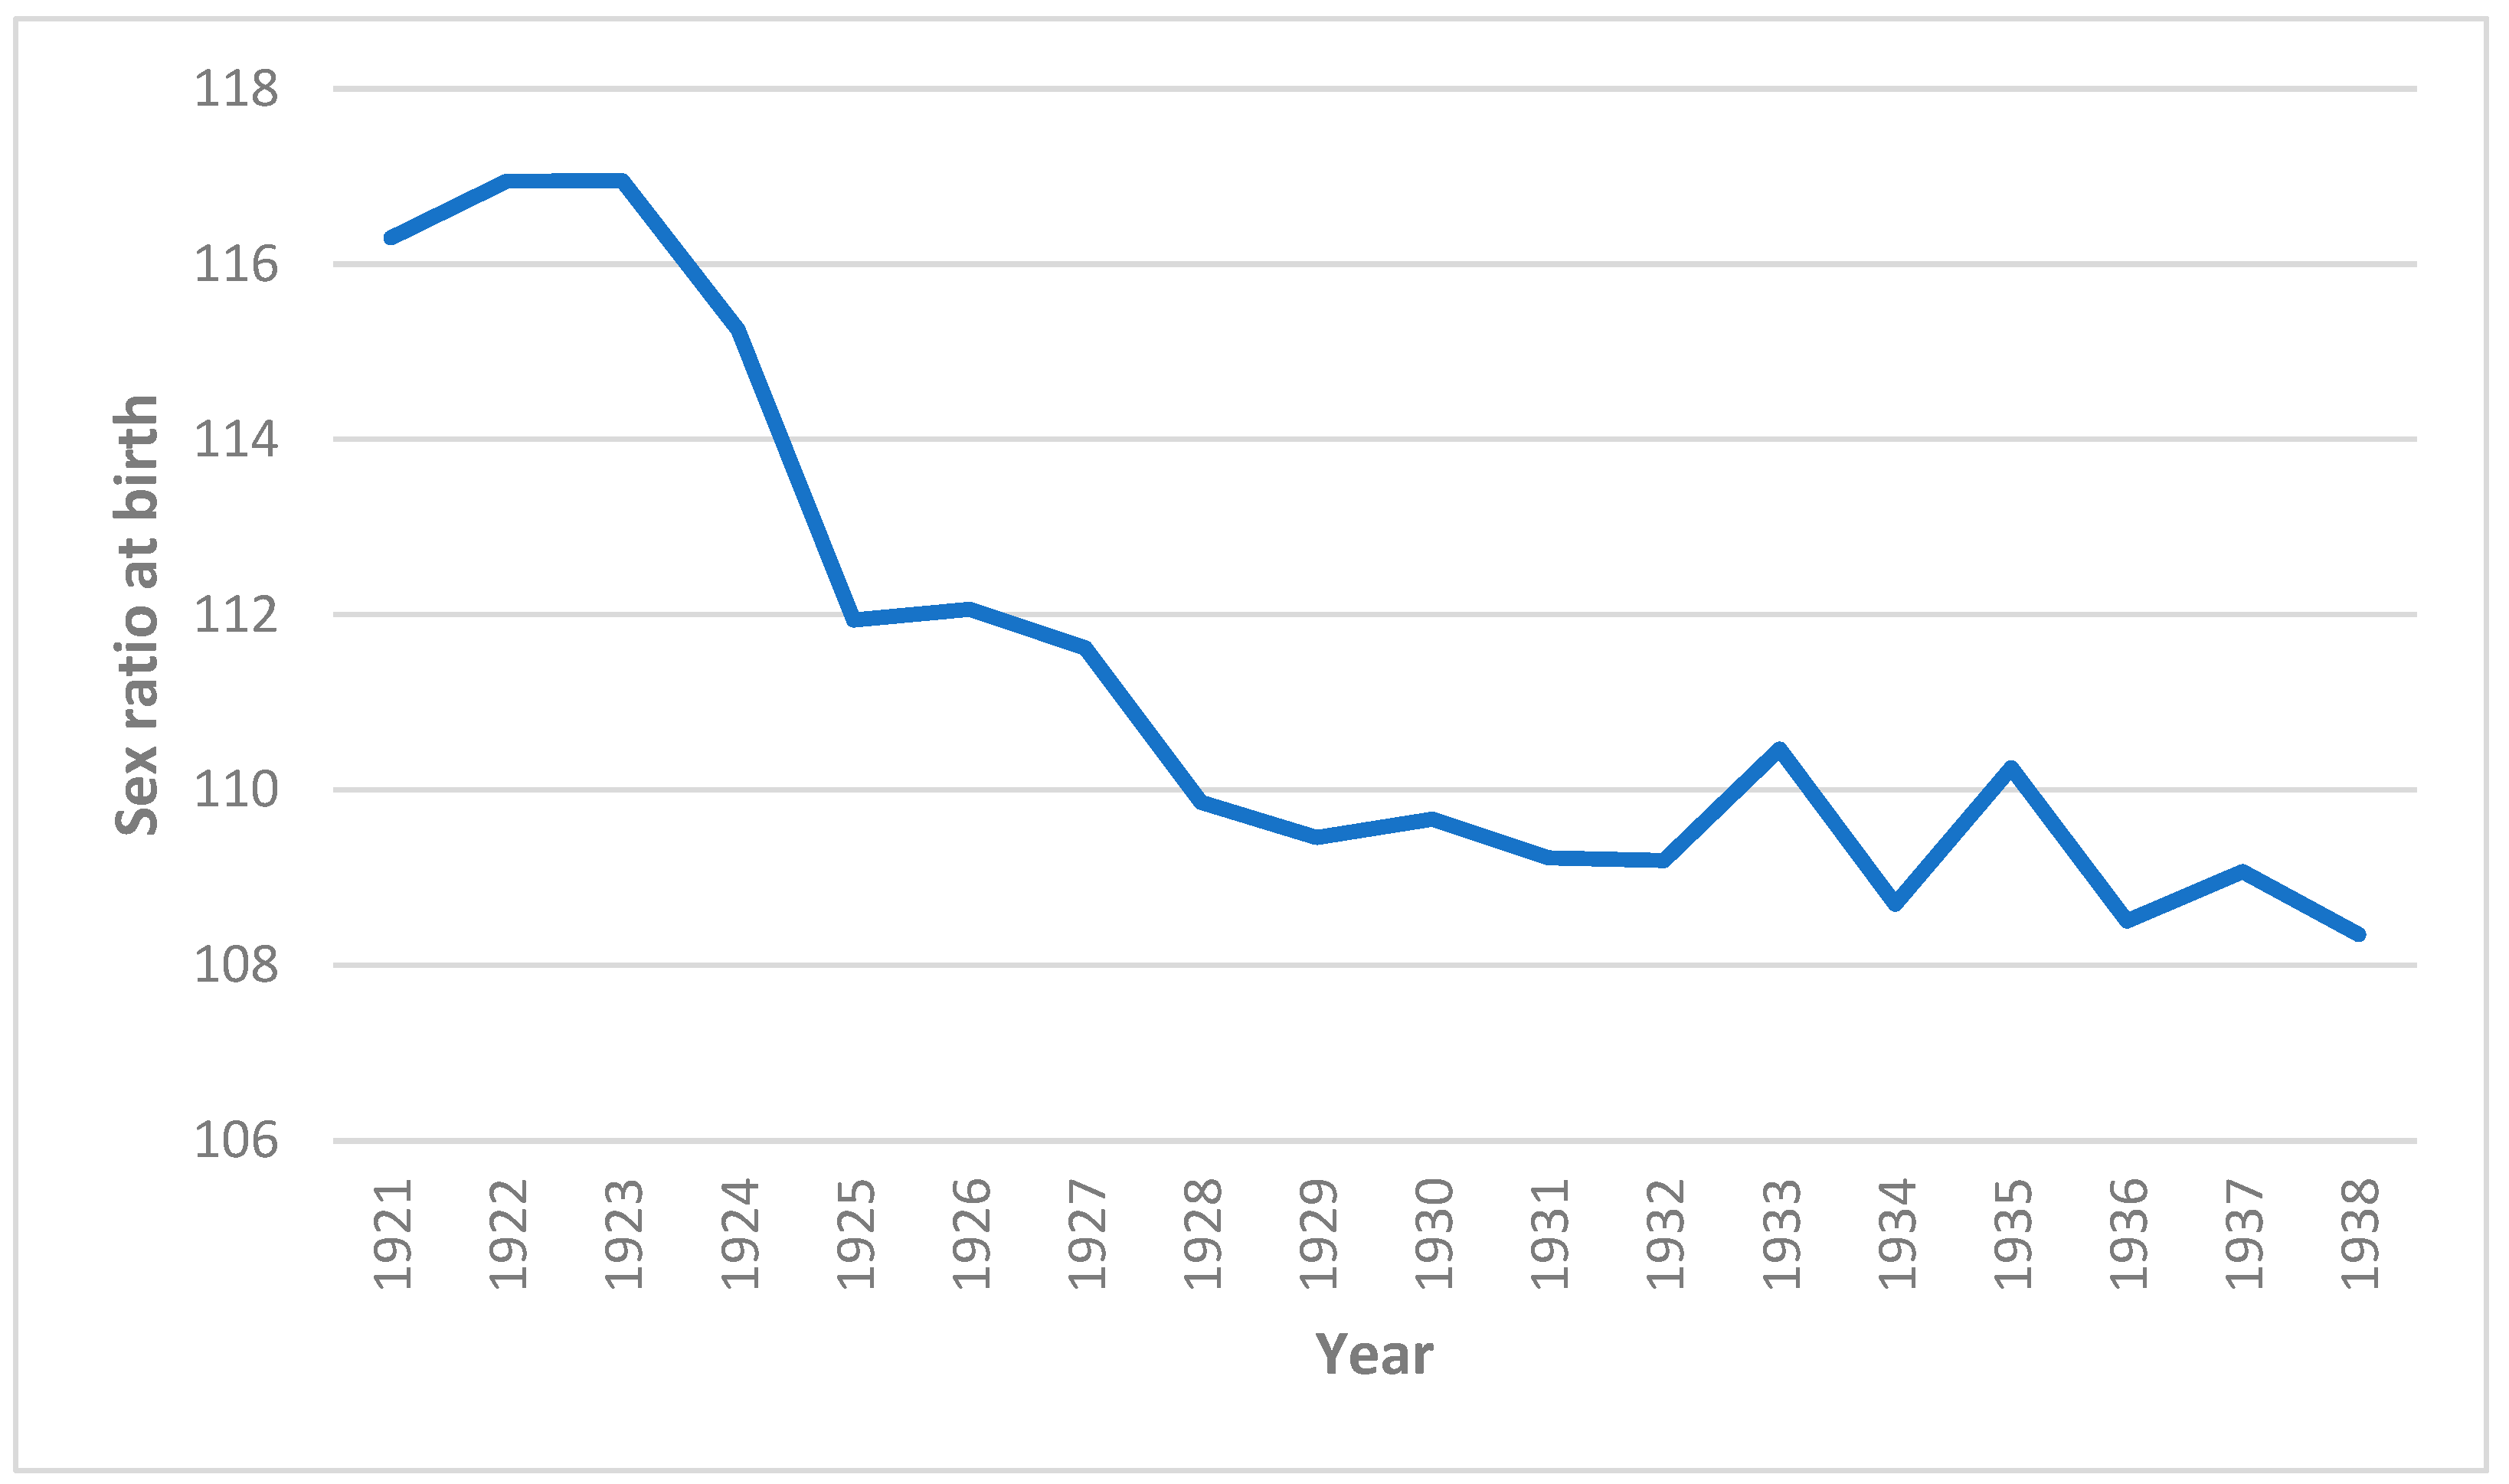
By 1929 sex ratio at birth had dropped to 109 (Figure 2), which still deviated significantly from the global average of 105 to 106 male for every 100 female births (Tarver and Lee 1968). Yet, a swift drop in SRB from 117 to 109 during the 1920s is more plausible to reflect an improvement in the stock of the background statistical material, rather than a radical change in the mentality of people as far as gender-inequality is concerned. It is this rapid decrease in SRB that makes us assume that the initially highly unbalanced ratio (117 male births to 100 female ones) was mostly due to under-registration of female births rather than due to infanticide of newborn girls.
The first census of the modern Greek State that enumerated more females than males is that of 1928. However, one must keep in mind that this numeric prevalence of females characterized only the total population of Greece. It was not in every region and not in every age-group. There were Geographical Departments (Thessaly, Peloponnese, Macedonia, Crete and Thrace) where males were overall more numerous than females. Even in Greece as a whole, more males were enumerated in the ages 45–59 and again in the age-group 75–79, where normally more females should be expected (Statistique Générale de la Grèce 1933).
Published vital statistics for Greece in the late 1920s, although are much improved compared with previous periods, are still characterized by significant under-registration of vital events. In the period 1925–29 the overall under-registration of births in Greece was 11,3%. This figure came up by juxtaposing the average annual number of live births in the quinquennium 1925–29 estimated by Valaoras, which was 200,500 (1960, p. 132) with the average annual number of births published by Statistique Générale de la Grèce, which was 177,798 (Ministère de l’ Economie Nationale-Direction de la Statistique 1929, 1930a, 1930b, 1931a, 1931b) for the same quinquennium. Therefore, it would be inaccurate to rely solely on sex ratios at birth (SRBs) from vital statistics to infer infanticide of girls in modern Greece before the 1950s.The indications of sex ratios at birth have to be corroborated by indexes that are less prone to under-registration. From the 1950s onwards vital statistics are becoming more reliable and SRBs calculated from published vital events are closer to the biological normal (102–108 male births for every 100 female ones).
3.2. Sex Differential Mortality by Geographical Department
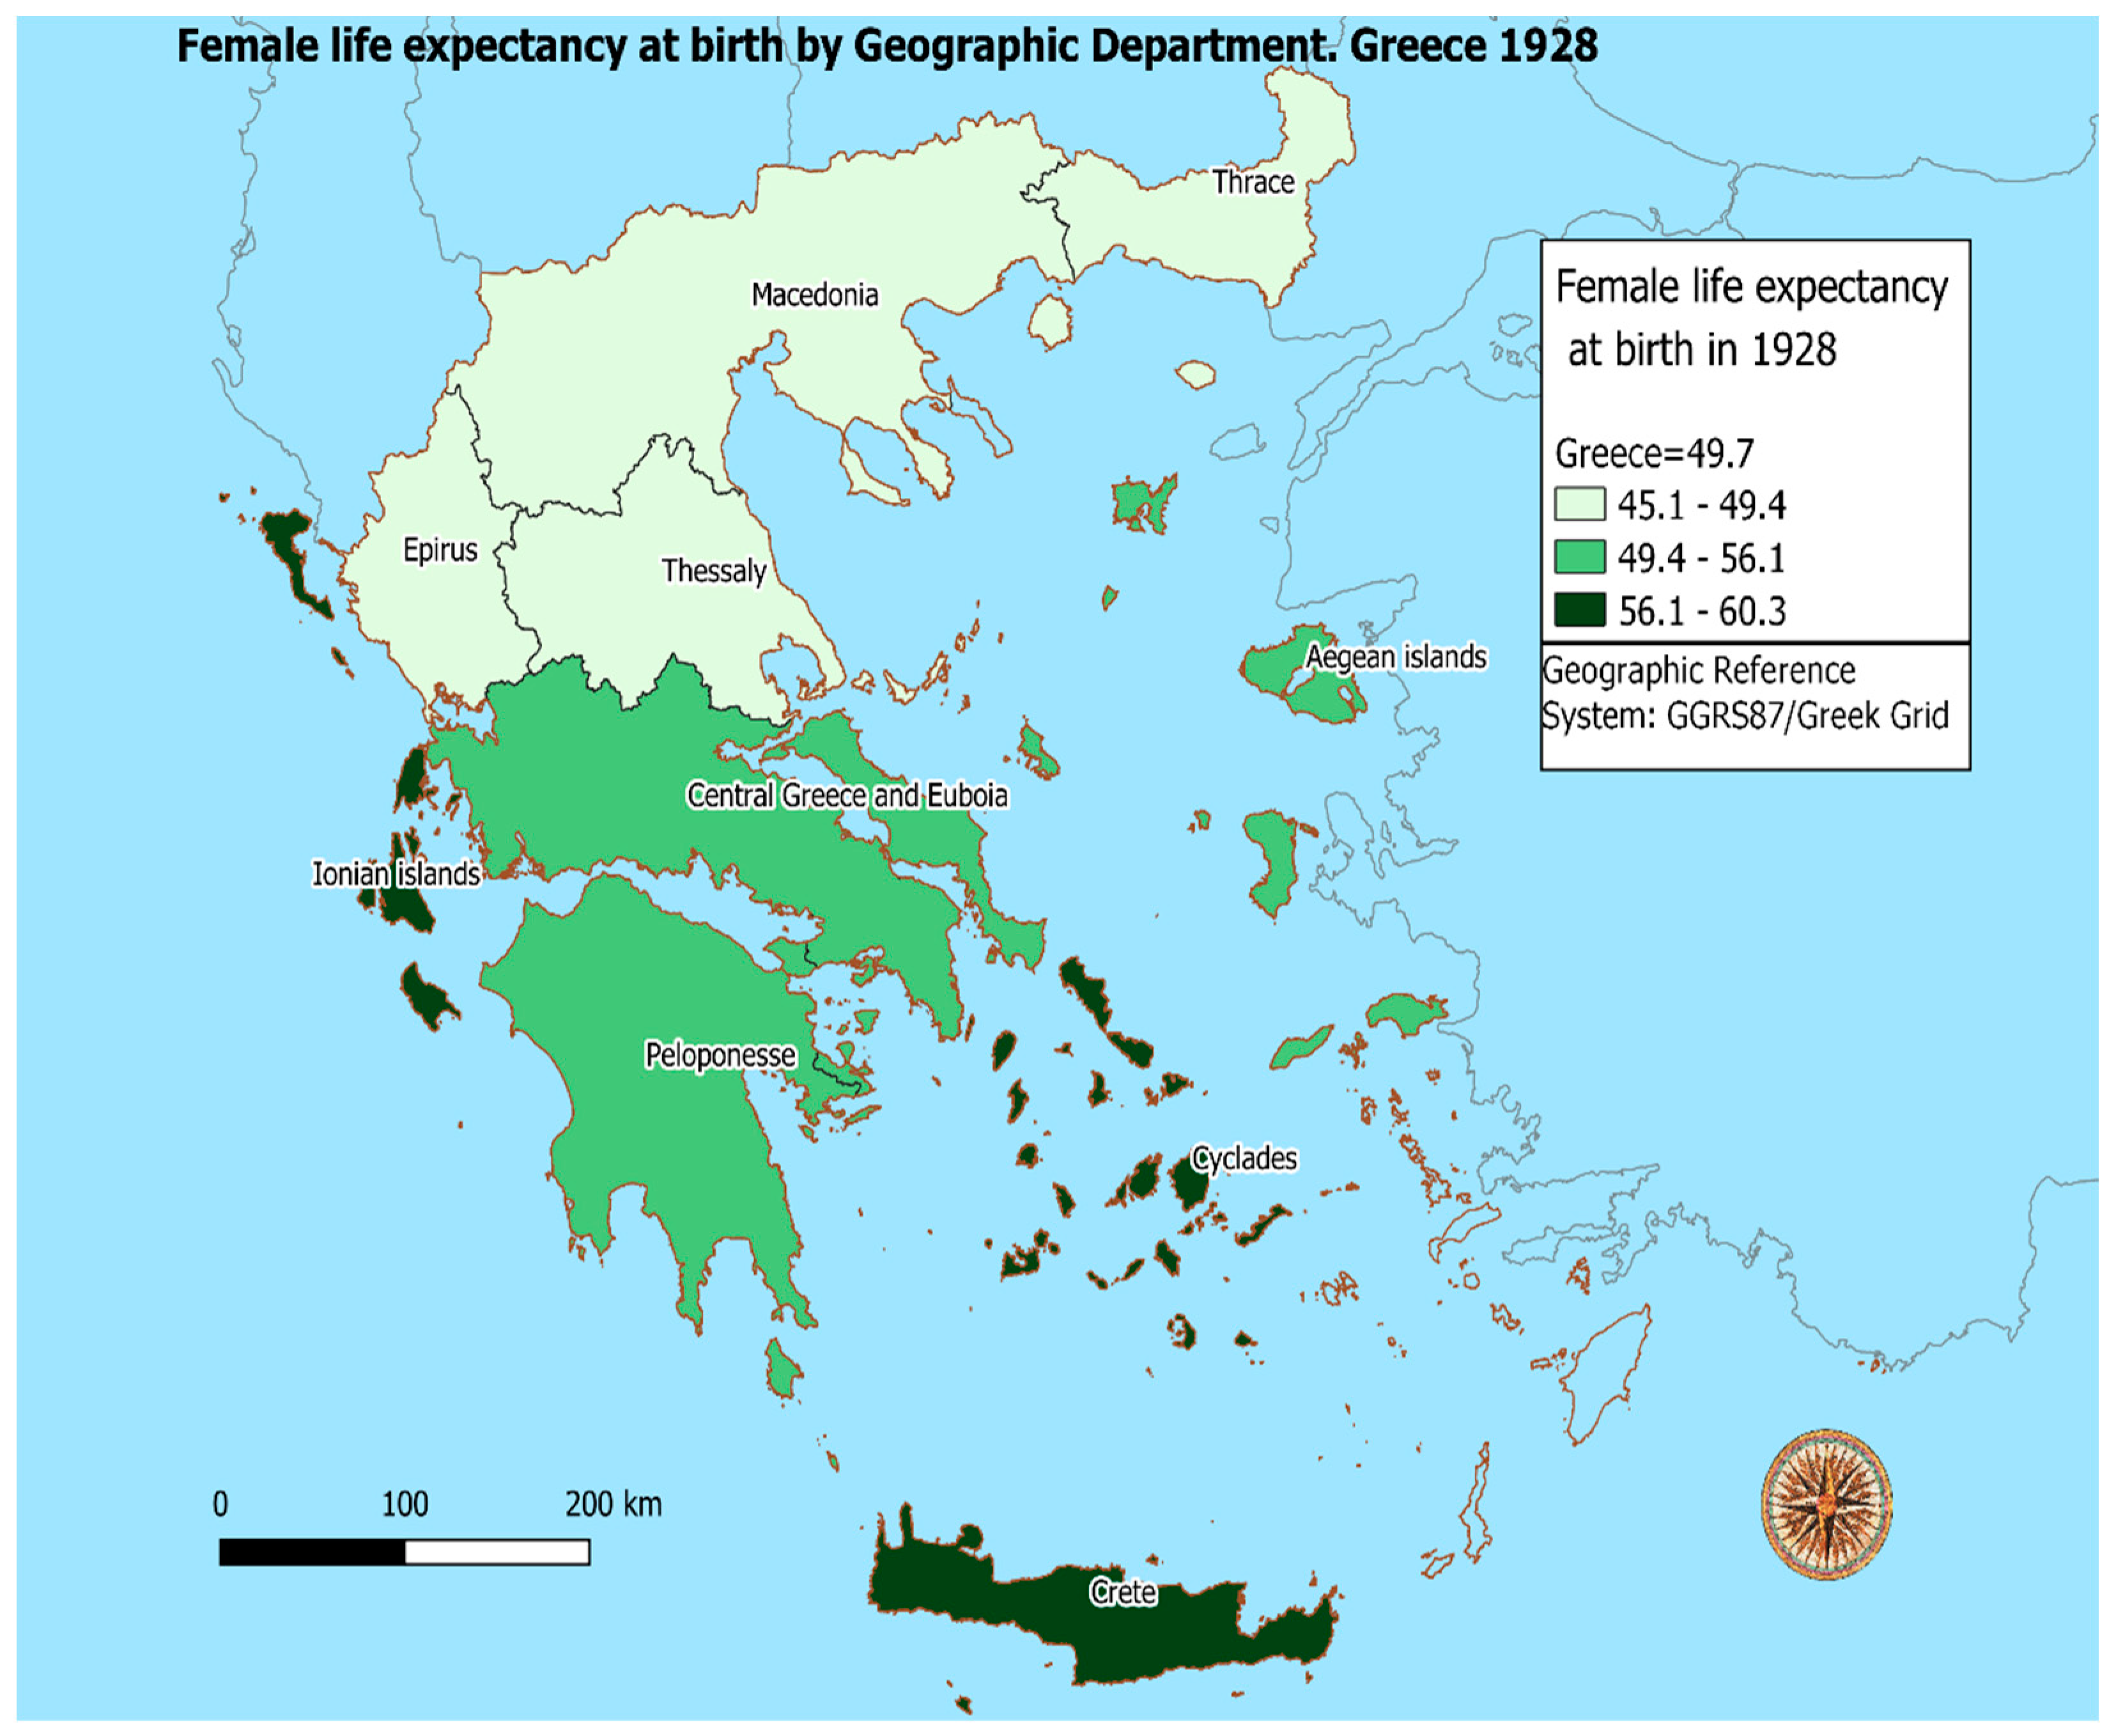
With a first glance at map 1 (Figure 3) a geographical pattern in female life expectancy at birth (e0) becomes obvious in 1928. Women in northern Greece (further north than Central Greece and Euboea) lived fewer years than women in the southern part of the country. This geographical distinction does not necessarily reflect sex differential mortality or gender inequalities between northern and southern Greece. It may reflect the general meagre living conditions and lack of health services in northern Greece, compared to the rest of the country. It is worth mentioning that the part of Greece north of Central Greece and Euboea was gradually annexed in the Greek state in the late 19th century (Thessaly and part of Epirus) and in the first decades of the 20th century (the rest of Epirus, Macedonia, Thrace and the North Aegean islands). Until then it belonged to the Ottoman empire. It is plausible that living conditions and access to health services were poorer in that part of mainland Greece. Life tables in Appendix A confirm that not only women, but men also lived fewer years in northern Greece compared to the southern parts of the country.
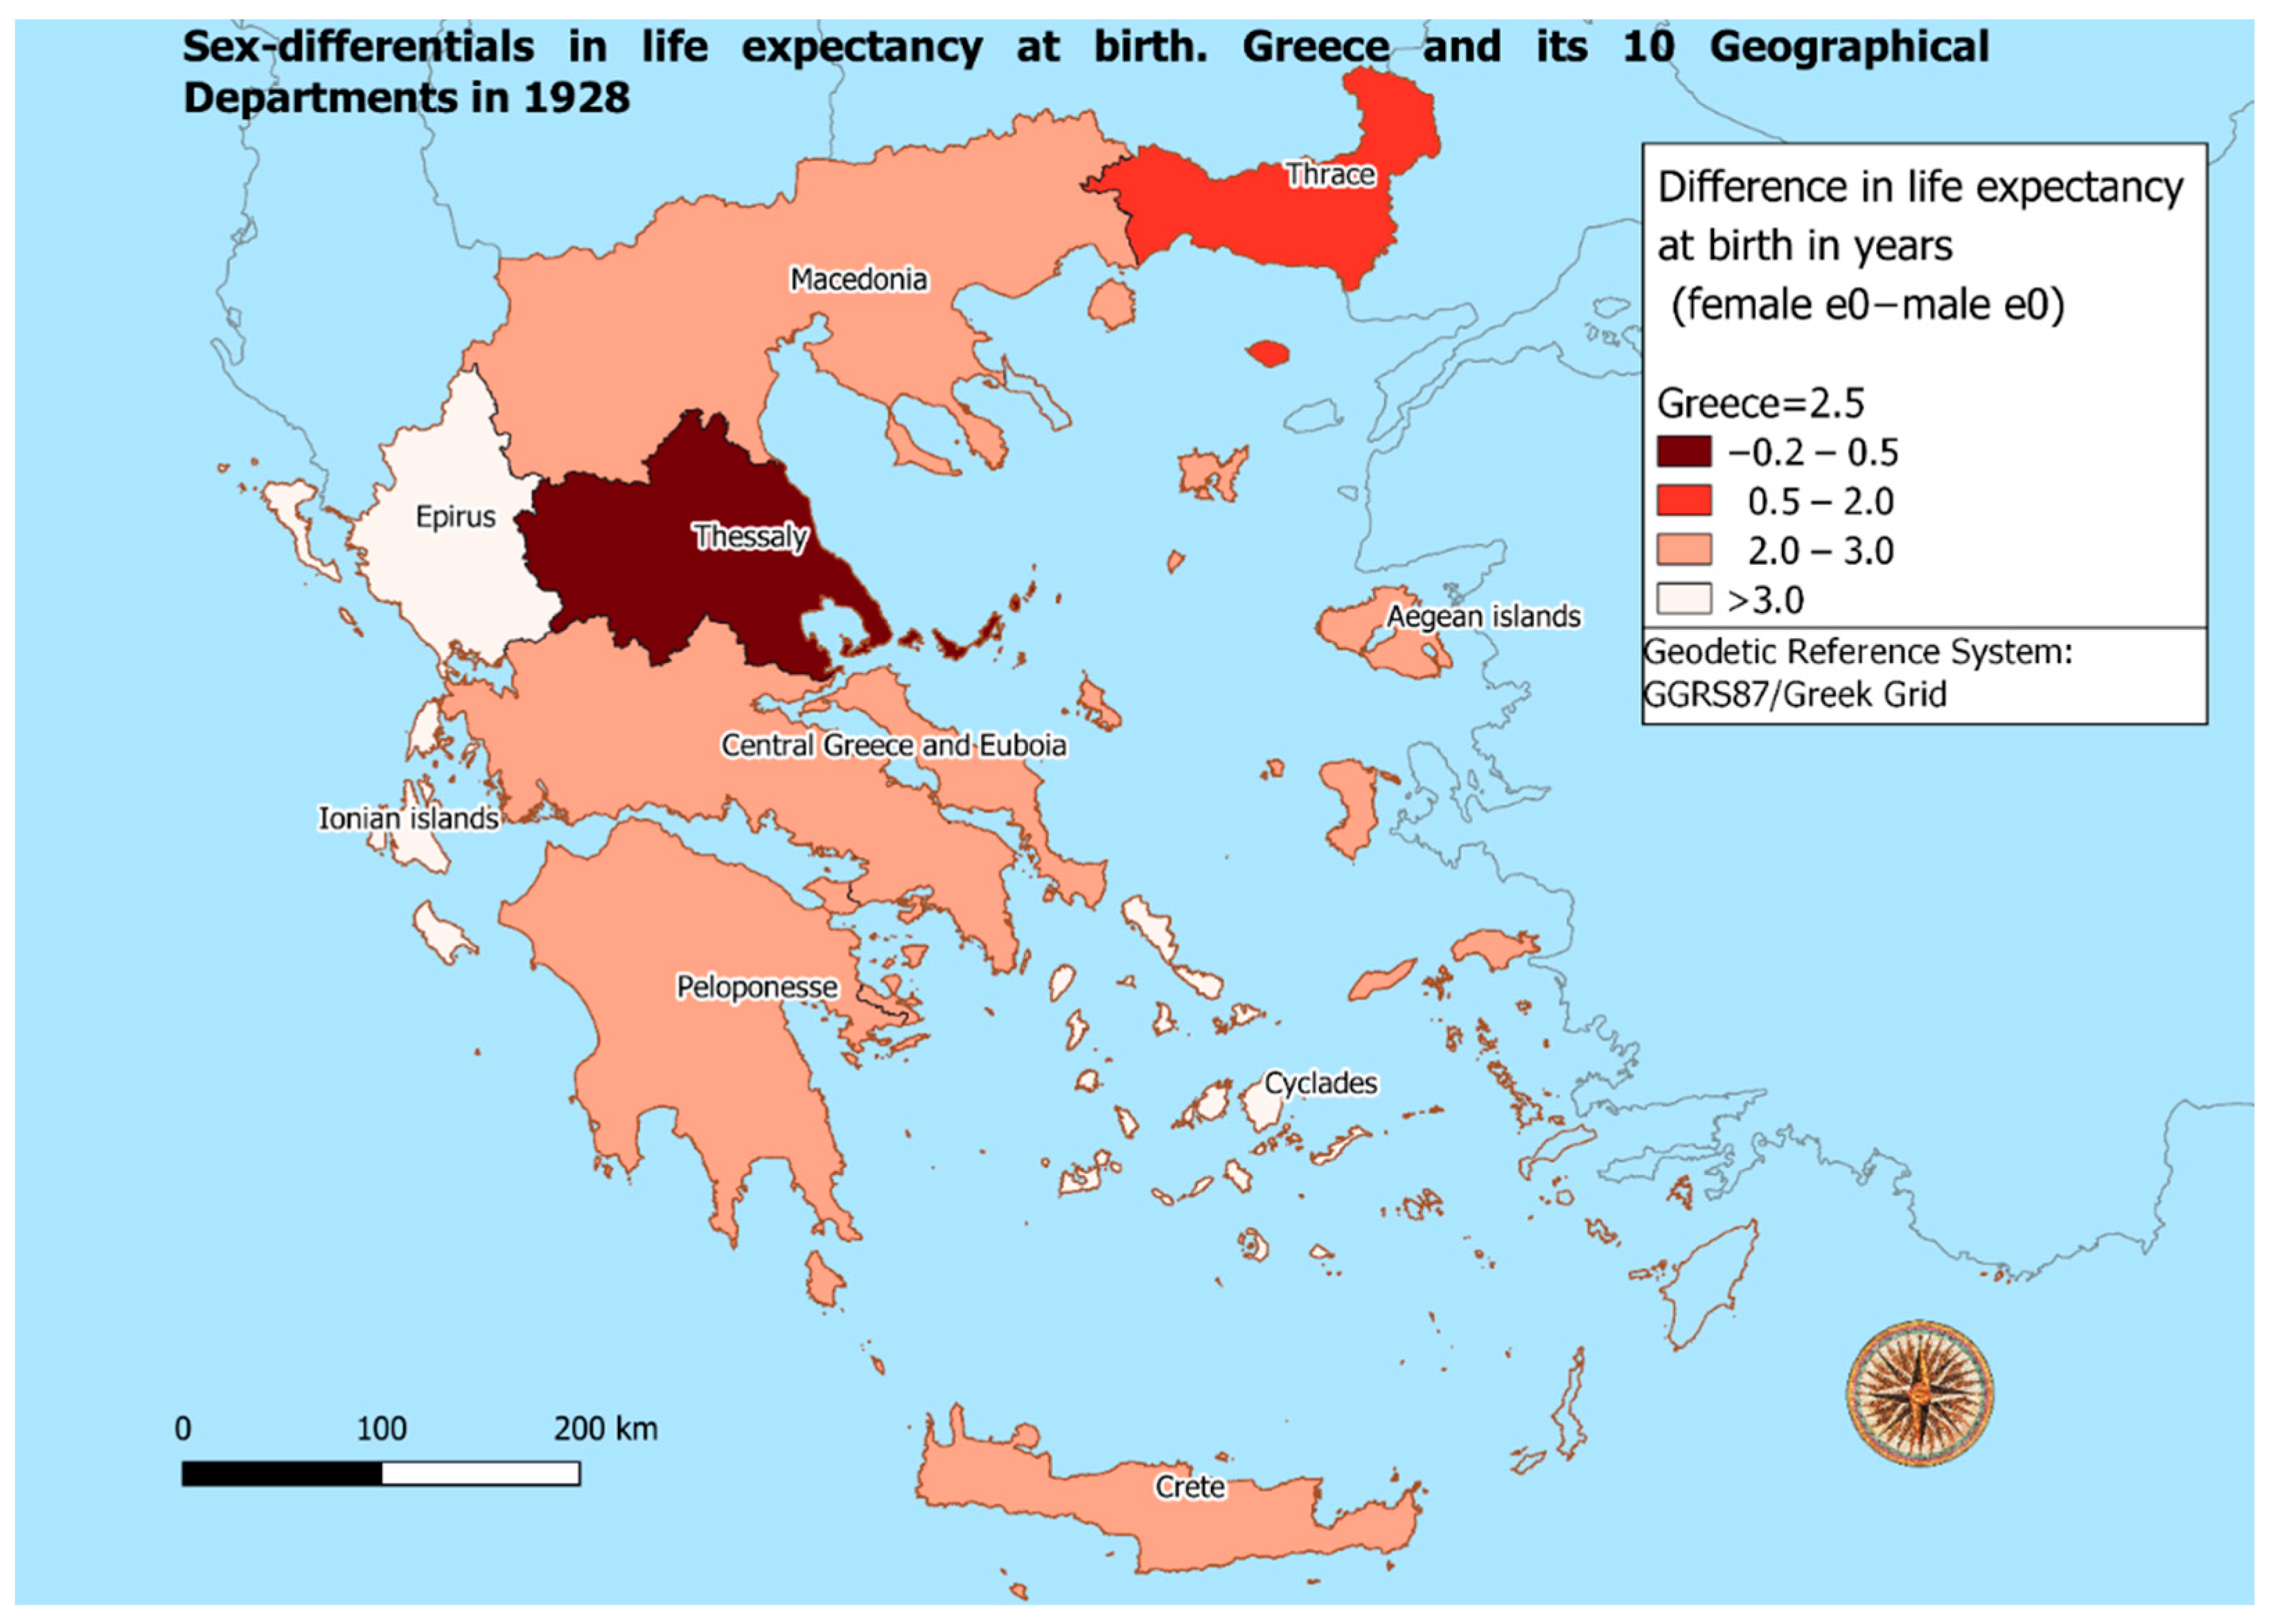
Map 2 (Figure 4) discloses that sex-differential mortality does not follow a distinct North-South pattern. It is rather two Geographical Departments that stand out. Thessaly, where girls were expected to live less than boys, and Thrace, where female life expectancy at birth was only slightly higher than that of males.
Figure 5 reveals with a more detailed way that there were great differences in the sex differential mortality among the ten Geographical Departments of Greece, and this fact alone implies that the treatment of men and women was not the same all over Greece. The most severe discriminatory practices against women appear to have taken place in Thessaly, where women had higher mortality than men in every age-group from 1–4 to 35–39. The second worse Geographical Department for a woman to live was Thrace (“Thrace Occidentale” as it is mentioned in the 1928 census, to remind us that West Thrace had been officially annexed to the Greek state only a few years earlier, in 1920). In Thrace, women had higher mortality than men from toddlers (1–4 years of age) to their early 30s (30–34). Macedonia presented a similar picture with Thrace: women also faced greater mortality than men in the ages 1–4 through 30–34, though the level of excess female mortality in Macedonia was not so high as in Thrace.
The remaining seven Geographical Departments presented better indexes of sex-differential mortality than the national average (as this represented by “Greece” in Figure 5), although women exhibited higher mortality than men in early childhood, in adolescence and, in Central Greece and Euboea, in the primary childbearing ages 25–29. The only Geographical Department where female mortality was lower than the male one in every age-group were the Ionian islands. Epirus also exhibited lower female mortality in all but one age-group, namely that of 15–19, where mortality was virtually the same for the two sexes.
Table 1 ranks Geographical Departments according to the average of sex-differential mortality index (as this was established in the methodology part). At the same time, Table 1 presents the difference in life expectancy between males and females at ages 0, 5 and 60 for each Geographical Department.
By and large it seems that in pre-war years gender inequalities were less acute in insular population (Aegean islands, the Cyclades, Crete, Ionian islands) than in mainland Greece (Table 1 and map 2). Paradoxically, Epirus, which is a mountainous Geographical Department in mainland Greece, ranks better than Crete and the Aegean islands as far as gender inequalities are concerned. If one looks at the life expectancy at birth in Epirus, women lived 4.3 years more than men did, a difference surpassed only by the Ionian islands. At age 5, yet again, the difference in life expectancy of the two sexes was 2.5 years in Epirus, a value that is lower than that in the Cyclades and the Ionian islands. At the age of 60 years, however, the difference in life expectancy between females and males in Epirus was lower than any of the insular population.
What is also noteworthy in Table 1 is that women that were born in Thessaly lived fewer years than men did. Their life expectancy was lower than that of men both at birth and at 5 years of age. In no other Geographical Department of Greece did men outlive women. In Thessaly, only women who managed to survive to 15 years of age obtained a slight advantage in life expectancy over males (see Appendix A), and this advantage was taking its peak at 60 years old, where a 60-year-old woman from Thessaly was expected to outlive her twin brother by 0.9 years.
3.3. Literacy Status and Gender Inequalities
Apart from the sex-differential mortality, another indication that boys were receiving preferential treatment over girls is the difference in the literacy status of the two sexes. Table 2 shows that the percentages of literate young women (aged 25–29) were much lower than those of the same-age males. The comparison of different Geographical Departments cannot be done by comparing the percentages of literate females alone, because in some Departments the percentages were low for males as well. It is the difference between the male and female literacy status that will show the unequal treatment of the two sexes, and this difference is grasped with the ratio of the male percentages over the female ones. This ratio shows how many literate males aged 25–29 existed for every literate female. In general, this ratio is associated in a negative way with the average of the sex-differential mortality index: more literate males for every literate female mean that the biologically innate female advantage of better survival is eliminated. However, the correlation coefficient (Pearson’s r) is weak (−0.29) and not statistically significant (p-value = 0.417) because there are Geographical Departments, such as Epirus, Crete and the Ionian islands, that ranked high in sex-differential mortality (meaning that women did have an advantage over men) but the percent of literate women was too low compared with that of men. The correlation coefficient might have been more robust if it was based on more than 10 observations, that is if the analysis is repeated for smaller administrative units of Greece.
4. Discussion
The first research question of this paper, that is whether under-registration and under-enumeration of females were partially responsible for the skewed sex ratios in Greece during the 1920s, was answered vaguely in the Section 3.1. A more robust analysis of the issue would require a different methodology in parochial level, such as nominal record linkage with the method of family reconstitution. This is by itself a topic for a new research work.
As far as the second research question is concerned, that is whether gender-based discrimination was the same all over Greece, it became obvious from the above analysis that Greece in the pre-WWII period was a very diverse country. Gender inequalities seemed to have been more acute in the northern and central part of the country (especially in Thessaly, Thrace and Macedonia), that in parts of mainland Greece that had been annexed to the Greek state later than the rest of the country. It is noteworthy that up to their annexation these parts were having a great percentage of Muslim residents (since they were part of the Ottoman empire). Whether the centuries-long mingle of Christian populations with their Muslims compatriots under the Ottoman rule made the preferential treatment towards sons more acute is a research question remaining open to speculations. Nevertheless, the literacy gap between males and females (which was greater in Thessaly, Macedonia and Thrace) is evidence of a general negligence towards girls. The negligence goes far beyond the sector of education and may have had an impact on the survival status of females as well.
One intriguing feature of the sex differential mortality in 1928 is that girls presented greater mortality than boys as toddlers (in all Departments except for the Ionian islands), while their mortality in infancy was much lower than that of boys. A slight drop of the ratio (male nmx/female nmx) from infancy to toddlership is also present in Greek life tables up to 1951, and this drop, which is evidence of negligence towards female toddlers, is not observed again after 1951 (data from Papadakis and Tsimpos 1993, pp. 63–70). Speculations as to what was the cause of this excess female mortality in toddlers in pre-war Greece can be put forward, based on findings from other countries with similar mortality patterns. A similar pattern has been found in rural Spain from the 18th century (where data are available) up to the first half of the 20th century (Marco-Gracia and Beltrán Tapia 2021). In like manner, in parts of India and Bangladesh in the 1970s and 1980s female mortality was lower than the male one in the early months after birth, but it rose sharply by the end of the first year of life (Coale 1991). In all these cases the explanation is that:
“the normal female advantage prevails in the early interval after birth, when the source of nutrition is predominantly breastfeeding, but when supplementation begins, female death rates start to rise relative to male death rates. This shift may be caused partly by provision of better nutrition other than mother’s milk for males, and partly by better health care”.
The same explanation is adopted by the Marco-Gracia and Beltrán Tapia for the rural area of Zaragoza in Spain: the effects of the preferential treatment of boys on the survival chances of girls were mitigated during infancy grace to breastfeeding, but once children were weaned sex-specific mortality was against girls (Marco-Gracia and Beltrán Tapia 2021, pp. 673–74).
It is plausible that this explanation holds true for pre-war Greece as well. It is known from family reconstitution studies that in parts of pre-war Greece the average duration of breast-feeding reached or even exceeded one year (Gavalas 2001, p. 212; Hionidou 1993, p. 231). As long as breastfeeding was in action, nutrition would be the same for boys and girls. After weaning, however, it is possible that boys received better nutrition than girls and, therefore, the survival chances in the sensitive ages 1–4, were in favor of boys. There is at least one study on unequal allocation of resources within the household, including food, which concerns the island of Karpathos, and comes to corroborate the above explanation of excess female mortality during toddlership (Vernier 1984).
It seems that infanticide was not uncommon in certain regions in Greece. Thessally, by being the only Geographical Department of Greece where men outlived women, is the most prominent candidate among these regions. It is not unlikely, therefore, that Papadiamantis, one of the greatest novelists of modern Greece, was literal when he was writing in 19033 about a woman who strangled her newborn granddaughter, to save her from the hardships that a female has to endure throughout her life in a patriarchal system:
“…she was heard to indoctrinate that it would be better for the man not to have a lot of girls […]. Sometimes it occurs to the man to strangle the girls at the time of their birth! … Yes, she said that, but of course she wouldn’t have been capable to ever do it… She didn’t believe it herself either.”.
Coincidentally, the above novel (“The Murderess”) takes place in Skiathos, which belongs to the Geographical Department of Thessaly, and, contrary to the initial anticipation of the author, “the murderess”, did kill her newborn granddaughter along with a series of other infant girls.
Author Contributions
Conceptualization, V.S.G.; methodology, V.S.G.; resources, V.S.G. and P.B.; data curation, V.S.G. and P.B.; writing—original draft preparation, V.S.G.; writing—review and editing, V.S.G. and P.B.; visualization, V.S.G. and P.B. All authors have read and agreed to the published version of the manuscript.
Funding
This research received no external funding.
Institutional Review Board Statement
Not applicable.
Informed Consent Statement
Not applicable.
Data Availability Statement
Not applicable.
Conflicts of Interest
The authors declare no conflict of interest.
Appendix A
Life tables of Greece and its ten Geographical Departments for 1928. Predicted nqx values extrapolated to age 100+ based on one component fit4.

Table A1.
Greece, 1928.
| Males | Females | ||||||
|---|---|---|---|---|---|---|---|
| x | n | nmx | nqx | ex | nmx | nqx | ex |
| 0 | 1 | 0.1440 | 0.1313 | 47.2 | 0.1162 | 0.1081 | 49.7 |
| 1 | 4 | 0.0187 | 0.0712 | 53.3 | 0.0199 | 0.0757 | 54.7 |
| 5 | 5 | 0.0045 | 0.0224 | 53.3 | 0.0047 | 0.0233 | 55.1 |
| 10 | 5 | 0.0028 | 0.0140 | 49.5 | 0.0028 | 0.0139 | 51.3 |
| 15 | 5 | 0.0041 | 0.0203 | 45.1 | 0.0043 | 0.0215 | 47.0 |
| 20 | 5 | 0.0058 | 0.0287 | 41.0 | 0.0060 | 0.0295 | 43.0 |
| 25 | 5 | 0.0066 | 0.0323 | 37.2 | 0.0069 | 0.0338 | 39.2 |
| 30 | 5 | 0.0078 | 0.0384 | 33.3 | 0.0080 | 0.0390 | 35.5 |
| 35 | 5 | 0.0097 | 0.0472 | 29.6 | 0.0090 | 0.0439 | 31.8 |
| 40 | 5 | 0.0123 | 0.0598 | 25.9 | 0.0101 | 0.0494 | 28.2 |
| 45 | 5 | 0.0161 | 0.0777 | 22.4 | 0.0124 | 0.0603 | 24.5 |
| 50 | 5 | 0.0217 | 0.1031 | 19.0 | 0.0166 | 0.0800 | 20.9 |
| 55 | 5 | 0.0295 | 0.1377 | 15.9 | 0.0234 | 0.1107 | 17.5 |
| 60 | 5 | 0.0418 | 0.1898 | 13.1 | 0.0337 | 0.1556 | 14.4 |
| 65 | 5 | 0.0607 | 0.2638 | 10.5 | 0.0493 | 0.2201 | 11.5 |
| 70 | 5 | 0.0869 | 0.3560 | 8.4 | 0.0735 | 0.3108 | 9.1 |
| 75 | 5 | 0.1206 | 0.4582 | 6.7 | 0.1092 | 0.4262 | 7.0 |
| 80 | 5 | 0.1633 | 0.5660 | 5.3 | 0.1552 | 0.5487 | 5.4 |
| 85 | 5 | 0.2154 | 0.6683 | 4.2 | 0.2149 | 0.6690 | 4.2 |
| 90 | 5 | 0.2757 | 0.7570 | 3.4 | 0.2857 | 0.7712 | 3.3 |
| 95 | 5 | 0.3438 | 0.8283 | 2.8 | 0.3675 | 0.8494 | 2.6 |
| 100+ | … | 0.4308 | ... | 2.3 | 0.4728 | ... | 2.1 |
Table A2.
Thrace 1928.
| Males | Females | ||||||
|---|---|---|---|---|---|---|---|
| x | n | nmx | nqx | ex | nmx | nqx | ex |
| 0 | 1 | 0.1403 | 0.1282 | 47.9 | 0.1174 | 0.1091 | 49.4 |
| 1 | 4 | 0.0179 | 0.0685 | 53.8 | 0.0203 | 0.0769 | 54.4 |
| 5 | 5 | 0.0044 | 0.0216 | 53.7 | 0.0048 | 0.0237 | 54.9 |
| 10 | 5 | 0.0027 | 0.0135 | 49.8 | 0.0029 | 0.0142 | 51.1 |
| 15 | 5 | 0.0040 | 0.0197 | 45.5 | 0.0044 | 0.0218 | 46.8 |
| 20 | 5 | 0.0056 | 0.0278 | 41.3 | 0.0061 | 0.0300 | 42.8 |
| 25 | 5 | 0.0064 | 0.0313 | 37.4 | 0.0070 | 0.0344 | 39.1 |
| 30 | 5 | 0.0076 | 0.0373 | 33.6 | 0.0081 | 0.0396 | 35.4 |
| 35 | 5 | 0.0094 | 0.0458 | 29.8 | 0.0091 | 0.0445 | 31.7 |
| 40 | 5 | 0.0120 | 0.0583 | 26.1 | 0.0103 | 0.0500 | 28.1 |
| 45 | 5 | 0.0158 | 0.0760 | 22.5 | 0.0126 | 0.0610 | 24.4 |
| 50 | 5 | 0.0213 | 0.1012 | 19.2 | 0.0168 | 0.0807 | 20.9 |
| 55 | 5 | 0.0290 | 0.1356 | 16.0 | 0.0236 | 0.1116 | 17.5 |
| 60 | 5 | 0.0413 | 0.1875 | 13.2 | 0.0339 | 0.1567 | 14.3 |
| 65 | 5 | 0.0600 | 0.2611 | 10.6 | 0.0496 | 0.2213 | 11.5 |
| 70 | 5 | 0.0860 | 0.3529 | 8.5 | 0.0739 | 0.3122 | 9.0 |
| 75 | 5 | 0.1195 | 0.4552 | 6.7 | 0.1097 | 0.4278 | 7.0 |
| 80 | 5 | 0.1621 | 0.5635 | 5.3 | 0.1557 | 0.5500 | 5.4 |
| 85 | 5 | 0.2143 | 0.6663 | 4.3 | 0.2155 | 0.6700 | 4.2 |
| 90 | 5 | 0.2746 | 0.7557 | 3.4 | 0.2864 | 0.7720 | 3.3 |
| 95 | 5 | 0.3429 | 0.8275 | 2.8 | 0.3680 | 0.8498 | 2.6 |
| 100+ | … | 0.4300 | ... | 2.3 | 0.4734 | … | 2.1 |
Table A3.
Macedonia 1928.
| Males | Females | ||||||
|---|---|---|---|---|---|---|---|
| x | n | nmx | nqx | ex | nmx | nqx | ex |
| 0 | 1 | 0.1636 | 0.1474 | 44.2 | 0.1305 | 0.1203 | 46.3 |
| 1 | 4 | 0.0228 | 0.0860 | 50.7 | 0.0243 | 0.0915 | 51.6 |
| 5 | 5 | 0.0055 | 0.0270 | 51.4 | 0.0058 | 0.0286 | 52.7 |
| 10 | 5 | 0.0033 | 0.0166 | 47.7 | 0.0034 | 0.0170 | 49.1 |
| 15 | 5 | 0.0048 | 0.0239 | 43.5 | 0.0054 | 0.0264 | 45.0 |
| 20 | 5 | 0.0068 | 0.0336 | 39.5 | 0.0074 | 0.0363 | 41.1 |
| 25 | 5 | 0.0077 | 0.0377 | 35.8 | 0.0084 | 0.0411 | 37.5 |
| 30 | 5 | 0.0092 | 0.0448 | 32.1 | 0.0096 | 0.0469 | 34.1 |
| 35 | 5 | 0.0112 | 0.0543 | 28.5 | 0.0106 | 0.0516 | 30.6 |
| 40 | 5 | 0.0140 | 0.0678 | 25.0 | 0.0117 | 0.0568 | 27.1 |
| 45 | 5 | 0.0181 | 0.0866 | 21.6 | 0.0141 | 0.0680 | 23.6 |
| 50 | 5 | 0.0239 | 0.1128 | 18.4 | 0.0185 | 0.0887 | 20.1 |
| 55 | 5 | 0.0319 | 0.1482 | 15.4 | 0.0258 | 0.1214 | 16.9 |
| 60 | 5 | 0.0447 | 0.2016 | 12.6 | 0.0367 | 0.1684 | 13.8 |
| 65 | 5 | 0.0644 | 0.2775 | 10.2 | 0.0531 | 0.2348 | 11.1 |
| 70 | 5 | 0.0915 | 0.3710 | 8.1 | 0.0784 | 0.3277 | 8.7 |
| 75 | 5 | 0.1260 | 0.4730 | 6.5 | 0.1156 | 0.4450 | 6.8 |
| 80 | 5 | 0.1689 | 0.5783 | 5.2 | 0.1621 | 0.5646 | 5.3 |
| 85 | 5 | 0.2211 | 0.6778 | 4.2 | 0.2223 | 0.6814 | 4.1 |
| 90 | 5 | 0.2810 | 0.7635 | 3.4 | 0.2931 | 0.7796 | 3.2 |
| 95 | 5 | 0.3486 | 0.8321 | 2.8 | 0.3745 | 0.8544 | 2.6 |
| 100+ | … | 0.4347 | ... | 2.3 | 0.4796 | ... | 2.1 |
Table A4.
Epirus 1928.
| Males | Females | ||||||
|---|---|---|---|---|---|---|---|
| x | n | nmx | nqx | ex | nmx | nqx | ex |
| 0 | 1 | 0.1865 | 0.1658 | 40.8 | 0.1357 | 0.1247 | 45.1 |
| 1 | 4 | 0.0280 | 0.1042 | 47.9 | 0.0261 | 0.0976 | 50.5 |
| 5 | 5 | 0.0066 | 0.0326 | 49.3 | 0.0062 | 0.0306 | 51.8 |
| 10 | 5 | 0.0040 | 0.0198 | 45.8 | 0.0037 | 0.0182 | 48.4 |
| 15 | 5 | 0.0057 | 0.0282 | 41.7 | 0.0058 | 0.0284 | 44.2 |
| 20 | 5 | 0.0081 | 0.0396 | 37.8 | 0.0079 | 0.0390 | 40.4 |
| 25 | 5 | 0.0090 | 0.0441 | 34.3 | 0.0090 | 0.0440 | 37.0 |
| 30 | 5 | 0.0107 | 0.0524 | 30.8 | 0.0102 | 0.0499 | 33.5 |
| 35 | 5 | 0.0129 | 0.0627 | 27.3 | 0.0112 | 0.0546 | 30.2 |
| 40 | 5 | 0.0160 | 0.0772 | 24.0 | 0.0123 | 0.0595 | 26.8 |
| 45 | 5 | 0.0203 | 0.0967 | 20.8 | 0.0147 | 0.0708 | 23.3 |
| 50 | 5 | 0.0263 | 0.1237 | 17.7 | 0.0192 | 0.0919 | 19.9 |
| 55 | 5 | 0.0347 | 0.1598 | 14.9 | 0.0266 | 0.1252 | 16.6 |
| 60 | 5 | 0.0479 | 0.2144 | 12.2 | 0.0378 | 0.1730 | 13.6 |
| 65 | 5 | 0.0684 | 0.2922 | 9.8 | 0.0544 | 0.2400 | 11.0 |
| 70 | 5 | 0.0965 | 0.3869 | 7.9 | 0.0801 | 0.3336 | 8.6 |
| 75 | 5 | 0.1318 | 0.4883 | 6.3 | 0.1179 | 0.4515 | 6.7 |
| 80 | 5 | 0.1748 | 0.5910 | 5.0 | 0.1645 | 0.5700 | 5.2 |
| 85 | 5 | 0.2271 | 0.6874 | 4.1 | 0.2249 | 0.6856 | 4.1 |
| 90 | 5 | 0.2866 | 0.7700 | 3.3 | 0.2957 | 0.7825 | 3.2 |
| 95 | 5 | 0.3536 | 0.8360 | 2.7 | 0.3770 | 0.8561 | 2.6 |
| 100+ | … | 0.4388 | ... | 2.3 | 0.4819 | ... | 2.1 |
Table A5.
Thessaly 1928.
| Males | Females | ||||||
|---|---|---|---|---|---|---|---|
| x | n | nmx | nqx | ex | nmx | nqx | ex |
| 0 | 1 | 0.1523 | 0.1382 | 45.9 | 0.1332 | 0.1226 | 45.7 |
| 1 | 4 | 0.0204 | 0.0774 | 52.2 | 0.0253 | 0.0947 | 51.0 |
| 5 | 5 | 0.0049 | 0.0243 | 52.5 | 0.0060 | 0.0297 | 52.2 |
| 10 | 5 | 0.0030 | 0.0151 | 48.7 | 0.0036 | 0.0176 | 48.7 |
| 15 | 5 | 0.0044 | 0.0218 | 44.4 | 0.0056 | 0.0275 | 44.6 |
| 20 | 5 | 0.0063 | 0.0308 | 40.4 | 0.0077 | 0.0377 | 40.7 |
| 25 | 5 | 0.0070 | 0.0346 | 36.6 | 0.0087 | 0.0426 | 37.2 |
| 30 | 5 | 0.0084 | 0.0411 | 32.8 | 0.0099 | 0.0485 | 33.8 |
| 35 | 5 | 0.0103 | 0.0502 | 29.1 | 0.0109 | 0.0532 | 30.4 |
| 40 | 5 | 0.0130 | 0.0633 | 25.5 | 0.0120 | 0.0583 | 26.9 |
| 45 | 5 | 0.0170 | 0.0815 | 22.0 | 0.0144 | 0.0694 | 23.4 |
| 50 | 5 | 0.0226 | 0.1073 | 18.8 | 0.0189 | 0.0904 | 20.0 |
| 55 | 5 | 0.0306 | 0.1422 | 15.7 | 0.0262 | 0.1234 | 16.7 |
| 60 | 5 | 0.0431 | 0.1950 | 12.9 | 0.0373 | 0.1708 | 13.7 |
| 65 | 5 | 0.0623 | 0.2698 | 10.4 | 0.0538 | 0.2376 | 11.0 |
| 70 | 5 | 0.0889 | 0.3626 | 8.3 | 0.0793 | 0.3309 | 8.7 |
| 75 | 5 | 0.1230 | 0.4647 | 6.6 | 0.1169 | 0.4485 | 6.7 |
| 80 | 5 | 0.1657 | 0.5714 | 5.2 | 0.1634 | 0.5675 | 5.2 |
| 85 | 5 | 0.2179 | 0.6725 | 4.2 | 0.2237 | 0.6837 | 4.1 |
| 90 | 5 | 0.2780 | 0.7599 | 3.4 | 0.2945 | 0.7812 | 3.2 |
| 95 | 5 | 0.3459 | 0.8300 | 2.8 | 0.3759 | 0.8553 | 2.6 |
| 100+ | … | 0.4325 | ... | 2.3 | 0.4808 | ... | 2.1 |
Table A6.
Ionian Islands.
| Males | Females | ||||||
|---|---|---|---|---|---|---|---|
| x | n | nmx | nqx | ex | nmx | nqx | ex |
| 0 | 1 | 0.1267 | 0.1168 | 50.2 | 0.0897 | 0.0844 | 56.6 |
| 1 | 4 | 0.0153 | 0.0588 | 55.7 | 0.0126 | 0.0487 | 60.8 |
| 5 | 5 | 0.0038 | 0.0186 | 55.1 | 0.0029 | 0.0146 | 59.8 |
| 10 | 5 | 0.0024 | 0.0118 | 51.1 | 0.0018 | 0.0088 | 55.7 |
| 15 | 5 | 0.0035 | 0.0173 | 46.7 | 0.0027 | 0.0134 | 51.1 |
| 20 | 5 | 0.0050 | 0.0245 | 42.5 | 0.0037 | 0.0183 | 46.8 |
| 25 | 5 | 0.0056 | 0.0277 | 38.5 | 0.0044 | 0.0216 | 42.6 |
| 30 | 5 | 0.0067 | 0.0330 | 34.5 | 0.0052 | 0.0256 | 38.5 |
| 35 | 5 | 0.0084 | 0.0410 | 30.6 | 0.0061 | 0.0302 | 34.5 |
| 40 | 5 | 0.0108 | 0.0527 | 26.8 | 0.0073 | 0.0360 | 30.4 |
| 45 | 5 | 0.0144 | 0.0697 | 23.2 | 0.0094 | 0.0460 | 26.5 |
| 50 | 5 | 0.0197 | 0.0941 | 19.7 | 0.0130 | 0.0630 | 22.6 |
| 55 | 5 | 0.0272 | 0.1278 | 16.5 | 0.0187 | 0.0896 | 19.0 |
| 60 | 5 | 0.0391 | 0.1786 | 13.5 | 0.0276 | 0.1296 | 15.6 |
| 65 | 5 | 0.0572 | 0.2506 | 10.9 | 0.0417 | 0.1893 | 12.5 |
| 70 | 5 | 0.0825 | 0.3413 | 8.7 | 0.0634 | 0.2743 | 9.9 |
| 75 | 5 | 0.1154 | 0.4436 | 6.9 | 0.0955 | 0.3845 | 7.6 |
| 80 | 5 | 0.1578 | 0.5536 | 5.4 | 0.1402 | 0.5124 | 5.8 |
| 85 | 5 | 0.2098 | 0.6587 | 4.3 | 0.1987 | 0.6401 | 4.5 |
| 90 | 5 | 0.2704 | 0.7505 | 3.5 | 0.2695 | 0.7516 | 3.5 |
| 95 | 5 | 0.3391 | 0.8244 | 2.8 | 0.3520 | 0.8377 | 2.7 |
| 100+ | … | 0.4270 | ... | 2.3 | 0.4584 | ... | 2.2 |
Table A7.
Crete 1928.
| Males | Females | ||||||
|---|---|---|---|---|---|---|---|
| x | n | nmx | nqx | ex | nmx | nqx | ex |
| 0 | 1 | 0.0865 | 0.0814 | 57.8 | 0.0762 | 0.0721 | 60.3 |
| 1 | 4 | 0.0084 | 0.0329 | 61.9 | 0.0094 | 0.0368 | 64.0 |
| 5 | 5 | 0.0021 | 0.0107 | 59.9 | 0.0022 | 0.0109 | 62.4 |
| 10 | 5 | 0.0014 | 0.0071 | 55.5 | 0.0013 | 0.0066 | 58.0 |
| 15 | 5 | 0.0021 | 0.0107 | 50.9 | 0.0020 | 0.0099 | 53.4 |
| 20 | 5 | 0.0031 | 0.0153 | 46.4 | 0.0027 | 0.0136 | 48.9 |
| 25 | 5 | 0.0035 | 0.0175 | 42.1 | 0.0033 | 0.0163 | 44.5 |
| 30 | 5 | 0.0042 | 0.0208 | 37.8 | 0.0040 | 0.0197 | 40.2 |
| 35 | 5 | 0.0054 | 0.0268 | 33.6 | 0.0048 | 0.0239 | 36.0 |
| 40 | 5 | 0.0073 | 0.0360 | 29.4 | 0.0060 | 0.0295 | 31.8 |
| 45 | 5 | 0.0103 | 0.0501 | 25.4 | 0.0079 | 0.0387 | 27.7 |
| 50 | 5 | 0.0148 | 0.0714 | 21.6 | 0.0111 | 0.0541 | 23.7 |
| 55 | 5 | 0.0214 | 0.1019 | 18.1 | 0.0163 | 0.0784 | 19.9 |
| 60 | 5 | 0.0319 | 0.1482 | 14.8 | 0.0244 | 0.1153 | 16.4 |
| 65 | 5 | 0.0477 | 0.2138 | 11.9 | 0.0374 | 0.1717 | 13.2 |
| 70 | 5 | 0.0703 | 0.2992 | 9.5 | 0.0577 | 0.2529 | 10.4 |
| 75 | 5 | 0.0877 | 0.4006 | 7.5 | 0.0877 | 0.3593 | 8.0 |
| 80 | 5 | 0.1422 | 0.5163 | 5.9 | 0.1314 | 0.4896 | 6.1 |
| 85 | 5 | 0.1938 | 0.6295 | 4.6 | 0.1889 | 0.6215 | 4.6 |
| 90 | 5 | 0.2551 | 0.7306 | 3.7 | 0.2597 | 0.7389 | 3.6 |
| 95 | 5 | 0.3255 | 0.8125 | 2.9 | 0.3427 | 0.8302 | 2.8 |
| 100+ | … | 0.4162 | ... | 2.4 | 0.4499 | ... | 2.2 |
Table A8.
Cyclades 1928.
| Males | Females | ||||||
|---|---|---|---|---|---|---|---|
| x | n | nmx | nqx | ex | nmx | nqx | ex |
| 0 | 1 | 0.1041 | 0.0972 | 54.2 | 0.0866 | 0.0816 | 57.4 |
| 1 | 4 | 0.0113 | 0.0437 | 59.1 | 0.0118 | 0.0459 | 61.5 |
| 5 | 5 | 0.0028 | 0.0140 | 57.7 | 0.0028 | 0.0137 | 60.4 |
| 10 | 5 | 0.0018 | 0.0091 | 53.5 | 0.0017 | 0.0083 | 56.2 |
| 15 | 5 | 0.0027 | 0.0135 | 48.9 | 0.0025 | 0.0125 | 51.6 |
| 20 | 5 | 0.0039 | 0.0192 | 44.6 | 0.0035 | 0.0172 | 47.3 |
| 25 | 5 | 0.0044 | 0.0219 | 40.4 | 0.0041 | 0.0204 | 43.1 |
| 30 | 5 | 0.0053 | 0.0261 | 36.3 | 0.0049 | 0.0242 | 38.9 |
| 35 | 5 | 0.0067 | 0.0330 | 32.2 | 0.0058 | 0.0287 | 34.8 |
| 40 | 5 | 0.0089 | 0.0434 | 28.2 | 0.0070 | 0.0345 | 30.7 |
| 45 | 5 | 0.0121 | 0.0589 | 24.3 | 0.0091 | 0.0443 | 26.8 |
| 50 | 5 | 0.0170 | 0.0818 | 20.7 | 0.0125 | 0.0609 | 22.9 |
| 55 | 5 | 0.0241 | 0.1139 | 17.3 | 0.0182 | 0.0871 | 19.2 |
| 60 | 5 | 0.0352 | 0.1624 | 14.2 | 0.0269 | 0.1264 | 15.8 |
| 65 | 5 | 0.0521 | 0.2312 | 11.4 | 0.0407 | 0.1854 | 12.7 |
| 70 | 5 | 0.0760 | 0.3193 | 9.1 | 0.0621 | 0.2696 | 10.0 |
| 75 | 5 | 0.1077 | 0.4214 | 7.2 | 0.0938 | 0.3790 | 7.7 |
| 80 | 5 | 0.1496 | 0.5345 | 5.7 | 0.1383 | 0.5074 | 5.9 |
| 85 | 5 | 0.2015 | 0.6439 | 4.5 | 0.1965 | 0.6361 | 4.5 |
| 90 | 5 | 0.2625 | 0.7404 | 3.6 | 0.2674 | 0.7489 | 3.5 |
| 95 | 5 | 0.3321 | 0.8183 | 2.9 | 0.3499 | 0.8361 | 2.7 |
| 100+ | … | 0.4214 | ... | 2.4 | 0.4565 | ... | 2.2 |
Table A9.
Aegean Islands 1928.
| Males | Females | ||||||
|---|---|---|---|---|---|---|---|
| x | n | nmx | nqx | ex | nmx | nqx | ex |
| 0 | 1 | 0.1086 | 0.1012 | 53.4 | 0.0917 | 0.0862 | 56.1 |
| 1 | 4 | 0.0120 | 0.0467 | 58.4 | 0.0131 | 0.0506 | 60.3 |
| 5 | 5 | 0.0030 | 0.0149 | 57.2 | 0.0031 | 0.0152 | 59.5 |
| 10 | 5 | 0.0019 | 0.0096 | 53.0 | 0.0018 | 0.0092 | 55.3 |
| 15 | 5 | 0.0029 | 0.0143 | 48.5 | 0.0028 | 0.0139 | 50.8 |
| 20 | 5 | 0.0041 | 0.0203 | 44.1 | 0.0038 | 0.0191 | 46.5 |
| 25 | 5 | 0.0047 | 0.0231 | 40.0 | 0.0045 | 0.0225 | 42.4 |
| 30 | 5 | 0.0056 | 0.0275 | 35.9 | 0.0054 | 0.0266 | 38.3 |
| 35 | 5 | 0.0070 | 0.0346 | 31.8 | 0.0063 | 0.0312 | 34.2 |
| 40 | 5 | 0.0093 | 0.0453 | 27.9 | 0.0075 | 0.0370 | 30.3 |
| 45 | 5 | 0.0126 | 0.0611 | 24.1 | 0.0096 | 0.0470 | 26.3 |
| 50 | 5 | 0.0176 | 0.0844 | 20.5 | 0.0132 | 0.0642 | 22.5 |
| 55 | 5 | 0.0248 | 0.1168 | 17.1 | 0.0191 | 0.0912 | 18.9 |
| 60 | 5 | 0.0361 | 0.1659 | 14.0 | 0.0281 | 0.1316 | 15.5 |
| 65 | 5 | 0.0532 | 0.2354 | 11.3 | 0.0423 | 0.1917 | 12.4 |
| 70 | 5 | 0.0774 | 0.3241 | 9.0 | 0.0642 | 0.2772 | 9.8 |
| 75 | 5 | 0.1094 | 0.4262 | 7.1 | 0.0966 | 0.3879 | 7.6 |
| 80 | 5 | 0.1514 | 0.5387 | 5.6 | 0.1414 | 0.5154 | 5.8 |
| 85 | 5 | 0.2033 | 0.6471 | 4.4 | 0.2000 | 0.6425 | 4.4 |
| 90 | 5 | 0.2642 | 0.7427 | 3.6 | 0.2708 | 0.7532 | 3.5 |
| 95 | 5 | 0.3336 | 0.8197 | 2.9 | 0.3532 | 0.8387 | 2.7 |
| 100+ | … | 0.4226 | ... | 2.4 | 0.4595 | ... | 2.2 |
Table A10.
Peloponnese 1928.
| Males | Females | ||||||
|---|---|---|---|---|---|---|---|
| x | n | nmx | nqx | ex | nmx | nqx | ex |
| 0 | 1 | 0.1479 | 0.1346 | 46.6 | 0.1172 | 0.1089 | 49.5 |
| 1 | 4 | 0.0195 | 0.0741 | 52.8 | 0.0202 | 0.0768 | 54.5 |
| 5 | 5 | 0.0047 | 0.0233 | 52.9 | 0.0048 | 0.0237 | 54.9 |
| 10 | 5 | 0.0029 | 0.0145 | 49.1 | 0.0028 | 0.0141 | 51.2 |
| 15 | 5 | 0.0042 | 0.0210 | 44.8 | 0.0044 | 0.0218 | 46.9 |
| 20 | 5 | 0.0060 | 0.0297 | 40.7 | 0.0061 | 0.0299 | 42.8 |
| 25 | 5 | 0.0068 | 0.0334 | 36.9 | 0.0070 | 0.0343 | 39.1 |
| 30 | 5 | 0.0081 | 0.0397 | 33.1 | 0.0081 | 0.0396 | 35.4 |
| 35 | 5 | 0.0100 | 0.0486 | 29.3 | 0.0091 | 0.0444 | 31.7 |
| 40 | 5 | 0.0127 | 0.0614 | 25.7 | 0.0102 | 0.0500 | 28.1 |
| 45 | 5 | 0.0165 | 0.0795 | 22.2 | 0.0125 | 0.0609 | 24.4 |
| 50 | 5 | 0.0221 | 0.1051 | 18.9 | 0.0168 | 0.0806 | 20.9 |
| 55 | 5 | 0.0300 | 0.1398 | 15.8 | 0.0236 | 0.1115 | 17.5 |
| 60 | 5 | 0.0424 | 0.1923 | 13.0 | 0.0339 | 0.1565 | 14.3 |
| 65 | 5 | 0.0614 | 0.2667 | 10.5 | 0.0496 | 0.2212 | 11.5 |
| 70 | 5 | 0.0879 | 0.3591 | 8.3 | 0.0739 | 0.3120 | 9.0 |
| 75 | 5 | 0.1217 | 0.4613 | 6.6 | 0.1096 | 0.4276 | 7.0 |
| 80 | 5 | 0.1644 | 0.5686 | 5.3 | 0.1557 | 0.5499 | 5.4 |
| 85 | 5 | 0.2166 | 0.6703 | 4.2 | 0.2154 | 0.6699 | 4.2 |
| 90 | 5 | 0.2768 | 0.7584 | 3.4 | 0.2863 | 0.7719 | 3.3 |
| 95 | 5 | 0.3448 | 0.8291 | 2.8 | 0.3680 | 0.8498 | 2.6 |
| 100+ | … | 0.4316 | ... | 2.3 | 0.4733 | ... | 2.1 |
Table A11.
Central Greece and Euboea 1928.
| Males | Females | ||||||
|---|---|---|---|---|---|---|---|
| x | n | nmx | nqx | ex | nmx | nqx | ex |
| 0 | 1 | 0.1388 | 0.1270 | 48.1 | 0.1119 | 0.1044 | 50.8 |
| 1 | 4 | 0.0176 | 0.0674 | 54.0 | 0.0186 | 0.0711 | 55.6 |
| 5 | 5 | 0.0043 | 0.0213 | 53.8 | 0.0044 | 0.0218 | 55.8 |
| 10 | 5 | 0.0027 | 0.0133 | 50.0 | 0.0026 | 0.0130 | 52.0 |
| 15 | 5 | 0.0039 | 0.0194 | 45.6 | 0.0040 | 0.0201 | 47.6 |
| 20 | 5 | 0.0056 | 0.0275 | 41.5 | 0.0056 | 0.0276 | 43.6 |
| 25 | 5 | 0.0063 | 0.0309 | 37.6 | 0.0064 | 0.0317 | 39.7 |
| 30 | 5 | 0.0075 | 0.0368 | 33.7 | 0.0075 | 0.0368 | 35.9 |
| 35 | 5 | 0.0093 | 0.0453 | 29.9 | 0.0085 | 0.0416 | 32.2 |
| 40 | 5 | 0.0119 | 0.0577 | 26.2 | 0.0097 | 0.0473 | 28.5 |
| 45 | 5 | 0.0156 | 0.0753 | 22.6 | 0.0119 | 0.0581 | 24.8 |
| 50 | 5 | 0.0211 | 0.1005 | 19.2 | 0.0161 | 0.0773 | 21.2 |
| 55 | 5 | 0.0288 | 0.1348 | 16.1 | 0.0227 | 0.1074 | 17.7 |
| 60 | 5 | 0.0410 | 0.1866 | 13.2 | 0.0327 | 0.1516 | 14.5 |
| 65 | 5 | 0.0597 | 0.2600 | 10.6 | 0.0481 | 0.2155 | 11.7 |
| 70 | 5 | 0.0856 | 0.3517 | 8.5 | 0.0720 | 0.3054 | 9.2 |
| 75 | 5 | 0.1191 | 0.4540 | 6.7 | 0.1071 | 0.4201 | 7.1 |
| 80 | 5 | 0.1617 | 0.5625 | 5.3 | 0.1529 | 0.5435 | 5.5 |
| 85 | 5 | 0.2138 | 0.6656 | 4.3 | 0.2125 | 0.6649 | 4.2 |
| 90 | 5 | 0.2741 | 0.7552 | 3.4 | 0.2834 | 0.7685 | 3.3 |
| 95 | 5 | 0.3425 | 0.8272 | 2.8 | 0.3652 | 0.8478 | 2.6 |
| 100+ | … | 0.4297 | ... | 2.3 | 0.4706 | ... | 2.1 |
| 1 | His work was inovative when it was first published and we consider the results reliable and trustworthy, even by today’s standard. He applied survival ratios from model life tables to project forwards and backwards (inverse projection) successive censuses. Any discrepancies between the two projections (forwards and backwards) are attributed either to migration or to under-enumeration. Therefore, Valaoras derives population structures, for each sex separately, for years ending in 0 and 5 from 1860 to 1965. Moreover, he provides estimates of live births, infant deaths and all deaths for the central year of each quinquennial period and estimates of the corresponding crude rates of the vital events per 1000 population. |
| 2 | Only a ratio well above the unit is a clear evidence that women were not treated differently than men. |
| 3 | The novel “The Murderess” was first published in the journal Panathinaia in sequels between January and June 1903. It was first published in book in 1912, a year after the death of his author. It is the edition of 1912 that we used here to quote the text in a free-style translation from the Greek language. |
| 4 | See the “Methodology” section for details. |
References
- Beltrán Tapia, Francisco J., and Michail Raftakis. 2021. Sex Ratios and Gender Discrimination in Modern Greece. Population Studies 75: 1–18. [Google Scholar] [CrossRef]
- Coale, Ansley J. 1991. Excess Female Mortality and the Balance of the Sexes in the Population: An Estimate of the Number of ‘Missing Females’. Population and Development Review 17: 517–23. [Google Scholar] [CrossRef]
- Coale, Ansley J., Paul Demeny, and Barbara Vaughan. 1983. Regional Model Life Tables and Stable Populations: Studies in Population. Amsterdam: Elsevier. [Google Scholar]
- Corbett, Percy Ellwood. 1930. The Roman Law of Marriage. Oxford: Clarendon Press. [Google Scholar]
- Gavalas, Vasilis. 2001. Demographic Reconstruction of a Greek Island Community: Naoussa and Kostos, on Paros, 1894–1998. Unpublished Ph.D. thesis, London School of Economics and Political Science, London, UK. [Google Scholar]
- Gavalas, Vasilis. 2015. O kosmos pou Kerdisame. Plethesmiaki Geografia tis Syghronis Elladas [The World We Have Gained. Population Geography of Modern Greece]. Mytilene: Reprographics. [Google Scholar]
- Gavalas, Vasilis. 2018. O plythismos ton nision tou Archipelagous: 1920–2020 enas aionas dimografikis kai koinonikis ekseliskis stis aigiakes koinonies [The Population of the Archipelago. 1920–2020: A Century of Demographic and Social Change in the Aegean Archipelago]. Thessaloniki: Disigma Pub., p. 2020. [Google Scholar]
- Hionidou, Violeta. 1993. The Demography of a Greek Island, Mykonos 1859–1959. A Family Reconstitution Study. Unpublished Ph.D. dissertation, University of Liverpool, Liverpool, UK. [Google Scholar]
- Jütting, Johannes, Christian Morrisson, Jeff Dayton-Johnson, and Denis Drechsler. 2008. Measuring Gender (In)Equality: The OECD Gender, Institutions and Development Data Base. Journal of Human Development and Capabilities 9: 65–86. [Google Scholar]
- Marco-Gracia, Francisco J., and Francisco J. Beltrán Tapia. 2021. Son Preference, Gender Discrimination, and Missing Girls in Rural Spain, 1750–1950. Population and Development Review 47: 665–89. [Google Scholar] [CrossRef]
- Ministère de l’ Economie Nationale-Direction de la Statistique. 1924. Statistique du Mouvement de la Population Pendant l’ année 1921. Athènes: Imprimerie Nationale. [Google Scholar]
- Ministère de l’ Economie Nationale-Direction de la Statistique. 1927. Statistique du Mouvement de la Population Pendant l’ année 1922. Athènes: Imprimerie Nationale. [Google Scholar]
- Ministère de l’ Economie Nationale-Direction de la Statistique. 1928a. Statistique du Mouvement de la Population Pendant l’ année 1923. Athènes: Imprimerie Nationale. [Google Scholar]
- Ministère de l’ Economie Nationale-Direction de la Statistique. 1928b. Statistique du Mouvement de la Population Pendant l’ année 1924. Athènes: Imprimerie Nationale. [Google Scholar]
- Ministère de l’ Economie Nationale-Direction de la Statistique. 1929. Statistique du Mouvement de la Population Pendant l’ année 1925. Athènes: Imprimerie Nationale. [Google Scholar]
- Ministère de l’ Economie Nationale-Direction de la Statistique. 1930a. Statistique du Mouvement de la Population Pendant l’ année 1926. Athènes: Imprimerie Nationale. [Google Scholar]
- Ministère de l’ Economie Nationale-Direction de la Statistique. 1930b. Statistique du Mouvement de la Population Pendant l’ année 1927. Athènes: Imprimerie Nationale. [Google Scholar]
- Ministère de l’ Economie Nationale-Direction de la Statistique. 1931a. Statistique du Mouvement de la Population Pendant l’ année 1928. Athènes: Imprimerie Nationale. [Google Scholar]
- Ministère de l’ Economie Nationale-Direction de la Statistique. 1931b. Statistique du Mouvement de la Population Pendant l’ année 1929. Athènes: Imprimerie Nationale. [Google Scholar]
- Ministère de l’ Economie Nationale-Direction de la Statistique. 1939. Statistique du Mouvement de la Population Pendant l’ année 1938. Athènes: Imprimerie Nationale. [Google Scholar]
- Pahi, Olga. 2013. I thesi tis gynaikas stin Ellada tou Mesopolemou [The position of woman in Greece in the interwar period]. Anistoriton 10: 1–7. [Google Scholar]
- Papadakis, Mihail, and Kleon Tsimpos. 1993. Perifereiakoi pinakes epiviosis tou ellinikou plithismou [Regional life tables of the Greek population]. Athens: Vita Medical Publications. [Google Scholar]
- Papadiamantis, Alexandros. 1912. I fonissa [The Murderess]. Athens: Fexi. [Google Scholar]
- Papastefanaki, Leda. 2019. Family, Gender, and Labour in the Greek Mines, 1860–1940. International Review of Social History. 65: 191–230. [Google Scholar]
- Sahni, Mohit, Neeraj Verma, D. Narula, Raji Mathew Varghese, V. Sreenivas, and Jacob M. Puliyel. 2008. Missing Girls in India: Infanticide, Feticide and Made-to-Order Pregnancies? Insights from Hospital-Based Sex-Ratio-at-Birth over the Last Century. Edited by Jacqueline Ho. PLoS ONE 3: e2224. [Google Scholar] [CrossRef]
- Saliba, Zizi. 2002. Gynaikes Ergatries stin Elliniki Viomihania kai Viotehnia (1870–1922) [Female Workers in the Greek Industry and Artisanship (1870–1922). Athens: Centre of Modern Greek Studies. [Google Scholar]
- Sarmah, Chavan Kr, and Jiten Hazarika. 2015. Educational Gender Gap in Assam: A Statistical Analysis. International Journal of Humanities, Arts, Medicine and Sciences (BEST: IJHAMS) 3: 125–30. [Google Scholar]
- Siampos, Georgios S. 1973. Dimografiki Exelixis tis Neoteras Ellados (1821–1985) [Demographic Evolution of Modern Greece (1821–1985)]. Athens: Tzanettis. [Google Scholar]
- Siampos, Georgios S. 1993. Dimografia [Demography]. Athens: Sbilias Pub. [Google Scholar]
- Statistique Générale de la Grèce. 1933. Résultats Statistique du Recensement de la Population de la Grèce du 15–16 Mai 1928. Athènes: Imprimerie nationale, 6 vols. [Google Scholar]
- Tarver, James, and Che-Fu Lee. 1968. Sex Ratio of registered live births in the United States, 1942–1943. Demography 5: 374–81. [Google Scholar]
- Theodoropoulou, Aura. 1916. To Kyriako Scholeio Ergatrion [The Sunday School for Female Workers]. Bulletin of the Educational Association of 1915. Athens: Educational Association, pp. 9–11. [Google Scholar]
- UNFPA. 2011. Trends in Sex Ratio at Birth and Estimates of Girls Missing at Birth in India (2001–2008). New Delhi: United Nations Population Fund-India. [Google Scholar]
- United Nations. 1982. Model Life Tables for Developing Countries. New York: United Nations Publication, Sales No. E.81.XIII.7. [Google Scholar]
- Valaoras, Vasilios G. 1960. A Reconstruction of the Demographic History of Modern Greece. The Milbank Memorial Fund Quarterly 38: 115–39. [Google Scholar] [CrossRef]
- Vernier, Bernard. 1984. Putting Kin and Kinship to Good Use: The Circulation of Goods, Labour, and Names on Karpathos (Greece). In Interest and Emotion: Essays on the Study of Family and Kinship. Edited by Hans Medick and David W. Sabean. Cambridge: Cambridge University Press, pp. 28–76. [Google Scholar]
- Yi, Zeng, Tu Ping, Gu Baochang, Xu Yi, Li Bohua, and Li Yongpiing. 1993. Causes and Implications of the Recent Increase in the Reported Sex Ratio at Birth in China. Population and Development Review 19: 283–302. [Google Scholar] [CrossRef]
Figure 1.
Sex ratio by age. Greece 1920–1928. Source: Greek census returns 1920, 1928.

Figure 2.
Sex ratio at birth (SRB). Greece 1921–1938. Source: Ministère de l’ Economie Nationale-Direction de la Statistique (1924, 1927, 1928a, 1928b, 1929, 1930a, 1930b, 1931a, 1931b, 1939).

Figure 3.
Map 1, Female life expectancy by Geographical Department. Greece 1928.

Figure 4.
Map 2, Sex-differentials in life expectancy at birth by Geographical Department. Greece 1928.
Figure 4.
Map 2, Sex-differentials in life expectancy at birth by Geographical Department. Greece 1928.

Figure 5.
Sex differential mortality in Greece and its ten Geographical Departments in 1928. Source: Life tables in Appendix A.
Figure 5.
Sex differential mortality in Greece and its ten Geographical Departments in 1928. Source: Life tables in Appendix A.

Table 1.
Geographical Departments by sex-differential mortality. Greece 1928.
| Difference in Years of Life Expectancy (Females-Males) | ||||
|---|---|---|---|---|
| Geographical Department | F(e0)-M(e0) | F(e5)-M(e5) | F(e60)-M(e60) | Average of Sex-Differential Mortality Indices |
| Thessaly | −0.2 | −0.3 | 0.9 | 1.00 |
| Thrace | 1.6 | 1.2 | 1.2 | 1.07 |
| Macedonia | 2.2 | 1.3 | 1.2 | 1.08 |
| Central Greece and Euboia | 2.7 | 2.0 | 1.3 | 1.12 |
| Peloponesse | 2.9 | 2.0 | 1.3 | 1.12 |
| Aegean Islands | 2.8 | 2.4 | 1.5 | 1.14 |
| Crete | 2.5 | 2.5 | 1.6 | 1.15 |
| Epirus | 4.3 | 2.5 | 1.4 | 1.16 |
| Cyclades | 3.2 | 2.7 | 1.6 | 1.16 |
| Ionian islands | 6.4 | 4.7 | 2.1 | 1.33 |
| Greece | 2.5 | 1.7 | 1.3 | 1.10 |
Source: Model life tables based on census returns and vital statistics. See text for details.
Table 2.
Literacy status and sex-differential mortality.
| Percent Literate at Ages 25–29 | (1) | (2) | ||
|---|---|---|---|---|
| Males | Females | Literate Males Per One Literate Female | Average of Sex-Differential Mortality Indices | |
| Thessaly | 87% | 35% | 2.45 | 1.00 |
| Thrace | 57% | 27% | 2.09 | 1.07 |
| Macedonia | 79% | 39% | 2.03 | 1.08 |
| Central Greece and Euboia | 89% | 56% | 1.59 | 1.12 |
| Peloponesse | 91% | 44% | 2.07 | 1.12 |
| Aegean Islands | 82% | 59% | 1.39 | 1.13 |
| Crete | 87% | 44% | 2.00 | 1.15 |
| Epirus | 78% | 29% | 2.65 | 1.16 |
| Cyclades | 77% | 60% | 1.30 | 1.16 |
| Ionian islands | 84% | 45% | 1.85 | 1.33 |
| Greece | 84% | 45% | 1.87 | 1.10 |
Source: Greek census of 1928. Own elaboration. Pearsons’ r (1)∗(2) = −0.29 p-value = 0.417.
Publisher’s Note: MDPI stays neutral with regard to jurisdictional claims in published maps and institutional affiliations. |
© 2022 by the authors. Licensee MDPI, Basel, Switzerland. This article is an open access article distributed under the terms and conditions of the Creative Commons Attribution (CC BY) license (https://creativecommons.org/licenses/by/4.0/).
Share and Cite
MDPI and ACS Style
Gavalas, V.S.; Baltas, P. Gender Inequalities and Sex-Differential Mortality in Pre-War Greece: A Regional Perspective. Genealogy 2022, 6, 5. https://0-doi-org.brum.beds.ac.uk/10.3390/genealogy6010005
AMA Style
Gavalas VS, Baltas P. Gender Inequalities and Sex-Differential Mortality in Pre-War Greece: A Regional Perspective. Genealogy. 2022; 6(1):5. https://0-doi-org.brum.beds.ac.uk/10.3390/genealogy6010005
Chicago/Turabian StyleGavalas, Vasilis S., and Pavlos Baltas. 2022. "Gender Inequalities and Sex-Differential Mortality in Pre-War Greece: A Regional Perspective" Genealogy 6, no. 1: 5. https://0-doi-org.brum.beds.ac.uk/10.3390/genealogy6010005