
Biomimetic Approach for the Elaboration of Highly Hydrophobic Surfaces: Study of the Links between Morphology and Wettability


Abstract
:1. Introduction
2. Materials and Methods
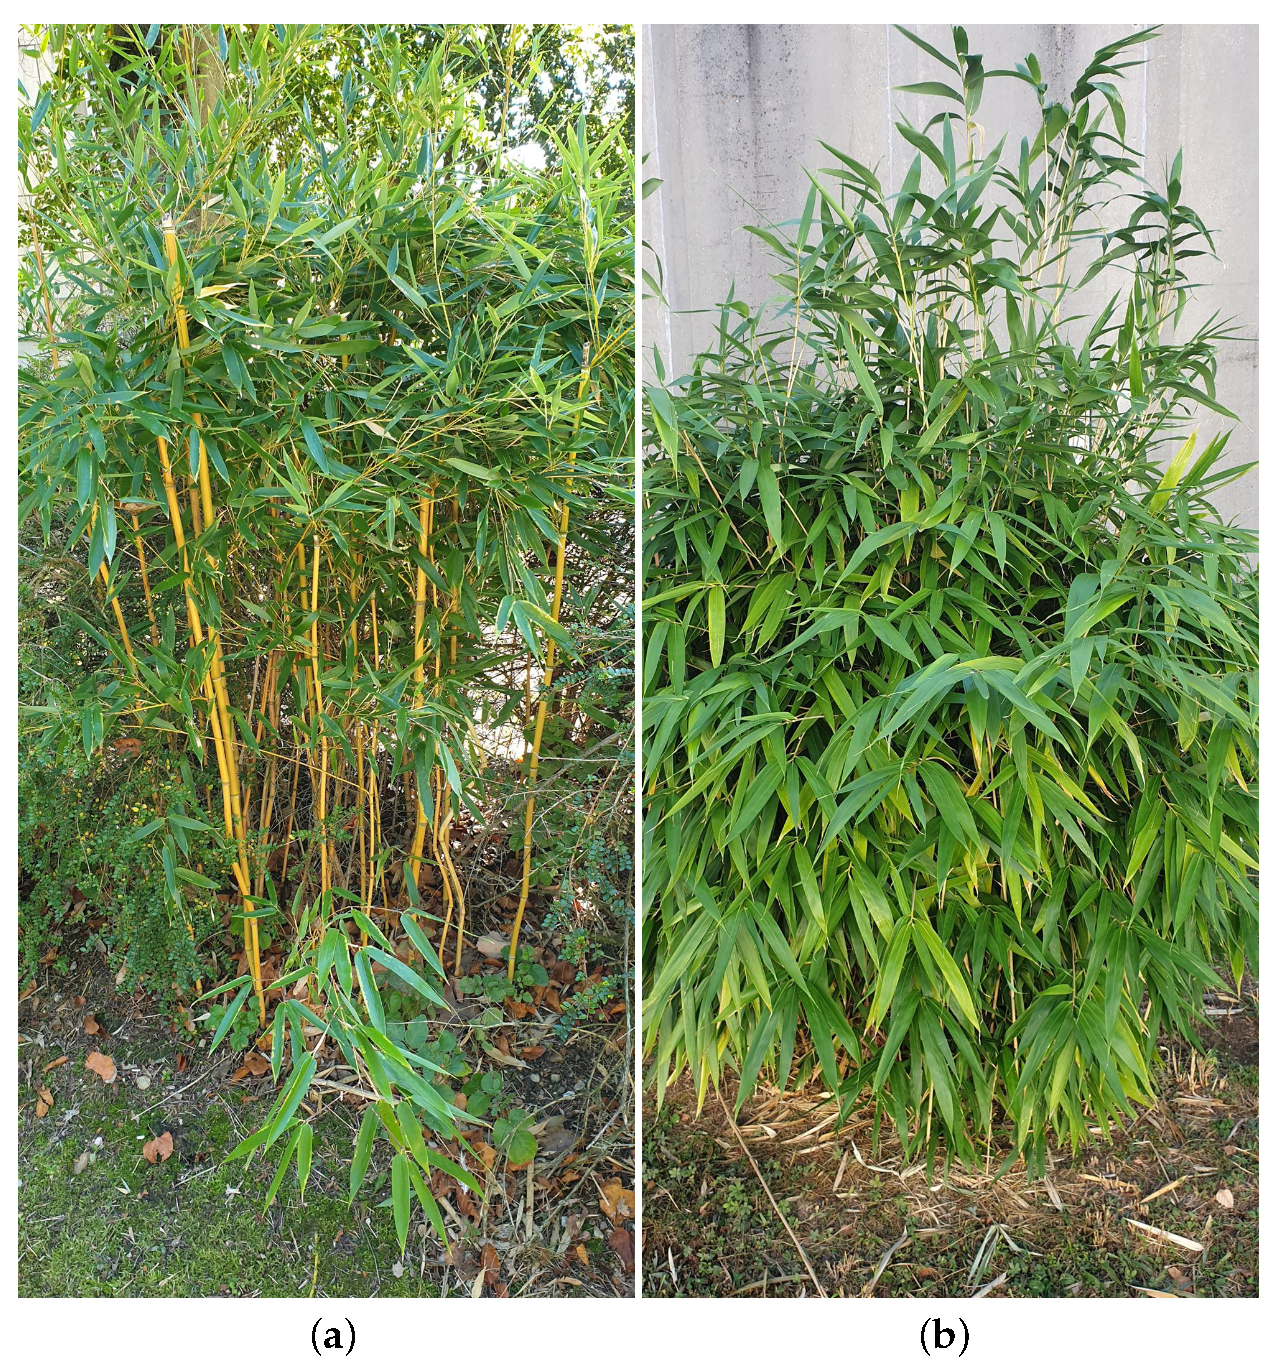
2.1. Leaves
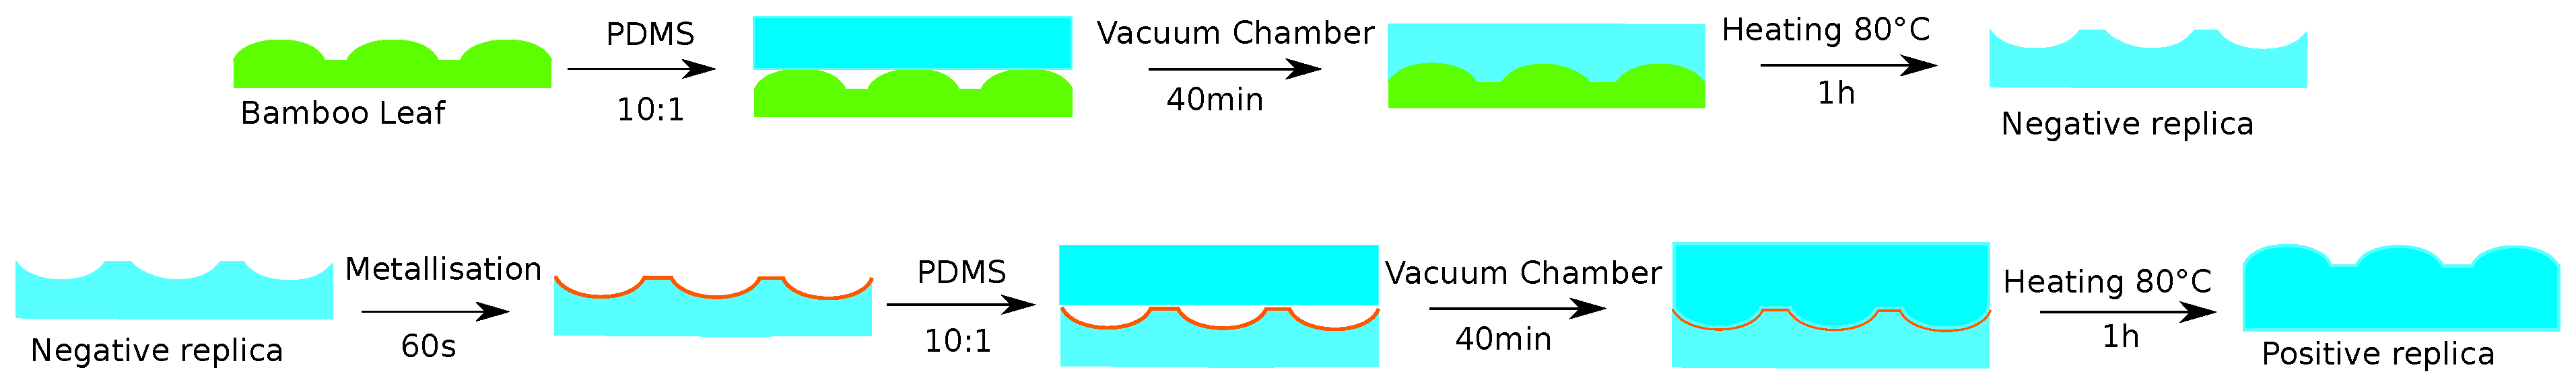
2.2. PDMS Replicas
2.3. Topographic Characterization
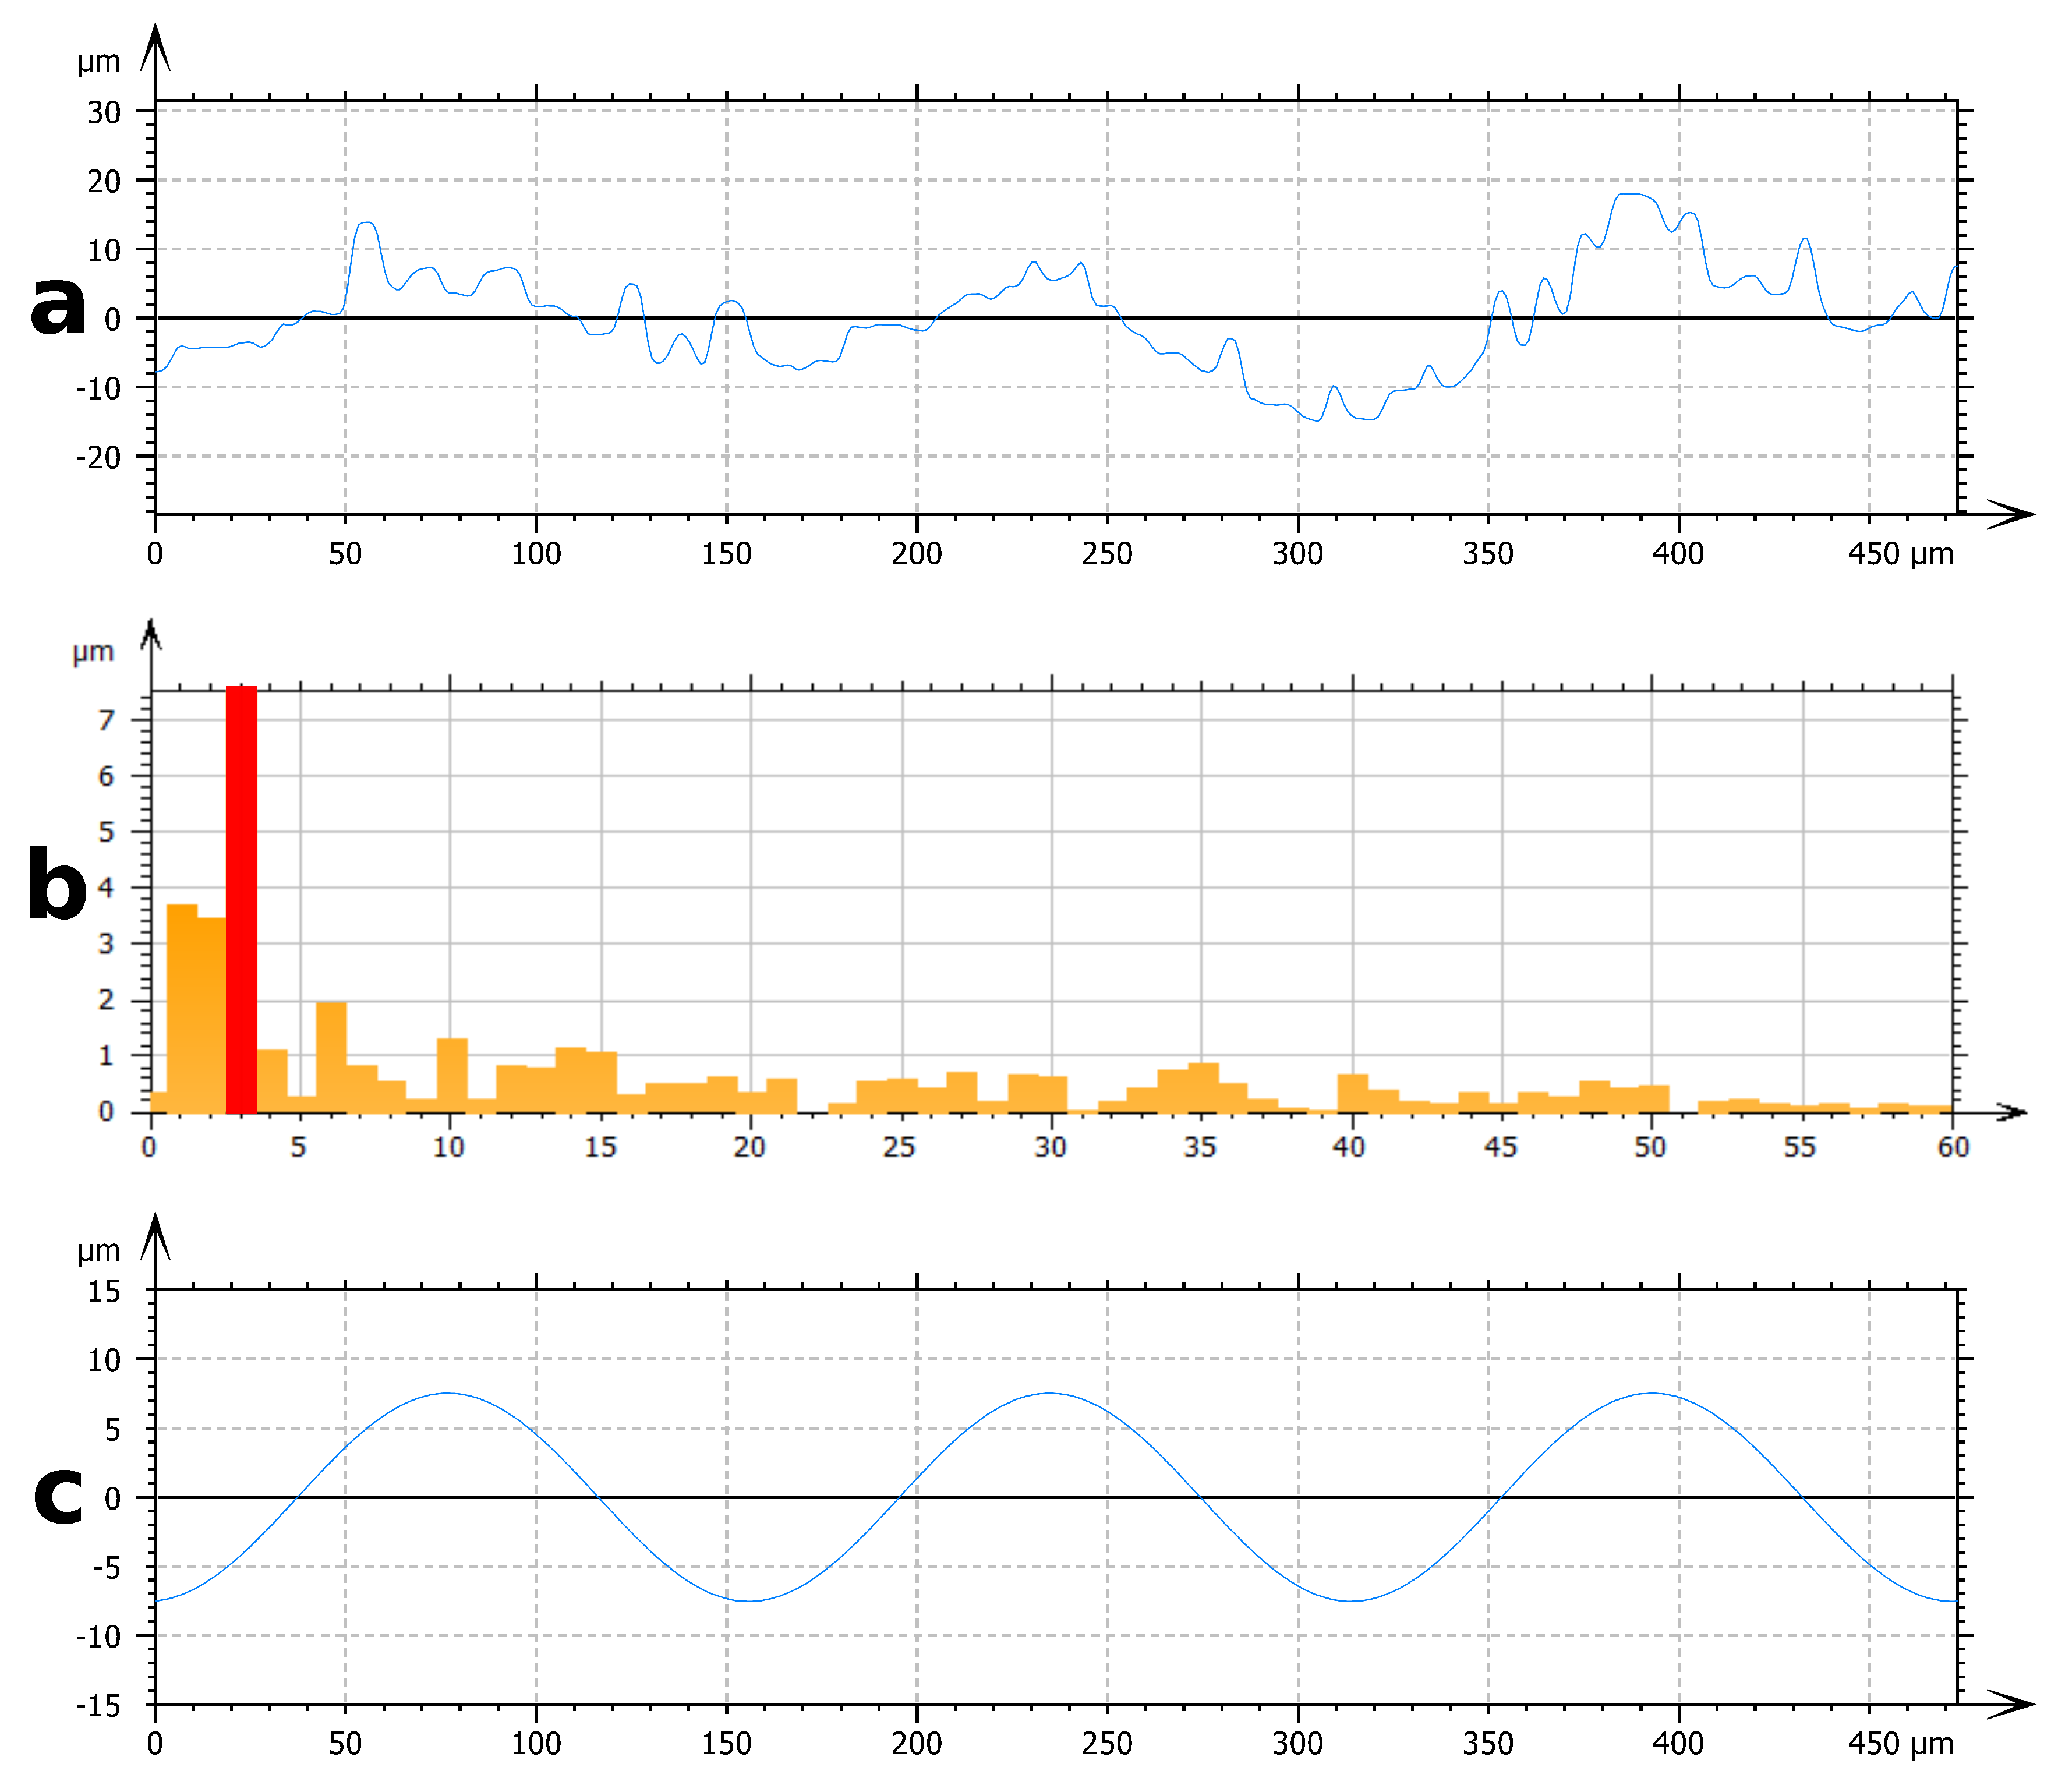
- The first filtering method involves Fast Fourier Transform (FFT). This method is used to characterize the range of periodical structures. FFT is performed on an experimental profile (Figure 3a) and provides a frequency spectrum (Figure 3b). Due to the multi-scale nature of these surfaces, many signals are present on the frequency spectrum. Frequencies corresponding to the periods identified by the SEM observation are isolated. These frequencies correspond to important signals on the frequency spectrum. By inverse FFT, the selected frequency profile is obtained (Figure 3c). The filtered profile is used to measure the height of the texture associated with each periodic roughness scale.
- The second filtering process involves Gaussian filters [30]. Gaussian filters are configured by a cut-off wavelength . By applying a Gaussian filter to a surface, two surfaces are obtained (Figure 4). The first one contains the wavelengths lower than the cut-off value (Figure 4b). The second one contains the wavelengths higher than the cut-off value (Figure 4c). For a wavelength equal to the cut-off value, 50% of its amplitude is transmitted to each of the surfaces produced by filtering. Due to this property of Gaussian filters, it is necessary to choose a cut-off wavelength far away from the wavelengths of the scales to be separated. The choice of the cut-off value for each surface studied is based on SEM observation. This method is used to separate the scales of large period versus small period profiles.
2.4. Wettability
3. Results
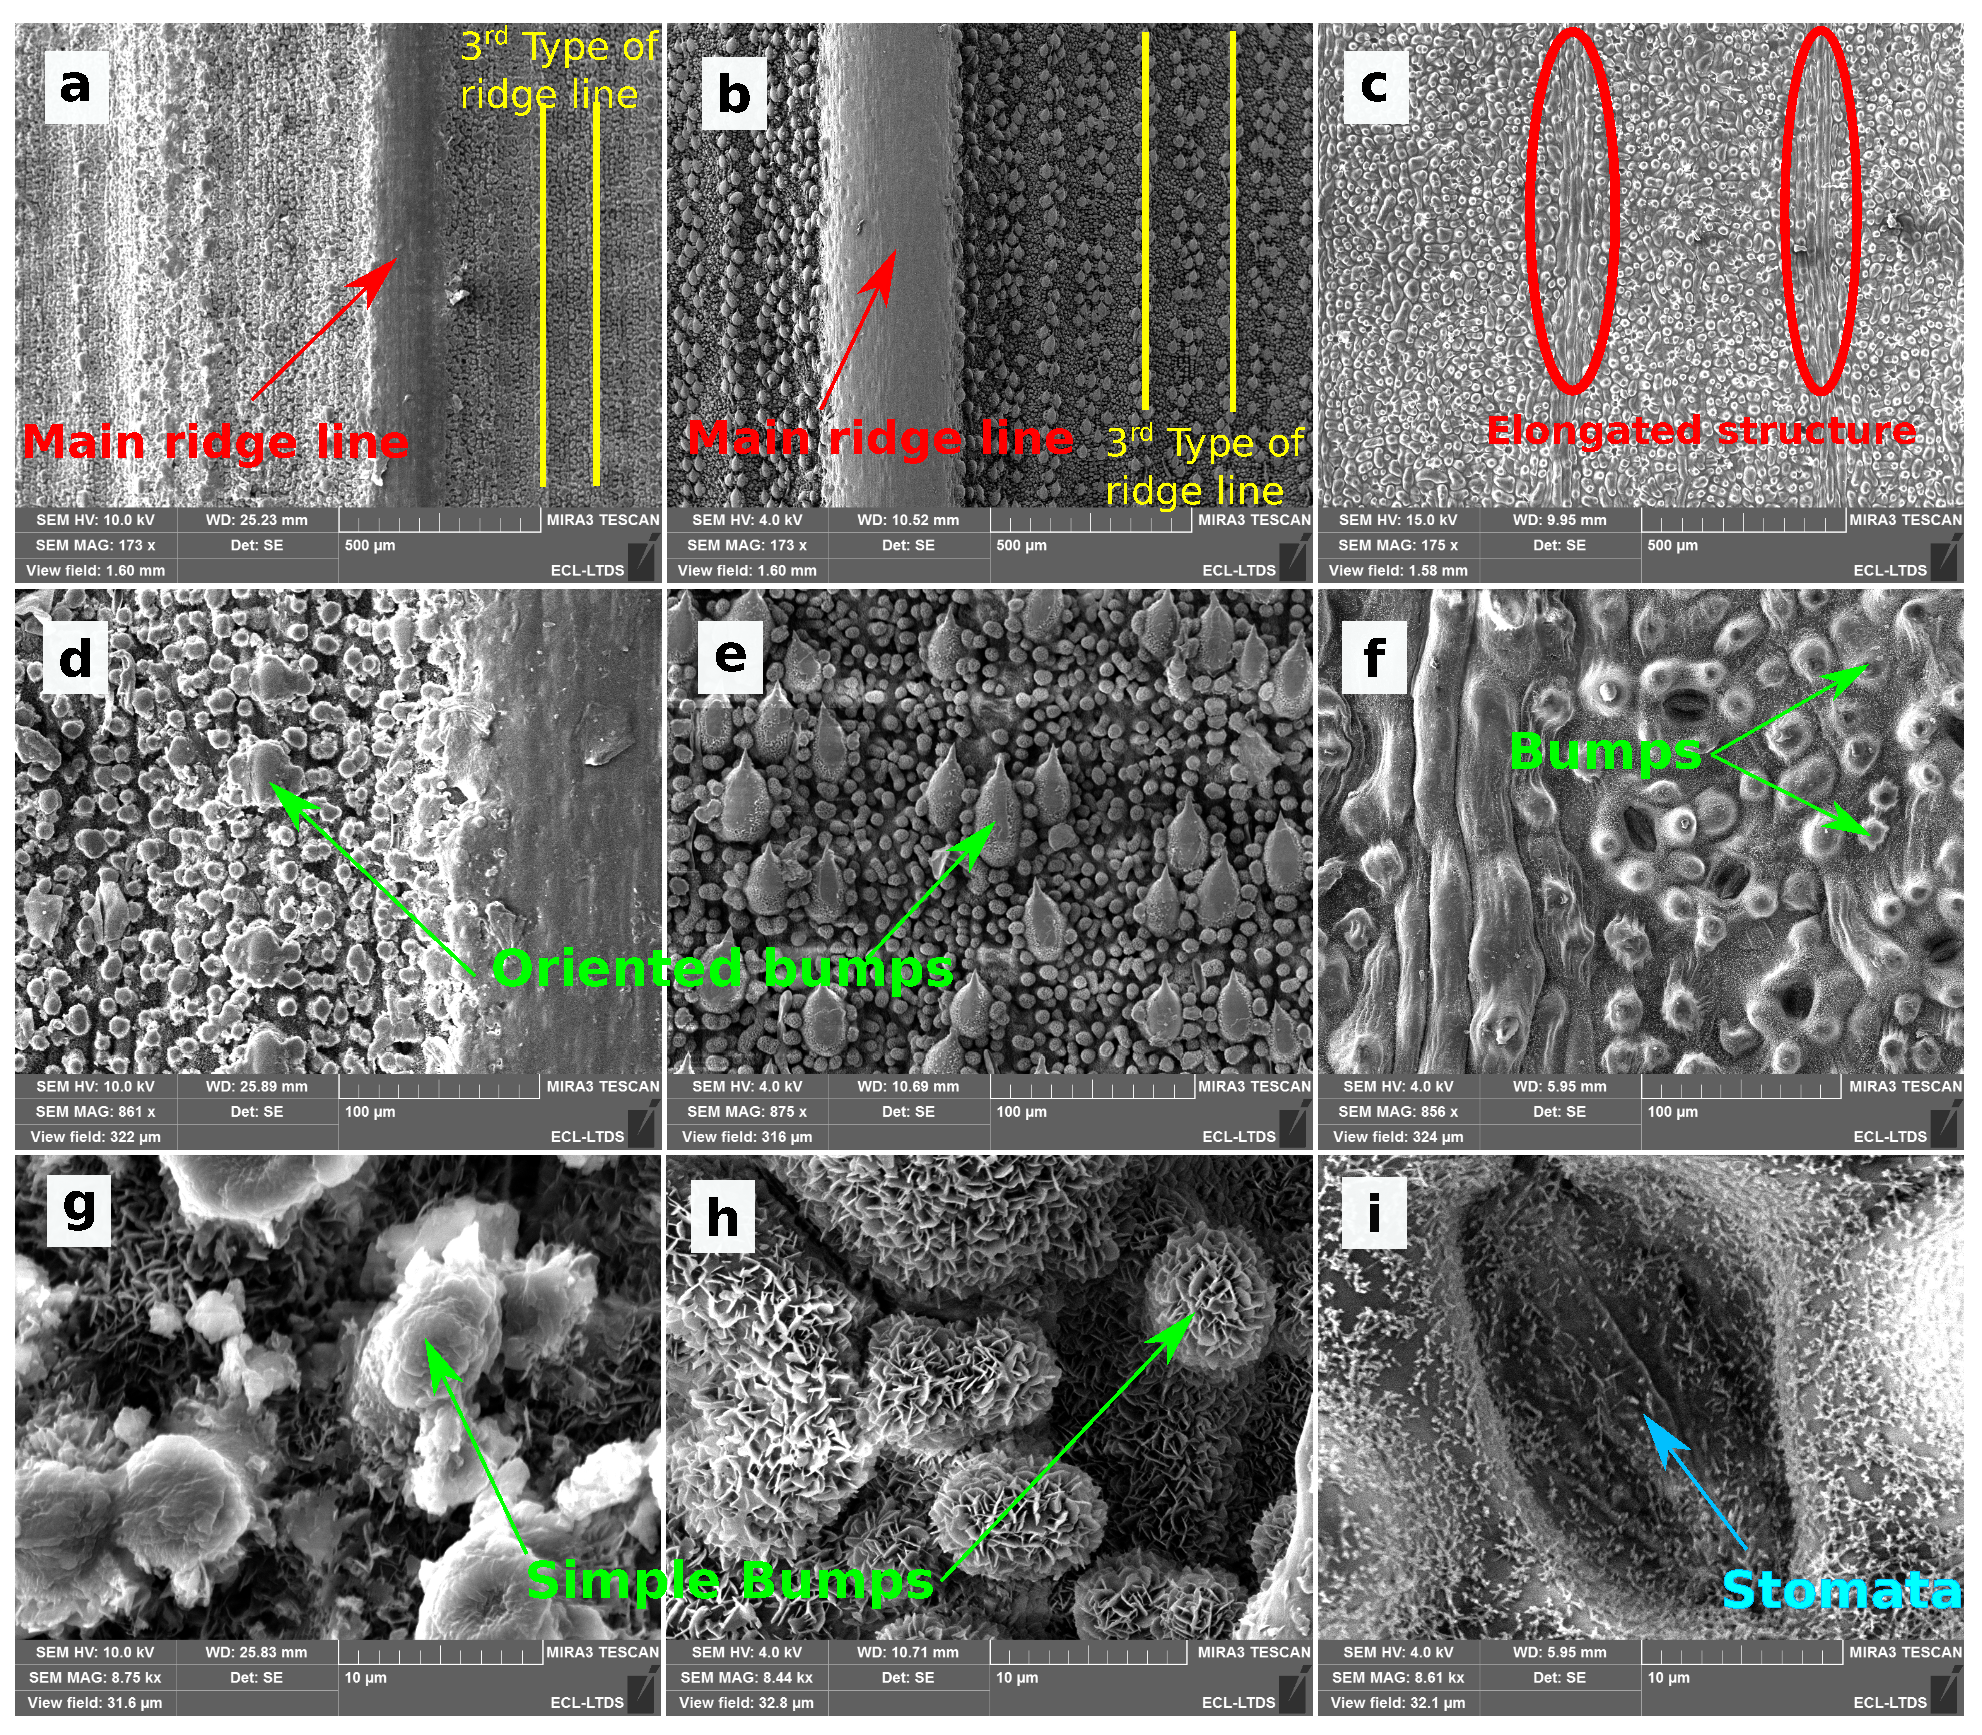
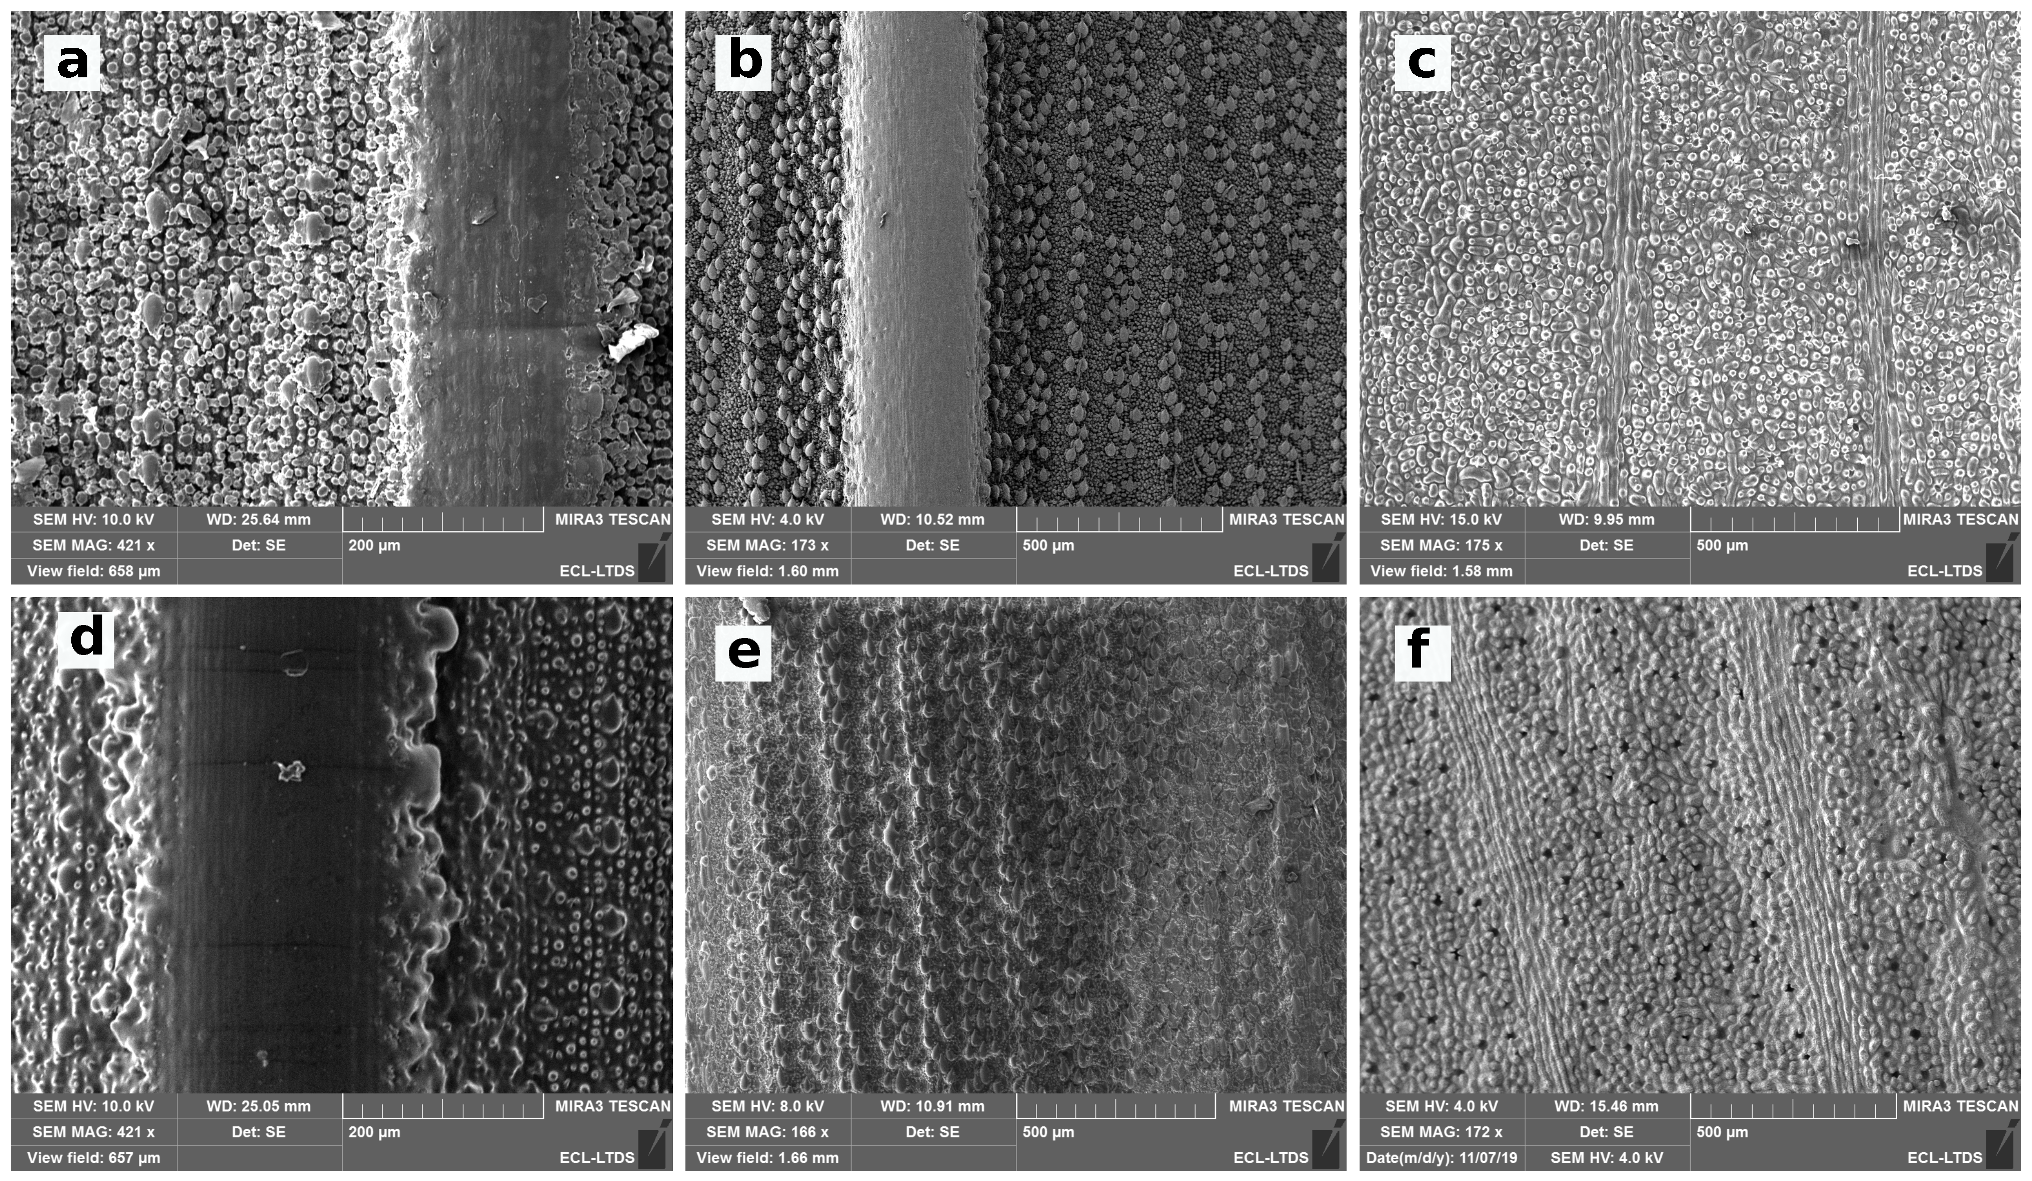
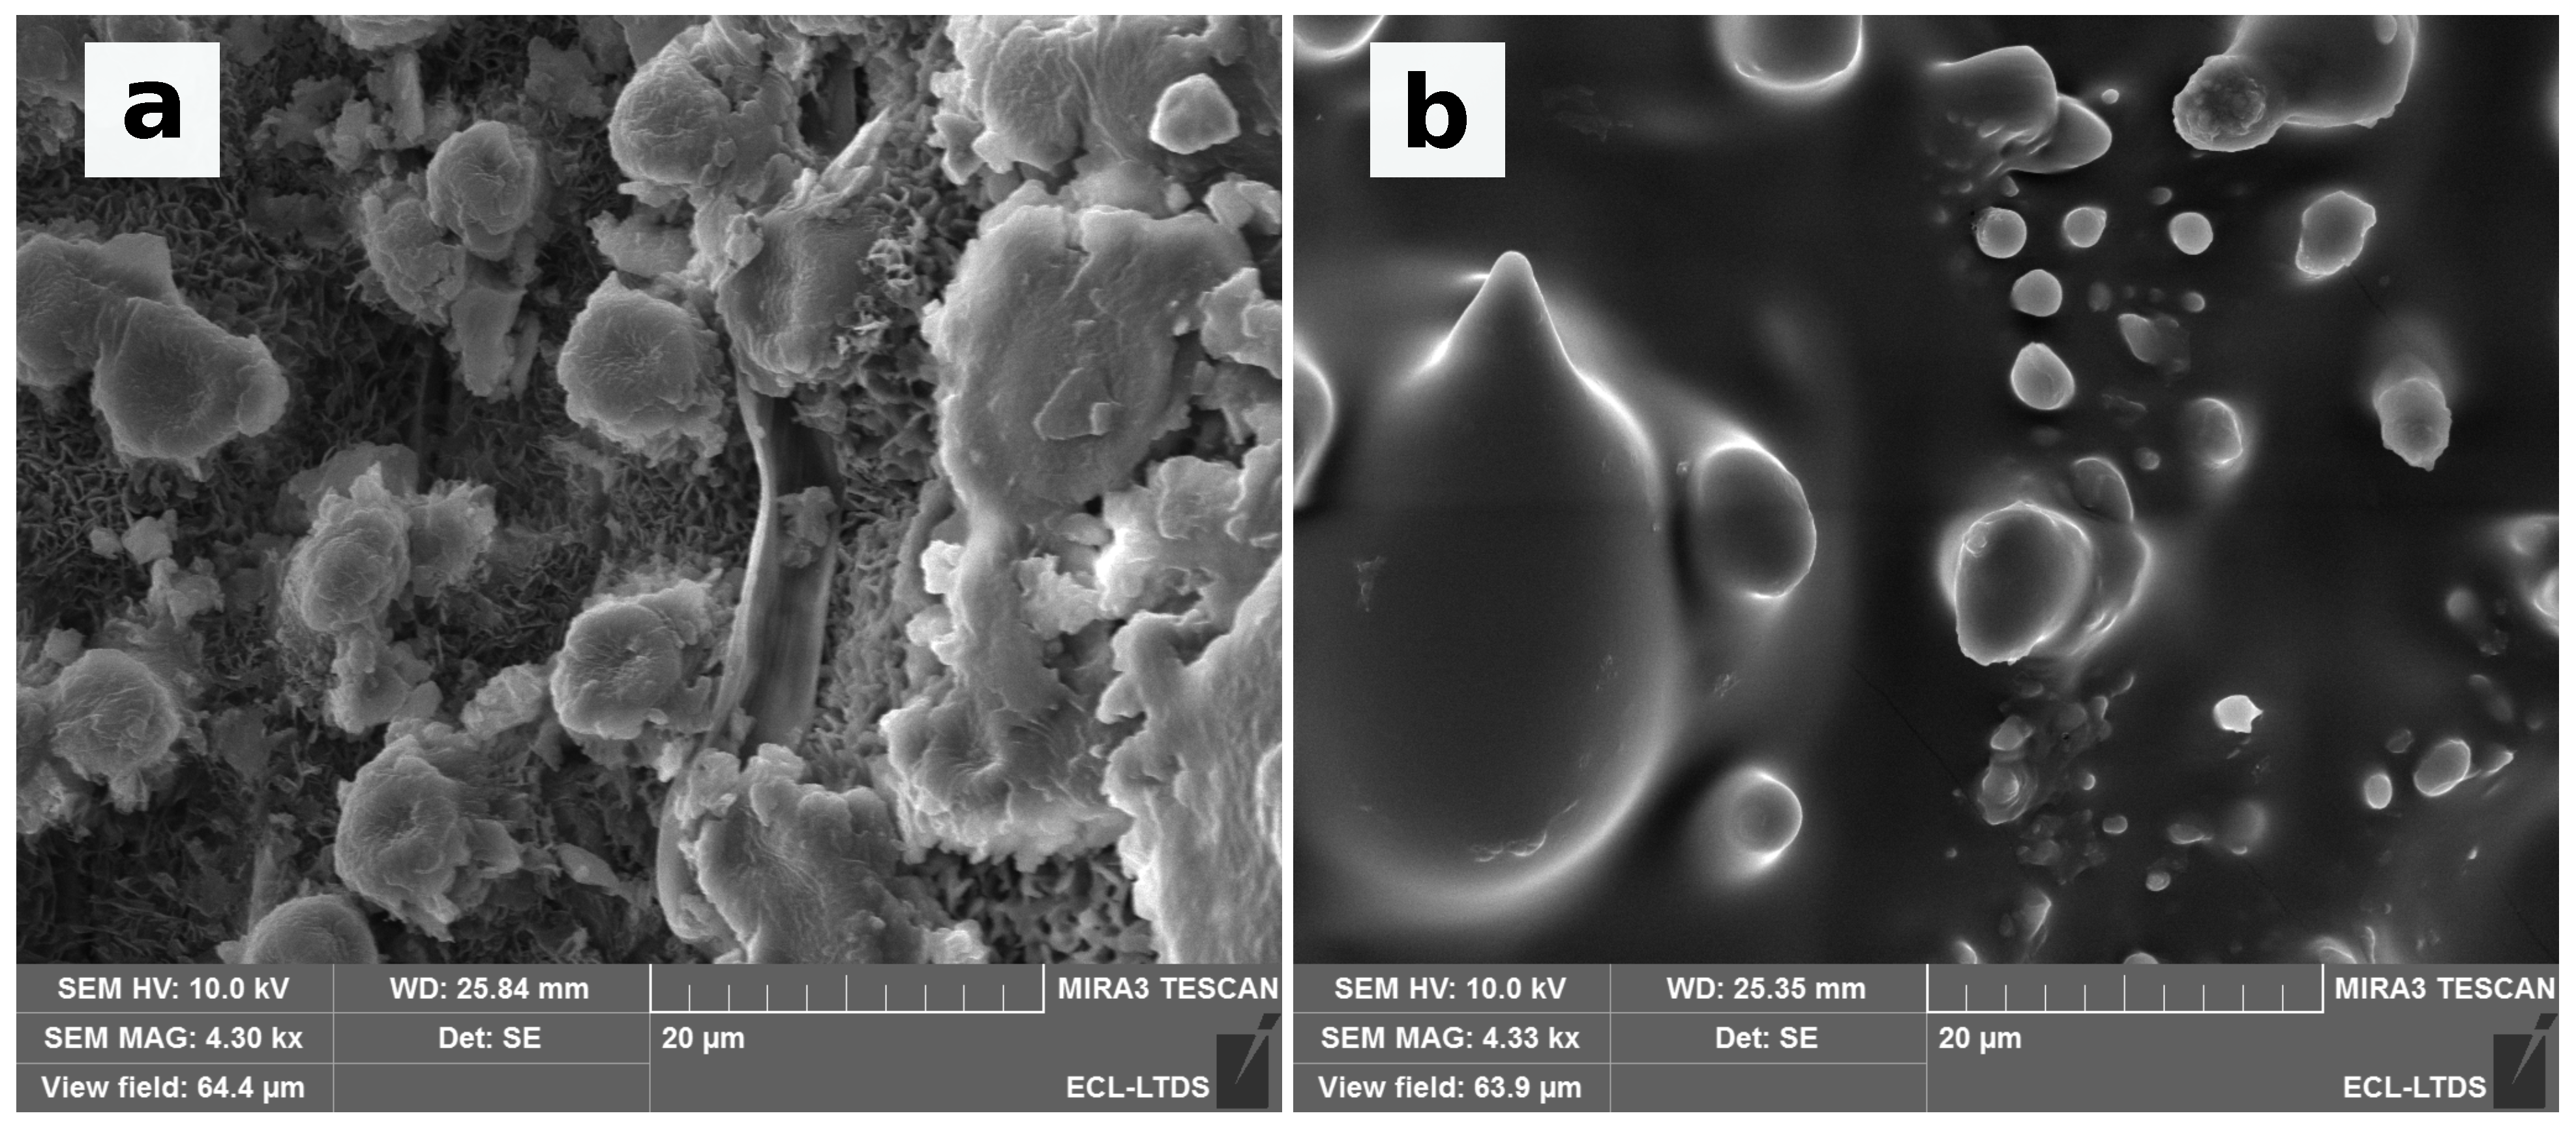
3.1. Topography of Natural Surfaces
3.1.1. Phyllostachys and Sasa Leaves
3.1.2. Ginkgo Biloba
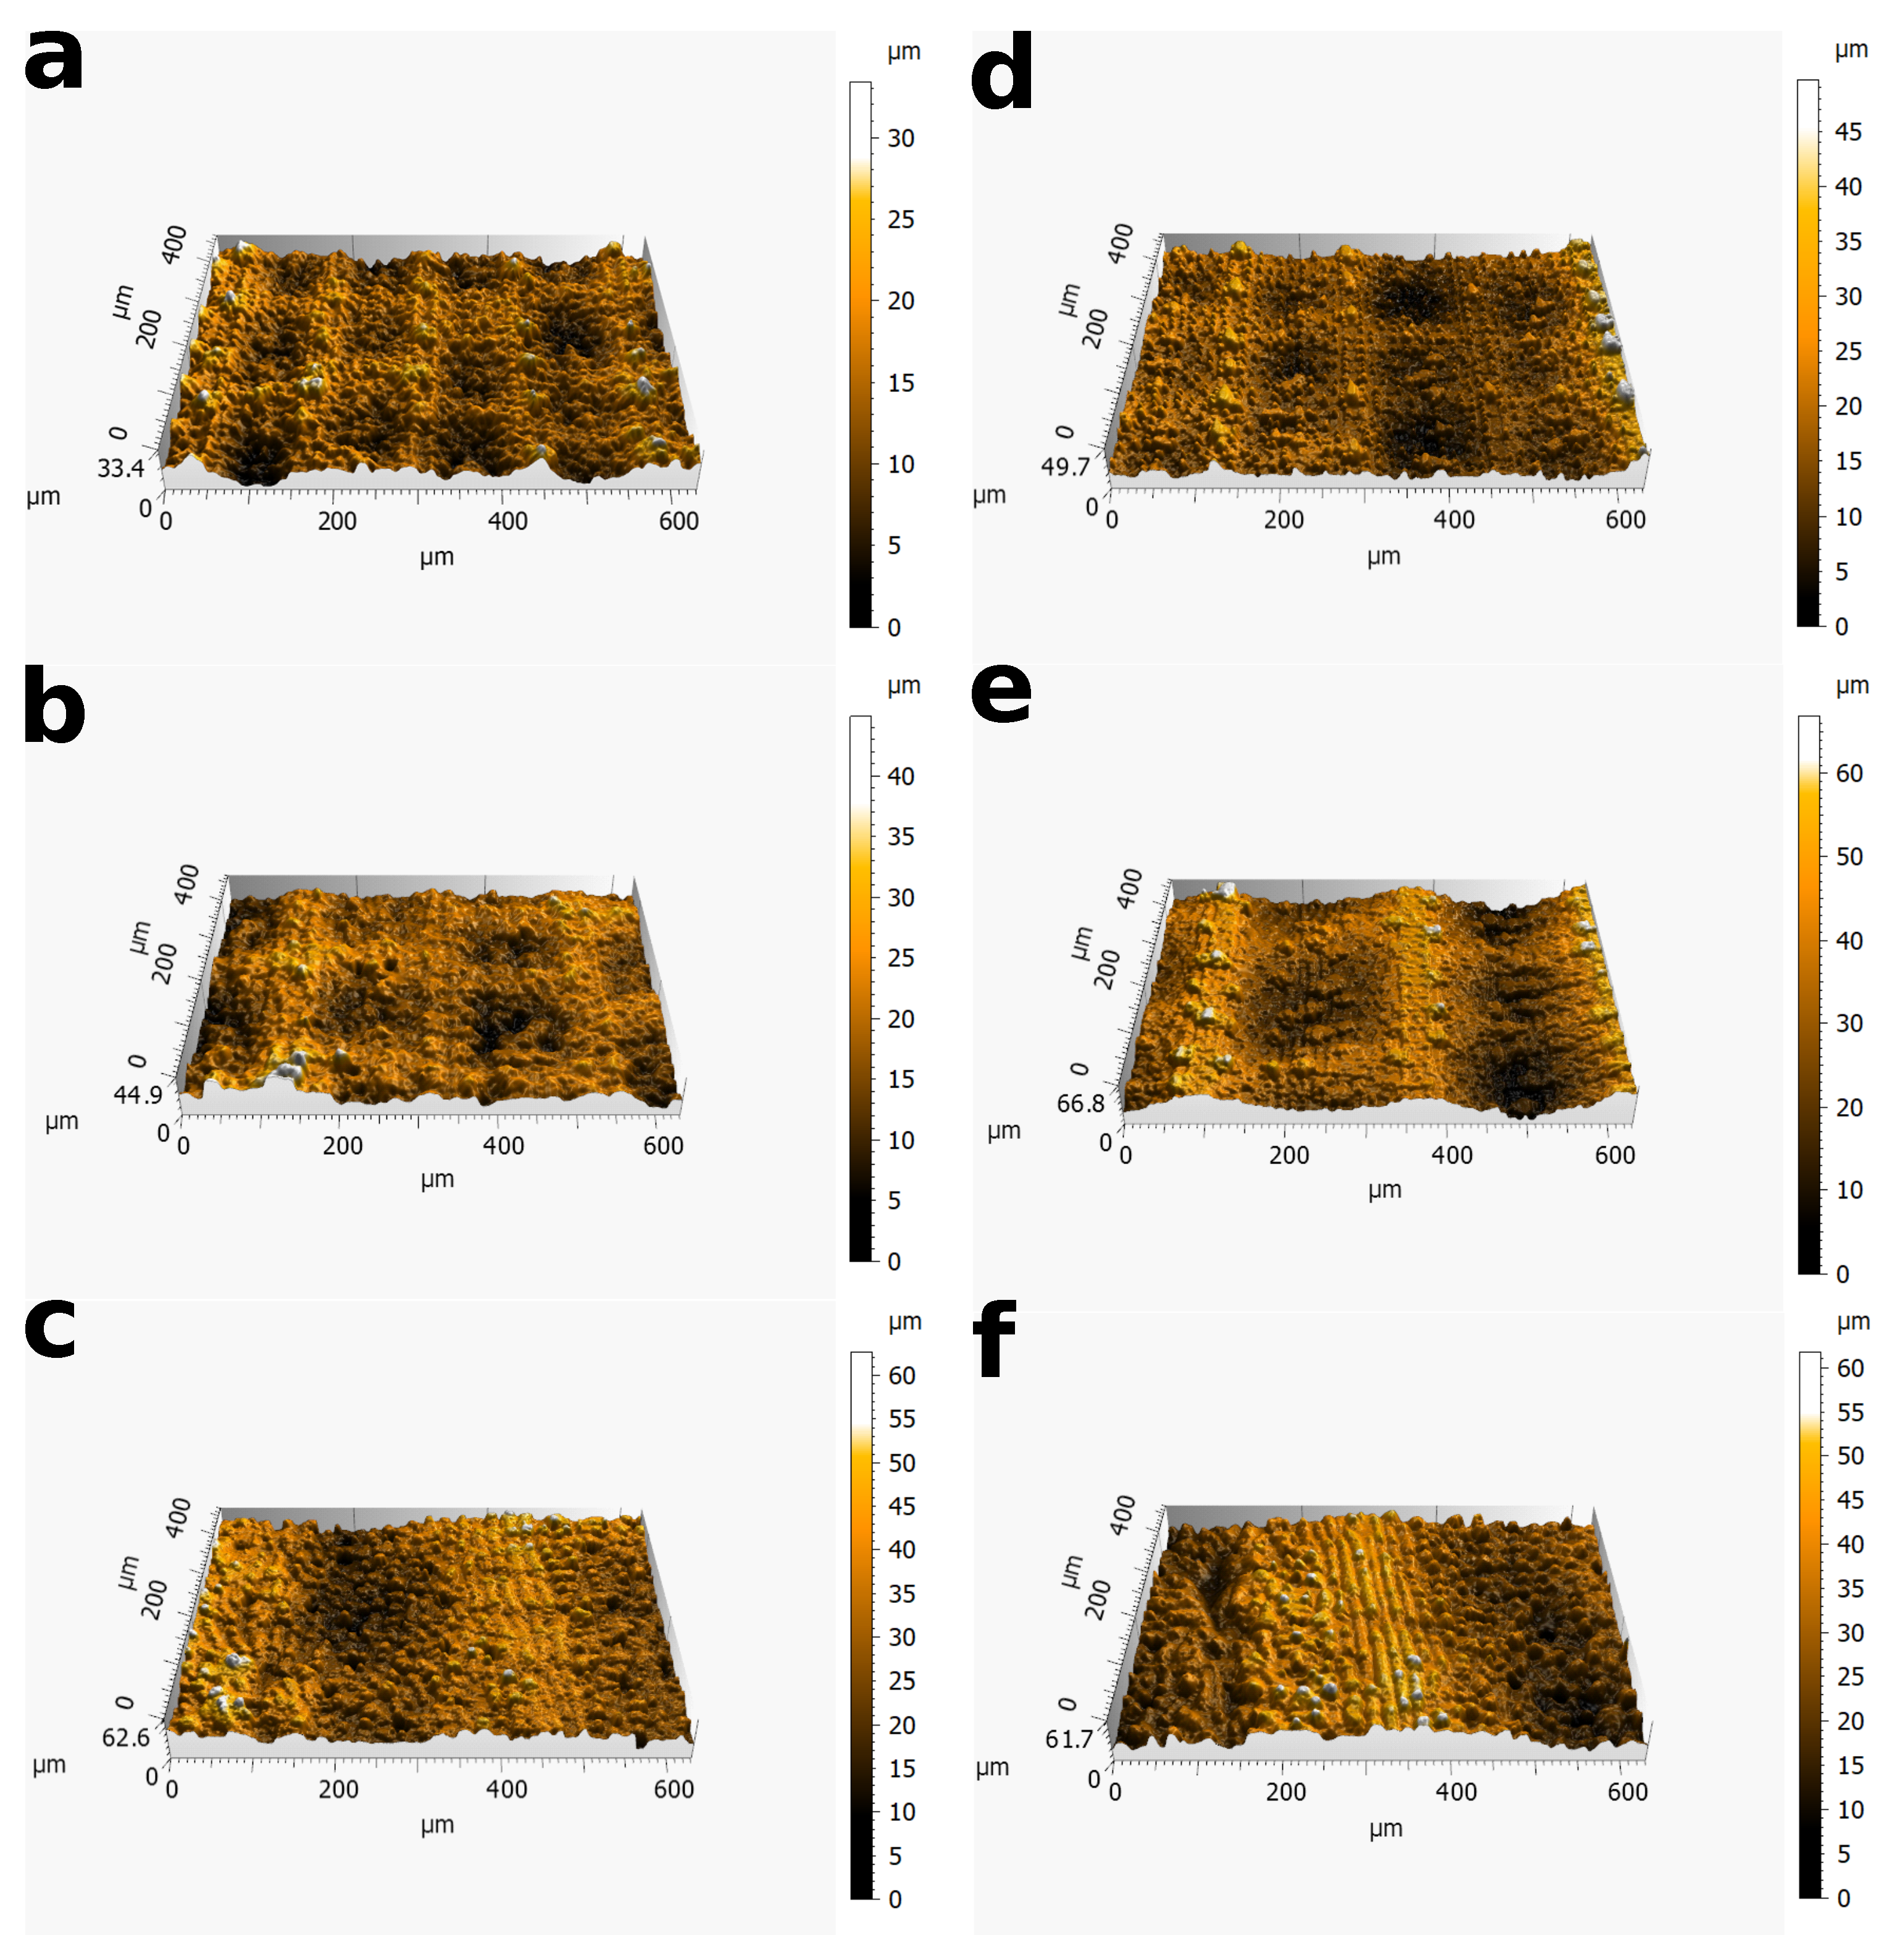
3.2. Topography of PDMS Replicas
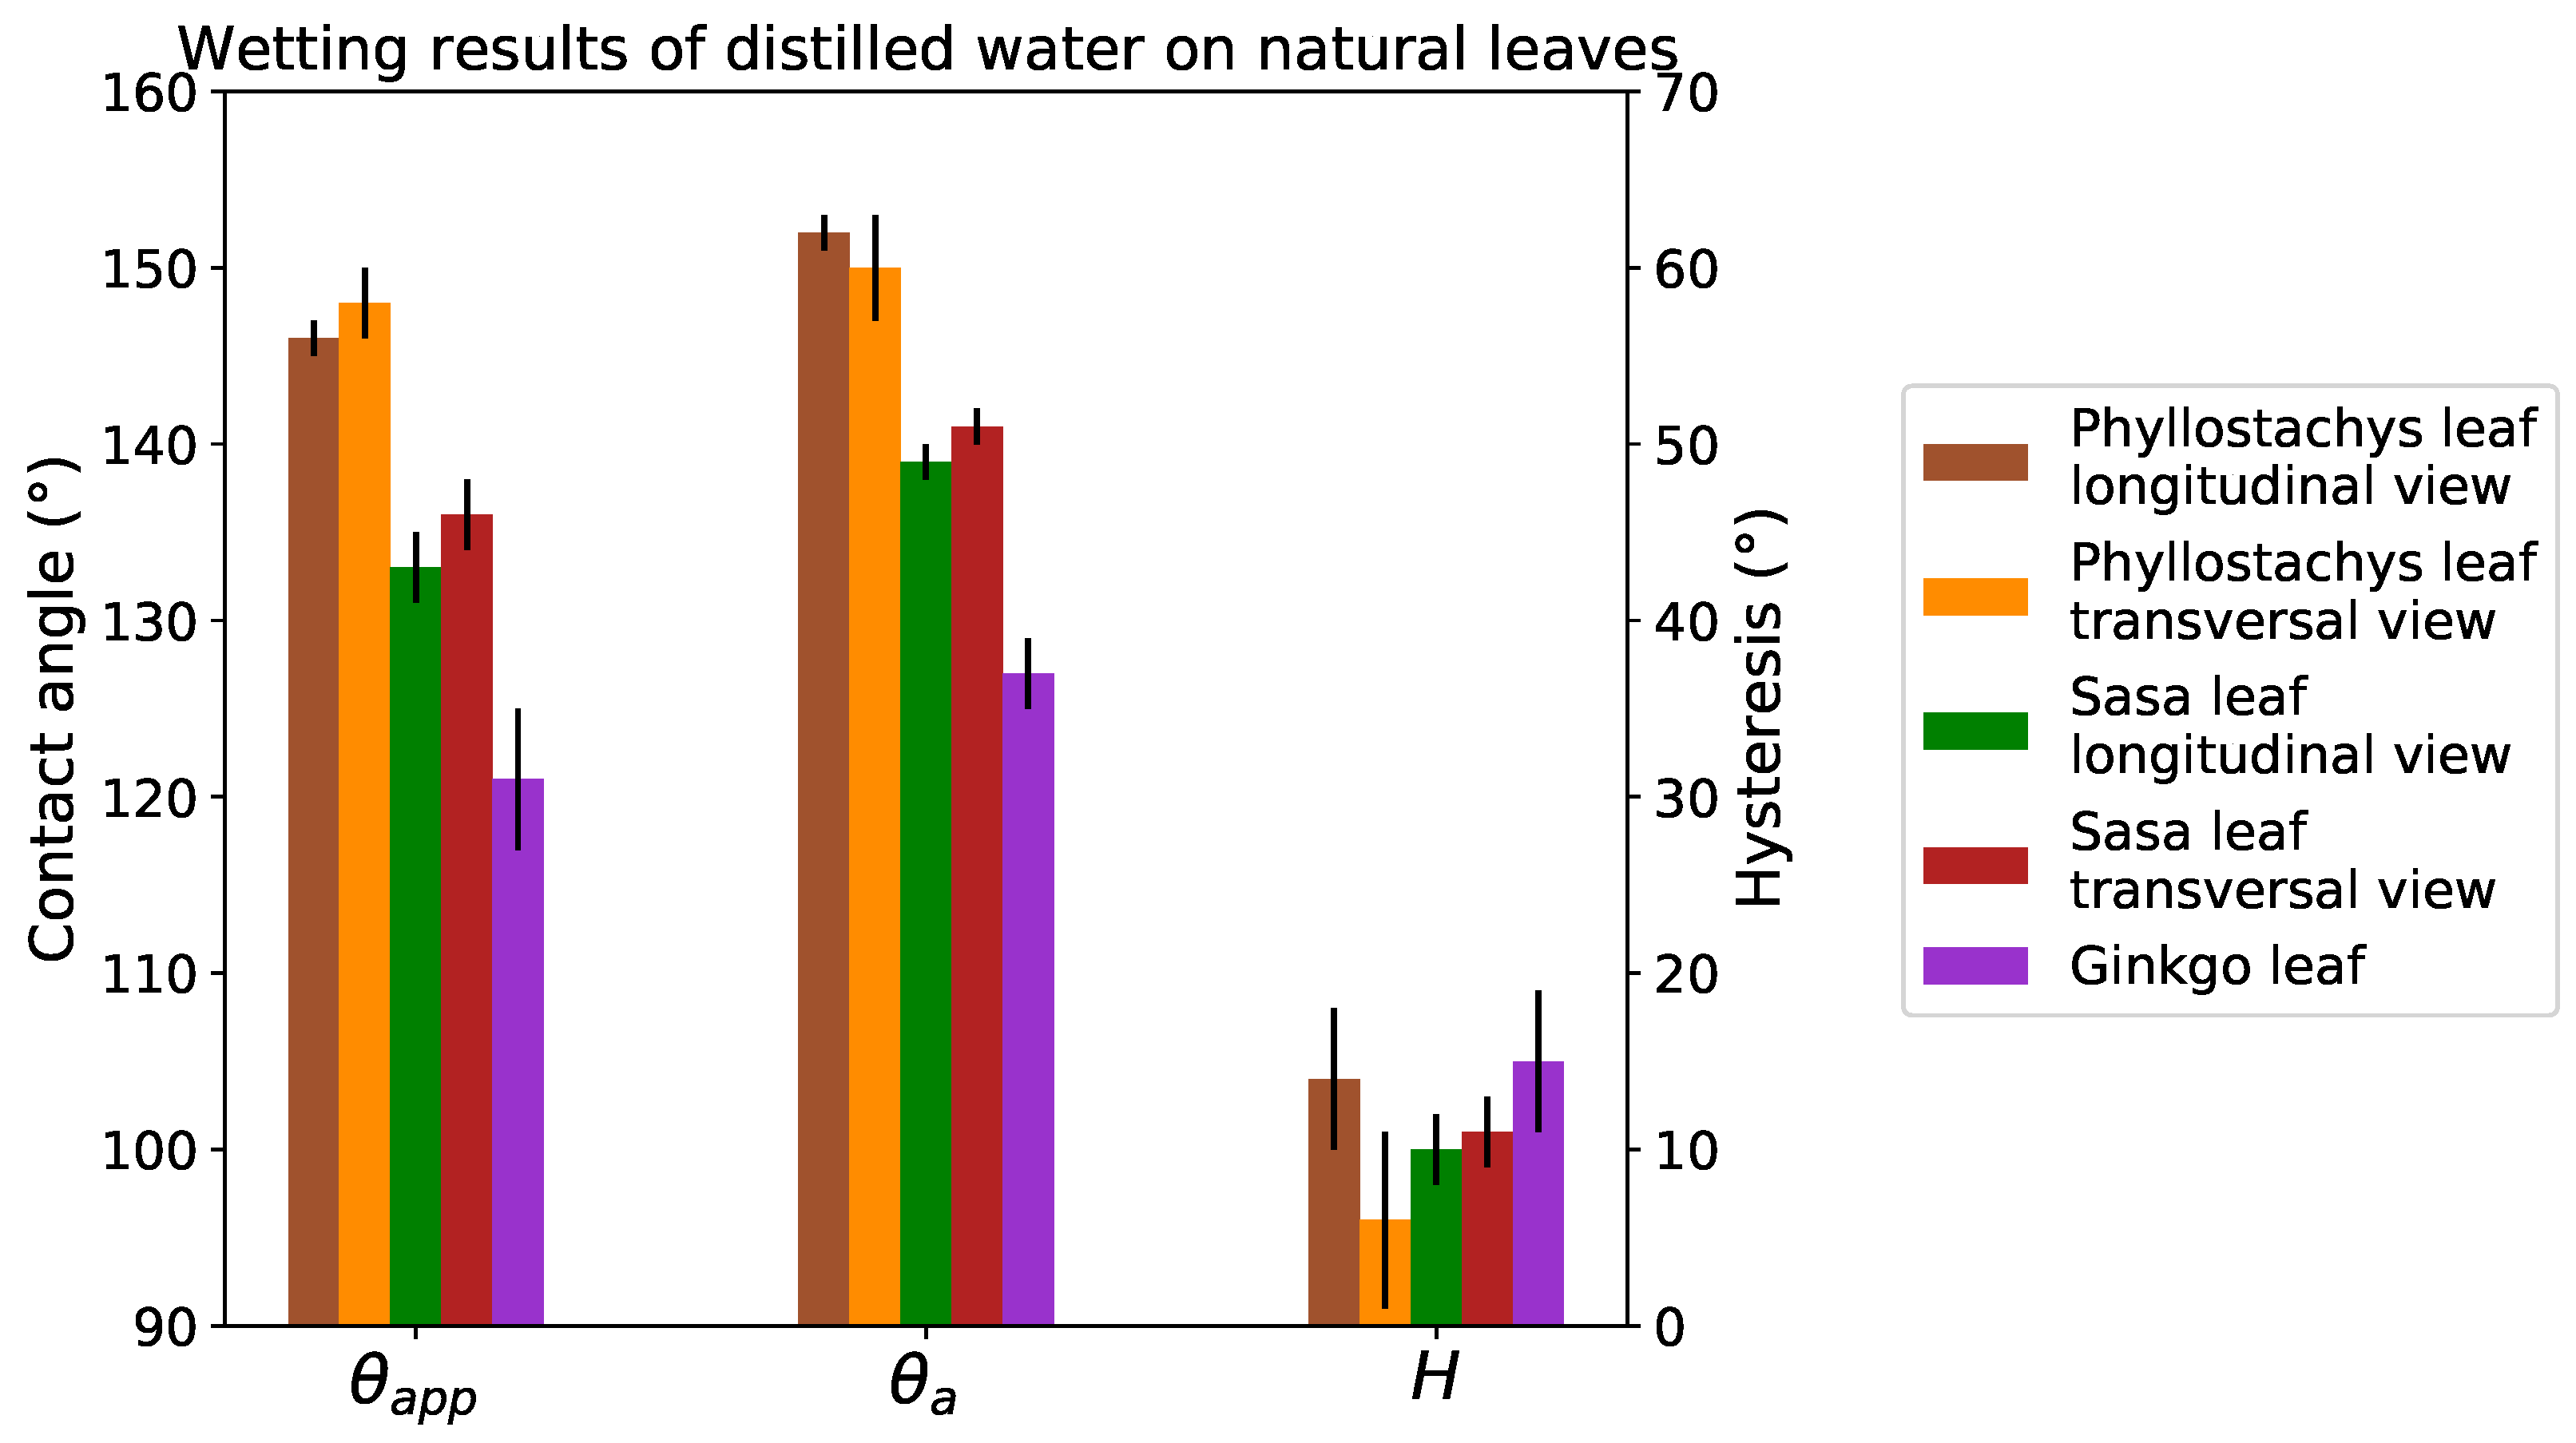
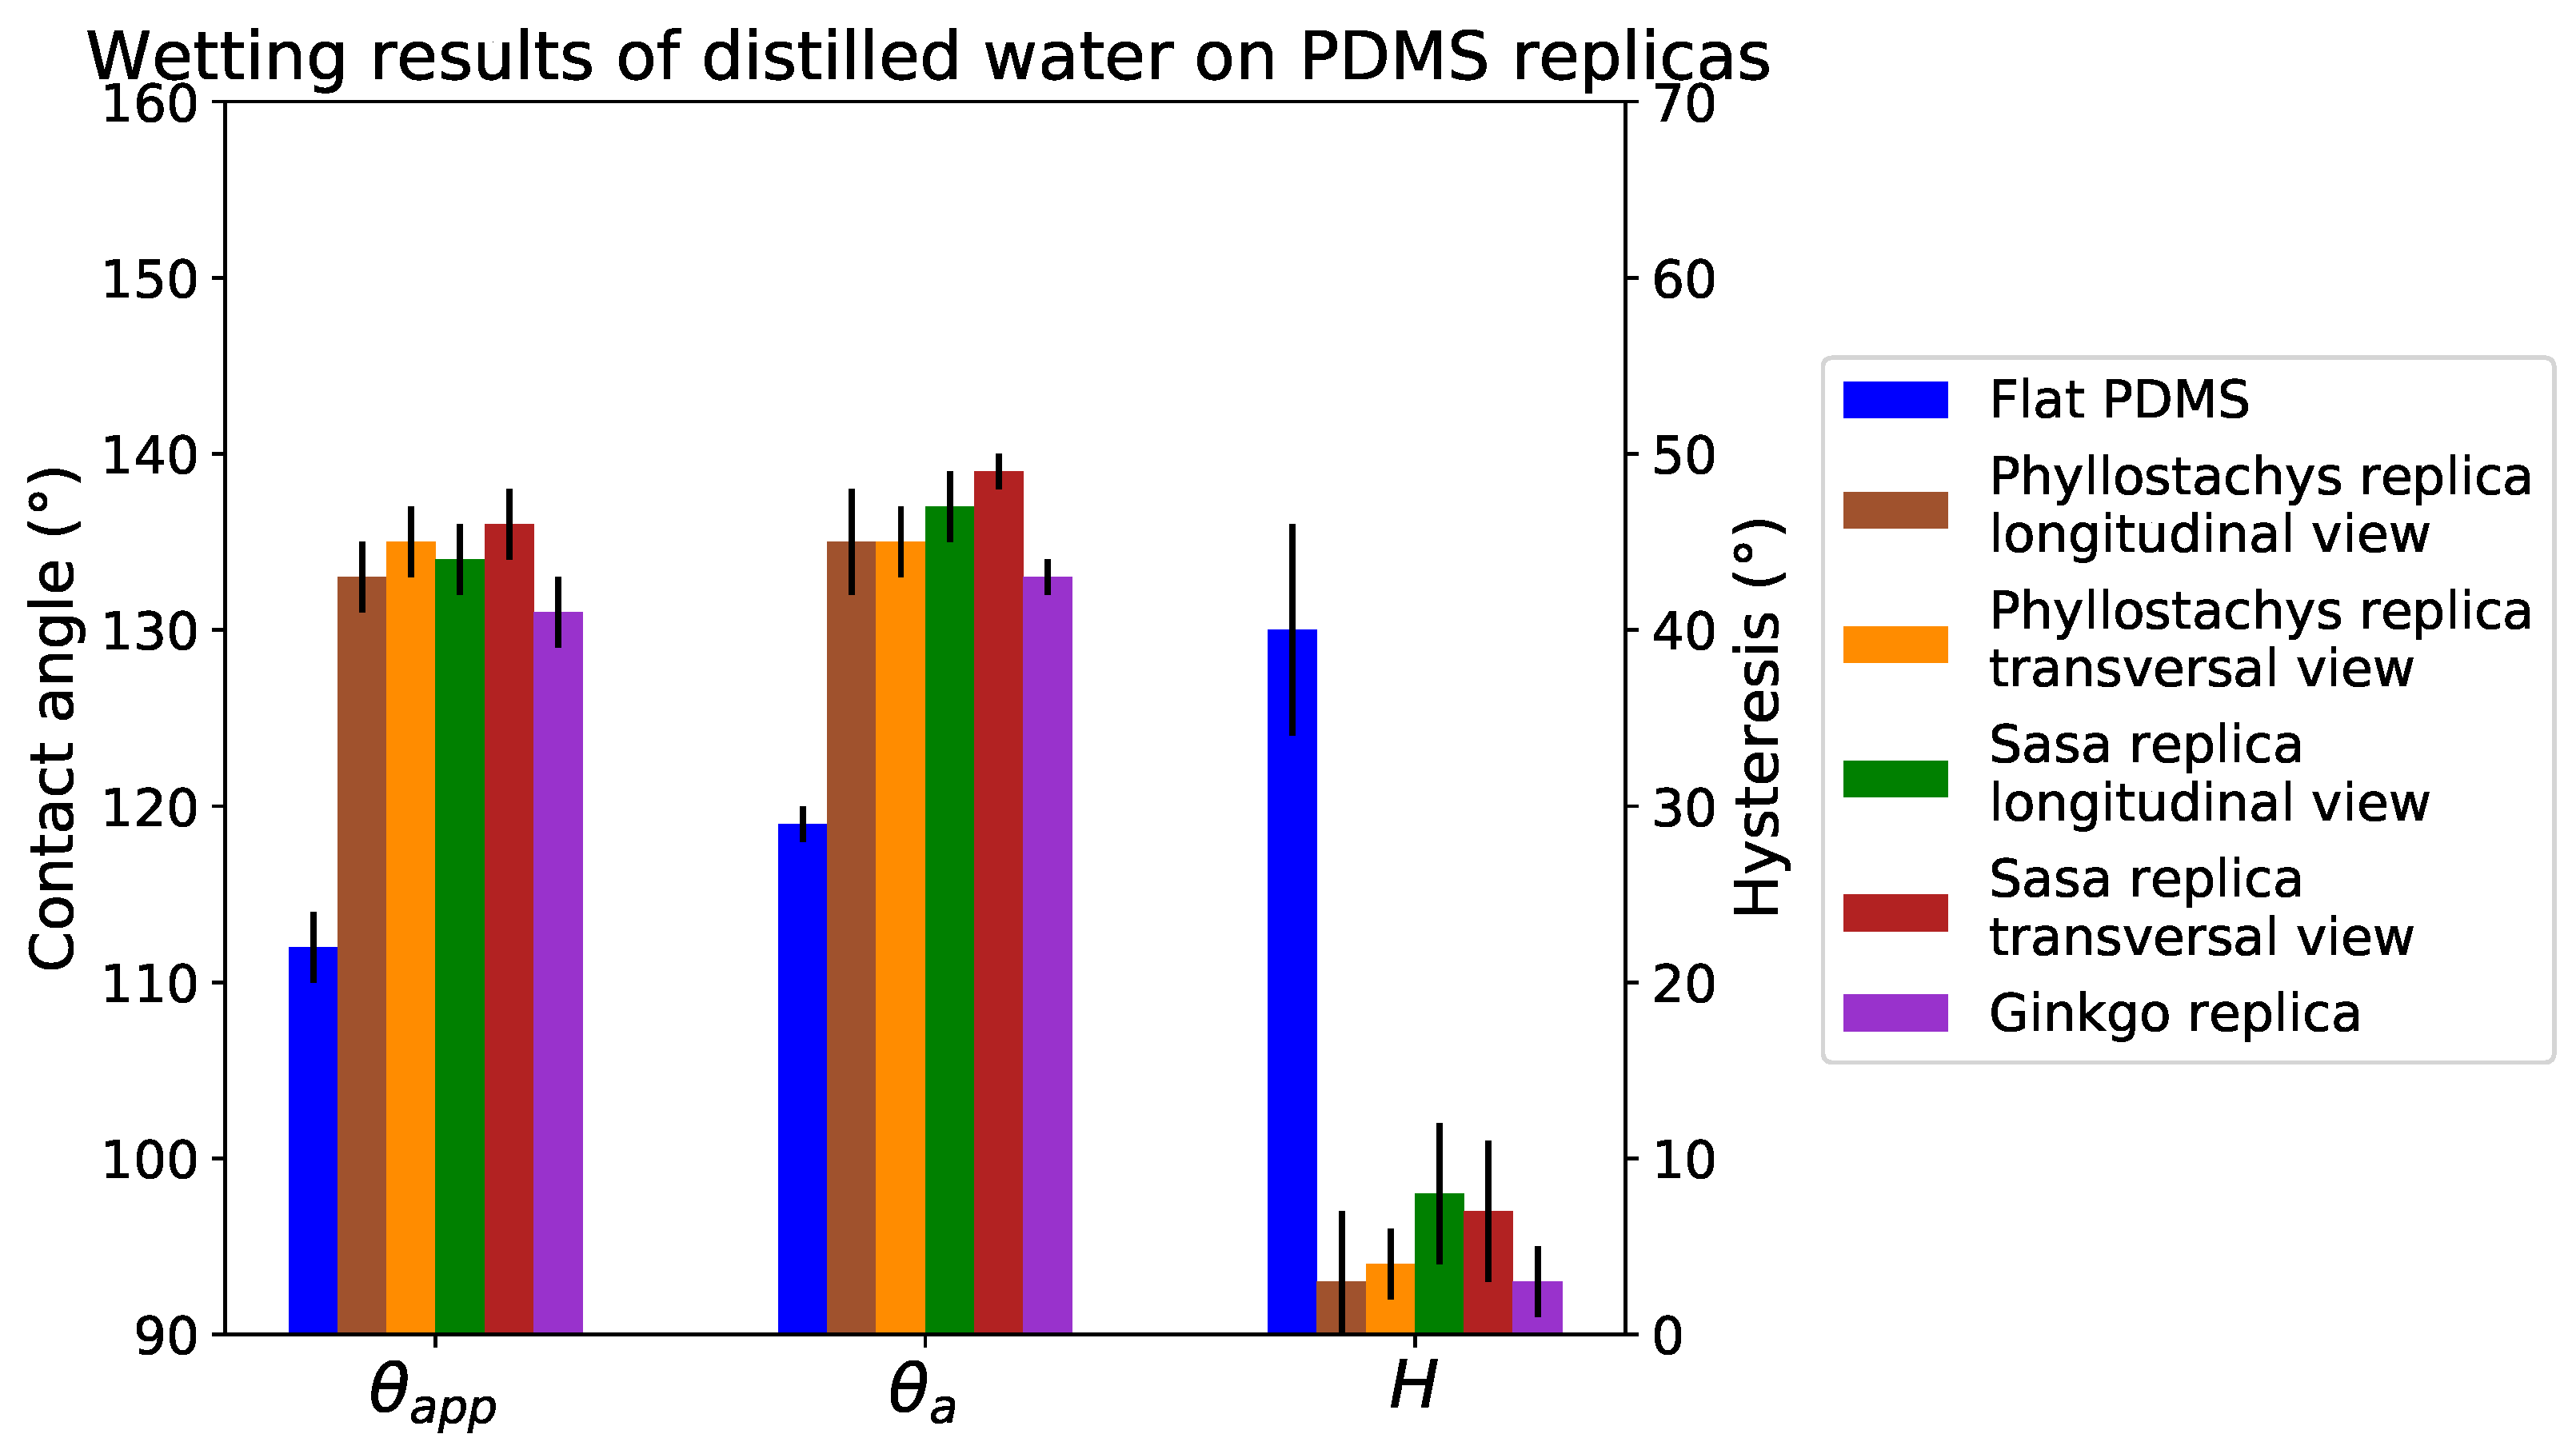
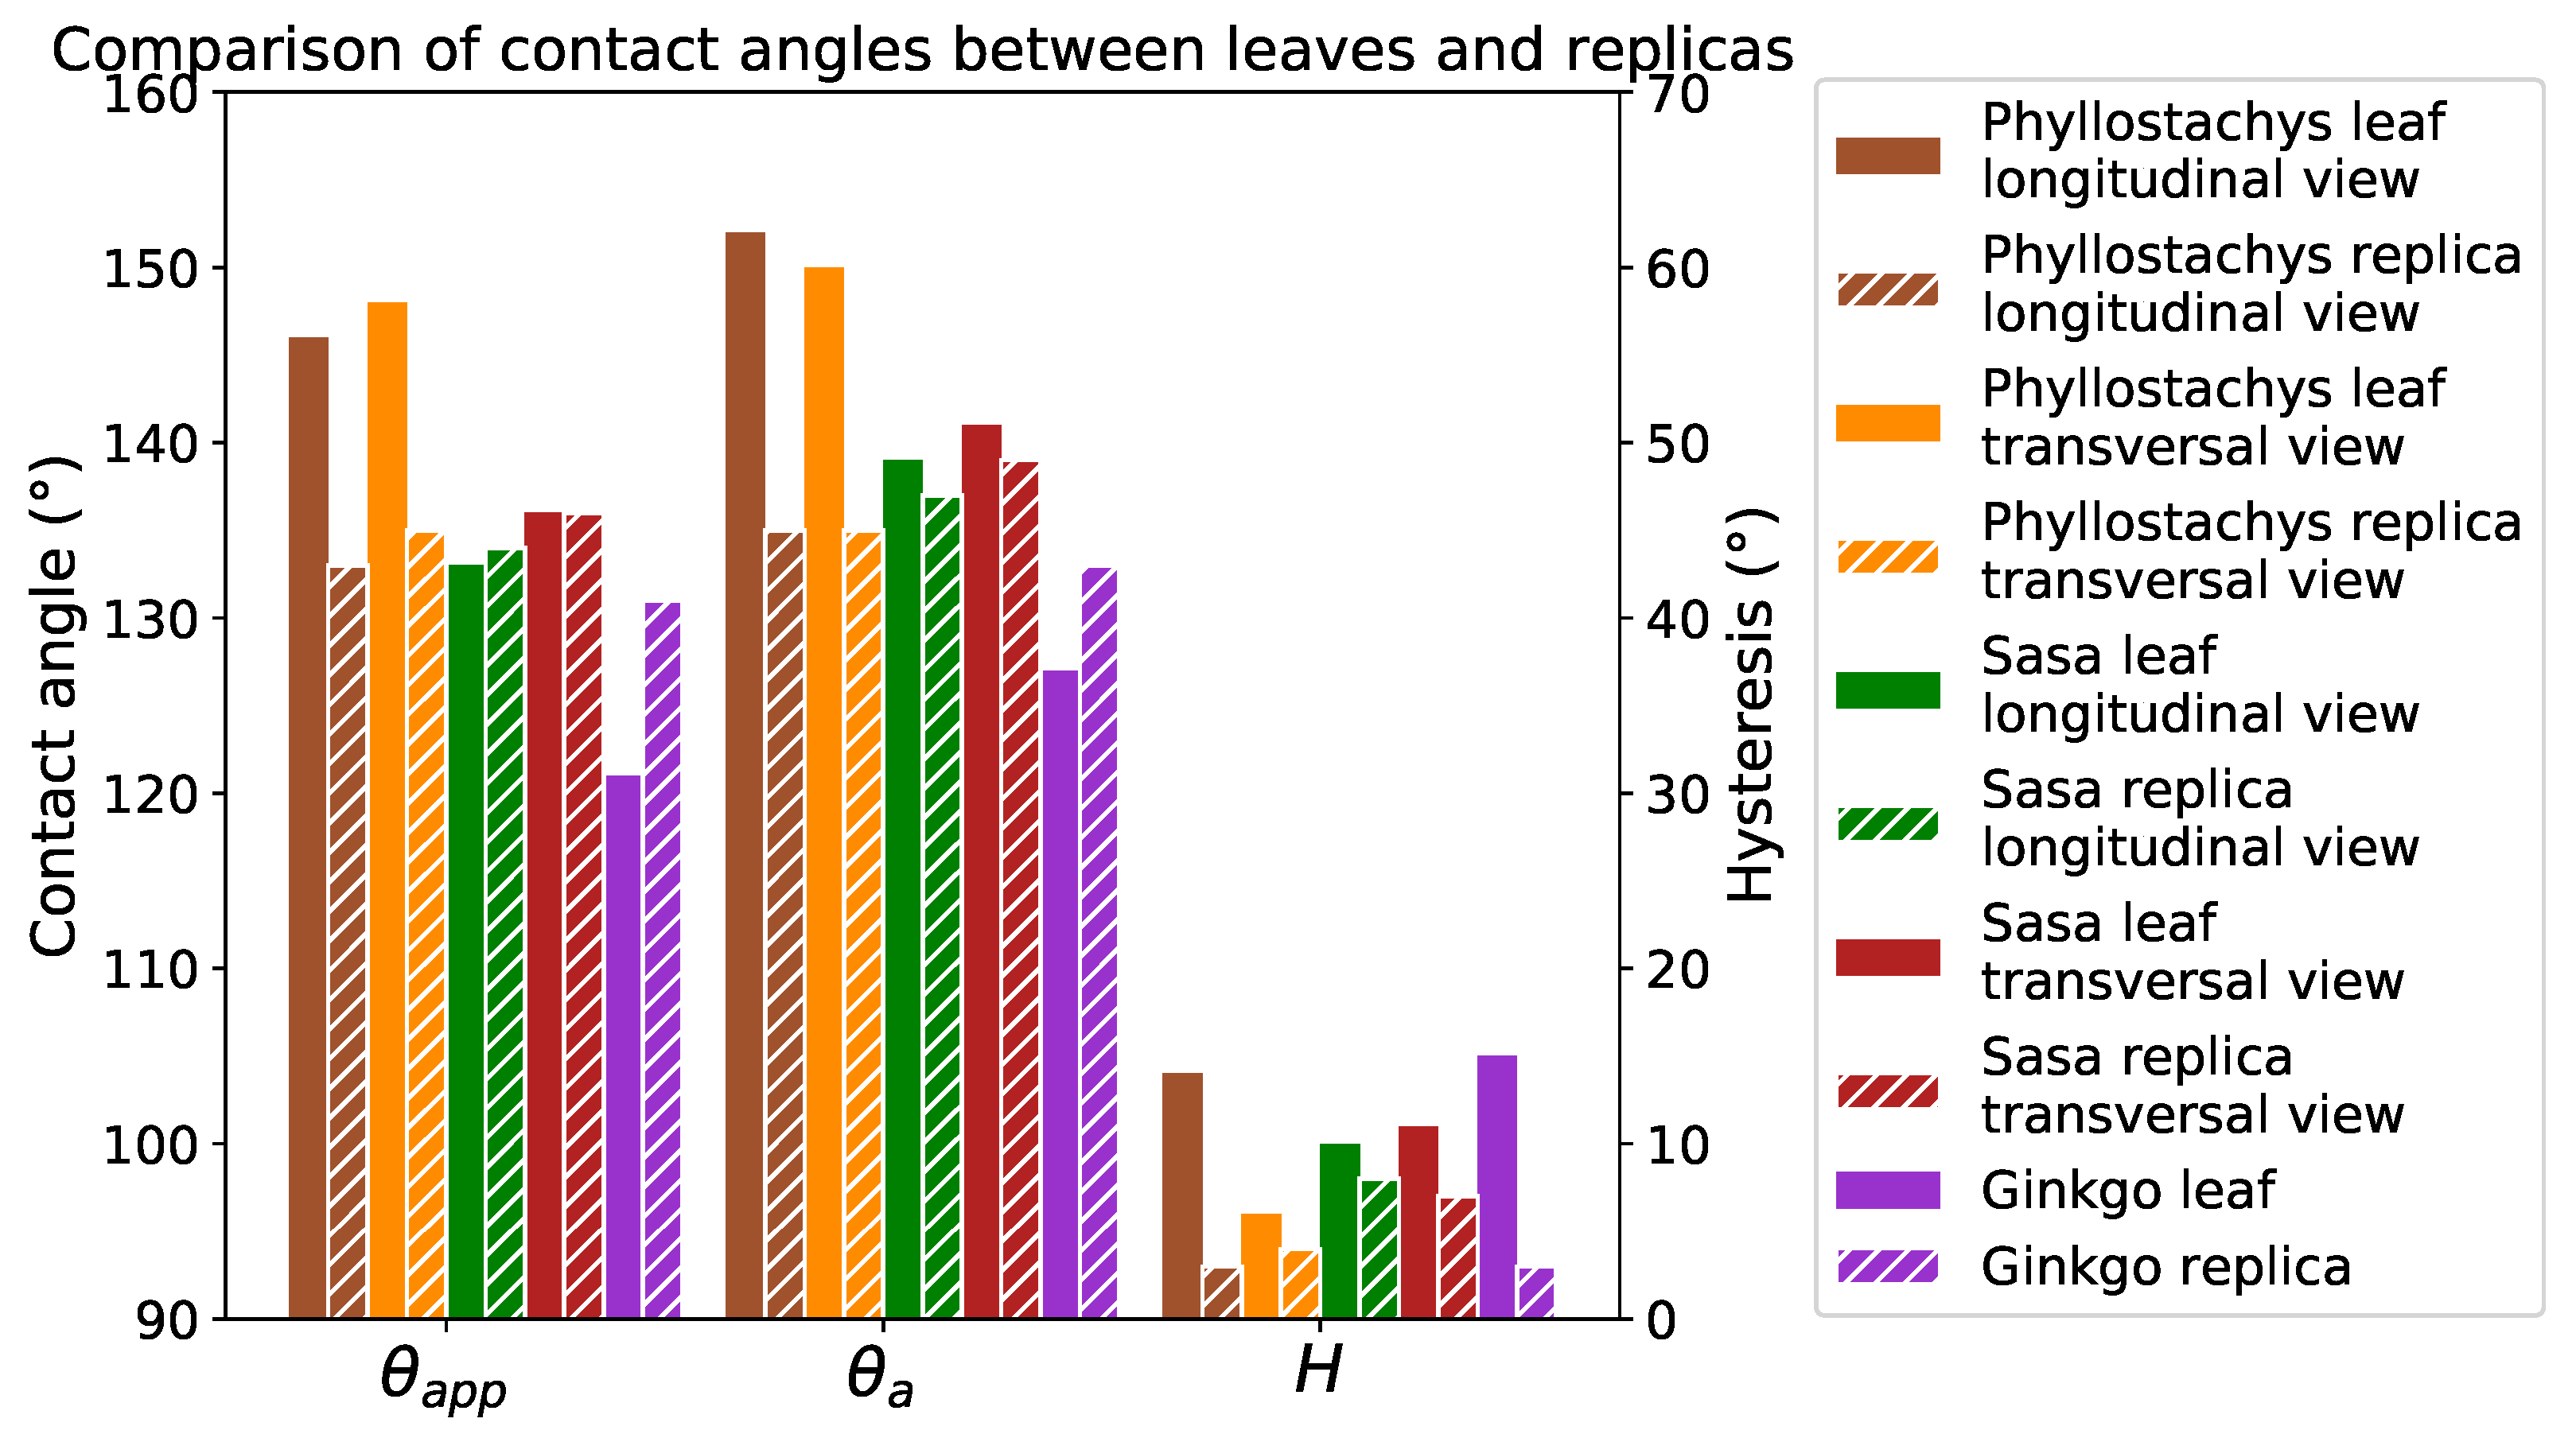
3.3. Wetting Results
4. Discussion
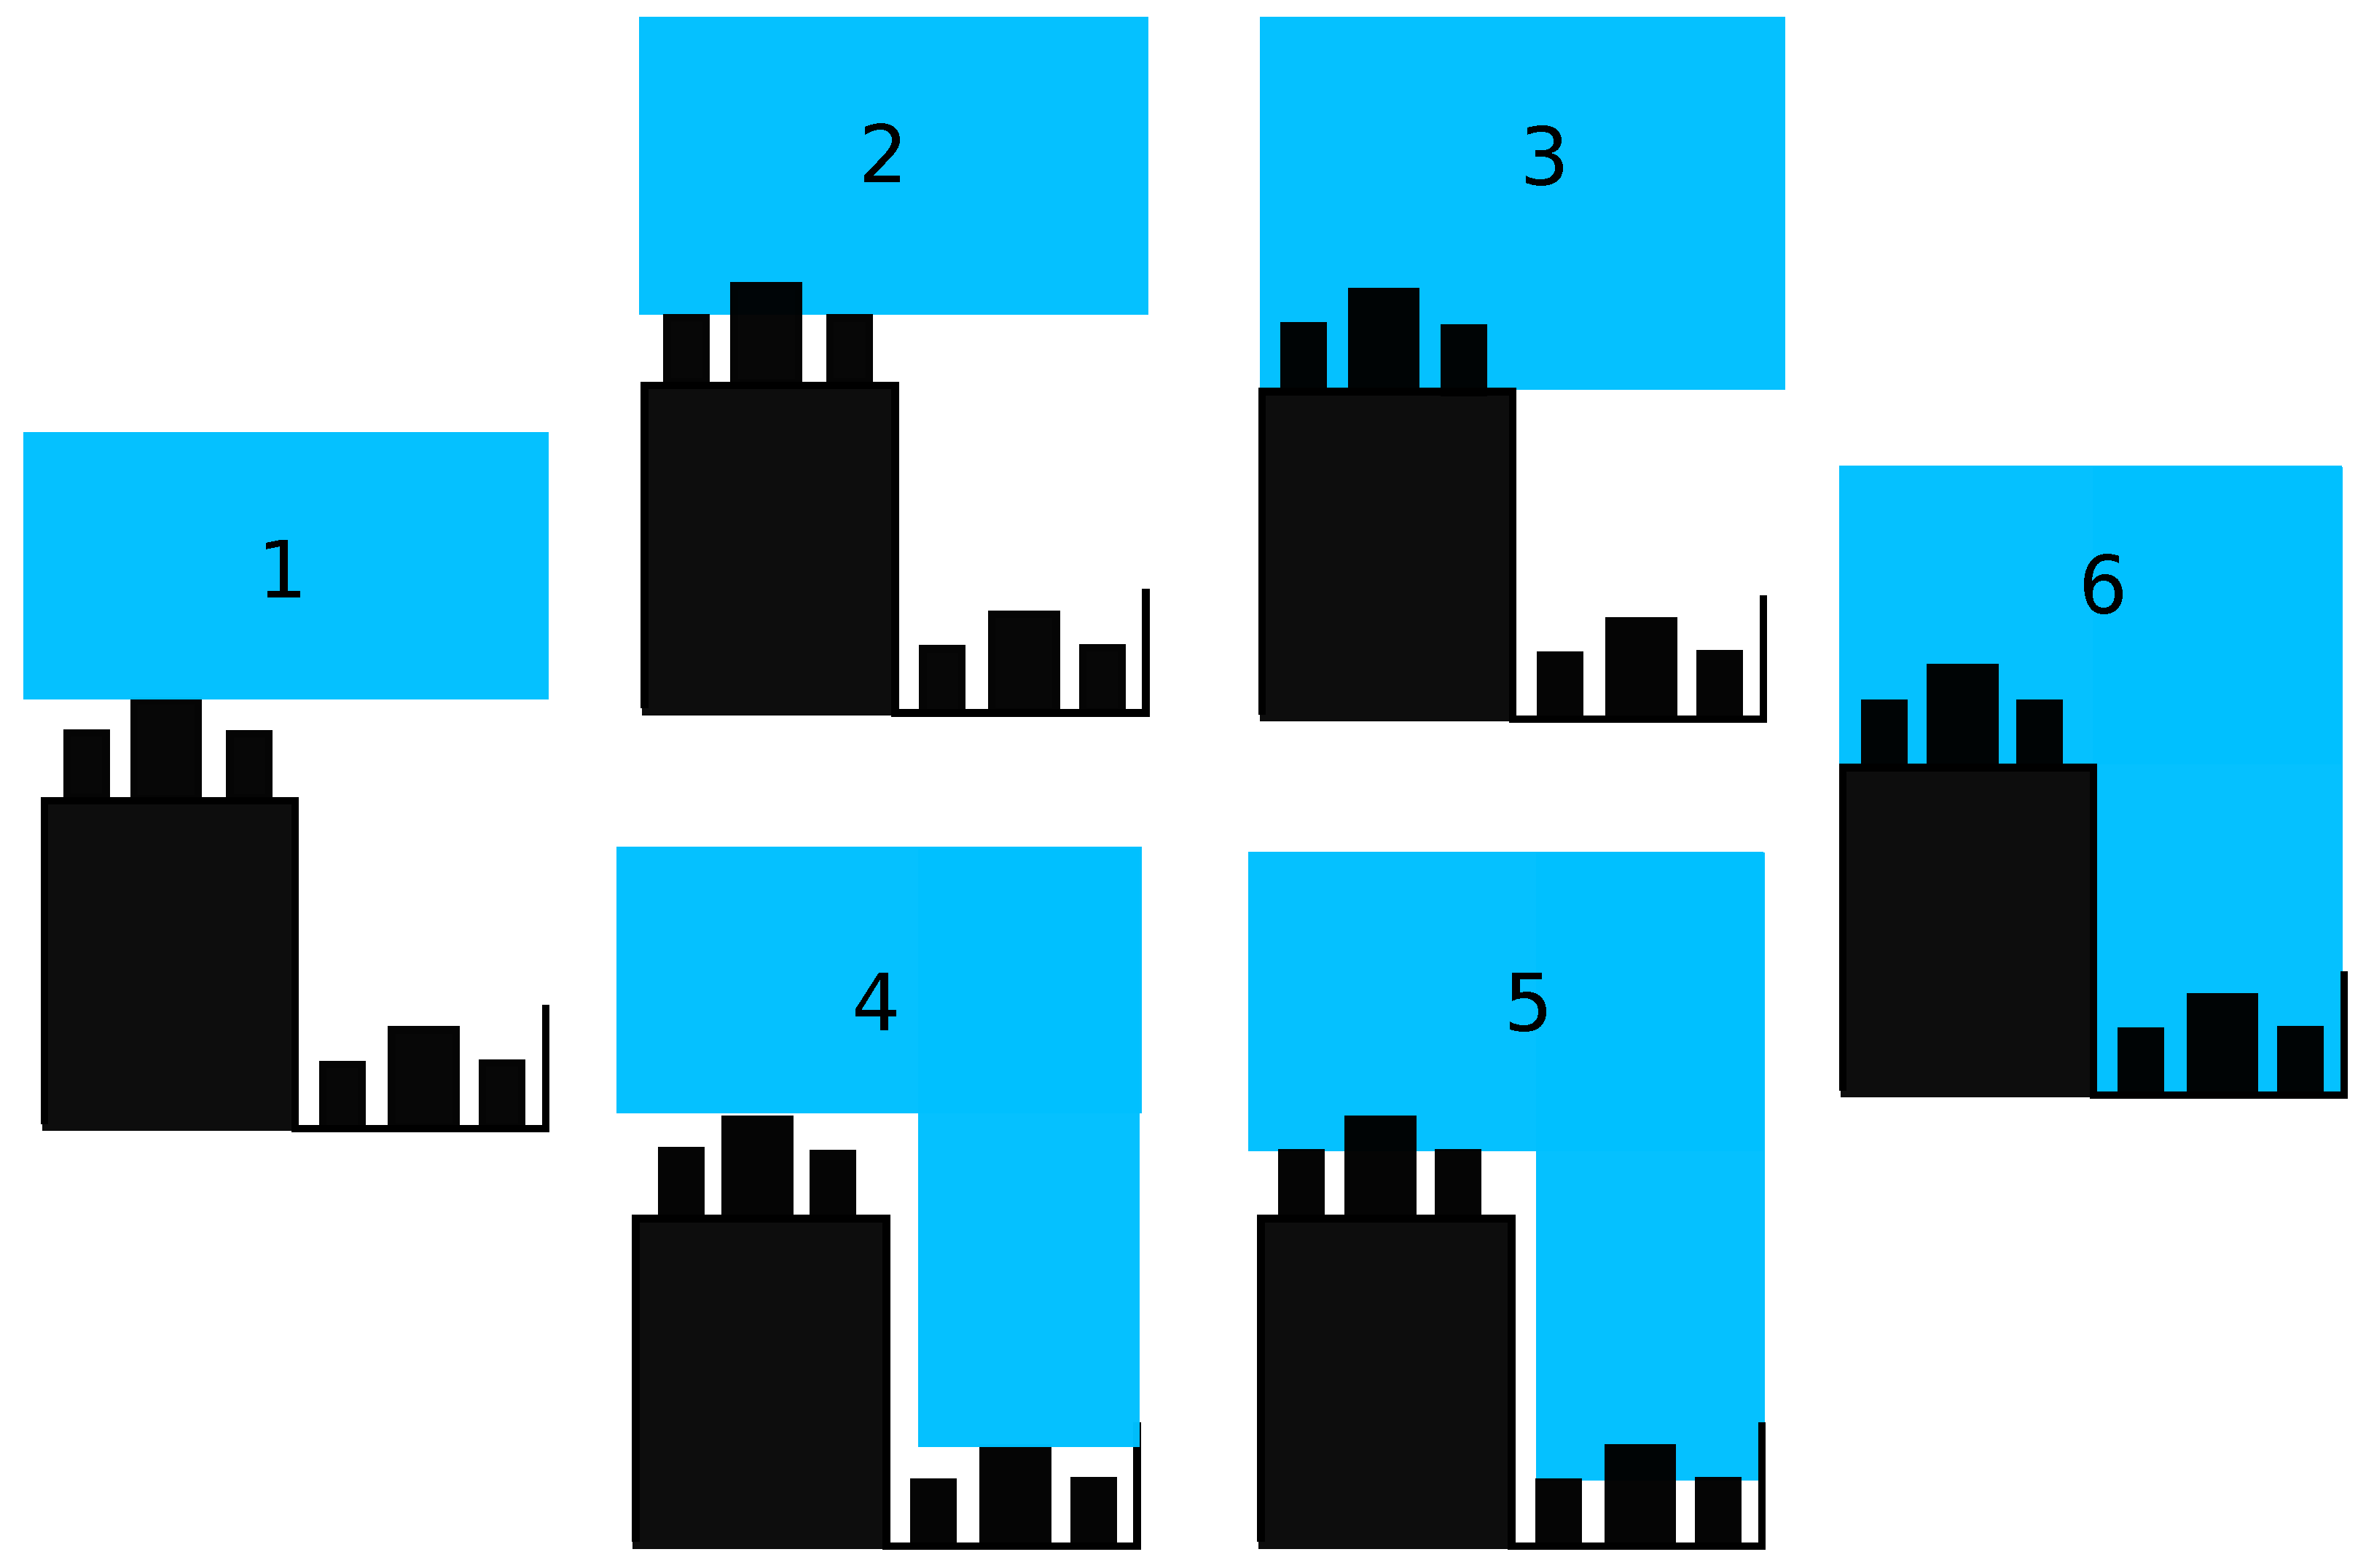
- The pure Cassie–Baxter state: oriented bumps and ridge lines wet in the Cassie–Baxter condition. The apparent contact angle is .
- The second pure Cassie–Baxter state: all scales wet in the Cassie–Baxter condition. The contact angle becomes
- Mixed state: ridge lines wet in Cassie–Baxter and the bumps wet in Wenzel. The expression of its apparent contact angle is .
- Mixed state: ridge lines wet in Wenzel and the oriented bumps wet in teh Cassie–Baxter state. The predicted contact angle for this configuration is .
- Mixed state: ridge lines wet in Wenzel state and all of the bumps wet in the Cassie–Baxter state. The predicted contact angle is .
- The pure Wenzel state: all scales wet in the Wenzel condition. The apparent contact angle becomes .
5. Conclusions
Author Contributions
Funding
Institutional Review Board Statement
Informed Consent Statement
Data Availability Statement
Acknowledgments
Conflicts of Interest
References
- Kreder, M.J.; Alvarenga, J.; Kim, P.; Aizenberg, J. Design of anti-icing surfaces: Smooth, textured or slippery? Nat. Rev. Mater. 2016, 1, 1–15. [Google Scholar] [CrossRef]
- Fürstner, R.; Barthlott, W.; Neinhuis, C.; Walzel, P. Wetting and Self-Cleaning Properties of Artificial Superhydrophobic Surfaces. Langmuir 2005, 3, 956–961. [Google Scholar] [CrossRef]
- Zhou, X.; Zhang, Z.; Xu, X.; Men, X.; Zhu, X. Fabrication of super-repellent cotton textiles with rapid reversible wettability switching of diverse liquids. Appl. Surf. Sci. 2013, 276, 571–577. [Google Scholar] [CrossRef]
- Park, S.; Kim, J.; Park, C.H. Influence of micro and nano-scale roughness on hydrophobicity of a plasma-treated woven fabric. Text. Res. J. 2017, 87, 193–207. [Google Scholar] [CrossRef]
- Zhang, X.; Wang, H.; Zhang, X.; Zhao, Z.; Zhu, Y. A multifunctional super-hydrophobic coating based on PDA modified MoS2 with anti-corrosion and wear resistance. Colloids Surf. A Physicochem. Eng. Asp. 2019, 568, 239–247. [Google Scholar] [CrossRef]
- Mao, Y.; Gleason, K.K. Vapor-Deposited Fluorinated Glycidyl Copolymer Thin Films with Low Surface Energy and Improved Mechanical Properties. Macromolecules 2006, 39, 3895–3900. [Google Scholar] [CrossRef]
- Jafari, R.; Menini, R.; Farzaneh, M. Superhydrophobic and icephobic surfaces prepared by RF-sputtered polytetrafluoroethylene coatings. Appl. Surf. Sci. 2010, 257, 1540–1543. [Google Scholar] [CrossRef] [Green Version]
- Coclite, A.M.; Shi, Y.; Gleason, K.K. Super-Hydrophobic and Oloephobic Crystalline Coatings by Initiated Chemical Vapor Deposition. Phys. Procedia 2013, 46, 56–61. [Google Scholar] [CrossRef] [Green Version]
- Hekster, F.M.; Laane, R.W.P.M.; De Voogt, P. Environmental and Toxicity Effects of Perfluoroalkylated Substances. In Reviews of Environmental Contamination and Toxicology; Ware, G.W., Albert, L.A., Crosby, D.G., De Voogt, P., Hutzinger, O., Knaak, J.B., Mayer, F.L., Morgan, D.P., Park, D.L., Tjeerdema, R.S., et al., Eds.; Springer: New York, NY, USA, 2003; pp. 99–121. [Google Scholar]
- Wenzel, R.N. Resistance of Solid Surfaces to Wetting by Water. Ind. Eng. Chem. 1936, 28, 988–994. [Google Scholar] [CrossRef]
- Cassie, A.B.; Baxter, S. Wettability of porous surfaces. Trans. Faraday Soc. 1944, 40, 546–551. [Google Scholar] [CrossRef]
- Ishino, C.; Okumura, K.; Quéré, D. Wetting transitions on rough surfaces. Europhys. Lett. 2004, 68, 419–425. [Google Scholar] [CrossRef]
- Marmur, A. Wetting on Hydrophobic Rough Surfaces: To Be Heterogeneous or Not To Be? Langmuir 2003, 19, 8343–8348. [Google Scholar] [CrossRef]
- Marmur, A. From Hygrophilic to Superhygrophobic: Theoretical Conditions for Making High-Contact-Angle Surfaces from Low-Contact-Angle Materials. Langmuir 2008, 24, 7573–7579. [Google Scholar] [CrossRef] [PubMed]
- Bormashenko, E. General equation describing wetting of rough surfaces. J. Colloid Interface Sci. 2011, 360, 317–319. [Google Scholar] [CrossRef]
- Whyman, G.; Bormashenko, E. How to Make the Cassie Wetting State Stable? Langmuir 2011, 27, 8171–8176. [Google Scholar] [CrossRef] [PubMed]
- Bormashenko, E. Progress in understanding wetting transitions on rough surfaces. Adv. Colloid Interface Sci. 2015, 222, 92–103. [Google Scholar] [CrossRef] [PubMed]
- Extrand, C.W.; Kumagai, Y. Contact Angles and Hysteresis on Soft Surfaces. J. Colloid Interface Sci. 1996, 184, 191–200. [Google Scholar] [CrossRef]
- Extrand, C.W. Designing for Optimum Liquid Repellency. Langmuir 2006, 22, 1711–1714. [Google Scholar] [CrossRef]
- Neinhuis, C.; Barthlott, W. Characterization and Distribution of Water-repellent, Self-cleaning Plant Surfaces. Ann. Bot. 1997, 79, 667–677. [Google Scholar] [CrossRef] [Green Version]
- Barthlott, W.; Mail, M.; Bhushan, B.; Koch, K. Plant Surfaces: Structures and Functions for Biomimetic Innovations. Nano Micro Lett. 2017, 9, 23. [Google Scholar] [CrossRef] [Green Version]
- Zheng, Y.; Gao, X.; Jiang, L. Directional adhesion of superhydrophobic butterfly wings. Soft Matter 2007, 3, 178–182. [Google Scholar] [CrossRef]
- Comanns, P.; Effertz, C.; Hischen, F.; Staudt, K.; Böhme, W.; Baumgartner, W. Moisture harvesting and water transport through specialized micro-structures on the integument of lizards. Beilstein J. Nanotechnol. 2011, 2, 204–214. [Google Scholar] [CrossRef] [Green Version]
- Malik, F.T.; Clement, R.M.; Gethin, D.T.; Krawszik, W.; Parker, A.R. Nature’s moisture harvesters: A comparative review. Bioinspir. Biomimetics 2014, 9. [Google Scholar] [CrossRef]
- Koch, K.; Bennemann, M.; Bohn, H.F.; Albach, D.C.; Barthlott, W. Surface microstructures of daisy florets (Asteraceae) and characterization of their anisotropic wetting. Bioinspir. Biomimetics 2013, 8, 036005. [Google Scholar] [CrossRef] [PubMed]
- Grewal, H.S.; Cho, I.; Yoon, E. The role of bio-inspired hierarchical structures in wetting. Bioinspir. Biomimetics 2015, 10, 026009. [Google Scholar] [CrossRef]
- Rahmawan, Y.; Moon, M.; Kim, K.; Lee, K.; Suh, K. Wrinkled, Dual-Scale Structures of Diamond-Like Carbon (DLC) for Superhydrophobicity. Langmuir 2010, 26, 484–491. [Google Scholar] [CrossRef] [PubMed]
- Feng, L.; Zhang, Y.; Xi, J.; Zhu, Y.; Wang, N.; Xia, F.; Jiang, L. Petal Effect: A Superhydrophobic State with High Adhesive Force. Langmuir 2008, 24, 4114–4119. [Google Scholar] [CrossRef] [PubMed]
- Alameda, M.T.; Osorio, M.R.; Hernández, J.J.; Rodríguez, I. Multilevel Hierarchical Topographies by Combined Photolithography and Nanoimprinting Processes to Create Surfaces with Controlled Wetting. Appl. Nano Mater. 2019, 2, 4727–4733. [Google Scholar] [CrossRef]
- Belaud, V.; Valette, S.; Stremsdoerfer, G.; Bigerelle, M.; Benayoun, S. Wettability versus roughness: Multi-scales approach. Tribol. Int. 2015, 82, 343–349. [Google Scholar] [CrossRef]
- Bizi-Bandoki, P.; Benayoun, S.; Valette, S.; Beaugiraud, B.; Audouard, E. Modifications of roughness and wettability properties of metals induced by femtosecond laser treatment. Appl. Surf. Sci. 2011, 257, 5213–5218. [Google Scholar] [CrossRef]
- Divin-Mariotti, S.; Amieux, P.; Pascale-Hamri, A.; Auger, V.; Kermouche, G.; Valiorgue, F.; Valette, S. Effects of micro-knurling and femtosecond laser micro texturing on aluminum long-term surface wettability. Appl. Surf. Sci. 2019, 479, 344–350. [Google Scholar] [CrossRef]
- Wong, W.S.Y.; Stachurski, Z.H.; Nisbet, D.R.; Tricolo, A. Ultra-Durable and Transparent Self-Cleaning Surfaces by Large-Scale Self-Assembly of Hierarchical Interpenetrated Polymer Networks. Appl. Mater. Interfaces 2016, 8, 13615–13623. [Google Scholar] [CrossRef] [PubMed]
- Sutar, R.S.; Kalel, P.J.; Latthe, S.S.; Kumbhar, D.A.; Deepak, A.M.; Mahajan, S.S.; Chikode, P.P.; Patil, S.S.; Kadam, S.S.; Gaikwad, V.H.; et al. Superhydrophobic PVC/SiO 2 Coating for Self-Cleaning Application. Macromol. Symp. 2020, 393. [Google Scholar] [CrossRef]
- Pionnier, N. Amélioration des Propriétés Antibuée du Polycarbonate Transparent par Traitement Topographique. Ph.D. Thesis, Université de Lyon, Lyon, France, 2017. [Google Scholar]
- Weng, C.; Wang, F.; Zhou, M.; Yang, D.; Jiang, B. Fabrication of hierarchical polymer surfaces with superhydrophobicity by injection molding from nature and function-oriented design. Appl. Surf. Sci. 2018, 436, 224–233. [Google Scholar] [CrossRef]
- Huang, H.; Wang, X. Biomimetic fabrication of micro-/nanostructure on polypropylene surfaces with high dynamic superhydrophobic stability. Mater. Today Commun. 2019, 19, 487–494. [Google Scholar] [CrossRef]
- Singh, R.A.; Yoon, E.; Kim, H.J.; Kim, J.; Jeong, H.E.; Suh, K.Y. Replication of surfaces of natural leaves for enhanced micro-scale tribological property. Mater. Sci. Eng. C 2007, 27, 875–879. [Google Scholar] [CrossRef]
- Guan, H.; Han, Z.; Cao, H.; Niu, S.; Qian, Z.; Ye, J.; Ren, L. Characterization of Multi-scale Morphology and Superhydrophobicity of Water Bamboo Leaves and Biomimetic Polydimethylsiloxane (PDMS) Replicas. J. Bionic Eng. 2015, 12, 624–633. [Google Scholar] [CrossRef]
- Liu, Y.; Gu, H.; Jia, Y.; Liu, J.; Zhang, H.; Wang, R.; Zhang, B.; Zhang, H.; Zhang, Q. Design and preparation of biomimetic polydimethylsiloxane (PDMS) films with superhydrophobic, self-healing and drag reduction properties via replication of shark skin and SI-ATRP. Chem. Eng. J. 2019, 356, 318–328. [Google Scholar] [CrossRef]
- Cho, K.L.; Wu, A.H.; Liaw, I.I.; Cookson, D.; Lamb, R.N. Wetting Transitions on Hierarchical Surfaces. J. Phys. Chem. C 2012, 116, 26810–26815. [Google Scholar] [CrossRef]
- Hourlier-Fargette, A. Soft Interfaces: From Elastocapillary Snap-through to Droplet Dynamics on Elastomers. Ph.D. Thesis, Universite Pierre et Marie Curie-Paris VI, Paris, France, 2017. [Google Scholar]
- Shao, G.; Wu, J.; Cai, Z.; Wang, W. Fabrication of elastomeric high-aspect-ratio microstructures using polydimethylsiloxane (PDMS) double casting technique. Sens. Actuators A Phys. 2012, 178, 230–236. [Google Scholar] [CrossRef]
- AFNOR. Geometrical Product Specification (GPS) Surface Texture: Areal—Part 2: Terms, Definitions and Surface Texture Parameters; Standard; AFNOR: Paris, France, 2012. [Google Scholar]
- Bormashenko, E. Physics of Wetting. Phenomena and Applications of Fluids on Surfaces; De Gruyter: Berlin, Germany, 2017. [Google Scholar]
- Drelich, J.; Marmur, A. Contact Angles and Wettability: Towards Common and Accurate Terminology, Surface Innovations; Ice Publishing: London, UK, 2017; Volume 5, pp. 3–8. [Google Scholar]
- Extrand, C.W. Uncertainty in contact angle measurements from the tangent method. J. Adhes. Sci. Technol. 2016, 30, 1597–1601. [Google Scholar] [CrossRef] [Green Version]
- Hua, F.; Sun, Y.; Gaur, A.; Meitl, M.A.; Bilhaut, L.; Rotkina, L.; Wang, J.; Geil, P.; Shim, M.; Rogers, J.A.; et al. Polymer Imprint Lithography with Molecular-Scale Resolution. Nano Lett. 2004, 4, 2467–2471. [Google Scholar] [CrossRef]
- Koch, K.; Hartman, K.D.; Schreibe, L.; Barthlott, W.; Neinhuis, C. Influences of air humidity during the cultivation of plants on wax chemical composition, morphology and leaf surface wettability. Environ. Exp. Bot. 2006, 56, 1–9. [Google Scholar] [CrossRef]
- Marmur, A.; Bittoun, E. When Wenzel and Cassie Are Right: Reconciling Local and Global Considerations. Langmuir 2009, 25, 1277–1281. [Google Scholar] [CrossRef] [PubMed]
- Dubov, A.L.; Teisseire, J.; Barthel, E. Elastic instability and contact angles on hydrophobic surfaces with periodic textures. Europhys. Lett. 2012, 97, 26003. [Google Scholar] [CrossRef] [Green Version]
- Dubov, A.L.; Mourran, A.; Möller, M.; Vinogradova, O.I. Contact angle hysteresis on superhydrophobic stripes. J. Chem. Phys. 2014, 141, 074710. [Google Scholar] [CrossRef] [Green Version]


| Type of Texture | Phyllostachys | Sasa | ||||
|---|---|---|---|---|---|---|
| Period | Width | Height | Period | Width | Height | |
| (μm) | (μm) | (μm) | (μm) | (μm) | (μm) | |
| Main ridge line | none | 600 ± 26 | 300 ± 11 | none | 700 ± 34 | 400 ± 10 |
| Second type of ridge line | 1200 ± 70 | - | 10 ± 1 | 2000 ± 101 | - | 40 ± 5 |
| Third type of ridge line | 160 ± 5 | 60 ± 3 | 15 ± 3 | 300 ± 12 | 100 ± 7 | 15 ± 2 |
| Oriented bumps (main ridge line direction) | 60 ± 3 | 20 ± 2 | 15 ± 2 | 70 ± 4 | 60 ± 8 | 30 ± 1 |
| Oriented bumps (orthogonal direction) | 80 ± 7 | 15 ± 1 | 15 ± 2 | 150 ± 9 | 40 ± 3 | 30 ± 1 |
| Simple Bumps | 9 ± 6 | 3 ± 4 | 3 ± 2 | 11 ± 5 | 10 ± 4 | 7 ± 3 |
| Surface | Pattern | Type | (μm) ± 0.7 | (μm) ± 0.7 | (%) |
|---|---|---|---|---|---|
| Phyllostachys ( = 120 μm) | ridge lines | Leaf | 2.1 | 2.6 | 0.33 ± 0.02 |
| Replica | 3.5 | 4.7 | 0.55 ± 0.15 | ||
| bumps | Leaf | 2.5 | 3.2 | 15.8 ± 0.83 | |
| Replica | 3.2 | 4.2 | 36.1 ± 0.70 | ||
| Sasa ( = 225 μm) | ridge lines | Leaf | 1.7 | 2.2 | 0.12 ± 0.02 |
| Replica | 5.2 | 6.2 | 0.74 ± 0.18 | ||
| bumps | Leaf | 3.2 | 4.0 | 12.3 ± 0.26 | |
| Replica | 5.7 | 7.1 | 26.2 ± 0.85 | ||
| Ginkgo Biloba | all | Leaf | 7.4 | 9.1 | 42.4 ± 0.6 |
| all | Replica | 8.8 | 10.4 | 36.4 ± 1.1 |
| Surface | Scale | Solid Fraction | Wenzel Parameter r |
|---|---|---|---|
| Phyllostachys replica | Ridge Lines | = 0.6 | = 1.006 |
| Oriented Bumps | = 0.08 | 1.361 | |
| Simple Bumps | = 0.25 | 1.361 | |
| Sasa replica | Ridge Lines | = 0.55 | = 1.007 |
| Oriented Bumps | = 0.68 | 1.260 | |
| Simple Bumps | = 0.25 | 1.260 | |
| Ginkgo replica | All | = 0.29 | r = 1.36 |
| Surface | Wetting Configuration | Predicted Contact Angle () | Experimental Contact Angle () |
|---|---|---|---|
| Phyllostachys replica | 1 | 166 | 133–135 |
| 2 | 150 | ||
| 3 | 133 | ||
| 4 | 162 | ||
| 5 | 142 | ||
| 6 | 121 | ||
| Sasa replica | 1 | 139 | 134–136 |
| 2 | 131 | ||
| 3 | 133 | ||
| 4 | 124 | ||
| 5 | 113 | ||
| 6 | 119 | ||
| Ginkgo replica | 1 | 144 | 131 |
| 6 | 121 |
Publisher’s Note: MDPI stays neutral with regard to jurisdictional claims in published maps and institutional affiliations. |
© 2021 by the authors. Licensee MDPI, Basel, Switzerland. This article is an open access article distributed under the terms and conditions of the Creative Commons Attribution (CC BY) license (https://creativecommons.org/licenses/by/4.0/).
Share and Cite
Legrand, Q.; Benayoun, S.; Valette, S. Biomimetic Approach for the Elaboration of Highly Hydrophobic Surfaces: Study of the Links between Morphology and Wettability. Biomimetics 2021, 6, 38. https://0-doi-org.brum.beds.ac.uk/10.3390/biomimetics6020038
Legrand Q, Benayoun S, Valette S. Biomimetic Approach for the Elaboration of Highly Hydrophobic Surfaces: Study of the Links between Morphology and Wettability. Biomimetics. 2021; 6(2):38. https://0-doi-org.brum.beds.ac.uk/10.3390/biomimetics6020038
Chicago/Turabian StyleLegrand, Quentin, Stephane Benayoun, and Stephane Valette. 2021. "Biomimetic Approach for the Elaboration of Highly Hydrophobic Surfaces: Study of the Links between Morphology and Wettability" Biomimetics 6, no. 2: 38. https://0-doi-org.brum.beds.ac.uk/10.3390/biomimetics6020038