Article

Evaluating a Machine Learning Tool for the Classification of Pathological Uptake in Whole-Body PSMA-PET-CT Scans

1
Department of Nuclear Medicine, University Hospital Bonn, 53127 Bonn, Germany
2
Department of Computer Science, University of Bonn, 53115 Bonn, Germany
3
Bonn-Aachen International Center for Information Technology (B-IT), 53115 Bonn, Germany
*
Author to whom correspondence should be addressed.
Both authors contributed in equal to the manuscript.
Submission received: 28 May 2021 / Revised: 10 July 2021 / Accepted: 27 July 2021 / Published: 29 July 2021
(This article belongs to the Special Issue AI Imaging Diagnostic Tools)

Abstract

:
The importance of machine learning (ML) in the clinical environment increases constantly. Differentiation of pathological from physiological tracer-uptake in positron emission tomography/computed tomography (PET/CT) images is considered time-consuming and attention intensive, hence crucial for diagnosis and treatment planning. This study aimed at comparing and validating supervised ML algorithms to classify pathological uptake in prostate cancer (PC) patients based on prostate-specific membrane antigen (PSMA)-PET/CT. Retrospective analysis of 68Ga-PSMA-PET/CTs of 72 PC patients resulted in a total of 77 radiomics features from 2452 manually delineated hotspots for training and labeled pathological (1629) or physiological (823) as ground truth (GT). As the held-out test dataset, 331 hotspots (path.:128, phys.: 203) were delineated in 15 other patients. Three ML classifiers were trained and ranked to assess classification performance. As a result, a high overall average performance (area under the curve (AUC) of 0.98) was achieved, especially to detect pathological uptake (0.97 mean sensitivity). However, there is still room for improvement to detect physiological uptake (0.82 mean specificity), especially for glands. The ML algorithm applied to manually delineated lesions predicts hotspot labels with high accuracy on unseen data and may be an important tool to assist in clinical diagnosis.

1. Introduction

Prostate Cancer is one of the leading malignancies in the whole world, with 1.3 million new cases in 2018. It is the second most common cancer in men worldwide [1] and is the fifth leading cause of cancer death [2]. The number of deaths is estimated to rise by 105.6% by 2040 [2]. While the overall 5-year-survival-rate reaches 98.0%, it decreases to 30.5% once metastases occur [3].
In order to diagnose the disease, detect possible progression and monitor therapy response, body scans are indispensable. Hybrid positron emission tomography/computed tomography (PET/CT) scans depict anatomical data on the one hand and functional information of tissues on the other hand. As a favorable biomarker for PET in prostate cancer patients, radiolabeled ligands to prostate-specific membrane antigen (PSMA) are used, being considered in many studies [4]. PSMA is expressed in prostate cells in very low concentration and overexpressed in an increasing degree on prostate cancer cells [5]. Therefore, it allows distinguishing between benign and malignant tissues. For PET diagnosis, small molecules targeting PSMA and labeled with the positron emitters, gallium-68 (68Ga) [6] or fluorine-18 (18F) [7], are utilized. The combination of PSMA-PET and CT allows allocating metastasis accurately [8,9].
So far, analysis of PSMA-PET/CT image data, performed by specialists in nuclear medicine, is mainly done manually based on experience. This has several disadvantages, being time-consuming and error-prone with high numbers of inter- and intra-observer variability [10]. Here, the use of computer-aided diagnosis (CAD) has several advantages: it can improve diagnostic precision, accelerates analysis, facilitates the clinical workflow, lowers human resource costs, and even may predict prognosis, and last but not least, if trained with proper datasets, can compensate for inter- and intra-observer variability [11]. Machine learning (ML) algorithms base their analysis on very large amounts of unstructured information (“big data” [12]), which allows the recognition of complex patterns. Especially in imaging, their application has shown to be very successful [13,14,15]. In hybrid imaging, the implementation of artificial intelligence (AI) is a promising field with application in a wide range of clinical sectors, e.g., Morbus Alzheimer in neurology, lung cancer, multiple myeloma, and prostate cancer in oncology [10,11]. Analysis of textural parameters in standard clinical image data allows performing segmentation and characterization of tissues as well as being useful in the fields of prediction and prognosis, leading the way to individually tailored therapies in the future [16,17,18]. In the field of prostate cancer, ML methods are furthermore already used and growing, e.g., in treatment, histopathology and genetics [13,14]. Khurshid et al. have shown that the two textural heterogeneity parameters, entropy and homogeneity, correlate with pre/post-therapy prostate-specific antigen (PSA) levels. A higher level of heterogeneity seems to predict a better response to PSMA therapy and may in the future allow a pre-therapeutic selection of responders to the treatment [19]. Moazemi et al. have consecutively shown that these parameters also have prognostic potential for the overall survival of prostate cancer patients [20]. In summary, the software could take over and improve the whole process in the future, enabling specialists to focus on more important tasks. For such CAD, including decision support algorithms, at first, the detection of pathological lesions is necessary, followed by an analysis of the radiomics features in these lesions. Although the automatic segmentation of high tracer uptake would be an essential step towards such a clinical decision support tool, in this study, we focus on the automated classification of pathological vs physiological uptake using radiomics features from manually segmented hotspots and leave the automated segmentation as future work. When present, such an automated system would enhance the procedure of the management of PC patients in terms of time and effort.
Therefore, in the present work, we further compare and evaluate supervised ML-based algorithms for classifying hotspots in PSMA PET/CT, which have shown their potential before [21]. Additionally, to verify the significance of the existing algorithm, the training cohort was gradually extended to find out with how many subjects our model would generalize. The aim of this study was to quantify the accuracy of the algorithm as applied to unseen sets of data, especially focusing on enhancing the true classification of hotspots with physiological uptake. To this end, first, the patients’ scans are manually annotated to provide data. Then, python software undertakes the task of classifying uptakes into two categories (pathological vs physiological). Finally, the output is verified and reviewed with an independent test cohort.

2. Materials and Methods

2.1. Patients and Volume of Interest (VoI) Delineation

Data of 87 patients with histologically proven prostate cancer were included in this analysis. All patients received a PSMA-PET/CT examination due to clinical reasons, either for staging or treatment control. PET/CT examinations were performed 40 to 80 min after the intravenous injection from 98 to 159 MBq in-house produced 68Ga-HBED-CC PSMA using a Siemens Biograph 2 PET/CT machine (Siemens Healthineers, Erlangen, Germany). First, a low-dose CT (16 mAS, 130 kV) was performed from the skull to mid-thigh, followed by the PET imaging over the same area with 3 or 4 min per bed position depending on the weight of the patient. PET data were reconstructed in 128 × 128 matrices with 5 mm slice thickness, while CT data were reconstructed in 512 × 512 matrices with 5 mm slice thickness. For PET image reconstruction, the attenuation-weighted ordered subsets expectation-maximization algorithm implemented by the manufacturer was used, including attenuation and scatter correction based on the CT data. Additionally, applied by the manufacturer, a 5 mm post-reconstruction Gaussian filtering was used for smoothing of all the input images prior to the ML analyses. All patients gave written and informed consent to the diagnostic procedure. Due to the retrospective character of the data analysis, an ethical statement was waived by the institutional ethical review board according to the professional regulations of the medical board of Nordrhein-Westfalen, Germany.
A total of 72 patients were assigned as the training dataset. The patients’ average age was 71 (range: 48–87), and the average Gleason score was 8 (range: 6–10) (Table 1). The PET/CT images data were analyzed using Interview Fusion Software by Mediso Medical Imaging (Budapest, Hungary) [
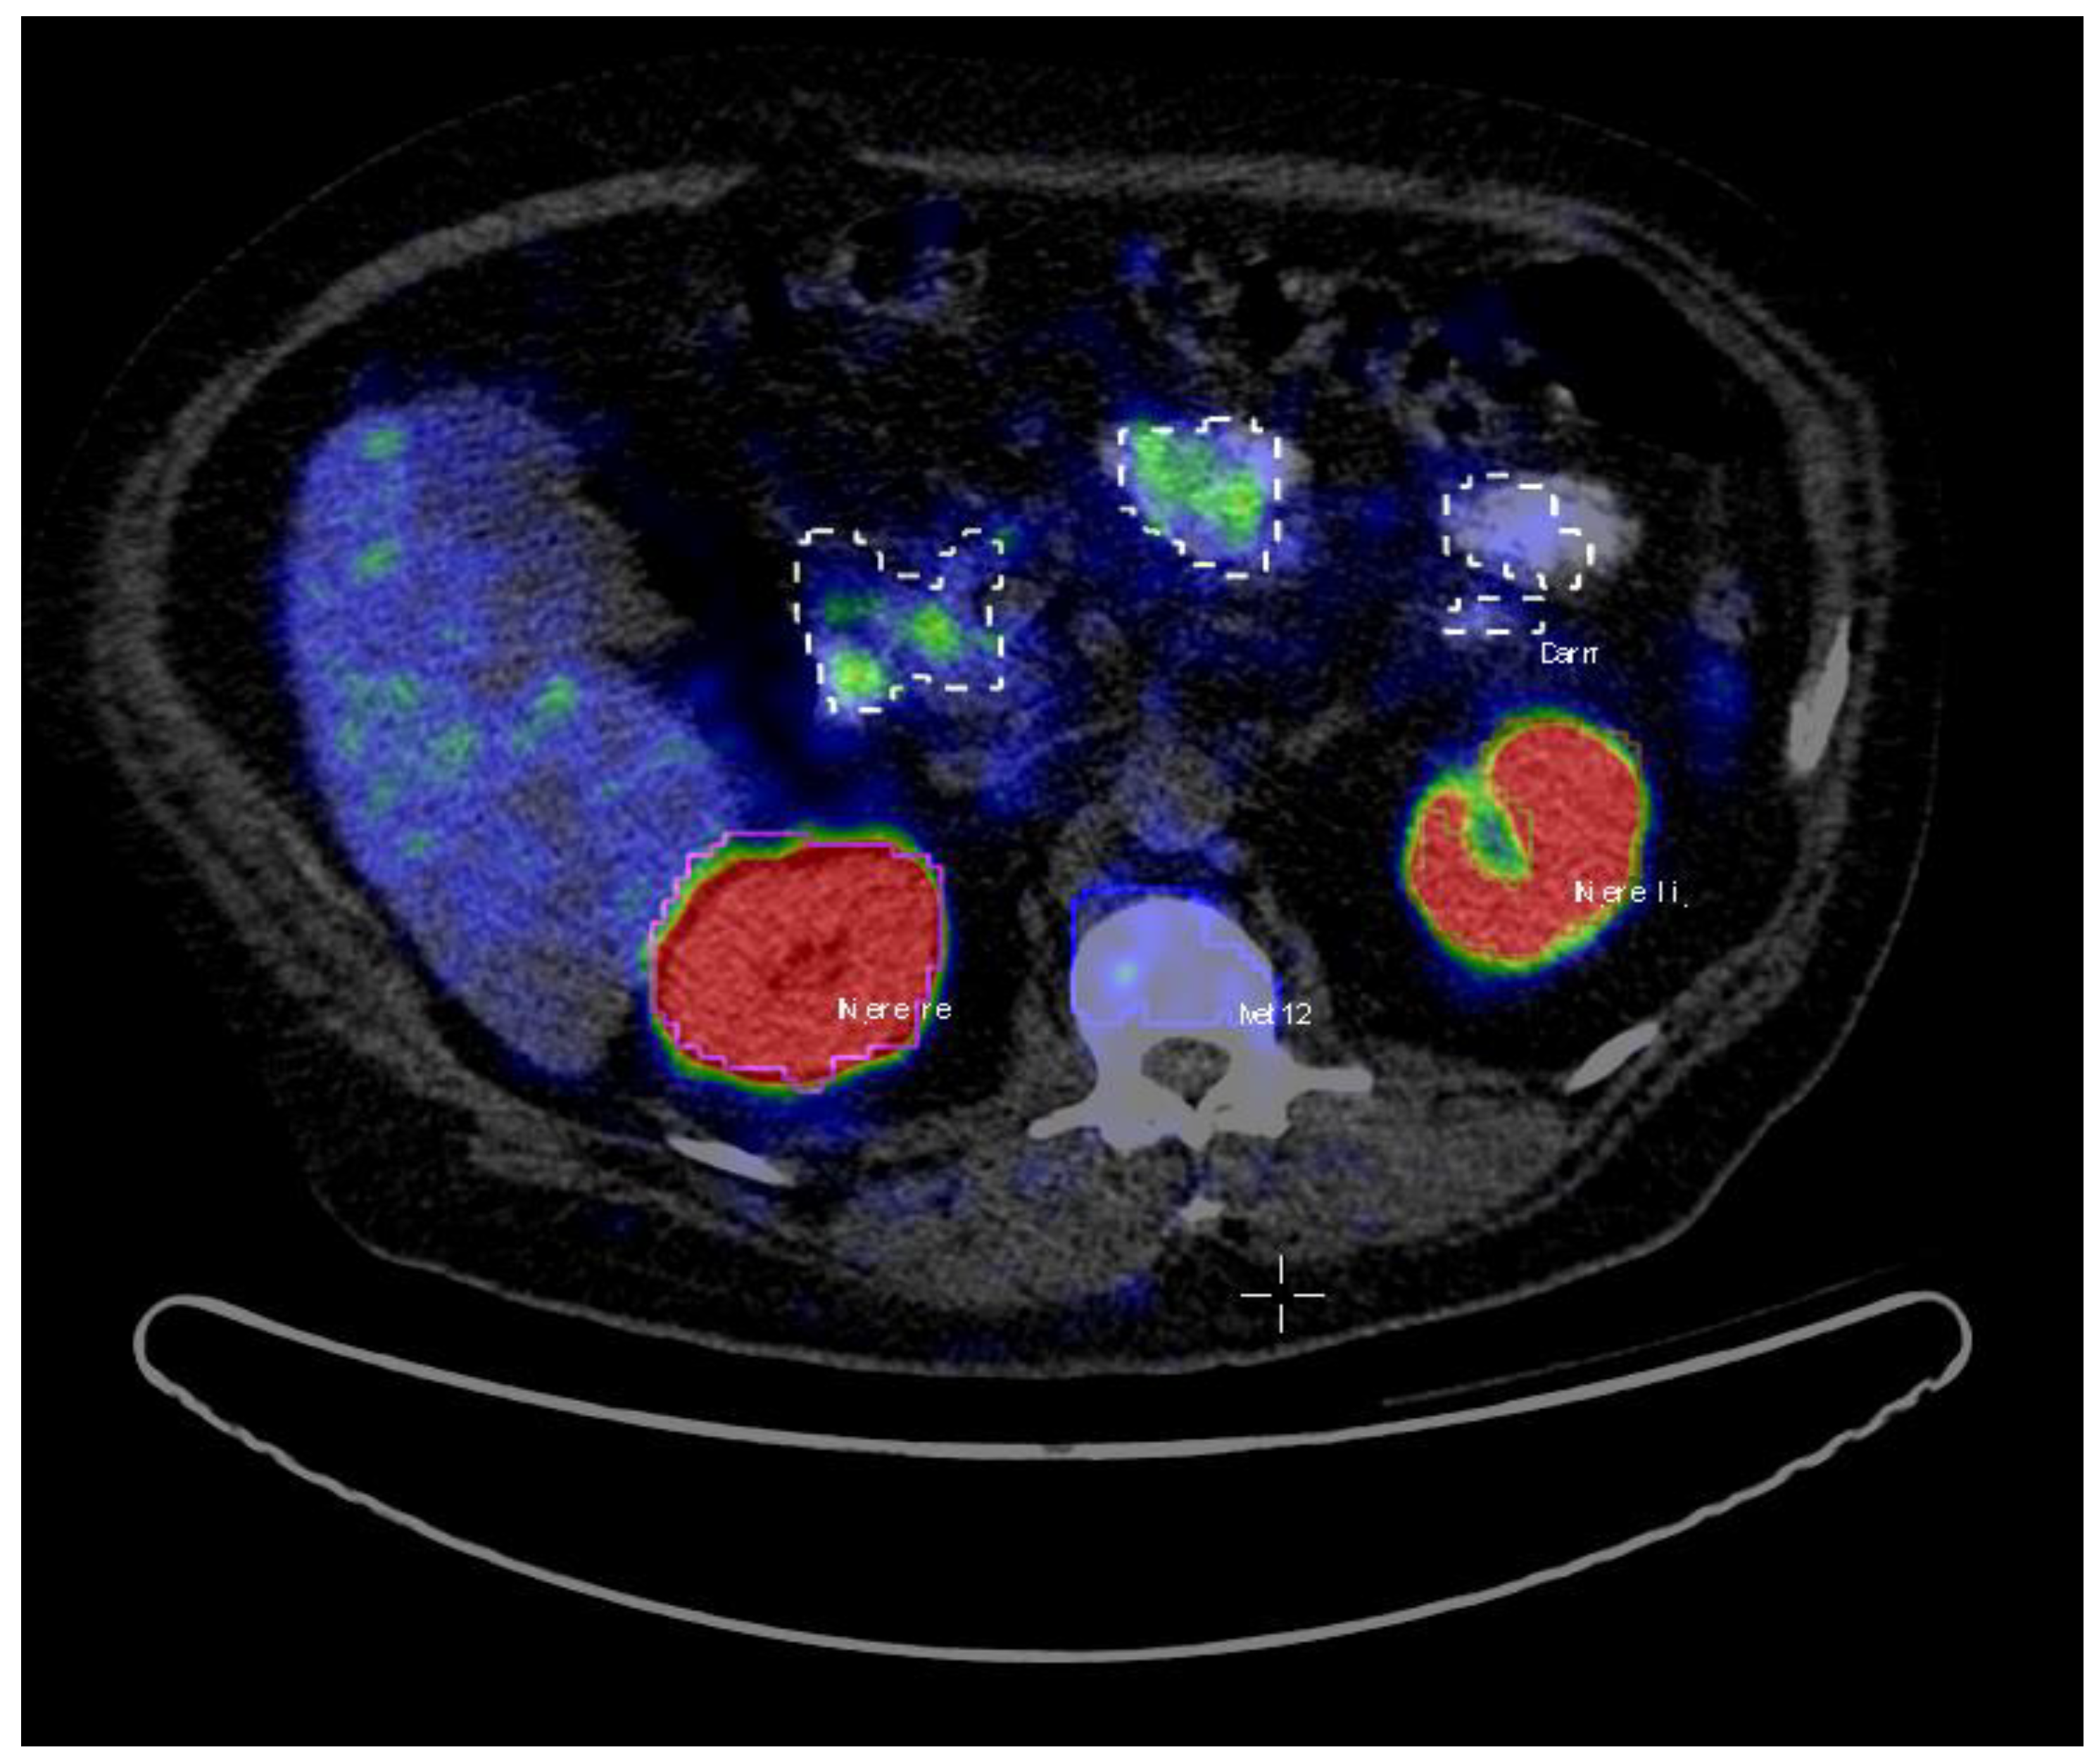
22]. All the hotspots have been identified based on fused PET and CT data. Volumes of interest (VoIs) were manually delineated with a brush tool in the PET images slice by slice (Figure 1). The criteria to choose an uptake was the visible tracer uptake without any predefined threshold. In a second step, the hotspots were classified as pathological or physiological, corresponding to the location they were situated in. The hotspots included primary prostate cancer and metastases in the skeletal system, lymph nodes, as well as physiological uptake in kidneys, liver, glands, gastrointestinal tract (gut) etc. A total number of 2452 hotspots were marked and then categorized as either pathological (total of 1629) or physiological (total of 823).
In total, 15 remaining patients with similar ranges of age, Gleason score, and PSA level as the patients in the training cohort were assigned to the test group for testing the ML algorithm (Table 1). First, the scans were again analyzed in the same way with Interview Fusion software as described above. For every patient, 5 to 10 pathological hotspots were delineated and tracer uptake in all glands; 5 physiological hotspots and uptake in the liver. Beforehand, glands proved to be difficult for the algorithm to classify whether physiological or pathological. This analysis resulted in 331 hotspots with 128 pathological and 203 physiological lesions.
For each hotspot, a total of 77 radiomics features were calculated using InterView FUSION software (Mediso Medical Imaging, Budapest, Hungary). The features include first/higher order statistics, textural heterogeneity parameters, and zone/run length statistics features. The complete list of the features is provided in Table 2.

2.2. Training and Classification

For the ML analyses, the question of pathological versus physiological uptake was mapped to the so-called supervised ML problem [
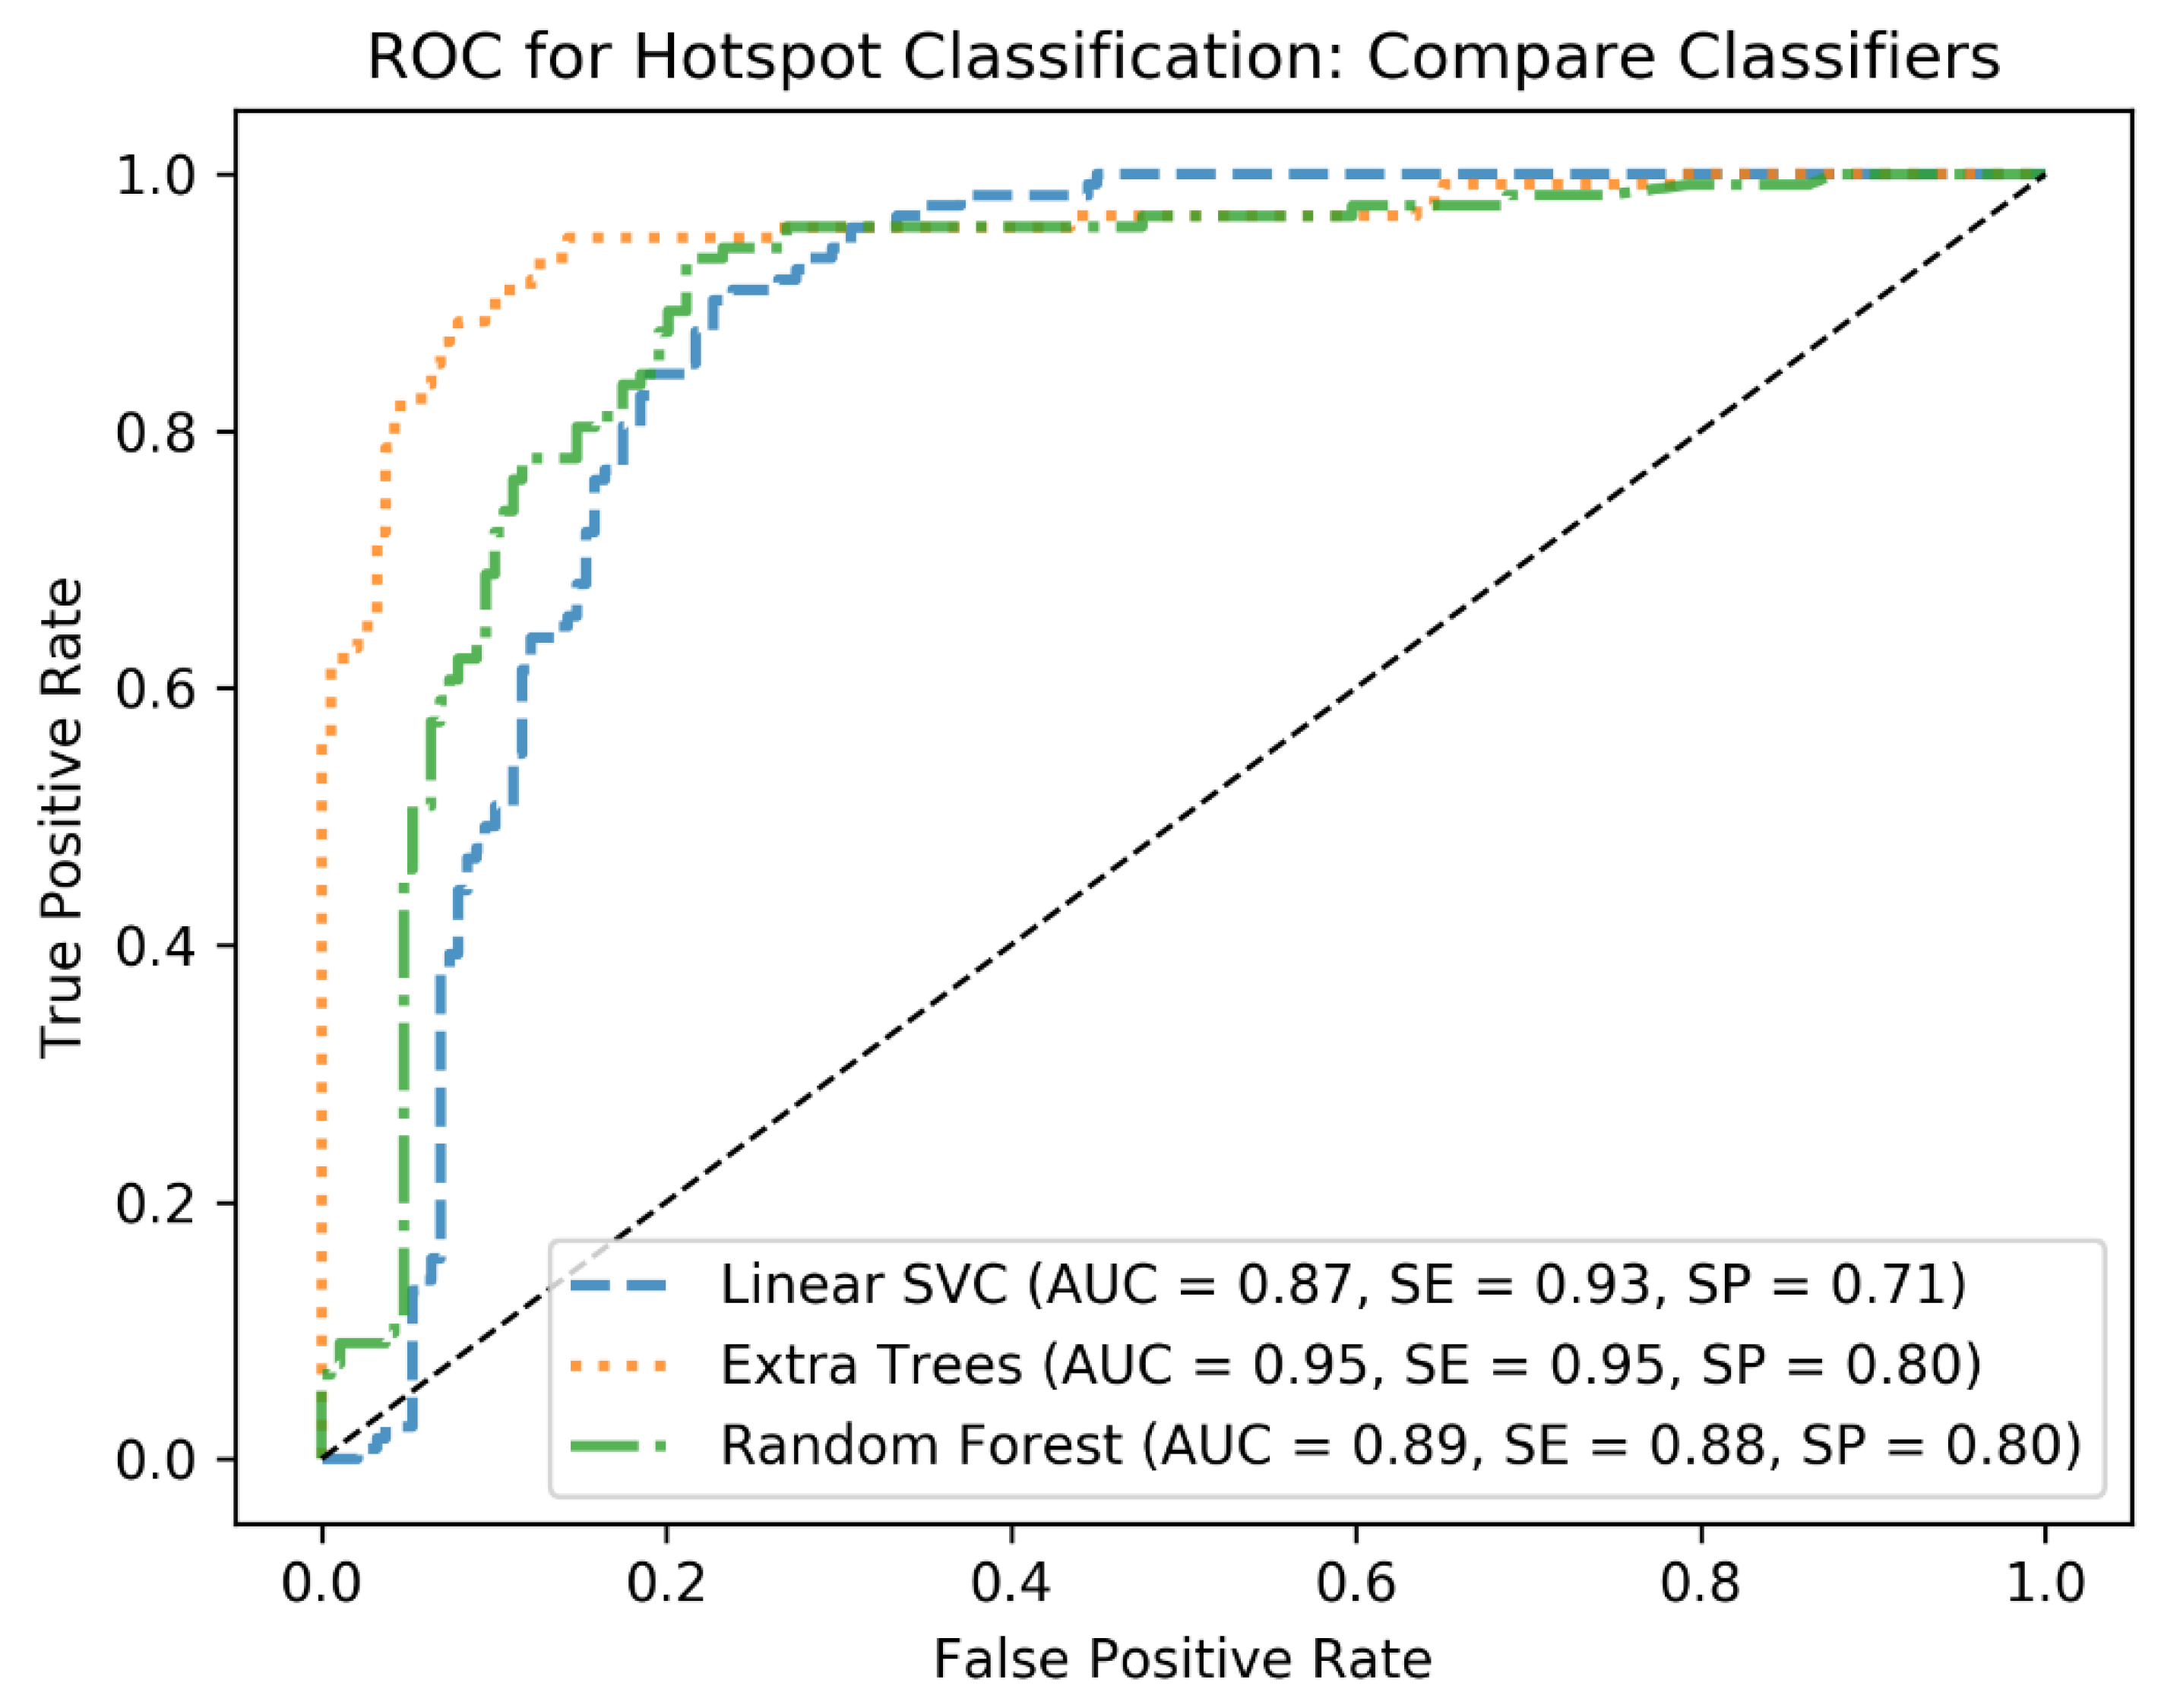
23]. This sort of ML algorithm is applied when part of the study cohort already includes complete information on input variables (in our case, PET/CT hotspots and their corresponding radiomics features) as well as ground truth labels (in our case, pathological vs physiological). Thus, for training and classification purposes, an in-house developed software in Python V.3.5 was used. Initially, we used a 30-subjects subset of the training dataset of 72 subjects to pre-set, tune, and compare our machine learning classifiers from SciKitLearn library [24] (linear kernel support vector machine (SVM), as well as ExtraTrees [25] and random forest as classifiers based on decision trees [26]), which already showed their significance [21].
In the first round of training, cross-validation (CV) is applied with KFold with 3 folds to tune hyperparameters of the classifiers and identify the best performing one. To this end, at each CV step, the C and Gamma parameters of the linear SVM as well as the min_sample_leaf and max_depth of the decision tree-based algorithms are tuned using grid search. For the hyperparameter tuning, standard ranges of the hyperparameters are applied. For example, for C, the range from 2−5 to 213 is used, and for max_depth, the range from 1 to 10 is used for the grid search. This has resulted in the best combination of the hyperparameters for each classifier and helped to identify the best classifier based on the performance metrics AUC, sensitivity (SE), and specificity (SP). We further quantified the performances of the classifiers on the test cohort to end up with the best algorithm, which was Extra Trees. From this point, we used Extra Trees with its tuned hyperparameters (n_estimators = 250, max_depth = 20, min_samples_leaf = 1) to investigate how the algorithm would generalize as the size of the training cohort increases.
For the next step to assess the generalizability of the algorithms, we started with the first initial cohort of 30 patients for training the algorithm. Then, we added the data from the second training cohort (42 patients), one patient at a time and with a randomized order (thus, the sizes of the training subsets varied from 30 to 72). It means, in each training step, a random subset of the combination of the two training cohorts was chosen, and each time the size of the subset was increased by one patient. Furthermore, we repeated the classification task 100 times with a bootstrapping approach to calculate the accuracy measures at each training step. As we aimed at assessing the performance of our algorithm on unseen data, in each step, we calculated the prediction accuracies (AUC, sensitivity (SE), and specificity (SP)) on the validation set (the hold-out set with 15 subjects). Finally, we report the mean and standard deviation (std) of the accuracy metrics to give an overview of how increasing the size of the training cohort affects the classification performance metrics when trained by the training cohorts of 30 to 72 subjects and tested by the test cohort of 15 subjects. The performance metrics were calculated at each training step based on the prediction scores of the ML classifier as trained by the training cohort and tested by the test cohort, then averaged along 100 bootstraps.
To minimize the risk of overfitting, first, the dataset including feature vectors of training and test subjects were normalized, using the MinMax standardization method. This method maps the input variables into the range between 0 and 1 to compensate for inconsistent variable ranges. As a result, variables with very large or very small values would not affect the classifier performance. For this study, we chose to apply both cross-validations to identify the best classifier and bootstrapping with replacement and resampling on the training set to better estimate the population statistics.

3. Results

3.1. Pathological and Physiological Hotspots

In the 72 patients’ scans of the training cohort, 2452 hotspots have been identified and marked. Out of these, 823 hotspots have been classified as physiological versus 1634 as pathological. In the 15 patients of the control cohort, 331 areas with increased uptake have been defined. Table 3 shows the detailed distribution of hotspots in the training cohort, and Table 4 shows the summarized distribution of the hotspots in the train and test cohorts. In the training cohort of 72 patients, the category “others” denotes 33 lesions in other organs such as the spleen and lung.

3.2. Patient Validation

As a result of the cross-validation step, the Extra Trees classifier outperformed other classifiers (see Figure 2). The Extra Trees classifier trained with the data of 30 patients resulted in an AUC of 0.95, a sensitivity of 0.95, and a specificity of 0.80. As expected, extending the training cohort by incrementing the sample size, one patient after another, resulted in improved accuracy measures until it reached its overall maximum as the data from the 72nd subject was imported (0.98 AUC, 0.97 sensitivity, and 0.83 specificity). Figure 2 gives an overview of how different classifiers performed on the first training cohort, and Table 5 shows the mean and standard deviation of the accuracy measures along all the training steps. Based on the training data of 72 subjects and the validation cohort of 15 subjects, 125 of the 128 lesions defined by the reader as pathological were identified as pathological as well, which means a sensitivity of 0.97. Additionally, the physiological uptake was classified with high precision. While the algorithm showed accurate predictions of liver, kidneys, GUT, etc., specificity regarding salivary glands showed to be more difficult with a figure of 0.82. Especially in sublingual and lacrimal glands, there was a high rate of false positives (9/19 and 7/19). Other glands were easier to identify as physiological, resulting in a total of only 2 (submandibular gland) and 1 (parotid gland) false positives. The complete overview is presented in Table 6. As pathological prostate uptake was only present in 14 subjects from the training cohort, we could not analyze the prediction performance on the test cohort for this category. However, analyzing the 14 prostate hotspots from the training cohort, we achieved a sensitivity of 0.92 (13/14 true positives).

4. Discussion

The application of ML-based image analysis would implicate several benefits for patients. First of all, this examination is fast and non-invasive. Second of all, it could be used for therapy prediction and differentiation between low and high-risk patients [27] and for prediction of overall survival [20], as already published before. It could furthermore be the base of individual therapy and treatment tailoring in the future, combining the technique with analysis of textural parameters. Furthermore, the presented ML-based approach and the outcoming results confirm the potential of the ML methods for the analysis of newly day-to-day arriving patients’ data.
The problem with the smaller set of data was that more physiological hotspots were recognized as pathological, i.e., a high rate of false positives. Results with the bigger set of data have shown to be more specific though. However, the obtained prediction accuracies after increasing the training cohort size showed the robustness of the algorithms. In addition, it is important to note that we have a very high number of hotspots per patient (34 hotspots per patient on average). Therefore, even with a low number of patients we have, significant numbers of lesions.
As a matter of fact, overfitting is an important concern in ML studies, especially when the number of features exceeds the number of samples. In this study, we included 2452 hotspots data (n_samples = 2452) and 77 radiomics features (n_features = 77). We also applied MinMax standardization. We had already applied cross-validation in the previous study [21] to identify the best performing ML classifier and tune its hyperparameters. In this study, we applied Bootstrapping to better estimate the population statistics. To conclude, all these precautions had been made to avoid overfitting.
In this analysis, we could also identify in which locations the most problems appear in the AI algorithm. In fact, the categorization of glands proved to be difficult with a specificity of just 0.82. 19 out of 111 glands were identified as metastasis, especially sublingual (9/19) and lacrimal (7/19) glands. The reason why the ML algorithm performs poorer on glands might be caused by the fact that, from the data-driven point of view, the radiomics features of the glands seem to be in a similar range as for the pathological uptake. Therefore, this must be a topic of further improvement of the algorithm. However, this limitation of the algorithm seems to be acceptable for this feasibility study as the head is only in very far spread tumor disease, a typical location of metastases. For other organ uptakes as kidney and bladder, a specificity of 1.0 was reached. Even uptake in the GUT approached a result just as high with a specificity of 0.97. The performance of the ML classifier to classify pathological prostate uptake was also quantified as high (0.92 sensitivity). However, as no pathological uptake was annotated in the test cohort, we could not analyze it on the test step.
As the goal of the presented study was to show the feasibility and power of the lesion classification in PSMA-PET data, so far, we used manual segmentation. For fast data processing in clinical routine in future segmentation needs to be performed in an automatic or at least semi-automatic manner, e.g., as described for bone lesions in [28]. However, this topic was beyond the scope of this study, and as no satisfying algorithms for total lesion segmentation in PSMA-PET are available, we decided for a manual segmentation not to alter our results by problems with a not fully validated segmentation process. Even as manual segmentation shows several problems, e.g., interobserver variability, it is widely accepted in this context [19,29].
As one of the limitations of the current study, the gold standard, which is in our case, the human-experienced nuclear medicine physician, should be discussed. For the detection of pathological uptake, naturally, histopathology findings should be preferred. However, we had nearly 2500 hotspots in our training cohort of 72 patients, meaning nearly 35 hotspots per patient, including physiological uptake. Therefore, there is no option and justification for performing such a high number of biopsies. This is a general limitation of this kind of study.
Another general limitation that needs to be taken into account is that the whole study was performed on data of the same scanner. Although this was not part of the current study, in further steps, it should be analyzed how specific training and results are according to changes in scan devices or scan protocols. Such questions should be dealt with best in multicentric studies.
For further studies in ML analysis of medical image data, prostate cancer seems to be an ideal subject having a high and increasing prevalence. It should be easy to acquire “big data” and so to train, develop, and improve the algorithm. In the end, a large group of people would benefit from this study.

5. Conclusions

Computer-aided decision support systems analyzing radiomics features from pre-therapeutic 68Ga-PSMA-PET-CT scans and leveraging state-of-the-art supervised machine learning methods have shown their significance to identify pathological uptake in patients with advanced prostate carcinoma even on unseen data. Further improvement, however, should be done in the identification of small glands and in cross-validation of different PET scanners and perhaps other centers to overcome limitations of interobserver variability and problems due to scan specifications.

Author Contributions

A.E.: Study concept, patient analysis, and writing the manuscript. S.M.: Study concept, data analysis and algorithm coding, and writing the manuscript. S.L.: Patient analysis and correcting the manuscript. M.E.: Study concept and correcting the manuscript. T.S.: Study concept, data analysis, and correcting the manuscript. R.A.B.: Study concept, lesion delineation, and correcting the manuscript. All authors have read and agreed to the published version of the manuscript.

Funding

This research received no external funding.

Institutional Review Board Statement

The study was conducted in accordance with the Declaration of Helsinki. All patients gave written and informed consent to the imaging procedure and for anonymized evaluation and publication of their data. Due to the retrospective character of the data analysis, an ethical statement was waived by the institutional ethical review board according to the professional regulations of the medical board of the state of Nordrhein-Westfalen, Germany.

Informed Consent Statement

Informed consent was obtained from all subjects involved in the study.

Data Availability Statement

The data are not publicly available because, according to German “Datenschutz Grundverordnung 2016/679”, patient data including images or part of images can only be used/seen within the hospital and by personnel of these hospitals if the patient has not agreed specifically to publish it. As this is a retrospective analysis, we have no agreement of the patients that we can make the data available openly, just that the data can be evaluated for studies.

Conflicts of Interest

R.A.B. is a Consultant for Bayer Healthcare (Leverkusen, Germany) and Eisai GmbH (Frankfurt, Germany). R.A.B. has a non-commercial research agreement and is on the speakers list with Mediso Medical Imaging (Budapest, Hungary). M.E. is a Consultant for Bayer Healthcare (Leverkusen, Germany) and Eisai GmbH (Frankfurt, Germany), IPSEN and Novartis. All other authors declare that there are no conflict of interest as well as consent for scientific analysis and publication.

Abbreviations

PCprostate cancer
PSMAprostate specific membrane antigen
PSAprostate specific antigen
PETpositron emission tomography
CTcomputed tomography
RFsradiomics features
MLmachine learning
AIartificial intelligence
AUCarea under the curve
SEsensitivity
SPspecificity
VoIvolume of interest
gutgastrointestinal tract

References

  1. Bray, F.; Ferlay, J.; Soerjomataram, I.; Siegel, R.L.; Torre, L.A.; Jemal, A. Global cancer statistics 2018: GLOBOCAN estimates of incidence and mortality worldwide for 36 cancers in 185 countries. CA Cancer J. Clin. 2018, 68, 394–424. [Google Scholar] [CrossRef] [PubMed] [Green Version]
  2. Ferlay, J.; Lam, F.; Colombet, M.; Mery, L.; Pineros, M.; Znaor, A.; Soerjomataram, I. Global Cancer Observatory: Cancer Today; International Agency for Research on Cancer: Lyon, France, 2021. [Google Scholar]
  3. Official Website of National Cancer Institute. Cancer Stat Facts: Prostate Cancer. 2019. Available online: https://seer.cancer.gov/statfacts/html/prost.html (accessed on 12 April 2021).
  4. Schwarzenboeck, S.M.; Rauscher, I.; Bluemel, C.; Fendler, W.P.; Rowe, S.P.; Pomper, M.G.; Afshar-Oromieh, A.; Herrmann, K.; Eiber, M. PSMA Ligands for PET Imaging of Prostate Cancer. J. Nucl. Med. 2017, 58, 1545–1552. [Google Scholar] [CrossRef] [PubMed] [Green Version]
  5. Wright, G.L.; Haley, C.; Beckett, M.L.; Schellhammer, P.F. Expression of prostate-specific membrane antigen in normal, benign, and malignant prostate tissues. Urol. Oncol. 1995, 1, 18–28. [Google Scholar] [CrossRef]
  6. Szabo, Z.; Mena, E.; Rowe, S.P.; Plyku, D.; Nidal, R.; Eisenberger, M.A.; Antonarakis, E.S.; Fan, H.; Dannals, R.F.; Chen, Y.; et al. Initial Evaluation of (18)FDCFPyL for Prostate-Specific Membrane Antigen (PSMA)-Targeted PET Imaging of Prostate Cancer. Mol. Imaging Biol. 2015, 17, 565–574. [Google Scholar] [CrossRef]
  7. Afshar-Oromieh, A.; Hetzheim, H.; Kratochwil, C.; Benesova, M.; Eder, M.; Neels, O.C.; Eisenhut, M.; Kübler, W.; Holland-Letz, T.; Giesel, F.L.; et al. The Theranostic PSMA Ligand PSMA-617 in the Diagnosis of Prostate Cancer by PET/CT: Biodistribution in Humans, Radiation Dosimetry, and First Evaluation of Tumor Lesions. J. Nucl. Med. 2015, 56, 1697–1705. [Google Scholar] [CrossRef] [PubMed] [Green Version]
  8. Fendler, W.P.; Calais, J.; Eiber, M.; Flavell, R.R.; Mishoe, A.; Feng, F.Y.; Nguyen, H.G.; Reiter, R.E.; Rettig, M.B.; Okamoto, S.; et al. Assessment of 68Ga-PSMA-11 PET Accuracy in Localizing Recurrent Prostate Cancer: A Prospective Single-Arm Clinical Trial. JAMA Oncol. 2019, 5, 856–863. [Google Scholar] [CrossRef] [Green Version]
  9. Rauscher, I.; Maurer, T.; Fendler, W.P.; Sommer, W.H.; Schwaiger, M.; Eiber, M. (68)Ga-PSMA ligand PET/CT in patients with prostate cancer: How we review and report. Cancer Imaging 2016, 16, 14. [Google Scholar] [CrossRef] [Green Version]
  10. Strack, C.; Seifert, R.; Kleesiek, J. Künstliche Intelligenz in der Hybridbildgebung. Radiologe 2020, 60, 405–412. [Google Scholar] [CrossRef]
  11. Sollini, M.; Bartoli, F.; Marciano, A. Artificial intelligence and hybrid imaging: The best match for personalized medicine in oncology. Eur. J. Hybrid. Imaging 2020, 4, 24. [Google Scholar] [CrossRef]
  12. Mayer-Schnberger, V.; Cukier, K. Big Data: A Revolution That Will Transform How We Live, Work and Think; John Murray Publishers: London, UK, 2014. [Google Scholar]
  13. Goldenberg, S.L.; Nir, G.; Salcudean, S.E. A new era: Artificial intelligence and machine learning in prostate cancer. Nat. Rev. Urol. 2019, 16, 391–403. [Google Scholar] [CrossRef] [PubMed]
  14. Hambarde, P.; Talbar, S.; Mahajan, A.; Chavan, S.; Thakur, M.; Sable, N. Prostate lesion segmentation in MR images using radiomics based deeply supervised U-Net. Biocybern. Biomed. Eng. 2020, 40, 1421–1435. [Google Scholar] [CrossRef]
  15. Thrall, J.H.; Li, X.; Li, Q.; Cruz, C.; Do, S.; Dreyer, K.; Brink, J. Artificial Intelligence and Machine Learning in Radiology: Opportunities, Challenges, Pitfalls, and Criteria for Success. J. Am. Coll. Radiol. 2018, 15, 504–508. [Google Scholar] [CrossRef]
  16. Bundschuh, R.A.; Dinges, J.; Neumann, L.; Seyfried, M.; Zsótér, N.; Papp, L.; Rosenberg, R.; Becker, K.; Astner, S.T.; Henninger, M.; et al. Textural Parameters of Tumor Heterogeneity in ¹⁸F-FDG PET/CT for Therapy Response Assessment and Prognosis in Patients with Locally Advanced Rectal Cancer. J. Nucl. Med. 2014, 55, 891–897. [Google Scholar] [CrossRef] [PubMed] [Green Version]
  17. Chicklore, S.; Goh, V.; Siddique, M.; Roy, A.; Marsden, P.K.; Cook, G.J.R. Quantifying tumour heterogeneity in 18F-FDG PET/CT imaging by texture analysis. Eur. J. Nucl. Med. Mol. Imaging 2013, 40, 133–140. [Google Scholar] [CrossRef] [PubMed]
  18. Pyka, T.; Bundschuh, R.A.; Andratschke, N.; Mayer, B.; Specht, H.M.; Papp, L.; Zsótér, N.; Essler, M. Textural features in pre-treatment F18-FDG-PET/CT are correlated with risk of local recurrence and disease-specific survival in early stage NSCLC patients receiving primary stereotactic radiation therapy. Radiat. Oncol. 2015, 10, 100. [Google Scholar] [CrossRef] [PubMed] [Green Version]
  19. Khurshid, Z.; Ahmadzadehfar, H.; Gaertner, F.C.; Papp, L.; Zsóter, N.; Essler, M.; Bundschuh, R.A. Role of textural heterogeneity parameters in patient selection for 177Lu-PSMA therapy via response prediction. Oncotarget 2018, 9, 33312–33321. [Google Scholar] [CrossRef] [Green Version]
  20. Moazemi, S.; Erle, A.; Lütje, S.; Gaertner, F.C.; Essler, M.; Bundschuh, R.A. Estimating the Potential of Radiomics Features and Radiomics Signature from Pretherapeutic PSMA-PET-CT Scans and Clinical Data for Prediction of Overall Survival When Treated with 177Lu-PSMA. Diagnostics 2021, 11, 186. [Google Scholar] [CrossRef]
  21. Moazemi, S.; Khurshid, Z.; Erle, A.; Lütje, S.; Essler, M.; Schultz, T.; Bundschuh, R.A. Machine Learning Facilitates Hotspot Classification in PSMA-PET/CT with Nuclear Medicine Specialist Accuracy. Diagnostics 2020, 10, 622. [Google Scholar] [CrossRef]
  22. Official Company Website for the InterView FUSION: Software. Available online: https://www.mediso.de/Interview-fusion.html (accessed on 12 April 2021).
  23. Kotsiantis, S.B. Supervised Machine Learning: A Review of Classification Techniques. Informatica 2007, 31, 249–268. [Google Scholar]
  24. Pedregosa, F.; Varoquaux, G.; Gramfort, A.; Michel, V.; Thirion, B.; Grisel, O. Scikit-learn: Machine learning in Python. J. Mach. Learn. Res. 2011, 12, 2825–2830. [Google Scholar]
  25. Simm, J.; de Abril, I.; Sugiyama, M. Tree-Based Ensemble Multi-Task Learning Method for Classification and Regression. Peer Rev. 2014, E97-D, 1677–1681. [Google Scholar] [CrossRef] [Green Version]
  26. Quinlan, J. Induction of Decision Trees. Mach. Learn. 1986, 1, 81–106. [Google Scholar] [CrossRef] [Green Version]
  27. Moazemi, S.; Erle, A.; Khurshid, Z.; Lütje, S.; Muders, M.; Essler, M.; Schultz, T.; Bundschuh, R.A. Decision support for treatment with 177Lu-PSMA: Machine learning predicts response with high accuracy based on PSMA-PET/CT and clinical parameters. Ann. Transl. Med. 2021, 9, 818. [Google Scholar] [CrossRef]
  28. Hammes, J.; Täger, P.; Drzezga, A. EBONI: A Tool for Automated Quantification of Bone Metastasis Load in PSMA PET/CT. J. Nucl. Med. 2018, 59, 1070–1075. [Google Scholar] [CrossRef] [PubMed]
  29. Thuillier, P.; Liberini, V.; Rampado, O.; Gallio, E.; De Santi, B.; Ceci, F.; Metovic, J.; Papotti, M.; Volante, M.; Molinari, F.; et al. Diagnostic Value of Conventional PET Parameters and Radiomic Features Extracted from 18F-FDG-PET/CT for Histologic Subtype Classification and Characterization of Lung Neuroendocrine Neoplasms. Biomedicines 2021, 9, 281. [Google Scholar] [CrossRef] [PubMed]
Figure 1. A sample screenshot from the hotspots’ delineation step using InterView Fusion Software (Mediso, Budapest, Hungary) [22]. The hotspots are identified and delineated slice by slice as 3D volumes of interests (VoIs) by an experienced nuclear medicine physician (the hotspot names translation from German: Niere = kidney, Darm = gut. Moreover, Met stands for metastasis).
Tomography 07 00027 g001
Figure 2. The receiver operating characteristic (ROC) curves to compare three classifiers. The classifiers are ranked after tuning in the cross-validation step and trained with the first training cohort with 30 subjects and then applied to the test cohort.
Tomography 07 00027 g002
Table 1. The age, Gleason score, and PSA level ranges for the patients in the training and test cohorts.
ParameterTraining GroupTest Cohort
NameAverageMinMaxAverageMinMax
Age714887776387
Gleason Score86108610
PSA (ng/mL)438.724.735910.0660.621.25400.0
Table 2. A list of the radiomics features from both positron emission tomography (PET) and computed tomography (CT) modalities. Please note that the metabolic tumor volume (MTV) is PET-specific. This table is already published in [20].
First or Higher Order StatisticsShape and SizeTexturalVolumetric Zone Length StatisticsVolumetric Run Length Statistics
DeviationMax. DiameterEntropyShort Zone EmphasisShort Run Emphasis
Mean HomogeneityLong Zone EmphasisLong Run Emphasis
Max CorrelationLow Grey-Level Zone EmphasisLow Grey-Level Run Emphasis
Min ContrastHigh Grey-Level Zone EmphasisHigh Grey-Level Run Emphasis
Sum Size VariationShort Zone Low Grey-Level EmphasisShort Run Low Grey-Level Emphasis
PET-MTV Intensity VariationShort Zone High Grey-Level EmphasisShort Run High Grey-Level Emphasis
Kurtosis CoarsenessLong Zone Low Grey-Level EmphasisLong Run Low Grey-Level Emphasis
BusynessLong Zone High Grey-Level EmphasisLong Run High Grey-Level Emphasis
ComplexityZone PercentageGrey-Level Non-Uniformity Run Length Non-Uniformity
Run Percentage
Table 3. The distribution of hotspots throughout the training cohort subjects.
Patient IDMetastasisBladderGutKidneyUreterParotid GlandLacrimal GlandSub-Mandibular GlandSub-Lingual GlandProstateLiverOther
11111222200112
22611200122100
32101200220010
42500222001000
51512202021014
62801221220110
73011220200010
82011202121110
91601222101013
102501210100012
111112222221100
121910211010111
132511202210111
143401222001010
151111200021010
163511222010110
171812212220010
181711220101116
19701222002100
202711220220115
211411200021000
222211112202110
231800210200010
241902222200011
253101221122110
261211202201011
272900220200010
284300202001000
291312212002010
302911221200110
311311222220010
322411202222000
332411202222000
342210202222000
351312202221010
363011202220000
373011222220000
381511202221000
392111222221010
402511202200010
411012202222000
422010202220000
432311202220010
443611202221010
451111202221002
463411222220000
471911202220010
481511222222000
49711222222001
502811222220010
511011202222001
522611102222000
531411202220010
542311222222002
553111232222000
561211202222000
572711202222000
584511202221010
591011202222000
602611204222000
612011212222011
622911202120000
632911202222000
642613202222010
652011202222010
661901202221010
674711212220000
681612202021000
692512002222000
702101202222000
714211202220010
723111202222000
total162058761405712211510771143933
Table 4. The distribution of the hotspots over different body organs in the training and test cohorts. (* the others category refers to the rest of organs in which hotspots were located).
Hotspot CategoryTraining Cohort 72 PatientsTest Cohort 15 Patients
Metastases1620128
Bladder5813
Kidney14030
Salivary Gland415111
Prostate14-
gut7633
liver3915
ureter571
Others *33-
Total of hotspots2452331
Table 5. The mean and standard deviation (std) values of the area under the curves (AUCs), sensitivities, and specificities achieved as the training cohort was extended.
Accuracy MetricMeanStd
AUC0.980.002
Sensitivity0.970.004
Specificity0.820.02
Table 6. The results of the predictions on the test cohort. (GUT: gastrointestinal tract).
Category1/Pathological0/PhysiologicalTotalSpecificity
bladder013131.00
glands19921110.82
GUT132330.97
liver015151.00
kidney030301.00
ureter0111.00
metastases12531280.97
Publisher’s Note: MDPI stays neutral with regard to jurisdictional claims in published maps and institutional affiliations.

