Harmonizing Newborn Screening Laboratory Proficiency Test Results Using the CDC NSQAP Reference Materials

 , ,
, , 

Abstract
:1. Introduction
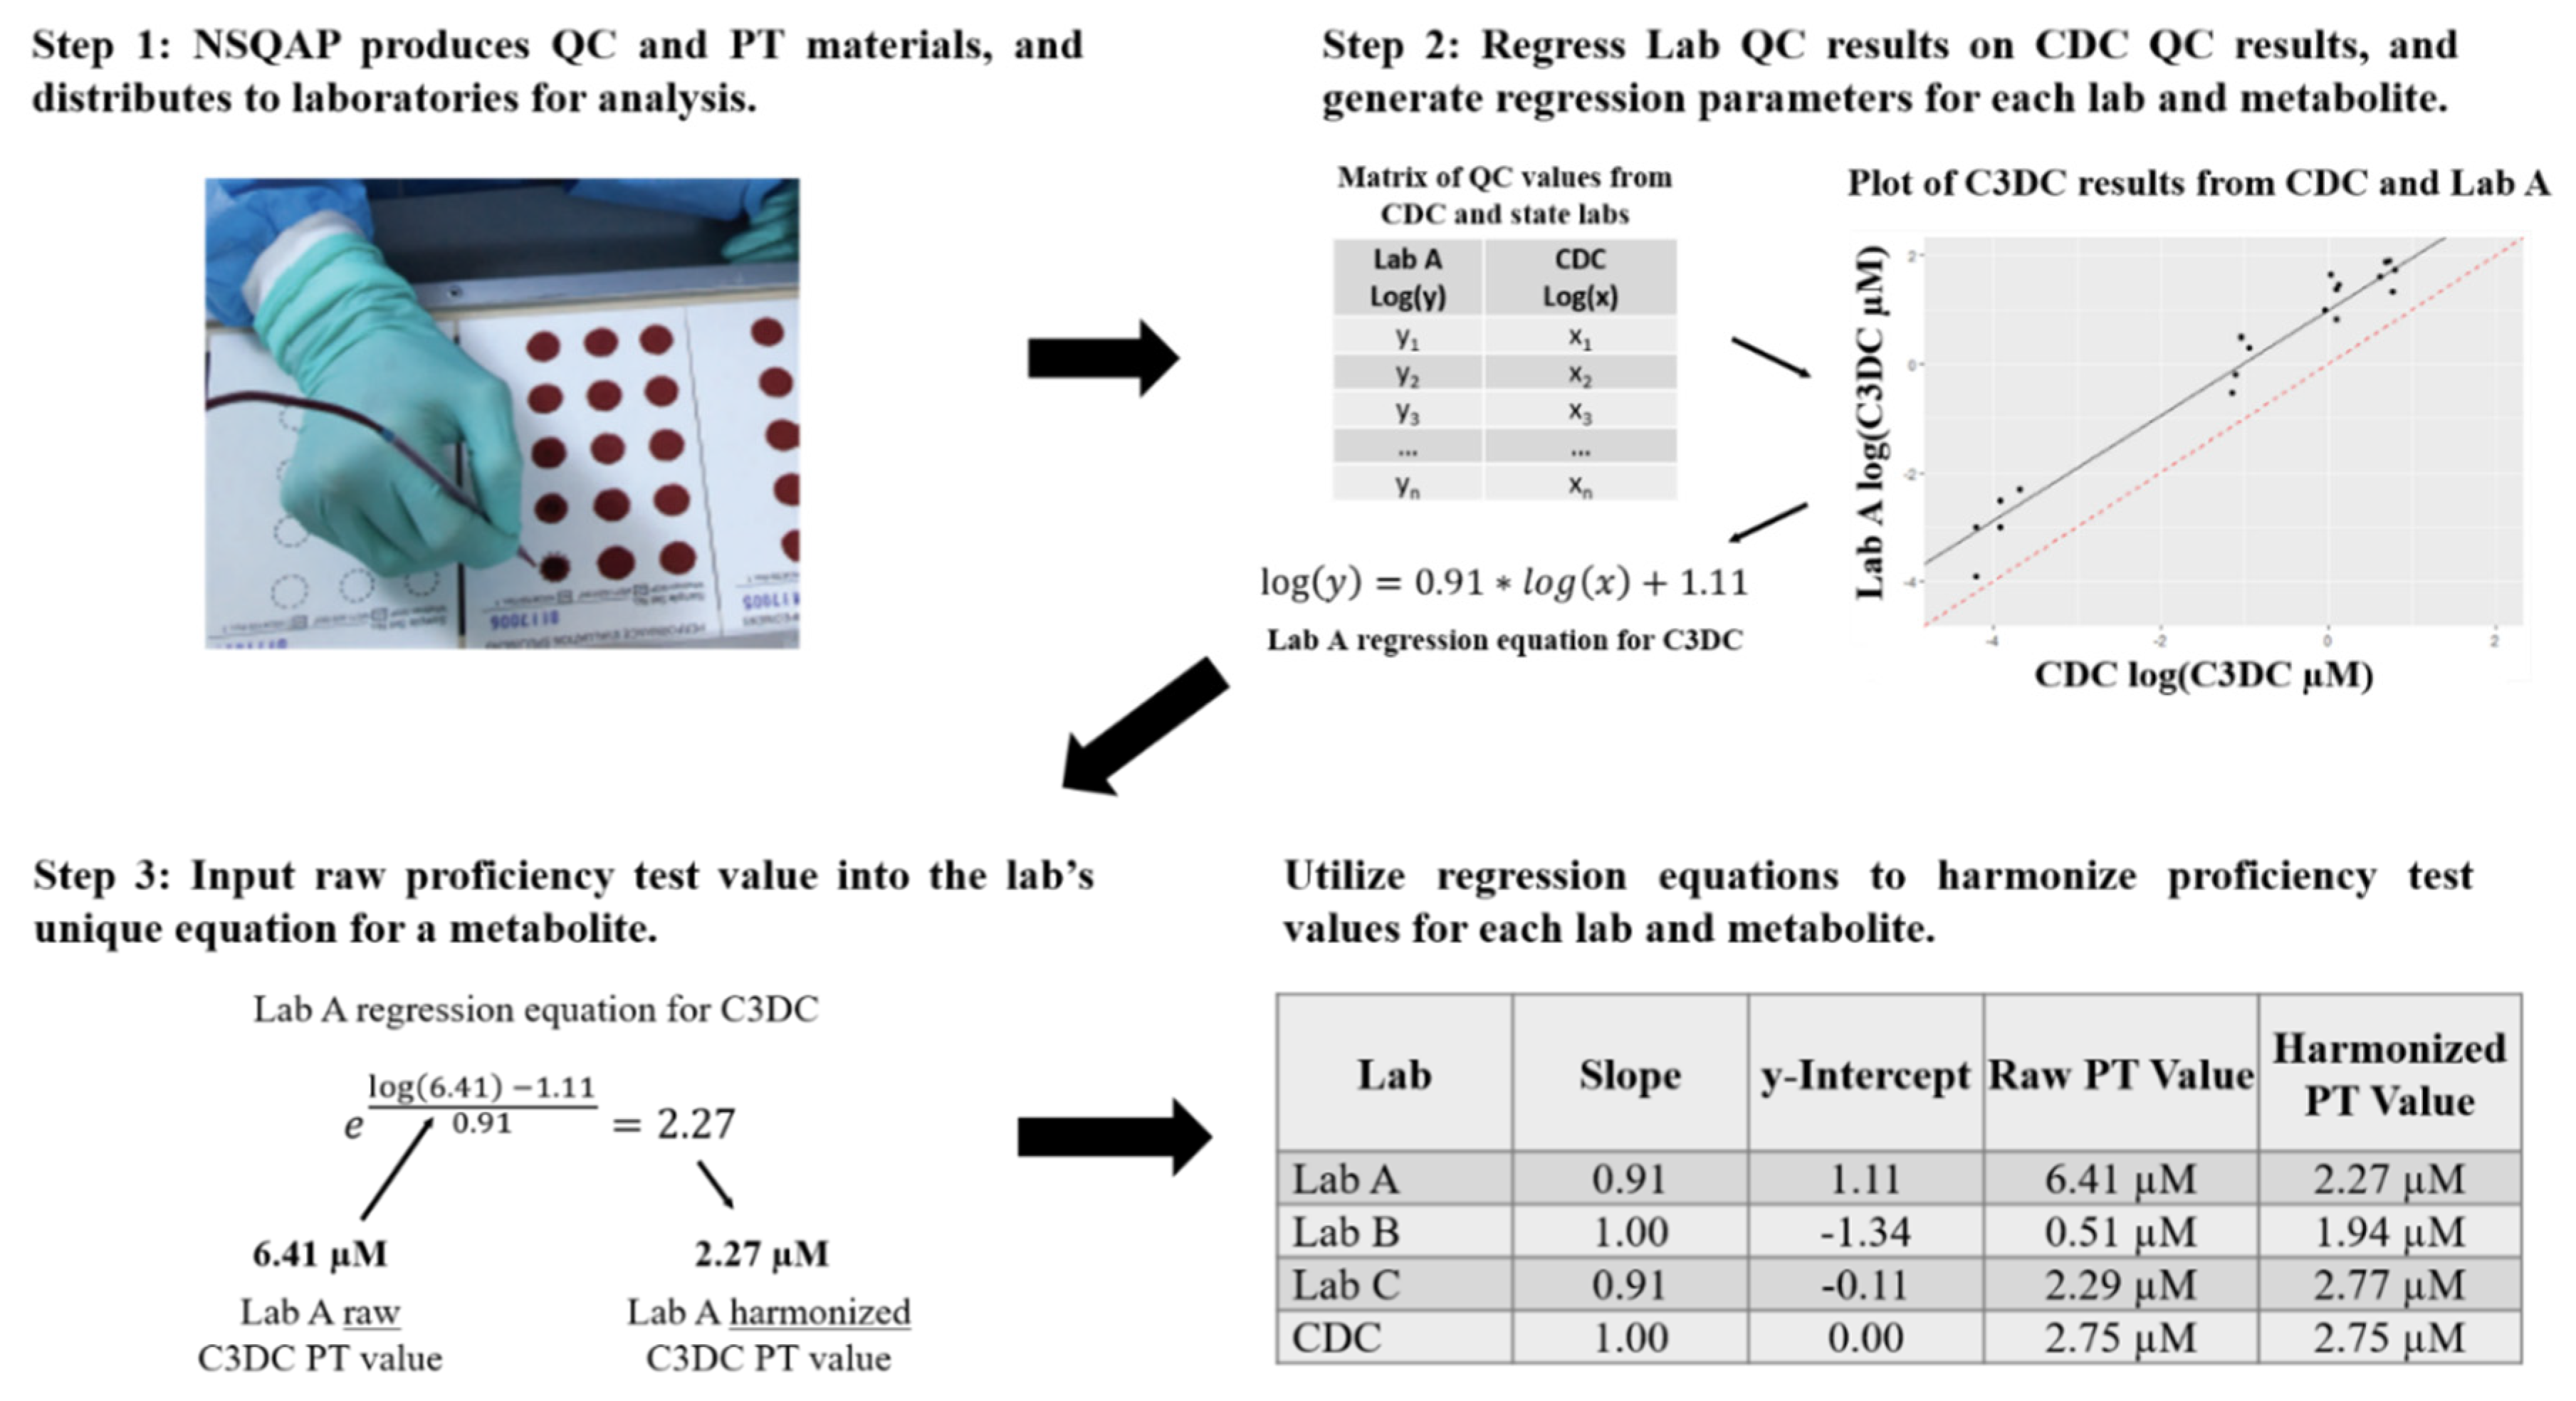
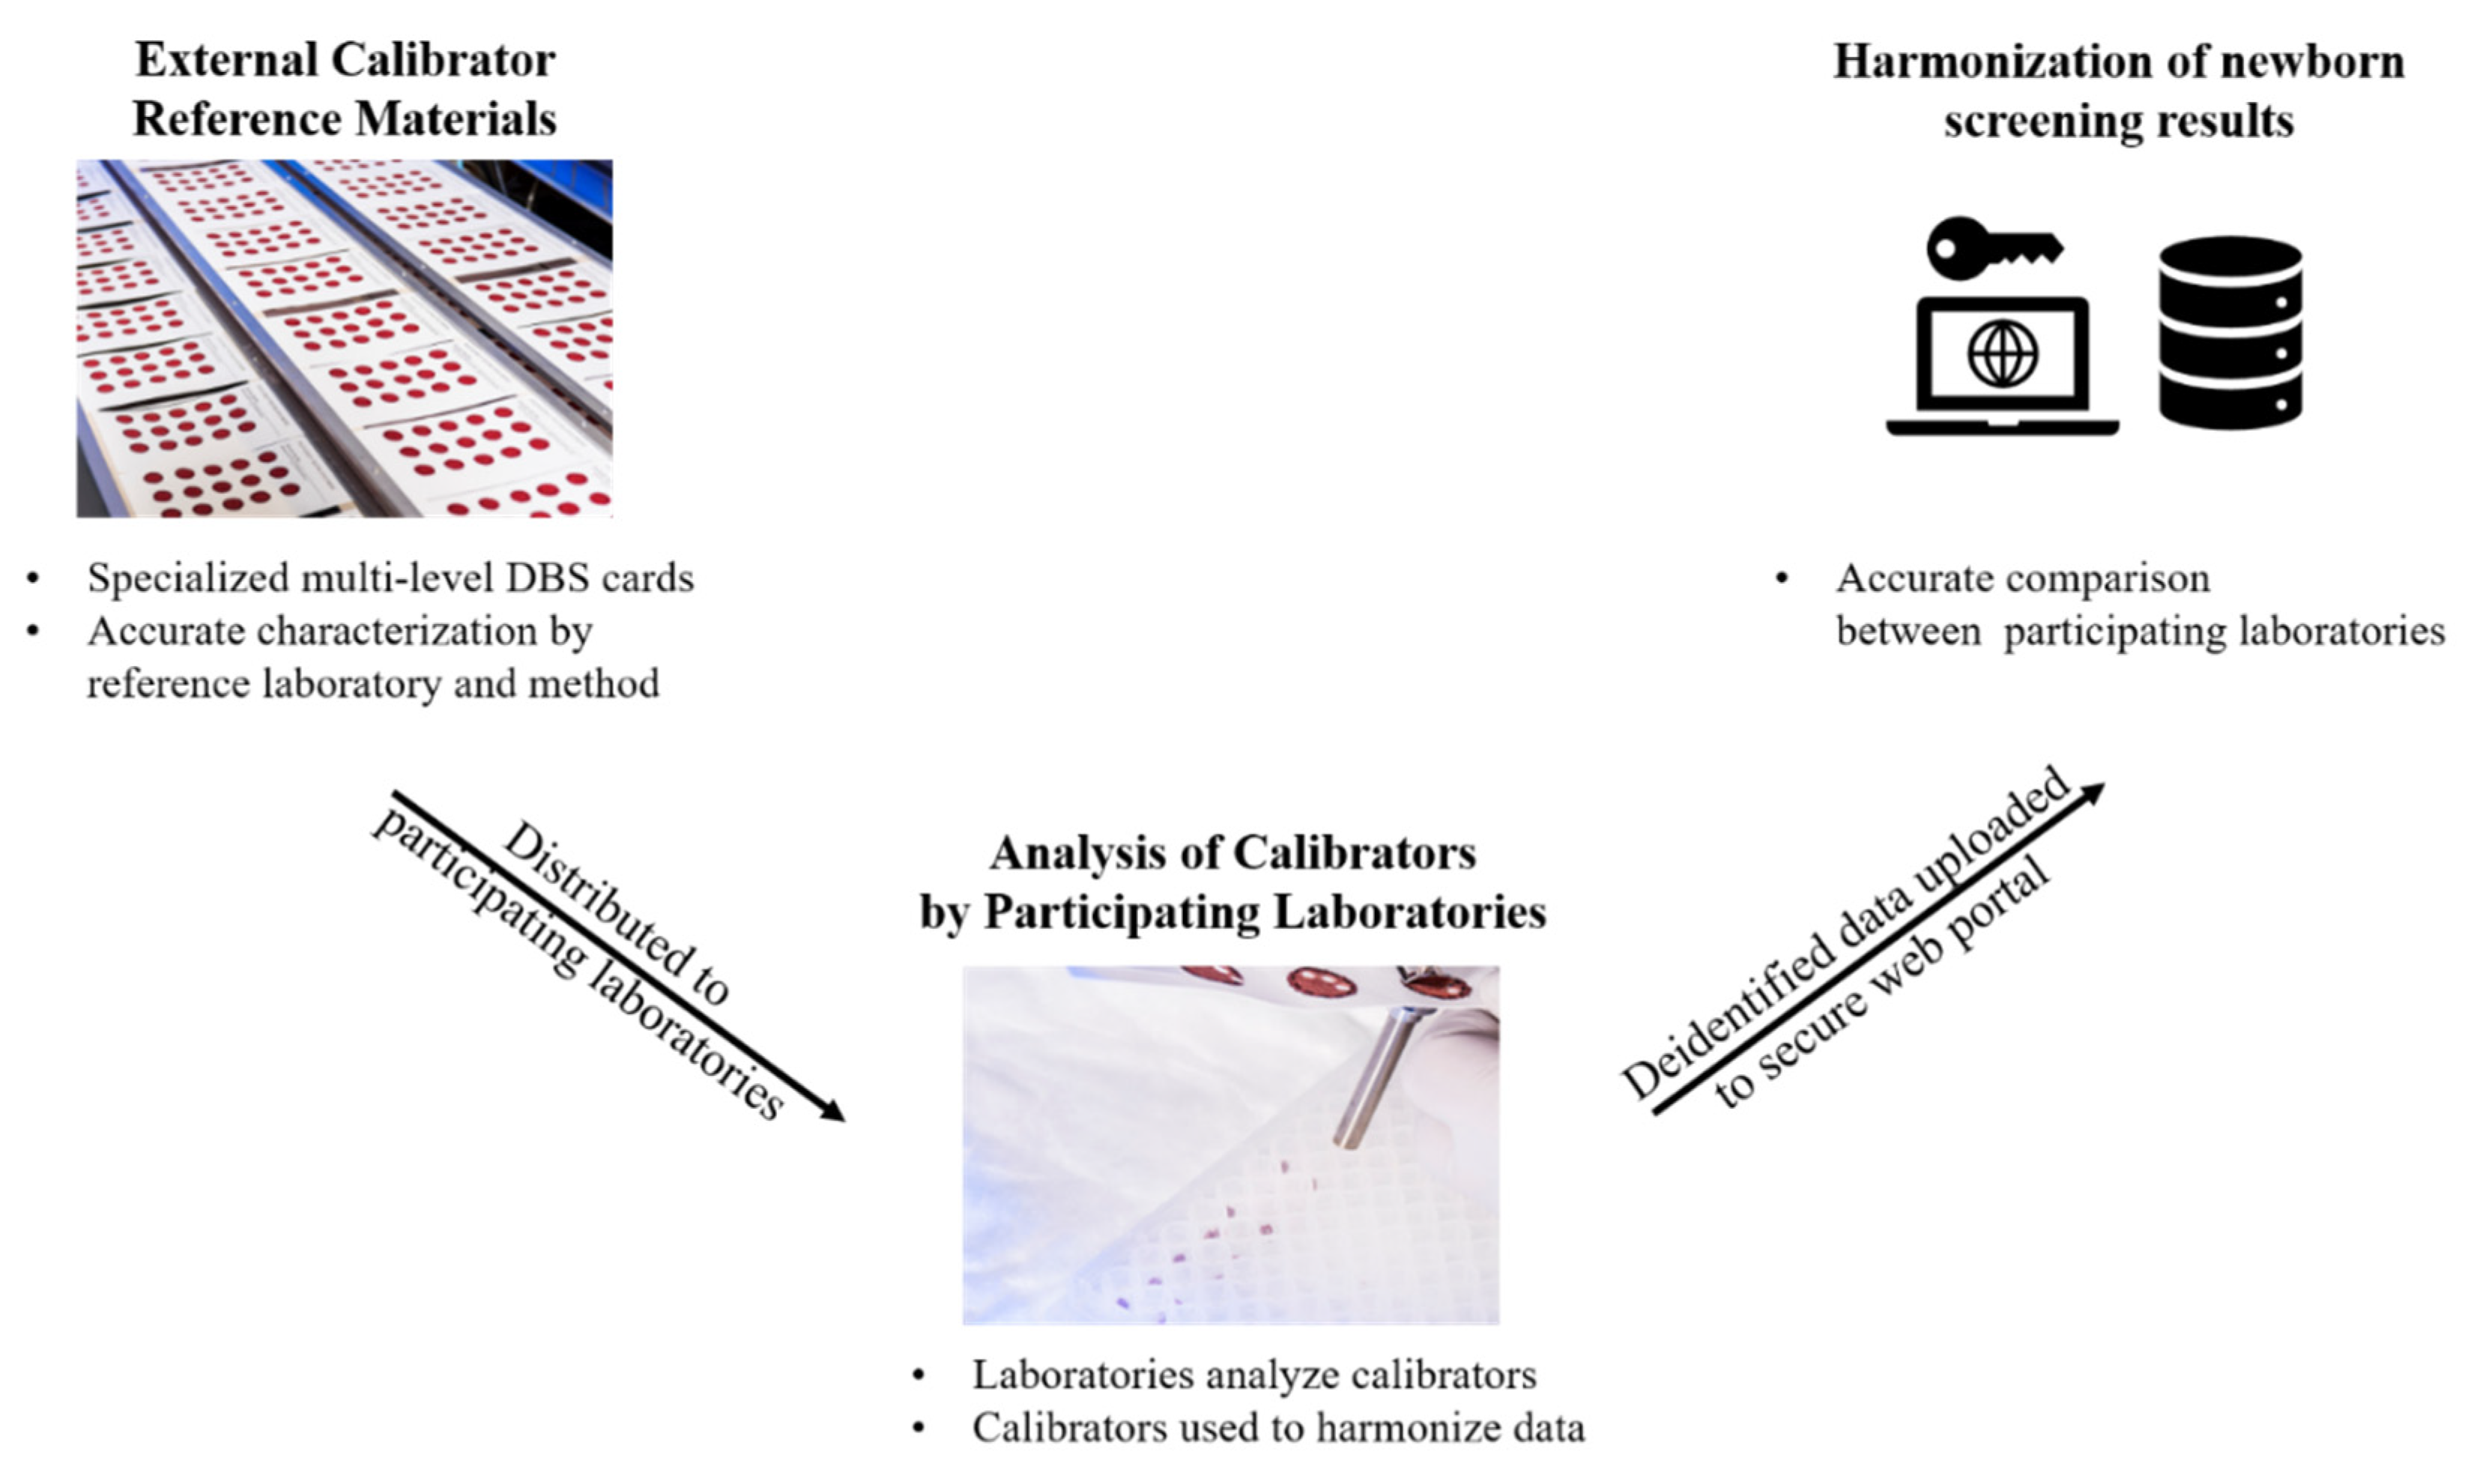
2. Methods
3. Results
3.1. Metabolite and Specimen Descriptive Statistics
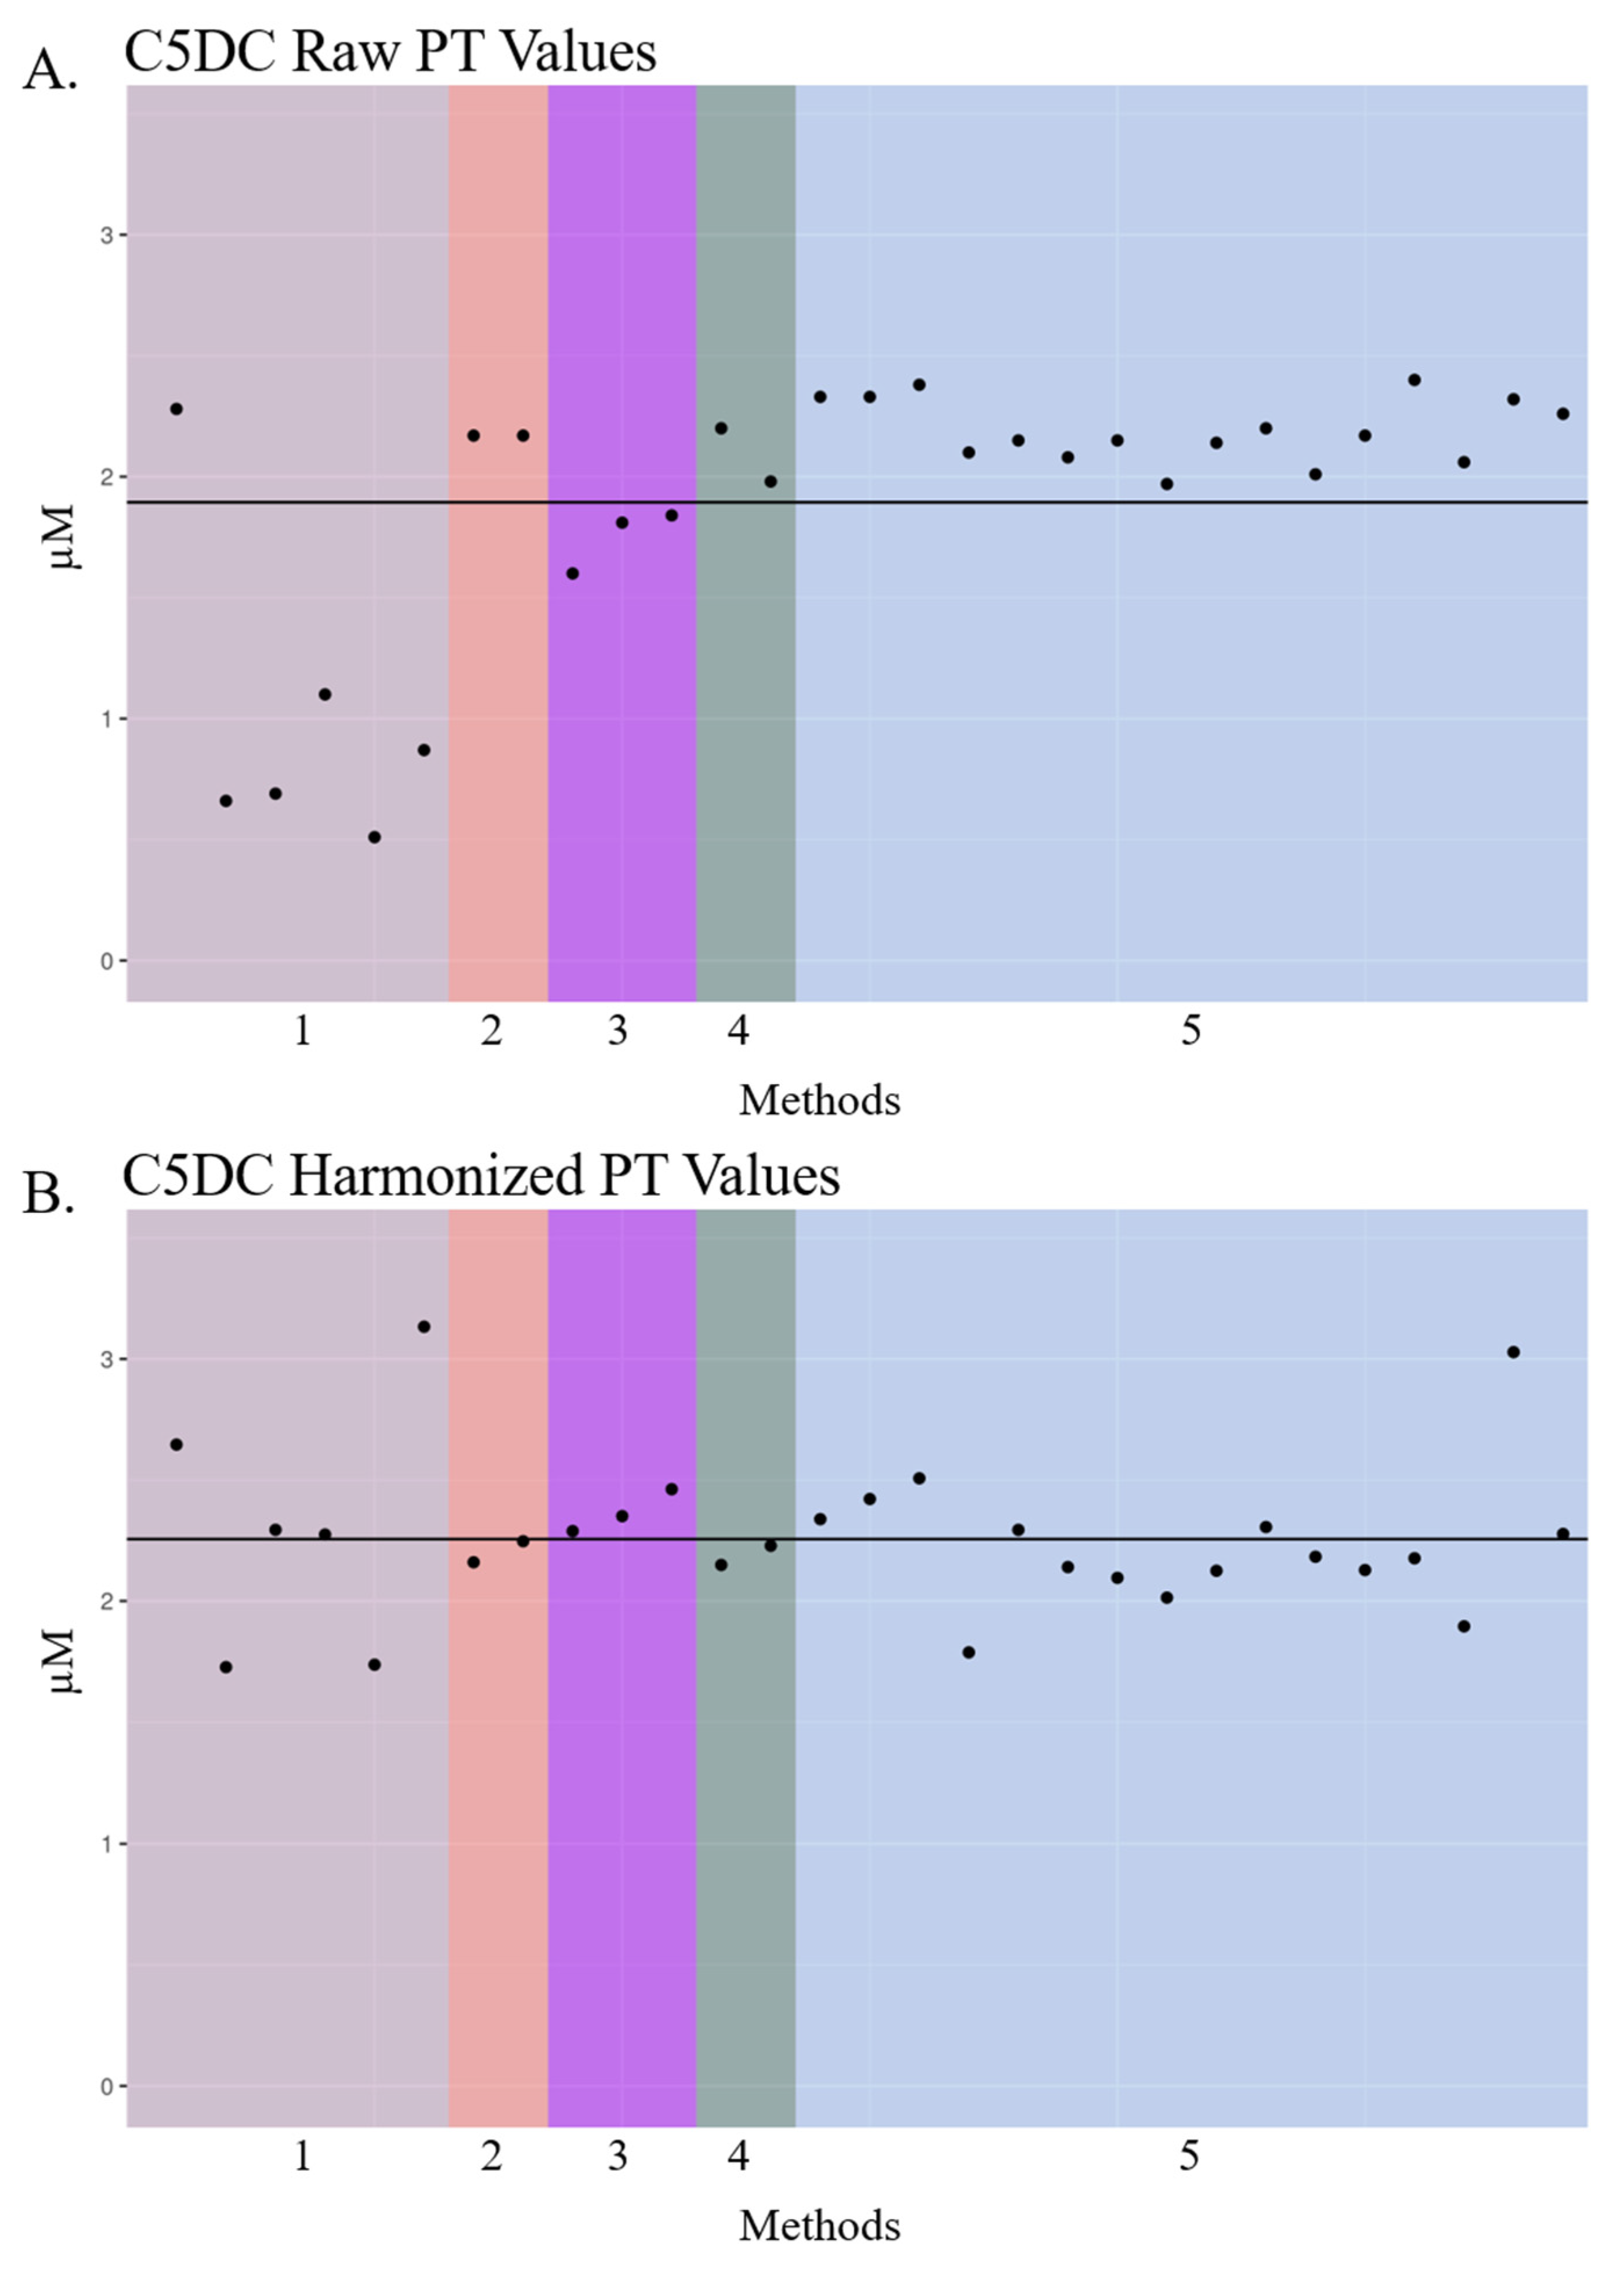
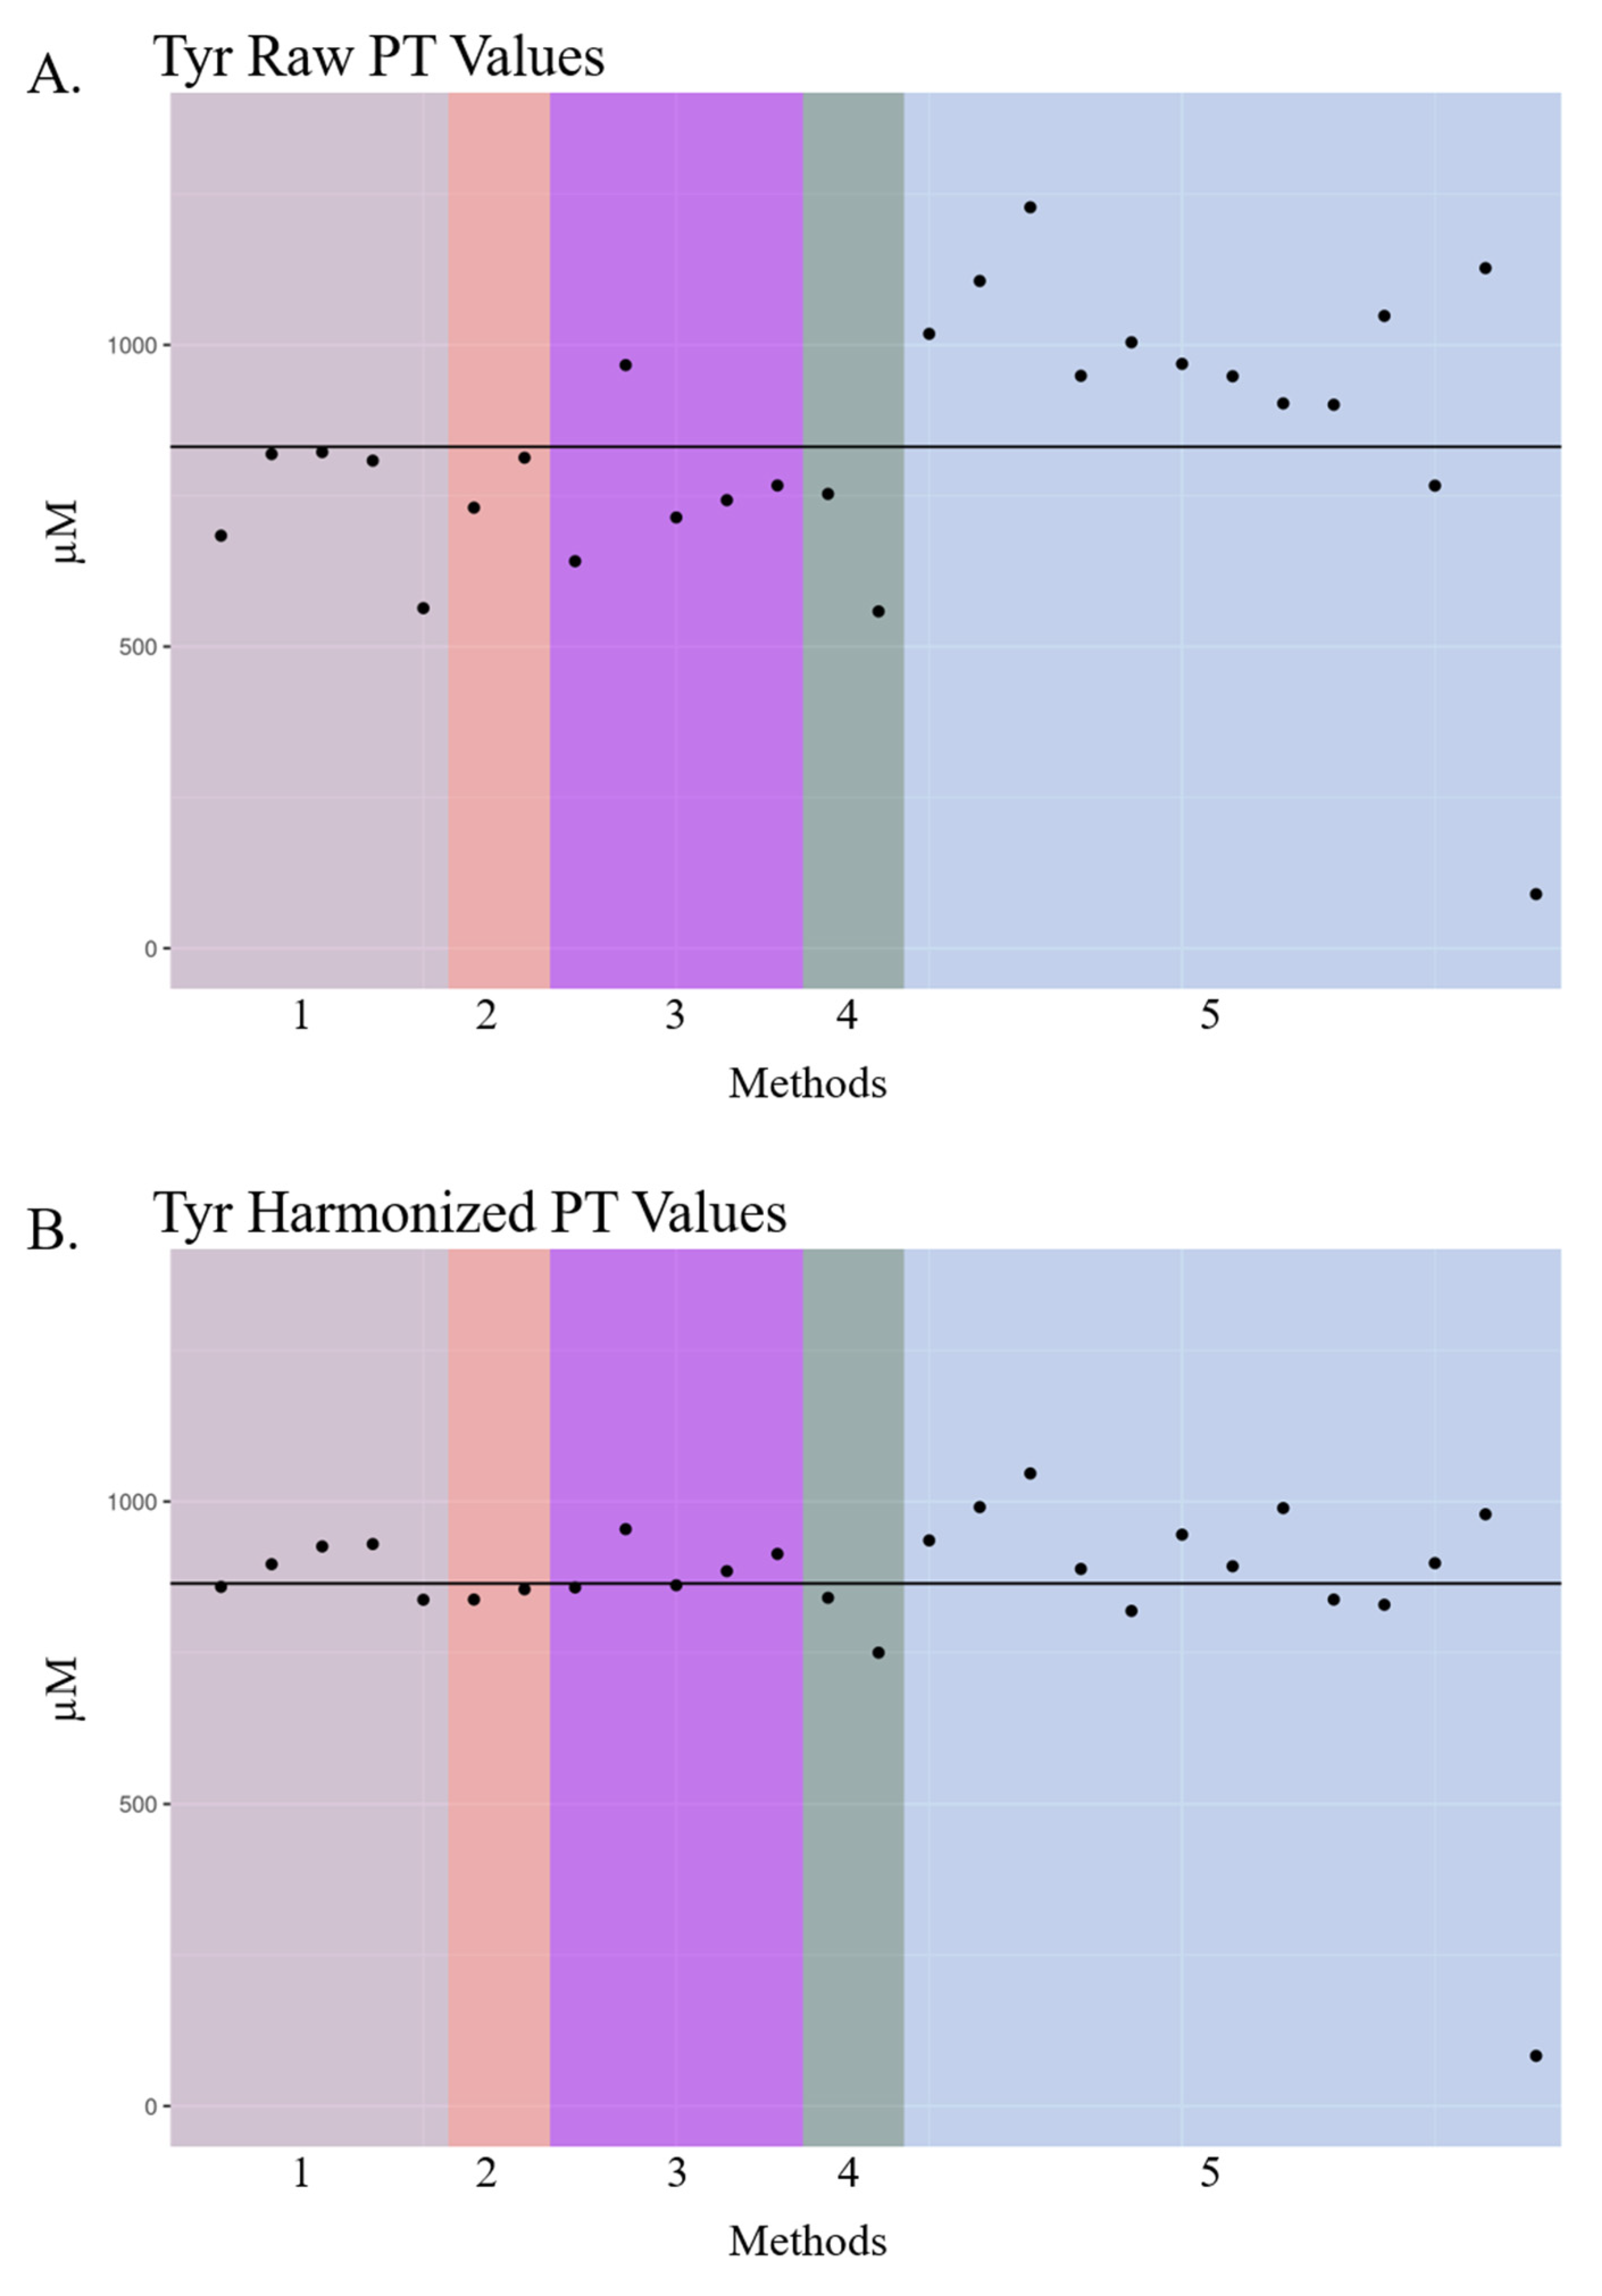
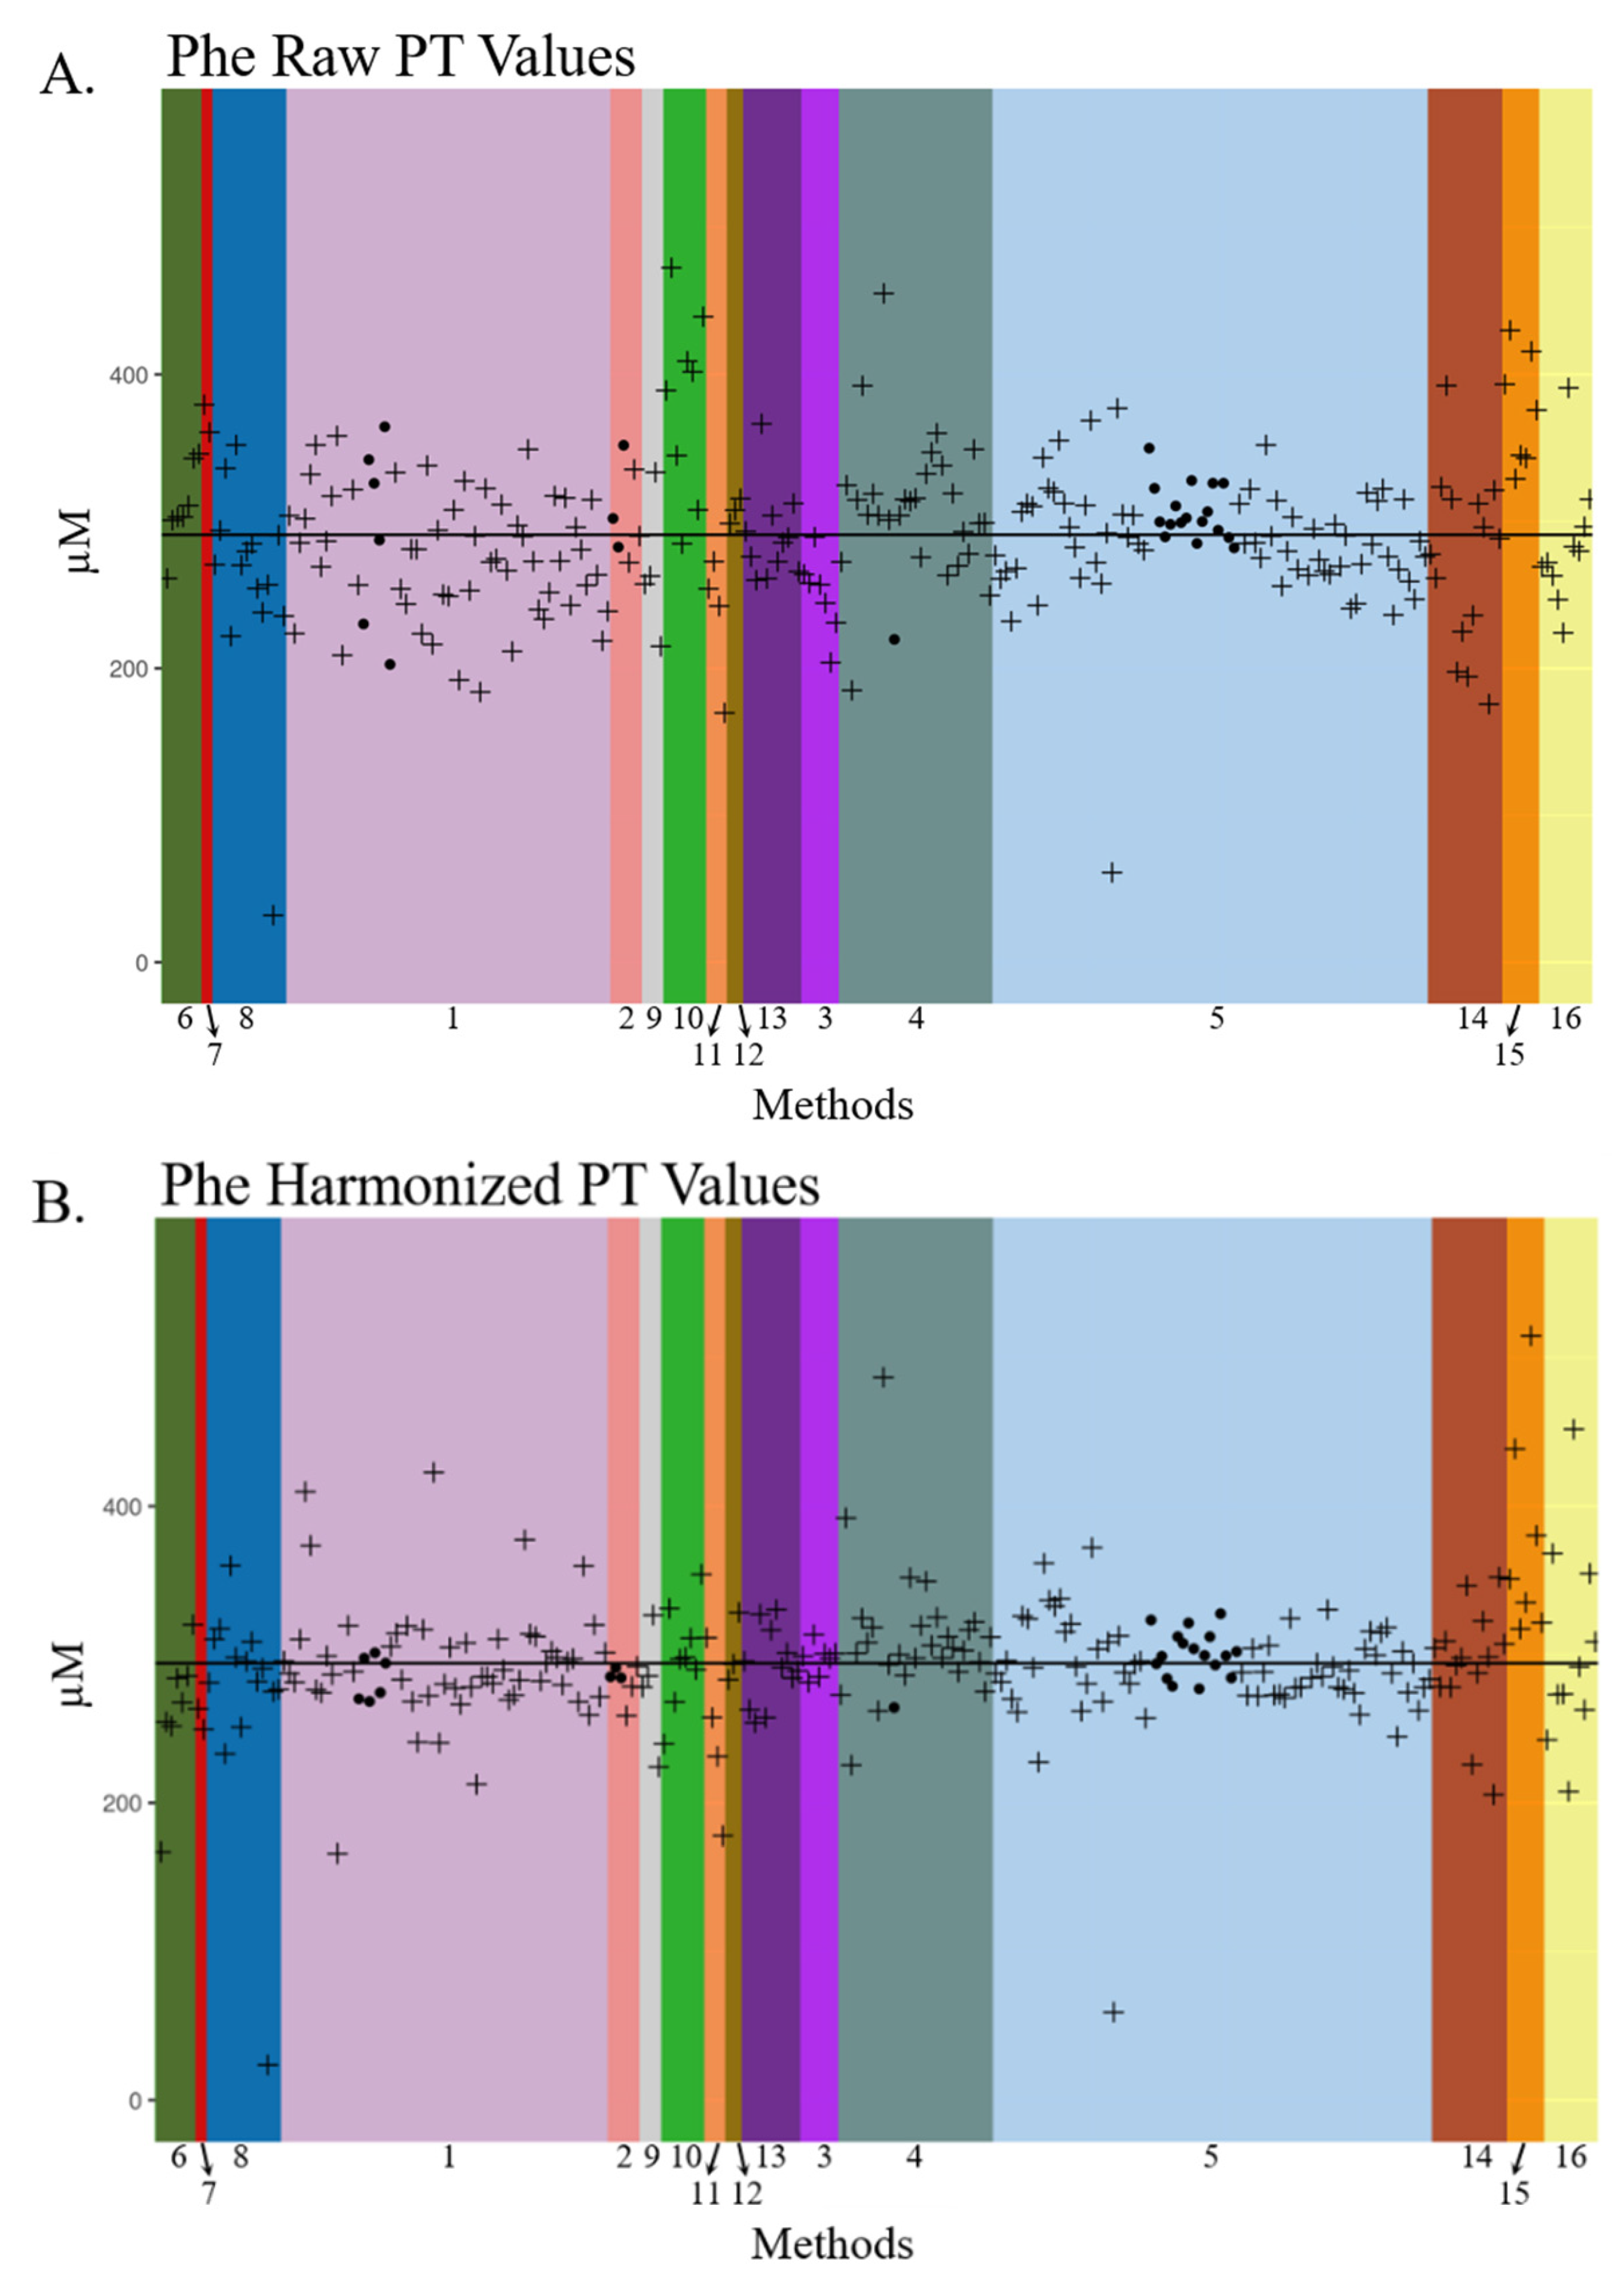
3.2. Visualization of Raw and Harmonized Proficiency Values
3.3. Study Limitations
3.4. Harmonization of Newborn Screening Data in the Future
4. Conclusions
Supplementary Materials
Author Contributions
Funding
Acknowledgments
Conflicts of Interest
Abbreviations
| C3 | Propionylcarnitine |
| C4OH | Hydroxybutyrylcarnitine |
| C5DC | Glutarylcarnitine |
| C8 | Octanoylcarnitine |
| C16 | Palmitoylcarnitine |
| C18 | Stearoylcarnitine |
| CDC | The Centers for Disease Control and Prevention |
| DBS | Dried blood spot |
| FIA | Flow injection analysis |
| IEM | Inborn errors of metabolism |
| LDT | Laboratory developed test |
| MS/MS | Tandem mass spectrometry |
| NBS | Newborn screening |
| NSQAP | Newborn Screening Quality Assurance Program |
| Phe | Phenylalanine |
| PT | Proficiency testing |
| QA | Quality assurance |
| QC | Quality control |
| SUAC | Succinylacetone |
| Tyr | Tyrosine |
References
- De Jesús, V.R.; Chace, D.H.; Lim, T.H.; Mei, J.V.; Hannon, W.H. Comparison of amino acids and acylcarnitines assay methods used in newborn screening assays by tandem mass spectrometry. Clin. Chim. Acta 2010, 411, 684–689. [Google Scholar] [CrossRef]
- De Jesús, V.R.; Mei, J.V.; Bell, C.J.; Hannon, W.H. Improving and assuring newborn screening laboratory quality worldwide: 30-year experience at the Centers for Disease Control and Prevention. Semin. Perinatol. 2010, 34, 125–133. [Google Scholar] [CrossRef] [Green Version]
- Chace, D.H.; Millington, D.S.; Terada, N.; Kahler, S.G.; Roe, C.R.; Hofman, L.F. Rapid diagnosis of phenylketonuria by quantitative analysis for phenylalanine and tyrosine in neonatal blood spots by tandem mass spectrometry. Clin. Chem. 1993, 39, 66–71. [Google Scholar] [CrossRef]
- Malvagia, S.; Haynes, C.A.; Grisotto, L.; Ombrone, D.; Funghini, S.; Moretti, E.; McGreevy, K.S.; Biggeri, A.; Guerrini, R.; Yahyaoui, R.; et al. Heptadecanoylcarnitine (C17) a novel candidate biomarker for newborn screening of propionic and methylmalonic acidemias. Clin. Chim. Acta 2015, 450, 342–348. [Google Scholar] [CrossRef] [PubMed] [Green Version]
- Huemer, M.; Kozich, V.; Rinaldo, P.; Baumgartner, M.R.; Merinero, B.; Pasquini, E.; Ribes, A.; Blom, H.J. Newborn screening for homocystinurias and methylation disorders: Systematic review and proposed guidelines. J. Inherit. Metab. Dis. 2015, 38, 1007–1019. [Google Scholar] [CrossRef] [PubMed] [Green Version]
- DeBarber, A.E.; Kalfon, L.; Fedida, A.; Sheffer, V.F.; Ben Haroush, S.; Chasnyk, N.; Biton, E.S.; Mandel, H.; Jeffries, K.; Shinwell, E.S.; et al. Newborn screening for cerebrotendinous xanthomatosis is the solution for early identification and treatment. J. Lipid Res. 2018, 59, 2214–2222. [Google Scholar] [CrossRef] [PubMed] [Green Version]
- Pitt, J.J. Newborn screening. Clin. Biochem. Rev. 2010, 31, 57–68. [Google Scholar]
- Jay, A.; Seeterlin, M.; Stanley, E.; Grier, R. Case Report of Argininemia: The Utility of the Arginine/Ornithine Ratio for Newborn Screening (NBS). JIMD Rep. 2012, 9, 121–124. [Google Scholar]
- Cheng, K.-H.; Liu, M.-Y.; Kao, C.-H.; Chen, Y.-J.; Hsiao, K.-J.; Liu, T.-T.; Lin, S.-P.; Huang, C.-H.; Chiang, C.-C.; Ho, H.-J.; et al. Newborn screening for methylmalonic aciduria by tandem mass spectrometry: 7 years’ experience from two centers in Taiwan. J. Chin. Med Assoc. 2010, 73, 314–318. [Google Scholar] [CrossRef] [Green Version]
- Merinero, B.; Alcaide, P.; Martin-Hernandez, E.; Morais, A.; Garcia-Silva, M.T.; Quijada-Fraile, P.; Pedrón-Giner, C.; Dulín, E.; Yahyaoui, R.; Egea, J.M.; et al. Four Years’ Experience in the Diagnosis of Very Long-Chain Acyl-CoA Dehydrogenase Deficiency in Infants Detected in Three Spanish Newborn Screening Centers. JIMD Rep. 2017, 39, 63–74. [Google Scholar]
- Tajima, G.; Hara, K.; Tsumura, M.; Kagawa, R.; Okada, S.; Sakura, N.; Maruyama, S.; Noguchi, A.; Awaya, T.; Ishige, M. Newborn screening for carnitine palmitoyltransferase II deficiency using (C16+C18:1)/C2: Evaluation of additional indices for adequate sensitivity and lower false-positivity. Mol. Genet. Metab. 2017, 122, 67–75. [Google Scholar] [CrossRef]
- Lim, T.H.; De Jesús, V.R.; Meredith, N.K.; Sternberg, M.R.; Chace, D.H.; Mei, J.V.; Hannon, W.H. Proficiency testing outcomes of 3-hydroxyisovalerylcarnitine measurements by tandem mass spectrometry in newborn screening. Clin. Chim. Acta 2011, 412, 631–635. [Google Scholar] [CrossRef] [PubMed]
- Chace, D.H.; Lim, T.; Hansen, C.R.; Adam, B.W.; Hannon, W.H. Quantification of malonylcarnitine in dried blood spots by use of MS/MS varies by stable isotope internal standard composition. Clin. Chim. Acta 2009, 402, 14–18. [Google Scholar] [CrossRef]
- De Jesús, V.R.; Mei, J.V.; Cordovado, S.K.; Cuthbert, C.D. The Newborn Screening Quality Assurance Program at the Centers for Disease Control and Prevention: Thirty-five Year Experience Assuring Newborn Screening Laboratory Quality. Int. J. Neonatal Screen. 2015, 1, 13–26. [Google Scholar] [CrossRef] [PubMed] [Green Version]
- Abiri, M.; Saei, H.; Eghbali, M.; Karamzadeh, R.; Shirzadeh, T.; Sharifi, Z.; Zeinali, S. Maple syrup urine disease mutation spectrum in a cohort of 40 consanguineous patients and insilico analysis of novel mutations. Metab. Brain Dis. 2019, 34, 1145–1156. [Google Scholar] [CrossRef] [PubMed]
- Puffenberger, E.G. Genetic heritage of the Old Order Mennonites of southeastern Pennsylvania. Am. J. Med. Genet. C Semin. Med. Genet. 2003, 121, 18–31. [Google Scholar] [CrossRef] [PubMed]
- Edelmann, L.; Wasserstein, M.P.; Kornreich, R.; Sansaricq, C.; Snyderman, S.E.; Diaz, G.A. Maple syrup urine disease: Identification and carrier-frequency determination of a novel founder mutation in the Ashkenazi Jewish population. Am. J. Hum. Genet. 2001, 69, 863–868. [Google Scholar] [CrossRef] [Green Version]
- Recommended Uniform Screen Panel. Available online: https://www.hrsa.gov/advisory-committees/heritable-disorders/rusp/index.html (accessed on 7 July 2020).
- Clinical and Laboratory Standards Institute (CLSI) Harmonized Terminology Database. Available online: http://htd.clsi.org/listterms.asp?searchdterm=harmonization (accessed on 25 October 2018).
- American Association for Clinical Chemistry. 20 April 2017. Available online: https://www.aacc.org/health-and-science-policy/advocacy/position-statements/2017/harmonization-of-clinical-laboratory-test-results (accessed on 29 October 2018).
- Armbruster, D.; Donnelly, J. Harmonization of Clinical Laboratory Test Results: The Role of the IVD Industry. EJIFCC 2016, 27, 37–47. [Google Scholar]
- Tate, J.R.; Johnson, R.; Sikaris, K. Harmonisation of laboratory testing. Clin. Biochem. Rev. 2012, 33, 121–122. [Google Scholar]
- Tate, J.R.; Myers, G.L. Harmonization of Clinical Laboratory Test Results. EJIFCC 2016, 27, 5–14. [Google Scholar]
- Villarraga-Gómez, H.; Morse, E.P.; Smith, S.; Hocken, R.J. Proficiency testing for interlaboratory comparisons on industrial computed tomography. In Proceedings of the 2014 ASPE Spring Topical Meeting, Berkeley, CA, USA, 13–16 April 2014. [Google Scholar]
- Szewczak, E.; Bondarzewski, A. Is the assessment of interlaboratory comparison results for a small number of tests and limited number of participants reliable and rational? Accred. Qual. Assur. 2016, 21, 10. [Google Scholar] [CrossRef] [Green Version]
- Maier, E.; Quevauviller, P.; Griepink, B. Interlaboratory studies as a tool for many purposes: Proficiency testing, learning exercises, quality control and certification of matrix materials. Anal. Chim. Acta 1993, 283, 590–599. [Google Scholar] [CrossRef]
- Pino, L.K.; Searle, B.C.; Huang, E.L.; Noble, W.S.; Hoofnagle, A.N.; MacCoss, M.J. Calibration Using a Single-Point External Reference Material Harmonizes Quantitative Mass Spectrometry Proteomics Data between Platforms and Laboratories. Anal. Chem. 2018, 90, 13112–13117. [Google Scholar] [CrossRef] [PubMed]
- Collins, B.C.; Hunter, C.L.; Liu, Y.; Schilling, B.; Rosenberger, G.; Bader, S.L.; Chan, D.W.; Gibson, B.W.; Gingras, A.-C.; Held, J.M.; et al. Multi-laboratory assessment of reproducibility, qualitative and quantitative performance of SWATH-mass spectrometry. Nat. Commun. 2017, 8, 291. [Google Scholar] [CrossRef]
- Thienpont, L.M.; Van Uytfanghe, K.; De Grande, L.A.; Reynders, D.; Das, B.; Faix, J.D.; MacKenzie, F.; Decallonne, B.; Hishinuma, A.; Lapauw, B.; et al. Harmonization of Serum Thyroid-Stimulating Hormone Measurements Paves the Way for the Adoption of a More Uniform Reference Interval. Clin. Chem. 2017, 63, 1248–1260. [Google Scholar] [CrossRef]
- Martínez-Morillo, E.; García, B.P.; Menéndez, F.V. Challenges for Worldwide Harmonization of Newborn Screening Programs. Clin. Chem. 2016, 62, 689–698. [Google Scholar] [CrossRef] [PubMed] [Green Version]
- Hall, P.; Marquardt, G.; McHugh, D.M.; Currier, R.J.; Tang, H.; Stoway, S.D.; Rinaldo, P. Postanalytical tools improve performance of newborn screening by tandem mass spectrometry. Genet. Med. 2014, 16, 889–895. [Google Scholar] [CrossRef] [Green Version]
- Seeterlin, M.; de Jesus, V.; Haynes, C.; Morrissey, M.; Manning, A.; Petritis, K.; Bhakta, S.; Held, P. Normalization of Laboratory MS/MS Cutoffs using the CDC NSQAP Quality Control Materials. In Proceedings of the APHL Newborn Screening and Genetic Testing Symposium, St. Louis, MI, USA, 29 February–3 March 2016. [Google Scholar]
- Grosse, S.D.; Riehle-Colarusso, T.; Gaffney, M.; Mason, C.A.; Shapira, S.K.; Sontag, M.K.; Braun, K.V.N.; Iskander, J. CDC Grand Rounds: Newborn Screening for Hearing Loss and Critical Congenital Heart Disease. Morb. Mortal. Wkly. Rep. 2017, 66, 888–890. [Google Scholar] [CrossRef] [Green Version]
- NSQAP. 2019 Quality Control Program Report. August 2019. Available online: https://www.cdc.gov/labstandards/pdf/nsqap/QC_Report_S2_2019-508.pdf (accessed on 2 March 2020).
- R Core Team. R: A Language and Environment for Statistical Computing; R Foundation for Statistical Computing: Vienna, Austria, 2017. [Google Scholar]
- Asef, C.K.; Khaksarfard, K.M.; de Jesus, V.R. Non-derivatized Assay for the Simultaneous Detection of Amino Acids, Acylcarnitines, Succinylacetone, Creatine, and Guanidinoacetic Acid in Dried Blood Spots by Tandem Mass Spectrometry. Int. J. Neonatal Screen. 2016, 2, 13. [Google Scholar] [CrossRef] [Green Version]
- Pickens, C.A.; Petritis, K. High resolution mass spectrometry newborn screening applications for quantitative analysis of amino acids and acylcarnitines from dried blood spots. Anal. Chim. Acta 2020, 1120, 85–96. [Google Scholar] [CrossRef]
- Miller, W.G. The role of proficiency testing in achieving standardization and harmonization between laboratories. Clin. Biochem. 2009, 42, 232–235. [Google Scholar] [CrossRef] [PubMed]
- Orsini, J.J.; Culley, L.; Christine Dorley, M.; Haynes, C.A.; Hunt, P.; Koupaei, R.; Manning, A.; Neogi, P.; Dhillon, K.; Roworth, P.; et al. Multi-state harmonization study: efforts to harmonize the cutoffs used in newborn screening for adrenoleukodystrophy. In Preparation.
- Keller, R.; Chrastina, P.; Pavlikova, M.; Gouveia, S.; Ribes, A.; Kölker, S.; Blom, H.J.; Baumgartner, M.R.; Bartl, J.; Dionisi-Vici, C.; et al. Newborn screening for homocystinurias: Recent recommendations versus current practice. J. Inherit. Metab. Dis. 2018, 42, 128–139. [Google Scholar] [CrossRef] [PubMed]
- Analytical Methods Committee. z-Scores and other scores in chemical proficiency testing—Their meanings, and some common misconceptions. Anal. Methods 2016, 8, 5553. [Google Scholar] [CrossRef]


| Metabolite (Abbreviation) | Specimen Identifier | Expected Value | CDC PT | Raw PT | Harmonized PT | Number of Labs | Number of Methods |
|---|---|---|---|---|---|---|---|
| Arginine (Arg) | 11,954 | 130.2 | 125.4 | 103.9 [65.5–120] | 119.32 [96.38–133.95] | 21 | 3 |
| Free Carnitine (C0) | 41,964 | 32.52 | 30.43 | 26.92 [19.3–36.15] | 33.47 [19.69–50.19] | 30 | 5 |
| Acetylcarnitine (C2) | 41,964 | 17.15 | 15.42 | 14.54 [11.1–19.58] | 16.51 [14.3–17.91] | 8 | 4 |
| Propionylcarnitine (C3) | 31,964 | 11.04 | 10.84 | 9.49 [7.9–15.01] | 11.41 [8.38–19.03] | 30 | 5 |
| Malonylcarnitine (C3DC) | 31,965 | 25.03 | 21.82 | 24.48 [7.02–41.78] | 26.8 [23.1–32.55] | 6 | 2 |
| Butyrylcarnitine (C4) | 31,965 | 3.04 | 2.55 | 2.56 [2.21–4.09] | 2.91 [2.21–3.37] | 25 | 5 |
| Hydroxybutyrylcarnitine (C4OH) | 41,961 | 3.04 | 2.68 | 2.27 [1.65–3.63] | 2.96 [2.41–3.9] | 6 | 2 |
| Isovalerylcarnitine (C5) | 41,965 | 1.55 | 1.59 | 1.4 [1.06–2.48] | 1.68 [1.44–1.99] | 30 | 5 |
| Tiglylcarnitine (C5:1) | 31,965 | 0.76 | 0.62 | 0.48 [0.34–0.8] | 0.68 [0.52–1] | 24 | 5 |
| Hydroxyisovalerylcarnitine (C5OH) | 41,964 | 1.91 | 1.71 | 1.41 [1.1–2.22] | 1.89 [1.37–2.29] | 29 | 5 |
| Glutarylcarnitine (C5DC) | 31,962 | 1.82 | 2.10 | 1.89 [0.51–2.4] | 2.26 [1.73–3.13] | 29 | 5 |
| Hexanoylcarnitine (C6) | 31,963 | 2.71 | 2.28 | 2.35 [1.99–2.73] | 2.62 [2.09–4.37] | 27 | 5 |
| Octanoylcarnitine (C8) | 11,962 | 0.68 | 0.69 | 0.8 [0.64–1.09] | 0.78 [0.64–0.95] | 27 | 4 |
| Decanoylcarnitine (C10) | 31,963 | 1.95 | 1.80 | 1.78 [1.49–2.9] | 1.97 [1.63–2.72] | 26 | 5 |
| Myristoylcarnitine (C14) | 41,962 | 1.59 | 1.42 | 1.55 [1.17–2.08] | 1.65 [1.42–1.96] | 26 | 5 |
| Tetradecenoylcarnitine (C14:1) | 41,962 | 1.75 | 1.29 | 1.27 [0.93–1.95] | 1.45 [1.16–1.72] | 26 | 5 |
| Palmitoylcarnitine (C16) | 31,965 | 15.52 | 11.44 | 12.12 [10.43–14.34] | 12.62 [10.58–15.68] | 27 | 5 |
| Hydroxypalmitoylcarnitine (C16OH) | 41,963 | 1.01 | 0.81 | 0.69 [0.52–1.08] | 1.01 [0.77–1.24] | 29 | 5 |
| Stearoylcarnitine (C18) | 11,965 | 3.77 | 4.22 | 3.36 [2.8–3.74] | 3.42 [3.12–3.77] | 23 | 4 |
| Hydroxystearoylcarnitine (C18OH) | 41,963 | 0.80 | 0.44 | 0.55 [0.47–0.74] | 0.57 [0.43–0.72] | 21 | 5 |
| Citrulline (Cit) | 11,951 | 181.3 | 190.3 | 180.7 [117.4–214] | 187.1 [130.9–254.3] | 27 | 4 |
| Leucine (Leu) | 41,951 | 450.0 | 521.3 | 498.8 [338.9–621.1] | 496.4 [436–571] | 30 | 5 |
| Methionine (Met) | 41,955 | 185.0 | 140.6 | 149.2 [116–188] | 176.4 [129.43–215.83] | 30 | 5 |
| Phenylalanine (Phe) | 11,952 | 311.4 | 296 | 295.9 [32–1685.4] | 338.42 [23.8–1743.5] | 268 | 16 |
| Succinylacetone (SUAC) | 41,953 | 50.0 | 28.2 | 17.6 [10.1–53.4] | 26.6 [12.5–49.9] | 26 | 4 |
| Tyrosine (Tyr) | 41,953 | 900.0 | 930.8 | 859.6 [558.3–1228] | 894.3 [749.7–1046.4] | 27 | 5 |
| Valine (Val) | 41,951 | 450.0 | 473.8 | 492.7 [266.9–639.3] | 463.6 [369.8–540.4] | 20 | 5 |
© 2020 by the authors. Licensee MDPI, Basel, Switzerland. This article is an open access article distributed under the terms and conditions of the Creative Commons Attribution (CC BY) license (http://creativecommons.org/licenses/by/4.0/).
Share and Cite
Pickens, C.A.; Sternberg, M.; Seeterlin, M.; De Jesús, V.R.; Morrissey, M.; Manning, A.; Bhakta, S.; Held, P.K.; Mei, J.; Cuthbert, C.; et al. Harmonizing Newborn Screening Laboratory Proficiency Test Results Using the CDC NSQAP Reference Materials. Int. J. Neonatal Screen. 2020, 6, 75. https://0-doi-org.brum.beds.ac.uk/10.3390/ijns6030075
Pickens CA, Sternberg M, Seeterlin M, De Jesús VR, Morrissey M, Manning A, Bhakta S, Held PK, Mei J, Cuthbert C, et al. Harmonizing Newborn Screening Laboratory Proficiency Test Results Using the CDC NSQAP Reference Materials. International Journal of Neonatal Screening. 2020; 6(3):75. https://0-doi-org.brum.beds.ac.uk/10.3390/ijns6030075
Chicago/Turabian StylePickens, Charles Austin, Maya Sternberg, Mary Seeterlin, Víctor R. De Jesús, Mark Morrissey, Adrienne Manning, Sonal Bhakta, Patrice K. Held, Joanne Mei, Carla Cuthbert, and et al. 2020. "Harmonizing Newborn Screening Laboratory Proficiency Test Results Using the CDC NSQAP Reference Materials" International Journal of Neonatal Screening 6, no. 3: 75. https://0-doi-org.brum.beds.ac.uk/10.3390/ijns6030075