Efficient Expression of Soluble Recombinant Protein Fused with Core-Streptavidin in Bacterial Strain with T7 Expression System


Abstract
:1. Introduction
2. Experimental Design
2.1. Materials
- New England BioLabs (NEB) (Ipswich, MA, USA)
- High fidelity Phusion polymerase (Cat No.: M0491S)
- Blunt/TA Ligase Master Mix (Cat No.: M0367S)
- T4 DNA ligase (Cat No.: M0202S)
- Monarch PCR & DNA cleanup kit (Cat No.: T1030S)
- BL21(DE3) competent E. coli (Cat No.: C2527I)
- NiCo21(DE3) competent E. coli (Cat No.: C2529H)
- SHuffle® T7 Express competent E. coli (Cat No.: C3029J)
- T7 Express Lemo21(DE3) competent E. coli (Cat No.: C2528J)
- L-rhamnose (Cat No.: B9030A)
- NEB® 5-alpha competent E. coli (subcloning efficiency) (Cat No.: C2988J)
- Thermo Fisher Scientific (Waltham, MA, USA)
- Dulbecco’s modified Eagles’ medium (DMEM) culture media (Cat No.: 10566016)
- Fetal bovine serum (FBS) (Cat No.: 16000044)
- 0.25% trypsin-EDTA (Cat No.: 25200056)
- L-glutamine (Cat No.: 25030081)
- Biotin-X DHPE (N-((6-(biotinoyl)amino)hexanoyl)-1,2-dihexadecanoyl-sn-glycero-3-phosphoethanolamine, triethylammonium salt) (Cat No.: B1616)
- Streptavidin-fluorescein isothiocyanate (SA-FITC) (Cat No.: SA1001)
- Bacterial protein extraction reagent (B-PER) (Cat No.: 78260)
- Protein concentrator PES MWCO = 50 kD (Cat No.: 88541)
- Protease inhibitor EDTA free (Cat No.: A32961)
- ECL substrate (Cat No.: 35050)
- Tween-20 (Cat No.: 28360)
- Streptavidin monoclonal antibody (Cat No.: MA1-20010)
- Penicillin-streptomycin (Cat No.: 15140163)
- HisPur™ cobalt resin (Cat No.: 89964)
- Bicinchoninic acid (BCA) protein assay kit including bovine serum albumin (BSA) standard (Cat No.: 23227)
- PageRuler™ Plus prestained protein ladder, 10 to 250 kDa (Cat No.: 26620)
- Disposable columns, 5 mL (Cat No.:29922)
- Methanol (Cat No.: 18-604-352)
- Sigma-Aldrich (St. Louis, MO, USA)
- 5-fluorouracil (5-FU) (Cat No.: F6627)
- Lysogeny broth (LB media) (Cat No.: L3522)
- Imidazole (Cat No.: 68268)
- Isopropyl-β-D-thiogalactopyranoside (IPTG) (Cat No.: I5502)
- Potassium phosphate (Cat No.: P5655)
- Sodium hydroxide (Cat No.: 28-2988)
- Ethanol (Cat No.: 102428)
- Plasmid pET-30a(+) DNA (Cat No.:69909)
- Bio-Rad (Hercules, CA, USA)
- Tris/glycine/SDS buffer (Cat No.: 1610772EDU)
- Tris-buffer saline (TBS) (Cat No.: 1706435)
- Nitrocellulose membrane 0.2 µm (Cat No.: 1620168)
- Laemmli sample buffer (Cat No.: 1610737)
- TGX FastCast Acrylamide Solutions (SDS-PAGE gels) (Cat No.: 161-0174)
- 2-mercaptoethanol (Cat No.: 1610710)
- APExBIO (Houston, TX, USA)
- 5′-deoxy-5′-fluorouridine (5′-DFUR) (Cat No.: B5516)
- Santa Cruz Biotech (Dallas, TX, USA)
- Kanamycin sulfate (Cat No.: sc-257635)
- Dimethyl sulfoxide (DMSO) (Cat No.: sc-358801)
- Platelet-derived endothelial cell growth factor (PD-ECGF) monoclonal antibody (Cat No.: sc-47702)
- ATCC (Manassas, VA, USA)
- A549 lung adenocarcinoma cell line (Cat No.: CCL-185)
- Integrated DNA Technologies, Inc. (Coralville, IA, USA)
- Forward primer 5′-AGATCCGAATTCGGTGCTGCTGAAGCAGGT-3′ and reverse primer 5′-ATTATACTCGAGGGAGGCGGCGGACGGCTT-3′ for coreSA (custom-made)
- Forward primer 5′-GCCATGGATATCATGGCAGCCTTGATGACCCC-3′ and reverse primer 5′-GATCTCGAATTCTTGCTGCGGCGGCAGAACG-3′ for TP (custom-made)
- R&D Systems (Minneapolis, MN, USA)
- Mouse IgG HRP (horseradish peroxidase)-conjugated antibody (Cat. No.: HAF018)
- GenScript (Piscataway, NJ, USA)
- pcDNA3.1+ C-eGFP-TP plasmid (custom-made)
- QIAGEN (Germantown, MD, USA)
- Plasmid Miniprep kit (Cat No.: 10043)
- Research Products International Corp (Mount Prospect, IL, USA)
- Rapid Coomassie11 blue stain (Cat No.: RCS-50)
- Boston BioProducts (Ashland, MA, USA)
- Phosphate buffer saline (PBS) (Cat No.: BM-220X)
- Promega (Madison, WI, USA)
- Tris-Hydrochloride (Tris-HCl) (Cat No.: H5121)
- G-Biosciences (St. Louis, MO, USA)
- Maxi Columns (Cat. No.: 7860197)
- University of Southern California
- Plasmid pSTE2-215 (yol) (provided by Dr. Stanley Tahara)
2.2. Equipment
- SpectraMax M2e microplate reader (Molecular Devices, Sunnyvale, CA, USA)
- Chemiluminescence imager (PXi Syngene, Frederick, MD, USA)
- DMi8 microscope equipped with Leica EC3 digital color camera (Leica Microsystems, Wetzlar, Germany)
- T-100 thermocycler (Bio-Rad, Hercules, CA, USA)
- Trans-Blot® semi-dry system (Bio-Rad, Hercules, CA, USA)
- C24 incubator shaker (New Brunswick Scientific, Edison, NJ, USA)
- Sorvall ST 16R centrifuge (Thermo Fisher Scientific, Waltham, MA, USA)
- Microprocessor controlled 280 series water bath (Thermo Fisher Scientific, Waltham, MA, USA)
- Mini-Protean® Tetra cell and PowerPac™ Universal power supply (Bio-Rad, Hercules, CA, USA)
3. Procedure
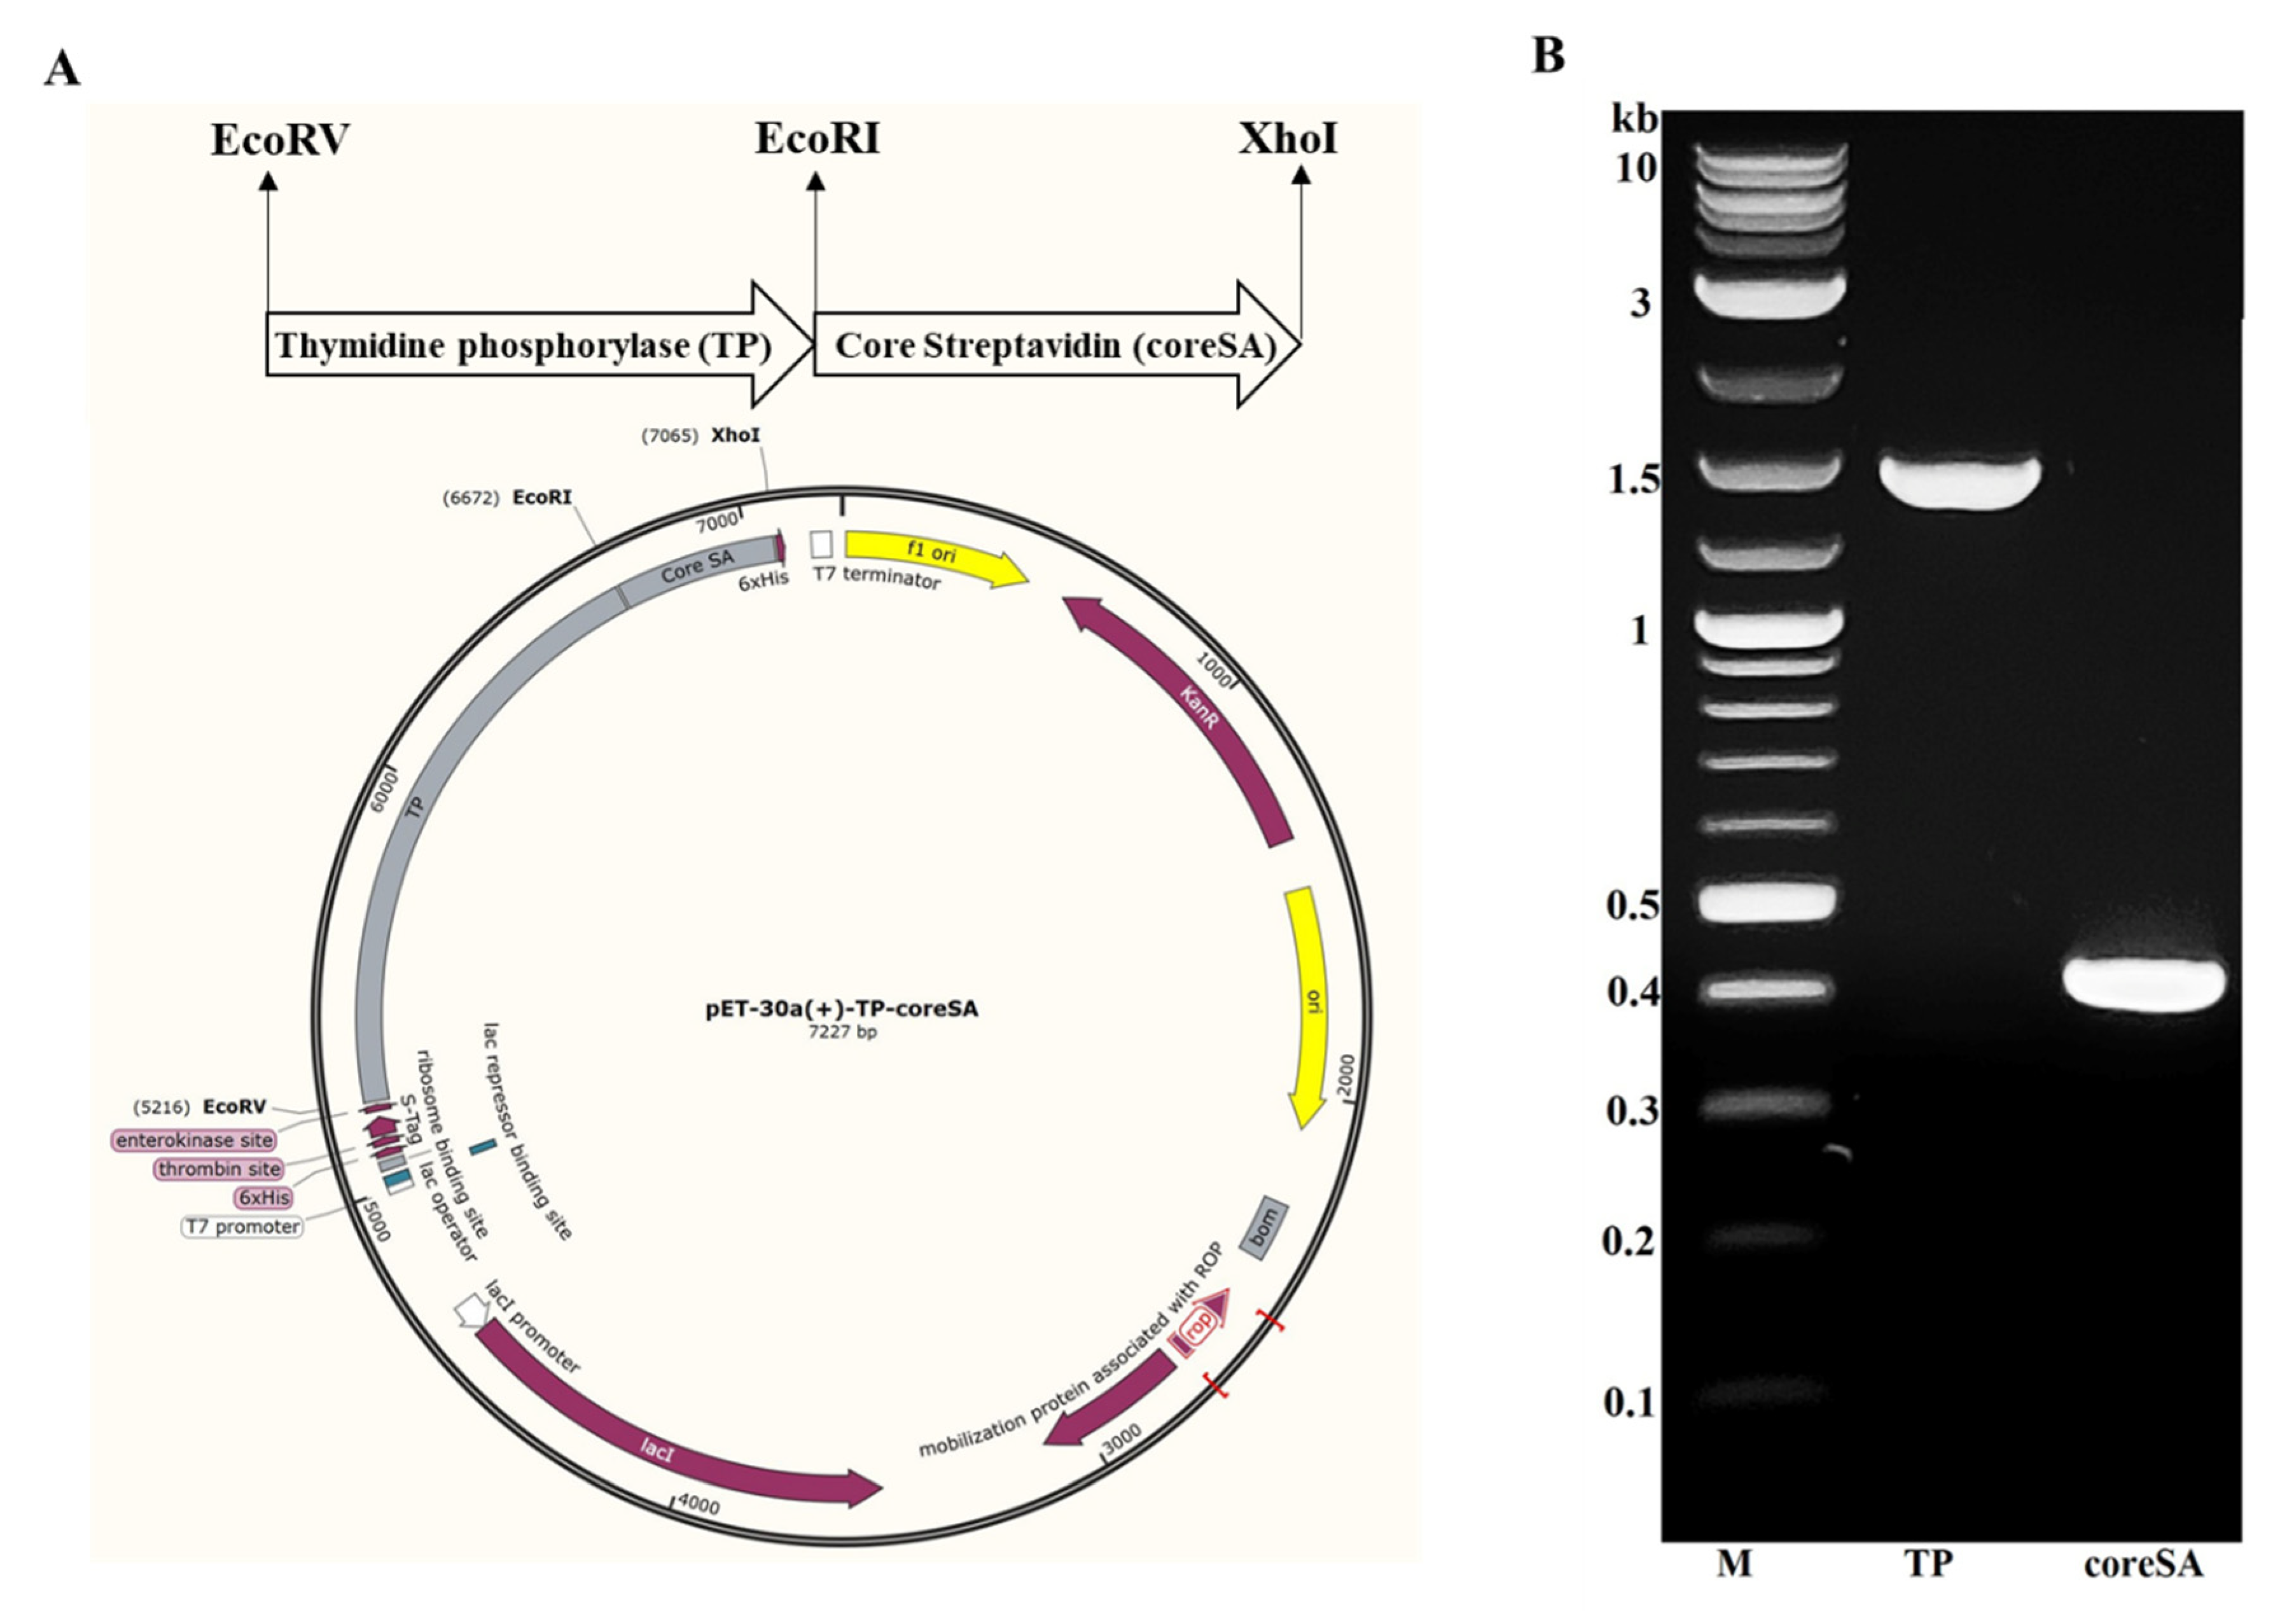
3.1. Construction of TP-coreSA Encoding Plasmid
- Clone TP gene sequence by polymerase chain reaction (PCR) from pcDNA3.1+ C-eGFP-TYMP using forward primer 5′-GCCATGGATATCATGGCAGCCTTGATGACCCC-3′ and reverse primer 5′-GATCTCGAATTCTTGCTGCGGCGGCAGAACG-3′. The 50 µL PCR mixture contains 1 µg of template DNA, 0.5 µM of each PCR primer, 1X Phusion HF buffer, 200 µM dNTPs, 0.5 unit of Phusion DNA polymerase, and nuclease-free water up to 50 µL. Perform PCR in T-100 thermocycler with an initial denaturation at 98 °C for 30 s, then 35 cycles of denaturation at 98 °C for 10 s, annealing at 66 °C for 30 s, and extension at 72 °C for 15 s, followed by a final extension at 72 °C for 5 min.
- Clone core streptavidin (coreSA) gene sequence by PCR from pSTE2-215 (yol) plasmid using forward 5′-AGATCCGAATTCGGTGCTGCTGAAGCAGGT-3′ and reverse primer 5′-ATTATACTCGAGGGAGGCGGCGGACGGCTT-3′. The 50 µL PCR mixture contains 1 µg of template DNA, 0.5 µM of each PCR primer, 1X Phusion HF buffer, 200 µM dNTPs, 0.5 unit of Phusion DNA polymerase, and nuclease-free water up to 50 µL. Perform PCR in T-100 thermocycler with an initial denaturation at 98 °C for 30 s, then 35 cycles of denaturation at 98 °C for 10 s, annealing at 62 °C for 30 s, and extension at 72 °C for 15 s, followed by a final extension at 72 °C for 5 min.
- Purify the cloned PCR product of TP and coreSA with Monarch PCR & DNA cleanup kit and analyze with 1% agarose gel electrophoresis.
- Insert coreSA in between XhoI and EcoRI restriction sites of pET-30a(+) plasmid using T4 DNA ligase to yield pET-30a(+)-coreSA plasmid.
- Insert TP in between EcoRI and EcoRV restriction sites of pET-30a(+)-coreSA using Blunt/TA Ligase Master Mix to yield pET-30a(+)-TP-coreSA expression vector (as shown in Figure 1).
3.2. Expression of TP-coreSA Encoding Plasmid
- Transform the constructed pET-30a(+)-TP-coreSA vector into different strains of E. coli competent cells (i.e., BL21(DE3), NiCo21(DE3), Lemo21(DE3), and SHuffle®) according to manufacturer standard protocols.
- Spread on separate agar plates supplemented with 50 µg/mL kanamycin.
- Incubate overnight at 37 °C to screen the positive clones.
- Pick a single colony from each agar plate and resuspend it into 5 mL LB media supplemented with 50 µg/mL kanamycin.
- Grow overnight with shaking at 220 rpm and 37 °C to produce starter culture.
- On the next day, dilute the starter cultures to 100 mL for SHuffle®, BL21(DE3), and NiCo21(DE3) separately with fresh media and keep shaking at 37 °C.
- Induce 400 µM IPTG when optical density at 600 nm (OD600) of the cultures reaches 0.5, and shake for 5 h at 30 °C to induce expression.
- Harvest the cells by centrifugation at 4500× g for 15 min at 4 °C.
- Re-suspend each cell pellets in 2 mL of lysis buffer that was made by mixing B-PER with 50 mM Tris-HCl (pH 7.5) and EDTA-free protease inhibitor (1 tablet for 50 mL).
- Wait for 10 min at room temperature and sonicate 10 times (pulse of 10 s with 10 s rest each time) with output at seven to maximize the protein extraction efficiency.
- Finally, centrifuge lysates at 17,000× g for 20 min and collect the supernatant named as a soluble crude fraction and the re-suspend the pellets in 1x PBS named as an insoluble fraction.
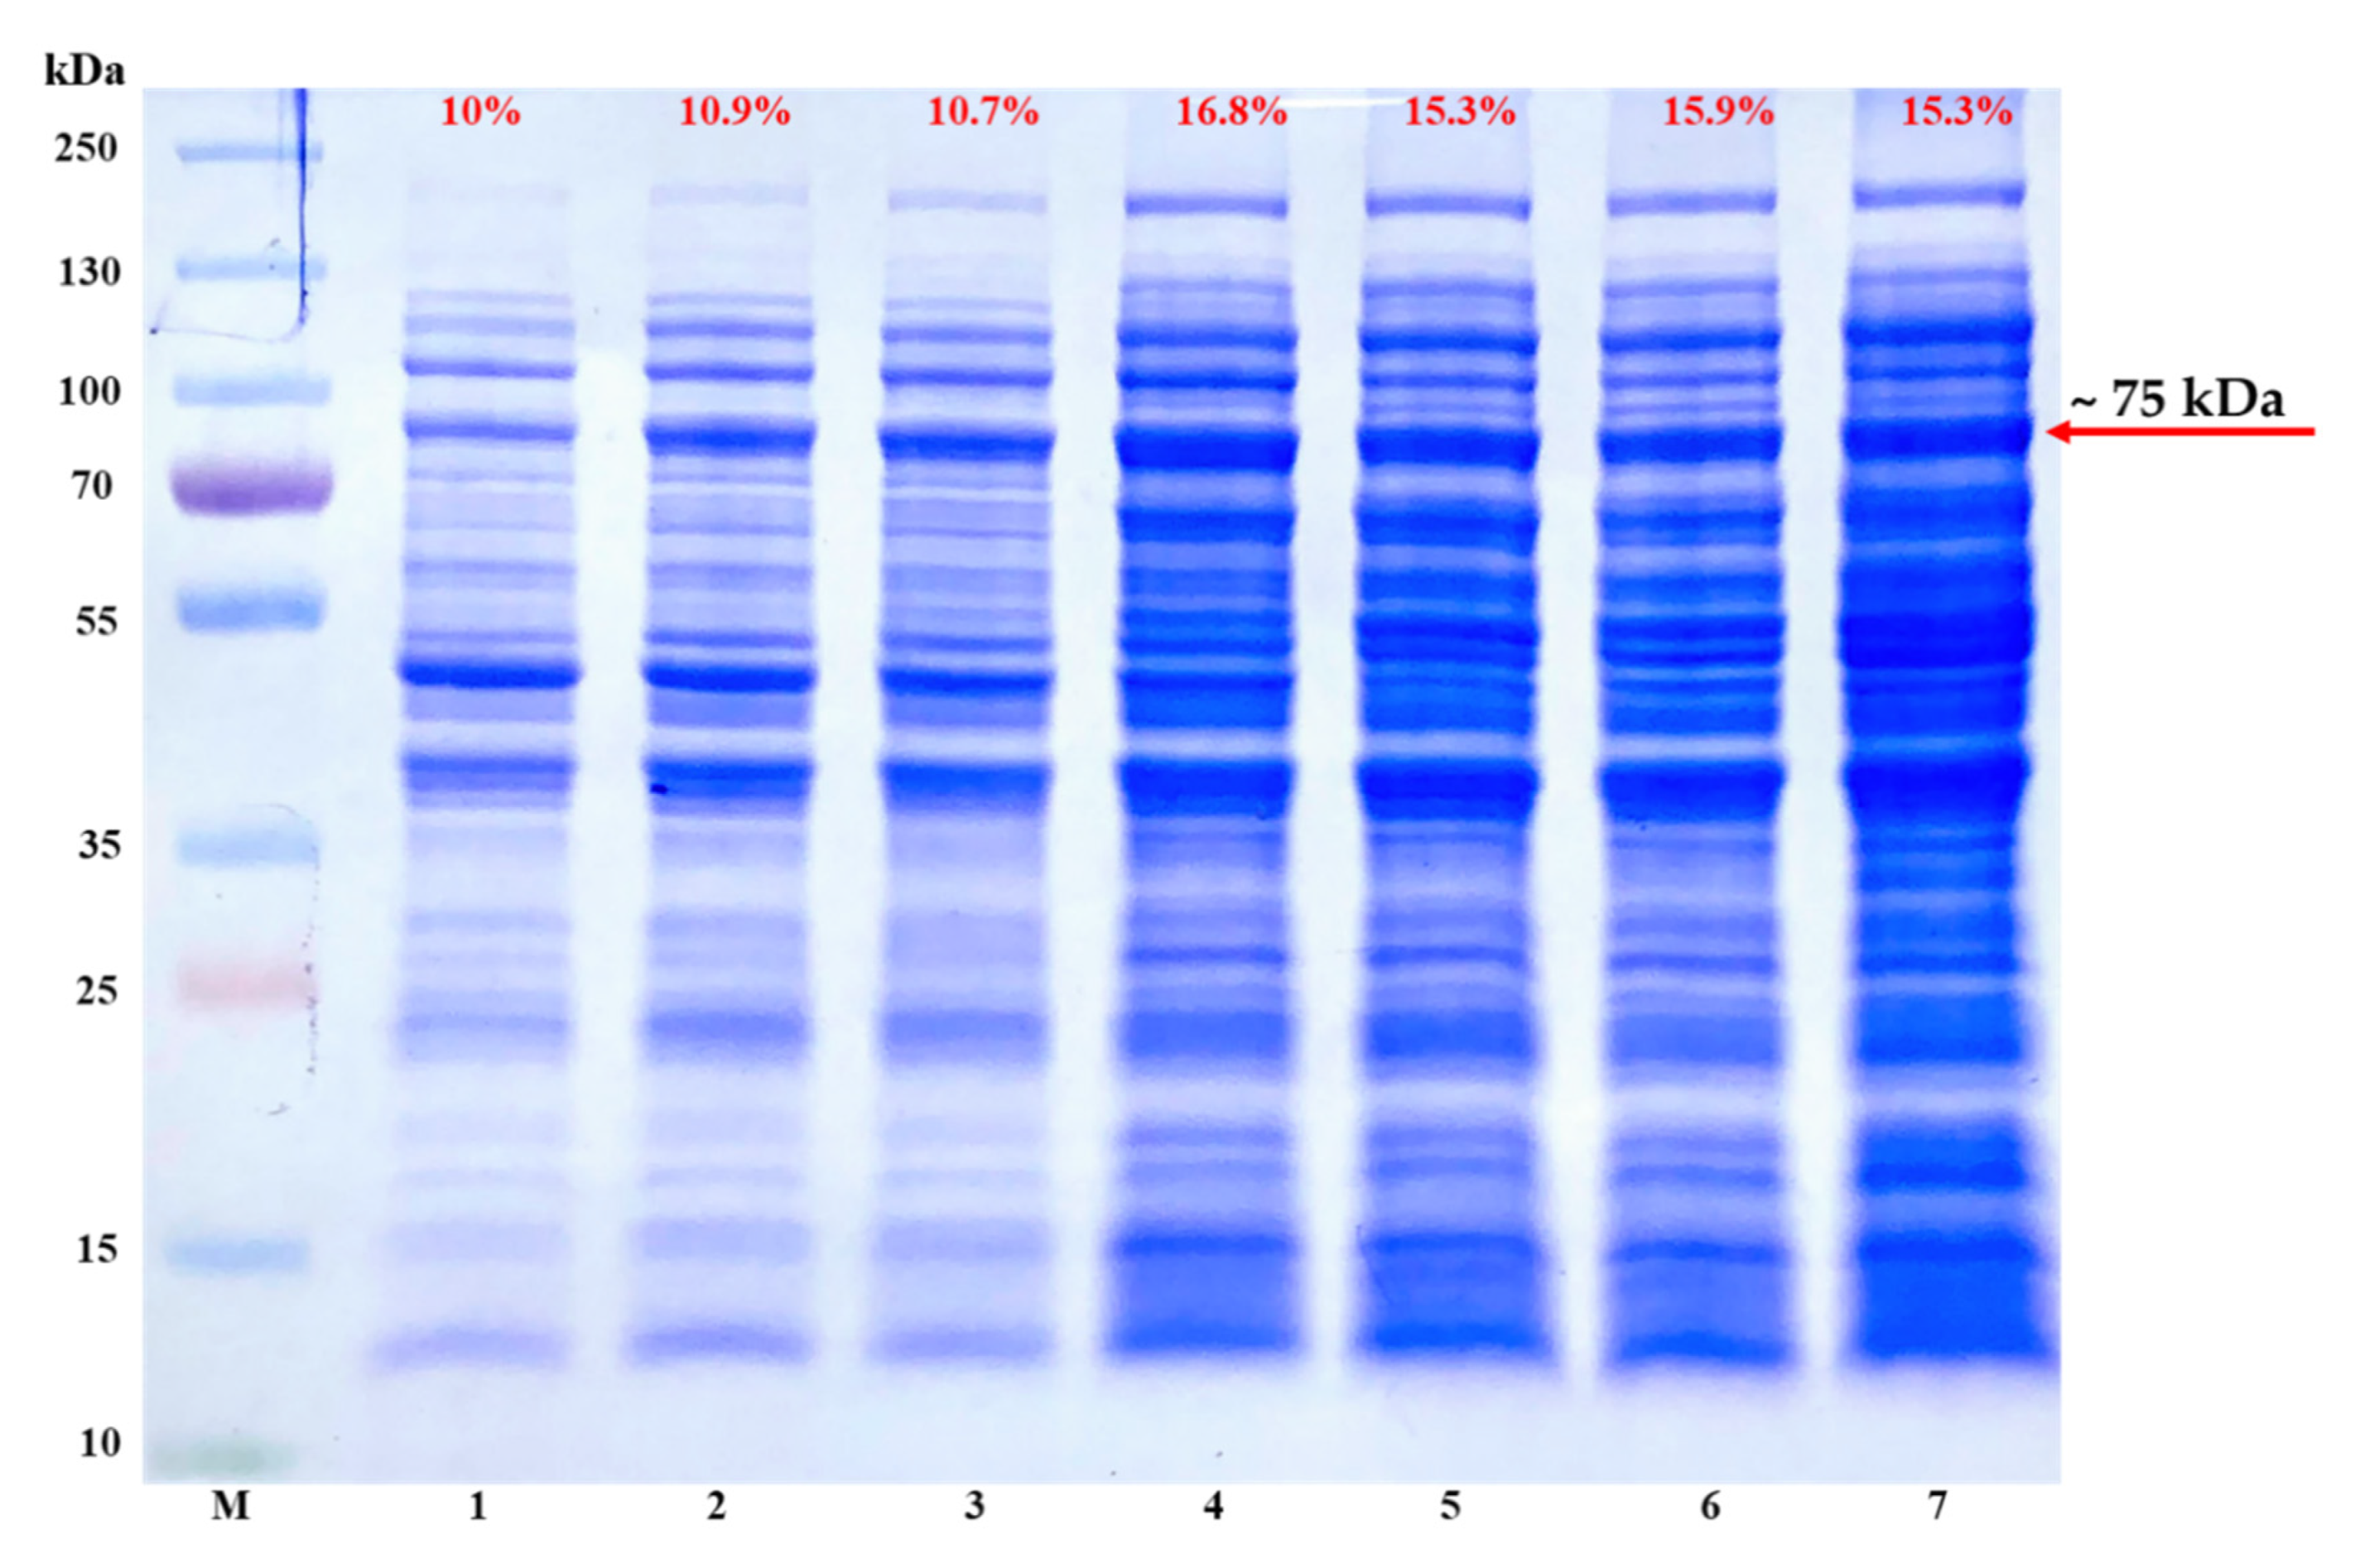
- To determine the optimal expression level of recombinant TP-coreSA protein with Lemo21(DE3), use 25 mL of culture media with different concentrations of L-rhamnose (0, 100, 250, 500, 750, 1000, 2000 µM) inoculated each with 0.2 mL of starter culture. Incubate all the cultures at 37 °C until OD600 reached 0.5.
 CRITICAL STEP:L-rhamnose concentration is very important and it can differ for every fusion protein of interest. So, researchers need to identify the best concentration through titer usually in the range of 0 to 2000 µM. Once the optimal concentration of L-rhamnose is identified, 100 mL of culture medium can be set up for the protein expression.
- 13.
- Induce with 400 µM IPTG and keep shaking overnight at 22 °C with 225 rpm. Then, harvest the cells by centrifugation at 4500× g for 15 min, and extract the soluble crude fraction and insoluble fraction as stated above.
CRITICAL STEP:The IPTG concentration should remain the same, only change L-rhamnose concentration for optimal expression of fusion protein of interest.3.3. Purification of TP-coreSA Fusion Protein
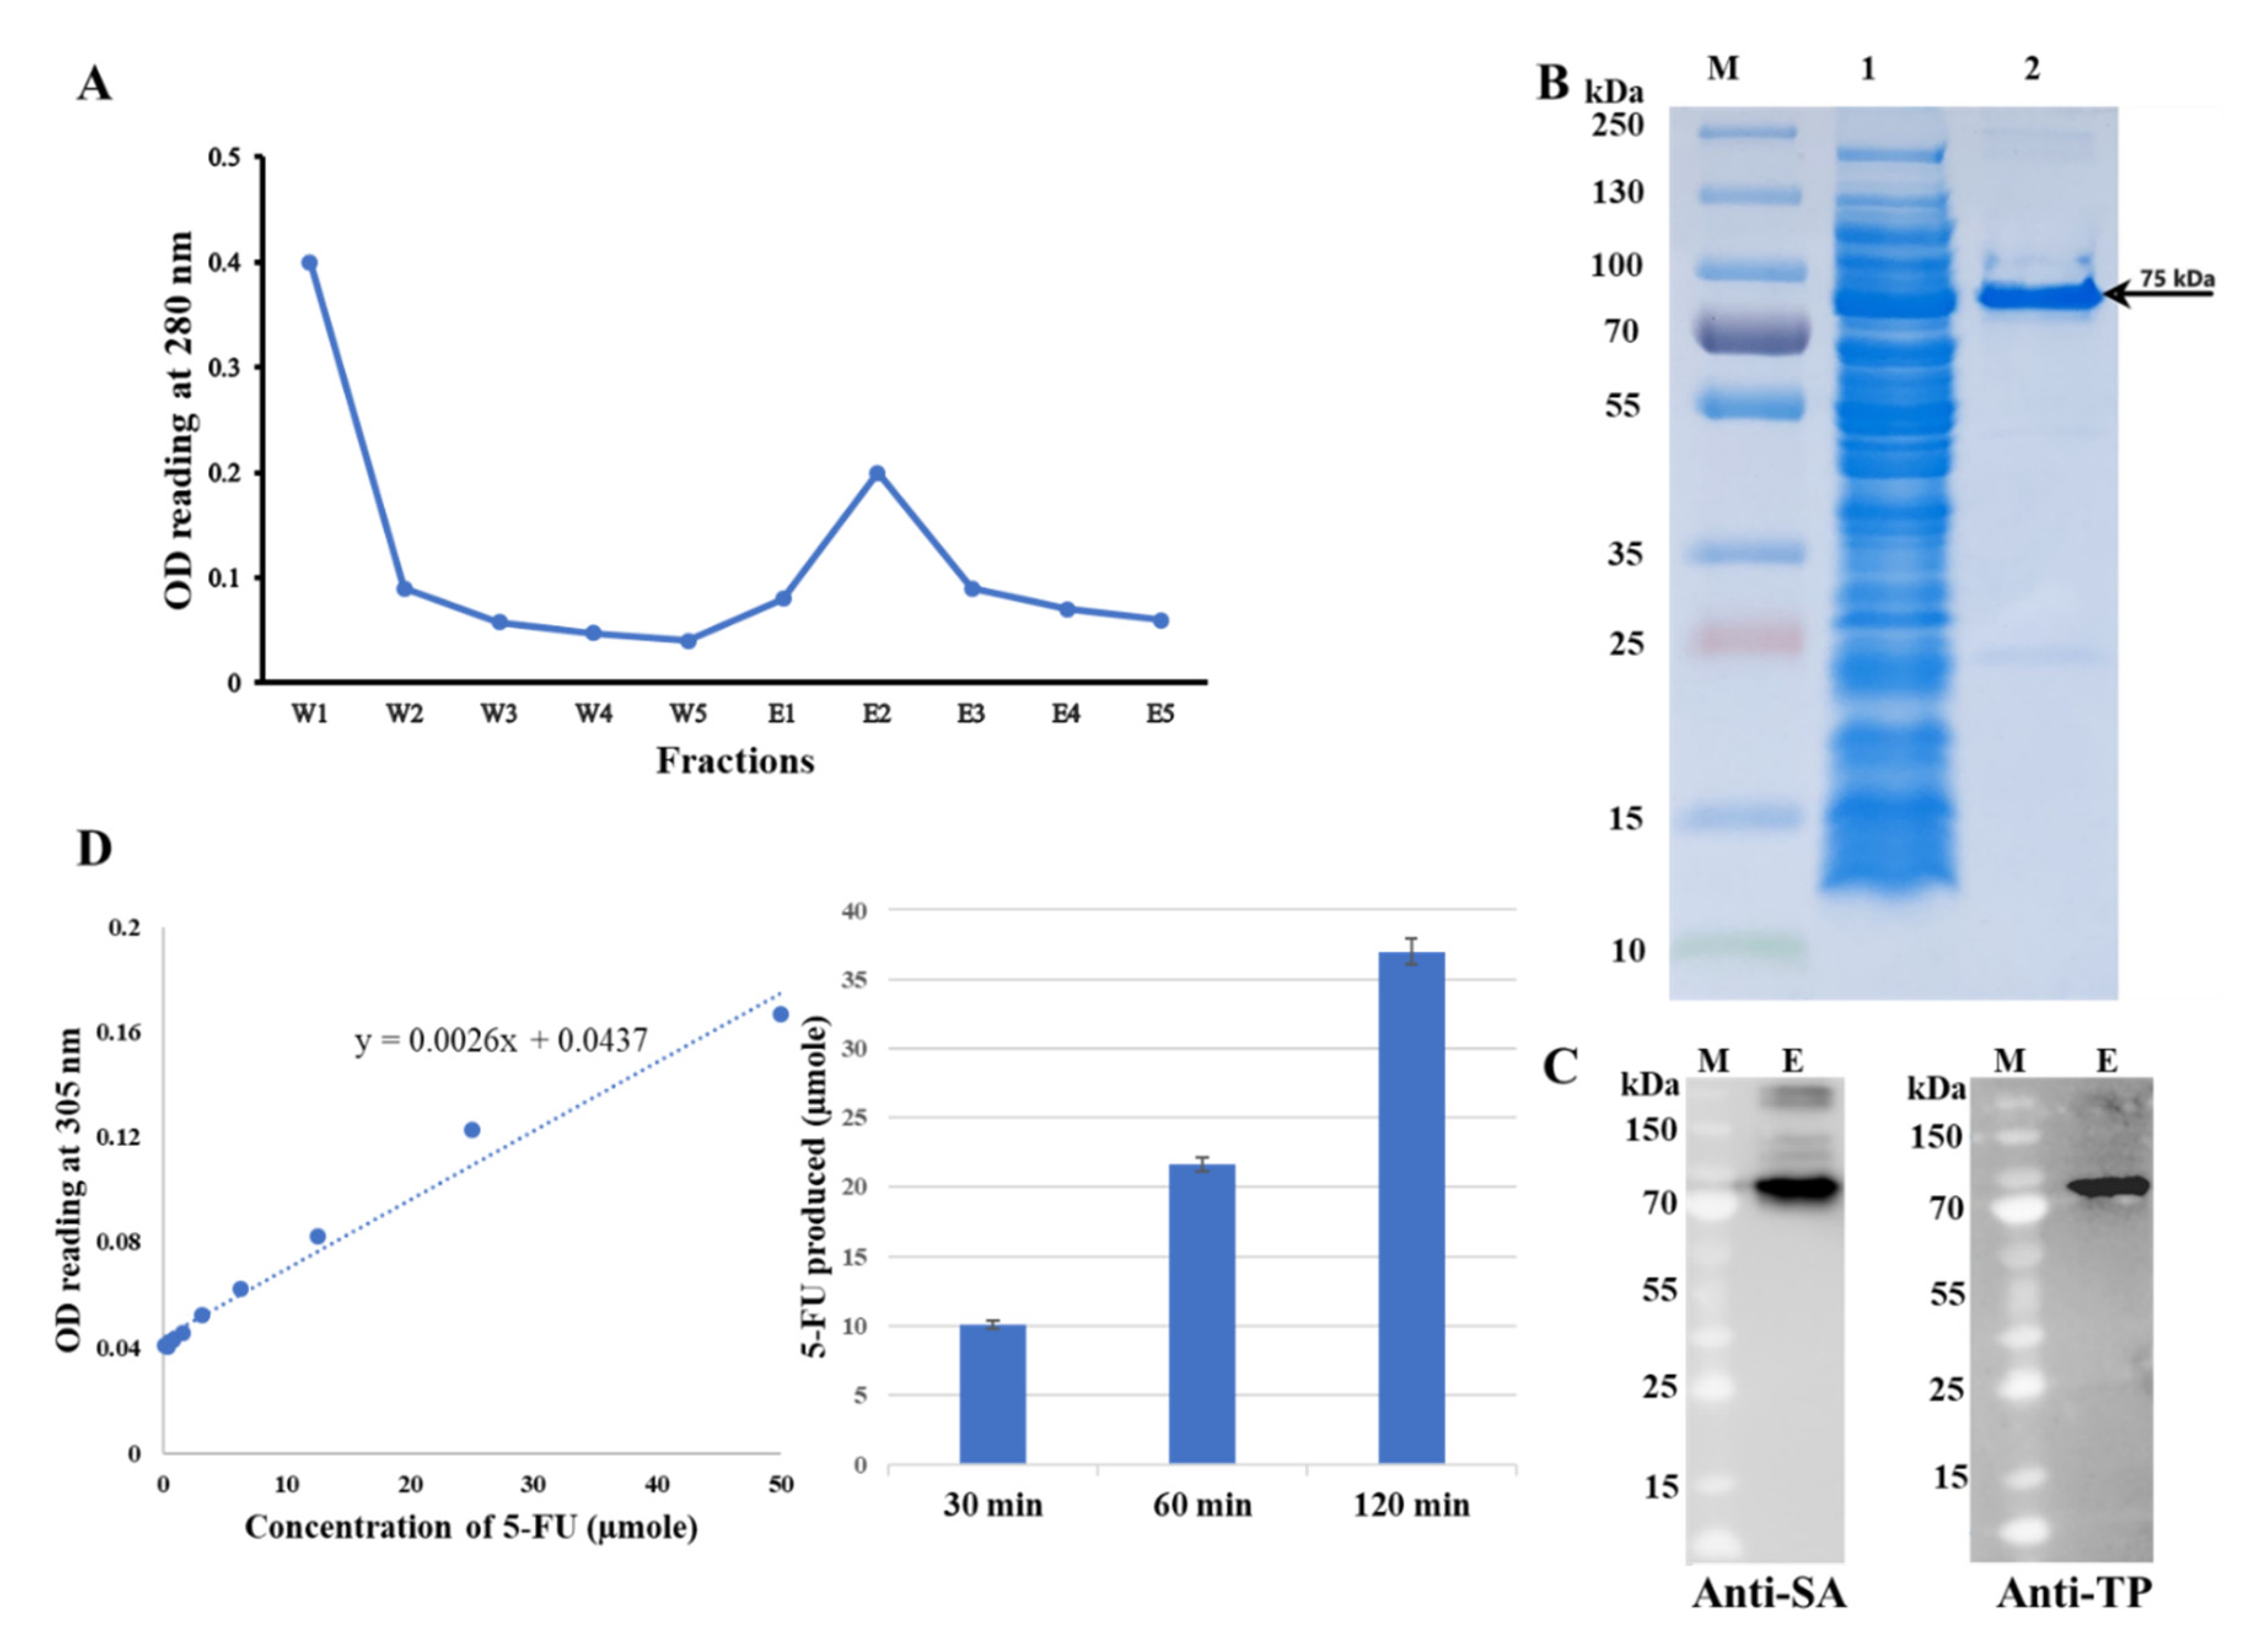
- repare binding buffer (10 mM imidazole in 1x PBS), wash buffer (10 mM imidazole in 1× PBS), and elution buffer (250 mM imidazole in 1x PBS).
- Mix the soluble crude fraction of Lemo21(DE3) in 1:1 ratio with binding buffer and let it bind to HisPur™ cobalt resin for 1 h with gentle shaking at 4 °C.
- Load into the column and collect the flow-through.
- Wash with 5 resin bed volume of wash buffer and elute with 3 resin bed volume of elution buffer. (For instance, 2 mL of resin was used in our experiment, it was washed with 10 mL with wash buffer and eluted with 6 mL of elution buffer).
- Measure OD280 of each collected fraction with SpectraMax M2e microplate reader to plot the elution profile.
CRITICAL STEP:Always place lysates, crude proteins, insoluble fraction, and purified protein on ice during the experiments.- 6.
- For the control group study using coreSA protein only, Lemo21(DE3) is transformed with the constructed pET-30a(+)-coreSA plasmid, expressed, and purified by the aforementioned methods.
3.4. Characterization of TP-coreSA Fusion Protein
3.4.1. BCA Protein Assay
- Dilute the 2000 µg/mL of bovine serum albumin (BSA) stock to seven different concentrations (1500, 1000, 750, 500, 250, 125, 25 µg/mL) to prepare standards.
- Prepare the working reagent by mixing 50:1 ratio of BCA kit reagent A with BCA kit reagent B.
- Mix 200 µL of working reagent and 30 µL of each BSA standard (prepared in the 1st step) and elution protein (obtained from purification).
- Incubate all samples at 37 °C for 30 min and measure the absorbance at 562 nm with SpectraMax M2e microplate reader.
- Do all the experiments in triplicate to calculate the mean values with standard deviation.
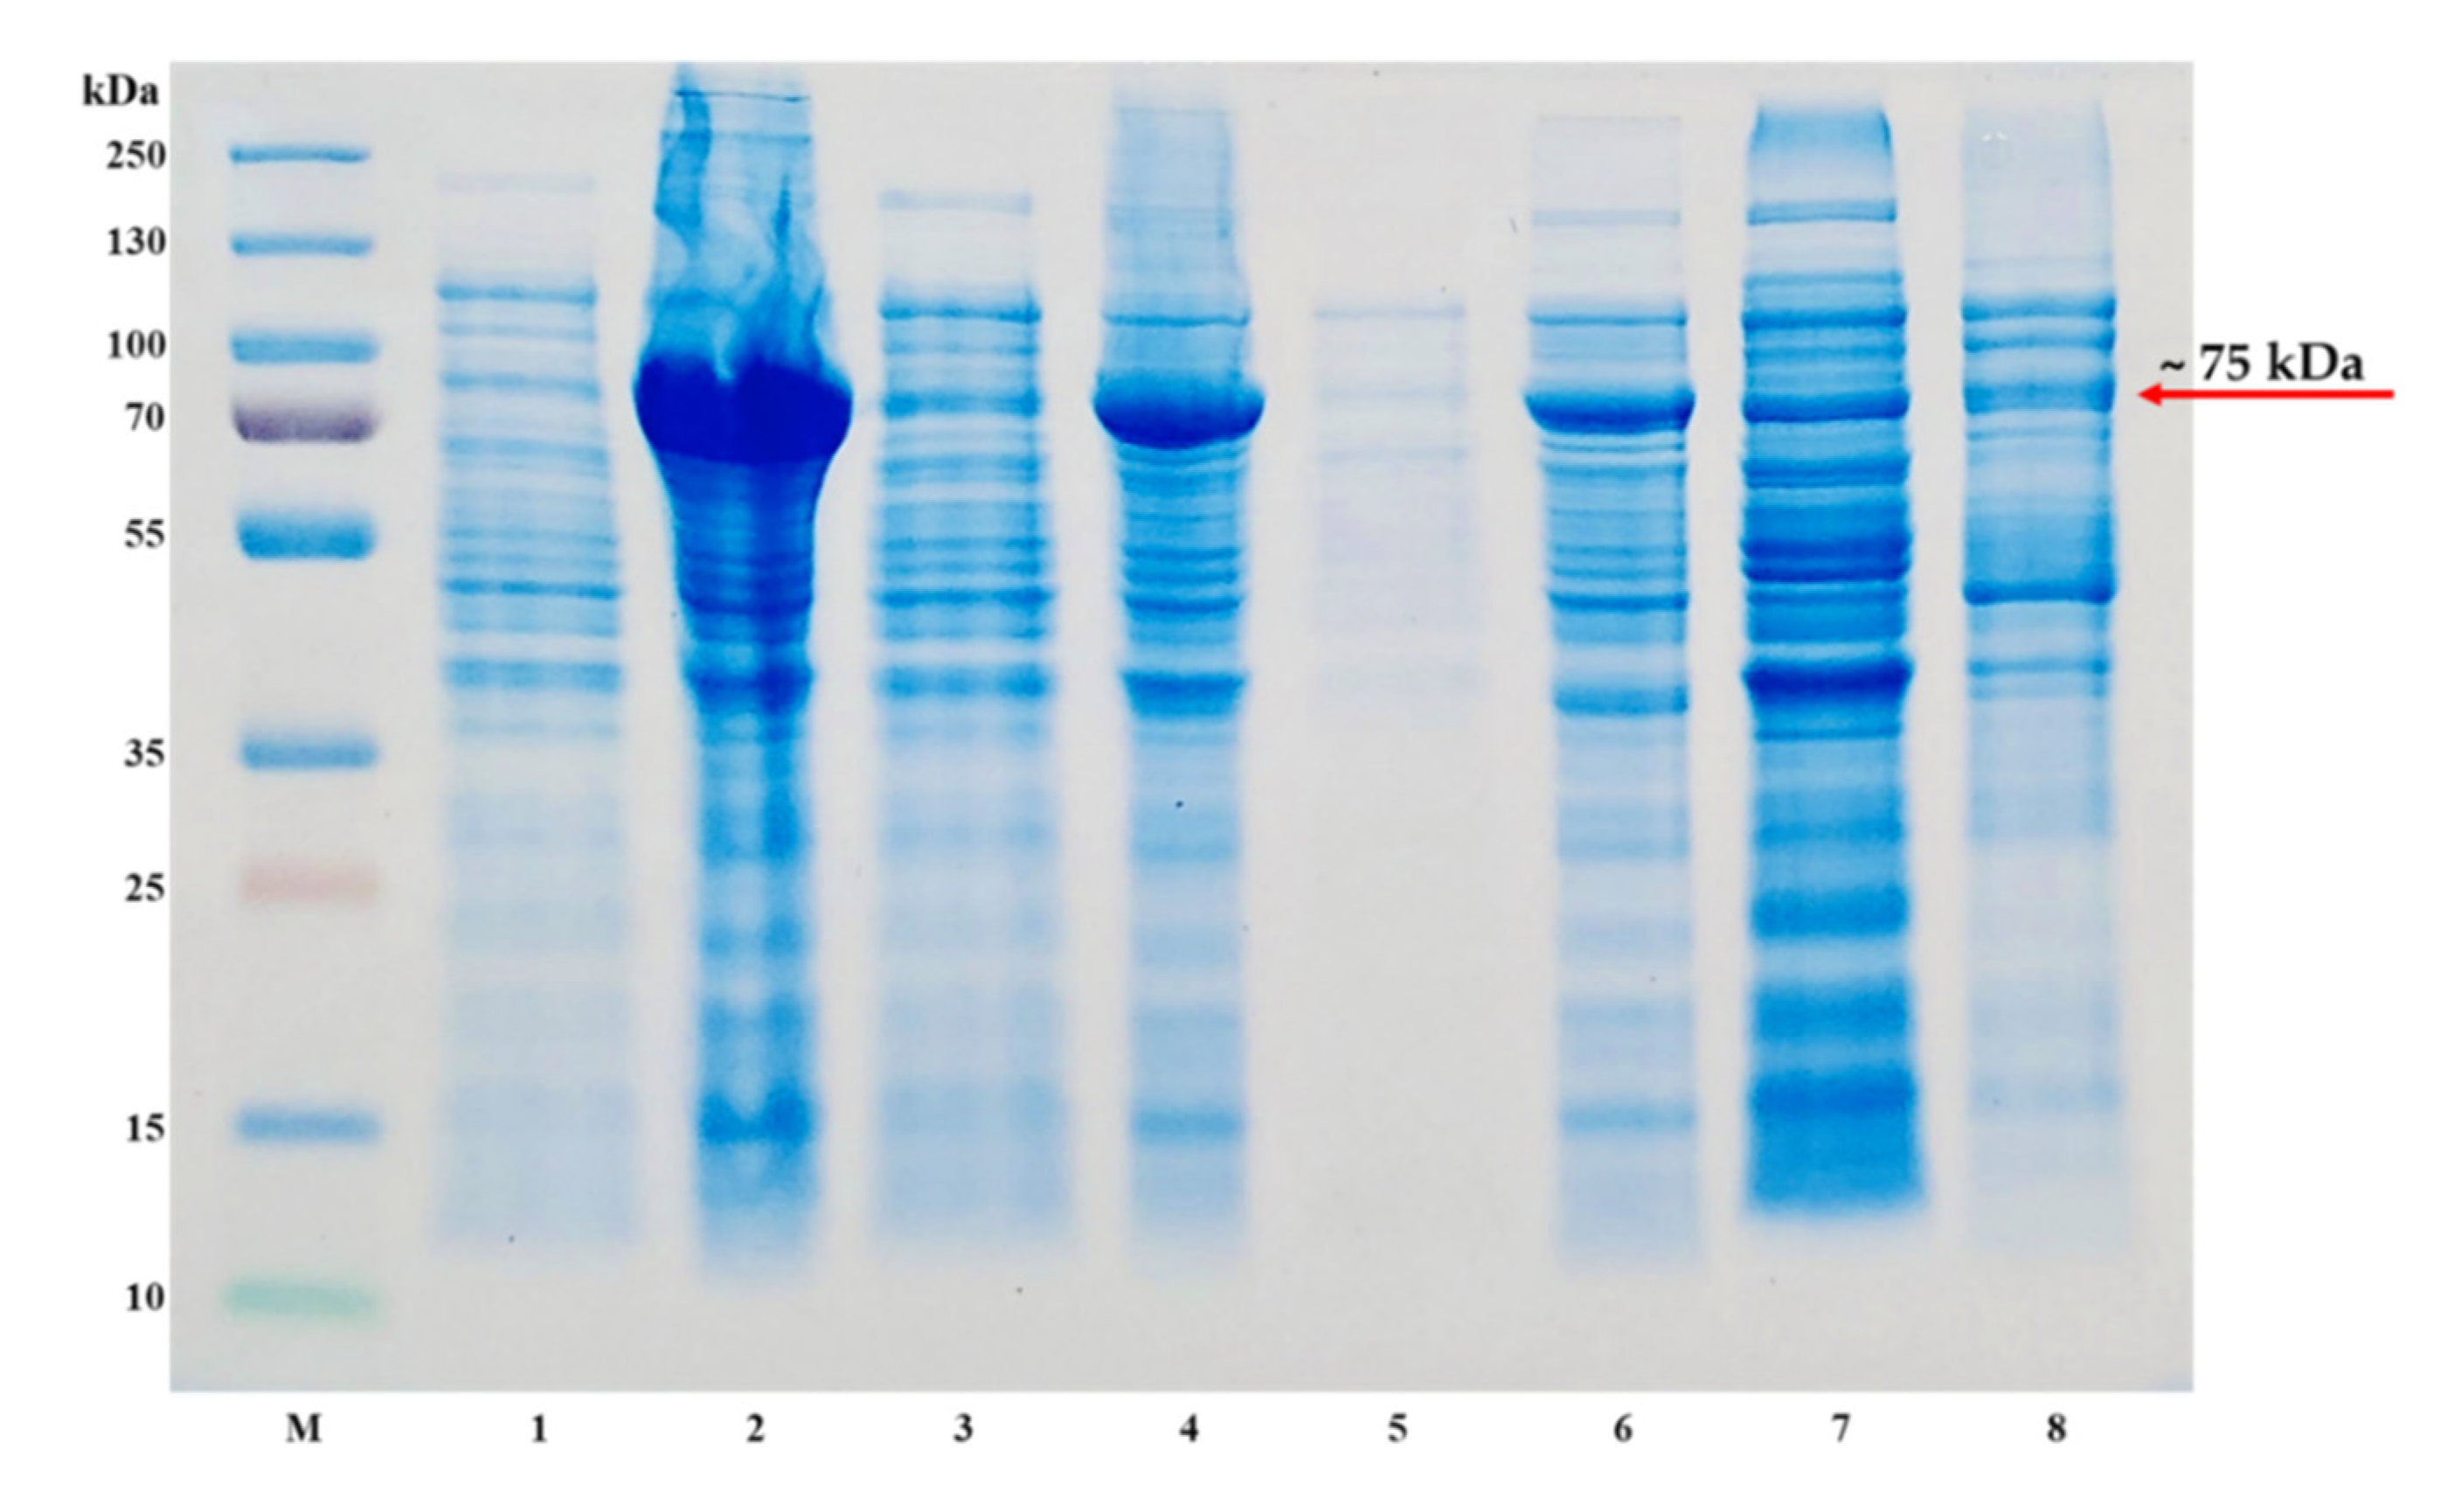
3.4.2. SDS-PAGE Analysis
- Characterize the TP-coreSA fusion protein along with soluble crude fraction with SDS-PAGE.
- Mix each sample with an equal amount of 2x Laemmli sample buffer containing 1% 2-mercaptoethanol and heat up to 80 °C for 10 min and briefly spin it down.
- Load 10 µL of protein ladder and 15 µL of each sample in 12% polyacrylamide gel using 1× Tris/glycine/SDS buffer and run for 40 min at 200 volts.
- Use the Rapid Coomassie11 blue stain to stain the gel and de-stain overnight with slow de-stained solution (7.5% methanol, 5% acetic acid).
3.4.3. Western Blot Analysis
- For Western blot, again perform the SDS-PAGE according to the aforementioned protocols, but instead of staining the gel, transfer to nitrocellulose membrane in Trans-Blot® semi-dry system.
- Block the membrane for 1 h using blocking buffer (5% BSA in TBST (Tris-buffered saline with 0.1% Tween-20)) at room temperature with constant gentle shaking.
- Wash 3 times with TBST buffer, then allow the membrane to react with streptavidin monoclonal antibody solution overnight at 4 °C.
CRITICAL STEP:Prepare the working solution of primary antibody by 1:1000 dilution of antibody stock in blocking buffer. The dilution factor can be changed and titered according to the results. The reaction time can be decreased to 1 h if shaking at room temperature.- 4.
- For the second Western blot, redo the 1st and 2nd step and use anti-TP (PD-ECGF) monoclonal antibody for the 3rd step.
- 5.
- Wash the membranes again 3 times to remove any excess of primary antibodies and incubate for 1 h at room temperature in secondary antibody solution (1:100 dilution of mouse IgG HRP-conjugated antibody in blocking buffer).
CRITICAL STEP:Although both streptavidin and TP (PD-ECGF) Western blots are recognized by the same secondary antibody, incubate the membranes separately in secondary antibody solution by preparing two working solution of secondary antibody.- 6.
- Finally, wash the membranes again and detect the fusion protein with horseradish peroxidase activity using ECL substrate by taking imaging through chemiluminescence imager.
3.4.4. TP-coreSA Enzyme Activity and Kinetics
- Mix 20 µL of eluted TP-coreSA protein in ice-cold 40 µL reaction mixture containing 10 mM 5′-DFUR and 25 mM potassium phosphate buffer (pH = 7.4).
- Measure the initial absorbance as a baseline at 305 nm with SpectraMax M2e microplate reader.
- Incubate the reaction mixture at 37 °C for 2 h and terminate the reaction by the addition of 500 mM sodium hydroxide.
- Measure the final absorbance at 305 nm, and then calculate the amount 5-fluorouracil (5-FU) produced using the calibration curve of 5-FU at 305 nm [14]. TP enzyme activity is expressed as the amount of 5-FU (µmole) produced per purified fusion protein (µg) per hour (µmole/µg/h).
- For enzyme kinetics, repeat all steps (from 1 to 4) with various concentrations of 5′-DFUR to react with TP-coreSA fusion protein for 2 h and obtain enzyme activities.
- Plot enzyme activities versus corresponding concentrations of 5′-DFUR.
- Use the Michaelis-Menten equation to do a curve fitting of the data points.
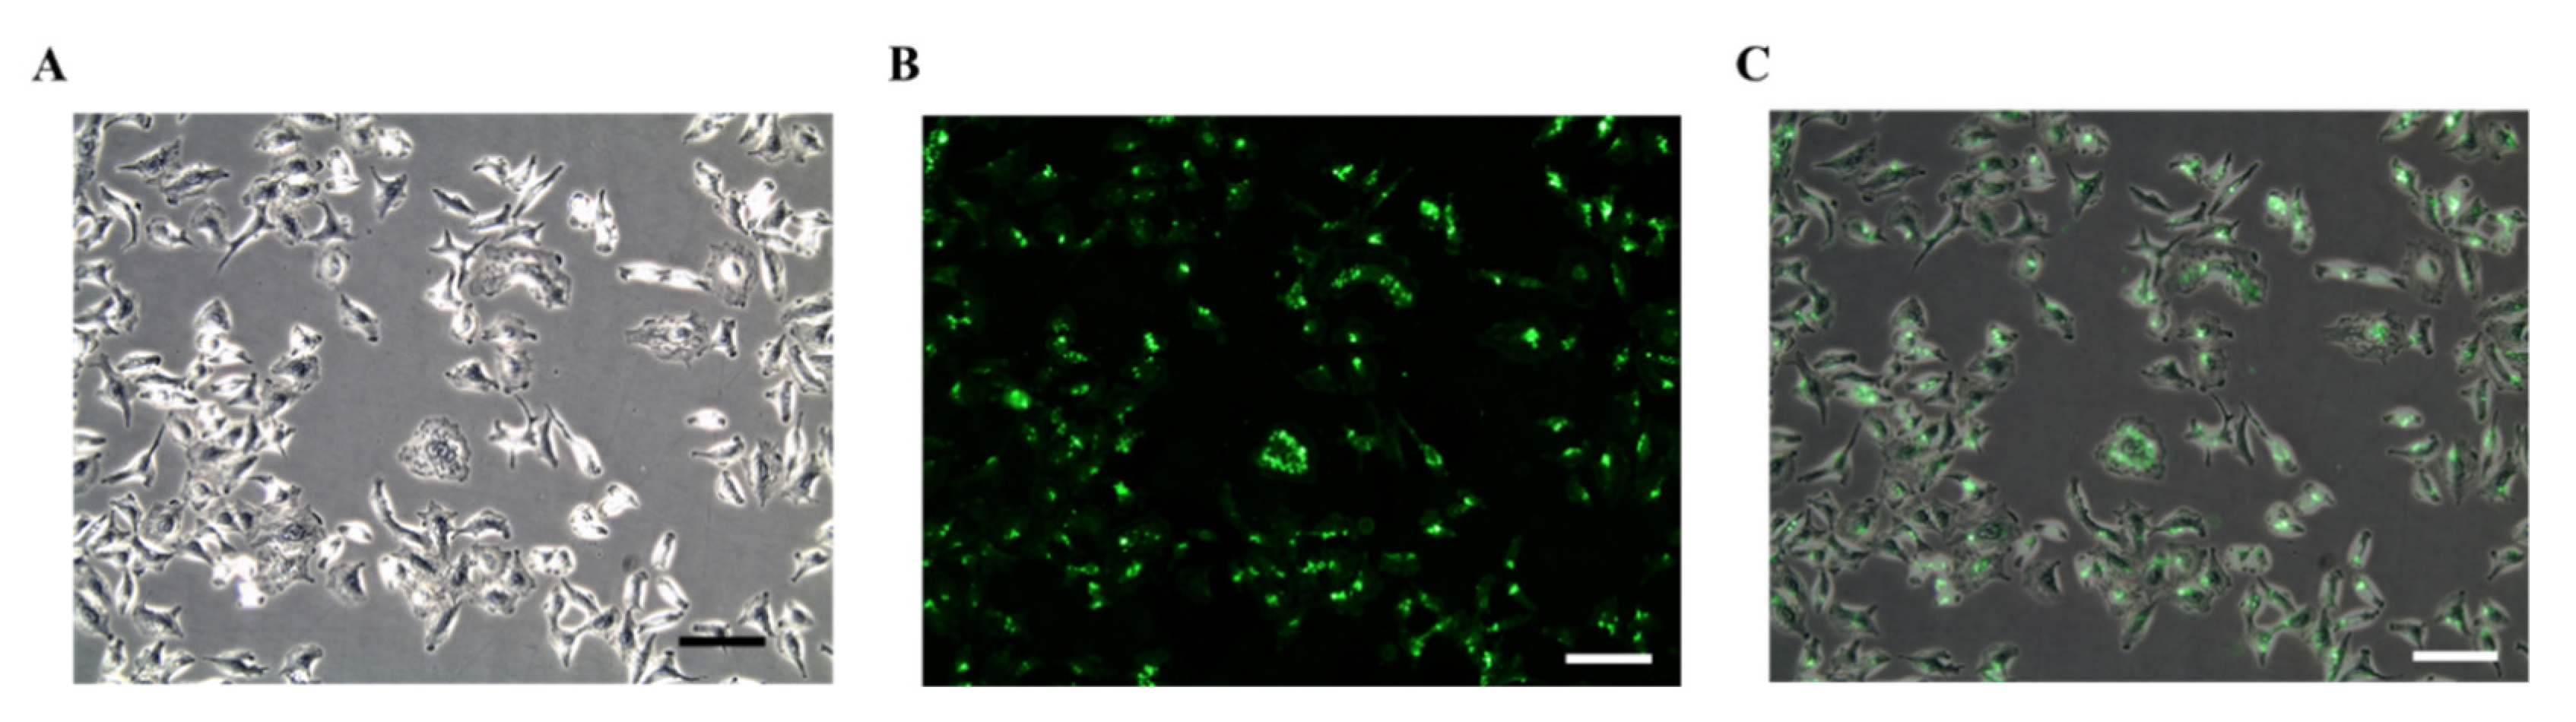
3.4.5. Surface Biotinylation of Cells
- Inoculate A549 cells in 6-well plates containing DMEM supplemented with 10% FBS and 1% penicillin-streptomycin, and cultivate in a 5% CO2 incubator balanced with humidifier air.
- Replace the culture media after 24 h with fresh media supplemented with 0.02 mg/mL Biotin-X DHPE and incubate for further 48 h.
- Confirm the surface biotinylation by incubating in SA-FITC for 1 h and let streptavidin bind with the biotinylated surface of cells.
- Gently wash the cells again with 1x PBS to discard any unbounded SA-FITC, and take the images with a Leica DMi8 microscope equipped with Leica EC3 digital color camera.
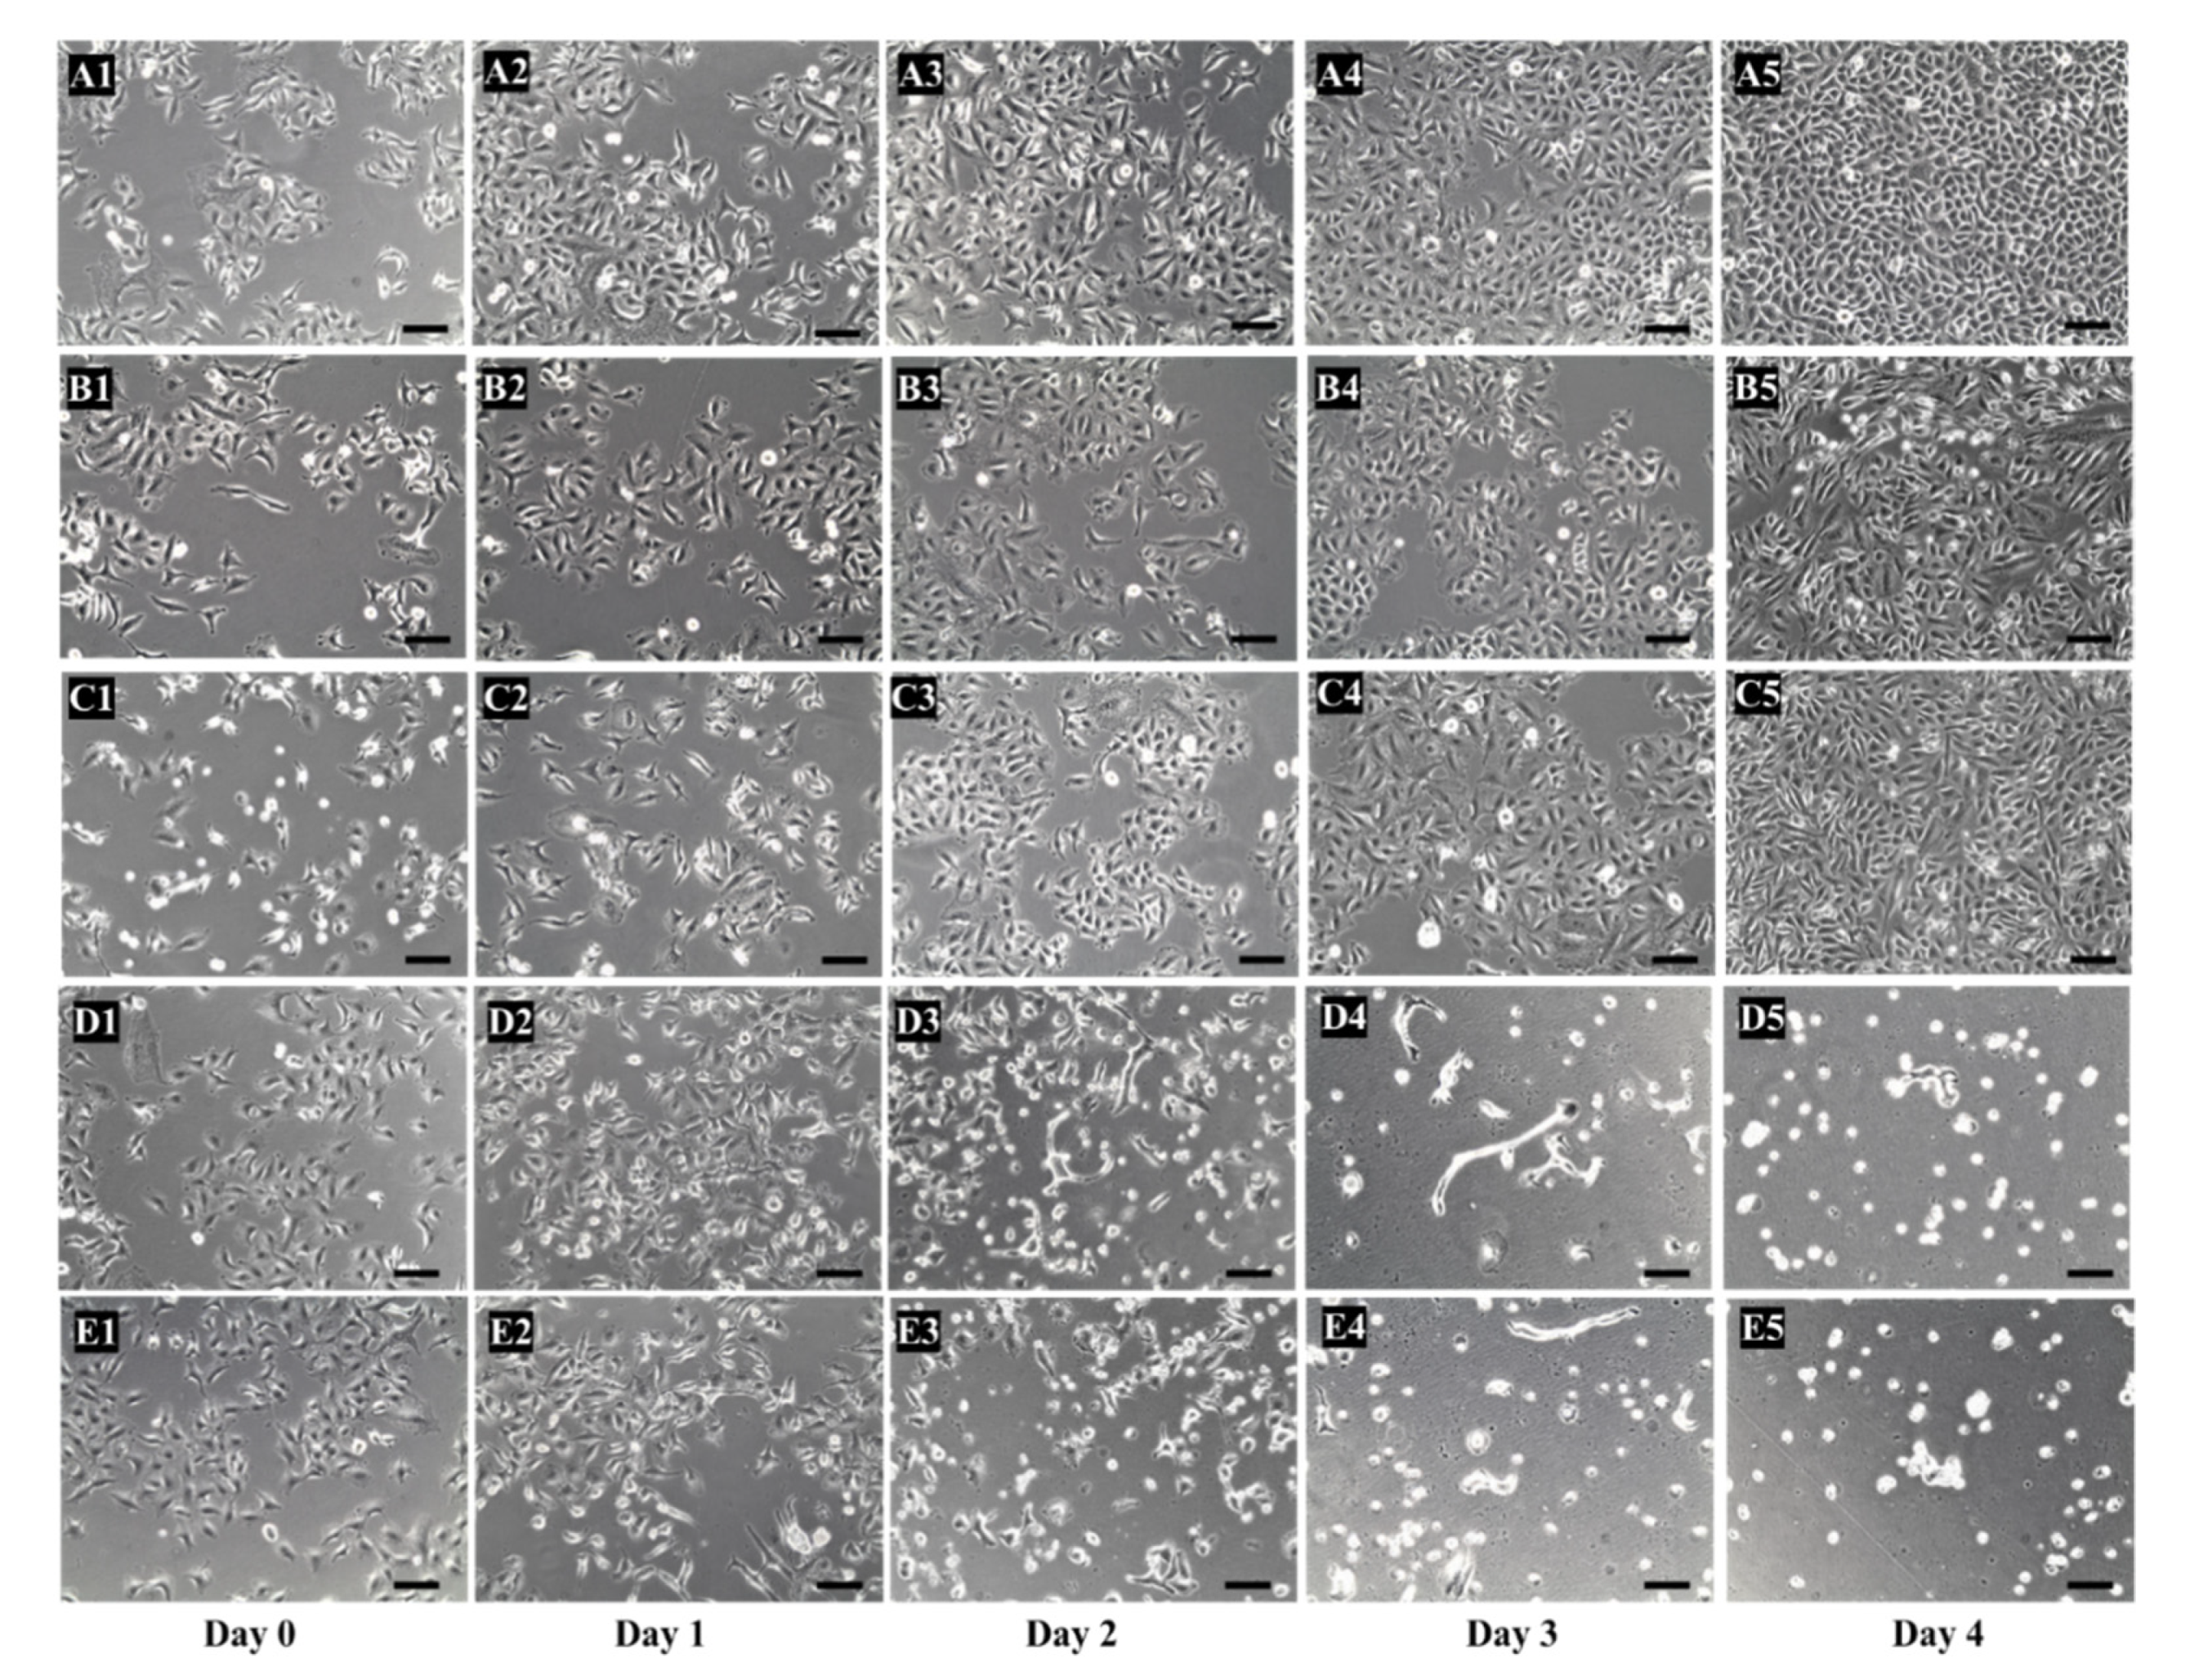
3.5. Cytotoxicity Studies
- Add 100 μL of TP-coreSA elution protein and incubate for 1 h to let it bind to the biotinylated A549 cells.
- Add 100 µM of 5′-DFUR into each well and incubate for 4 days.
- Culture positive and negative control experiment at the same time.
- Calculate the cell viability at the end of the experiment using trypan blue staining and hemocytometer.
CRITICAL STEP:Carry out the experiments in triplicate and calculate the percentage of cancer cell viability compared to the control groups.4. Results and Discussion
4.1. Expression of pET-30a(+)-TP-coreSA
4.2. Purification of TP-coreSA Fusion Protein
4.3. Characterization of TP-coreSA Fusion Protein
SDS-PAGE Analysis, Western Blot, TP-coreSA Enzyme Activity and Kinetics
4.4. Surface Biotinylation of A549 Cells
4.5. Cytotoxicity Studies
5. Conclusions
Author Contributions
Funding
Acknowledgments
Conflicts of Interest
References
- Rosano, G.L.; Ceccarelli, E.A. Recombinant protein expression in Escherichia coli: Advances and challenges. Front. Microbiol. 2014, 5, 172. [Google Scholar] [CrossRef] [PubMed] [Green Version]
- Arditti, R.; Scaife, J.G.; Beckwith, J.R. The nature of mutants in the lac promoter region. J. Mol. Biol. 1968, 38, 421–426. [Google Scholar] [CrossRef]
- Studier, F.W.; Rosenberg, A.H.; Dunn, J.J.; Dubendorff, J.W. Use of T7 RNA polymerase to direct expression of cloned genes. Heterotrimeric G-Protein Eff. 1990, 185, 60–89. [Google Scholar] [CrossRef]
- Walsh, M.K.; Swaisgood, H.E. AnEscherichia coli plasmid vector system for production of streptavidin fusion proteins: Expression and bioselective adsorption of streptavidin-?-galactosidase. Biotechnol. Bioeng. 1994, 44, 1348–1354. [Google Scholar] [CrossRef] [PubMed]
- Lee, P.; Swaisgood, H. Cloning and expression of a streptavidin-lipase fusion gene in Escherichia coli and characterization of the immobilized fusion protein. Enzym. Microb. Technol. 1998, 22, 246–254. [Google Scholar] [CrossRef]
- Goshorn, S.; Sanderson, J.; Axworthy, D.; Lin, Y.; Hylarides, M.; Schultz, J. Preclinical Evaluation of a Humanized NR-LU-10 Antibody-Streptavidin Fusion Protein for Pretargeted Cancer Therapy. Cancer Biother. Radiopharm. 2001, 16, 109–123. [Google Scholar] [CrossRef] [PubMed]
- Pandori, M.W.; Sano, T.; Chen, X.; Smith, C.L.; Cantor, C.R. Recombinant Core Streptavidins: A Minimum-Sized Core Streptavidin Has Enhanced Structural Stability and Higher Accessibility to Biotinylated Macromolecules. J. Biol. Chem. 1995, 270, 28204–28209. [Google Scholar] [CrossRef] [Green Version]
- Dübel, S.; Breitling, F.; Kontermann, R.; Schmidt, T.; Skerra, A.; Little, M. Bifunctional and multimeric complexes of streptavidin fused to single chain antibodies (scFv). J. Immunol. Methods 1995, 178, 201–209. [Google Scholar] [CrossRef]
- Wang, W.W.-S.; Das, D.; McQuarrie, S.A.; Suresh, M.R. Design of a bifunctional fusion protein for ovarian cancer drug delivery: Single-chain anti-CA125 core-streptavidin fusion protein. Eur. J. Pharm. Biopharm. 2007, 65, 398–405. [Google Scholar] [CrossRef]
- Hsu, Y.-C.; Acuña, M.; Tahara, S.M.; Peng, C.-A. Reduced phagocytosis of colloidal carriers using soluble CD47. Pharm. Res. 2003, 20, 1539–1542. [Google Scholar] [CrossRef]
- Salehi, N.; Peng, C.-A. Purification of CD47-streptavidin fusion protein from bacterial lysate using biotin-agarose affinity chromatography. Biotechnol. Prog. 2016, 32, 949–958. [Google Scholar] [CrossRef]
- Singh, A.; Upadhyay, V.; Upadhyay, A.K.; Singh, S.M.; Panda, A.K. Protein recovery from inclusion bodies of Escherichia coli using mild solubilization process. Microb. Cell Factories 2015, 14, 1–10. [Google Scholar] [CrossRef] [PubMed] [Green Version]
- Drew, D.; Fröderberg, L.; Baars, L.; De Gier, J.W. Assembly and overexpression of membrane proteins in Escherichia coli. Biochim. Biophys. Acta (BBA) Biomembr. 2003, 1610, 3–10. [Google Scholar] [CrossRef] [Green Version]
- Patterson, A.; Zhang, H.; Moghaddam, A.; Bicknell, R.; Talbot, D.; Stratford, I.J.; Harris, A.L.; Patterson, A.V. Increased sensitivity to the prodrug 5′-deoxy-5-fluorouridine and modulation of 5-fluoro-2′-deoxyuridine sensitivity in MCF-7 cells transfected with thymidine phosphorylase. Br. J. Cancer 1995, 72, 669–675. [Google Scholar] [CrossRef] [Green Version]
- Wagner, S.; Klepsch, M.M.; Schlegel, S.; Appel, A.; Draheim, R.; Tarry, M.; Högbom, M.; Van Wijk, K.J.; Slotboom, D.J.; Persson, J.O.; et al. Tuning Escherichia coli for membrane protein overexpression. In Proceedings of the Proceedings of the National Academy of Sciences. Proc. Natl. Acad. Sci. USA 2008, 105, 14371–14376. [Google Scholar] [CrossRef] [Green Version]
- Sawdon, A.J.; Zhang, J.; Wang, X.; Peng, C.-A. Enhanced Anticancer Activity of 5′-DFUR-PCL-MPEG Polymeric Prodrug Micelles Encapsulating Chemotherapeutic Drugs. Nanomaterials 2018, 8, 1041. [Google Scholar] [CrossRef] [Green Version]
- Miyadera, K.; Sumizawa, T.; Haraguchi, M.; Yoshida, H.; Konstanty, W.; Yamada, Y.; Akiyama, S.-I. Role of thymidine phosphorylase activity in the angiogenic effect of platelet derived endothelial cell growth factor/thymidine phosphorylase. Cancer Res. 1995, 55, 1687–1690. [Google Scholar] [PubMed]
- Evrard, A.; Cuq, P.; Ciccolini, J.; Vian, L.; Cano, J.-P. Increased cytotoxicity and bystander effect of 5-fluorouracil and 5′-deoxy-5-fluorouridine in human colorectal cancer cells transfected with thymidine phosphorylase. Br. J. Cancer 1999, 80, 1726–1733. [Google Scholar] [CrossRef] [PubMed] [Green Version]
- López-Estévez, S.; Ferrer, G.; Torres-Torronteras, J.; Mansilla, M.J.; Casacuberta-Serra, S.; Martorell, L.; Hirano, M.; Martí, R.; Barquinero, J. Thymidine phosphorylase is both a therapeutic and a suicide gene in a murine model of mitochondrial neurogastrointestinal encephalomyopathy. Gene Ther. 2014, 21, 673–681. [Google Scholar] [CrossRef]
- Lettieri, R.; D’Abramo, M.; Stella, L.; La Bella, A.; Leonelli, F.; Giansanti, L.; Venanzi, M.; Gatto, E. Fluorescence and computational studies of thymidine phosphorylase affinity toward lipidated 5-FU derivatives. Spectrochim. Acta Part A Mol. Biomol. Spectrosc. 2018, 195, 84–94. [Google Scholar] [CrossRef]
- Tsuneyoshi, K.; Haraguchi, M.; Hongye, Z.; Gotanda, T.; Tachiwada, T.; Sumizawa, T.; Furukawa, T.; Baba, M.; Akiyama, S.-I.; Nakagawa, M. Induction of thymidine phosphorylase expression by AZT contributes to enhancement of 5′-DFUR cytotoxicity. Cancer Lett. 2006, 244, 239–246. [Google Scholar] [CrossRef] [PubMed]
- Ishikawa, T.; Utoh, M.; Sawada, N.; Nishida, M.; Fukase, Y.; Sekiguchi, F.; Ishitsuka, H. Tumor selective delivery of 5-fluorouracil by capecitabine, a new oral fluoropyrimidine carbamate, in human cancer xenografts. Biochem. Pharmacol. 1998, 55, 1091–1097. [Google Scholar] [CrossRef]


Publisher’s Note: MDPI stays neutral with regard to jurisdictional claims in published maps and institutional affiliations. |
© 2020 by the authors. Licensee MDPI, Basel, Switzerland. This article is an open access article distributed under the terms and conditions of the Creative Commons Attribution (CC BY) license (http://creativecommons.org/licenses/by/4.0/).
Share and Cite
Tarar, A.; Alyami, E.M.; Peng, C.-A. Efficient Expression of Soluble Recombinant Protein Fused with Core-Streptavidin in Bacterial Strain with T7 Expression System. Methods Protoc. 2020, 3, 82. https://0-doi-org.brum.beds.ac.uk/10.3390/mps3040082
Tarar A, Alyami EM, Peng C-A. Efficient Expression of Soluble Recombinant Protein Fused with Core-Streptavidin in Bacterial Strain with T7 Expression System. Methods and Protocols. 2020; 3(4):82. https://0-doi-org.brum.beds.ac.uk/10.3390/mps3040082
Chicago/Turabian StyleTarar, Ammar, Esmael M. Alyami, and Ching-An Peng. 2020. "Efficient Expression of Soluble Recombinant Protein Fused with Core-Streptavidin in Bacterial Strain with T7 Expression System" Methods and Protocols 3, no. 4: 82. https://0-doi-org.brum.beds.ac.uk/10.3390/mps3040082