
Effect of Using Different Chemical Dispersing Agents in Grain Size Analyses of Fluvial Sediments via Laser Diffraction Spectrometry

 , , ,
, , ,
Abstract
:1. Introduction
2. Materials and Methods
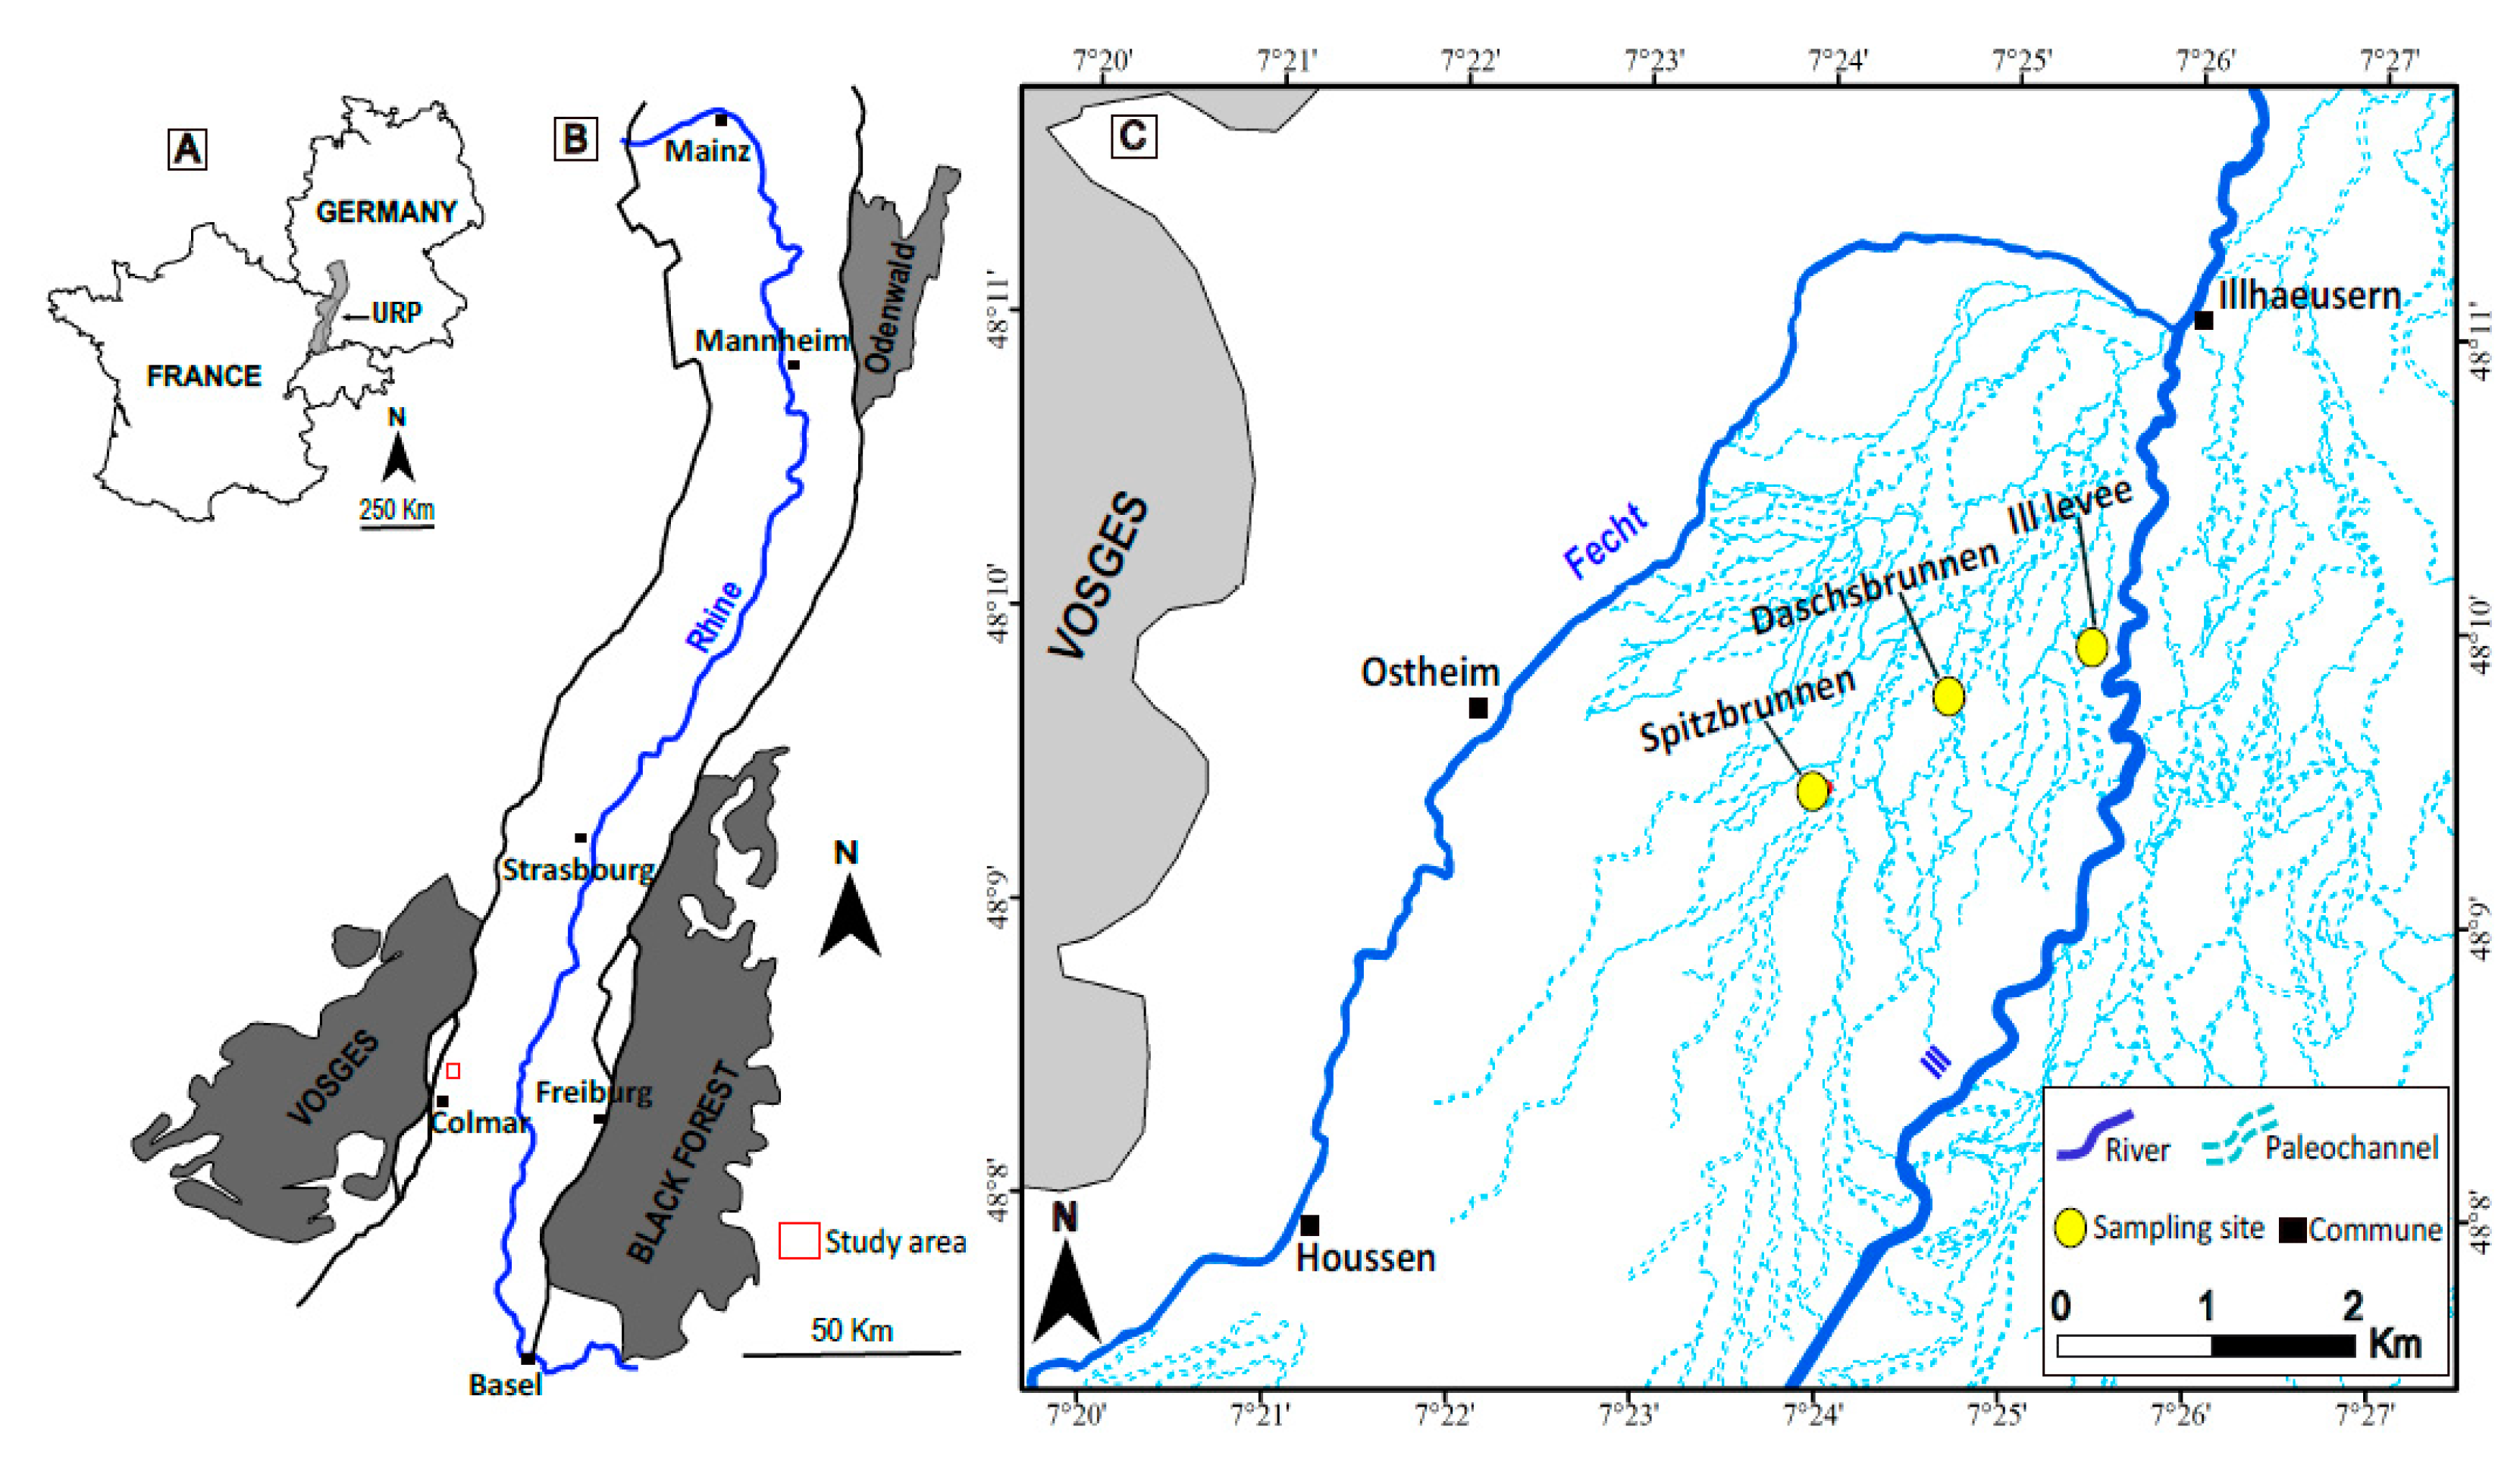
2.1. Samples
2.2. Sample Preparation
2.2.1. Experiment 1
2.2.2. Experiment 2
2.3. Measurement Equipment and Protocols
3. Results
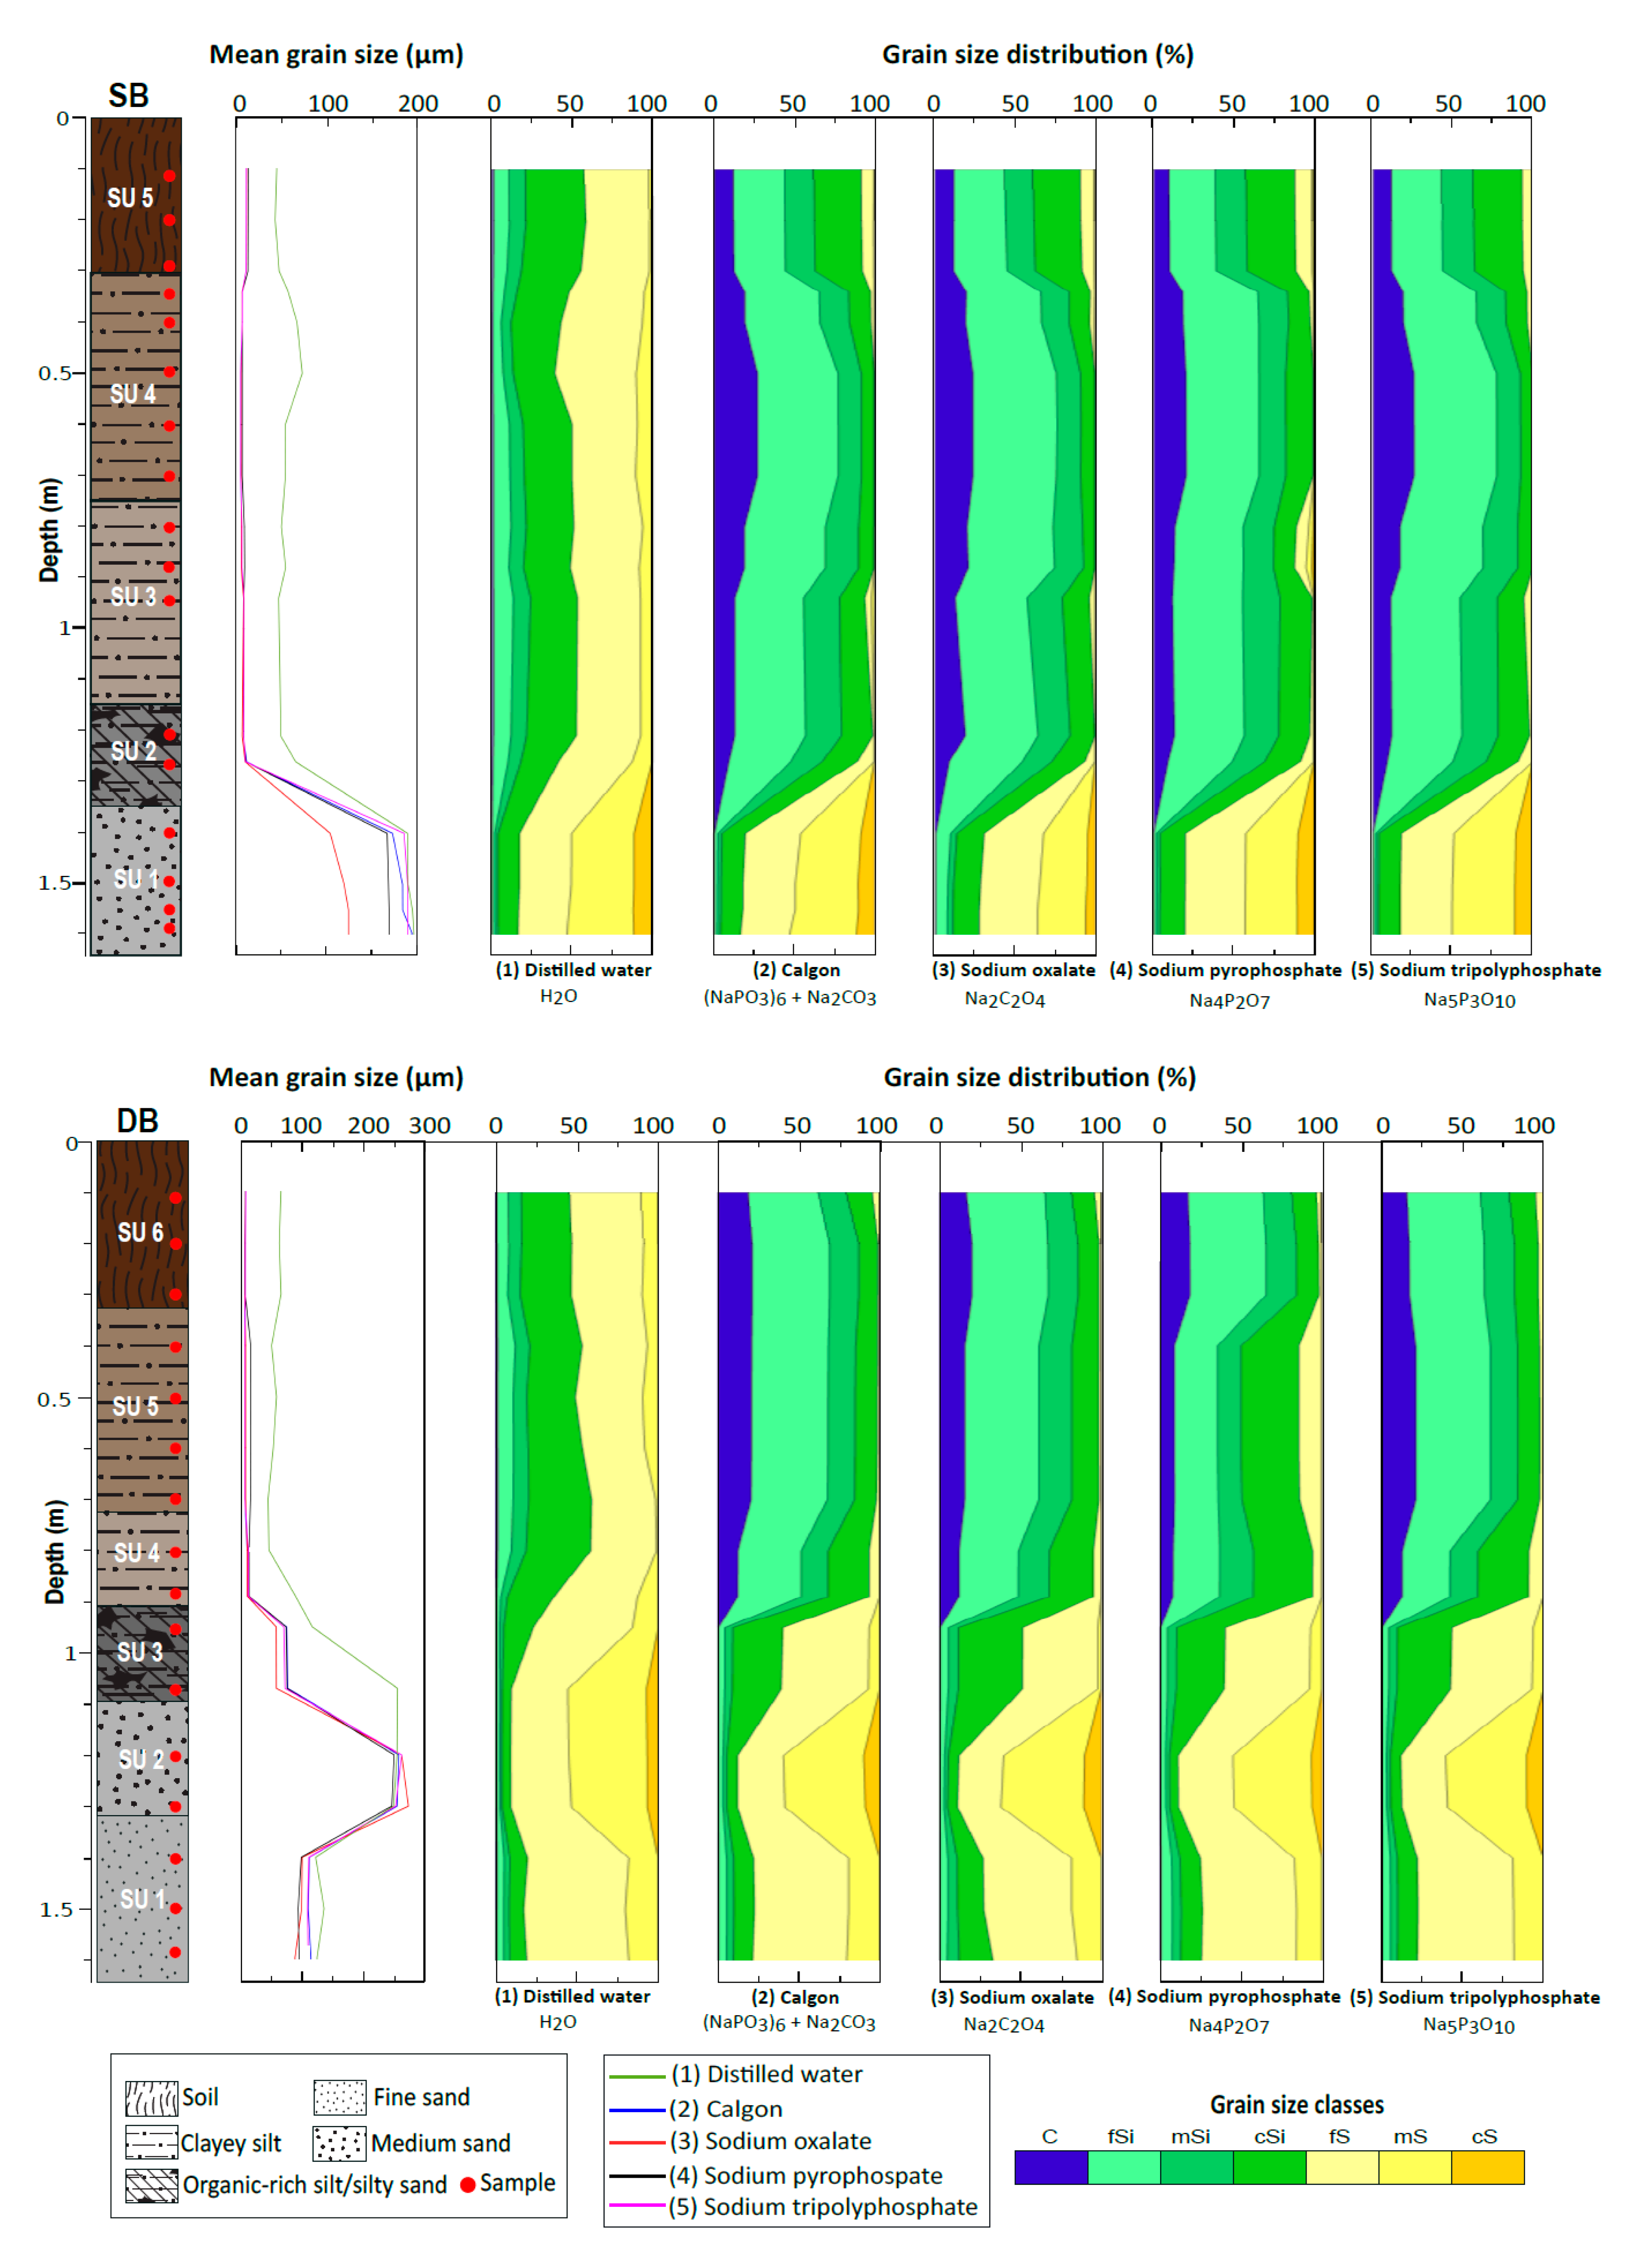
3.1. Experiment 1
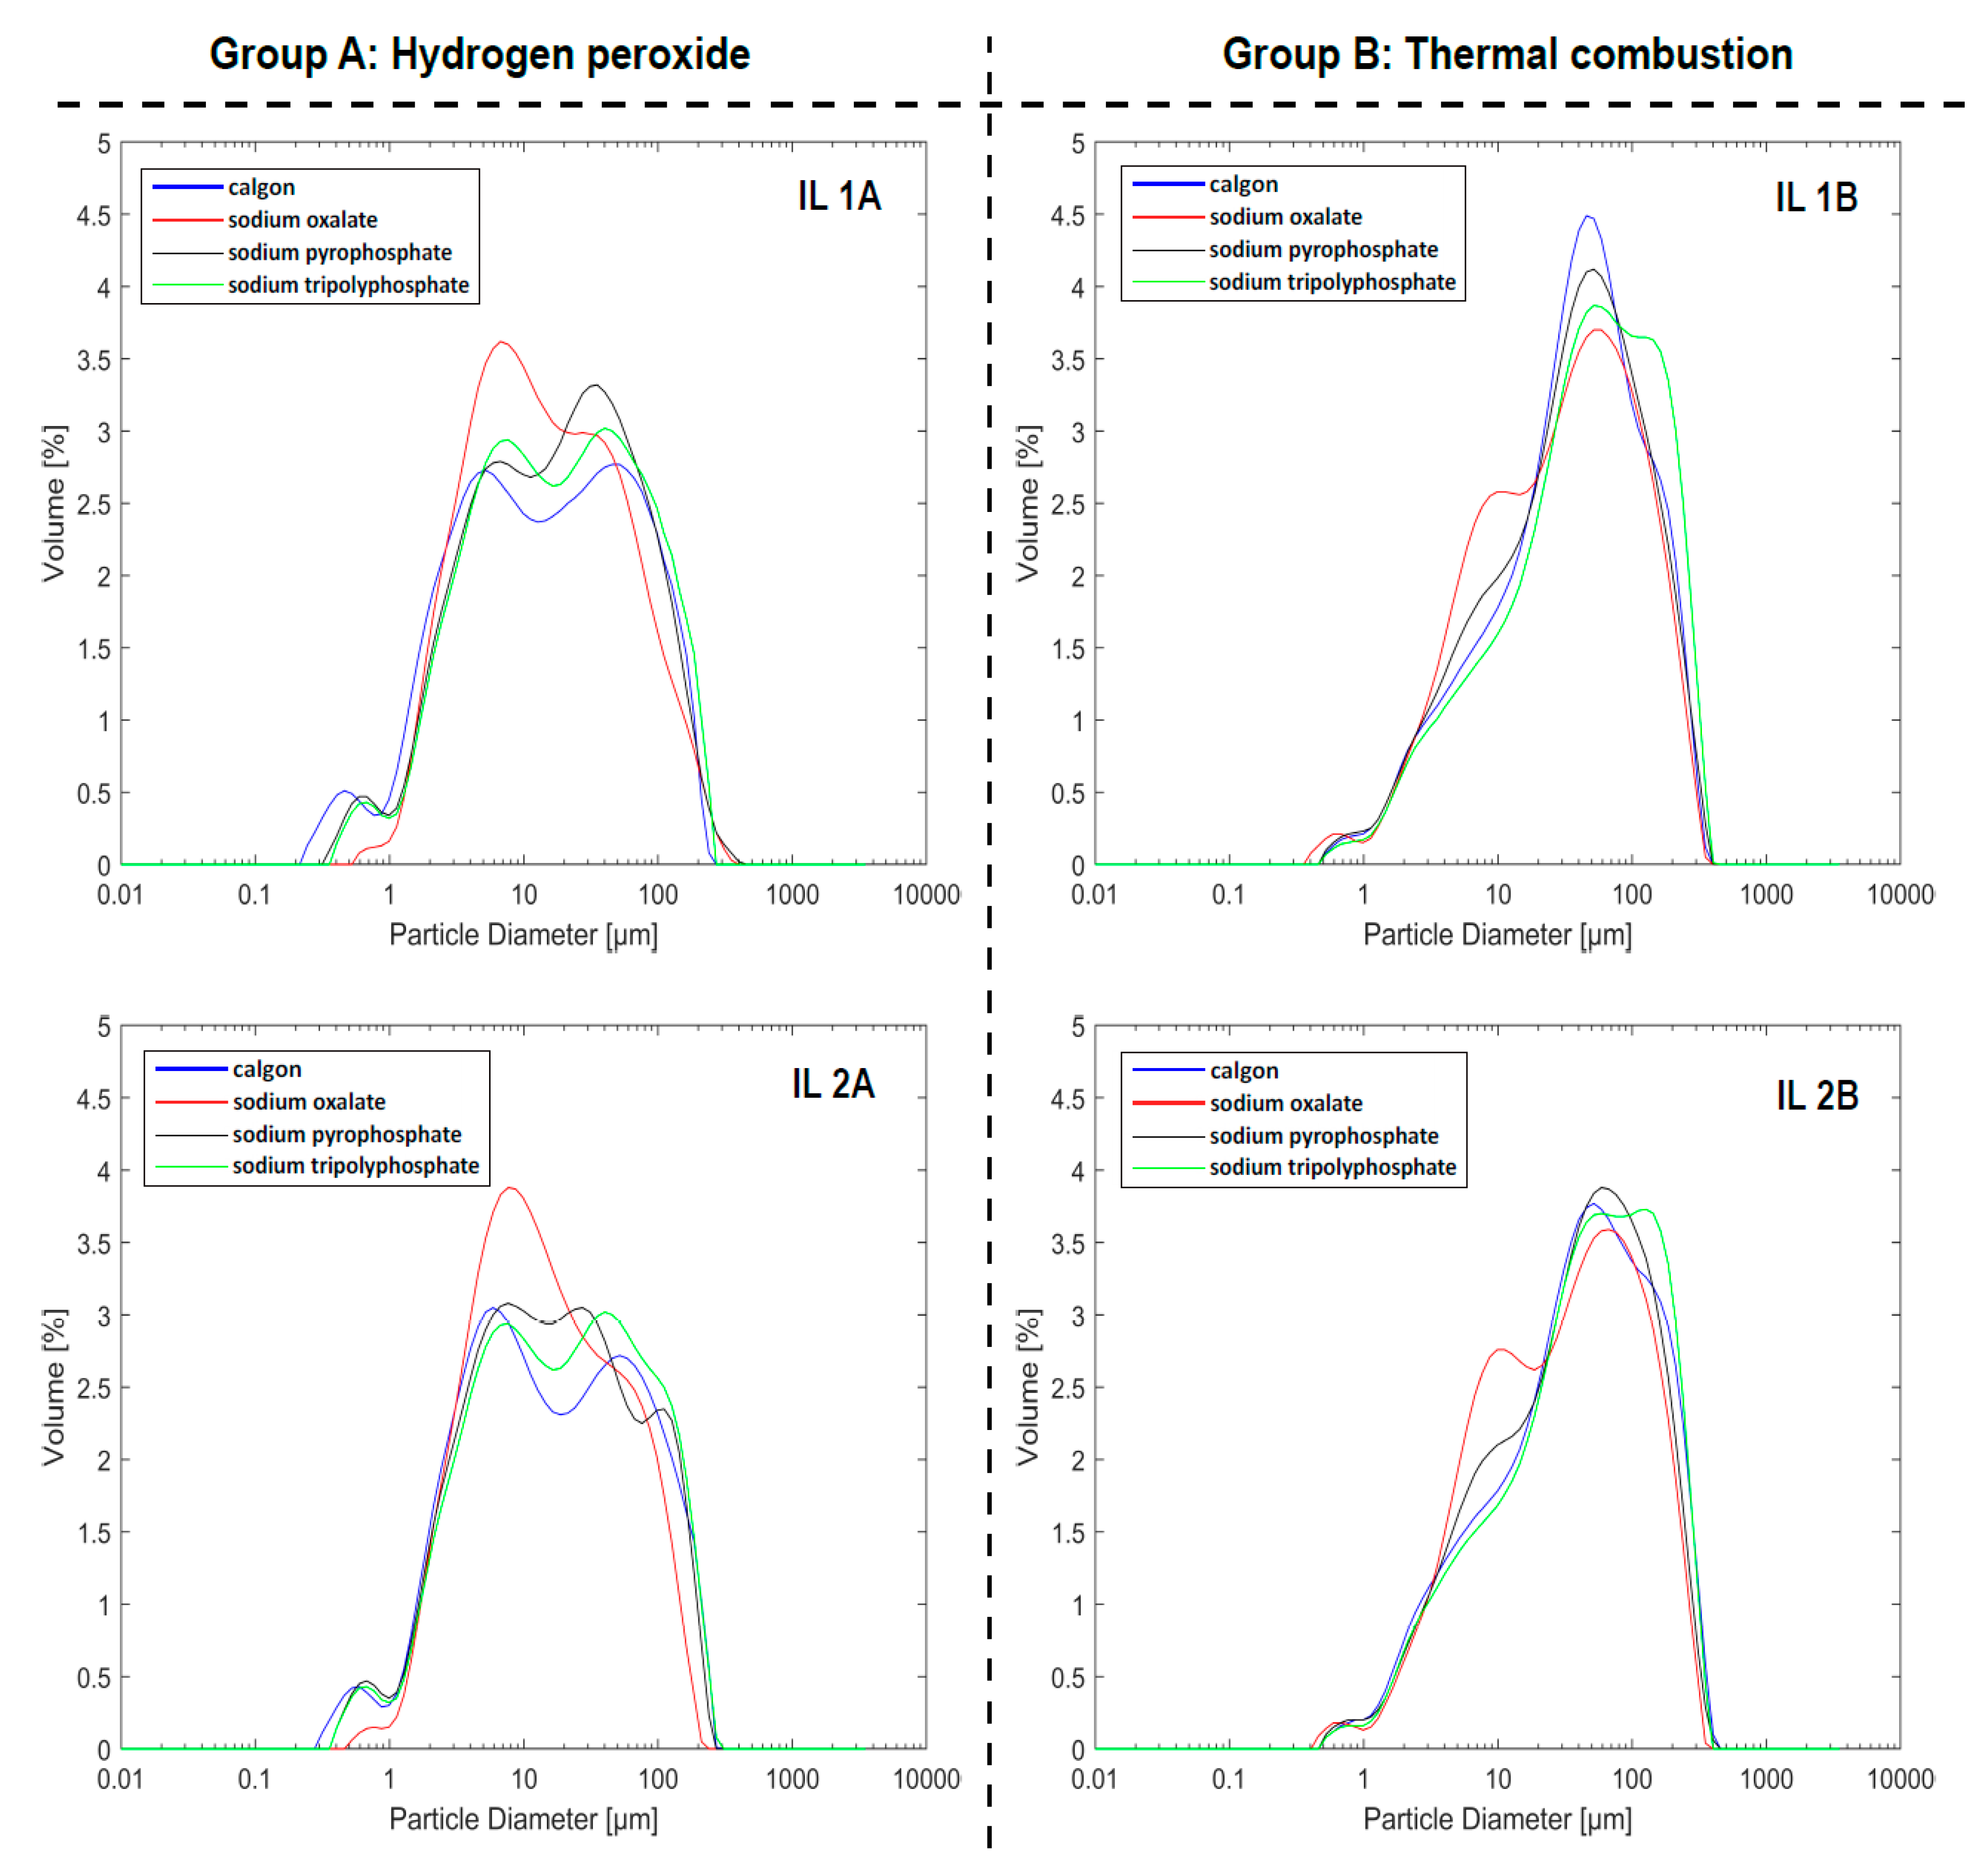
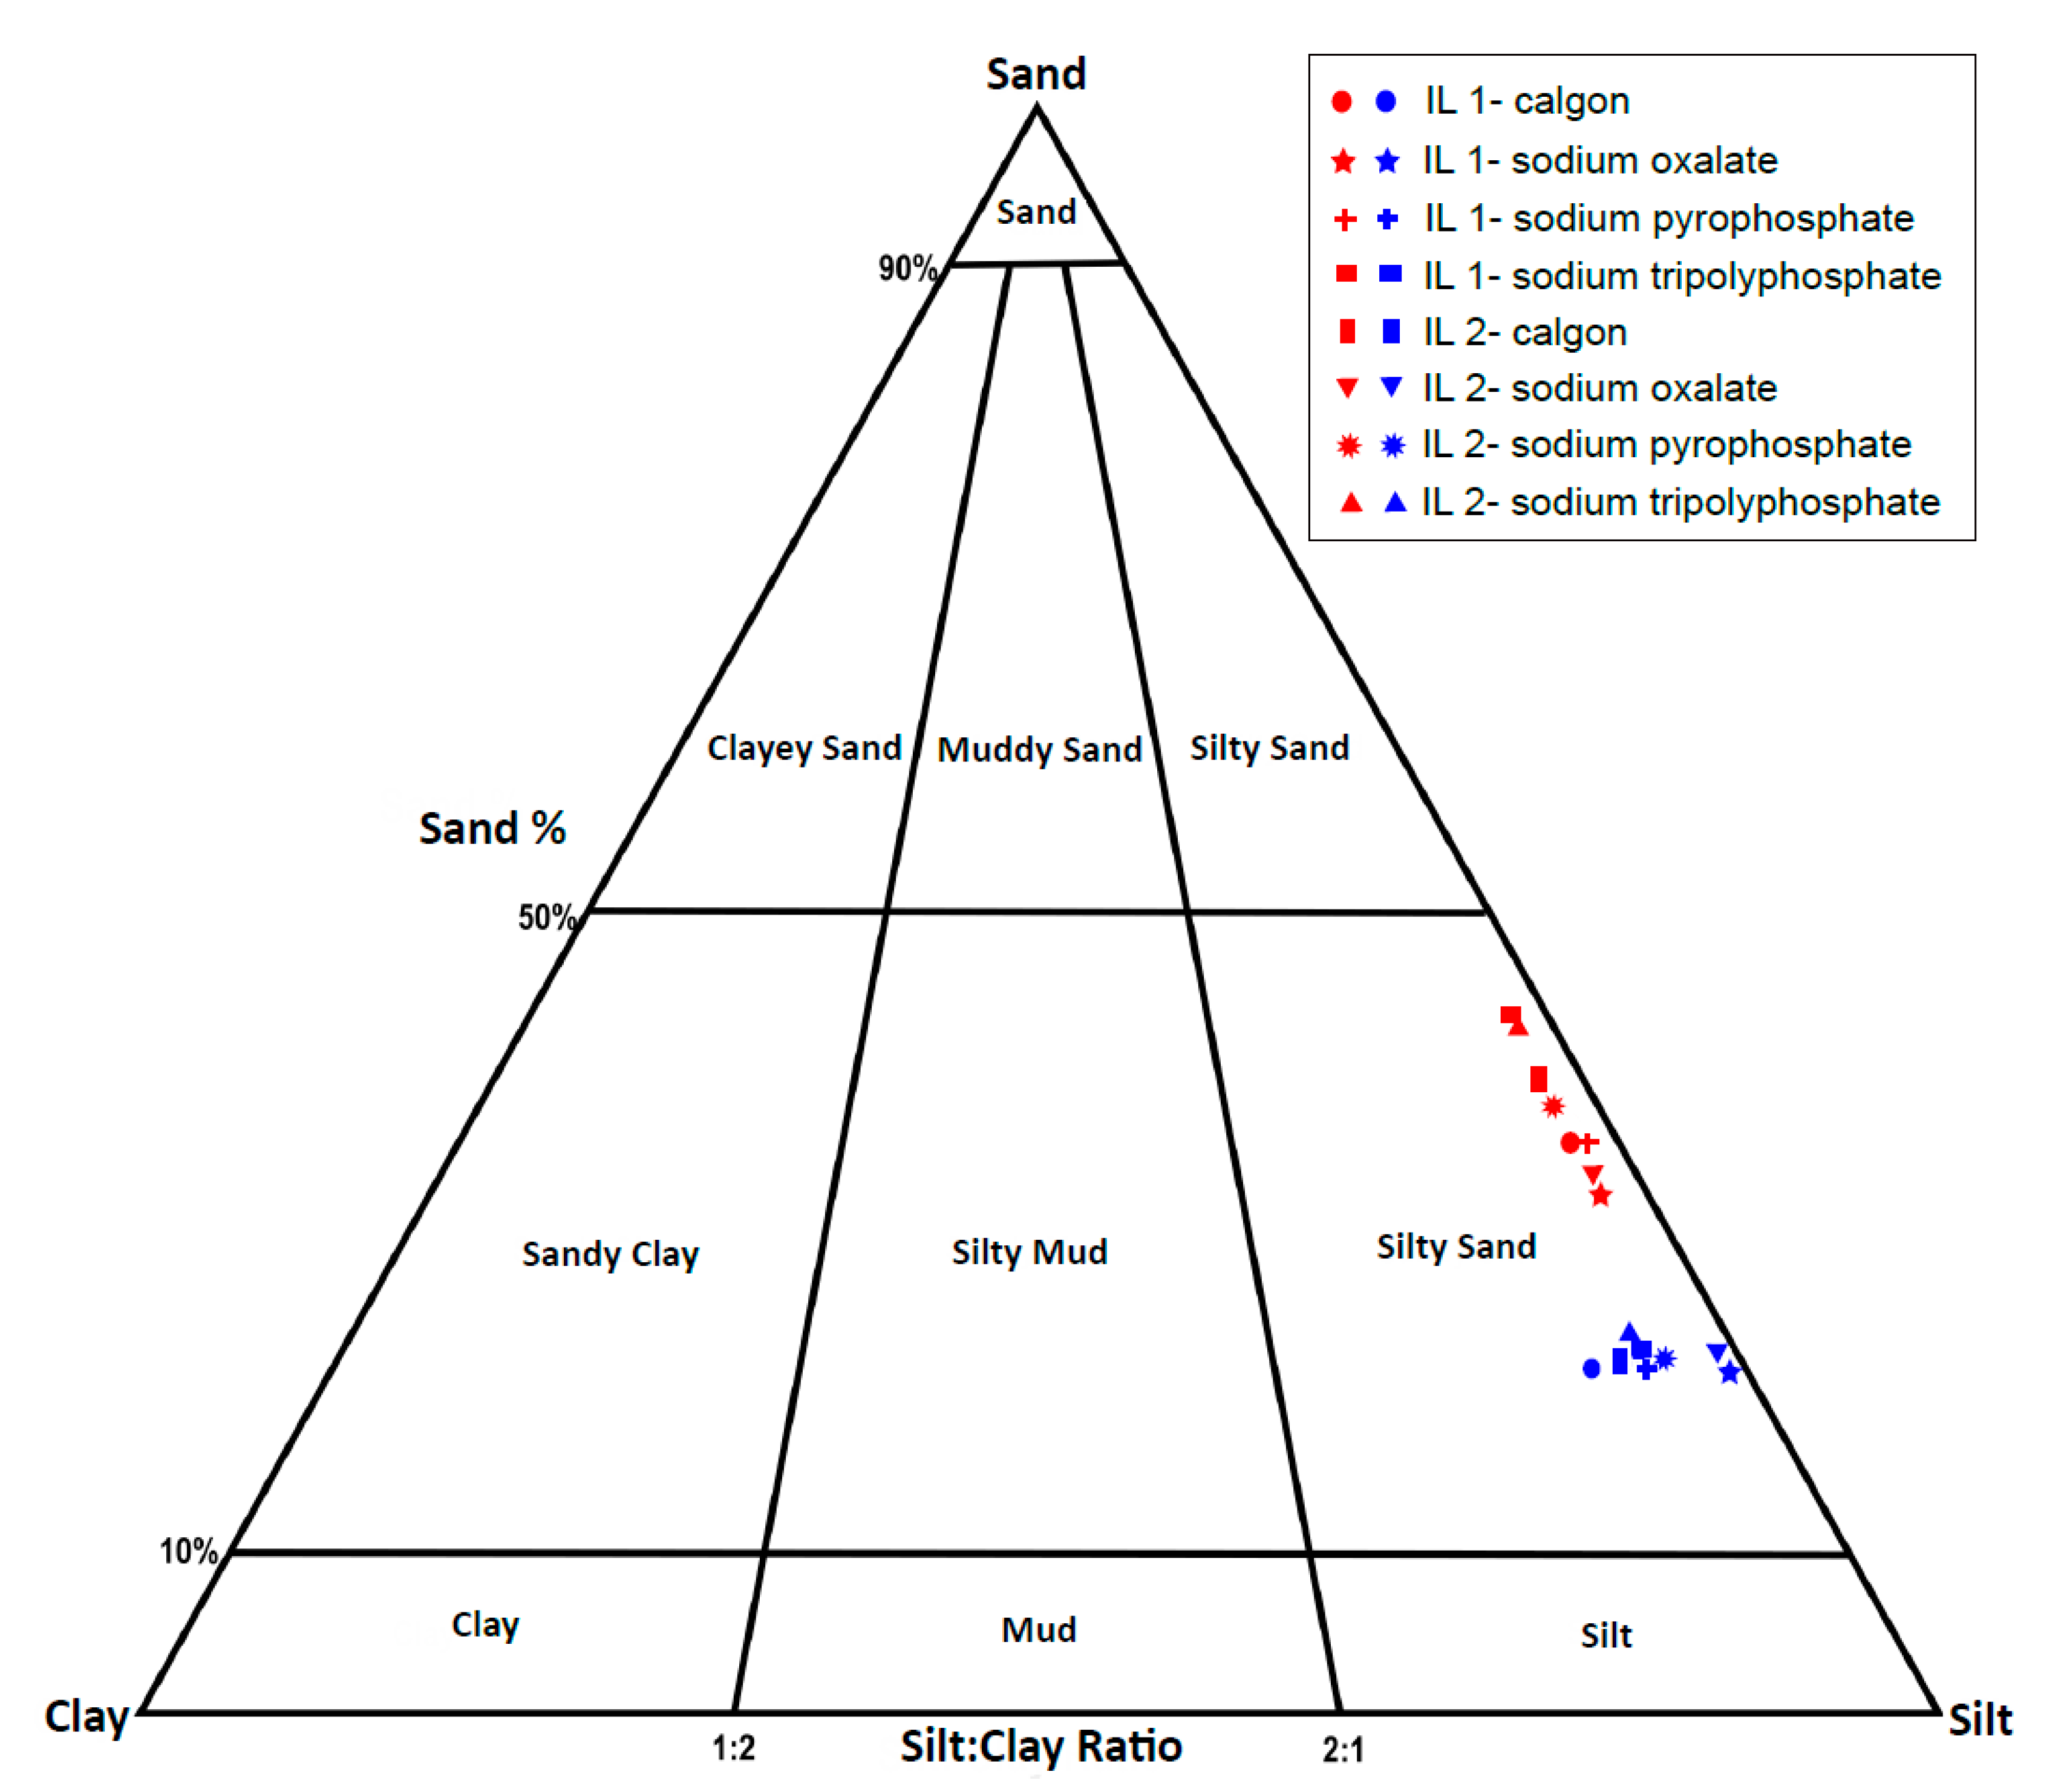
3.2. Experiment 2
4. Discussion
4.1. Effectiveness of Dispersing Agents
4.2. Effect of Thermal Combustion on Dispersing Agent Performance
5. Conclusions
- Calgon (sodium hexametaphosphate + sodium carbonate) is the most effective dispersing agent, yielding the highest clay content.
- Sodium tripolyphosphate shows almost equal effectiveness to Calgon, albeit with small differences.
- Sodium oxalate shows similar results but will potentially lead to an increase in silt-sized particles, due to the formation of precipitates.
- Sodium pyrophosphate is the least effective of the four dispersing agents.
- Thermal combustion of sediments promotes aggregate formation, and chemical dispersants are relatively ineffective for dispersing such aggregates.
- Thermal combustion should be avoided as a pretreatment method for the determination of grain size distribution.
- The pretreatments were carried out on Quaternary fluvial sediments from the Upper Rhine Plain, but the results may also be applicable to sediments from similar depositional environments.
Supplementary Materials
Author Contributions
Funding
Institutional Review Board Statement
Informed Consent Statement
Data Availability Statement
Conflicts of Interest
References
- Pye, K.; Blott, S. Particle size analysis of sediments, soils and related particulate materials for forensic purposes using laser granulometry. Forensic Sci. Int. 2004, 144, 19–27. [Google Scholar] [CrossRef] [PubMed]
- Friedman, G.M.; Sanders, J.E. Principles of Sedimentology; Wiley: New York, NY, USA, 1978. [Google Scholar]
- Folk, R.L.; Ward, W.C. Brazos River bar [Texas]; a study in the significance of grain size parameters. J. Sediment. Res. 1957, 27, 3–26. [Google Scholar] [CrossRef]
- Visher, G.S. Grain Size Distributions and Depositional Processes. J. Sediment. Res. 1969, 39, 1074–1106. [Google Scholar] [CrossRef]
- McLaren, D.B.P. The Effects of Sediment Transport on Grain-Size Distributions. J. Sediment. Res. 1985, 55, 457–470. [Google Scholar] [CrossRef]
- Xu, J. Grain-size characteristics of suspended sediment in the Yellow River, China. Catena 2000, 38, 243–263. [Google Scholar] [CrossRef]
- Vandenberghe, J.; Renssen, H.; Van Huissteden, K.; Nugteren, G.; Konert, M.; Lu, H.; Dodonov, A.; Buylaert, J.-P. Penetration of Atlantic westerly winds into Central and East Asia. Quat. Sci. Rev. 2006, 25, 2380–2389. [Google Scholar] [CrossRef]
- Rajganapathi, V.C.; Jitheshkumar, N.; Sundararajan, M.; Bhat, K.H.; Velusamy, S. Grain size analysis and characterization of sedimentary environment along Thiruchendur coast, Tamilnadu, India. Arab. J. Geosci. 2012, 6, 4717–4728. [Google Scholar] [CrossRef]
- Szmańda, J.B. Main determinants of the grain size distribution of overbank deposits in Poland—An overview of literature on models of sedimentation. Geol. Q. 2018, 62, 10. [Google Scholar] [CrossRef] [Green Version]
- Wang, C.; Chen, M.; Qi, H.; Intasen, W.; Kanchanapant, A. Grain-Size Distribution of Surface Sediments in the Chanthaburi Coast, Thailand and Implications for the Sedimentary Dynamic Environment. J. Mar. Sci. Eng. 2020, 8, 242. [Google Scholar] [CrossRef] [Green Version]
- McCave, I.N.; Syvitski, J.P.M. Principles and Methods of Geological Particle Size Analysis. In Principles, Methods and Application of Particle Size Analysis; Syvitski, J.P.M., Ed.; Cambridge University Press: Cambridge, UK, 1991; pp. 3–21. [Google Scholar]
- Goossens, D. Techniques to Measure Grain-Size Distributions of Loamy Sediments: A Comparative Study of Ten Instruments for Wet Analysis. Sedimentology 2008, 55, 65–96. [Google Scholar] [CrossRef]
- Virden, A. Particle Sizing by Laser Diffraction; Malvern Instruments Limited: Malvern, UK, 2017. [Google Scholar]
- Chappell, A. Dispersing Sandy Soil for the Measurement of Particle Size Distributions Using Optical Laser Diffraction. Catena 1998, 31, 271–281. [Google Scholar] [CrossRef]
- Murray, M.R. Is laser particle size determination possible for carbonate-rich lake sediments? J. Paleolimnol. 2002, 27, 173–183. [Google Scholar] [CrossRef]
- Schulte, P.; Lehmkuhl, F.; Steininger, F.; Loibl, D.; Lockot, G.; Protze, J.; Fischer, P.; Stauch, G. Influence of HCl pretreatment and organo-mineral complexes on laser diffraction measurement of loess–paleosol-sequences. Catena 2016, 137, 392–405. [Google Scholar] [CrossRef]
- Jaijel, R.; Tchernov, B.N.G.; Biton, E.; Weinstein, Y.; Katz, T. Optimizing a standard preparation procedure for grain size analysis of marine sediments by laser diffraction (MS-PT4SD: Marine sediments-pretreatment for size distribution). Deep. Sea Res. Part I Oceanogr. Res. Pap. 2021, 167, 103429. [Google Scholar] [CrossRef]
- Vaasma, T. Grain-size analysis of lacustrine sediments: A comparison of pre-treatment methods. Estonian J. Ecol. 2008, 57, 231. [Google Scholar] [CrossRef] [Green Version]
- Żarczyński, M.; Szmańda, J.; Tylmann, W. Grain-Size Distribution and Structural Characteristics of Varved Sediments from Lake Żabińskie (Northeastern Poland). Quaternary 2019, 2, 8. [Google Scholar] [CrossRef] [Green Version]
- Wintermyer, A.M.; Kinter, E.B. Dispersing Agents for Particle-Size Analysis of Soils. Highw. Res. Board Bull. 1955, 95, 1–14. [Google Scholar]
- Tchillingarian, G. Study of the Dispersing Agents. J. Sediment. Petrol. 1952, 22, 229–233. [Google Scholar] [CrossRef]
- Kaur, A.; Fanourakis, G.C. The effect of type, concentration and volume of dispersing agent on the magnitude of the clay content determined by the hydrometer analysis. J. S. Afr. Inst. Civ. Eng. 2016, 58, 48–54. [Google Scholar] [CrossRef] [Green Version]
- Borja, K.; Mercado, J.; Combatt, E. Methods of Mechanical Dispersion for Determining Granulometric Fractions in Soils Using Four Dispersant Solutions. Agron. Colomb. 2015, 33, 253–260. [Google Scholar] [CrossRef]
- Abdulkarim, M.; Chapkanski, S.; Ertlen, D.; Rambeau, C.; Schmitt, L.; Le Bouteiller, L.; Preusser, F. Provenance Determination of Paleochannel Infillings in the Alsatian Upper Rhine Floodplain Using Mid-Infrared Spectroscopy-Discriminant Analysis. In Proceedings of the 23rd EGU General Assembly, Vienna, Austria, 19–30 April 2021. [Google Scholar] [CrossRef]
- Allen, J.R.L. Fining-upwards Cycles in Alluvial Successions. Geol. J. 1964, 4, 229–246. [Google Scholar] [CrossRef]
- Heiri, O.; Lotter, A.F.; Lemcke, G. Loss on Ignition as Method for Estimating Organic and Carbonate Content in Sediments: Reproducibility and Comparability of Results. J. Paleolimnol. 2001, 25, 101–110. [Google Scholar] [CrossRef]
- Machalett, B.; Oches, E.A.; Frechen, M.; Zöller, L.; Hambach, U.; Mavlyanova, N.G.; Marković, S.B.; Endlicher, W. Aeolian Dust Dynamics in Central Asia During the Pleistocene: Driven by the Long-term Migration, Seasonality, and Permanency of the Asiatic Polar Front. Geochem. Geophys. Geosyst. 2008, 9, 1–22. [Google Scholar] [CrossRef]
- Blott, S.J.; Pye, K. GRADISTAT: A Grain Size Distribution and Statistics Package for the Analysis of Unconsolidated Sediments. Earth Surf. Process. Landf. 2001, 26, 1237–1248. [Google Scholar] [CrossRef]
- Udden, J.A. Mechanical Composition of Clastic Sediments. Bull. Geol. Soc. Am. 1914, 25, 655–744. [Google Scholar] [CrossRef]
- Wentworth, C.K. A Scale of Grade and Class Terms for Clastic Sediments. J. Geol. 1922, 30, 377–392. [Google Scholar] [CrossRef]


| Dispersing Agent (Deflocculant) | Concentration | Citation |
|---|---|---|
| (1) Distilled water | - | - |
| (2) Calgon 1 ((NaPO3)6+ Na2CO3) | 33 g of sodium hexametaphosphate and 7 g of sodium carbonate per liter of distilled water | Kaur and Fanourakis [22] |
| (3) Sodium oxalate (Na2C2O4) | 5 g of sodium oxalate per liter of distilled water | Kaur and Fanourakis [22] |
| (4) Sodium pyrophosphate (Na4P2O7) | 44.6 g of sodium pyrophosphate per liter of distilled water | Wintermyer and Kinter [20] |
| (5) Sodium tripolyphosphate (Na5P3O10) | 29.4 g of sodium tripolyphosphate per liter of distilled water | Wintermyer and Kinter [20] |
| Parameter | Specification |
|---|---|
| Particle refractive index | 1.55 |
| Dispersant refractive index | 1.33 |
| Absorption index | 0.1 |
| Obscuration | Fine sediments: 5–10%; coarse sediments: 10–15% |
| Measurement duration | 10 s |
| Measurement cycle | 5 |
| Stirrer speed | 1660 rpm |
| Ultrasonication | Off |
| Size fraction bins | 101 bins (0.01 to 3500 µm) |
| S/U | Distilled Water | NaPO3)6 + Na2CO3 | Na2C2O4 | Na4P2O7 | Na5P3O10 | |||||
|---|---|---|---|---|---|---|---|---|---|---|
| MGS (µm) | Clay (%) | MGS (µm) | Clay (%) | MGS (µm) | Clay (%) | MGS (µm) | Clay (%) | MGS (µm) | Clay (%) | |
| SB SU-5 | 43.9 ± 2.2 | 1.0 ± 0.1 | 9.6 ± 0.1 | 12.1 ± 0.1 | 9.8 ± 0.2 | 11.7 ± 0.1 | 11.7 ± 0.2 | 9.7 ± 0.2 | 9.6 ± 0.1 | 11.6 ± 0.1 |
| SB SU-4 | 60.2 ± 8.5 | 0.6 ± 0.2 | 4.0 ± 1.0 | 23.9 ± 4.4 | 4.3 ± 0.7 | 22.0 ± 2.4 | 5.1 ± 0.1 | 19.4 ± 1.1 | 4.2 ± 1.0 | 23.0 ± 3.7 |
| SB SU-3 | 49.3 ± 3.9 | 0.8 ± 0.1 | 5.4 ± 1.2 | 16.9 ± 3.5 | 5.0 ± 1.4 | 17.9 ± 4.5 | 7.4 ± 0.5 | 12.5 ± 0.8 | 5.6 ± 1.3 | 15.0 ± 3.3 |
| SB SU-2 | 56.5 ± 11.7 | 0.7 ± 0.2 | 8.2 ± 2.4 | 11.0 ± 2.5 | 6.8 ± 2.3 | 13.9 ± 7.1 | 7.9 ± 1.8 | 10.9 ± 2.8 | 7.8 ± 1.4 | 10.4 ± 2.0 |
| SB SU-1 | 192.7 ± 3.6 | 0.1 ± 0.1 | 183.9 ± 9.3 | 0.1 ± 0.1 | 117.3 ± 9.7 | 0.5 ± 0.1 | 168.1 ± 1.0 | 0.1 ± 0.1 | 188.6 ± 2.1 | 0.1 ± 0.1 |
| DB SU-6 | 62.8 ± 1.6 | 0.4 ± 0.1 | 4.9 ± 0.7 | 20.4 ± 1.5 | 5.1 ± 0.5 | 19.0 ± 2.1 | 5.3 ± 0.3 | 18.0 ± 0.8 | 5.8 ± 0.4 | 16.7 ± 1.0 |
| DB SU-5 | 49.7 ± 5.8 | 0.8 ± 0.1 | 4.7 ± 0.1 | 20.8 ± 0.2 | 5.8 ± 0.1 | 15.7 ± 0.1 | 14.2 ± 0.1 | 8.8 ± 0.1 | 4.7 ± 0.1 | 21.3 ± 0.1 |
| DB SU-4 | 65.8 ± 30.8 | 0.4 ± 0.4 | 8.3 ± 0.1 | 12.3 ± 0.1 | 8.5 ± 0.1 | 12.1 ± 0.1 | 11.4 ± 0.1 | 8.0 ± 0.1 | 10.2 ± 0.1 | 12.8 ± 0.1 |
| DB SU-3 | 184.9 ± 98.6 | 0.1 ± 0.1 | 74.0 ± 1.3 | 0.3 ± 0.1 | 56.2 ± 0.2 | 0.4 ± 0.1 | 73.1 ± 1.1 | 0.3 ± 0.1 | 69.4 ± 1.3 | 0.3 ± 0.1 |
| DB SU-2 | 251.1 ± 4.0 | 0.1 ± 0.1 | 255.4 ± 2.1 | 0.2 ± 0.1 | 267.0 ± 7.7 | 2.3 ± 0.1 | 247.2 ± 2.8 | 0.2 ± 0.1 | 256.6 ± 7.0 | 0.2 ± 0.1 |
| DB SU-1 | 125.8 ± 7.5 | 0.3 ± 0.1 | 110.6 ± 2.3 | 0.3 ± 0.1 | 94.1 ± 6.8 | 0.3 ± 0.1 | 94.3 ± 2.6 | 0.5 ± 0.1 | 108.4 ± 1.0 | 0.4 ± 0.1 |
| (NaPO3)6+Na2CO3 | Na2C2O4 | Na4P2O7 | Na5P3O10 | ||||||
|---|---|---|---|---|---|---|---|---|---|
| Sample ID | Treatment Method | MGS (µm) | Clay (%) | MGS (µm) | Clay (%) | MGS (µm) | Clay (%) | MGS (µm) | Clay (%) |
| IL 1A | Hydrogen peroxide | 15.3 | 9.5 | 15.4 | 3.6 | 17.9 | 6.2 | 19.1 | 5.6 |
| IL 1B | Thermal combustion | 35.8 | 2.7 | 30.0 | 2.8 | 33.9 | 2.8 | 43.3 | 2.3 |
| IL 2A | Hydrogen peroxide | 17.1 | 6.6 | 15.5 | 3.2 | 17.6 | 5.9 | 19.6 | 5.5 |
| IL 2B | Thermal combustion | 38.0 | 2.6 | 31.6 | 2.3 | 35.6 | 2.5 | 41.4 | 2.3 |
Publisher’s Note: MDPI stays neutral with regard to jurisdictional claims in published maps and institutional affiliations. |
© 2021 by the authors. Licensee MDPI, Basel, Switzerland. This article is an open access article distributed under the terms and conditions of the Creative Commons Attribution (CC BY) license (https://creativecommons.org/licenses/by/4.0/).
Share and Cite
Abdulkarim, M.; Grema, H.M.; Adamu, I.H.; Mueller, D.; Schulz, M.; Ulbrich, M.; Miocic, J.M.; Preusser, F. Effect of Using Different Chemical Dispersing Agents in Grain Size Analyses of Fluvial Sediments via Laser Diffraction Spectrometry. Methods Protoc. 2021, 4, 44. https://0-doi-org.brum.beds.ac.uk/10.3390/mps4030044
Abdulkarim M, Grema HM, Adamu IH, Mueller D, Schulz M, Ulbrich M, Miocic JM, Preusser F. Effect of Using Different Chemical Dispersing Agents in Grain Size Analyses of Fluvial Sediments via Laser Diffraction Spectrometry. Methods and Protocols. 2021; 4(3):44. https://0-doi-org.brum.beds.ac.uk/10.3390/mps4030044
Chicago/Turabian StyleAbdulkarim, Mubarak, Haruna M. Grema, Ibrahim H. Adamu, Daniela Mueller, Melanie Schulz, Marius Ulbrich, Johannes M. Miocic, and Frank Preusser. 2021. "Effect of Using Different Chemical Dispersing Agents in Grain Size Analyses of Fluvial Sediments via Laser Diffraction Spectrometry" Methods and Protocols 4, no. 3: 44. https://0-doi-org.brum.beds.ac.uk/10.3390/mps4030044