Welfare Challenges Influence the Complexity of Movement: Fractal Analysis of Behaviour in Zebrafish

 , and
, and 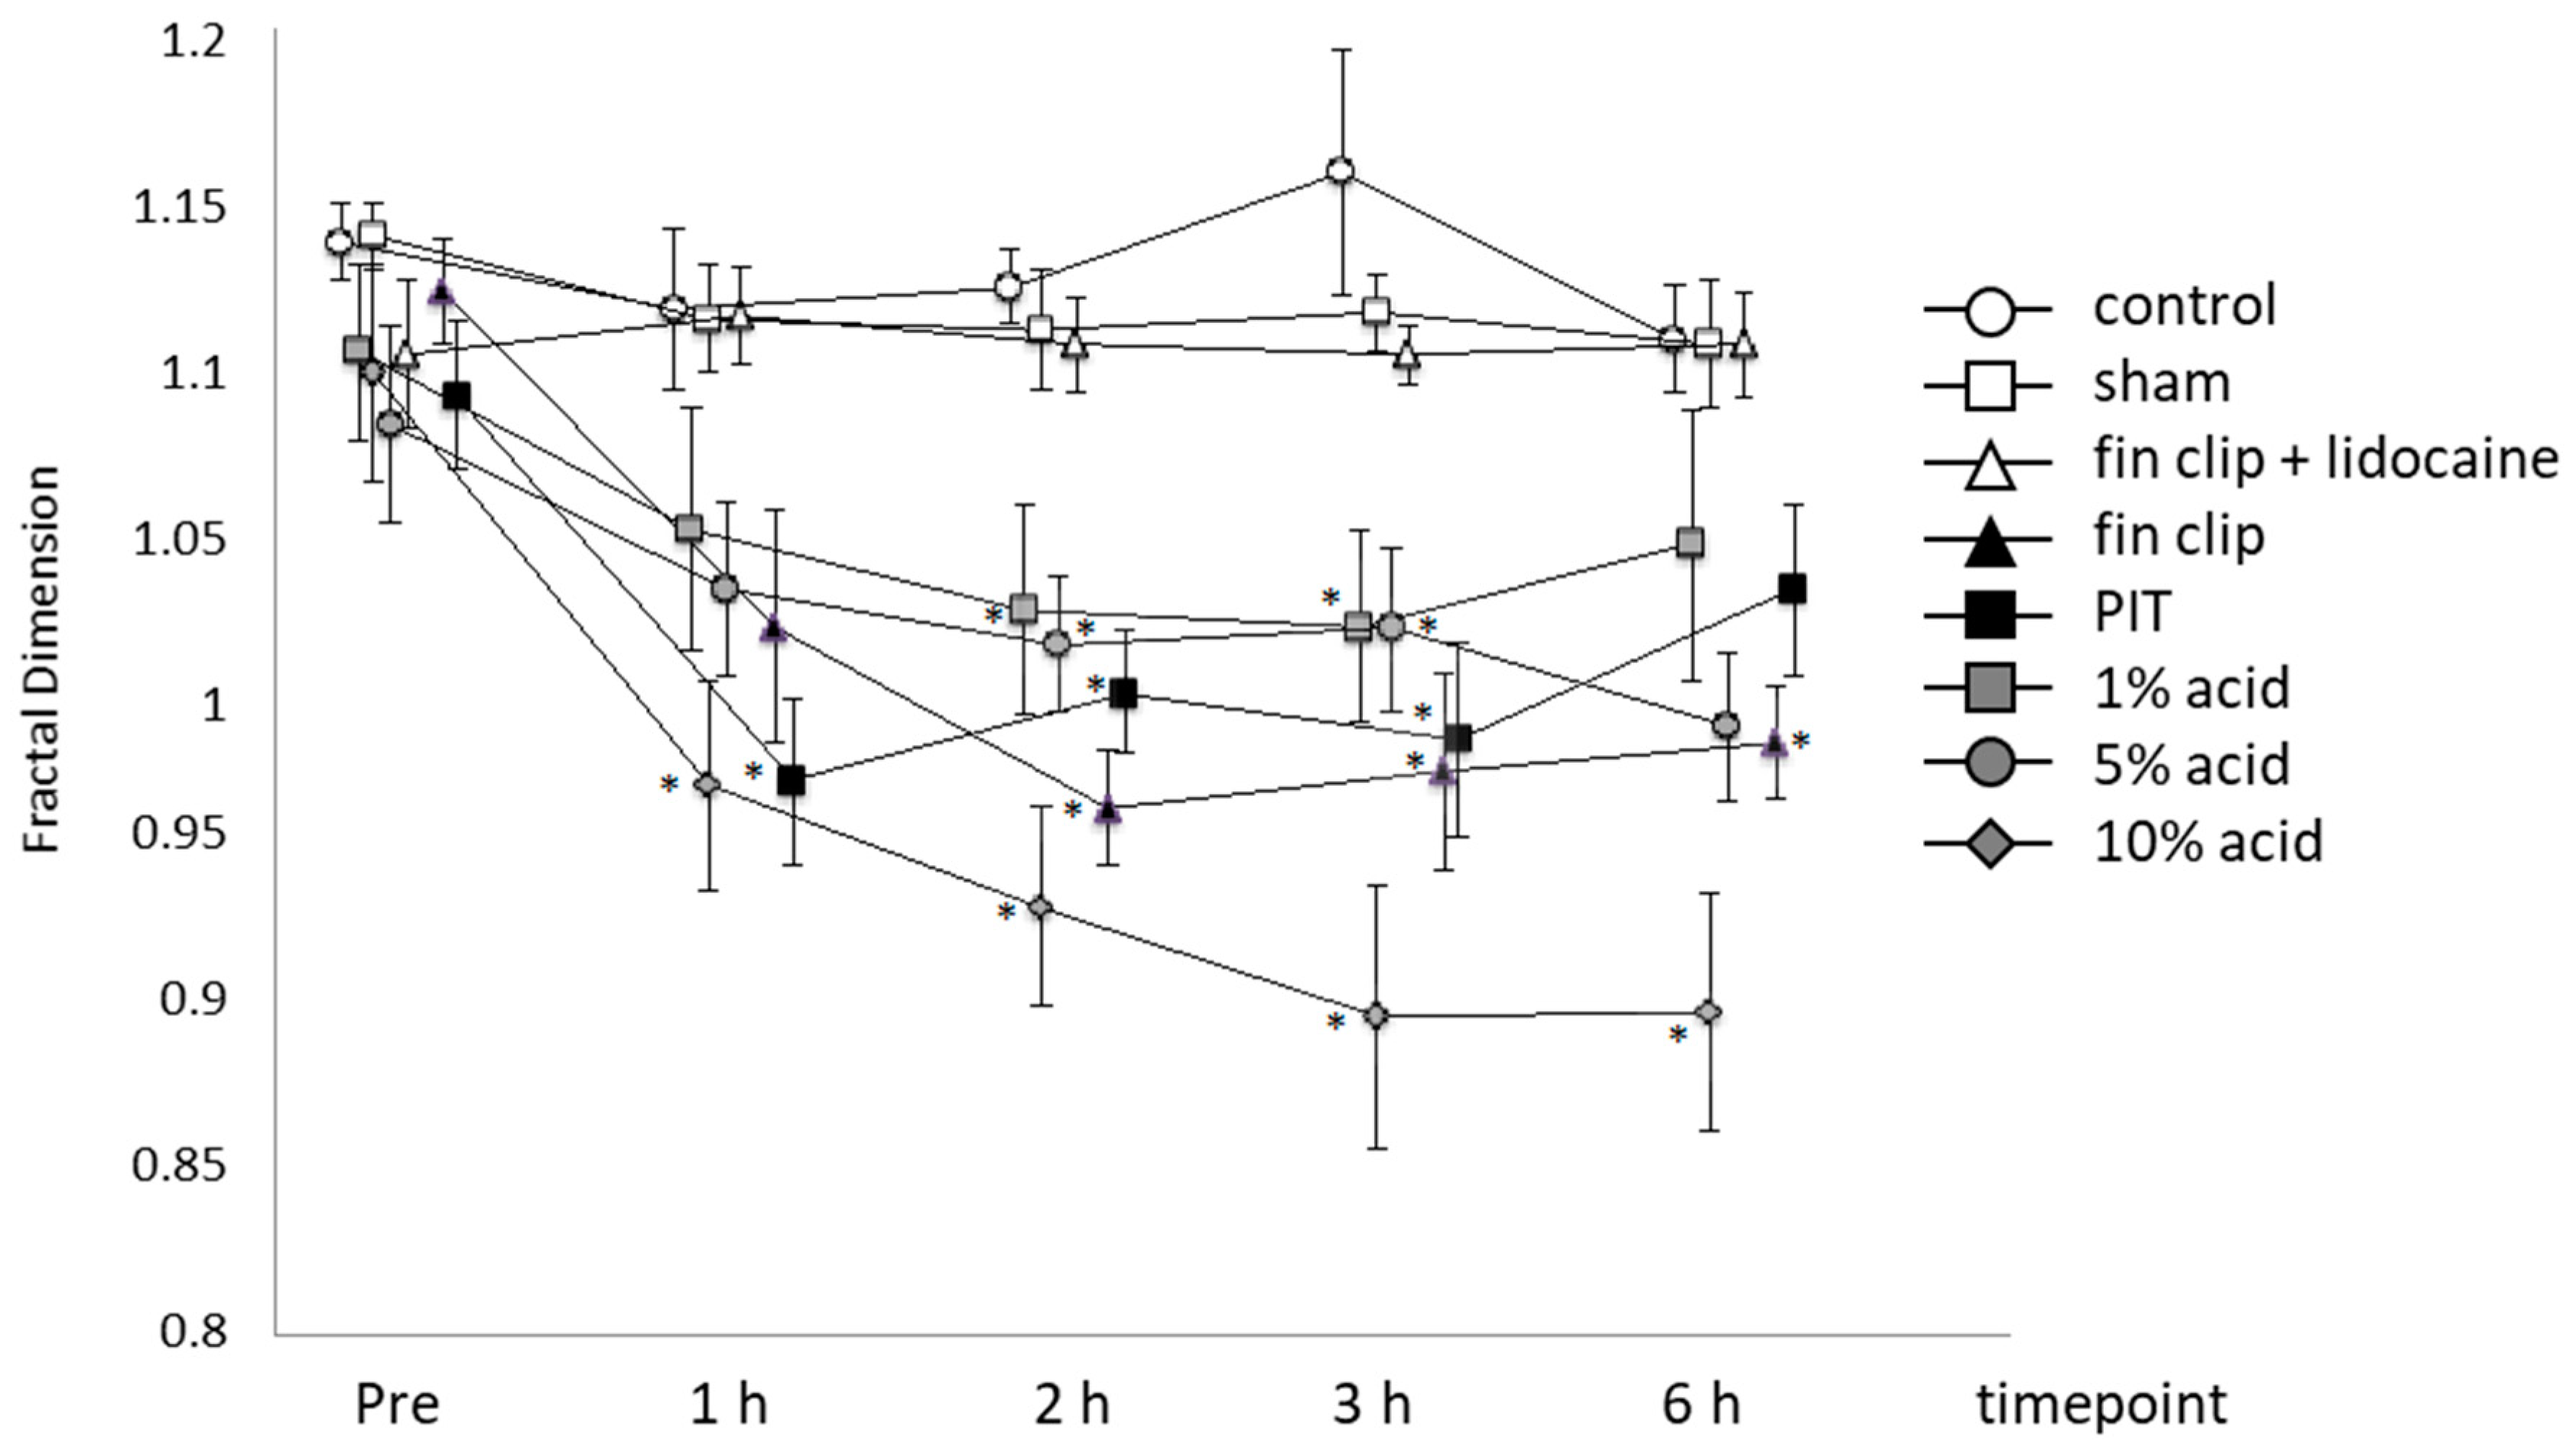
Abstract
:1. Introduction
2. Results
2.1. Effect of Treatment
2.2. Effect of Time
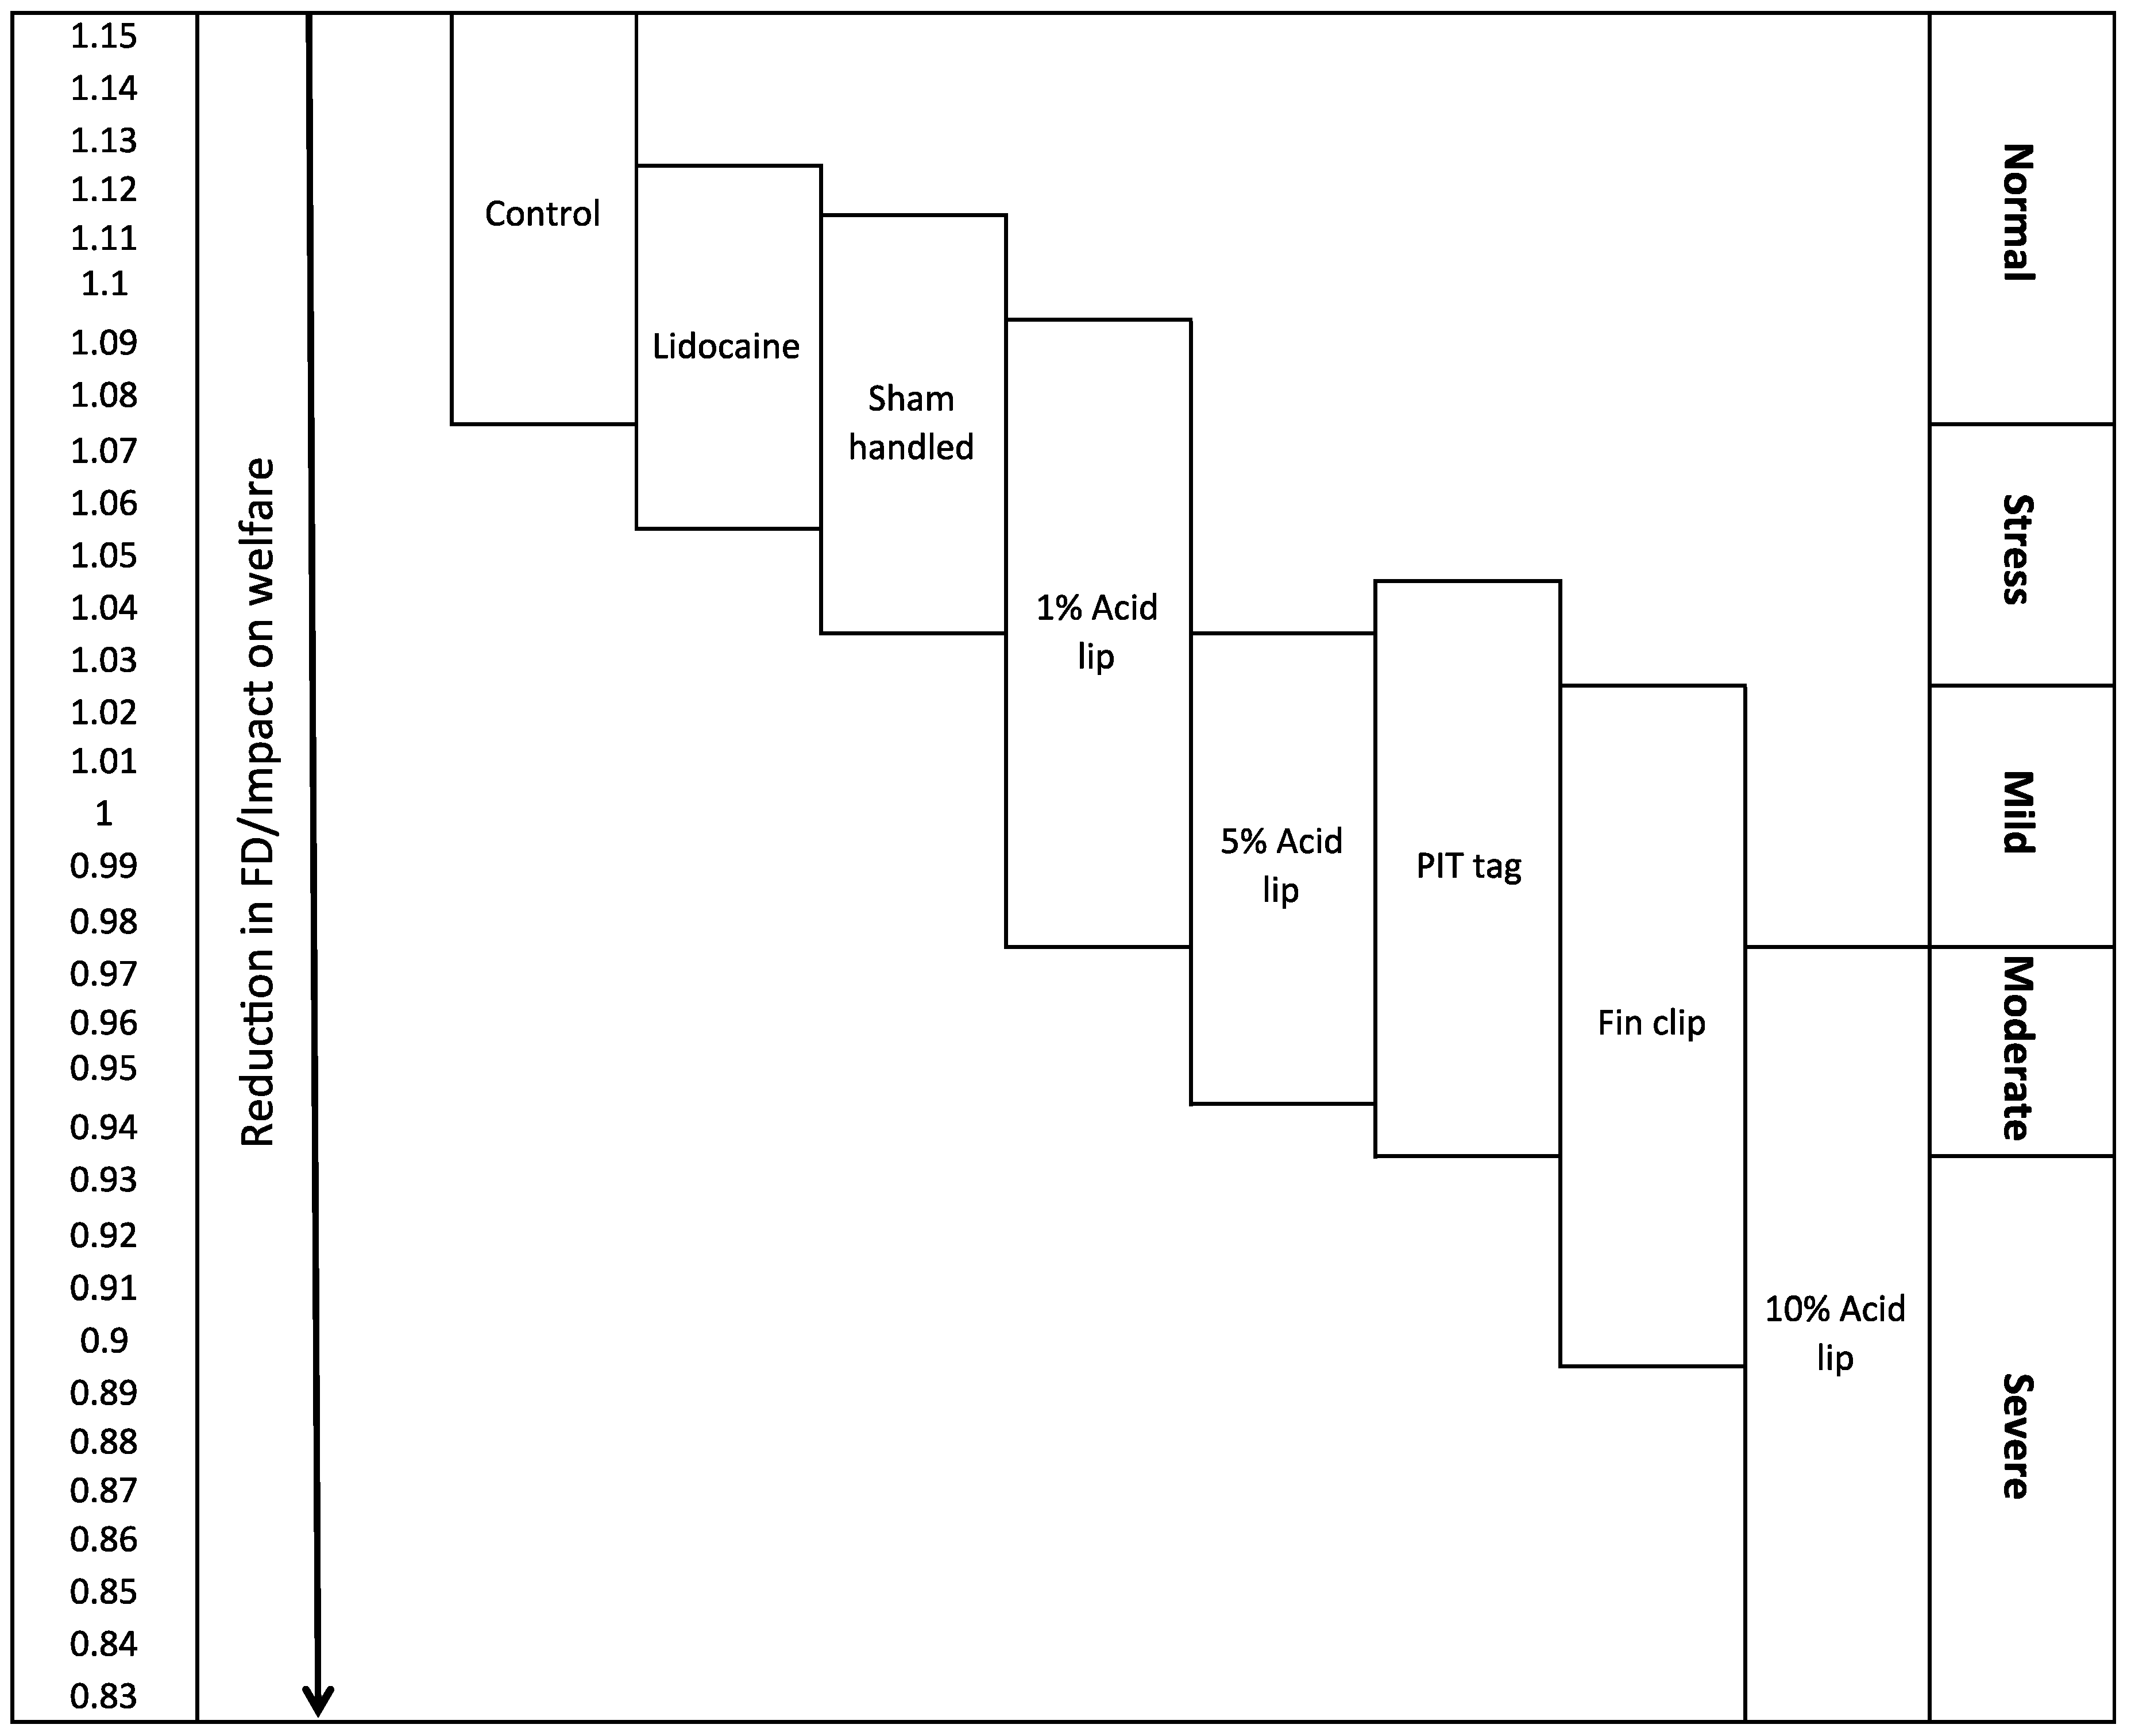
2.3. Hypothetical Scale of Severity
3. Discussion
4. Materials and Methods
4.1. Subjects and Husbandry
4.2. Treatment Groups
4.3. Data Collection
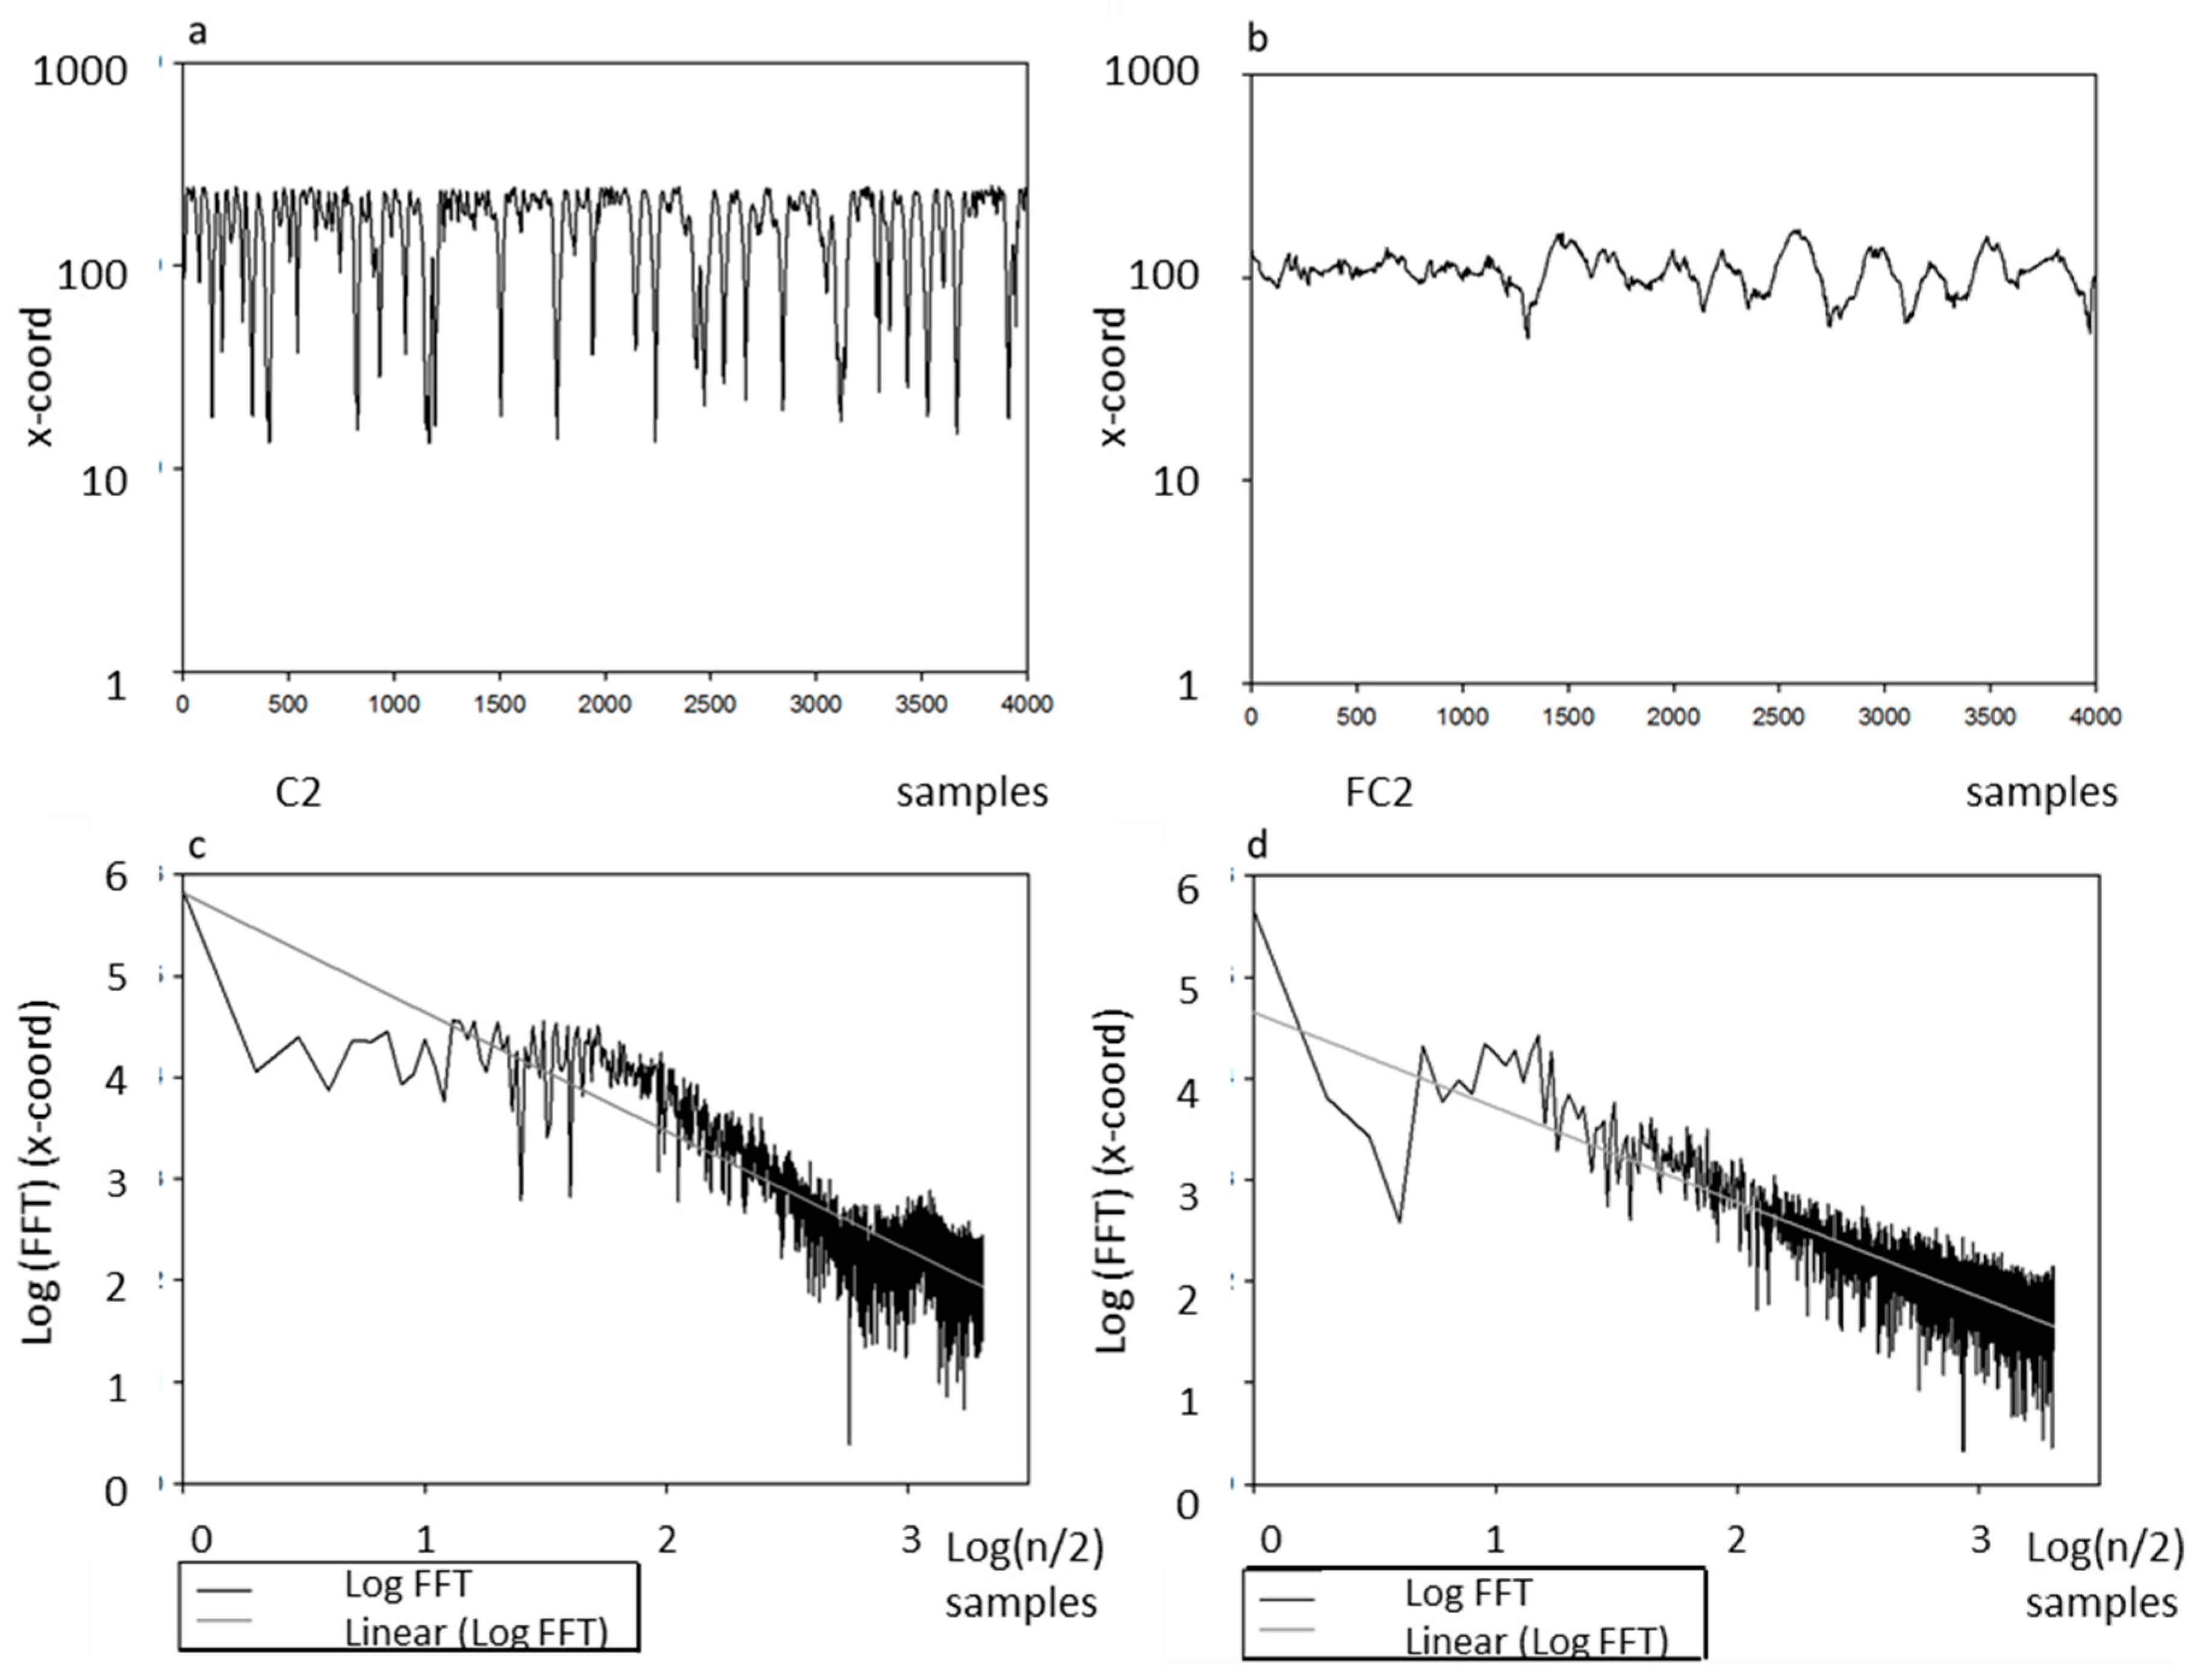
4.4. Fractal Dimension
4.5. Statistical Analysis
4.6. Ethics Note
5. Conclusions
Supplementary Materials
Author Contributions
Funding
Acknowledgments
Conflicts of Interest
References
- Broom, D.M. Indicators of poor welfare. Brit. Vet. J. 1986, 142, 524–526. [Google Scholar] [CrossRef]
- Broom, D.M. Animal welfare: Concepts and measurement. J. Anim. Sci. 1991, 69, 4167–4175. [Google Scholar] [CrossRef] [PubMed]
- Molony, V.; Kent, J.E.; McKendrick, I.J. Validation of a method for assessment of an acute pain in lambs. Appl. Anim. Behav. Sci. 2002, 76, 215–238. [Google Scholar] [CrossRef]
- Sneddon, L.U. Pain in aquatic animals. J. Exp. Biol. 2015, 218, 967–976. [Google Scholar] [CrossRef] [PubMed]
- Sneddon, L.U.; Elwood, R.W.; Adamo, S.A.; Leach, M.C. Defining and assessing animal pain. Anim. Behav. 2014, 97, 201–212. [Google Scholar] [CrossRef]
- Zimmerman, M. Physiological mechanisms of pain and its treatment. Klinische Anäesthesiologie Intensivtherapie 1986, 32, 1–19. [Google Scholar]
- Leach, M.C.; Klaus, K.; Miller, A.L.; di Perrotolo, M.S.; Sotocinal, S.G.; Flecknell, P.A. The Assessment of Post-Vasectomy Pain in Mice Using Behaviour and the Mouse Grimace Scale. PLoS ONE 2012, 7, e35656. [Google Scholar] [CrossRef] [PubMed]
- Roughan, J.V.; Wright-Williams, S.L.; Flecknell, P.A. Automated analysis of postoperative behaviour: Assessment of HomeCageScan as a novel method to rapidly identify pain and analgesic effects in mice. Lab. Anim. 2009, 43, 17–26. [Google Scholar] [CrossRef] [PubMed]
- Home Office. 2018. Available online: https://www.gov.uk/government/statistics/statistics-of-scientific-procedures-on-living-animals-great-britain-2017 (accessed on 18 December 2018).
- Clark, K.J.; Ekker, S.C. How Zebrafish Genetics Informs Human Biology. Nat. Educ. 2015, 8, 3. [Google Scholar]
- Hart, P.C.; Bergner, C.L.; Egan, R.J.; LaPorte, J.L.; Smolinsky, A.N.; Amri, H.; Zukowska, Z.; Glasgow, E.; Kalueff, A.V. The Utility of Zebrafish in Stress Research. FASEB J. 2009, 23, 1. [Google Scholar]
- Hill, A.J.; Teraoka, H.; Heideman, W.; Peterson, R.E. Zebrafish as a model vertebrate for investigating chemical toxicity. Toxicol. Sci. 2005, 86, 6–19. [Google Scholar] [CrossRef] [PubMed]
- Johansen, R.; Needham, J.R.; Colquhoun, D.J.; Poppe, T.T.; Smith, A.J. Guidelines for health and welfare monitoring of fish used in research. Lab. Anim. 2006, 40, 323–340. [Google Scholar] [CrossRef] [PubMed]
- Iwama, G.K. The welfare of fish. Dis. Aquat. Org. 2007, 75, 155–158. [Google Scholar] [CrossRef] [PubMed]
- Rose, J.D. The Neurobehavioral nature of fishes and the question of awareness and pain. Rev. Fish. Sci. 2002, 10, 1–38. [Google Scholar] [CrossRef]
- Ashley, P.J.; Sneddon, L.U.; McCrohan, C.R. Properties of corneal receptors in a teleost fish. Neurosci. Lett. 2006, 410, 165–168. [Google Scholar] [CrossRef] [PubMed]
- Ashley, P.J.; Sneddon, L.U.; McCrohan, C.R. Nociception in fish: Stimulus-response properties of receptors on the head of trout Oncorhynchus mykiss. Brain Res. 2007, 1166, 47–54. [Google Scholar] [CrossRef] [PubMed]
- Sneddon, L.U. Trigeminal somatosensory innervation of the head of a teleost fish with particular reference to nociception. Brain Res. 2003, 972, 44–52. [Google Scholar] [CrossRef]
- Sneddon, L.U.; Braithwaite, V.A.; Gentle, M.J. Do fishes have nociceptors? Evidence for the evolution of a vertebrate sensory system. Proc. R. Soc. B-Biol. Sci. 2003, 270, 1115–1121. [Google Scholar] [CrossRef] [PubMed]
- Dunlop, R.; Laming, P. Mechanoreceptive and nociceptive responses in the central nervous system of goldfish (Carassius auratus) and trout (Oncorhynchus mykiss). J. Pain 2005, 6, 561–568. [Google Scholar] [CrossRef] [PubMed]
- Reilly, S.C.; Kipar, A.; Hughes, D.J.; Quinn, J.P.; Cossins, A.R.; Sneddon, L.U. Investigation of Van Gogh-like 2 mRNA regulation and localisation in response to nociception in the brain of adult common carp (Cyprinus carpio). Neurosci. Lett. 2009, 465, 290–294. [Google Scholar] [CrossRef] [PubMed]
- Reilly, S.C.; Quinn, J.P.; Cossins, A.R.; Sneddon, L.U. Novel candidate genes identified in the brain during nociception in common carp (Cyprinus carpio) and rainbow trout (Oncorhynchus mykiss). Neurosci. Lett. 2008, 437, 135–138. [Google Scholar] [CrossRef] [PubMed]
- Ashley, P.J.; Ringrose, S.; Edwards, K.L.; Wallington, E.; McCrohan, C.R.; Sneddon, L.U. Effect of noxious stimulation upon antipredator responses and dominance status in rainbow trout. Anim. Behav. 2009, 77, 403–410. [Google Scholar] [CrossRef]
- Millsopp, S.; Laming, P. Trade-offs between feeding and shock avoidance in goldfish (Carassius auratus). Appl. Anim. Behav. Sci. 2008, 113, 247–254. [Google Scholar] [CrossRef]
- Reilly, S.C.; Quinn, J.P.; Cossins, A.R.; Sneddon, L.U. Behavioural analysis of a nociceptive event in fish: Comparisons between three species demonstrate. Appl. Anim. Behav. Sci. 2008, 114, 248–259. [Google Scholar] [CrossRef]
- Roques, J.A.C.; Abbink, W.; Geurds, F.; van de Vis, H.; Flik, G. Tailfin clipping, a painful procedure Studies on Nile tilapia and common carp. Physiol. Behav. 2010, 101, 533–540. [Google Scholar] [CrossRef] [PubMed]
- Sneddon, L.U. The evidence for pain in fish: The use of morphine as an analgesic. Appl. Anim. Behav. Sci. 2003, 83, 153–162. [Google Scholar] [CrossRef]
- Mettam, J.J.; Oulton, L.J.; McCrohan, C.R.; Sneddon, L.U. The efficacy of three types of analgesic drugs in reducing pain in the rainbow trout, Oncorhynchus mykiss. Appl. Anim. Behav. Sci. 2011, 133, 265–274. [Google Scholar] [CrossRef]
- Schroeder, P.; Sneddon, L.U. Exploring the efficacy of immersion analgesics in zebrafish using an integrative approach. Appl. Anim. Behav. Sci. 2017, 187, 93–102. [Google Scholar] [CrossRef]
- Lopez-Luna, J.; Al-Jubouri, Q.; Al-Nuaimy, W.; Sneddon, L.U. Activity reduced by noxious chemical stimulation is ameliorated by immersion in analgesic drugs in zebrafish. J. Exp. Biol. 2017, 220, 1451–1458. [Google Scholar] [CrossRef] [PubMed]
- Taylor, J.C.; Dewberry, L.S.; Totsch, S.K.; Yessick, L.R.; DeBerry, J.J.; Watts, S.A.; Sorge, R.E. A novel zebrafish-based model of nociception. Physiol. Behav. 2017, 174, 83–88. [Google Scholar] [CrossRef] [PubMed]
- Bershadskii, A. An universal relation between fractal and Euclidean (topological) dimensions of random systems. Eur. Phys. J. B 1998, 6, 381–382. [Google Scholar] [CrossRef]
- Nimkerdphol, K.; Nakagawa, M. Effect of sodium hypochlorite on zebrafish swimming behavior estimated by fractal dimension analysis. J. Biosci. Bioeng. 2008, 105, 486–492. [Google Scholar] [CrossRef] [PubMed]
- Power, W.L.; Tullis, T.E. Euclidean and fractal models for the description of rock surface-roughness. J. Geophys. Res.-Solid Earth Planets 1991, 96, 415–424. [Google Scholar] [CrossRef]
- Deakin, A.G.; Yates, D.F. Evolving and Optimizing Autonomous Agents’ Strategies with Genetic Programming. In Genetic Programming 1998: Proceedings of the Third Annual Conference, University of Wisconsin, Madison, WI, USA, 22–25 July 1998; Koza, J.R., Banzhaf, W., Chellapilla, K., Deb, K., Dorigo, M., Fogel, D.B., Garzon, M.H., Goldberg, D.E., Iba, H., Riolo, R., Eds.; Morgan Kaufmann: San Francisco, CA, USA, 1998; pp. 42–47. [Google Scholar]
- Deakin, A.G.; Yates, D.F. Phase Transition Networks: A Modelling Technique supporting the Evolution of Autonomous Agents’ Tactical and Operational Activities. In Lecture Notes in Computer Science, Proceedings of the AISB 97 Evolutionary Computing Workshop, University of Manchester, Manchester, UK, 7–8 April 1997; Corne, D., Shapiro, J., Eds.; Springer Verlag: Berlin, Germany, 1997; Volume 1305, pp. 263–273. [Google Scholar]
- Eddy, S.R. What is a hidden Markov model? Nat. Biotechnol. 2004, 22, 1315–1316. [Google Scholar] [CrossRef] [PubMed]
- Cortes, C.; Vapnik, V. Support-vector networks. Mach. Learn. 1995, 20, 273–297. [Google Scholar] [CrossRef]
- Mandelbrot, B. How Long Is the Coast of Britain? Statistical Self-Similarity and Fractional Dimension. Science 1967, 156, 636–638. [Google Scholar] [CrossRef] [PubMed]
- Pearson, K. On lines and planes of closest fit to systems of points in space. Philos. Mag. 1901, 2, 559–572. [Google Scholar] [CrossRef]
- Jones, G.R.; Deakin, A.G.; Spencer, J.W. Chromatic Monitoring of Complex Conditions; CRC Press-Taylor & Francis Group: Boca Raton, FL, USA, 2008. [Google Scholar]
- Goldberger, A.L.; Amaral, L.A.N.; Hausdorff, J.M.; Ivanov, P.C.; Peng, C.K.; Stanley, H.E. Fractal dynamics in physiology: Alterations with disease and aging. Proc. Nat. Acad. Sci. USA 2002, 99, 2466–2472. [Google Scholar] [CrossRef] [PubMed]
- Rutherford, K.M.D.; Haskell, M.J.; Glasbey, C.; Jones, R.B.; Lawrence, A.B. Fractal analysis of animal behaviour as an indicator of animal welfare. Anim. Welf. 2004, 13, S99–S103. [Google Scholar]
- Alados, C.L.; Escos, J.M.; Emlen, J.M. Fractal structure of sequential behaviour patterns: An indicator of stress. Anim. Behav. 1996, 51, 437–443. [Google Scholar] [CrossRef]
- MacIntosh, A.J.J.; Alados, C.L.; Huffman, M.A. Fractal analysis of behaviour in a wild primate: Behavioural complexity in health and disease. J. R. Soc. Interface 2011, 8, 1497–1509. [Google Scholar] [CrossRef] [PubMed]
- Alados, C.L.; Huffman, M.A. Fractal long-range correlations in behavioural sequences of wild chimpanzees: A non-invasive analytical tool for the evaluation of health. Ethology 2000, 106, 105–116. [Google Scholar] [CrossRef]
- Burgunder, J.; Pafco, B.; Petrzelkova, K.J.; Modry, D.; Hashimoto, C.; MacIntosh, A.J. J Complexity in behavioural organization and strongylid infection among wild chimpanzees. Anim. Behav. 2017, 129, 257–268. [Google Scholar] [CrossRef]
- Alados, C.L.; Weber, D.N. Lead effects on the predictability of reproductive behavior in fathead minnows (Pimephales promelas): A mathematical model. Environ. Toxicol. Chem. 1999, 18, 2392–2399. [Google Scholar] [CrossRef] [PubMed]
- Eguiraun, H.; Lopez-de-Ipina, K.; Martinez, I. Application of Entropy and Fractal Dimension Analyses to the Pattern Recognition of Contaminated Fish Responses in Aquaculture. Entropy 2014, 16, 6133–6151. [Google Scholar] [CrossRef]
- Tenorio, B.M.; da Silva, E.A.; Neiva, G.S.M.; da Silva, V.A.; Tenorio, F.D.A.M.; da Silva, T.D.; Silva, E.C.S.E.; Nogueira, R.D. Can fractal methods applied to video tracking detect the effects of deltamethrin pesticide or mercury on the locomotion behavior of shrimps? Ecotoxicol. Environ. Saf. 2017, 142, 243–249. [Google Scholar] [CrossRef] [PubMed]
- Seuront, L.; Cribb, N. Fractal analysis provides new insights into the complexity of marine mammal behavior: A review, two methods, their application to diving and surfacing patterns, and their relevance to marine mammal welfare assessment. Mar. Mammal Sci. 2017, 33, 847–879. [Google Scholar] [CrossRef]
- Seuront, L.; Cribb, N. Fractal analysis reveals pernicious stress levels related to boat presence and type in the Indo-Pacific bottlenose dolphin, Tursiops aduncus. Phys. A-Stat. Mech. Appl. 2011, 390, 2333–2339. [Google Scholar] [CrossRef]
- Maximino, C. Modulation of nociceptive-like behavior in zebrafish (Danio rerio) by environmental stressors. Psychol. Neurosci. 2011, 4, 149–155. [Google Scholar] [CrossRef]
- Moberg, G.P.; Mench, J.A. The Biology of Animal Stress: Basic Principles and Implications for Animal Welfare; CABI Publishing: Wallingford, UK, 2000. [Google Scholar]
- Stubsjoen, S.M.; Bohlin, J.; Skjerve, E.; Valle, P.S.; Zanella, A.J. Applying fractal analysis to heart rate time series of sheep experiencing pain. Physiol. Behav. 2010, 101, 74–80. [Google Scholar] [CrossRef] [PubMed]
- Maria, G.A.; Escos, J.; Alados, C.L. Complexity of behavioural sequences and their relation to stress conditions in chickens (Gallus gallus domesticus): A non-invasive technique to evaluate animal welfare. Appl. Anim. Behav. Sci. 2004, 86, 93–104. [Google Scholar] [CrossRef]
- Asher, L.; Collins, L.M.; Ortiz-Pelaez, A.; Drewe, J.A.; Nicol, C.J.; Pfeiffer, D.U. Recent advances in the analysis of behavioural organization and interpretation as indicators of animal welfare. J. R. Soc. Interface 2009, 6, 1103–1119. [Google Scholar] [CrossRef] [PubMed]
- Mason, G.J. Stereotypies and suffering. Behav. Proc. 1991, 25, 103–115. [Google Scholar] [CrossRef]
- Garner, J.P. Stereotypies and Other Abnormal Repetitive Behaviors: Potential Impact on Validity, Reliability, and Replicability of Scientific Outcomes. ILAR J. 2005, 46, 106–117. [Google Scholar] [CrossRef] [PubMed]
- Gonyou, H.W. Why the study of animal behavior is associated with the animal-welfare issue. J. Anim. Sci. 1994, 72, 2171–2177. [Google Scholar] [CrossRef] [PubMed]
- Jasmin, L.; Kohan, L.; Franssen, M.; Janni, G.; Goff, J.R. The cold plate as a test of nociceptive behaviors: Description and application to the study of chronic neuropathic and inflammatory pain models. Pain 1998, 75, 367–382. [Google Scholar] [CrossRef]
- Deakin, A.G.; Buckley, J.; AlZu’bi, H.S.; Cossins, A.R.; Spencer, J.W.; Al’Nuaimy, W.; Young, I.S.; Sneddon, L.U. Automated monitoring of behaviour in zebrafish after invasive procedures. 2019; MS under review. [Google Scholar]
- Blaser, R.E.; Rosemberg, D.B. Measures of Anxiety in Zebrafish (Danio rerio): Dissociation of Black/White Preference and Novel Tank Test. PLoS ONE 2012, 7, e36931. [Google Scholar] [CrossRef] [PubMed]
- Sneddon, L.U.; Braithwaite, V.A.; Gentle, M.J. Novel object test: Examining nociception and fear in the rainbow trout. J. Pain 2003, 4, 431–440. [Google Scholar] [CrossRef]
- Sneddon, L.U. Pain in Laboratory Animals: A Possible Confounding Factor? Altern. Lab. Anim. ATLA 2017, 45, 161–164. [Google Scholar] [PubMed]
- Brown, R.S.; Cooke, S.J.; Anderson, W.G.; McKinley, R.S. Evidence to challenge the ‘2% rule’ for biotelemetry. N. Am. J. Fish. Manag. 1999, 19, 867–871. [Google Scholar] [CrossRef]
- Ficke, A.D.; Myrick, C.A.; Kondratieff, M.C. The effects of PIT tagging on the swimming performance and survival of three nonsalmonid freshwater fishes. Ecol. Eng. 2012, 48, 86–91. [Google Scholar] [CrossRef]
- Thorstad, E.B.; Rikardsen, A.H.; Alp, A.; Okland, F. The Use of Electronic Tags in Fish Research—An Overview of Fish Telemetry Methods. Turk. J. Fish. Aquat. Sci. 2013, 13, 881–896. [Google Scholar]
- Tudorache, C.; Viaene, P.; Blust, R.; Vereecken, H.; De Boeck, G. A comparison of swimming capacity and energy use in seven European freshwater fish species. Ecol. Freshw. Fish 2008, 17, 284–291. [Google Scholar] [CrossRef]
- Lower, N.; Moore, A.; Scott, A.P.; Ellis, T.; James, J.D.; Russell, I.C. A non-invasive method to assess the impact of electronic tag insertion on stress levels in fishes. J. Fish Biol. 2005, 67, 1202–1212. [Google Scholar] [CrossRef]
- Fu, C.; Cao, Z.D.; Fu, S.J. The effects of caudal fin loss and regeneration on the swimming performance of three cyprinid fish species with different swimming capacities. J. Exp. Biol. 2013, 216, 3164–3174. [Google Scholar] [CrossRef] [PubMed]
- Webb, P.W. Effects of median-fin amputation on fast-start performance of rainbow-trout (Salmo-gairdneri). J. Exp. Biol. 1977, 68, 123–135. [Google Scholar]
- Plaut, I. Effects of fin size on swimming performance, swimming behaviour and routine activity of zebrafish Danio rerio. J. Exp. Biol. 2000, 203, 813–820. [Google Scholar] [PubMed]
- Paulus, M.P.; Geyer, M.A.; Sternberg, E. Differential movement patterns but not amount of activity in unconditioned motor behavior of Fischer, Lewis, and Sprague-Dawley rats. Physiol. Behav. 1998, 65, 601–606. [Google Scholar] [CrossRef]
- Sneddon, L.U. Anatomical and electrophysiological analysis of the trigeminal nerve in a teleost fish, Oncorhynchus mykiss. Neurosci. Lett. 2002, 319, 167–171. [Google Scholar] [CrossRef]
- White, L.J.; Thomson, J.S.; Pounder, K.C.; Coleman, R.C.; Sneddon, L.U. The impact of social context on behaviour and the recovery from welfare challenges in zebrafish, Danio rerio. Anim. Behav. 2017, 132, 189–199. [Google Scholar] [CrossRef]
- Oliveira, R.F.; Faustino, A.I. Social information use in threat perception: Social buffering, contagion and facilitation of alarm responses. Commun. Integr. Biol. 2017, 10, e1325049. [Google Scholar] [CrossRef]
- Faustino, A.I.; Tacão-Monteiro, A.; Oliveira, R.F. Mechanisms of social buffering of fear in zebrafish. Sci. Rep. 2017, 7, 44329. [Google Scholar] [CrossRef] [PubMed]
- Chablais, F.; Jaźwińska, A. Induction of Myocardial Infarction in Adult Zebrafish Using Cryoinjury. J. Vis. Exp. JOVE 2012, 62, e3666. [Google Scholar] [CrossRef] [PubMed]
- Lemmens, K.; Bollaerts, I.; Bhumika, S.; de Groef, L.; Van Houcke, J.; Darras, V.M.; Van Hove, I.; Moons, L. Matrix metalloproteinases as promising regulators of axonal regrowth in the injured adult zebrafish retinotectal system. J. Comp. Neurol. 2016, 524, 1472–1493. [Google Scholar] [CrossRef] [PubMed]
- Schweitzer, J.; Becker, T.; Becker, C.G.; Schachner, M. Expression of protein zero is increased in lesioned axon pathways in the central nervous system of adult zebrafish. Glia 2003, 41, 301–317. [Google Scholar] [CrossRef] [PubMed]
- AlZu’bi, H.S. Analysis of Human Activities and Animal Behaviours Based on Computational Intelligence. Ph.D. Thesis, University of Liverpool, Liverpool, UK, 2015. [Google Scholar]
- Costa, F.V.; Rosa, L.V.; Quadros, V.A.; Santos, A.R.S.; Kalueff, A.V.; Rosemberg, D.B. Understanding nociception-related phenotypes in adult zebrafish: Behavioral and pharmacological characterization using a new acetic acid model. Brain Behav. Res. 2019, 359, 570–578. [Google Scholar] [CrossRef] [PubMed]
- Sneddon, L.U. Clinical anaesthesia and analgesia in fish. J. Exot. Pet Med. 2012, 21, 32–43. [Google Scholar] [CrossRef]
- Nimkerdphol, K.; Nakagawa, M. 3D locomotion and fractal analysis of Goldfish for acute toxicity bioassay. Int. J. Biol. Med. Sci. 2006, 2, 180–185. [Google Scholar]
- Cooley, J.W.; Tukey, J.W. An Algorithm for the Machine Computation of the Complex Fourier Series. Math. Comput. 1965, 19, 297–301. [Google Scholar] [CrossRef]
- Brand, M.; Granato, M.; Nüsslein-Volhard, C. Keeping and raising zebrafish. Zebrafish 2002, 261, 7–37. [Google Scholar]
- Gunnes, K.; Refstie, T. Cold-branding and fin-clipping for marking of salmonids. Aquaculture 1980, 19, 295–299. [Google Scholar] [CrossRef]
- Readman, G.D.; Owen, S.F.; Murrell, J.C.; Knowles, T.G. Do Fish Perceive Anaesthetics as Aversive? PLoS ONE 2013, 8, e73773. [Google Scholar] [CrossRef] [PubMed]
- EC Severity Assessment. 2018. Available online: http://ec.europa.eu/environment/chemicals/lab_animals/pdf/report_ewg.pdf (accessed on 18 December 2018).


© 2019 by the authors. Licensee MDPI, Basel, Switzerland. This article is an open access article distributed under the terms and conditions of the Creative Commons Attribution (CC BY) license (http://creativecommons.org/licenses/by/4.0/).
Share and Cite
Deakin, A.G.; Spencer, J.W.; Cossins, A.R.; Young, I.S.; Sneddon, L.U. Welfare Challenges Influence the Complexity of Movement: Fractal Analysis of Behaviour in Zebrafish. Fishes 2019, 4, 8. https://0-doi-org.brum.beds.ac.uk/10.3390/fishes4010008
Deakin AG, Spencer JW, Cossins AR, Young IS, Sneddon LU. Welfare Challenges Influence the Complexity of Movement: Fractal Analysis of Behaviour in Zebrafish. Fishes. 2019; 4(1):8. https://0-doi-org.brum.beds.ac.uk/10.3390/fishes4010008
Chicago/Turabian StyleDeakin, Anthony G., Joseph W. Spencer, Andrew R. Cossins, Iain S. Young, and Lynne U. Sneddon. 2019. "Welfare Challenges Influence the Complexity of Movement: Fractal Analysis of Behaviour in Zebrafish" Fishes 4, no. 1: 8. https://0-doi-org.brum.beds.ac.uk/10.3390/fishes4010008