Article

The Dietary Lipid Content Affects the Tissue Gene Expression of Muscle Growth Biomarkers and the GH/IGF System of Pejerrey (Odontesthes bonariensis) Juveniles

by
Pedro Gómez-Requeni
,
Mauricio Nestor Kraemer
and
Luis Fabián Canosa
*
Instituto Tecnológico de Chascomús (INTECH)-CONICET-UNSAM, Intendente Marino km 8.200, C.C. 164, Chascomús, Buenos Aires B7130IWA, Argentina
*
Author to whom correspondence should be addressed.
Present address: BioMar A/S, Mylius Erichsensvej 35, 7330 Brande, Denmark.
Present address: CENEXA-UNLP-CONICET, Facultad de Ciencias Médicas, piso 4, Calle 60 y 120, La Plata, Buenos Aires B1900, Argentina.
Submission received: 15 May 2019 / Revised: 7 June 2019 / Accepted: 10 June 2019 / Published: 27 June 2019

Abstract

:
Gene expression of growth hormone receptors (GHRs), insulin-like growth factors (IGFs), myostatin (MSTN) and myogenin (MyoG) was analyzed in juveniles pejerrey fed with graded levels of lipids (L): 6% (L6), 10% (L10), 25% (L25). After 14 weeks, no changes were found in liver GHR-I GHR-II and IGF-II mRNA levels whereas IGF-I decreased in L10 and L25. Muscle GHR-I gene expression increased in L25 whereas GHR-II, IGF-II and MyoG were higher in L6. IGF-I and MSTN expression was not affected by the different diets. Adipose IGF-I mRNA levels decreased in L10. Correlations between body weight and members of GH/IGF system in liver and skeletal muscle were found only in L10 group. Correlations found in L10 group between both liver and skeletal muscle GHR-I and IGF-I were lost in either L6 or L25 groups. Thus, fish fed with apparently unbalanced dietary lipid contents (6% and 25%) exhibit a compensatory regulation of systemic and local components of the GH/IGF axis. Furthermore, the marked inhibition of muscle MyoG gene expression in L25 might limit excessive lipid deposition and fish growth. Our data suggest that a dietary lipid contents of 10% would promote a particular adjustment of the endocrine and autocrine/paracrine GH/IGF system, stimulating body growth and perhaps muscle hyperplasia. On the other hand, a higher dietary lipid content would uncouple the GH/IGF system, reducing hepatic IGF-I, while slightly increasing hepatic GHR-I, probably to prompt lipolysis.

1. Introduction

In vertebrates, the endocrine control of growth works through the somatotropic axis, which is ruled by the growth hormone (GH), the GH receptors (GHRs) and the insulin-like growth factors (IGFs). GH can stimulate the synthesis of IGFs (mainly IGF-I and IGF-II) in liver and extra-hepatic tissues such as the skeletal muscle that, if translated, can act in an endocrine and autocrine–paracrine manner to promote cell differentiation and proliferation, skeletal elongation, and body growth [1,2,3,4] Body growth consists mainly in the deposition of protein in muscle and, in addition to the GH/IGF axis, it is also regulated by different families of growth factors including the myogenic regulatory factors (MRFs) and the transforming growth factor-β (TGF-β) [5]. The MRFs play a key role in muscle cell specification, differentiation and the activation of muscle-specific gene expression [1,3,6] and include MyoD, Myf-5, myogenin (MyoG), and MRF4. These proteins share a highly conserved basic helix-loop-helix (bHLH) domain that dimerizes with ubiquitous bHLH proteins, bind to a DNA consensus sequence E-box (CANNTG) and eventually activate muscle-specific transcription [7,8]. In particular, MyoG plays a central role in muscle differentiation controlling both the onset of myoblast fusion and the maturation of myofibers [6,9,10]. On the contrary, myostatin (MSTN), a member of the TGF-β superfamily, strongly inhibits skeletal muscle mass reducing the number of myoblasts and fiber enlargement in terapods [11,12,13,14]. Fish MSTN has been detected in several tissues other than skeletal muscles, including gills, kidney and gonads; this indicates that MSTN is involved in numerous physiological activities [5]. In fact, Williams and colleagues [15] have proposed mice MSTN as a legitimate endocrine regulator of the GH/IGF axis. In terms of muscle development, transgenic zebrafish over-expressing the MSTN pro-domain (which inhibits MSTN function) provoked moderate weight gain of the fish [16]. However, rainbow trout primary myosatellite cells showed contradictory results. Thus, whereas Garikipati and Rodgers [17] evidenced that MSTN is a stimulator of myosatellite cell differentiation, Seiliez and colleagues [18] showed that under their experimental conditions, human MSTN inhibited myoblast proliferation, but did not affect differentiation. Conversely, silencing the MSTN gene led to a dramatic weight gain and evidences of a concomitant muscle growth by either hyperplasia (recruitment of myoblasts into new fibers) or hypertrophy (incorporation of myoblasts into pre-existent fibers) in zebrafish [19,20,21] and medaka [22]. Nevertheless, both sequence and biological functions are highly conserved in vertebrates [23].
The pejerrey (Odontesthes bonarienis) is an atherinid eurihaline fish very appreciated by South American and foreign consumers, especially from Japan, due to its high-quality flesh. For this reason, the pejerrey has been considered as a promissory fish species for the aquaculture industry, and important advances in larvae and caged culture at a commercial scale have been achieved for this species [24,25,26,27,28,29,30]. However, the slow growth rates obtained with captive pejerrey is one of the bottle-necks that hinder the proper development of the aquaculture activity of this fish species [27,28,31]. The main reason of the impaired growth in captivity is the scarce knowledge of nutritional requirements for larvae and juveniles of this species. Indeed, few studies have so far focused on the physiologic and endocrine response of larvae and juveniles pejerrey to variation in dietary formulations, and their impact over somatic growth [26,27,28,32,33]. In pejerrey, the GH and IGF-I have been cloned and characterized [34,35] and the effects of an oral administration of recombinant pejerrey GH (r-pjGH) on growth and muscle hypertrophy has been studied [36]. In this work, authors found a 30% increase in the mean body weight of fish fed for 28 days with a 1.5% lipid based-diet containing 2 mg r-pjGH/g body weight, probably due to the stimulation of liver IGF-I mRNA expression. However, the difference in size between the treatment and control group disappeared after 42 days of feeding. Interestingly, the experimental group fed with 20 mg r-pjGH/g body weight showed a dramatic decrease in body weight at 42 days when compared with the control and the 10-fold lower GH dose-fed groups. This growth impairment, despite the stimulation of muscle hypertrophy and the lack of adipose tissue found in fish belonging to both GH-treated groups, indicated a potential limitation of dietary energy supply (in the form of lipid), which was even exacerbated by the lipolytic effect of GH [1,37].
Although it is known that the fatty acids composition of the diet can alter the regulation of the GH/IGF axis [38] the effects of different dietary lipid contents in the regulation of growth genes has been barely studied [39,40]. In our previous study in pejerrey [28], increasing dietary lipids content induced a higher final body weight and body weight increase. In addition, the protein productive value, nitrogen and energy retention were significantly higher in animals fed with 10% and 25% compared to 6% dietary lipid content. However, there were no significant differences between 10% and 25% lipids [28]. Differences between diets containing 10% and 25% of lipids were found only in lipid productive value [28], being higher in fish fed with 10% lipids (61.9 ± 3.81; 25.9 ± 0.34; for 10% and 25%, respectively), suggesting a better lipid utilization is achieved when a moderated dietary content is used. Thus, increasing lipid content beyond 10% apparently had not additional benefits. In fact, 25% lipid-containing diet reduced the lipid retention, total neutral lipase activity while reduced total trypsin activity when compared to 10% lipid diet [28]. In this context, variations in the regulation of GH/IGF axis and muscle development may help to understand the underlaying endocrine mechanism for feed composition influencing growth performance. In addition, these results may give further support for diets election or design. Thus, the aim of the present work was to analyze the response of muscle growth biomarkers MSTN and MyoG, and the tissue gene expression of the GH/IGF system to variations in the dietary lipid contents in order to increase the available information of dietary nutrient effects on growth performance regulation to support the selection of an optimal diet. To address this objective, we first cloned and characterized partial sequences of pejerrey MSTN and MyoG in skeletal muscle tissue samples. Subsequently, we performed an experimental feeding trial in which juvenile pejerrey were fed for 14 weeks with isoproteic diets (approximately 36% of crude protein) containing increasing levels of dietary lipids (6%, 10% and 25%). At the end of the trial, the gene expression of MyoG, MSTN, IGF-I, IGF-II, GHR-I, and GHR-II was assessed in juveniles of this teleost species.

2. Material and Methods

2.1. Diets

The experimental diets were formulated using fishmeal and haddock fillet as protein sources. The lipid content of each diet was achieved at the target level (6% DM, diet L6: 10% DM, diet L10 and 25% DM, diet L25) variating fish oil ingredient as lipid source. Soy lecithin was added as additional source of phospholipids obtaining a level of crude protein ranging 36.4–38.2% of dry matter (DM) [28]. The proximate composition of each diet was as follow: 36.53% protein (P), 6.13 lipid (L), 21.95 carbohydrate (C); 36.38 P, 10.2 L, 18.53 C; 38.18 P, 24.79 L, 6.99 C, for L6, L10 and L25 respectively. The energy content obtained for each diet was 12.04 kJ/g (diet L6), 12.96 kJ/g (diet L10) and 16.83 kJ/g (diet L25). For more detail on ingredients and composition of the experimental diets, see reference [28].

2.2. Growth Trial

Juveniles of pejerrey were reared as previously stated [28]. Briefly, fish were randomly distributed into experimental tanks of 300-L capacity and each diet was distributed to triplicate groups of fish for 98 days (14 weeks). Feed was offered to apparent visual satiety in 3 meals per day (10:00 h, 13:00 h, 16:00 h), and feed consumption was recorded daily. Every 14 days, approximately, fish were anesthetized in ice-cold water and body weight determined. In these conditions fish fed with higher dietary lipid content showed, for example, higher body weight (3.89 ± 0.24a g; 5.23 ± 0.37b g; 5.41 ± 0.05b g; p = 0.044 for L6, L10, L25, respectively) and weight increase (196.3 ± 23.9a g; 291.5 ± 24.2b g; 323.6 ± 1.82b g; p = 0.040 for L6, L10, L25, respectively) at the end of the trial. The same trend was found, for example, for the nitrogen retention (19.2 ± 0.69a%; 29.8 ± 2.78b%; 28.8 ± 0.56b%; p = 0.036 for L6, L10, L25, respectively). See reference [28] for more details.
At the end of the experimental period fish were fasted for 24 h, anaesthetized by benzocaine bath (1 mg/L), killed by scission of the spinal cord and liver, skeletal muscle, and adipose tissue were sampled and immediately frozen in liquid nitrogen. Tissue samples were kept at −80 °C until gene expression evaluation by real-time qPCR.
Experiments involving fish were in accordance with the UFAW Handbook on the Care and Management of Laboratory Animals and the INTECH internal regulations.

2.3. Cloning and Sequencing

Total RNA from 50–75 mg of pejerrey muscle was extracted using TRIzol Reagent (Life Technologies, Gaithesburg, MD, USA) according to the manufacturer’s instructions. The RNA extracted was assessed for quality on 1% agarose gel stained with ethidium bromide and quantified by spectrophotometry at 260 nm. A 5 µg aliquot of the purified RNA was treated with RQ1 RNase-Free DNase (Promega Inc., Madison, WI, USA), and 1.5 µg of the DNase treated RNA was subsequently reverse-transcribed with 200 U/µL Superscript II (Life Technologies) using oligo(dT)17 as primer.
The forward and reverse primers used for the cloning partial fragments of MyoG (myog-f1, Tm = 55.4 °C; myog-r1, Tm = 53 °C) and MSTN (mstn-f1, Tm = 59.6 °C; mstn-r1, Tm = 59.9 °C) were designed based on highly conserved regions from teleost orthologues inferred from sequence alignment using the ClustalW method (Table 1). The PCR reactions were carried out using 1 µL of RT products (template), 800 µM of dNTP mixture, 3 mM of MgCl2, 1.5 µL of 5× PCR buffer, 0.2 µM of each primer, and 0.5 U of GoTaq DNA polymerase (Promega Inc.) in a total volume of 15 µL. RT-PCR cycling conditions used were 94 °C for 2 min, 40 reaction cycles consisting of 20 s at 94 °C, 20 s at 55–58 °C, and 40 s at 72 °C, and final elongation of 2 min at 72 °C. The PCR products were run in a 1% agarose gel. Fragments of expected sizes were excised from the gel and extracted with the QIAEX II Gel Extraction Kit (Qiagen Inc., Valencia, Spain) following the manufacturer’s guidelines. The fragments were then cloned into a T-vector (pGEM-T-Easy Vector, Promega Inc.) and sequenced. The resulting partial sequences of MyoG and MSTN have been submitted to the GenBank database under accession no. HM061693 (MyoG) and HM061694 (MSTN).

2.4. Molecular Phylogenetic Anaylsis of MSTN and MyoG Genes

Evolutionary analyses were conducted in MEGA5 program [41]. The evolutionary history was inferred by using the Maximum Likelihood method based on the Tamura–Nei model [42]. The bootstrap consensus tree inferred from 500 replicates were taken to represent the evolutionary history of the taxa analyzed [43]. The analysis involved nucleotide sequences from 22 and 19 vertebrate species using human α-inhibin and mouse follistatin as out-groups for MSTN and MyoG respectively. All positions containing gaps and missing data were eliminated. There was a total of 864 and 394 positions (MSTN and MyoG, respectively) in the final dataset.

2.5. Gene Expression

Total RNA from pejerrey tissues (liver, muscle and adipose) extracted and processed as above mentioned was treated with RQ1 RNase-Free DNase (Promega Inc., Madison, WI, USA). Then 1.5 µg of DNase-treated RNA was reverse-transcribed using 200 U/µL Superscript II (Life Technologies) and oligo(dT)17 as primer.
The mRNA levels of liver, muscle and adipose GHR-I, GHR-II, IGF-I and IGF-II; and muscle MyoG and MSTN were determined by real-time qPCR. Pejerrey β-actin shown no differences among treatments and was considered a good reference gene (Ct = 24.62 ± 0.5; 23.71 ± 0.25; 24.14 ± 0.36; p = 0.26 for L6, L10, and L25 respectively). The specific primers used in this work (Table 1) were designed using Beacon Designer 7 (Premier Biosoft International, Palo Alto, CA, USA). The GeneBank accession numbers of the sequences were as follows: β-actin, EF044319; IGF-I, EU257205; GHR-I, KF055461; GHR-II, KF055460. Sequences of IGF peptides including IGF-II and GH receptors were kindly provided by Silvia E. Arranz (Universidad Nacional de Rosario, Argentina). Real-time qPCR was performed on an Mx3005P QPCR System (Agilent Technologies, Santa Clara, CA, USA). The PCR reactions were carried out in 10 µL final volume, using FastStart Universal SYBR Green Master (ROX; Roche Applied Biosciences, Indianapolis, IN, USA) and specific primers (150 nM each). The thermal profile for real-time PCR was 2 min at 50 °C and 10 min at 95 °C followed by 40 cycles of 15 s at 95 °C and 1 min at 60 °C. Serial dilutions of cDNA were used as standard curves for each gene of interest. Analysis and quantification using the relative standard curve method were carried out with the Stratagene MxPro software (Agilent Technologies). Specificity of amplified PCR products was estimated by the melting curves on real-time PCR assays. Group L6 was designated as reference group. In this group, individual raw data from each tissue sample were normalized to its correspondent β-actin data and the overall mean of the group was calculated. Then, all of the normalized data with β-actin (group L6, L10, L25) were subsequently relativized to the overall mean value of L6 group, which represents the control condition since it is the common lipids levels used at the INTECH aquatic facility.

2.6. Statistics

Data were analyzed by one-way analysis of variance, followed by the Newman–Keuls test at a significance level of p < 0.05. Data that did not pass homogeneity or homoscedasticity tests were log-transformed and re-tested. Correlation analyses were performed by Pearson Product Moment correlation.

3. Results

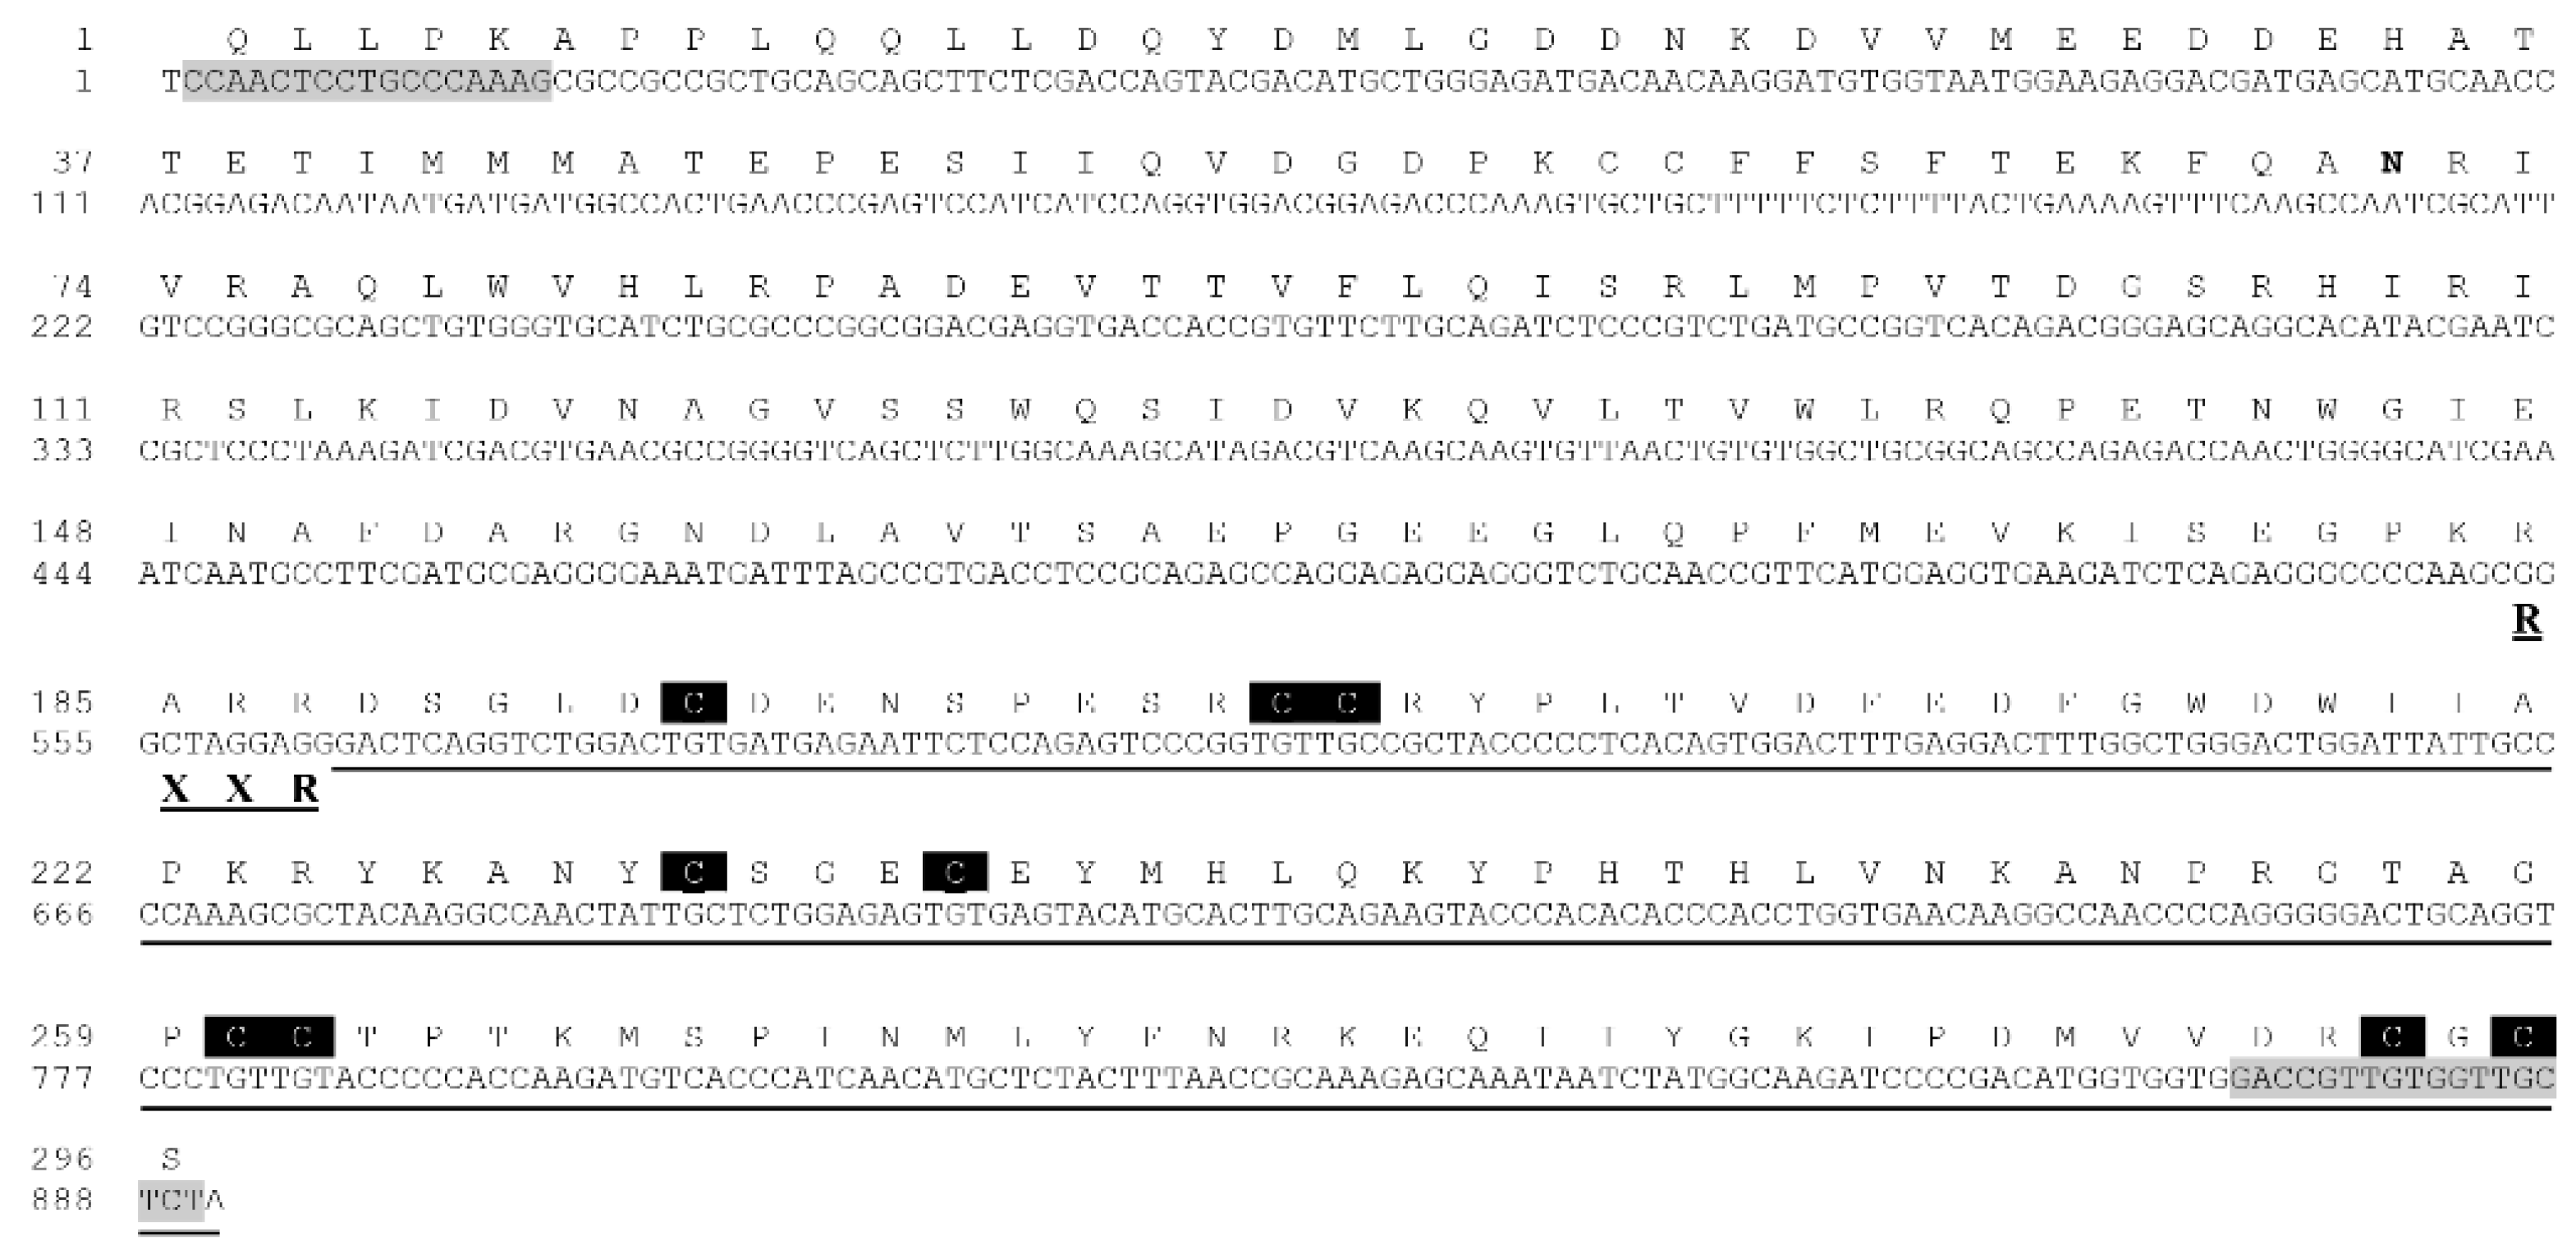
3.1. Partial Cloning of Pejerrey MSTN and MyoG

A partial nucleotide sequence of pejerrey MSTN was determined by RT-PCR, using primers based on available sequences of MSTN of teleost fish. The partial cDNA sequence has 891 bp, encoding 296 amino acid residues which contained 9 cysteine highly conserved in the bioactive domain of TGF-β superfamily [44]. One putative conserved proteolytic RXXR motif for the releasing of the mature peptide (RARR in O. bonariensis sequence) was identified along with one putative glycosylation site (N) in the pro-peptide domain (Figure 1). The overall identity of the deduced partial amino acid sequence of pejerrey MSTN remained high compared with MSTN of other teleost fish such as turbot (93.2%), gilthead seabream (91.5%), Atlantic salmon (91.2%), tilapia (90.5%), carp (90.2%), medaka (89.5%), fugu (89.1%) and zebrafish (88.1%) (Figure S1). Similarly, a partial nucleotide sequence of pejerrey MyoG was also cloned and sequenced. The partial cDNA sequence of MyoG has 447 bp which encode 149 amino acid residues. Also, the cDNA sequence contains the Hys/Cys-rich and basic helix-loop-helix (bHLH) domains characteristic of myogenic regulatory factors (Figure 2). Multi-sequence alignment showed that pejerrey MyoG has a high degree of global conservation with homologous proteins from other fish species such as tilapia (97.3%), gilthead seabream and pufferfish (95.3%), fugu (93.9%), sole (93.2%), salmon (85.4%), carp (78%), zebrafish (77.4%), and catfish (76.1%) (Figure S2).

3.2. Phylogenetic Analysis of Pejerrey MSTN and MyoG

Phylogenetic analysis of sequences of both MSTN and MyoG were obtained and are presented in supplementary data in Figures S3 and S4, respectively. In the case of MSTN (Figure S3), the pejerrey sequence is grouped along sequences from teleosts and, as expected, separated from tetrapod species. The sequences of Salmoniformes species are clearly grouped in a subclade separated from Acanthopterygii species including pejerrey. Pejerrey MSTN is in close relatioship to O. latipes and O. mossambicus. Similarly, the pejerrey MyoG sequence was included within the same clade grouping several teleosts fish species, separated from tetrapods species. Teleost sequences were divided into two subclades, one containing Ostariophysi species and the other grouping species representing Salmoniformes and Perciformes along with pejerrey. As in the case of MSTN, the pejerrey MyoG (Figure S4) was grouped together with species of the genus Oreochromis.

3.3. Gene Expression

Data on hepatic, skeletal muscle, and adipose tissue expression of the GH/IGF system and muscle MSTN and MyoG from fish fed with the experimental diets are summarized in Table 2.
Following overnight fasting, we did not find significant differences in the gene expression of GHR-I, GHR-II or IGF-II mRNA levels. Fish fed with diet L6 showed significantly higher hepatic IGF-I mRNA levels than fish fed with diets L10 and L25.
The dietary treatments significantly affected the skeletal muscle expression of the GH/IGF system. GHR-I mRNA transcripts significantly decreased in group L10 when compared to group L25 whereas the expression of IGF-I mRNA transcripts was not significantly affected. The mRNA levels of both GHR-II and IGF-II were significantly higher in fish fed with diet L6. The same pattern was found on the skeletal muscle expression of MyoG mRNA. The mRNA transcripts of MSTN, however, did not differ among the dietary treatments.
In the adipose tissue, the gene expression of GHR-I did not change, whereas a significant reduction in IGF-I mRNA levels was found in fish fed with diet L10. Similarly, the amount of mRNA transcripts of GHR-II and IGF-II was not significantly affected by the dietary treatment.
Table 3 shows the significant correlation analysis of gene expression in the liver, skeletal muscle and adipose tissue of fish fed with the 3 experimental diets. In addition, scatter plots for these datasets are shown in Figures S5–S7. We analyzed the correlations between fish body weight reported in [28] and the expression levels of GH/IGF system measured in the present paper. Previously, we have shown that dietary lipid contents higher than 6% induced an increase in the growth rates and final body weight by 35–39%. Furthermore, the nitrogen retention was increased by an additional 10%, which suggests a better utilization of the dietary protein for growth purposes (see reference [28]). Thus, we found in the liver a significant positive correlation in group L10 between body weight and the expression levels of both IGF-I and GHR-I. In addition, the expression levels of GHR-I versus IGF-I (L10), and those of GHR-II versus GHR-I and IGF-II (L6, L10 and total) were significantly positive correlated. In the skeletal muscle, significant positive correlations were found between body weight and the expression levels of IGF-II (L10); and between the expression levels of GHR-I versus IGF-I (L6, L10 and total), GHR-II (all groups and total) and IGF-II (L6, L25 and total). In the adipose tissue, among others, a negative correlation was found in group L6 between body weight and the expression levels of GHR-II. As can be seen in Table 3, fish fed with diet L10 showed the highest number of statistically significant correlations between the different parameters analyzed.

4. Discussion

The present work is part of a more complete study aimed to improve our knowledge on the nutritional requirements of pejerrey juveniles, which is currently scarce. As previously shown, in addition to differences in the whole-body composition and digestive enzymes activities, our fish exhibited better results when fed with diets L10 and L25 including higher body weight, and protein and lipid retentions, among others [28]. In the present study we focused on the analysis of the tissue gene expression of members of the GH/IGF system and muscle growth biomarkers MyoG and MSTN; this last being recently proposed as a legitimate endocrine regulator of the GH/IGF axis [15].
In fish, contrary to mammals, muscle recruitment continues throughout the life cycle by mechanisms involving hyperplasia and hypertrophy, both dependent on the species and growth conditions [45]. Thus, whereas growth to a large body size mostly occurs through the recruitment of new muscle fibers (e.g., salmonids), in fish species, reaching a modest ultimate size hyperplasia during adult life is low and muscle growth primarily involves the hypertrophy of fibers formed during the embryo and early larval stage [46]. In the present study, we cloned a partial sequence of the growth biomarkers MSTN and MyoG in order to evaluate the response of the muscle tissue to shifts in the availability of high-energy dietary lipids during the phase of juvenile rapid growth. The cloned MSTN and MyoG cDNAs encode 296 amino acid and 149 amino acid residues, respectively. Similar to what was previously found for other species, the pejerrey MSTN pro-peptide domain contains the bioactive domain of TGF-β superfamily [44] and one putative conserved proteolytic RXXR motif for the releasing of the mature peptide, whereas pejerrey MyoG contains the Hys/Cys-rich and bHLH characteristic of myogenic regulatory factors. As shown before, both MSTN and MyoG sequences from pejerrey were included, as expected, within clades separated from mammal and avian species. Although our pejerrey MSTN was mainly grouped with MSTN-1 sequences from other teleosts species, the potential existence of a MSTN-2 isoform as in the case of salmonids, carp and zebrafish remains to be established.
Studies developed with different fish species have shown that both MyoG and MSTN are nutritionally regulated. Thus, 30 days of starvation [47] and a dietary carbohydrate content higher than 15% [48] provoked a decrease in the muscle expression of rainbow trout (Oncorhynchus mykiss) MyoG and the differentiation process of myogenic precursor cells into myocytes, whereas a re-feeding period following starvation showed the opposite effect [47]. The results obtained in pejerrey show an apparent opposite pattern; thus, contrary to rainbow trout [48] MyoG gene expression decreased in fish fed with the lowest contents of dietary carbohydrate (18% and 7%) which corresponds to the highest dietary lipid contents (10% and 25%, respectively) and fish weight gain [28]. This is in accordance with a study developed in Senegalese sole (Solea senegalensis) in which a slight decrease of the muscle MyoG expression was observed when fish were fed with increasing levels of dietary lipids from 4% to 20% [40]. However, and contrary to our results, a decrease of sole growth rates paralleled the decrease of MyoG mRNA levels. Therefore, our results in terms of muscle MyoG may suggest that either (1) muscle hypertrophy is being stimulated in fish fed with diet L6; or (2) the promotion of hypertrophy-driven muscle growth is being slowed down in groups L10 and L25. To elucidate whether MSTN was a supporting actor in the slower growth of fish fed with a 6% of dietary lipids we also evaluated its response to the dietary treatments. In this respect, we did not find significant differences in the gene expression of MSTN among diets although, as it was previously reported in sole [40], those fish that reached a higher body weight tended to exhibit the lowest levels of MSTN mRNA transcripts. In teleost, the roles of MSTN have not been yet fully elucidated. Previous studies developed with a transgenic line of zebrafish (Danio rerio) over-expressing the MSTN prodomain [16] and with zebrafish microinjected with MSTN dsRNA [19] suggested that MSTN inhibits muscle growth driven by only hyperplasia or both hyperplasia and hypertrophia, respectively. On the contrary, other authors have recently demonstrated that recombinant MSTN induces the expression of key MRFs, including MyoG, necessary for the initiation and maintenance of muscle cell differentiation in rainbow trout primary myosatellite cells cultured in conditions of suppressed growth rates [17]. In this latter fish species, however, Seiliez et al. [18] also showed an inhibitory effect of recombinant human MSTN on myoblast proliferation whereas it failed to find a clear effect on differentiation. In this sense, genome duplication events resulted in the production and retention of several MSTN genes in some fish species and, compared to mammals, suggests that MSTN may not be limited to skeletal muscle growth regulation per se but may additionally influence other tissues [49]. In our study, it seems that muscle MSTN was not apparently responsible of the differential regulation of fish growth fed with varying dietary lipid levels. Nevertheless, the myogenesis process is complex and involve the participation of several other myogenic regulatory factors such as Myf5, MyoD, MRF4, and myocyte enhancer factors, etc., [6,50] and more research is required to corroborate these hypotheses. In this scenario, histological studies of the muscle tissues might have been useful to elucidate the prevalent mechanisms of myocytes growth in pejerrey fed with different levels of dietary lipids. Even though, based on the lower amount of MyoG mRNA transcripts found in those fish that reached the highest final body weights (groups L10 and L25) we might hypothesize about an inhibition of hypertrophic growth processes either as an attempt to counteract higher rates of muscle growth hyperplasia or as a mechanism to limit the growth of these fish for reasons that remain to be elucidated. Regarding the former option, it has been previously demonstrated that the contribution of hyperplasia to muscle growth is more important than that of hypertrophy in juveniles of large fish [51] and that fiber recruitment continues until fish reaches approximately 44% of its ultimate body length [46]. Pejerrey, has been characterized as the largest species among atherinopsides or atheriniforms (up to 52 cm of standard length) [52], reaching 49 cm of standard length and 1200 g of body weight in our INTECH indoor aquatic facility (Leandro Miranda, personal communication). Therefore, it seems plausible that hyperplasic growth mechanisms were still active in our fish.
The GH/IGF axis has been proposed in several fish species as a good biomarker of growth and nutritional disorders arising from, among others, the dietary protein and fatty acid sources [3,38,53,54,55,56]. Previous works exploring the effects of the dietary lipid content on the regulation of the GH/IGF axis highlight a species-specific regulation of this endocrine growth axis [27,39,40,57,58,59,60], although additional factors such as the rearing water temperature and quality, oxygen availability, biomass density, and biological value of dietary substrates should not be fully discharged. Thus, in gilthead seabream (Sparus aurata) the use of high energy diets in fish fed until satiety provoked the impairment of feed conversion paralleled to the up-regulation of plasma GH levels probably to promote lipolysis and prevent further weight gain and adiposity in overfed fish [39,57]. This strategy would thus protect adipose and other tissues from excessive lipid deposition when energy is largely available. In our study, the decrease of hepatic IGF-I in fish fed with diet L25 (and, to a lesser extent, L10) in parallel to the slight increase of GHR-I might also point out to an inhibition of the endocrine growth-promoting mechanisms via IGFs in order to, probably, prioritize the lipolytic actions of available GH in those fish that exhibited higher hepatosomatic and mesenteric fat indices [28]. Adipose expression of IGF-I dramatically decreased in fish fed with diet L10, whereas that of GHR-I and GHR-II did not significantly vary; therefore, potentially limiting the increase in the number and/or size of adipose cells while maintaining the capacity to adjust the cell homeostasis through GH-dependent lipolytic mechanisms. Moreover, mechanisms to prevent further weight gain mainly in fish fed with diet L10 are also evident through the autocrine/paracrine regulation of the skeletal muscle growth. Hence, both GHRs and IGF-II are down-regulated in the skeletal muscle of fish fed with diet L10 in parallel to MyoG. In fish, IGF-II is considered as an important growth-promoting factor through all the life cycle and it is expressed at a high rate in the muscle of fast-growing families of channel catfish and juvenile rainbow trout during re-feeding [61]. In an experiment similar to ours [40], authors showed a slight non-significant down-regulation of muscle IGF-II gene expression in sole fed with increasing dietary lipid contents in parallel to the decrease of growth rates (diet 4% > diet 12% ≥ diet 20%). On the contrary, juveniles of gilthead seabream fed practical diets with increased amounts of feed-borne contaminants and Atlantic halibut (Hippoglossus hippoglossus) under a fasting regime showed compensatory increases of muscle IGF-II [38,62]. Also, in seabream and Mozambique tilapia (Oreochromis mossambicus) muscle GHR-II was up-regulated in response to fasting probably in an attempt to adjust muscle growth and metabolism through the mobilization of local energy depots [63,64]. Therefore, in juveniles of pejerrey high expression levels of muscle GHRs and IGF-II in group L6 and GHR-I in group L25 point out to locally enhanced GHRs expression to face up a putative malfunction of the hepatic GH/IGF-I axis [65] due to undernourishment (diet L6) and excessive liver engrossment (diet L25). Although the determination of plasma GH and IGF-I levels would probably clarify some of these hypotheses, unfortunately the small size of the fish did not allow us to obtain blood samples to develop plasma hormone analysis.
It is interesting to note that in fish fed with diet L10 (and, to a lesser extent, diet L25) most of the genes analyzed significantly correlated among them in the adipose tissue, liver and especially in the muscle. In the adipose tissue, the negative correlation found between the fish body weight and the gene expression of GHR-II in diet L6 might point out to an attempt to avoid a complete depletion of the scarce energy reserves through GH-mediated lipolysis with the increase in body size. This scenario would agree with the lower MFI and body lipid levels found in fish fed with this diet [28] and would reinforce the idea of a lipid deficiency in diet L6. It is possible that the energy demands of these fish are partially met by the mobilization of hepatic lipid stores through an increase of GHR-II gene expression, which would be in concordance with the lower HSI also exhibited by these fish [28]. Interestingly, the hepatic gene expression of GHRs and IGFs correlates positively among each other in fish fed with diet L10, suggesting a particular fine tuning of the endocrine growth axis in these fish. This view is reinforced by the significant correlations found between the final body weight of the fish and the gene expression of both GHR-I and IGF-I, the main modulators of systemic GH-promoted growth actions. In line with this, in the previous paper we showed that increasing dietary lipid contents from 6% to 10% induced an increase in the growth rates and final body weight by 35%, and the nitrogen and energy retention as well as the lipid and protein productive values were also increased, which suggests better utilization of the dietary protein for growth purposes [28]. These well-orchestrated adjustments of the endocrine GH/IGF axis in fish fed with diet L10 may be also perceived at a local level in the skeletal muscle, including a correlation between the final body weight of the fish and the IGF-II gene expression.
In summary, it seems evident that the dietary lipid composition greatly influences the expression of genes involved in the regulation of pejerrey growth. Fish fed with apparently unbalanced dietary lipid contents (6% and 25%) exhibited a compensatory regulation of systemic and local components of the GH/IGF axis. In concordance to our previous complementary study [28], the present data strongly suggest that dietary lipid contents around 10% promote the growth of the fish through particularly well-orchestrated adjustments of the endocrine and autocrine/paracrine GH/IGF system. However, these promising results must be taken with caution and more extensive experiments are needed to properly adjust the levels of dietary carbohydrates as well, which in diet L10 seems to be close to the tolerable limit for pejerrey.

Supplementary Materials

The following are available online at https://0-www-mdpi-com.brum.beds.ac.uk/2410-3888/4/3/37/s1, Figure S1: alignment of MSTN sequences, Figure S2: alignment of MyoG sequences, Figure S3: phylogenetic analysis of MSTN sequences, Figure S4: phylogenetic analysis of MyoG sequences, Figure S5: liver data for correlation analysis, Figure S6: muscle data for correlation analysis, Figure S7: adipose tissue data for correlation analysis.

Author Contributions

Funding acquisition, L.F.C.; Investigation, P.G.-R. and M.N.K.; Supervision, L.F.C.; Writing—original draft, P.G.-R.; Writing—review and editing, L.F.C.

Funding

This research was supported by the Agencia Nacional de Promoción Científica y Técnica (ANPCyT) through the following grants: PICT-2010-1493 and PICT-2006-074 to LFC.

Acknowledgments

PG-R was postdoctoral fellow from the Consejo Nacional de Investigaciones Científicas y Técnicas (CONICET, Argentina). MNK was doctoral fellow from CONICET. The authors would like to thank Silvia E. Arranz from Universidad Nacional de Rosario, Argentina, for kindly providing pejerrey GHRs and IGFs sequences.

Conflicts of Interest

The authors declare no conflict of interest.

References

  1. Vélez, E.J.; Perelló-Amorós, M.; Lutfi, E.; Azizi, S.; Capilla, E.; Navarro, I.; Pérez-Sánchez, J.; Calduch-Giner, J.A.; Blasco, J.; Fernández-Borràs, J.; et al. A long-term growth hormone treatment stimulates growth and lipolysis in gilthead sea bream juveniles. Comp. Biochem. Physiol. 2019, 232, 67–78. [Google Scholar] [CrossRef] [PubMed]
  2. Picha, M.E.; Turano, M.J.; Beckman, B.R.; Borski, R.J. Endocrine biomarkers of growth and applications to aquaculture: A minireview of growth hormone, insulin-like growth factor (IGF)-I, and IGF-binding proteins as potential growth indicators in fish. N. Am. J. Aquac. 2008, 70, 196–211. [Google Scholar] [CrossRef]
  3. Vélez, E.J.; Lutfi, E.; Azizi, S.; Perelló, M.; Salmerón, C.; Riera-Codina, M.; Ibarz, A.; Fernández-Borràs, J.; Blasco, J.; Capilla, E.; et al. Understanding fish muscle growth regulation to optimize aquaculture production. Aquaculture 2017, 467, 28–40. [Google Scholar] [CrossRef]
  4. Pérez-Sánchez, J.; Simó-Mirabet, P.; Naya-Català, F.; Martos-Sitcha, J.A.; Perera, E.; Bermejo-Nogales, A.; Benedito-Palos, L.; Calduch-Giner, J.A. Somatotropic axis regulation unravels the differential effects of nutritional and environmental factors in growth performance of marine farmed fishes. Front. Endocrinol. 2018, 9, 687. [Google Scholar] [CrossRef] [PubMed]
  5. De-Santis, C.; Jerry, D.R. Candidate growth genes in finfish—Where should we be looking? Aquaculture 2007, 272, 22–38. [Google Scholar] [CrossRef]
  6. Buckingham, M.; Rigby, P.W.J. Gene Regulatory Networks and Transcriptional Mechanisms that Control Myogenesis. Dev. Cell 2014, 28, 225–238. [Google Scholar] [CrossRef] [PubMed] [Green Version]
  7. Edmondson, D.G.; Olson, E.N. Helix-loop-helix proteins as regulators of muscle-specific transcription. J. Biol. Chem. 1993, 268, 755–758. [Google Scholar]
  8. Olson, E.N.; Klein, W.H. bHLH factors in muscle development: Dead lines and commitments, what to leave in and what to leave out. Genes Dev. 1994, 8, 1–8. [Google Scholar] [CrossRef]
  9. Hasty, P.; Bradley, A.; Morris, J.H.; Edmondson, D.G.; Venuti, J.M.; Olson, E.N.; Klein, W.H. Muscle deficiency and neonatal death in mice with a targeted mutation in the myogenin gene. Nature 1993, 364, 501–506. [Google Scholar] [CrossRef]
  10. Nabeshima, Y.; Hanaoka, K.; Hayasaka, M.; Esumi, E.; Li, S.; Nonaka, I.; Nabeshima, Y. Myogenin gene disruption results in perinatal lethality because of severe muscle defect. Nature 1993, 364, 532–535. [Google Scholar] [CrossRef]
  11. McPherron, A.C.; Lawler, A.M.; Lee, S.J. Regulation of skeletal muscle mass in mice by a new TGF-beta superfamily member. Nature 1997, 387, 83–90. [Google Scholar] [CrossRef] [PubMed]
  12. Ríos, R.; Carneiro, I.; Arce, V.M.; Devesa, J. Myostatin is an inhibitor of myogenic differentiation. Am. J. Physiol. Cell Physiol. 2002, 282, C993–C999. [Google Scholar] [CrossRef] [PubMed] [Green Version]
  13. Joulia, D.; Bernardi, H.; Garandel, V.; Rabenoelina, F.; Vernus, B.; Cabello, G. Mechanisms involved in the inhibition of myoblast proliferation and differentiation by myostatin. Exp. Cell Res. 2003, 286, 263–275. [Google Scholar] [CrossRef]
  14. McCroskery, S.; Thomas, M.; Maxwell, L.; Sharma, M.; Kambadur, R. Myostatin negatively regulates satellite cell activation and self-renewal. J. Cell Boil. 2003, 162, 1135–1147. [Google Scholar] [CrossRef] [PubMed] [Green Version]
  15. Williams, N.G.; Interlichia, J.P.; Jackson, M.F.; Hwang, D.; Cohen, P.; Rodgers, B.D. Endocrine actions of myostatin: Systemic regulation of the IGF and IGF binding protein axis. Endocrinology 2011, 152, 172–180. [Google Scholar] [CrossRef] [PubMed]
  16. Xu, C.; Wu, G.; Zohar, Y.; Du, S.J. Analysis of myostatin gene structure, expression and function in zebrafish. J. Exp. Biol. 2003, 206, 4067–4079. [Google Scholar] [CrossRef] [PubMed]
  17. Garikipati, D.K.; Rodgers, B.D. Myostatin regulation of myosatellite cells in a novel model system: II. Differentiation and gene subfunctionalization. Am. J. Physiol. Regul. Integr. Comp. Physiol. 2012, 302, R1059–R1066. [Google Scholar] [CrossRef] [PubMed]
  18. Seiliez, I.; Sabin, N.; Gabillard, J.C. Myostatin inhibits proliferation but not differentiation of trout myoblasts. Mol. Cell. Endocrinol. 2012, 351, 220–226. [Google Scholar] [CrossRef]
  19. Acosta, J.; Carpio, Y.; Borroto, I.; Gonzalez, O.; Estrada, M.P. Myostatin gene silenced by RNAi show a zebrafish giant phenotype. J. Biotechnol. 2005, 119, 324–331. [Google Scholar] [CrossRef]
  20. Lee, C.-Y.; Hu, S.-Y.; Gong, H.-Y.; Chen, M.H.-C.; Lu, J.-K.; Wu, J.-L. Suppression of myostatin with vector-based RNA interference causes a double-muscle effect in transgenic zebrafish. Biochem. Biophys. Res. Commun. 2009, 387, 766–771. [Google Scholar] [CrossRef]
  21. Gao, Y.; Dai, Z.; Shi, C.; Zhai, G.; Jin, X.; He, J.; Lou, Q.; Yin, Z. Depletion of myostatin b promotes somatic growth and lipid metabolism in zebrafish. Front. Endocrinol. 2016, 7, 88. [Google Scholar] [CrossRef]
  22. Chisada, S.I.; Okamoto, H.; Taniguchi, Y.; Kimori, Y.; Toyoda, A.; Sakaki, Y.; Takeda, S.; Yoshiura, Y. Myostatin-deficient medaka exhibit a double-muscling phenotype with hyperplasia and hypertrophy, which occur sequentially during post-hatch development. Dev. Biol. 2011, 359, 82–94. [Google Scholar] [CrossRef] [PubMed] [Green Version]
  23. Gabillard, J.-C.; Biga, P.R.; Rescan, P.-Y.; Seiliez, I. Revisiting the paradigm of myostatin in vertebrates: Insights from fishes. Gen. Comp. Endocrinol. 2013, 194, 45–54. [Google Scholar] [CrossRef] [PubMed]
  24. Somoza, G.M.; Miranda, L.A.; Berasain, G.E.; Colautti, D.; Remes Lenicov, M.; Strüssmann, C.A. Historical aspects, current status and prospects of pejerrey aquaculture in South America. Aquac. Res. 2008, 39, 784–793. [Google Scholar] [CrossRef]
  25. Colautti, D.C.; Garcia de Souza, J.R.; Balboni, L.; Baigún, C.R.M. Extensive cage culture of pejerrey (Odontesthes bonariensis) in a shallow pampean lake in Argentina. Aquac. Res. 2010, 41, e376–e384. [Google Scholar] [CrossRef]
  26. Hualde, J.P.; Ceferino Torres, W.D.; Moreno, P.; Ferrada, M.; Demicheli, M.A.; Molinari, L.J.; Luquet, C.M. Growth and feeding of Patagonian pejerrey Odontesthes hatcheri reared in net cages. Aquac. Res. 2011, 42, 754–763. [Google Scholar] [CrossRef]
  27. Gomez-Requeni, P.; Kraemer, M.N.; Canosa, L.F. Regulation of somatic growth and gene expression of the GH-IGF system and PRP-PACAP by dietary lipid level in early juveniles of a teleost fish, the pejerrey (Odontesthes bonariensis). J. Comp. Physiol. B 2012, 182, 517–530. [Google Scholar] [CrossRef] [PubMed]
  28. Gómez-Requeni, P.; Bedolla-Cázares, F.; Montecchia, C.; Zorrilla, J.; Villian, M.; Toledo-Cuevas, E.M.; Canosa, F. Effects of increasing the dietary lipid levels on the growth performance, body composition and digestive enzyme activities of the teleost pejerrey (Odontesthes bonariensis). Aquaculture 2013, 416–417, 15–22. [Google Scholar] [CrossRef]
  29. Bertucci, J.I.; Tovar, M.O.; Blanco, A.M.; Gomez-Requeni, P.; Unniappan, S.; Canosa, L.F. Influence of water salinity on genes implicated in somatic growth, lipid metabolism and food intake in Pejerrey (Odontesthes bonariensis). Comp. Biochem. Physiol. B Biochem. Mol. Biol. 2017, 210, 29–38. [Google Scholar] [CrossRef]
  30. Bertucci, J.I.; Tovar, M.O.; Unniappan, S.; Navarro, J.C.; Canosa, L.F. Effects of dietary sunflower oil on growth parameters, fatty acid profiles and expression of genes regulating growth and metabolism in the pejerrey (Odontesthes bonariensis) fry. Aquac. Nutr. 2018, 24, 748–757. [Google Scholar] [CrossRef]
  31. Miranda, L.A.; Berasain, G.E.; Velasco, C.A.M.; Shirojo, Y.; Somoza, G.M. Natural spawning and intensive culture of pejerrey Odontesthes bonariensis juveniles. Biocell 2006, 30, 157–162. [Google Scholar] [PubMed]
  32. Toledo-Cuevas, E.M.; Moyano López, F.J.; Ramírez, D.T.; Strüssmann, C.A.; Álvarez-González, C.A.; Martínez-Chávez, C.C.; Martínez-Palacios, C.A. Development of digestive biochemistry in the initial stages of three cultured Atherinopsids. Aquac. Res. 2011, 42, 776–786. [Google Scholar] [CrossRef]
  33. Piedras, S.R.N.; Pouey, J.L.O.F.; Rutz, F. Effect of methionine and lysine supplementation on growth and survival of pejerrey (Odontesthes bonariensis) fingerlings. Rev. Bras. Zootec. 2004, 33, 1366–1371. [Google Scholar] [CrossRef]
  34. Sciara, A.A.; Rubiolo, J.A.; Somoza, G.M.; Arranz, S.E. Molecular cloning, expression and immunological characterization of pejerrey (Odontesthes bonariensis) growth hormone. Comp. Biochem. Physiol. C Toxicol. Pharmacol. 2006, 142, 284–292. [Google Scholar] [CrossRef] [PubMed]
  35. Sciara, A.A.; Somoza, G.M.; Arranz, S.E. Insulin-like growth factor-I of pejerrey, Odontesthes bonariensis: cDNA characterization, tissue distribution and expression profiles after growth hormone administration. J. Exp. Zool. Part A Ecol. Genet. Physiol. 2008, 309, 407–418. [Google Scholar] [CrossRef] [PubMed]
  36. Sciara, A.A.; Vigliano, F.A.; Somoza, G.M.; Arranz, S.E. Muscular hypertrophy and growth-promoting effects in juvenile pejerrey (Odontesthes bonariensis) after oral administration of recombinant homologous growth hormone obtained by a highly efficient refolding process. Aquac. Res. 2011, 42, 844–857. [Google Scholar] [CrossRef]
  37. Albalat, A.; Gomez-Requeni, P.; Rojas, P.; Medale, F.; Kaushik, S.; Vianen, G.J.; Van den Thillart, G.; Gutierrez, J.; Perez-Sanchez, J.; Navarro, I. Nutritional and hormonal control of lipolysis in isolated gilthead seabream (Sparus aurata) adipocytes. Am. J. Physiol. Regul. Integr. Comp. Physiol. 2005, 289, R259–R265. [Google Scholar] [CrossRef] [PubMed]
  38. Benedito-Palos, L.; Saera-Vila, A.; Calduch-Giner, J.-A.; Kaushik, S.; Pérez-Sánchez, J. Combined replacement of fish meal and oil in practical diets for fast growing juveniles of gilthead sea bream (Sparus aurata L.): Networking of systemic and local components of GH/IGF axis. Aquaculture 2007, 267, 199–212. [Google Scholar] [CrossRef]
  39. Company, R.; Calduch-Giner, J.A.; Kaushik, S.; Pérez-Sánchez, J. Growth performance and adiposity in gilthead sea bream (Sparus aurata): Risks and benefits of high energy diets. Aquaculture 1999, 171, 279–292. [Google Scholar] [CrossRef]
  40. Campos, C.; Valente, L.M.; Borges, P.; Bizuayehu, T.; Fernandes, J.M. Dietary lipid levels have a remarkable impact on the expression of growth-related genes in Senegalese sole (Solea senegalensis Kaup). J. Exp. Biol. 2010, 213, 200–209. [Google Scholar] [CrossRef]
  41. Tamura, K.; Peterson, D.; Peterson, N.; Stecher, G.; Nei, M.; Kumar, S. MEGA5: Molecular evolutionary genetics analysis using maximum likelihood, evolutionary distance, and maximum parsimony methods. Mol. Biol. Evol. 2011, 28, 2731–2739. [Google Scholar] [CrossRef] [PubMed]
  42. Tamura, K.; Nei, M. Estimation of the number of nucleotide substitutions in the control region of mitochondrial DNA in humans and chimpanzees. Mol. Biol. Evol. 1993, 10, 512–526. [Google Scholar] [PubMed]
  43. Felsenstein, J. Confidence Limits on Phylogenies: An Approach Using the Bootstrap. Evolution 1985, 39, 783–791. [Google Scholar] [CrossRef]
  44. Daopin, S.; Piez, K.A.; Ogawa, Y.; Davies, D.R. Crystal structure of transforming growth factor-beta 2: An unusual fold for the superfamily. Science 1992, 257, 369–373. [Google Scholar] [CrossRef] [PubMed]
  45. Johnston, I.A.; Moon, T.W. Fine structure and metabolism of multiply innervated fast muscle fibres in teleost fish. Cell Tissue Res. 1981, 219, 93–109. [Google Scholar] [CrossRef] [PubMed]
  46. Weatherley, A.H.; Gill, H.S.; Lobo, A.F. Recruitment and maximal diameter of axial muscle fibres in teleosts and their relationship to somatic growth and ultimate size. J. Fish Biol. 1988, 33, 851–859. [Google Scholar] [CrossRef]
  47. Johansen, K.A.; Overturf, K. Alterations in expression of genes associated with muscle metabolism and growth during nutritional restriction and refeeding in rainbow trout. Comp. Biochem. Physiol. B Biochem. Mol. Biol. 2006, 144, 119–127. [Google Scholar] [CrossRef]
  48. Chapalamadugu, K.C.; Robison, B.D.; Drew, R.E.; Powell, M.S.; Hill, R.A.; Amberg, J.J.; Rodnick, K.J.; Hardy, R.W.; Hill, M.L.; Murdoch, G.K. Dietary carbohydrate level affects transcription factor expression that regulates skeletal muscle myogenesis in rainbow trout. Comp. Biochem. Physiol. B Biochem. Mol. Biol. 2009, 153, 66–72. [Google Scholar] [CrossRef]
  49. Rodgers, B.D.; Garikipati, D.K. Clinical, agricultural, and evolutionary biology of myostatin: A comparative review. Endocr. Rev. 2008, 29, 513–534. [Google Scholar] [CrossRef]
  50. Johnston, I.A.; Bower, N.I.; Macqueen, D.J. Growth and the regulation of myotomal muscle mass in teleost fish. J. Exp. Biol. 2011, 214, 1617–1628. [Google Scholar] [CrossRef] [Green Version]
  51. Stickland, N.C. Growth and development of muscle fibres in the rainbow trout (Salmo gairdneri). J. Anat. 1983, 137 Pt 2, 323–333. [Google Scholar]
  52. Brian, S.; Dyer, H. Systematic revision of the South American silversides (Teleostei, Atheriniformes). Biocell 2006, 30, 69–88. [Google Scholar]
  53. Dyer, A.R.; Barlow, C.G.; Bransden, M.P.; Carter, C.G.; Glencross, B.D.; Richardson, N.; Thomas, P.M.; Williams, K.C.; Carragher, J.F. Correlation of plasma IGF-I concentrations and growth rate in aquacultured finfish: A tool for assessing the potential of new diets. Aquaculture 2004, 236, 583–592. [Google Scholar] [CrossRef]
  54. Gómez-Requeni, P.; Mingarro, M.; Calduch-Giner, J.A.; Médale, F.; Martin, S.A.M.; Houlihan, D.F.; Kaushik, S.; Pérez-Sánchez, J. Protein growth performance, amino acid utilisation and somatotropic axis responsiveness to fish meal replacement by plant protein sources in gilthead sea bream (Sparus aurata). Aquaculture 2004, 232, 493–510. [Google Scholar] [CrossRef]
  55. Gómez-Requeni, P.; Calduch-Giner, J.; Vega-Rubín de Celis, S.; Médale, F.; Kaushik, S.J.; Pérez-Sánchez, J. Regulation of the somatotropic axis by dietary factors in rainbow trout (Oncorhynchus mykiss). Br. J. Nutr. 2005, 94, 353–361. [Google Scholar] [CrossRef] [PubMed]
  56. Hevrøy, E.M.; El-Mowafi, A.; Taylor, R.G.; Olsvik, P.A.; Norberg, B.; Espe, M. Lysine intake affects gene expression of anabolic hormones in atlantic salmon, Salmo salar. Gen. Comp. Endocrinol. 2007, 152, 39–46. [Google Scholar] [CrossRef] [PubMed]
  57. Marti-Palanca, H.; Martinez-Barbera, J.P.; Pendon, C.; Valdivia, M.M.; Perez-Sanchez, J.; Kaushik, S. Growth hormone as a function of age and dietary protein: Energy ratio in a marine teleost, the gilthead sea bream (Sparus aurata). Growth Regul. 1996, 6, 253–259. [Google Scholar]
  58. Company, R.; Calduch-Giner, J.A.; Pérez-Sánchez, J.; Kaushik, S.J. Protein sparing effect of dietary lipids in common dentex (Dentex dentex): A comparative study with sea bream (Sparus aurata) and sea bass (Dicentrarchus labrax). Aquat. Living Resour. 1999, 12, 23–30. [Google Scholar] [CrossRef]
  59. Wille, K.; McLean, E.; Goddard, J.S.; Byatt, J.C. Dietary lipid level and growth hormone alter growth and body conformation of blue tilapia, Oreochromis aureus. Aquaculture 2002, 209, 219–232. [Google Scholar] [CrossRef]
  60. Higgs, D.A.; Sutton, J.N.; Kim, H.; Oakes, J.D.; Smith, J.; Biagi, C.; Rowshandeli, M.; Devlin, R.H. Influence of dietary concentrations of protein, lipid and carbohydrate on growth, protein and energy utilization, body composition, and plasma titres of growth hormone and insulin-like growth factor-1 in non-transgenic and growth hormone transgenic coho salmon, Oncorhynchus kisutch (Walbaum). Aquaculture 2009, 286, 127–137. [Google Scholar]
  61. Chauvigne, F.; Gabillard, J.C.; Weil, C.; Rescan, P.Y. Effect of refeeding on IGFI, IGFII, IGF receptors, FGF2, FGF6, and myostatin mRNA expression in rainbow trout myotomal muscle. Gen. Comp. Endocrinol. 2003, 132, 209–215. [Google Scholar] [CrossRef]
  62. Hagen, Ø.; Fernandes, J.M.O.; Solberg, C.; Johnston, I.A. Expression of growth-related genes in muscle during fasting and refeeding of juvenile Atlantic halibut, Hippoglossus hippoglossus L. Comp. Biochem. Physiol. B Biochem. Mol. Biol. 2009, 152, 47–53. [Google Scholar] [CrossRef] [PubMed]
  63. Saera-Vila, A.; Calduch-Giner, J.-A.; Pérez-Sánchez, J. Duplication of growth hormone receptor (GHR) in fish genome: Gene organization and transcriptional regulation of GHR type I and II in gilthead sea bream (Sparus aurata). Gen. Comp. Endocrinol. 2005, 142, 193–203. [Google Scholar] [CrossRef] [PubMed]
  64. Fox, B.K.; Breves, J.P.; Davis, L.K.; Pierce, A.L.; Hirano, T.; Grau, E.G. Tissue-specific regulation of the growth hormone/insulin-like growth factor axis during fasting and re-feeding: Importance of muscle expression of IGF-I and IGF-II mRNA in the tilapia. Gen. Comp. Endocrinol. 2010, 166, 573–580. [Google Scholar] [CrossRef] [PubMed]
  65. Saera-Vila, A.; Calduch-Giner, J.A.; Perez-Sanchez, J. Co-expression of IGFs and GH receptors (GHRs) in gilthead sea bream (Sparus aurata L.): Sequence analysis of the GHR-flanking region. J. Endocrinol. 2007, 194, 361–372. [Google Scholar] [CrossRef] [PubMed]
Figure 1. Pejerrey myostatin (MSTN) nucleotide sequence. Nucleotide fragments with grey background indicate the primers sequences (MSTN-f1, MSTN-r1). Proteolytic processing site RXXR was highlighted. Nine conserved cysteines in the bioactive TGF-β2 domain (underlined) were marked in white with a black background. A potential N-linked glycosylation site is marked in bold.
Fishes 04 00037 g001
Figure 2. Pejerrey MyoG nucleotide sequence. Nucleotide fragments with grey background indicate the primers sequences (MyoG-f1, MyoG-r1). The underlined amino acid region represents the basic helix-loop-helix (bHLH) domain. A potential N-linked glycosylation site is marked in bold.
Fishes 04 00037 g002
Table 1. Summary of forward (f) and reverse (r) primers used for PCR amplification and real-time qPCR analysis.
Primer NamePrimer Sequence
PCR
MyoG-f15′-GAGCTTTTCGAGACCAATCC
MyoG-r15′-TTGCAGCCTTTCAATGTACTG
MSTN-f15′-TCCAACTCCTGCCCAAAG
MSTN-r15′-TAGAGCAACCACAACGGTC
Real time qPCR
MyoG-f25′-TGAACGAGGCCTTTGATG
MyoG-r25′-GCAGCCTTTCAATGTACTGG
MSTN-f25′-GTGGACTTTGAGGACTTT
MSTN-r25′-CATGTACTCACACTCTCCA
GHRI-f15′-CTTTGGAGAGAGGTGAAACGGTTG
GHRI-r15′-CTTGGGCGTAGAAGTCTGTGTTG
GHRII-f15′-GACGGACCTGGACACGGACTG
GHRII-r15′-ACGGGAGAATGGAGCGGTGAC
IGFI-f15′-CTGCGCAATGGAACAAAG
IGFI-r15′-GAATGAGCGCTAGACATCC
IGFII-f15′-AGCAGAGAACAGCCGAAT
IGFII-r15′-GTAGAGCGTGAGAGCCAG
βACT-f15′-GCTGTCCCTGTACGCCTCTGG
βACT-r15′-GCTCGGCTGTGGTGGTGAAGC
Table 2. Data on tissue expression (arbitrary units) of GHR-I, GHR-II, IGF-I, IGF-II, MSTN and MyoG in fish fed the experimental diets for 14 weeks. (Mean values and standard errors of the mean of 12 fish per dietary treatment).
Diet
L6L10L25
MeanSEMMeanSEMMeanSEMp *
Liver
GHR-I1.000.241.020.231.240.260.76
GHR-II1.000.130.820.090.810.060.43
IGF-I1.00 b0.090.72 a0.110.67 a0.050.02
IGF-II1.000.110.780.091.010.140.31
Skeletal muscle
GHR-I1.00 ab0.150.66 a0.081.06 b0.120.05
GHR-II1.00 b0.160.51 a0.080.56 a0.060.01
IGF-I1.000.141.330.161.240.210.38
IGF-II1.00 b0.110.61 a0.090.79 ab0.130.03
MSTN1.000.110.910.090.910.090.76
MyoG1.00 b0.130.60 a0.050.65 a0.050.01
Adipose tissue
GHR-I1.000.180.990.161.060.140.96
GHR-II1.000.151.200.311.240.210.72
IGF-I1.00 a0.190.37 b0.120.67 ab0.210.05
IGF-II1.000.131.140.231.280.140.50
Values presented are in arbitrary units. * p values result from analysis of variance. Different superscript letters in each row indicate significant differences among dietary treatments (Newman–Keuls test, p < 0.05).
Table 3. Summary of correlation analysis of gene expression in liver, skeletal muscle and adipose tissue of fish fed the experimental diets.
Diet
L6L10L25Total *
rprprprp
Liver
BW vs. GHR-I--0.6750.016----
BW vs. IGF-I--0.6320.037----
GHR-I vs. IGF-I--0.6060.048----
GHR-I vs. GHR-II0.8270.0020.6340.027--0.562<0.001
GHR-II vs. IGF-I------0.4690.005
GHR-II vs. IGF-II0.6760.0320.7740.005--0.5330.002
Skeletal muscle
BW vs. IGF-II--0.5980.040----
GHR-I vs. IGF-I0.5960.0530.8160.001--0.3820.024
GHR-I vs. GHR-II0.877<0.0010.5850.0460.865<0.0010.700<0.001
GHR-I vs. IGF-II0.8030.003--0.5670.0550.651<0.001
GHR-II vs. IGF-II0.891<0.0010.6310.0280.7050.0150.817<0.001
Adipose tissue
BW vs. GHR-II−0.6910.047------
GHR-I vs. IGF-I------0.5950.006
GHR-I vs. GHR-II--0.8080.0150.956<0.0010.655<0.001
GHR-I vs. IGF-II0.7400.0140.7930.0190.8900.0040.744<0.001
GHR-II vs. IGF-II--0.8000.0170.943<0.0010.736<0.001
* Correlations obtained with independence of the dietary treatment; r and p values result from analysis of Pearson Product Moment Correlations (p < 0.05); Body Weight.

