Detection Range of Acoustic Receivers in a Large Hydropower Reservoir


1
Canadian Rivers Institute, Department of Biology, University of New Brunswick, Fredericton, New Brunswick, NB E3B 5A3, Canada
2
The Michener Institute, 222 St. Patrick Street, Toronto, Ontario, ON T6G 2R3, Canada
3
Canadian Rivers Institute, Faculty of Forestry and Environmental Management, University of New Brunswick, Fredericton, New Brunswick, NB E3B 5A3, Canada
*
Author to whom correspondence should be addressed.
Fishes 2019, 4(4), 60; https://0-doi-org.brum.beds.ac.uk/10.3390/fishes4040060
Submission received: 6 November 2019
/
Revised: 6 December 2019
/
Accepted: 9 December 2019
/
Published: 11 December 2019
Abstract
:Acoustic telemetry manufacturers report estimated detection ranges under idealized conditions, but environmental conditions such as water depth, substrate type, and turbulence can affect the range of reliable detection. Range testing of low (Vemco V7 136 dB re 1µPa@1m) and high power (V13 147 dB re 1µPa@1m) acoustic transmitters (tags) was performed near a hydropower generating station and its associated reservoir using both active (mobile; VR100) and passive (stationary; VR2W/VR2Tx) receivers. Low power tags are typically used to track small fish such as juvenile Atlantic salmon (Salmo salar), whereas high power tags are typically used to track larger fish such as adult salmon. The results found herein were applied to concurrent salmon telemetry studies. Detection ranges of the low power tags were within 246–351 ± 20–70 m (mean ± SE), and the high power tags were within 537–1106 ± 53–272 m. Observed detection ranges were comparable or higher to manufacturer estimates for both tag types being detected by passive receivers, and were lower than expected for both tag types being detected by active receivers. Passive receivers were further tested by mooring a fixed sentinel tag (low power) on a receiver line at the hydropower site for 50 days. The sentinel tag detection range of 212 m was less than the expected range of 280–292 m, and was not found to be significantly impacted by wind speed. There was evidence of a hydropower effect on detection probability (up to 95% reduction) of both tag types for the active receiver, and detection ranges were significantly lower at the hydropower site than the reservoir site for the high power tag. The results of this study give insight to the initial design of acoustic telemetry studies beyond what can be gathered from manufacturer’s estimates, but rather near hydropower facilities and within large reservoirs; however, detection ranges reported herein do not replace the importance of range testing in site-specific conditions.
1. Introduction
Acoustic telemetry is a widely used method for tracking aquatic animals, particularly fish [1,2]. Detection range among transmitters (henceforth tags) and receivers is dependent on the technical characteristics of the equipment and environmental conditions [3,4]. Manufacturers of acoustic telemetry equipment can only provide generalized, estimated detection ranges for ‘typical ocean conditions’ because of the variability of equipment and environmental factors inherent within each study. At any site, a general understanding of the expected detection ranges is fundamental for ensuring feasibility (i.e., can a fish be detected effectively), and to determine cost effectiveness (i.e., how many receivers and in what configuration are required to ensure a reasonable detection efficiency). Therefore, site-specific range testing of the equipment in use should be a crucial part of telemetry study design [3,4].
Acoustic environments are influenced by water depth and salinity, substrate types, and surface conditions (e.g., wind), as well as anthropogenic influences, such increases in ambient noise near hydropower dams. Detection range is expected to be lower where salinity levels are high due to increased absorption rates of the acoustic signal [2,5]. Environments with substantial wave action that causes air entrapment can increase sound absorption and acoustic signal scattering [3,5]. Deep waters allow an acoustic signal to travel unimpeded through spherical spreading rather than encountering the surface or bottom, at which point the acoustic signal would spread cylindrically causing it to weaken [5]. Shallow waters where the acoustic signal reaches the bottom could have vegetation that causes attenuation, or substrate types that could dissipate (soft substrates) or reflect/scatter (hard substrates) the signal [3,5]. Anthropogenic activities such as watercraft can also reduce the signal-to-noise ratio.
A specific case in which anthropogenically-caused underwater noise may be increased is around hydropower generating stations. Noise is created by water flow through turbines and spillways, as well as by cavitation [2,6]. Acoustic signals can also be distorted and reflected off concrete and rock structures of dams causing multipath signals [7,8]. While use of acoustic telemetry to examine fish movements close to hydropower facilities is common [9,10], specific studies documenting the effects of these facilities on the acoustic environment and subsequent potential effects on acoustic signal detection are not common, and none were considered in a recent detection range testing literature review [4].
Beyond the environmental conditions impacting detection ranges, the type of acoustic telemetry equipment used also impacts the reliability of detecting an acoustic signal. The tags and receivers selected for use in a study depends upon species-specific criteria for tag type/size and behavior to be examined, as well as the environment in which the tags and receivers will be deployed [7]. Low power tags are smaller, have a relatively short battery life, and are commonly used to tag small fish such as juvenile Atlantic salmon (Salmo salar; smolts), whereas high power tags can accommodate more or larger batteries, and are often used to tag large fish. These tag types differ in size to accommodate their respective acoustic transducers, electronics, and batteries. High power tags output an acoustic signal which propagates farther underwater than low power tags. Passive receivers are typically moored at a fixed location for extended periods of time because they have internal memory that stores telemetry data including tag identification and datetime stamps. Active receivers are mobile and are used for short periods of time to detect tagged individuals as they move along. Active tracking involves the transport of the receiver and associated hydrophone, most typically using a boat, and is therefore used under more benign environmental conditions that allow for safe operation of such equipment. Passive and active receiver types vary in tag detection sensitivities. Active receivers generally have a higher sensitivity than passive receivers, especially when using a directional rather than an omnidirectional hydrophone (Jonathan Mulock, Vemco, personal communication); therefore, active receivers should be able to detect a given tag at a greater distance than passive receivers.
The equipment used in this study were chosen based on the applicability of the range testing results to concurrent studies being conducted on Atlantic salmon within a large hydropower reservoir. Both juvenile (smolts) and adults were detected with acoustic technology provided by Vemco (Amirix, Bedford, NS). We used low power tags for smolts and high power tags for adults. Here, we report on the detection range of low and high power acoustic tags by passive and active receivers at a site close to a hydropower generating station, and a site upstream away from potential generating station noise but still within a large reservoir. It was hypothesized that: (1) detection ranges for both tag and receiver types would approximate the estimated detection ranges provided by the manufacturer; (2) detection ranges would be greater for the active than the passive receiver due to the higher sensitivity of the hydrophone; (3) detection ranges would be greater for the high power than the low power tag; (4) detection ranges would decrease with increasing wind speed (due to wave noise); and (5) the hydropower site would have lower detection ranges in comparison to the reservoir site due to higher background underwater noise levels and/or acoustic scattering off reflective surfaces.
2. Results
2.1. Range Testing Trials
Detection ranges and environmental conditions for each tag trial are shown in Table 1.
At an average wind speed of 2.7 m/s, the manufacturer estimates a detection range for the low power tag of 280–292 m for the passive receiver, and 1065 m for the active receiver. This study found detection ranges that were similar or slightly lower to those predicted by the manufacturer for the passive receiver at the hydropower and reservoir site, respectively (mean ± SE; 307 ± 51 m, 246 ± 48 m), whereas detected ranges were much lower than predicted by the manufacturer for the active receiver (hydropower 232 ± 20 m, reservoir 351 ± 70 m; Figure 1). At the same average wind speed, the manufacturer estimates the high power tag would have detection ranges of 522–539 m for the passive receiver, and 1432 m for the active receiver. Our range testing provided comparable or higher measured ranges for the passive receiver (hydropower 537 ± 53 m, reservoir 897 ± 227 m), and lower measures for the active receiver (hydropower 677 ± 99 m, reservoir 1106 ± 272 m; Figure 2).
Detection ranges did not significantly differ between receiver types for either tag type (two-way ANOVAs, low power F1,20 = 0.000, p = 0.985, high power F1,24 = 1.227, p = 0.279; Figure 1 and Figure 2), but average detection ranges were higher for the active receiver than the passive receiver in all cases except the low power tag at the hydropower site. As was expected, detection ranges were consistently higher for the high power tag than the low power tag (Figure 1 vs. Figure 2).
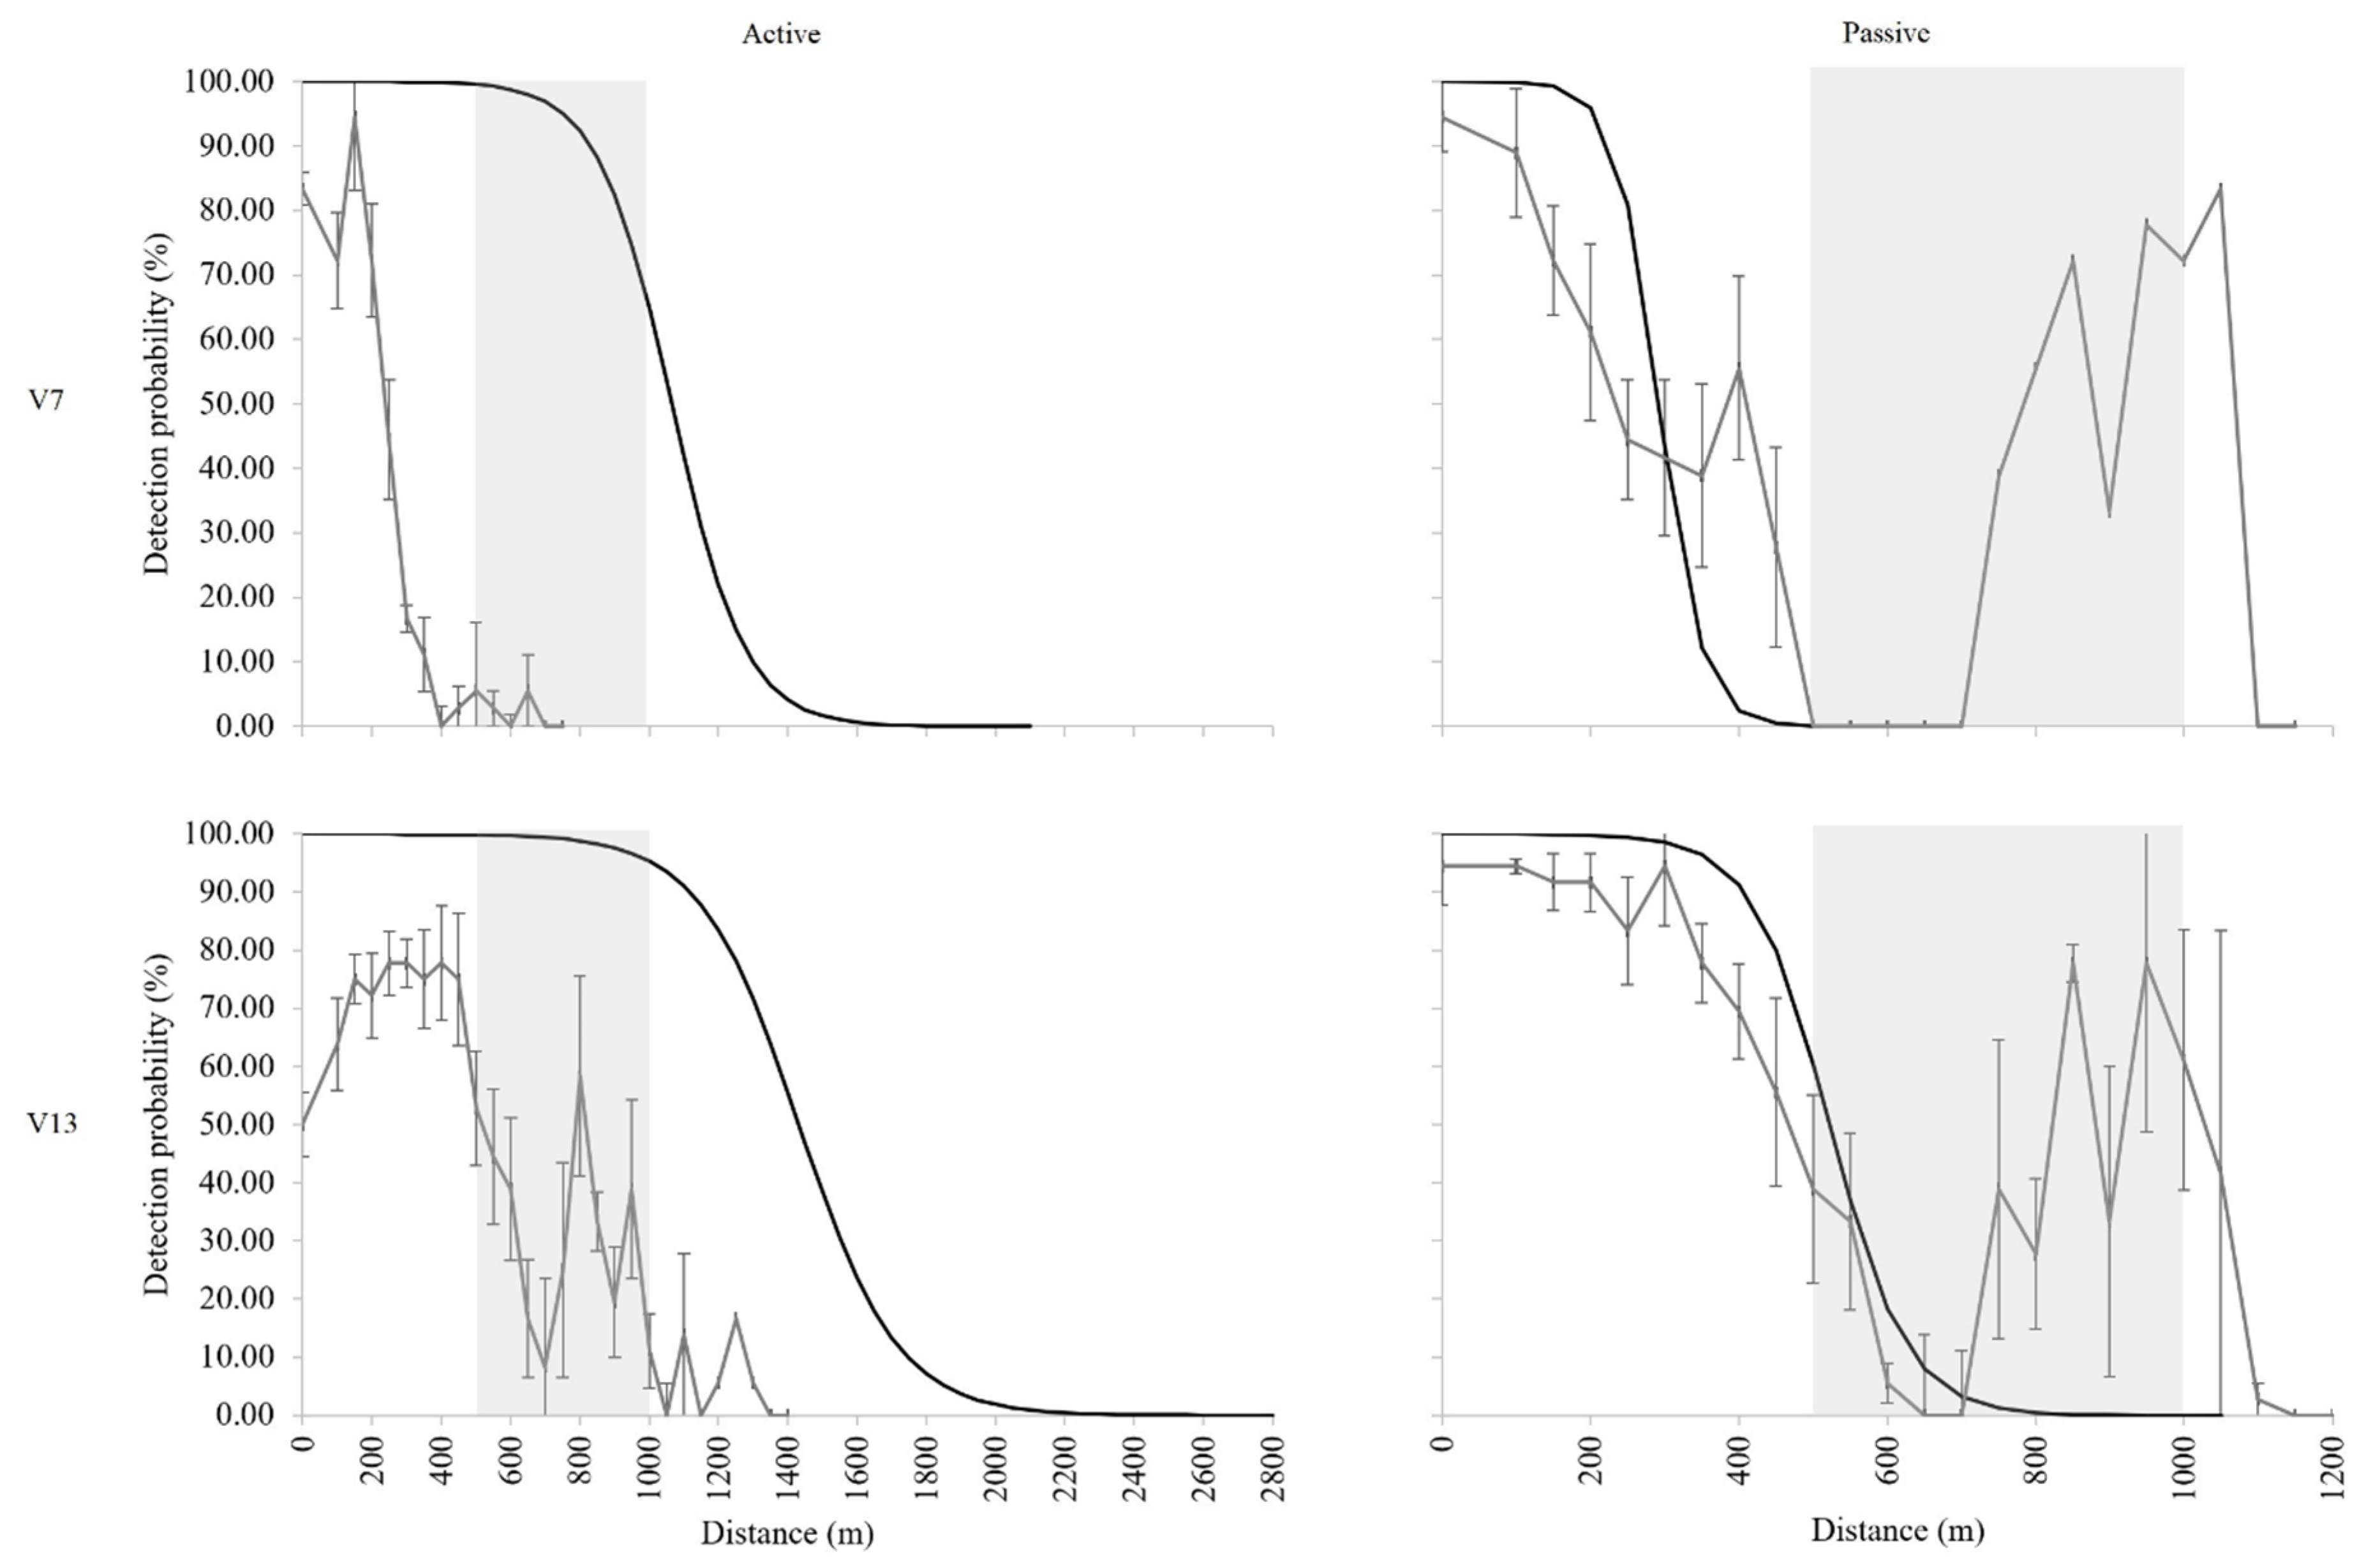
Detection ranges were not significantly different between hydropower and reservoir sites for the low power tag (two-way ANOVA, F1,20 = 0.356, p = 0.558; Figure 1 and Figure 2), but were significantly different for the high power tag (two way ANOVA, F1,24 = 6.596, p = 0.017), with ranges generally being lower near the hydropower facility. Observed detection probabilities of replicate trials for each tag and receiver type at the hydropower site were compared with expected values from the manufacturer to estimate the effect of the hydropower facility on ambient noise levels and/or reflective surfaces potentially decreasing detection efficiencies (Figure 3). Differences between expected and observed detection probabilities were calculated for the area of the Mactaquac generating station (MGS) to estimate a ‘hydropower effect’, but differences in detection probabilities due to other environmental factors would be included in these values. Trials at the hydropower site showed consistently drastic and unexpected reductions in detection probabilities coinciding with the concrete structures, such as the diversion sluiceway (DS) of the MGS between 500–700 m (Figure 3). Notable was also the subsequent and fairly large increase in detection probability from near zero percent to >60% in the 750–1000 m distance along the transect (Figure 3). Differences between expected and observed detection probabilities within the area of the hydropower facility were greatest for the active receiver detecting the low power tag (Figure 3; median reduction of 95%), followed by the active receiver detecting the high power tag (Figure 3; median 65%). For the passive receiver detecting the low power tag (Figure 3), expected values reached zero detection probability before the hydropower facility situated at 500 m along the transect, thus a hydropower effect was not calculated. The passive receiver detecting the high power tag had observed values lower than expected between 500–700 m (Figure 3; median 8%), beyond which observed values substantially exceeded expected values.
2.2. Longer-Term Range Test
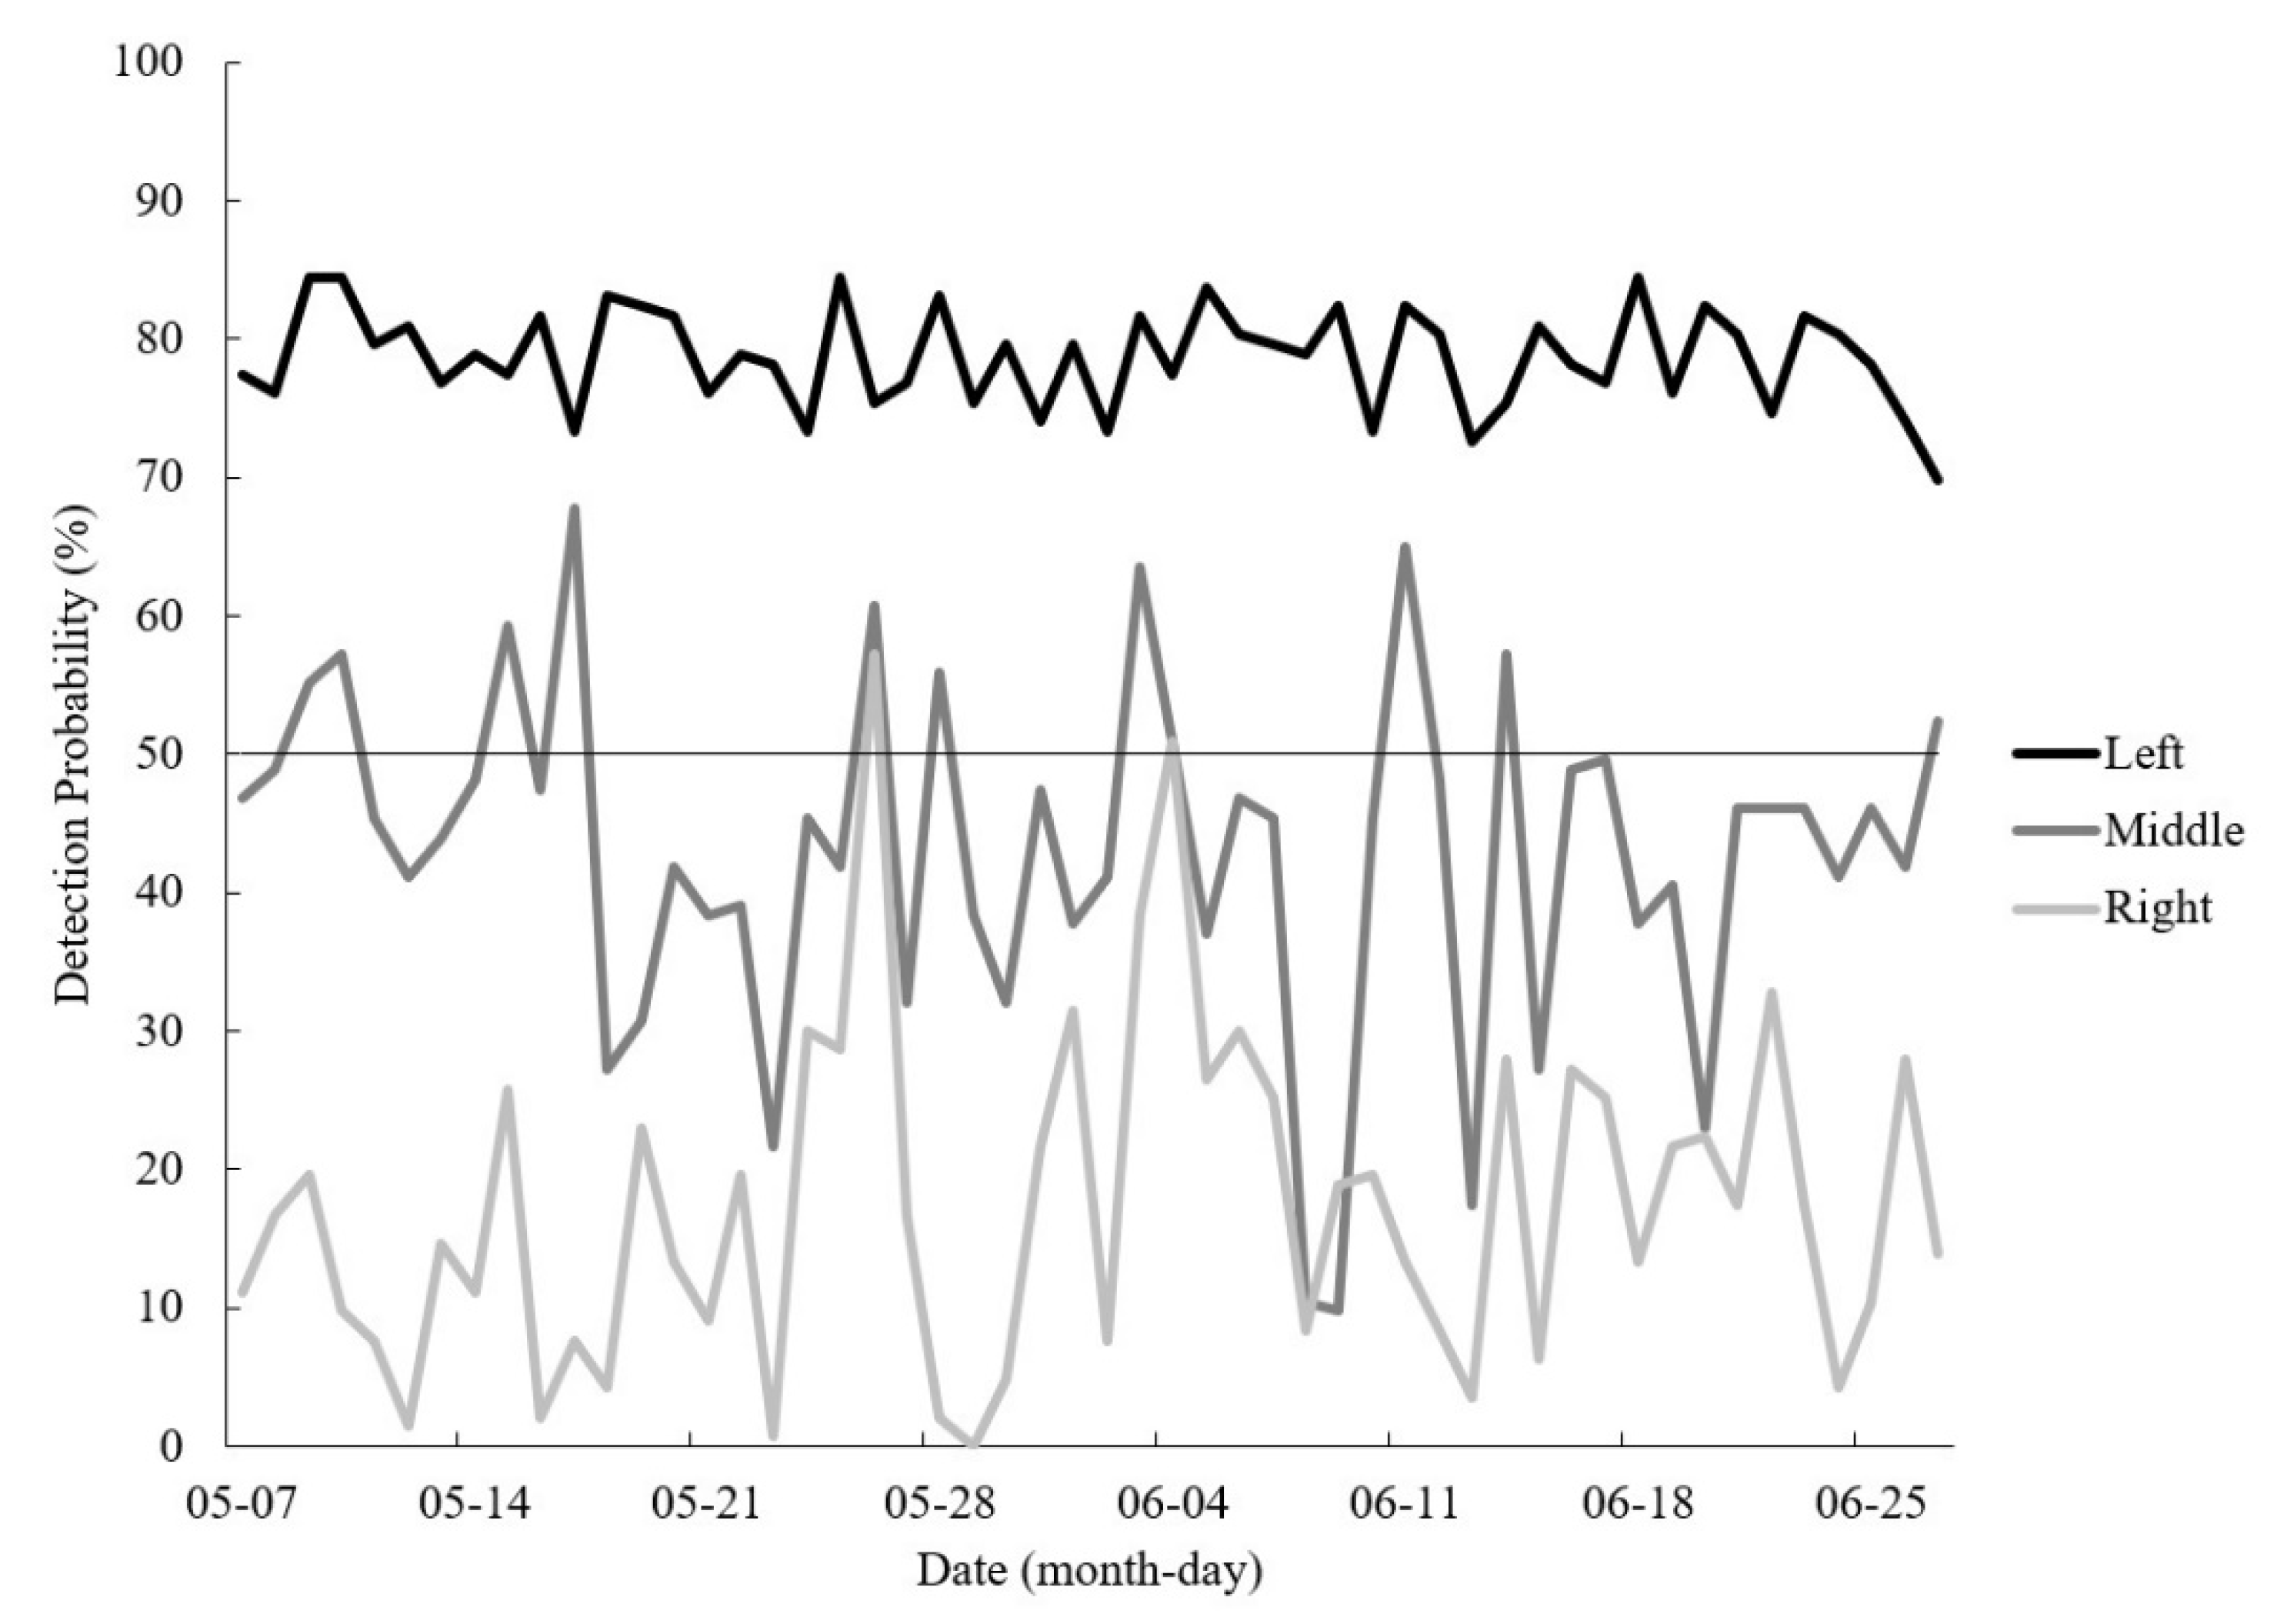
Detection probabilities were greater than 50% at all times for the receiver 13 m away from the tag (RL; mean ± SE, 79 ± 0.5%), whereas reliable detection only occurred 43 ± 2% and 17 ± 2% of the time for the receivers 266 m (M) and 519 m (RR) away from the tag, respectively (Figure 4). The overall detection range was determined as 212 m, meaning there was 37% and 31% overlap between the RL-M and M-RR receivers, respectively.
The relationships between average wind speeds and detection probabilities (by 3 h blocks) for each receiver were weak, with wind speed having no effect on the arcsine-squareroot transformed detection probability of the closest receiver (RL slope 0.23, r2 < 0.001; RL; Figure 5 and Figure 6), and progressively more negative although weak relationships with receiver distance (M slope −2.32, r2 = 0.01; RR slope −4.72, r2 = 0.05; Figure 5 and Figure 6). However, there were examples of high detection probabilities by the M and RR receivers being associated with lower average wind speeds (50.9–60.7%, 0.56–0.99 m/s), and low detection probabilities being associated with higher average wind speeds (0.7–21.6%, 1.71–2.81 m/s).
3. Discussion
Range testing within a hydropower reservoir established that detection ranges often differed from manufacturer’s estimates, generally with detection ranges being higher than expected for the passive receiver, and lower than expected for the active receiver. Deviations from expected detection ranges have been observed in other studies. For example, detection ranges of only 88–111 m for the low power tag and 65 m for the high power tag have been documented in oceanic conditions [2,6]. Such drastic differences in detection range due to environmental conditions exemplify why site-specific and equipment-specific range testing is critical for successful study design.
The long-term range test allowed for the quantification of detection range while taking variability of environmental conditions into account. Importantly, this test was performed during the time when tagged Atlantic salmon smolts would be out-migrating. Tagged Atlantic salmon smolts tracked in a concurrent study (transmitting every 30–90 s) took a minimum of 188 s to move through the reliable detection space (212 m) around the receiver line at the hydropower site, and therefore, at least two transmissions were available for detection when receivers were placed using the design in this study, with no undetectable area within a triple receiver line (Babin, University of New Brunswick, unpublished data). The number and placement of receivers at any site must be balanced between effectiveness and cost. Using a 50% threshold for reliable detection allows for optimizing of receiver spacing whereby detection efficiency can be balanced with the number of receivers in the area to minimize financial cost while ensuring reliable data collection.
Wind speeds encountered during the range testing trials did not reach those recorded during the longer-term range test (maximum 2.7 versus 6.2 m/s), High wind speeds during the long-term test generally coincided with decreased detection ranges, especially as distance between the tag and the receiver increased, although the relationships were weak. Wind speeds high enough to affect detection reliability would probably not be encountered during active tracking in a small boat since the higher wind speeds would limit safe travel on the water before they would affect detection probabilities.
Detection ranges significantly differed between sites for the high power tag only, with ranges being generally lower near the hydropower facility than at the reservoir site. This could be partially attributable to the difference in substrate types, where the soft mud and silt bottom at the hydropower site could have attenuated some of the acoustic signals, whereas the cobble bottom at the reservoir site may have propagated the acoustic signal. Overall, the detection probability patterns in the vicinity of the hydropower generating station indicate that decreased detection probabilities were substantial (8%–95%). Reduced detection probabilities have been attributed to increased ambient noise levels caused by discharge flows and cavitation [2,6]. In the case of the current study, the area in which detection probabilities indicated an abrupt decrease was associated with a diversion sluiceway (DS), however, it is important to note that the DS and spillway (SW) gates were closed during the range testing trials. Therefore, the relationship between the reduction in detection probability and association with the DS could be attributable to acoustic scattering off reflective surfaces rather than increases in ambient noise levels. It was similarly surprising that detection probabilities increased after the significant reduction. Particularly for the passive receiver detecting both tag types, the detection probability often exceeded 50% beyond the distance at which zero-detection probability would have been expected. This surprising result may also be attributable to the presence of the hydropower facility allowing the signal to reflect off hard surfaces and to propagate the signal farther than would be expected. Future range testing studies could consider implementing ray tracing to track where and how the sound propagates, although this would be a complex task within moving waters with numerous natural and anthropogenic obstacles [11]. The patterns of detection probability found in the vicinity of a hydropower generating station lead the authors to recommend that telemetry studies test the detection probabilities under various (hydropower) operating conditions, as well as different environmental conditions and locations, or design their receiver deployments to have greater acoustic space overlap near hydropower dams as a precaution to ensure signals will be reliably detected. It is important to consider the study objectives when assessing optimal receiver locations.
In conclusion, (1) detection ranges were generally lower in both studied sites within the large hydropower reservoir than the expected detection ranges estimated by the manufacturer, especially for the active receiver; (2) detection ranges were generally greater for the active receiver than the passive receiver; (3) detection ranges were greater for the high power tag than the low power tag; (4) detection probabilities were decreased when wind speeds reached 6 m/s, and (5) the hydropower site had generally lower detection ranges in comparison to the reservoir site, with an estimated 8%–95% decrease in detection probability at least partially attributable to the presence of a hydropower facility.
The results of this study will inform the design of telemetry studies performed in hydropower and reservoir settings, although site-specific range testing is recommended. Researchers should carefully consider the conditions of their site, especially in relation to hydropower facilities which could have higher ambient underwater noise and concrete structures causing multipath signals. Range testing should include all tag and receiver types to be used. Additionally, range testing should be conducted in a way that captures variability in environmental conditions as well as during times of the year which are relevant for the species and life-stage which will be detected.
4. Materials and Methods
4.1. Study Sites
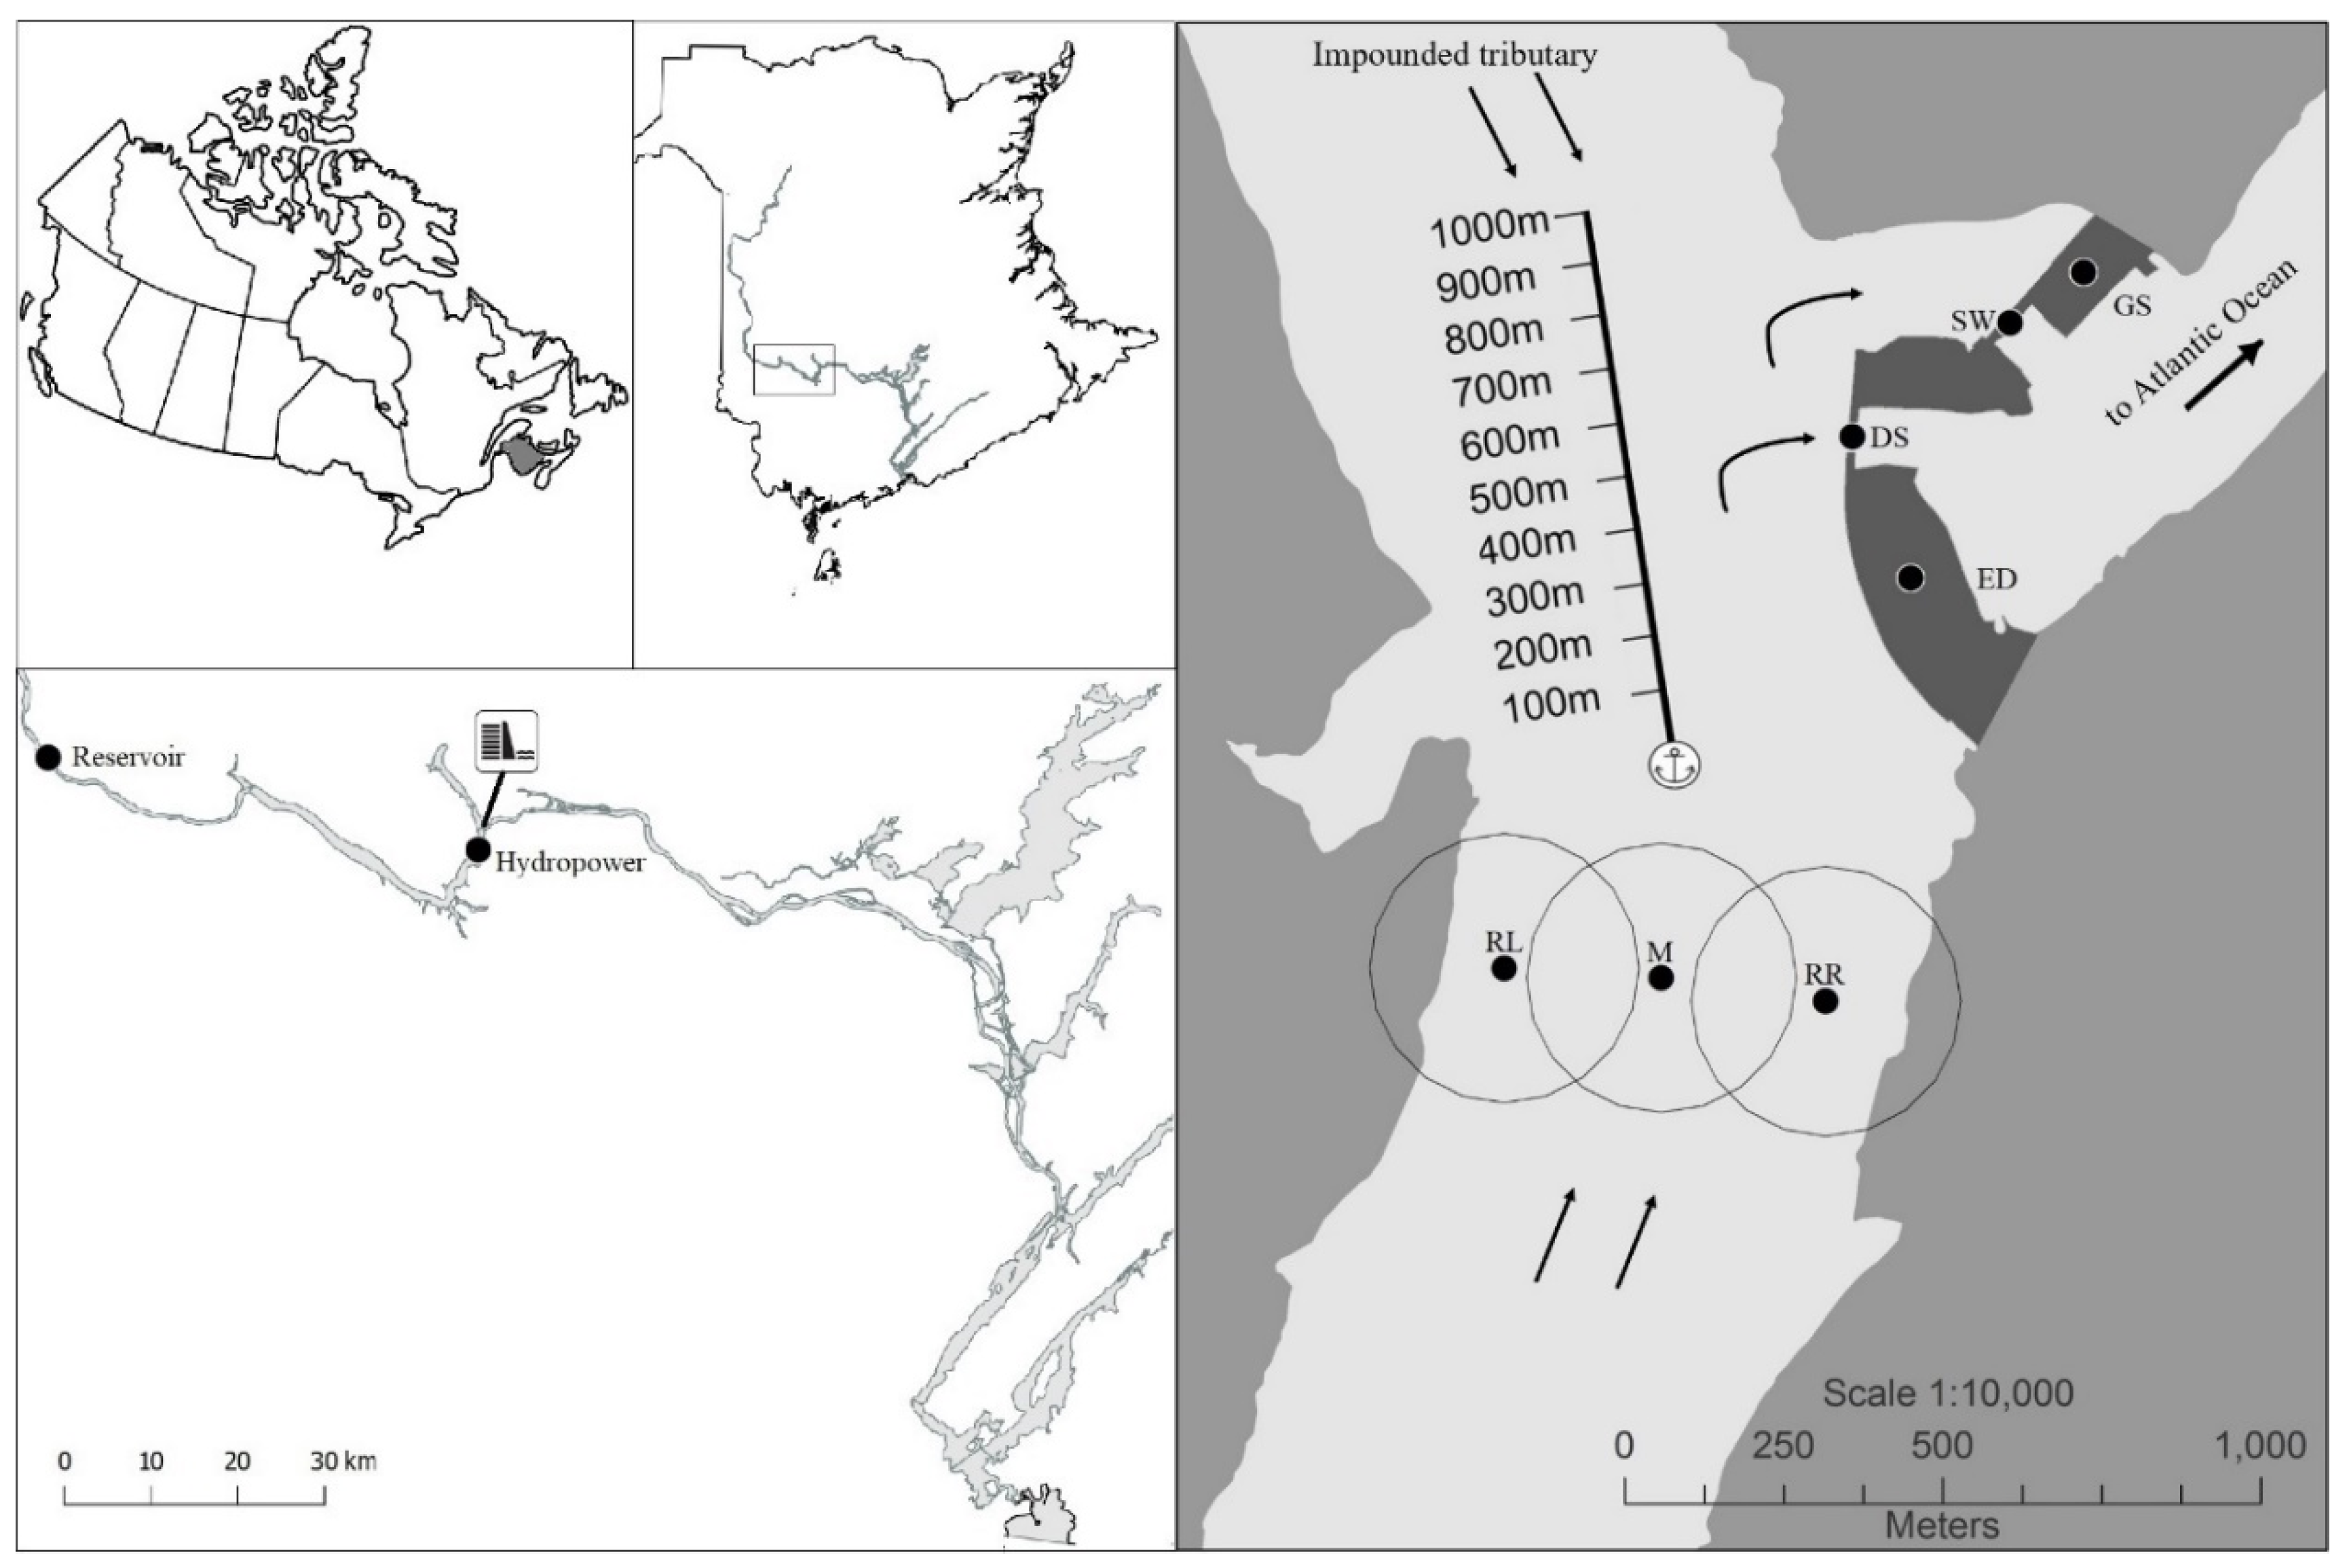
The study took place within the Mactaquac Reservoir created by the Mactaquac Generating Station (MGS) in the Saint John River (SJR), New Brunswick, Canada (Figure 6). The MGS is 1100 m wide with a head of 34 m and has six Kaplan turbines with a total generation capacity of 672 MW. The MGS reservoir spans 97 river km (rkm). There were two study sites: a hydropower site (45.94815°N 66.87314°W) near the MGS, and a reservoir site (46.00461°N 67.50419°W) 64 rkm upstream of the MGS (Figure 6). The river channel at the hydropower site was approximately 750 m wide and 30–40 m deep (max 51 m) with soft mud and silt substrates. The maximum fetch was approximately 9 rkm. Recreational boat traffic was variable and sometimes heavy (10–100 boats per day). The channel at the upstream reservoir site was approximately 300 m wide and 20 m deep with cobble substrate. Trees on shore provided some shelter from the wind, which along with river bends brought the maximum fetch down to 4 rkm. Boating activity during the range testing trials was rare (1–5 boats per day).
4.2. Detection Range Testing
Equipment used in this study was developed and manufactured by Vemco, a division of Amirix (Bedford, Nova Scotia, Canada; https://www.vemco.com/). Range testing tags were the same size and power as the tags used in concurrent tracking studies but had a cap as an attachment point. The low power range testing tag was the V7-4L, being 7 mm in diameter and emitting an acoustic signal (69 kHz, 136 dB re 1µPa@1m) every 10 s. The low power sentinel tag was the same model but transmitted an acoustic signal every 10 min. The high power range testing tag was the V13-1L, being 13 mm diameter and emitting an acoustic signal (69 kHz, 147 dB re 1µPa@1m) every 10 s. The active receiver was the VR100 with a VH165 omnidirectional hydrophone, and the passive receivers were the VR2W and VR2Tx. New batteries were installed before all range testing.
Range testing trials were performed in replicate. They consisted of mooring one of the test tags (either low or high power) in a fixed position 5 m below the surface, placing the passive receiver on one side of an aluminum boat at 10 m depth and the hydrophone of the active receiver on the other side at 10 m depth, and then travelling away from the tag site always along the same transect, stopping to listen every 50 m for 180 s; an example transect at the hydropower site is shown in Figure 1. Since the range testing tags transmitted every 10 s, each listening station could theoretically produce 18 detections, which was thus considered as 100% detection probability. Because the active receiver should theoretically detect the tag from a greater distance than the passive receiver, the transect was followed until the active receiver did not detect any transmissions for two consecutive listening stations. Testing took place at both sites between 21 July and 18 August 2015 for a total of 26 trials (n = 7 for low power/hydropower, n = 5 for low power/reservoir, n = 8 for high power/hydropower, n = 6 for high power/reservoir).
A longer-term range test was performed at the hydropower site to quantify variability in detection probability of a line of three VR2W passive receivers over 50 days coinciding with the Atlantic salmon smolt run (7 May–27 June 2015). A low power sentinel tag was moored 6 m below the surface (approximating the position of surface-oriented Atlantic salmon smolts) and 13 m above a passive receiver on the same mooring line in the river left (RL) position (Figure 6). Two additional passive receivers were placed at a horizontal distance of 266 m (middle: M) and 519 m (river right: RR) across the channel (Figure 6). The three receivers created a line or gate for detection of smolts passing this location to be tested.
Environmental conditions including depth and substrate type were assessed by the Mactaquac Aquatic Ecosystem Study team. Wind speeds were recorded hourly by a nearby meteorological station (45.95919°N 66.84217°W). The average wind speed was calculated for the duration of each longer-term range test, and wind speeds were averaged in 3 h blocks to correspond with the detection probability estimates (see below).
4.3. Statistical Analyses
Detection range was defined as the range at which the acoustic signal was detected in 50% of the possible occurrences (9/18 transmissions detected). This definition is consistent with the manufacturer and other studies [4,6]. The range at which tags were detected at least 50% of the time was considered to represent the area of reliable detection.
For each range testing trial, detection probability was plotted against distance and a logistic curve was fitted to the data because the response variable was binary (detected or not detected) [4]. The detection range for that trial was then inferred as the 50% detection probability on the logistic curve. Idealized logistic curves were also created based on the manufacturers estimates of detection range for each tag-receiver pair. To quantify the difference between observed and expected detection ranges for each tag-receiver pair, median ± SE data from replicate trials were plotted against the expected logistic curve and differences were calculated. Detection ranges for each tag type were compared using two-way ANOVAs of receiver type and site.
Vemco Range Test preliminary software (v 1.9.22.0, Amirix Systems Inc., Bedford, NS, Canada, 2014) was used to analyze the longer-term dataset. Data from each of the passive receivers (Figure 6) were segmented into 3 h blocks such that each would have 18 potential detections (180 min; 10 min transmission interval; n = 420 probability assessment intervals) so that the results were directly comparable with the shorter range testing trials. The effect of wind speed on detection probability (arcsine-squareroot transformed) was visualized through linear regressions.
Analyses were done in R Studio (Version 0.99.878 - © 2009-2016 RStudio, Inc., Boston, MA, USA, Packages car, nls2). Normality plots were analyzed for each statistical test, and statistical significance was assumed when p was less than or equal to 0.05.
Author Contributions
Conceptualization, A.B., L.F., and T.L.; data curation, A.B. and L.F.; formal analysis, A.B. and L.F.; funding acquisition, A.B., T.L., and R.A.C.; methodology, A.B., L.F., and T.L.; project administration, A.B., T.L., and R.A.C.; supervision, A.B., T.L., and R.A.C.; visualization, A.B. and L.F.; writing—original draft, A.B. and L.F.; writing—review and editing, A.B., L.F., T.L., and R.A.C.
Funding
This research was funded by New Brunswick Power, NSERC’s Collaborative Research and Development programme, CRDPJ: 462708-13, and the Atlantic Salmon Conservation Foundation. The APC was funded by the Canadian Rivers Institute.
Acknowledgments
The authors thank Aurélien Simon for help in the field.
Conflicts of Interest
The authors declare no conflict of interest.
References
- Heupel, M.R.; Semmens, J.M.; Hobday, A.J. Automated acoustic tracking of aquatic animals: Scales, design and deployment of listening station arrays. Mar. Freshw. Res. 2006, 57, 1–13. [Google Scholar] [CrossRef]
- Pincock, D.G.; Johnston, S.V. Acoustic telemetry overview. In Telemetry Techniques: A User Guide for Fisheries Research; Adams, N.S., Beeman, J.W., Eiler, J.H., Eds.; American Fisheries Society: Bethesda, MD, USA, 2012; pp. 305–338. [Google Scholar]
- Gjelland, K.Ø.; Hedger, R.D. Environmental influence on transmitter detection probability in biotelemetry: Developing a general model of acoustic transmission. Methods Ecol. Evol. 2013, 4, 665–674. [Google Scholar] [CrossRef]
- Kessel, S.T.; Cooke, S.J.; Heupel, N.E.; Simpfendorfer, C.A.; Vagle, S.; Fisk, A.T. A review of detection range testing in aquatic passive acoustic telemetry studies. Rev. Fish Biol. Fish. 2014, 24, 199–218. [Google Scholar] [CrossRef]
- Medwin, H.; Clay, S. Fundamentals of Acoustical Oceanography; Academic Press: San Diego, CA, USA, 1998. [Google Scholar]
- How, J.R.; de Lestang, S. Acoustic tracking: Issues affecting design, analysis and interpretation of data from movement studies. Mar. Freshw. Res. 2012, 63, 312–324. [Google Scholar] [CrossRef]
- Adams, N.S.; Beeman, J.W.; Eiler, J.H. Telemetry Techniques: A User Guide for Fisheries Research; American Fisheries Society: Bethesda, MD, USA, 2012. [Google Scholar]
- Kessel, S.T.; Hussey, N.E.; Webber, D.M.; Gruber, S.H.; Young, J.M.; Smale, M.J.; Fisk, A.T. Close proximity detection interference with acoustic telemetry: The importance of considering tag power output in low ambient noise environments. Anim. Biotelem. 2015, 3, 1–14. [Google Scholar] [CrossRef] [Green Version]
- Coutant, C.C.; Whitney, R.R. Fish behavior in relation to passage through hydropower turbines: A review. Trans. Am. Fish. Soc. 2000, 129, 351–380. [Google Scholar] [CrossRef]
- Thorstad, E.B.; Whoriskey, F.G.; Uglem, I.; Moore, A.; Rikardsen, A.H.; Finstad, B. A critical life stage of the Atlantic salmon Salmo salar; behavior and survival during the smolt and initial post-smolt migration. J. Fish Biol. 2012, 81, 500–542. [Google Scholar] [CrossRef] [PubMed]
- Mo, Q.; Yeh, H.; Lin, M.; Manocha, D. Analytic ray curve tracing for outdoor sound propagation. Appl. Acoust. 2016, 104, 142–151. [Google Scholar] [CrossRef] [Green Version]
Figure 1.
Average detection range (m) ± SE for a low power tag being detected by passive and active receivers at hydropower and reservoir sites.
Figure 1.
Average detection range (m) ± SE for a low power tag being detected by passive and active receivers at hydropower and reservoir sites.
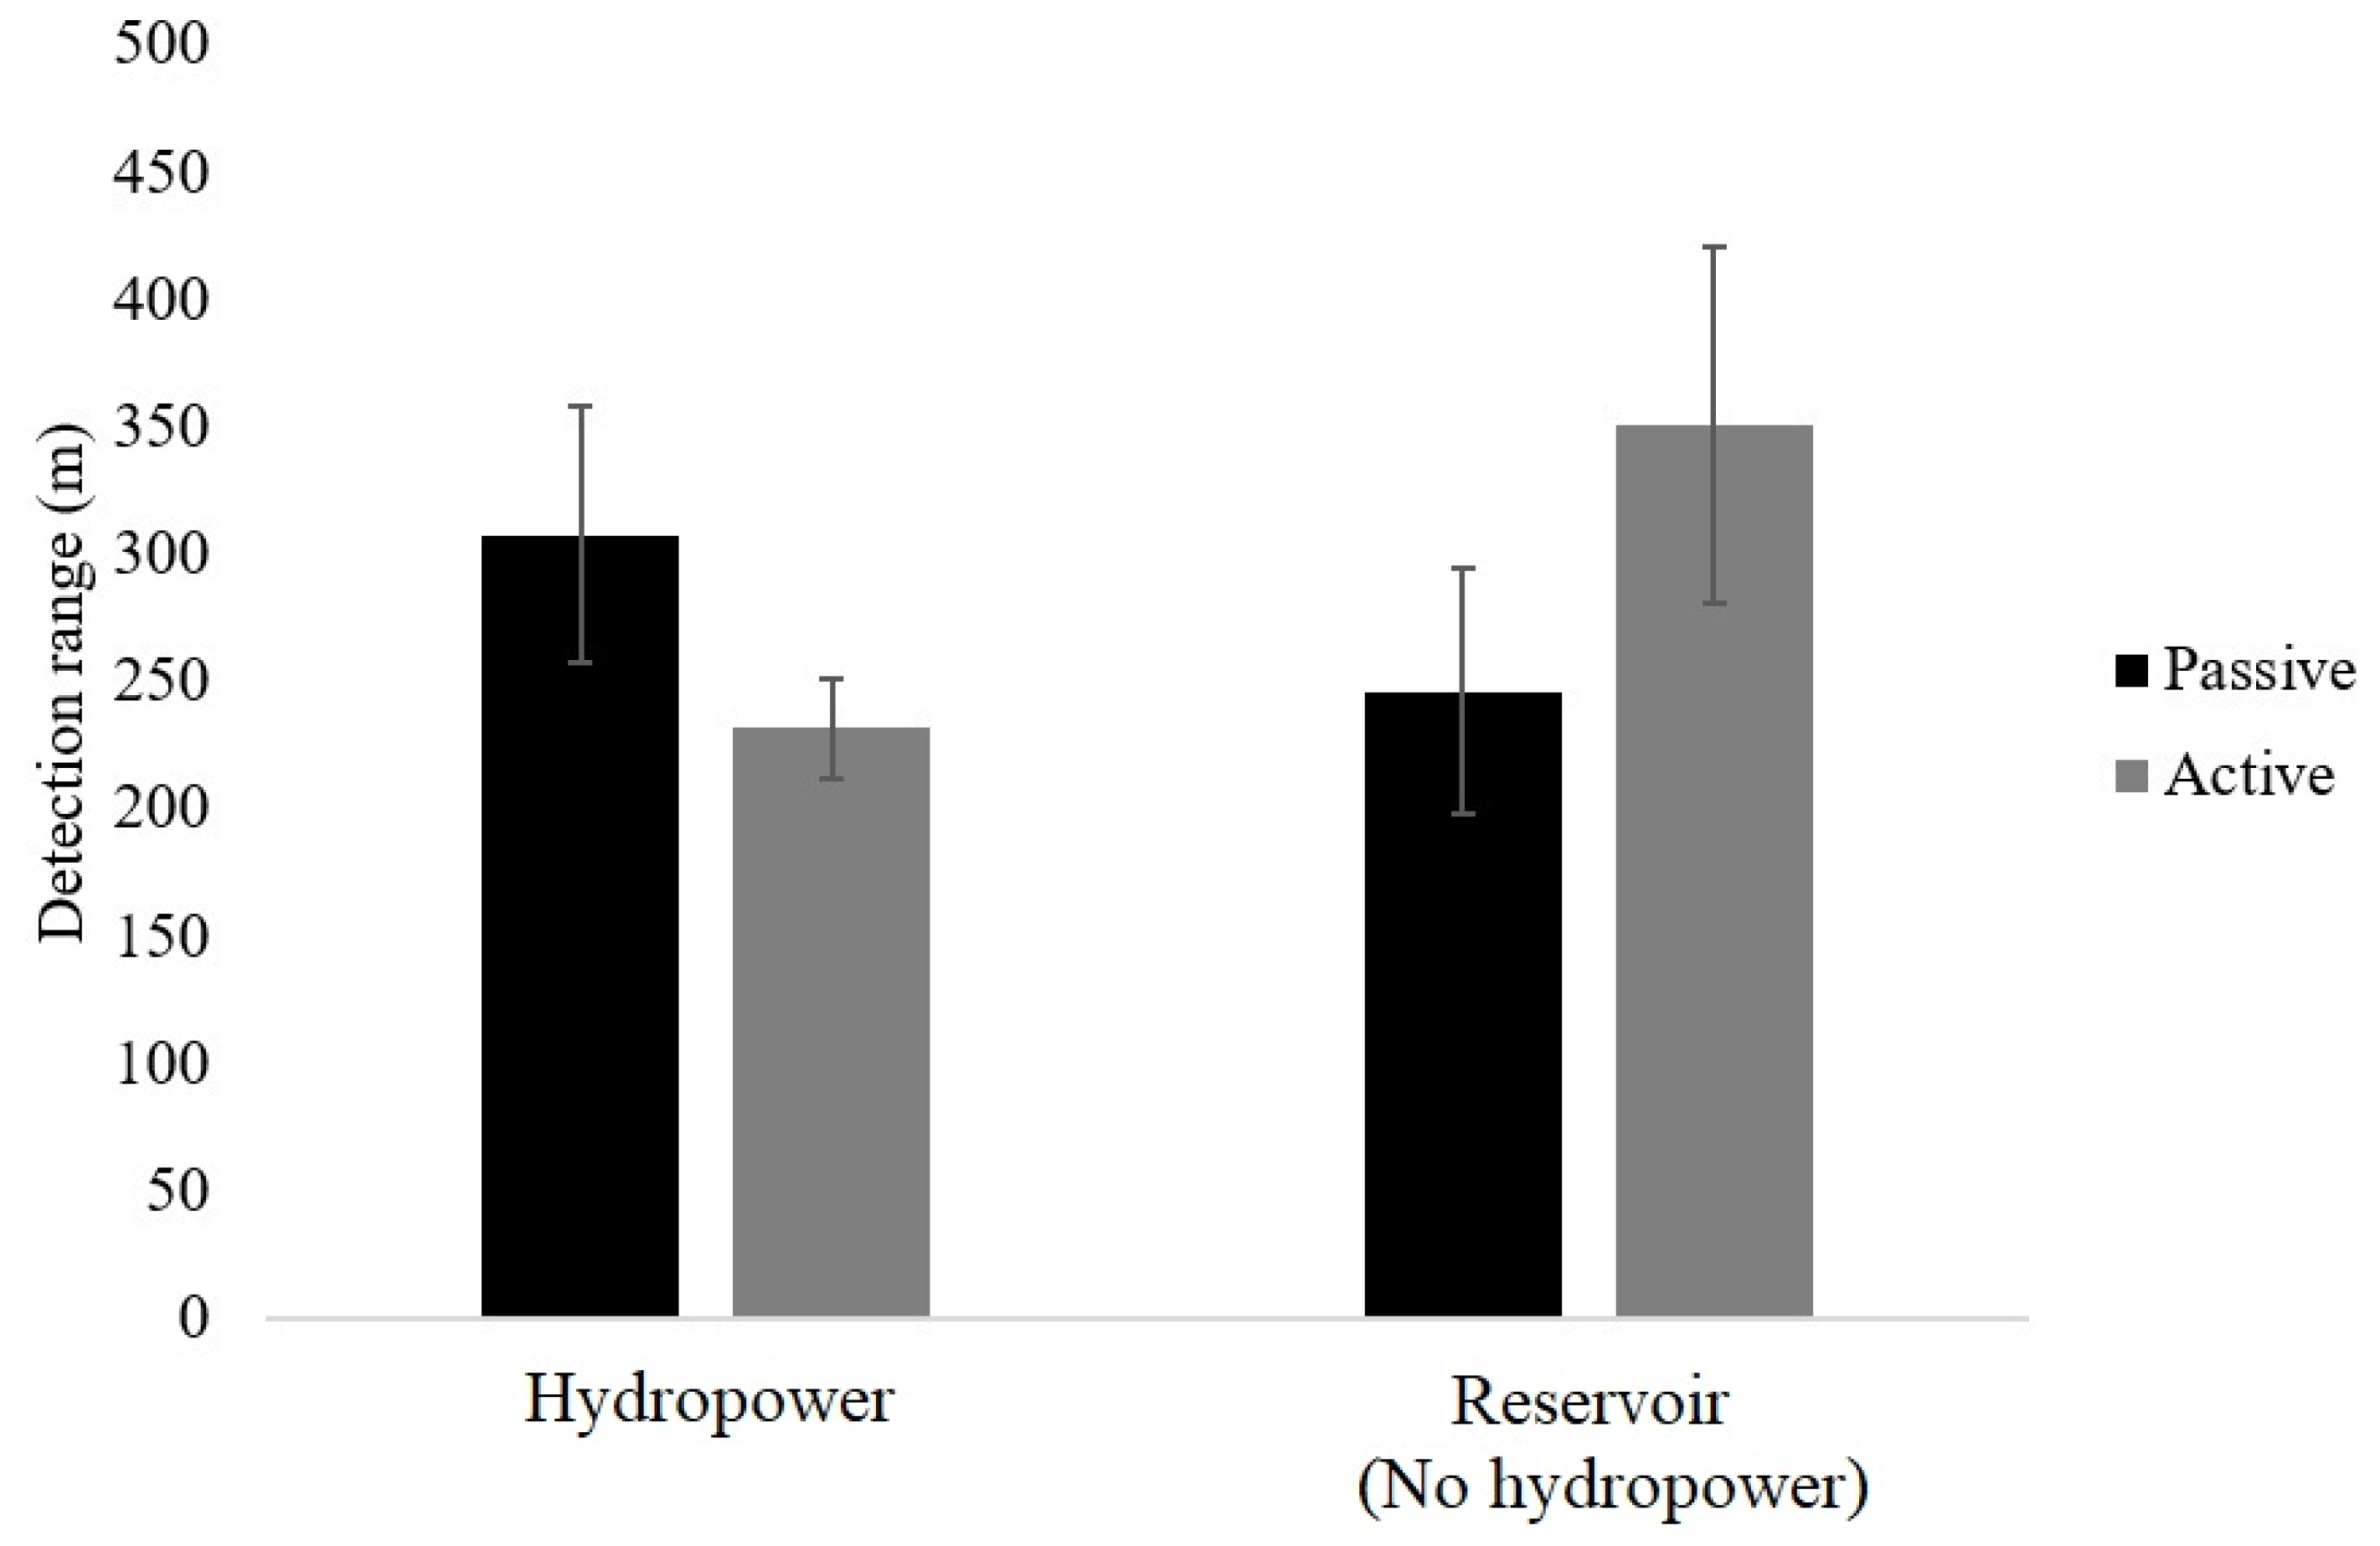
Figure 2.
Average detection range (m) ± SE for a high power tag being detected by passive and active receivers at hydropower and reservoir sites.
Figure 2.
Average detection range (m) ± SE for a high power tag being detected by passive and active receivers at hydropower and reservoir sites.
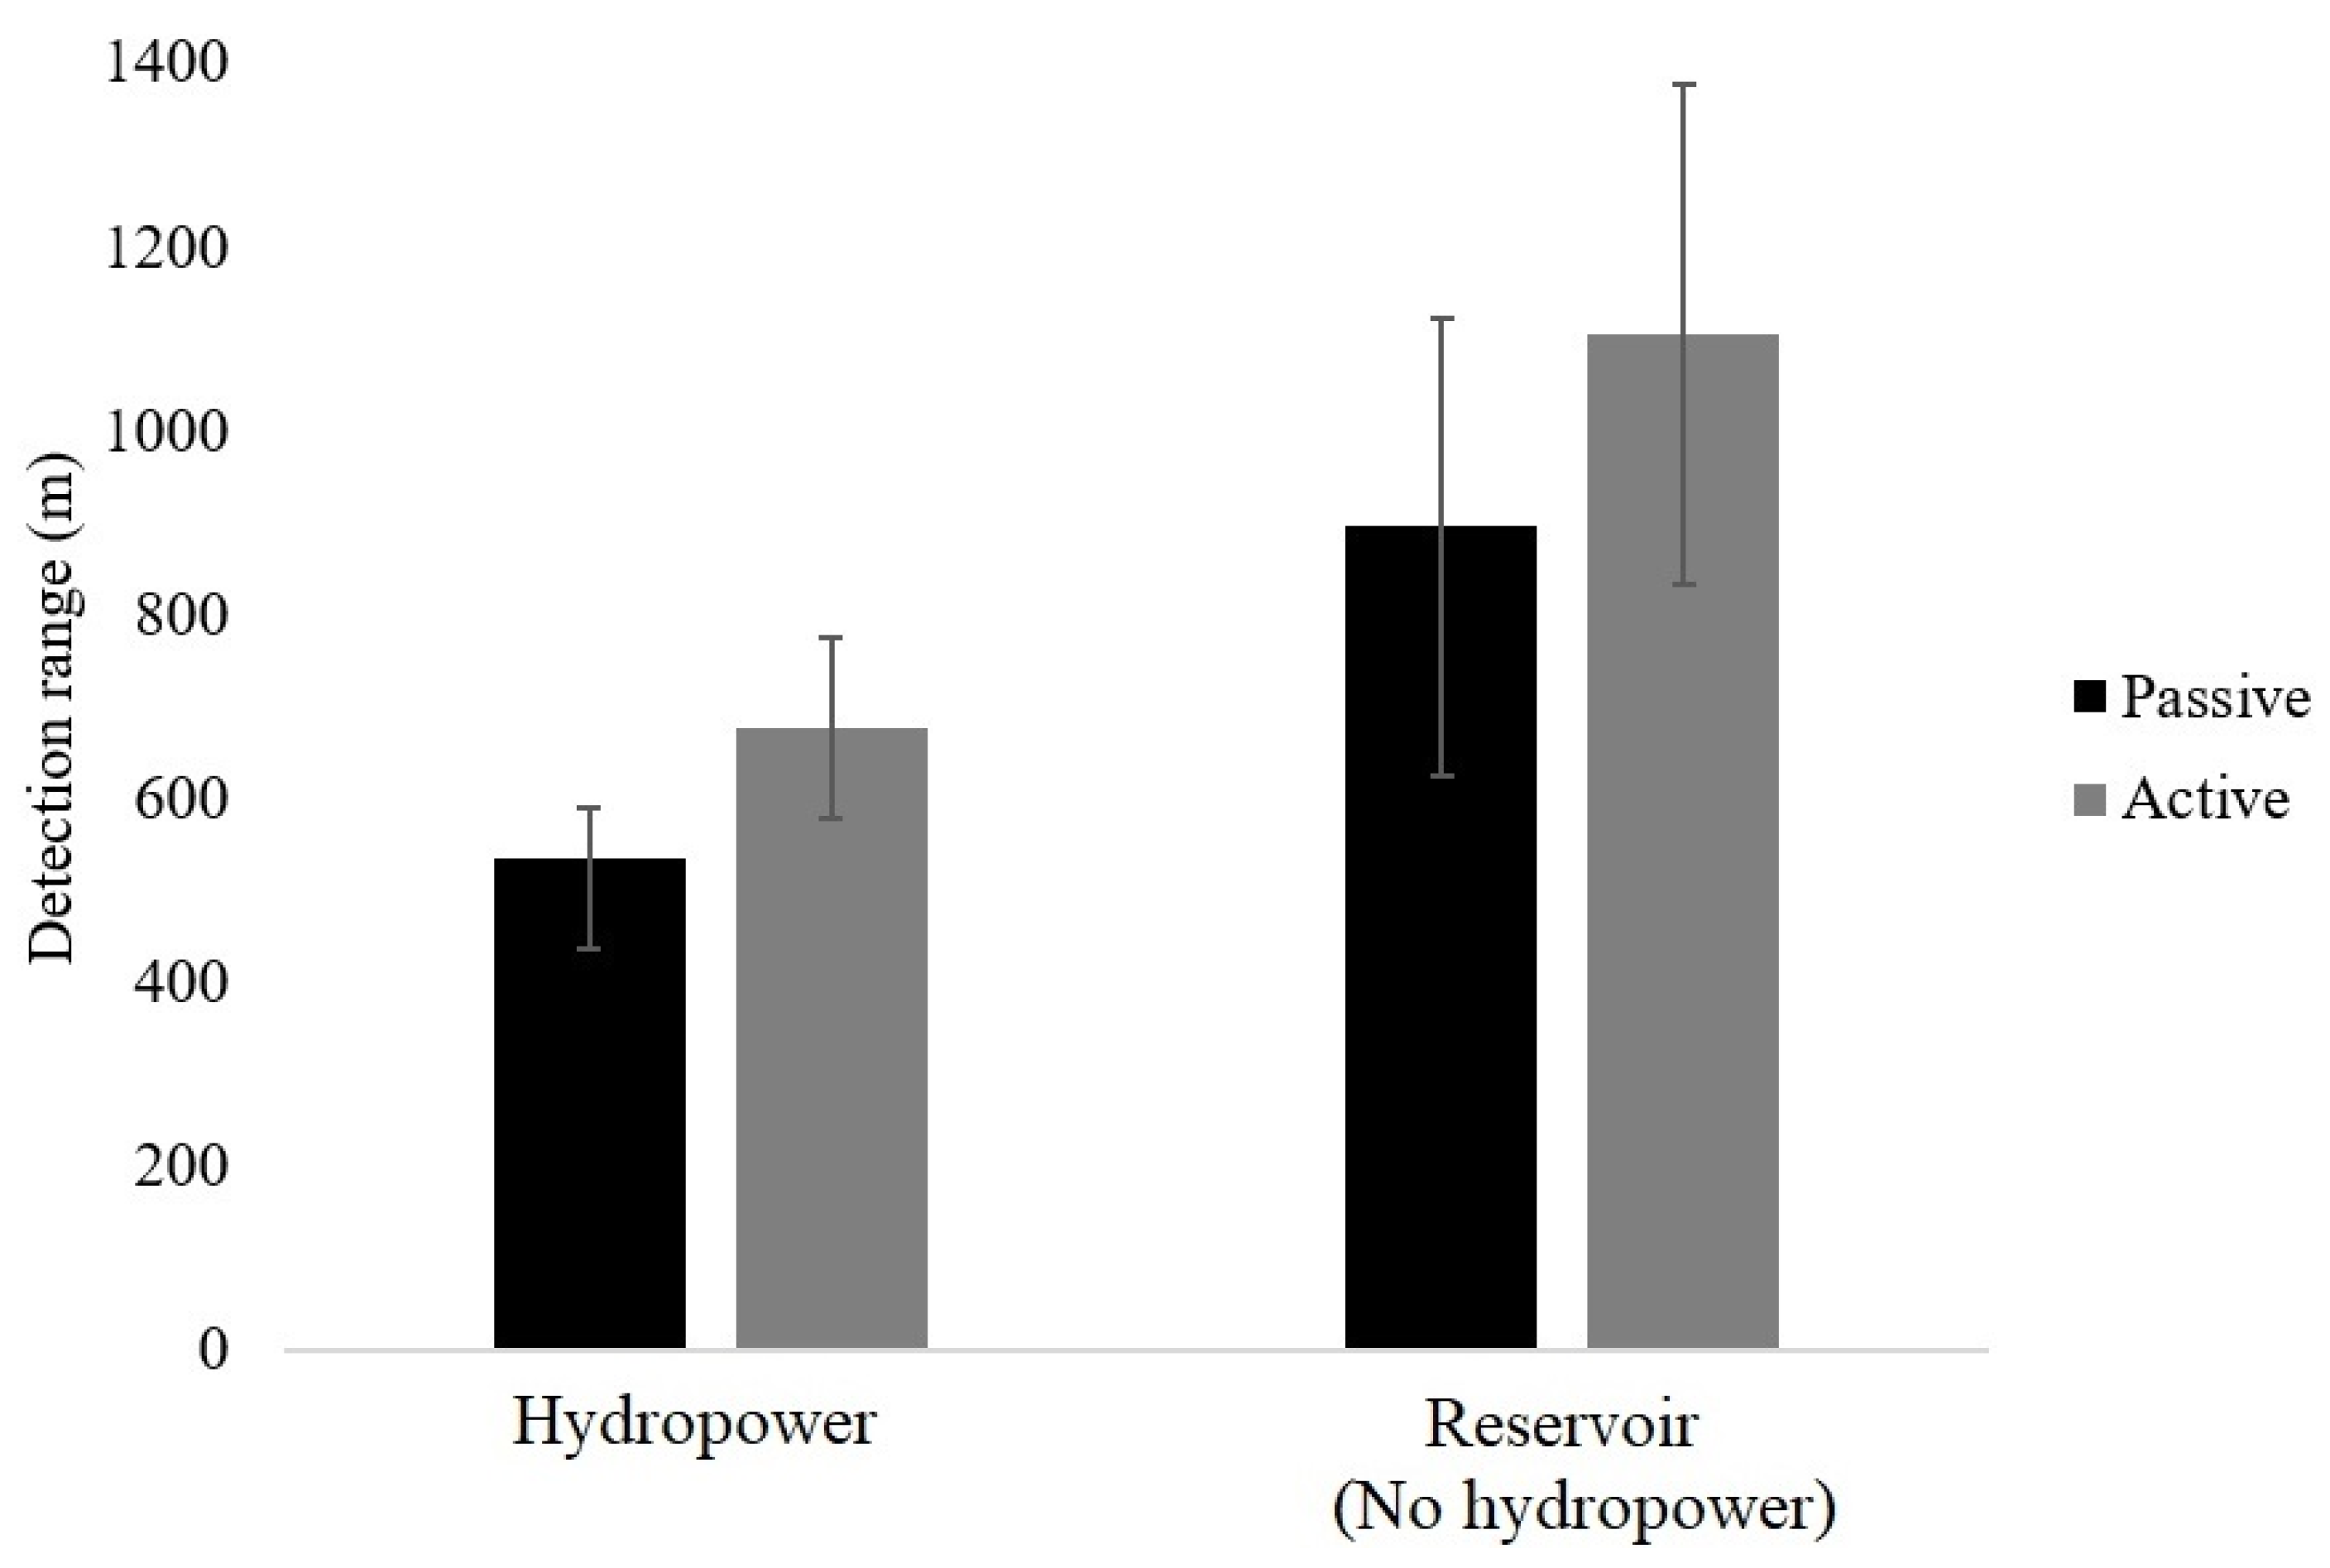
Figure 3.
Expected (black) and observed (grey; median ± SE) detection probabilities along replicate transects for low (V7) and high (V13) power tags detected by active and passive receivers at the hydropower site. Grey sections indicate the area of potential hydropower impact on ambient noise levels (500–1000 m).

Figure 4.
Daily average detection probabilities for passive receivers located 13 (left), 266 (middle), and 519 m (right) from a low power sentinel tag at the hydropower site.
Figure 4.
Daily average detection probabilities for passive receivers located 13 (left), 266 (middle), and 519 m (right) from a low power sentinel tag at the hydropower site.

Figure 5.
Linear regressions of the effect of average wind speed (m/s) on the detection probabilities (%) of receivers located on river left (RL: black), middle (M: dark grey), and river right (RR: light grey) from a low power sentinel tag at the hydropower site.
Figure 5.
Linear regressions of the effect of average wind speed (m/s) on the detection probabilities (%) of receivers located on river left (RL: black), middle (M: dark grey), and river right (RR: light grey) from a low power sentinel tag at the hydropower site.
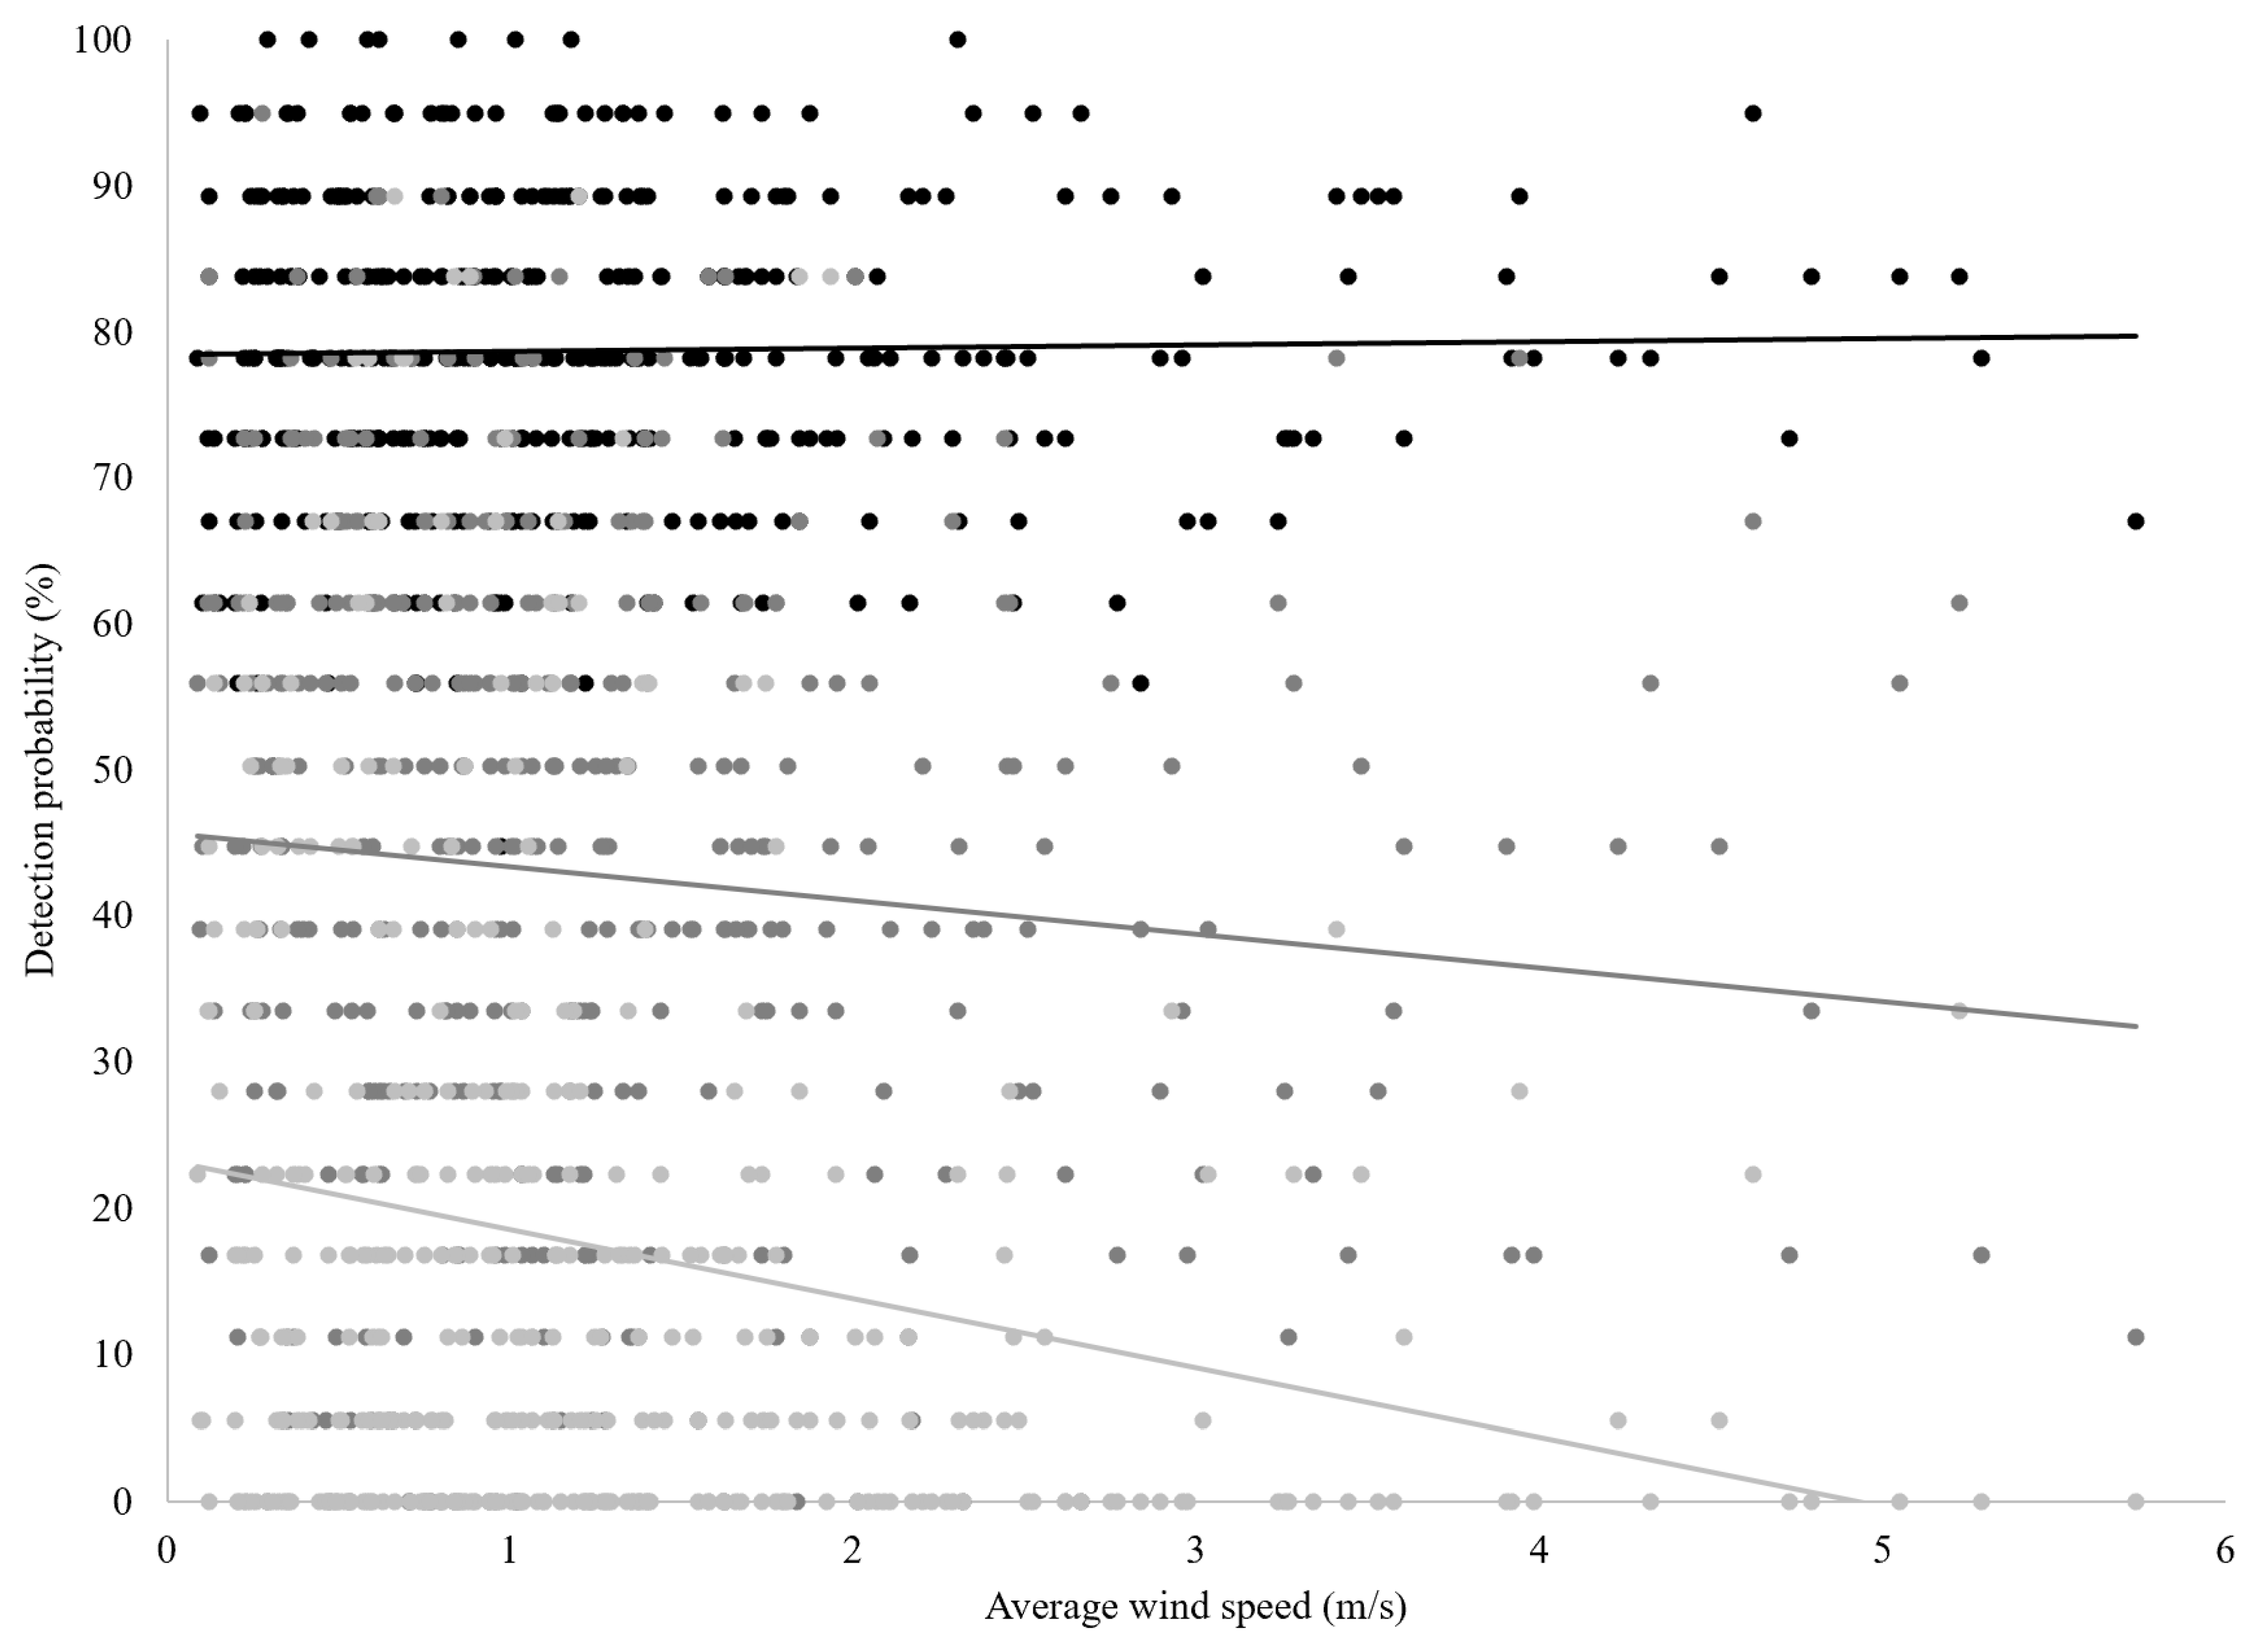
Figure 6.
Location of hydropower and reservoir sites in the Mactaquac Reservoir, Saint John River, New Brunswick, with a generalized range testing transect along which receivers detected anchored range testing tags (indicated by an anchor symbol) in relation to the hydropower facility (GS = generating station; SW = spillway; DS = diversion sluiceway; ED = earthen dam). Arrows indicate direction of water flow. Also shown is a passive receiver line (river left: RL with low power sentinel tag, middle: M, river right: RR) showing detection range (212 m) estimated by a long-term range test.

Table 1.
Range testing trials, prevailing environmental conditions and detection range (m) of low power (V7) and high power (V13) tags detected by passive and active receivers at hydropower and reservoir sites as inferred by logistic regression.
Table 1.
Range testing trials, prevailing environmental conditions and detection range (m) of low power (V7) and high power (V13) tags detected by passive and active receivers at hydropower and reservoir sites as inferred by logistic regression.
| Tag-Trial | Site | Date (2015) | Boats Present | Average Wind Speed (m/s)/Direction (°) | Detection Range (m) | |
|---|---|---|---|---|---|---|
| Passive Receiver | Active Receiver | |||||
| V7-1 | Hydropower | 21 July | No | 0.96/162.5 | 318 | 140 |
| V7-2 | Hydropower | 24 July | No | 1.06/98.1 | 451 | 295 |
| V7-3 | Hydropower | 29 July | Yes | 0.66/303.09 | 67 | 193 |
| V7-4 | Hydropower | 10 August | Yes | 0.36/292.37 | 297 | 248 |
| V7-5 | Hydropower | 10 August | Yes | 0.28/292.88 | 368 | 272 |
| V7-6 | Reservoir | 11 August | Yes | 0.45/191.20 | 159 | 99 |
| V7-7 | Reservoir | 11 August | No | 0.70/221.40 | 200 | 403 |
| V7-8 | Reservoir | 12 August | No | 0.24/294.00 | 374 | 493 |
| V7-9 | Hydropower | 13 August | No | 0.42/287.31 | 440 | 246 |
| V7-10 | Hydropower | 13 August | No | 0.39/276.00 | 216 | 229 |
| V7-11 | Reservoir | 17 August | Yes | 0.68/272.70 | 351 | 451 |
| V7-12 | Reservoir | 18 August | No | 0.73/343.88 | 149 | 307 |
| V13-1 | Hydropower | 21 July | Yes | 0.98/218.70 | 584 | 643 |
| V13-2 | Hydropower | 24 July | No | 0.71/32.30 | 451 | 1030 |
| V13-3 | Hydropower | 24 July | Yes | 0.96/91.60 | 731 | 635 |
| V13-4 | Hydropower | 29 July | Yes | 0.15/339.45 | 383 | 330 |
| V13-5 | Reservoir | 7 August | Yes | 0.39/244.60 | 1412 | 1369 |
| V13-6 | Reservoir | 11 August | No | 0.82/154.10 | 1003 | 1330 |
| V13-7 | Reservoir | 12 August | No | 0.84/244.60 | 1678 | 2222 |
| V13-8 | Hydropower | 13 August | No | 0.44/261.20 | 457 | 569 |
| V13-9 | Hydropower | 13 August | No | 0.39/233.90 | 615 | 855 |
| V13-10 | Reservoir | 17 August | No | 0.36/39.10 | 456 | 554 |
| V13-11 | Reservoir | 17 August | No | 0.31/359.52 | 406 | 596 |
| V13-12 | Reservoir | 18 August | Yes | 0.35/265.20 | 440 | 567 |
| V13-13 | Hydropower | 27 August | Yes | 0.17/231.20 | 487 | 529 |
| V13-14 | Hydropower | 27 August | No | 0.11/167.20 | 441 | 747 |
© 2019 by the authors. Licensee MDPI, Basel, Switzerland. This article is an open access article distributed under the terms and conditions of the Creative Commons Attribution (CC BY) license (http://creativecommons.org/licenses/by/4.0/).
Share and Cite
MDPI and ACS Style
Babin, A.; Fitzpatrick, L.; Linnansaari, T.; Curry, R.A. Detection Range of Acoustic Receivers in a Large Hydropower Reservoir. Fishes 2019, 4, 60. https://0-doi-org.brum.beds.ac.uk/10.3390/fishes4040060
AMA Style
Babin A, Fitzpatrick L, Linnansaari T, Curry RA. Detection Range of Acoustic Receivers in a Large Hydropower Reservoir. Fishes. 2019; 4(4):60. https://0-doi-org.brum.beds.ac.uk/10.3390/fishes4040060
Chicago/Turabian StyleBabin, Amanda, Lauren Fitzpatrick, Tommi Linnansaari, and R. Allen Curry. 2019. "Detection Range of Acoustic Receivers in a Large Hydropower Reservoir" Fishes 4, no. 4: 60. https://0-doi-org.brum.beds.ac.uk/10.3390/fishes4040060