Article

Population Genetic Analysis for Stock Enhancement of Silver Sea Bream (Rhabdosargus sarba) in Taiwan

1
Department of Aquaculture, National Taiwan Ocean University, Keelung 20224, Taiwan
2
Center of Excellence for the Oceans, National Taiwan Ocean University, Keelung 20224, Taiwan
3
Department of Environmental Biology and Fisheries Science, National Taiwan Ocean University, Keelung 20224, Taiwan
4
Institute of Marine Affairs and Resources Management, National Taiwan Ocean University, Keelung 20224, Taiwan
*
Author to whom correspondence should be addressed.
Submission received: 2 March 2020 / Revised: 10 June 2020 / Accepted: 12 June 2020 / Published: 16 June 2020

Abstract

:
Stock enhancement is a method for replenishing depleted wild finfish populations by supplementing them with hatchery-raised fish. In Taiwan, silver sea bream (Rhabdosargus sarba) is a predominant commercial species involved in stock enhancement projects. Although management agencies conduct stock enhancement projects, there are a lot of private releases without records. Stock enhancement is performed by the private aquaculture sector without accurate genetic records, potentially leading to unintended consequences for wild populations. We analyzed the genetics of 459 wild and 701 hatchery-reared specimens from nine batches produced by various hatcheries. Wild and hatchery-reared samples could be considered two separate clades by using a set of stable and informative microsatellite markers including type I (from gene introns and 3′UTR) and type II markers (randomly picked up from genome). Type I microsatellite markers could more sensitively reflect the loss of genetic diversity more than type II markers in the domestication process. All specimens were considered native by using mtDNA COI and microsatellites. The genetic composition of the wild population is relatively simple, and the estimated low contribution rate of the hatchery stock (1.3–10.9%; 6–50/459) indicated a weak but significant genetic effect of stock enhancement. Therefore, establishing standards for the stock enhancement of silver sea bream for more effective supplementation of wild populations is imperative.

1. Introduction

Stock enhancement, the supplementation of dwindling natural populations with hatchery-reared populations, has become a frequent practice for addressing the deterioration of wild fishery resources [1,2,3,4]. In Taiwan, stock enhancement of marine species has been applied for at least 20 years through the development of hatchery-rearing technology [5,6]. However, hatchery-reared fish are usually produced from relatively few broodstock animals with limited genetic diversity. Genetic drift occurs in a hatchery population when the effective population size is small, akin to an anthropogenic founder effect [7]. Furthermore, the same broodstock is bred in the same hatcheries year after year, which makes the genetic makeup of these populations significantly differ from the natural population. The subsequent interbreeding between released and wild populations may change the genetic structure of natural populations and reduce their overall fitness and genetic diversity by repeatedly inundating wild populations with the same alleles [8].
Several genetic studies on stock enhancement have observed negative effects on natural populations after the release of captive-bred stock into the wild [9]. Whether through the deliberate release of hatchery populations or the escape of individuals from hatcheries, the interbreeding of wild fish populations with genetically drifted conspecifics can lead to lower fitness [10,11,12,13] and genetic diversity. Examples include case studies of the Adriatic sturgeon, Acipenser naccarii [14]; Korean starry flounder, Platichthys stellatus [15]; Atlantic cod, Gadus morhuaand [16]; Atlantic salmon, Salmo salar [17]; European seabass, Dicentrarchus labrax [18]; red sea bream, Pagrus major [19]; and black sea bream, Acanthopagrus schlegelii [20].
Stock enhancement is commonly used in developed countries to improve fishery resources and rebuild threatened species populations. Fish stocking is often contentious because of the high cost, limited scientific evaluability, and typically divided opinion from fisherpersons and ecological conservationists [21]. Currently, several countries, including the United States, Japan, and European countries, have official agencies for the management of stock enhancement. These agencies not only verify the reliability of external markers but also evaluate offspring genetic composition and reproduce mark-recapture studies [2]. Taiwan began to promote the artificial release of seedlings in 1980s; the government allocated a considerable amount of money every year but neglected to consider genetic factors [6]. Thus, responsible stock enhancement must coincide with genetic management to minimize genetic changes in wild populations [1,4]. Significant efforts have been made to maximize gene pool diversity by increasing the effective population size of hatchery broodstock and to minimize the differences from native populations by recruiting broodstock from local wild individuals; however, these practices remain uncommon in large-scale stock enhancement programs.
Silver sea bream Rhabdosargus sarba (Forsskal 1775), a species crucial to commercial fishing and aquaculture, is common in coastal waters of the Indian and the West Pacific Oceans, from the Red Sea and the coast of East Africa to Taiwan, Japan, China, and Australia. This species is abundant off the west coast of Taiwan and the Penghu Islands (Pescadores), where it is one of the most popular sport fish. In the wild, silver sea bream reproduces at 2–3 years of age in coastal waters and river mouths [22]; specimens in Asia are protandrous hermaphrodites [23]. Juveniles mature in estuaries, before heading to deeper waters in schools [24]. Aquaculture of silver sea bream began in the 1980s, and hatcheries in Taiwan are mainly located in the Kaohsiung and Pingtung areas. The broodstocks are from the main fishery areas, the Penghu Islands and off the west coast of Taiwan (Chiayi–Yunlin–Changhua).
Although no fishery stock assessments of silver sea bream have been conducted in Taiwan, wild capture fisheries are considered to be at the maximum sustainable yield or overfishing, and increases in natural stock are improbable. Consequently, a regular stock enhancement program has been conducted by the Taiwan Fisheries Sustainable Development Association (TFSDA) since 2002. At least 4 million fry in total (3–10 cm standard length) were released off the west coast of Taiwan from 2004 to 2018 and the Penghu Islands from 2003 to 2005. Irregular stock enhancement programs were also implemented by the Penghu local government from 2008 to 2018. However, only a few tagging experiments were performed, and no future government efforts have been made to evaluate and manage the stock enhancement of silver sea bream. Genetic monitoring before and after stock introduction is an essential component for evaluating the effectiveness of a stock enhancement program and refining procedures in an adaptive strategy consistent with a responsible approach [1,4].
Our study developed microsatellite markers and examined the genetic structure of silver sea bream off the west coast of Taiwan and the Penghu Islands, with a specific emphasis on the main release area of the species: the Penghu Islands waters. In Taiwan, all the silver sea bream larvae for stock enhancement were provided by a small number of private hatcheries that did not keep records of broodstock sources or genetics. Therefore, nine batches from private hatcheries were collected over the course of 2 years (2015–2016) to examine the genetics of hatchery stocks.

2. Results

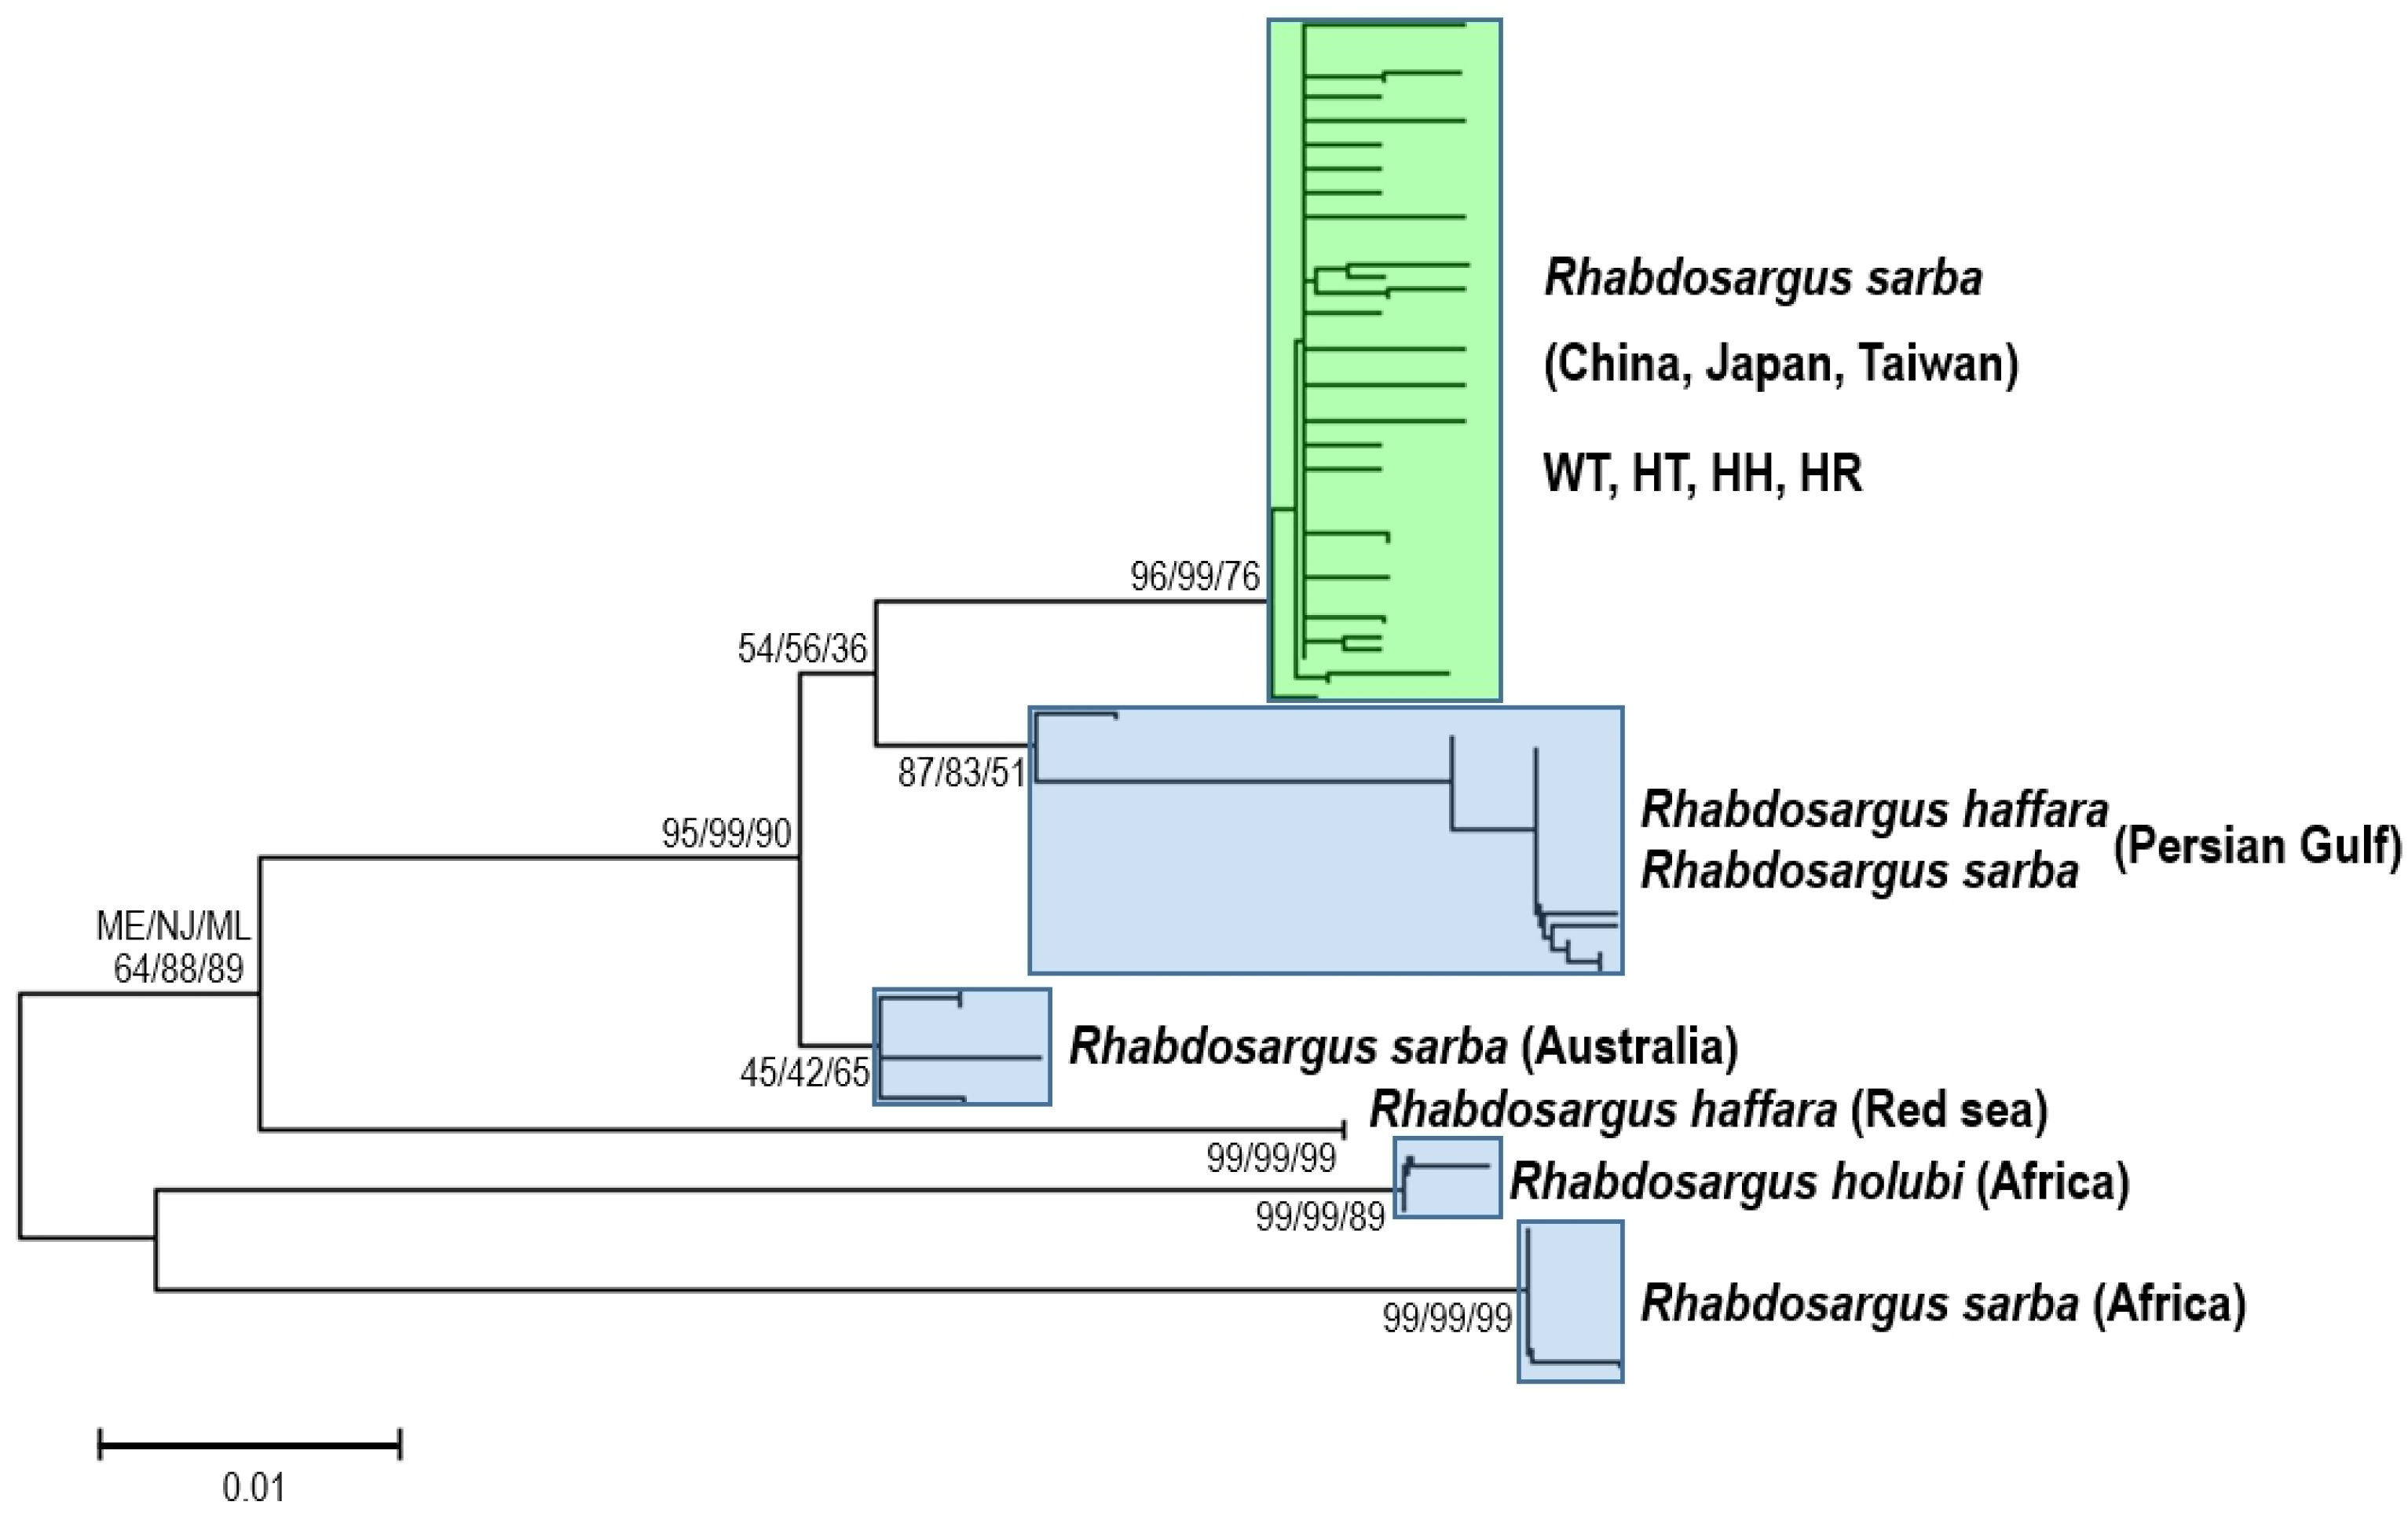
2.1. DNA Barcoding of Silver Seabream

One mtDNA clade was identified for our samples (WT, HT, HH, and HR) and silver seabream collected from East Asia (Taiwan, China, and Japan) (Figure 1; the abbreviated population names are shown in Table 1). Genus Rhabdosargus may exhibit paraphyly for distinct species, but Rhabdosargus sarba in East Asia is reciprocal monophyly. Our samples were only found East Asia haplotypes of Rhabdosargus sarba, suggesting no species identification problem.

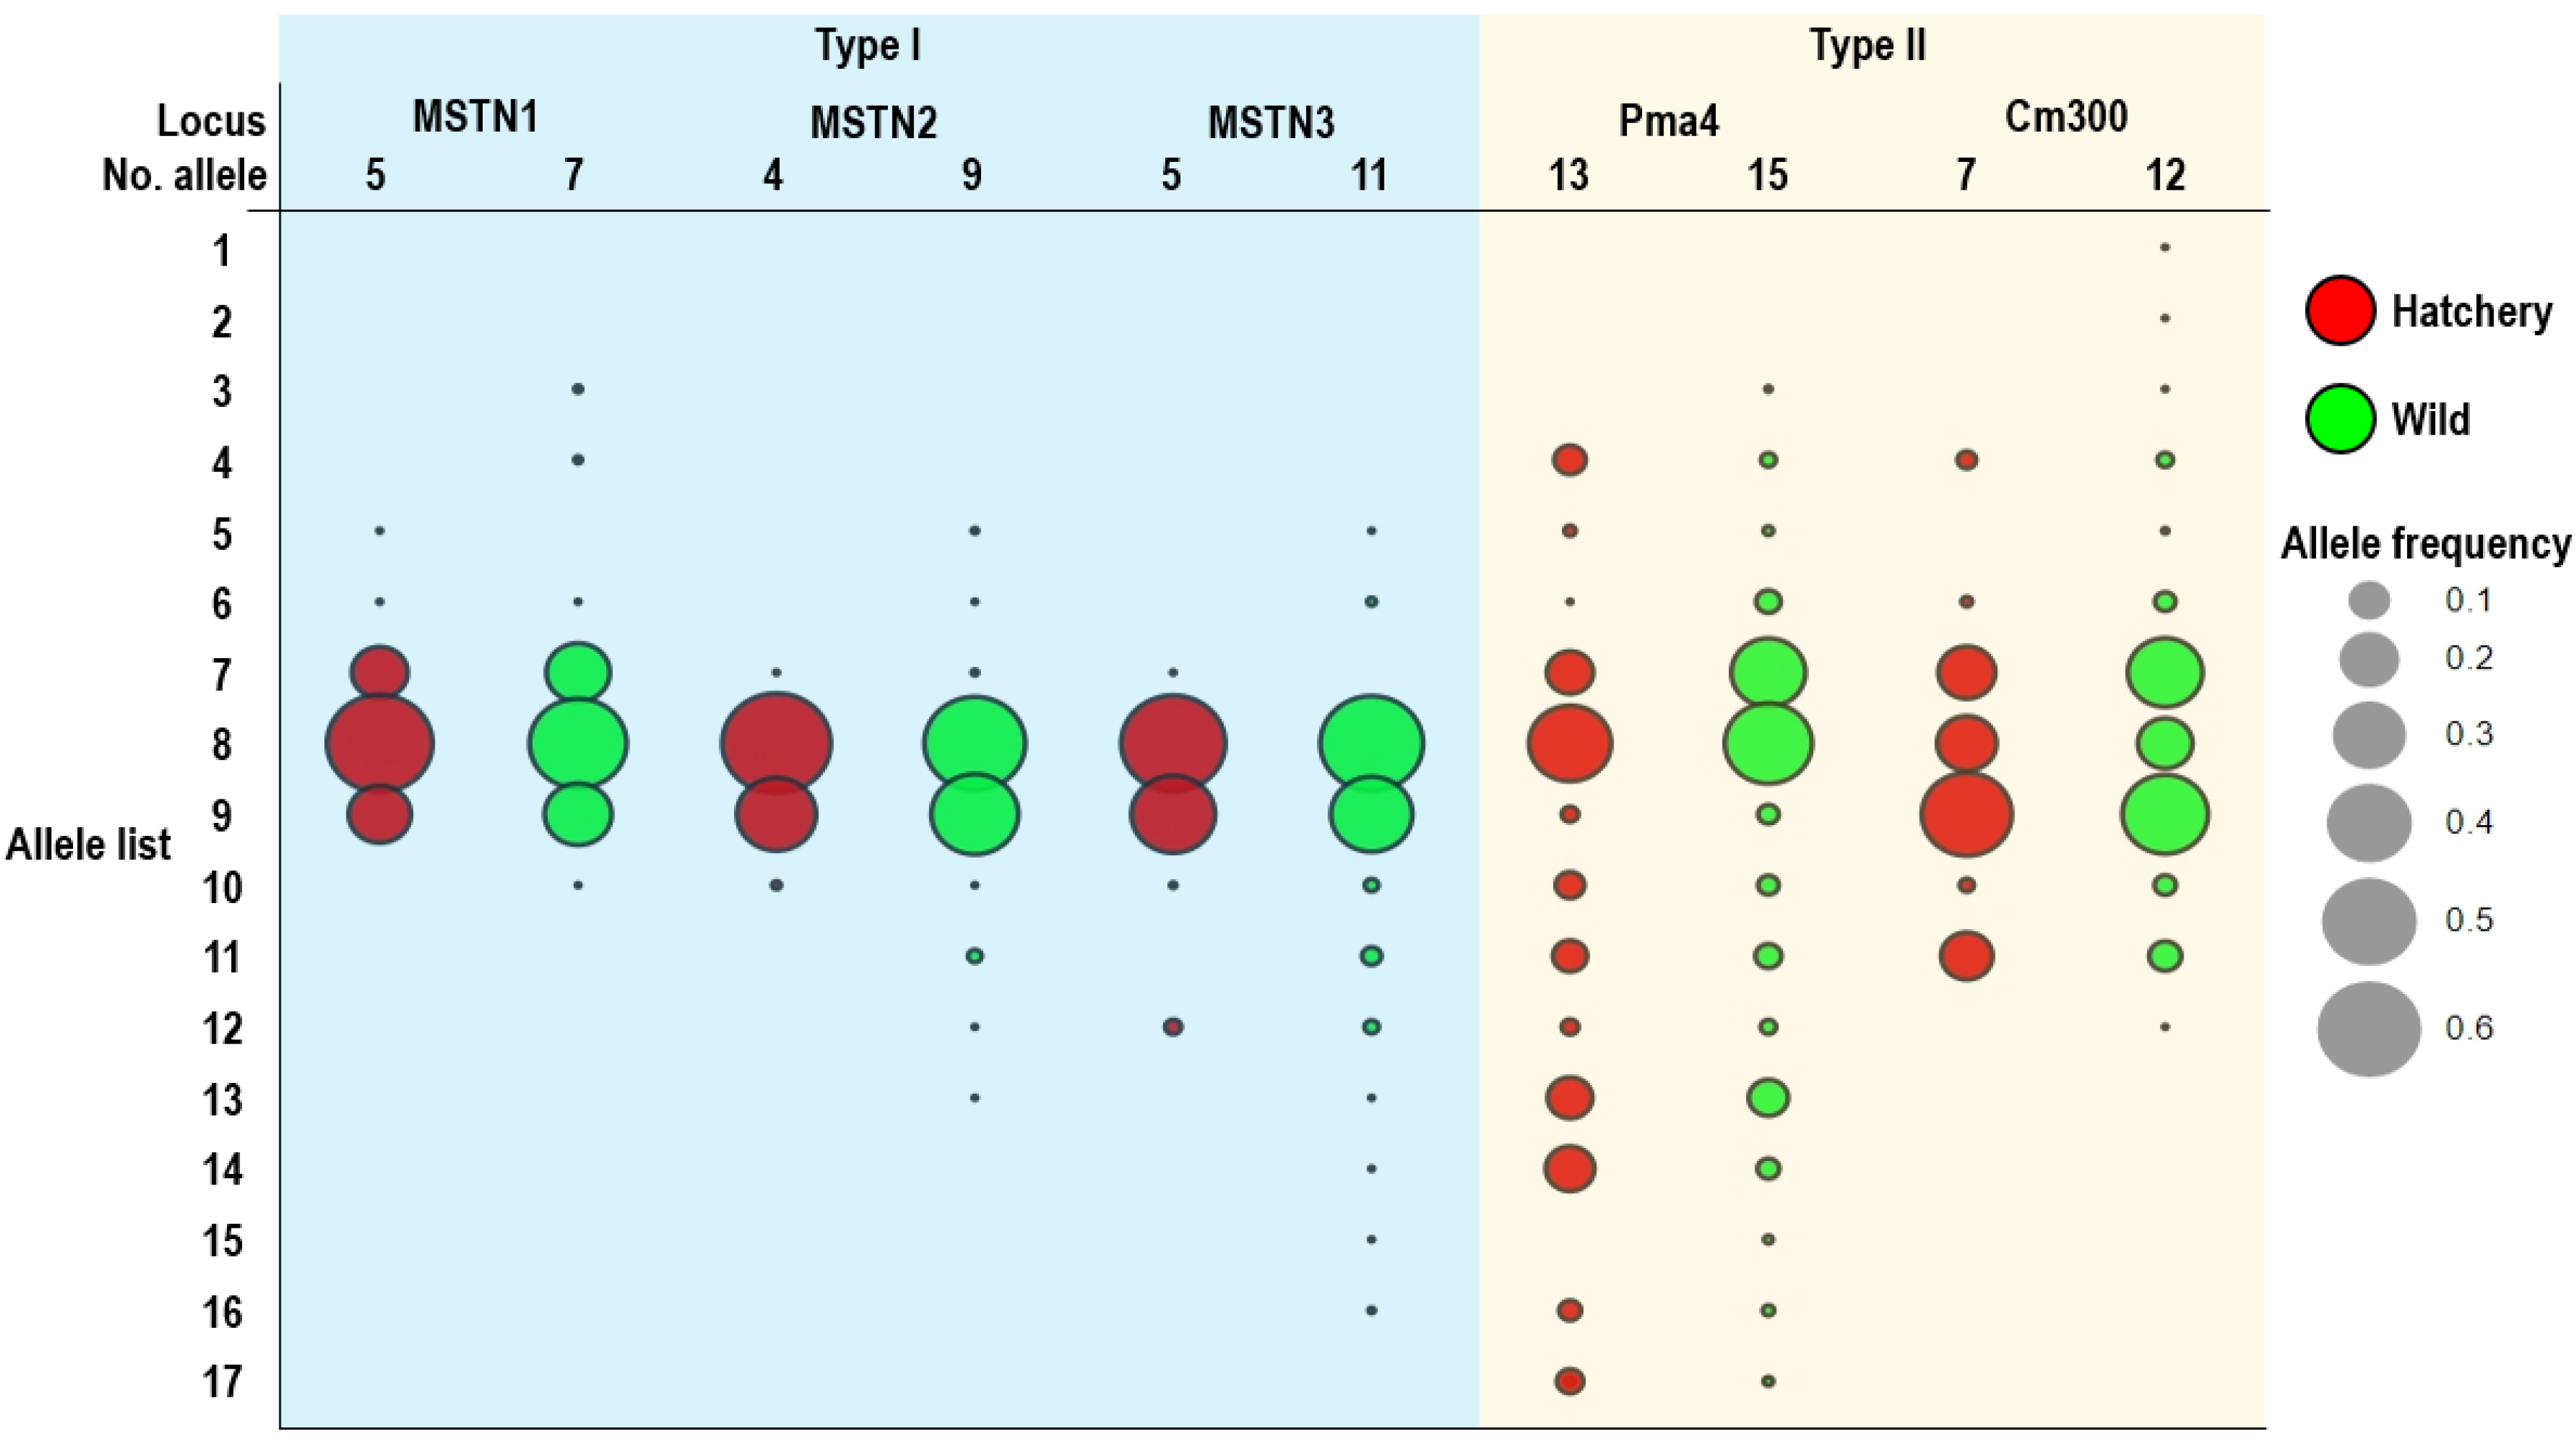
2.2. Genetic Diversity within Populations

Across the five microsatellite markers, all the individuals were genotyped successfully. No monomorphic loci were found among the 11 populations. In total, 57 alleles were detected from the samples; the marker Pma4 exhibited the highest number of alleles per locus in all individuals (16 alleles), and the marker MSTN1 exhibited the lowest number of alleles per locus (eight alleles) in all individuals. The marker Pma4 in WP exhibited the highest number of alleles per locus (16 alleles), whereas the marker MSTN2 in HT1, HT2, HH, HR1, and HR2 showed the lowest number of alleles (two alleles) (Table 2). Allele richness ranged from 1.928 (marker MSTN2) to 4.656 (marker Pma4) per locus in all individuals. The lowest allele richness was 1.650 in HT3 (marker MSTN2), and the highest allele richness was 6.056 in HHS (marker Pma4) (Table 2). Mean estimates of expected heterozygosity over all loci among the 11 populations were between 0.569 and 0.647 (Table 2). WT had the highest expected heterozygosity for all the loci (He = 0.647), whereas HT1 had the lowest expected heterozygosity (He = 0.569) (Table 2). Of the 55 population–locus combinations, 28 displayed deviations from the HWE significant at the p < 0.05 level (Table 2). Strong trends of deviation were observed for specific loci (marker Cm300). No possible genotyping errors were found in all loci and only one locus (Pma4) in WP shown possible null alleles (Table 2). All population–loci combinations displaying deviations included wild populations (WP and WT). The average FIS value among 11 populations was between −0.233 and 0.016. The highest FIS (0.016) was found in WT, and the lowest FIS (−0.233) was observed in HT1 (Table 2). MSTN1, MSTN2, and MSTN3 are the type I microsatellite markers (from introns and 3′UTR of myostatin 1 gene), and Pma4 and Cm300 are the type II microsatellite markers (randomly picked up from genome). Type II microsatellite markers are higher diversity than type I microsatellite markers, but type I microsatellite markers could reflect the loss of functional diversity sensitive more than type II markers in the domestication process (Type I: wild/hatchery = 27/14; Type II: wild/hatchery = 27/20) (Figure 2).

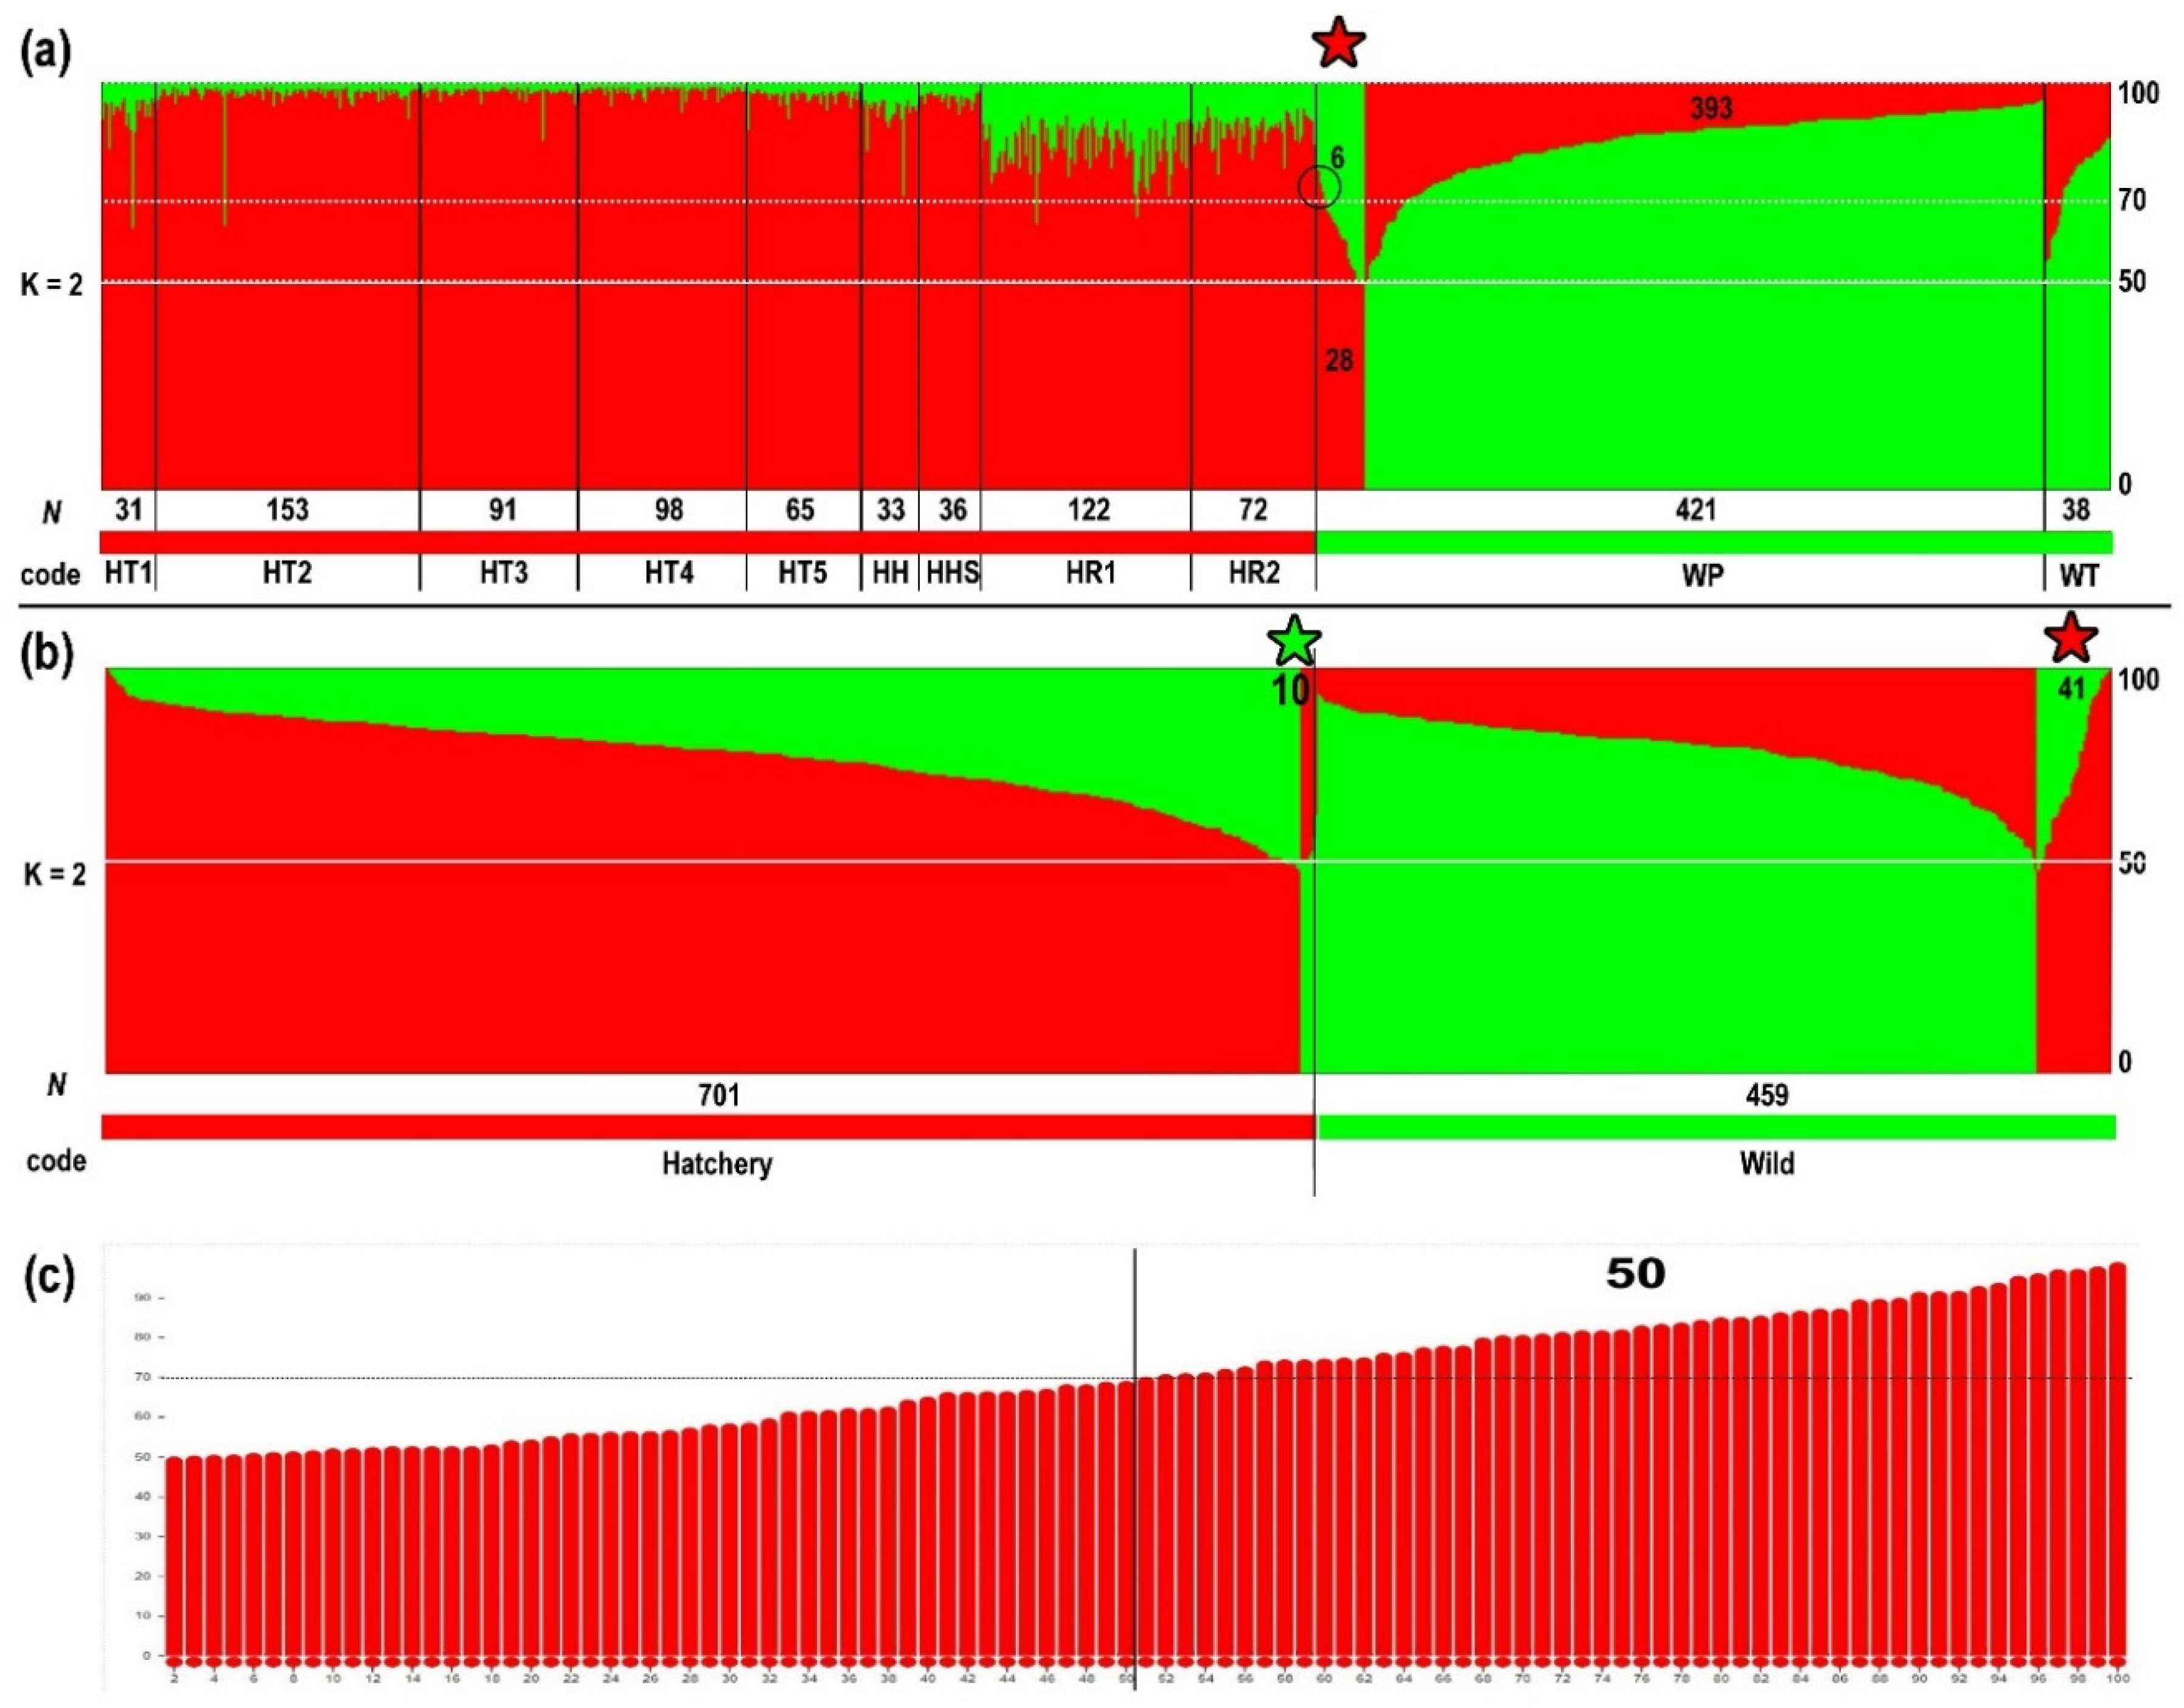
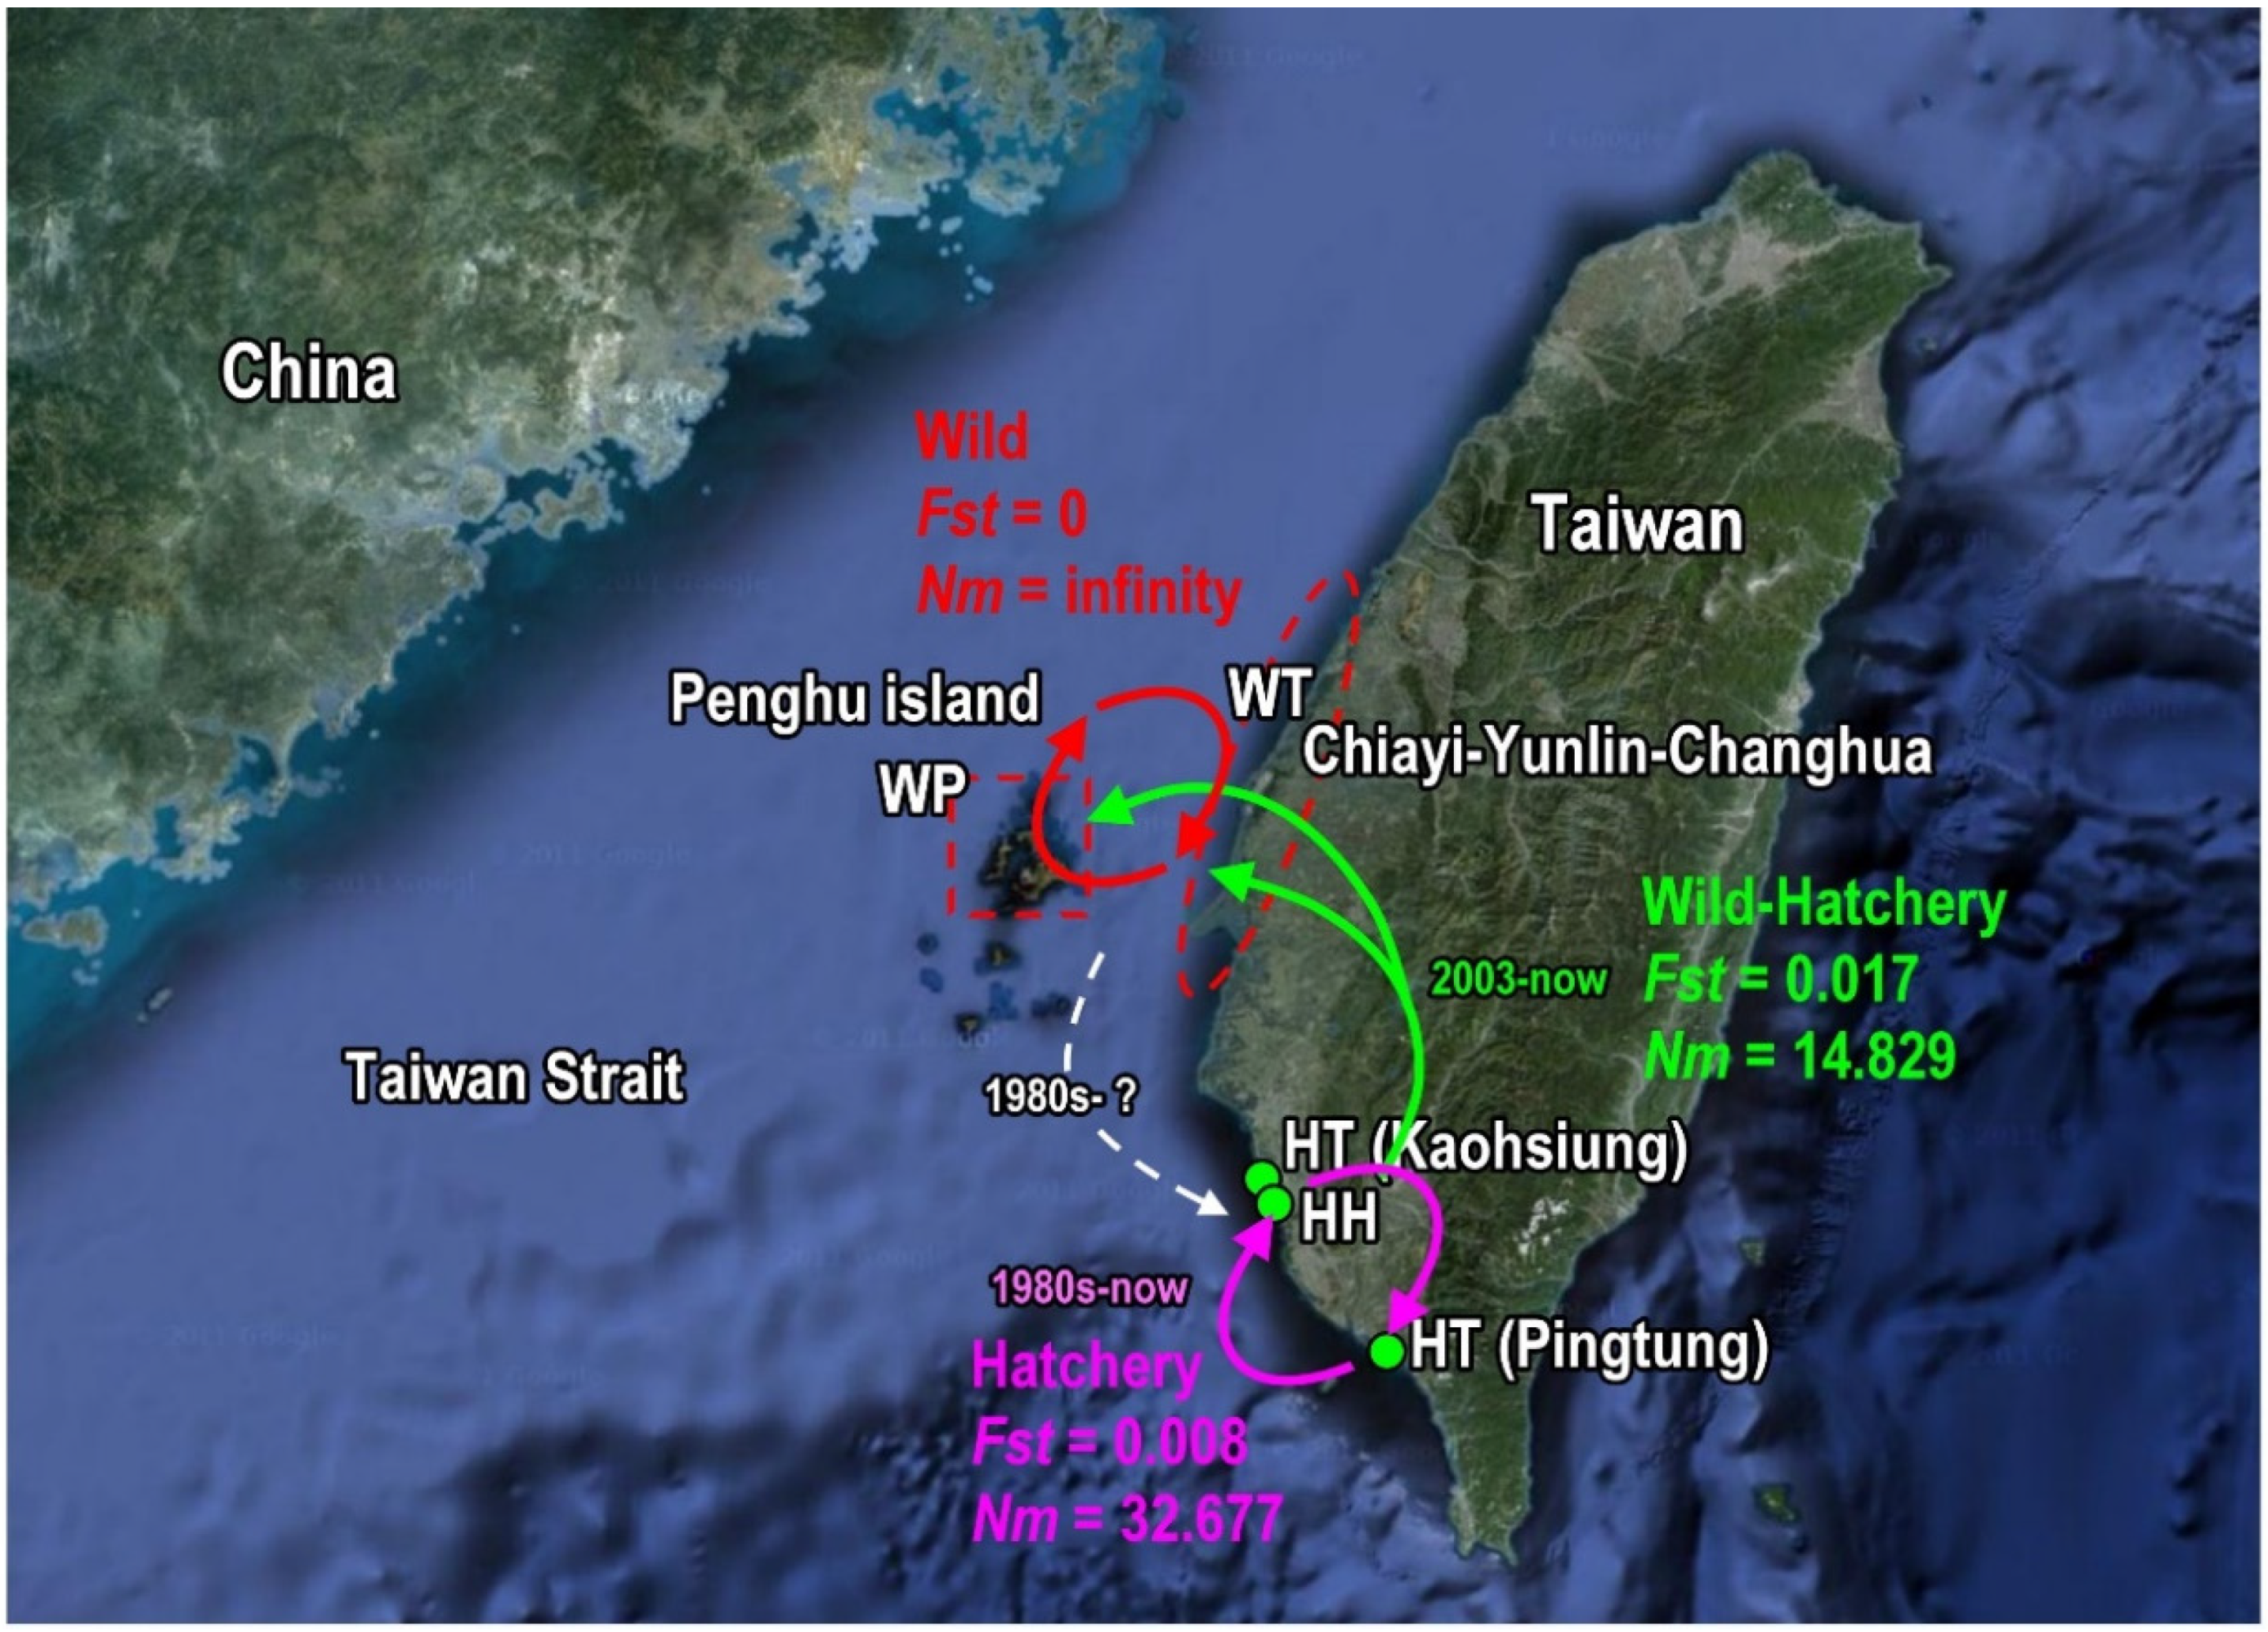
2.3. Genetic Differentiation among Populations

Pairwise comparisons between sampling localities were also performed. The pairwise FST values ranged from 0 (HT4–HT5–HHS and WT–WP) to 0.027 (HT3–WP), suggesting a low level of genetic differentiation (Table 3). Most comparisons among hatchery populations were not significantly different, but comparisons revealed that HT2 and HT3 differed significantly (p < 0.0009) (Table 3). WP and hatchery populations were significantly different, especially WP and HT (HT1, HT2, and HT3) (Table 3).
An initial analysis of molecular variance (AMOVA) indicated low differentiation (FST = 0.014) with 1% genetic variation distributed among the 11 populations (Table 4). However, the overall FST differentiation was nonetheless significant among populations, based on 999 permutations (p = 0 < 0.001; Table 4). Low genetic differentiation and high population connectivity across hatchery sampling sites were found (average FST value = 0.008; Table 4). The FST and gene flow (Nm) among the 11 populations were 0.014 and 17.209, respectively (Table 4).
A hierarchical AMOVA in which we defined several regions was performed, and all groupings were significantly supported by permutations (0.05 ≥ p ≥ 0.01) (Table 5). However, when K = 2, ((HT1, HT2, HT3, HT4, HT5, HH, HHS, HR1, and HR2,) and (WP and WT)) this was determined to be the optimal grouping using the SAMOVA program and exhibited the highest intergroup variance (7.65%) (Table 5). The best grouping result separated hatchery and wild populations. The FST and gene flow (Nm) between hatchery and wild individuals were 0.017 and 14.829, respectively; between wild populations were 0 and infinity, respectively; and among the nine hatchery populations were 0.008 and 32.677, respectively (Table 5).
The best estimation of the K value (number of groups) was 2 and exhibited a stable representation (data not shown). The optimal two-cluster structure analysis was supported by the SAMOVA grouping results ((HT1, HT2, HT3, HT4, HT5, HH, HHS, HR1, and HR2) and (WP and WT)) (Figure 3a; Table 5). All individuals from hatchery populations were grouped into the red cluster, and most individuals from wild populations were grouped into the green cluster. Only 28 individuals (6.7%) from WP were grouped into the red cluster, and these individuals were likely of hatchery origin (Figure 3a; Table 5). When clusters threshold is 70% in Structure analysis, there are six individuals grouped into the red cluster in WP (Figure 3a). Structure analysis of two groups (hatchery and wild) showed 10 hatchery individuals grouped into the green cluster (wild origin), and 41 wild individuals grouped into the red cluster (hatchery origin) (Figure 3b). We also use GenClass2 to check wild sample with Bayesian and frequency methods. There are 100 individuals grouped into the red cluster, and these individuals were likely of hatchery origin (Figure 3c). When the clusters threshold is 70% in GenClass2, there are 50 individuals grouped into the red cluster (Figure 3c). The genetic composition of the wild population is estimated to have low contribution rate of the hatchery stock (6, 28, 41, 50/459; 1.3%, 6.1%, 8.9%, 10.9%) (Figure 3).

3. Discussion

Silver sea bream, Rhabdosargus sarba is a crucial aquaculture species. Aquaculture of silver sea bream began in the 1980s, and hatcheries in Taiwan are located in the Kaohsiung and Pingtung areas. Broodstocks are from the main fishery areas, which are off the Penghu Islands and west coast of Taiwan (Chiayi–Yunlin–Changhua). Stock enhancement in Taiwan began in 1973 with the building and casting of artificial reefs but no fish release. Until 1987, the stocking program was conducted with restocking broodstock (Japanese eels, Anguilla japonica) and fry (finfish) [6]. Seven finfish (5.8 million fry), four mollusk (5 million seeds), and six crustacean (30 million larvae) species were released before 1996 [6]. Records for this period are not detailed, and it was not known how many silver sea bream were released into the wild. However, we speculate that from the 1980s to 1996, there was less gene flow between the cultured and wild populations of silver sea bream, and the genetic differences between the wild and hatchery populations should have increased over six generations (2–3 years per generation). Although introducing new stock from the wild remains possible, hatcheries in Taiwan generally have maintained farmed stock since the 1980s. Many studies have demonstrated that the domestication process directly reduces genetic diversity and increases genetic differentiation among populations such as the large yellow croaker (Larimichthys crocea), barramundi (Lates calcarifer), gilthead sea bream (Sparus aurata), purple sea urchin (Paracentrotus lividus), and pearl oysters (Pinctada maxima) [25,26,27,28,29]. Porta et al. [30] noted that substantial loss of genetic variation can be found after just one generation. Therefore, although no direct evidence exists for this period, we speculate that a certain genetic difference exists between wild and hatchery populations.
Between 2002 and 2018, the official fishery organization (TFSDA) in Taiwan conducted stock enhancement of 21 species (20 finfish and one crab) with more than 133,593,000 individuals. For the official stock enhancement program for silver sea bream during 2002–2018, 5,769,700 juvenile silver sea bream were released into the waters off the Penghu Islands and west coast of Taiwan. However, because of a lack of assessment of the contribution of the release, it is unknown whether the stock enhancement has been beneficial. The TFSDA did not produce fish fry directly. Seeds for stock enhancement were provided by one or several private hatcheries, a case in which the genetic information of stock is unknown. Thus, genetic information regarding hatchery stock remains insufficient, and there is no research related to hatchery silver seabream in East Asia. We found Rhabdosargus sarba in East Asia is reciprocal monophyly and a few genetic differences between hatchery and wild populations, meaning no evidence of introduction or hybrid in Taiwan (Figure 1 and Figure 3).
We conducted a molecular analysis of 701 silver sea bream larvae from nine batches produced by various hatcheries. We found that all hatchery-raised silver sea bream exhibited low genetic diversity (low Na) and could be considered a single cluster in structural analysis, AMOVA, and SAMOVA (Table 1, Table 4 and Table 5; Figure 3). In the Kaohsiung hatchery populations, the genetic differences in the juveniles (HH) and broodstock (HHS), and the three batches of released juveniles (HT3, HT4, and HT5) were small (FST = 0–0.005), indicating a high degree of homogenization. By contrast, the genetic differences between Pingtung hatchery (HT1, HT2) and Kaohsiung hatcheries (HH, HHS, HT3, HT4, and HT5) were large, and the FST values ranged from 0.005 to 0.016 (Table 3). These indicated genetic heterogeneity of broodstock or that the released juveniles were not from the same stock. However, the average FST among three hatchery populations was 0.008, and the gene flow (Nm) was 32.677. This result shows that hatchery species have extensive communication; thus, their genetics tend to be homogenous. The two wild populations were grouped into a single cluster in structural analysis, AMOVA, and SAMOVA (Table 1, Table 4 and Table 5; Figure 3). The genetic differences between WP and WT were extremely low (FST = 0), and the gene flow Nm was infinity (Figure 4), suggesting that WP and WT should be considered one population.
Silver sea bream in Taiwan has been cultured for nearly 40 years. Wild and hatchery populations can be clearly separated into two clusters with FST values ranging from 0.010 to 0.027 (average FST = 0.017). Although stock enhancement has been conducted for the last 15 years, the differences between farmed and wild fish remain relatively large, and the gene flow is 14.829, which is smaller than the genetic flow in cultured and wild populations (Figure 4). Among 459 wild individuals, 28 were considered to be hatchery-reared in structural analysis, whereas the remaining individuals had unequal proportions, illustrating the effects of release on the wild population. Deviations from HWE were observed mainly in the wild populations (WP and WT), indicating that one or more of the assumptions of the HWE model were not met (Table 2). The nonrandom mating of hatchery-reared stock may result from a low-effective population size (small broodstock) or kinship mating. However, because this is usually not the case in wild populations, the HWE deviations may be explained by the Wahlund effect caused by hatchery-reared individuals that may have been used for stock enhancement or escaped. Despite at least 5,769,700 juveniles being released during 2002–2018, escapes were another potential source of continued gene flow. Cage farming aquaculture is mainly in the coastal waters of the Penghu Islands, and escapes can happen after typhoons. Farmed fish escapes may affect natural populations and interfere with the broodstock [31]. Two- to three-year-old silver sea bream can mature and undergo protandrous (male-to-female) sex changes later [18]. Escaped farmed fish are relatively big (at 1–2 years of age) and show a higher survival rate than juveniles used for stock enhancement. Moreover, escape through spawning is also possible (as with the gilthead sea bream) [32,33]. Although we cannot distinguish based on genetics fish used for stock enhancement from those that escaped hatcheries, they can all be traced to hatchery-reared stock. The only difference is that stock enhancement is active and conscious whereas escapes are unintended (Figure 5).
Molecular markers were used to monitor and compare several genetic aspects of stock enhancement, including genetic diversity, sufficient broodstock, contribution rates, and hybridization between hatchery and wild individuals. Intraspecific genetic diversity is widely monitored using microsatellite markers derived from neutral or functional genes. In this study, we used only five microsatellite markers (two derived from neutral and three from functional genes) and obtained stable and clear results. The three microsatellite markers from functional genes did not exhibit deviations from HWE (Table 2). Type I markers have less marker diversity, while type II markers have higher diversity. This is mainly because type II markers are neutral and non-functional, thus easily accumulating higher diversity. Although type II markers are neutral, our sample is significantly disturbed by human activities, and is reflected not in compliance with HWE. Besides, as our MSTN-derived microsatellites are found within transcribed regions of the genome these markers may be less polymorphic than those from untranscribed regions, but possible conservation of the primer sites could make them more transferable across species and reduce null alleles. As MSTN-microsatellite markers directly sample variation in transcribed regions of the genome, they may provide an estimate of functional diversity. MSTN (Myostatin) is a negative regulator of skeletal muscle growth, and is important for growth. Additionally, growth character is easy to select in breeding programs, so this functional diversity is also easily lost in the domestication process.
Although analysis with more markers facilitates the identification of individuals of hatchery origin, it greatly increases the cost for 1000 samples. Although a large amount of genetic data can be obtained through the use of NGS (next-generation sequencing) in recent years, this cannot avoid the overall research cost and complexity increase. Therefore, when the sample cannot be reduced, we consider that samples are more important than genetic markers. In the case of population genetic structure containing stochastic or uncertain factors (such as escape, religious release, etc.), Bayesian analysis shows the advantages. For example, when we have the sampling information of each batch (hatchery) and wild samples, the accuracy of the analysis is significantly higher than only “hatchery” or “wild” information. That is, although this result may be simple now, we can improve our analysis through extra data (such as genetic markers, or hatchery information, etc.).
In stock enhancement programs, genetic analysis is possible only when hatchery stocks have genetically diverged from wild populations or when broodstock have been genotyped so that parentage-based tagging can be used to identify individuals of hatchery origin. Hatchery-reared individuals are released into the wild and are expected to be identified within the first generation, and, if possible, estimations regarding hybridization between hatchery-reared and wild individuals in the following few years should be made. This study demonstrated that hatchery-reared stocks exhibited admixture and could be grouped into one genetic clade. This clade may directly mix in hatcheries after imports of different stock or embryos from other hatcheries. In addition, before release, one batch of fry may represent a number of hatchery sources. The genetic composition of the wild population is relatively simple, and the low contribution rate of hatchery stock (6.1%; 28/459) indicated a weak but significant genetic effect after stock enhancement. The negative effects of stock enhancement are evident in many cases. The main effects include low survival rate, growth rate, reproductive fitness, and genetic diversity [34]. Few studies have provided direct evidence that wild stock has increased because of hatchery stocking [35]. Competition between wild and stocked fish may reduce wild population abundance and lead to replacement [35]. Low genetic diversity and high genetic differentiation are indicative of the risks of genetic management. These genetic issues should be carefully considered when designing a stocking plan, especially for fish from private hatcheries in Taiwan without adequate genetic information and management. In conclusion, this study proves the genetic evidence of stock enhancement in the past two decades. There are 6.1–8.9% (28–41/459) of individuals in the wild that come directly from hatchery sources or their hybrid. However, overall, we do not know whether these increase the fishery resources or just replace the composition of the wild population.

4. Materials and Methods

A total of 1160 specimens of silver sea bream, comprising 701 from the hatchery and 459 from the wild, were obtained from 2015 to 2016 (Table 6). Fresh specimens—at least 30 individuals for each batch, including juveniles, broodstock (S), and juveniles for releasing (R)—were sampled from three kinds of hatchery sources: (1) projected hatchery with native stock (HH and HHS); (2) private hatchery for TFSDA releasing without genetic information (HT: HT1–HT5); (3) unknown hatchery for religious releasing (HR: HR1 and HR2), and two field locations (WP: the Penghu Islands, release areas; WT: Chiayi–Yunlin–Changhua, on the west coast of Taiwan) (Table 1; Figure 4 and Figure 5). The geographical locations of these populations, the sampling locations with the abbreviated population names, and the sample size from each population are shown in Figure 4 and Figure 5, and Table 1. Small pieces of muscle tissue (approximately 3–5 mm) were prepared from fresh (2% alcohol used for anesthesia) or frozen samples and transported to our laboratory for molecular studies and preserved in 95% ethanol. The standard proteinase K/phenol method was modified from an animal DNA extraction protocol. Moreover, 0.8% agarose gel electrophoresis was performed to assess DNA template quality.
The mitochondrial COI gene (Partial COI gene sequences data see the Supplementary Materials) was amplified for species identification by using primer pair 5′-CCACCGCTTAAACCTCAGC-3′ and 5′-TCCGGAAGAAGCTAACAGGA-3′, yielding approximately 380 base pairs. Amplifications of the COI gene were performed using an initial denaturation at 94 °C for 3 min, followed by 35 cycles of 94 °C for 45 s, 55 °C for 30 s, and 72 °C for 45 s and a final extension at 72 °C for 3 min. DNA samples were purified using the QIAquick gel extraction kit (Qiagen, Taipei, Taiwan). Sequences were determined using the ABI 3100 (Applied Biosystems, Taipei, Taiwan) and were edited and aligned using DNA Baser (Heracle BioSoft S.R.L.). Partial COI gene sequences of genus Rhabdosargus were searched from NCBI. Minimum evolution (ME), neighbor-joining (NJ) and maximum likelihood (ML) topology were analyzed by MEGA X [36].
In this study, no useful information about microsatellite marks for silver sea bream (Rhabdosargus sarba). First, we tested 20 microsatellite marks from other sparid fish (data not shown). Then, five stable and informative microsatellite markers were used. Three were from silver sea bream MSTN1 (myostatin 1, GenBank: MT473239) gene introns, and 3′UTR: MSTN1 (intron1), MSTN2 (intron2), and MSTN3 (3′UTR). The other two were marker Pma4 from Takagi et al. [37] and marker Cm300 from Genebank (AB703235) (Table 6). These markers can also be used in other Sparide fish e.g., Pagrus major (data not shown) [37]. Polymerase chain reaction (PCR) amplification was performed in 20-µL reaction volumes containing 5–10 ng of template DNA, 1× PCR buffer (10 mM Tris and 50 mM KCl, pH 9.0), each dNTP at 200 μM, 1.5 mM MgCl2, 0.5 U of Taq polymerase (Promega, Madison, WI, USA), and 4 pmol of each primer. Thereafter, PCR cycling was performed in an Autorisierter Thermocycler (Eppendorf, Germany) with initial denaturing at 95 °C for 2 min, followed by 30 cycles of denaturing at 95 °C for 30 s, annealing at locus-specific temperatures for 30 s, extension at 72 °C for 30 s, and a final extension at 72 °C for 10 min. Fragment analysis of PCR products was performed using an ABI 3130 Genetic Analyzer (Applied Biosystems). The output was analyzed using GeneMapper software (versions 4.0, Applied Biosystems).
The observed genetic diversity (Ho), expected genetic diversity (He), and FIS were calculated by using Genalex 6.41 [38]. The chi-square Hardy–Weinberg equilibrium (HWE) test, pairwise FST values and associated p values were performed using Genalex 6.41 [38]. To determine significance levels of FST, multilocus genotypes were randomized between pairs of samples (9999 permutations), then significance after Bonferroni correction was calculated [39,40]. Possible genotyping errors and null alleles analyses were estimated by using Microchecker 2.2.3 [41]. To elucidate the population genetic structure from multilocus genotypes, an admixture model with correlated allele frequencies was developed using Structure v2.3.4 [42,43]. Five independent runs were performed for the entire data set for K values (numbers of groups) ranging from 1 to 9. All runs were based on 1,000,000 iterations of burn-in followed by an additional 5,000,000 iterations. The best estimation of the K value was conducted using Structure Harvester [44]. Summation and graphical representation of the Structure results were conducted using Clumpak [45]. A graphical representation of the Structure results was generated using Structure Plot v2.0 [46]. The estimated population structure was based on the highest probability Structure run at K = 2. Each individual was partitioned into two colored segments that represent individuals’ estimated likelihood of membership in “wild and “hatchery” clusters. The clusters threshold was 50% and 70% in Structure analysis. Then, the wild individuals were also checked by GenClass2 with Bayesian and frequency methods. The clusters threshold was 50% and 70% in GenClass2 analysis. [47]. A hierarchical analysis of molecular variance (hierarchical AMOVA) was performed to partition the total genetic variance within and between regions as described in Excoffier et al. [48]. We used Arlequin to calculate analysis of molecular variance (AMOVA) (Table 4). The most supported grouping can be automatically detected by using SAMOVA (based on Arlequin 3.5) (Table 5) [49,50].

Supplementary Materials

The following are available online at https://0-www-mdpi-com.brum.beds.ac.uk/2410-3888/5/2/19/s1, Partial COI gene sequences data.

Author Contributions

Conceptualization, T.-H.H.; Data curation, Y.-H.K. and K.-M.L.; Formal analysis, T.-H.H.; Funding acquisition, H.-Y.G.; Methodology, T.-H.H., C.-W.H. and H.-T.L.; Project administration, H.-Y.G.; Resources, K.-M.L. and C.-H.L.; Software, T.-H.H.; Supervision, H.-Y.G.; Validation, H.-T.L.; Visualization, T.-H.H. and H.-T.L.; Writing—original draft, T.-H.H.; Writing—review and editing, C.-W.H., H.-T.L. and H.-Y.G. All authors have read and agreed to the published version of the manuscript.

Funding

This research was supported by the Fisheries Agency, Council of Agriculture, Executive Yuan, ROC (Taiwan) under project number 107AS-11.2.1-FA-F1(3).

Acknowledgments

This research was supported by grants from the Center of Excellence for the Oceans (National Taiwan Ocean University), which were financially supported by the Featured Areas Research Center Program within the framework of the Higher Education Sprout Project by the Ministry of Education, ROC (Taiwan).

Conflicts of Interest

The authors declare no conflict of interest.

References

  1. Blankenship, H.L.; Leber, K.M. A responsible approach to marine stock enhancement. Am. Fish. Soc. Symp. 1995, 15, 167–175. [Google Scholar]
  2. Bell, J.D.; Leber, K.M.; Blankenship, H.L.; Loneragan, N.R.; Masuda, R. A new era for restocking, stock enhancement and sea ranching of coastal fisheries resources. Rev. Fish. Sci. 2008, 16, 1–9. [Google Scholar] [CrossRef]
  3. Araki, H.; Schmid, C. Is hatchery stocking a help or harm? Evidence, limitations and future directions in ecological and genetic surveys. Aquaculture 2010, 308, S2–S11. [Google Scholar] [CrossRef]
  4. Lorenzen, K.; Leber, K.M.; Blankenship, H.L. Responsible approach to marine stock enhancement: An update. Rev. Fish. Sci. 2010, 18, 189–210. [Google Scholar] [CrossRef]
  5. Liao, I.C. Status, Problems and prospects of stock enhancement in Taiwan. Hydrobiologia 1997, 352, 167–180. [Google Scholar] [CrossRef]
  6. Liao, I.C.; Su, M.S.; Leano, E.M. Status of research in stock enhancement and sea ranching. Rev. Fish Biol. Fisher. 2003, 13, 151–163. [Google Scholar] [CrossRef]
  7. Laikre, L.; Schwartz, M.K.; Waples, R.S.; Ryman, N.; Grp, G.W. Compromising genetic diversity in the wild: Unmonitored large-scale release of plants and animals. Trends Ecol. Evol. 2010, 25, 520–529. [Google Scholar] [CrossRef] [Green Version]
  8. Kitada, S.; Shishidou, H.; Sugaya, T.; Kitakado, T.; Hamasaki, K.; Kishino, H. Genetic effects of long-term stock enhancement programs. Aquaculture 2009, 290, 69–79. [Google Scholar] [CrossRef]
  9. Ward, R.D. The importance of identifying spatial population structure in restocking and stock enhancement programmes. Fish. Res. 2006, 80, 9–18. [Google Scholar] [CrossRef]
  10. Satake, A.; Araki, H. Stocking of captive-bred fish can cause long-term population decline and gene pool replacement: Predictions from a population dynamics model incorporating density-dependent mortality. Theor. Ecol. 2012, 5, 283–296. [Google Scholar] [CrossRef]
  11. Baskett, M.L.; Burgess, S.C.; Waples, R.S. Assessing strategies to minimize unintended fitness consequences of aquaculture on wild populations. Evol. Appl. 2013, 6, 1090–1108. [Google Scholar] [CrossRef] [PubMed]
  12. Milot, E.; Perrier, C.; Papillon, L.; Dodson, J.J.; Bernatchez, L. Reduced fitness of Atlantic salmon released in the wild after one generation of captive breeding. Evol. Appl. 2013, 6, 472–485. [Google Scholar] [CrossRef] [PubMed]
  13. Naish, K.A.; Seamons, T.R.; Dauer, M.B.; Hauser, L.; Quinn, T.P. Relationship between effective population size, inbreeding and adult fitness-related traits in a steelhead (Oncorhynchus mykiss) population released in the wild. Mol. Ecol. 2013, 22, 1295–1309. [Google Scholar] [CrossRef] [PubMed]
  14. Boscari, E.; Congiu, L. The need for genetic support in restocking activities and ex situ conservation programmes: The case of the Adriatic sturgeon (Acipenser naccarii Bonaparte, 1836) in the Ticino River Park. J. Appl. Ichthyol. 2014, 30, 1416–1422. [Google Scholar] [CrossRef]
  15. An, H.S.; Nam, M.M.; Myeong, J.I.; An, C.M. Genetic diversity and differentiation of the Korean starry flounder (Platichthys stellatus) between and within cultured stocks and wild populations inferred from microsatellite DNA analysis. Mol. Biol. Rep. 2014, 41, 7281–7292. [Google Scholar] [CrossRef]
  16. Glover, K.A.; Dahle, G.; Jørstad, K.E. Genetic identification of farmed and wild Atlantic cod, Gadus morhua, in coastal Norway. ICES J. Mar. Sci. 2011, 68, 901–910. [Google Scholar] [CrossRef] [Green Version]
  17. Wringe, B.F.; Jeffery, N.W.; Stanley, R.R.E.; Hamilton, L.C.; Anderson, E.C.; Fleming, I.A.; Bradbury, I.R. Extensive hybridization following a large escape of domesticated Atlantic salmon in the Northwest Atlantic. Commun. Biol. 2018, 1, 108. [Google Scholar] [CrossRef] [PubMed]
  18. Šegvić-Bubić, T.; Grubišić, L.; Trumbić, Ž.; Stanić, R.; Ljubković, J.; Maršić-Lučić, J.; Katavić, I. Genetic characterization of wild and farmed European seabass in the Adriatic sea: Assessment of farmed escapees using a Bayesian approach. ICES J. Mar. Sci. 2016, 74, 369–378. [Google Scholar] [CrossRef]
  19. Sawayama, E.; Nakao, H.; Kobayashi, W.; Minami, T.; Takagi, M. Identification and quantification of farmed red sea bream escapees from a large aquaculture area in Japan using microsatellite DNA markers. Aquat. Living Resour. 2019, 32, 26. [Google Scholar] [CrossRef]
  20. Gonzalez, E.B.; Umino, T. Fine-scale genetic structure derived from stocking black sea bream, Acanthopagrus schlegelii (Bleeker, 1854), in Hiroshima Bay, Japan. J. Appl. Ichthyol. 2009, 25, 407–410. [Google Scholar] [CrossRef]
  21. Hunt, T.L.; Jones, P. Informing the great fish stocking debate: An Australian case study. Rev. Fish. Sci. Aquac. 2018, 26, 275–308. [Google Scholar] [CrossRef]
  22. Hesp, S.A.; Potter, I.C. Reproductive biology of Rhabdosargus sarba (Sparidae) in Western Australian waters, in which it is a rudimentary hermaphrodite. J. Mar. Biol. Assoc. UK 2003, 83, 1333–1346. [Google Scholar] [CrossRef] [Green Version]
  23. De Mitcheson, Y.S.; Liu, M. Functional hermaphroditism in teleosts. Fish Fish. 2008, 9, 1–43. [Google Scholar] [CrossRef]
  24. Bauchot, M.L.; Skelton, P.H. Sparidae. In Check-List of The Freshwater fishes of Africa (CLOFFA); Daget, J., Gosse, J.-P., van den Audenaerde, D.F.E., Eds.; Tervuren and ORSTOM: Paris, France, 1986; pp. 331–332. [Google Scholar]
  25. Frost, L.A.; Evans, B.S.; Jerry, D.R. Loss of genetic diversity due to hatchery culture practices in barramundi (Lates calcarifer). Aquaculture 2006, 261, 1056–1064. [Google Scholar] [CrossRef]
  26. Lind, C.E.; Evans, B.S.; Knauer, J.; Taylor, J.J.U.; Jerry, D.R. Decreased genetic diversity and a reduced effective population size in cultured silver-lipped pearl oysters (Pinctada maxima). Aquaculture 2009, 286, 12–19. [Google Scholar] [CrossRef]
  27. Loukovitis, D.; Sarropoulou, E.; Vogiatzi, E.; Tsigenopopulos, C.S.; Kotoulas, G.; Magoulas, A.; Chatziplis, D. Genetic variation in farmed populations of the gilthead sea bream Sparus aurata in Greece using microsatellite DNA markers. Aquac. Res. 2012, 43, 239–246. [Google Scholar] [CrossRef]
  28. Wang, L.; Shi, X.F.; Su, Y.Q.; Meng, Z.N.; Lin, H.R. Loss of genetic diversity in the cultured stocks of the large yellow croaker, Larimichthys crocea, revealed by microsatellites. Int. J. Mol. Sci. 2012, 13, 5584–5597. [Google Scholar] [CrossRef] [Green Version]
  29. Segovia-Viadero, M.; Serrao, E.A.; Canteras-Jordana, J.C.; Gonzalez-Wanguemert, M. Do hatchery-reared sea urchins pose a threat to genetic diversity in wild populations? Heredity 2016, 116, 378–383. [Google Scholar] [CrossRef] [Green Version]
  30. Porta, J.; Porta, J.M.; Canavate, P.; Martinez-Rodriguez, G.; Alvarez, M.C. Substantial loss of genetic variation in a single generation of Senegalese sole (Solea senegalensis) culture: Implications in the domestication process. J. Fish Biol. 2007, 71, 223–234. [Google Scholar] [CrossRef]
  31. Holmer, M. Environmental issues of fish farming in offshore waters: Perspectives, concerns and research needs. Aquac. Environ. Interact. 2010, 1, 57–70. [Google Scholar] [CrossRef] [Green Version]
  32. Dimitriou, E.; Katselis, G.; Moutopoulos, D.K.; Akovitiotis, C.; Koutsikopoulos, C. Possible influence of reared gilthead sea bream (Sparus aurata, L.) on wild stocks in the area of the Messolonghi lagoon (Ionian Sea, Greece). Aquac. Res. 2007, 38, 398–408. [Google Scholar] [CrossRef]
  33. Somarakis, S.; Pavlidis, M.; Saapoglou, C.; Tsigenopoulos, C.S.; Dempster, T. Evidence for ’escape through spawning’ in large gilthead sea bream Sparus aurata reared in commercial sea-cages. Aquacult. Environ. Interact. 2013, 3, 135–152. [Google Scholar] [CrossRef] [Green Version]
  34. Hansen, M.M.; Fraser, D.J.; Meier, K.; Mensberg, K.-L.D. Sixty years of anthropogenic pressure: A spatio-temporal genetic analysis of brown trout populations subject to stocking and population declines. Mol. Ecol. 2009, 18, 2549–2562. [Google Scholar] [CrossRef] [PubMed]
  35. Kitada, S. Economic, ecological and genetic impacts of marine stock enhancement and sea ranching: A systematic review. Fish Fish. 2018, 19, 511–532. [Google Scholar] [CrossRef] [Green Version]
  36. Kumar, S.; Stecher, G.; Li, M.; Knyaz, C.; Tamura, K. MEGA X: Molecular evolutionary genetics analysis across computing platforms. Mol. Biol. Evol. 2018, 35, 1547–1549. [Google Scholar] [CrossRef]
  37. Takagi, M.; Taniguchi, N.; Cook, D.; Doyle, R.W. Isolation and characterization of microsatellite loci from red sea bream Pagrus major and detection in closely related species. Fish. Sci. 1997, 63, 199–204. [Google Scholar] [CrossRef] [Green Version]
  38. Peakall, R.; Smouse, P.E. GenAlEx 6.5: Genetic analysis in Excel. Population genetic software for teaching and research—An update. Bioinformatics 2012, 28, 2537–2539. [Google Scholar] [CrossRef] [Green Version]
  39. Rice, W.R. Analysing tables of statistical tests. Evolution 1989, 43, 223–225. [Google Scholar] [CrossRef]
  40. Borrell, Y.J.; Pinera, J.A.; Sanchez Prado, J.A.; Blanco, G. Mitochondrial DNA and microsatellite genetic differentiation in the European anchovy Engraulis encrasicolus L. ICES J. Mar. Sci. 2012, 69, 1357–1371. [Google Scholar] [CrossRef] [Green Version]
  41. Van Oosterhout, C.; Hutchinson, W.F.; Wills, D.P.M.; Shipley, P. MICRO-CHECKER: Software for identifying and correcting genotyping errors in microsatellite data. Mol. Ecol. Notes 2004, 4, 535–538. [Google Scholar] [CrossRef]
  42. Falush, D.; Stephens, M.; Pritchard, J.K. Inference of population structure using multilocus genotype data: Linked loci and correlated allele frequencies. Genetics 2003, 164, 1567–1587. [Google Scholar] [PubMed]
  43. Falush, D.; Stephens, M.; Pritchard, J.K. Inference of population structure using multilocus genotype data: Dominant markers and null alleles. Mol. Ecol. Notes 2007, 7, 574–578. [Google Scholar] [CrossRef] [PubMed]
  44. Earl, D.A.; von Holdt, B.M. STRUCTURE HARVESTER: A website and program for visualizing STRUCTURE output and implementing the Evanno method. Conserv. Genet. Resour. 2012, 4, 359–361. [Google Scholar] [CrossRef]
  45. Kopelman, N.M.; Mayzel, J.; Jakobsson, M.; Rosenberg, N.A.; Mayrose, I. C LUMPAK: A program for identifying clustering modes and packaging population structure inferences across K. Mol. Ecol. Resour. 2015, 15, 1179–1191. [Google Scholar] [CrossRef] [Green Version]
  46. Ramasamy, R.K.; Ramasamy, S.; Bindroo, B.B.; Naik, V.G. STRUCTURE PLOT: A program for drawing elegant STRUCTURE bar plots in user friendly interface. SpringerPlus 2014, 3, 431. [Google Scholar] [CrossRef] [Green Version]
  47. Piry, S.; Alapetite, A.; Cornuet, J.-M.; Paetkau, D.; Baudouin, L.; Estoup, A. GeneClass2: A software for genetic assignment and first-generation migrant detection. J. Hered. 2004, 95, 536–539. [Google Scholar] [CrossRef] [PubMed]
  48. Excoffier, L.; Smouse, P.E.; Quattro, J.M. Analysis of molecular variance inferred from metric distances among DNA haplotypes: Application to human mitochondrial DNA restriction data. Genetics 1992, 131, 479–491. [Google Scholar] [PubMed]
  49. Dupanloup, I.; Schneider, S.; Excoffier, L.A. Simulated annealing approach to define the genetic structure of populations. Mol. Ecol. 2002, 11, 2571–2581. [Google Scholar] [CrossRef]
  50. Excoffier, L.; Lischer, H.E.L. Arlequin suite ver 3.5: A new series of programs to perform population genetics analyses under Linux and Windows. Mol. Ecol. Resour. 2010, 10, 564–567. [Google Scholar] [CrossRef]
Figure 1. Neighbor-joining (NJ) topology derived from partial COI gene of genus Rhabdosargus. The branch lengths were computed using the maximum composite likelihood method. All ambiguous positions were removed for each sequence pair (pairwise deletion option). The root was temporarily set at the deepest branch (midpoint rooting method). Numbers at nodes indicate topological support: 1000 bootstrap replicates in minimum evolution (ME), neighbor-joining (NJ) and maximum likelihood (ML) (ME/NJ/ML).
Fishes 05 00019 g001
Figure 2. Allele frequency of five microsatellite markers among two sources (hatchery and wild) of silver sea bream in Taiwan. MSTN1, MSTN2, and MSTN3 are type I microsatellite markers, and Pma4 and Cm300 are type II microsatellite markers.
Fishes 05 00019 g002
Figure 3. (a) Structure analysis of 11 populations of silver sea bream collected from hatcheries and the wild in Taiwan. The estimated population structure based on the highest probability Structure run at K = 2. Each individual is represented by a thin vertical line, which is partitioned into K colored segments that represent individuals’ estimated likelihood of membership in each of the K clusters. The red star indicates individuals with high probability of being grouped in the red cluster. When clusters threshold is 50% in Structure analysis, there are 28 individuals grouped into the red cluster and 393 individuals grouped into the green cluster in WP; when clusters threshold is 70% in Structure analysis, there are six individuals grouped into the red cluster in WP; (b) Structure analysis of hatchery and wild samples of silver sea bream in Taiwan. The estimated population structure based on the highest probability Structure run at K = 2. Each individual is represented by a thin vertical line, which is partitioned into K colored segments that represent individuals’ estimated likelihood of membership in each of the K clusters. The red star indicates individuals with high probability of being grouped in the red cluster. The green star indicates individuals with high probability of being grouped in the green cluster. There are 41 individuals grouped into the red cluster in wild samples; and 10 individuals grouped into the green cluster in hatchery samples. Clusters threshold is 50% in Structure analysis. (c) There are 100 individuals from wild populations were grouped into the red cluster by using GenClass2, and these individuals were likely of hatchery origin. When the clusters threshold is 70%, there are 50 individuals grouped into the red cluster. Bayesian and frequency methods are used in GenClass2.
Fishes 05 00019 g003
Figure 4. Map of study sampling locations. Aquaculture of silver sea bream began in the 1980s, and hatcheries are mainly located in the Kaohsiung and Pingtung areas. Broodstocks are from the main fishery areas: the Penghu Islands and the west coast of Taiwan (Chiayi–Yunlin–Changhua).
Fishes 05 00019 g004
Figure 5. Diagram of sampling, hatchery, and stock enhancement information of silver sea bream.
Fishes 05 00019 g005
Table 1. Summary of sample information. N = number of fish.
CodeNYearSourcesFish TypesStructure Analysis *
HT
HT1312015TFSDA releasing from Pingtung hatcheryReleased juvenilesAll samples are hatchery
HT21532015 All samples are hatchery
HT3912015TFSDA releasing from Kaohsiung hatchery All samples are hatchery
HT4982015 All samples are hatchery
HT5652016 All samples are hatchery
HH All samples are hatchery
HH332015Juveniles from Kaohsiung hatchery broodstockJuvenilesAll samples are hatchery
HHS362015Broodstock of Kaohsiung hatcheryBroodstockAll samples are hatchery
HR All samples are hatchery
HR11222016Religious releasing from Unknown hatcheryReleased juvenilesAll samples are hatchery
HR2722016 All samples are hatchery
WP4212015Wild; Penghu island (releasing area)Subadult/adultWild: 393 (93.35%)
Hatchery: 28 (6.65%) +
WT382015Wild; Chiayi–Yunlin–ChanghuaSubadult/adultAll samples are wild cluster
* Clusters threshold is 50% in Structure analysis; + incurred samples were also check by Geneclass2.
Table 2. Summary statistics for genetic variation at five microsatellite loci in 11 populations of silver sea bream.
Population (N)MSTN1MSTN2MSTN3Pma4Cm300Average
HT1 (31)Na3241044.6
Ne1.8051.8752.0515.2092.5802.704
Ho0.5480.5480.5160.9031.0000.703
He0.4460.4670.5120.8080.6120.569
FIS−0.230 NS−0.175 NS−0.007 NS−0.118 NS−0.633 ***−0.233
HT2 (153)Na4231375.8
Ne2.2301.9062.0265.1283.4782.954
Ho0.6600.5160.6010.7970.9870.712
He0.5520.4750.5060.8050.7120.61
FIS−0.197 **−0.086 NS−0.187 NS0.009 NS−0.385 ***−0.169
HT3 (91)Na3351265.8
Ne2.1381.6501.9144.0513.5292.656
Ho0.6040.3560.4730.7780.9560.633
He0.5320.3940.4780.7530.7170.575
FIS−0.136 NS0.098 NS0.010 NS−0.033 NS−0.333 ***−0.079
HT4 (98)Na3331265.4
Ne2.2841.9271.9305.8223.43.072
Ho0.6940.5410.4690.8470.9800.706
He0.5620.4810.4820.8280.7060.612
FIS−0.234 *−0.124 NS0.026 NS−0.023 ***−0.388 ***−0.149
HT5 (65)Na3431175.6
Ne2.3991.8621.7935.2013.4352.938
Ho0.7230.4770.4620.8280.9850.695
He0.5830.4630.4420.8080.7090.601
FIS−0.240 *−0.030 NS−0.044 NS−0.025 NS−0.389 ***−0.146
HH (33)Na3231064.8
Ne2.2951.6951.9575.0183.2852.85
Ho0.5150.3330.7880.9091.0000.709
He0.5640.4100.4890.8010.6960.592
FIS0.087 NS0.187 NS−0.611 **−0.135 NS−0.438 ***−0.182
HHS (36)Na3331175.4
Ne1.8891.9442.0086.0563.5903.098
Ho0.5280.4440.4720.8330.9720.65
He0.4710.4860.5020.8350.7210.603
FIS−0.121 NS0.085 NS0.059 NS0.002 NS−0.348 *−0.065
HR1 (122)Na3241375.8
Ne2.0681.8711.9695.5303.2682.941
Ho0.6390.4750.5160.8200.8930.669
He0.5160.4660.4920.8190.6940.597
FIS−0.238 **−0.021 NS−0.049 ***−0.001 ***−0.287 ***−0.119
HR2 (72)Na4221275.4
Ne2.4991.7141.8703.3703.3622.563
Ho0.7080.4230.5420.6760.9580.661
He0.6000.4170.4650.7030.7030.577
FIS−0.181 NS−0.014 NS−0.164 NS0.039 ***−0.364 ***−0.137
WP (421)Na68916 +1110
Ne2.5922.0222.0813.5673.3932.731
Ho0.6600.4800.5580.6510.9360.657
He0.6140.5060.5200.7200.7050.613
FIS−0.075 ***0.051 ***−0.074 ***0.096 ***−0.327 ***−0.066
WT (38)Na5471097
Ne2.8822.1312.4293.4024.0792.985
Ho0.7110.5260.4470.6320.8950.642
He0.6530.5310.5880.7060.7550.647
FIS−0.088 **0.008 ***0.240 ***0.105 *−0.185 ***0.016
All (1160)Na8912161211.4
Ne2.3741.9282.0274.6563.5232.901
N = number of samples, Na = allele number, Ne = allele richness, He = expected heterozygosity, Ho = observed heterozygosity, FIS = fixation index, HWE = Hardy–Weinberg equilibrium test, NS = not significant, * p < 0.05, ** p < 0.01, *** p < 0.001, Null alleles may be present at this locus, + p < 0.01 (red color).
Table 3. Pairwise FST values (below diagonal) and associated p values (above diagonal) among 11 populations of silver sea bream collected from hatcheries and the wild in Taiwan.
HT1HT2HT3HT4HT5HHHHSHR1HR2WPWT
HT1-0.055 NS0.037 NS0.148 NS0.015 NS0.146 NS0.156 NS0.140 NS0.027 NS0.000 *0.012 NS
HT20.010-0.000 *0.017 NS0.003 NS 0.063 NS0.125 NS0.003 NS 0.002 NS 0.000 *0.011 NS
HT30.0120.013-0.035 NS0.283 NS0.297 NS0.179 NS0.004 NS 0.346 NS0.000 *0.000 *
HT40.0050.0070.006-0.430 NS0.227 NS0.392 NS0.035 NS0.037 NS0.000 *0.019 NS
HT50.0160.0120.0010.000-0.171 NS0.363 NS0.018 NS0.123 NS0.000 *0.018 NS
HH0.0080.0070.0020.0030.005-0.234 NS0.259 NS0.359 NS0.004 NS 0.058 NS
HHS0.0070.0050.0040.0000.0000.004-0.209 NS0.050 NS0.004 NS 0.041 NS
HR10.0060.0100.0110.0060.0090.0020.003-0.005 NS 0.000 *0.029 NS
HR20.0150.0150.0010.0070.0040.0010.0100.013-0.000 *0.048 NS
WP0.0260.0230.0270.0160.0190.0160.0200.0150.017-0.426 NS
WT0.0240.0140.0210.0120.0150.0110.0140.0120.0100.000-
p values (above diagonal) and their significance after Bonferroni corrections at an alpha level of 5% (p = 0.05/55 = 0.0009). * p < 0.0009; NS, not significant.
Table 4. Analysis of molecular variance (AMOVA) among different groups of silver sea bream.
SourcedfSum of SquaresMean SquaresVariance% Total
Eleven populations
Among sampling localities1055.3295.5330.0221%
Among individuals11491559.8881.3580.0000%
Within individuals11601947.5001.6791.67999%
Total23193562.716 1.701100%
Average FST value = 0.014 (p = 0 < 0.001); Nm = 17.209
Hatchery (9) and wild (2)
Among sampling localities129.87429.8740.0262%
Among individuals11581585.3421.3690.0000%
Within individuals11601947.5001.6791.67998%
Total23193562.716 1.705100%
FST value = 0.017 (p = 0 < 0.001), Nm = 14.829
Nine hatchery populations
Among sampling localities824.2523.0310.0111%
Among individuals692899.4591.3000.0000%
Within individuals7011195.0001.7051.70599%
Total14012118.710 1.716100%
Average FST value = 0.008 (p = 0 < 0.001), Nm = 32.677.
Table 5. Hierarchical analysis of molecular variance (AMOVA) of 11 populations of silver sea bream collected from hatcheries and the wild in Taiwan by using SMOVA.
Region GroupingsΦCT% Variance
among Groups
K = 2(HT1, HT2, HT3, HT4, HT5, HH, HHS, HR1, HR2); (WP, WT)0.077 *7.65
K = 3(HT1, HT2, HT3, HT4, HT5, HH, HHS); (HR1, HR2); (WP, WT)0.075 *7.53
K = 4(HT1, HT2, HT3, HT4, HT5); (HH, HHS); (HR1, HR2); (WP, WT)0.075 **7.47
K = 5(HT1, HT2, HT3, HT4, HT5); (HH, HHS); (HR1, HR2); (WP); (WT)0.073 **7.30
K = 6(HT1, HT2, HT3, HT4, HT5); (HH, HHS); (HR1); (HR2); (WP); (WT)0.071 **7.06
K = 7(HT1, HT2); (HT3, HT4, HT5); (HH, HHS); (HR1); (HR2); (WP); (WT)0.068 **6.86
** 0.01 > p ≥ 0.001; * 0.05 ≥ p ≥ 0.01; NS, not significant.
Table 6. Five selected microsatellite loci of silver sea bream.
LocusPrimer Sequences (5′–3’)Repeat MotifTa (°C)Size Range (bp)Reference
MSTN1F:CACGCCATCACGGAGACGATTATG(T)n59248–288This study
R:CAATCCCTGACACGAATCCCTGAC
MSTN2F:GCAGGCGGTTAAACATTCCTGC(CA)n58 340–362This study
R:GGTTGGTTAACCACCGCCGTCTC
MSTN3F:CTGCTTTCACATCCGGCACAGC (CA)n60 179–207This study
R:GAACACAGAGACGACGAAGGACGAG
Pma4F:GCCACCTACTGTTTCCTCAACTTCTG (CA)n60150–180[32]
R:GTGATTACAGTCGGGTTTGGCTG
Cm300 F:GAAAGATGGGTTGTGAGGGT (CT)n54117–139AB703235
R:CCATCTGAACGTCTGAGCG

