Use of Environmental DNA to Detect Grass Carp Spawning Events
by
 , and
, and
Cari-Ann Hayer
1, 
Michael F. Bayless
2,
Amy George
3,
Nathan Thompson
3,
Catherine A. Richter
3,* and
Duane C. Chapman
3 1
US Fish and Wildlife Service; Green Bay Fish and Wildlife Conservation Office, 2661 Scott Tower Drive, New Franken, WI 54229, USA
2
Missouri Department of Conservation, 2010 South Second St, Clinton, MO 64735, USA
3
US Geological Survey; Columbia Environmental Research Center, 4200 New Haven Road, Columbia, MO 65201, USA
*
Author to whom correspondence should be addressed.
Fishes 2020, 5(3), 27; https://0-doi-org.brum.beds.ac.uk/10.3390/fishes5030027
Submission received: 18 July 2020
/
Revised: 18 August 2020
/
Accepted: 21 August 2020
/
Published: 27 August 2020
(This article belongs to the Special Issue Biology and Control of Invasive Fishes)
Abstract
:The timing and location of spawning events are important data for managers seeking to control invasive grass carp populations. Ichthyoplankton tows for grass carp eggs and larvae can be used to detect spawning events; however, these samples can be highly debris-laden, and are expensive and laborious to process. An alternative method, environmental DNA (eDNA) technology, has proven effective in determining the presence of aquatic species. The objectives of this project were to assess the use of eDNA collections and quantitative eDNA analysis to assess the potential spawning of grass carp in five reservoir tributaries, and to compare those results to the more traditional method of ichthyoplankton tows. Grass carp eDNA was detected in 56% of sampling occasions and was detected in all five rivers. Concentrations of grass carp eDNA were orders of magnitude higher in June, corresponding to elevated discharge and egg presence. Grass carp environmental DNA flux (copies/h) was lower when no eggs were present and was higher when velocities and discharge increased and eggs were present. There was a positive relationship between grass carp eDNA flux and egg flux. Our results support the further development of eDNA analysis as a method to detect the spawning events of grass carp or other rheophilic spawners.
1. Introduction
Since the developing semibuoyant eggs and the larvae of grass carp (Ctenopharyngodon idella) drift in the current [1,2,3,4], ichthyoplankton tows during the spawning season can be used to detect spawning events [2,5]. Grass carp are thought to be cued to spawn by a temperature threshold coupled with discharge pulses or other factors, such as turbidity and flow velocity, which are related to discharge. Ichthyoplankton samples from tows taken during high discharge tend to be debris-laden and are expensive and laborious to process. In addition, grass carp eggs in the drift tend to distribute more densely toward the bottom of the water column [6], where sampling is difficult or dangerous. An alternative technology, environmental DNA (eDNA), has been used in determining the presence of aquatic species from water samples taken from a particular waterbody [7]. Grass carp are mass spawners, and the movement and activity of many fish, and the release of sex products, especially sperm, could be expected to cause a sharp increase in the amount of eDNA in the water. Consequently, eDNA technologies could theoretically be used for the detection of spawning or as part of a two-tiered approach with traditional ichthyoplankton sampling.
Grass carp are efficient at removing vegetation and if they reach high abundance, can have undesirable environmental effects in their invaded range [8], although in Asia they are important and desirable species. In both cases, the detection of spawning events is important for managers [9,10]. Furthermore, bighead carp (Hypophthalmichthys nobilis) and silver carp (H. molitrix), which also have been extremely problematic invasive species in central North America but are important desirable species in Asia, have essentially similar spawning behaviors [1]. If sampling for eDNA is an efficient way to detect the spawning events of grass carp, it should work similarly for these carp species or for other species which are mass spawners in flowing water.
The objective of the present study was to compare the effectiveness of quantitative eDNA analysis to traditional ichthyoplankton sampling for the detection of grass carp spawning events. Our study area was a reservoir system fed by small flashy tributaries that may support grass carp spawning during spring run-off events.
2. Results
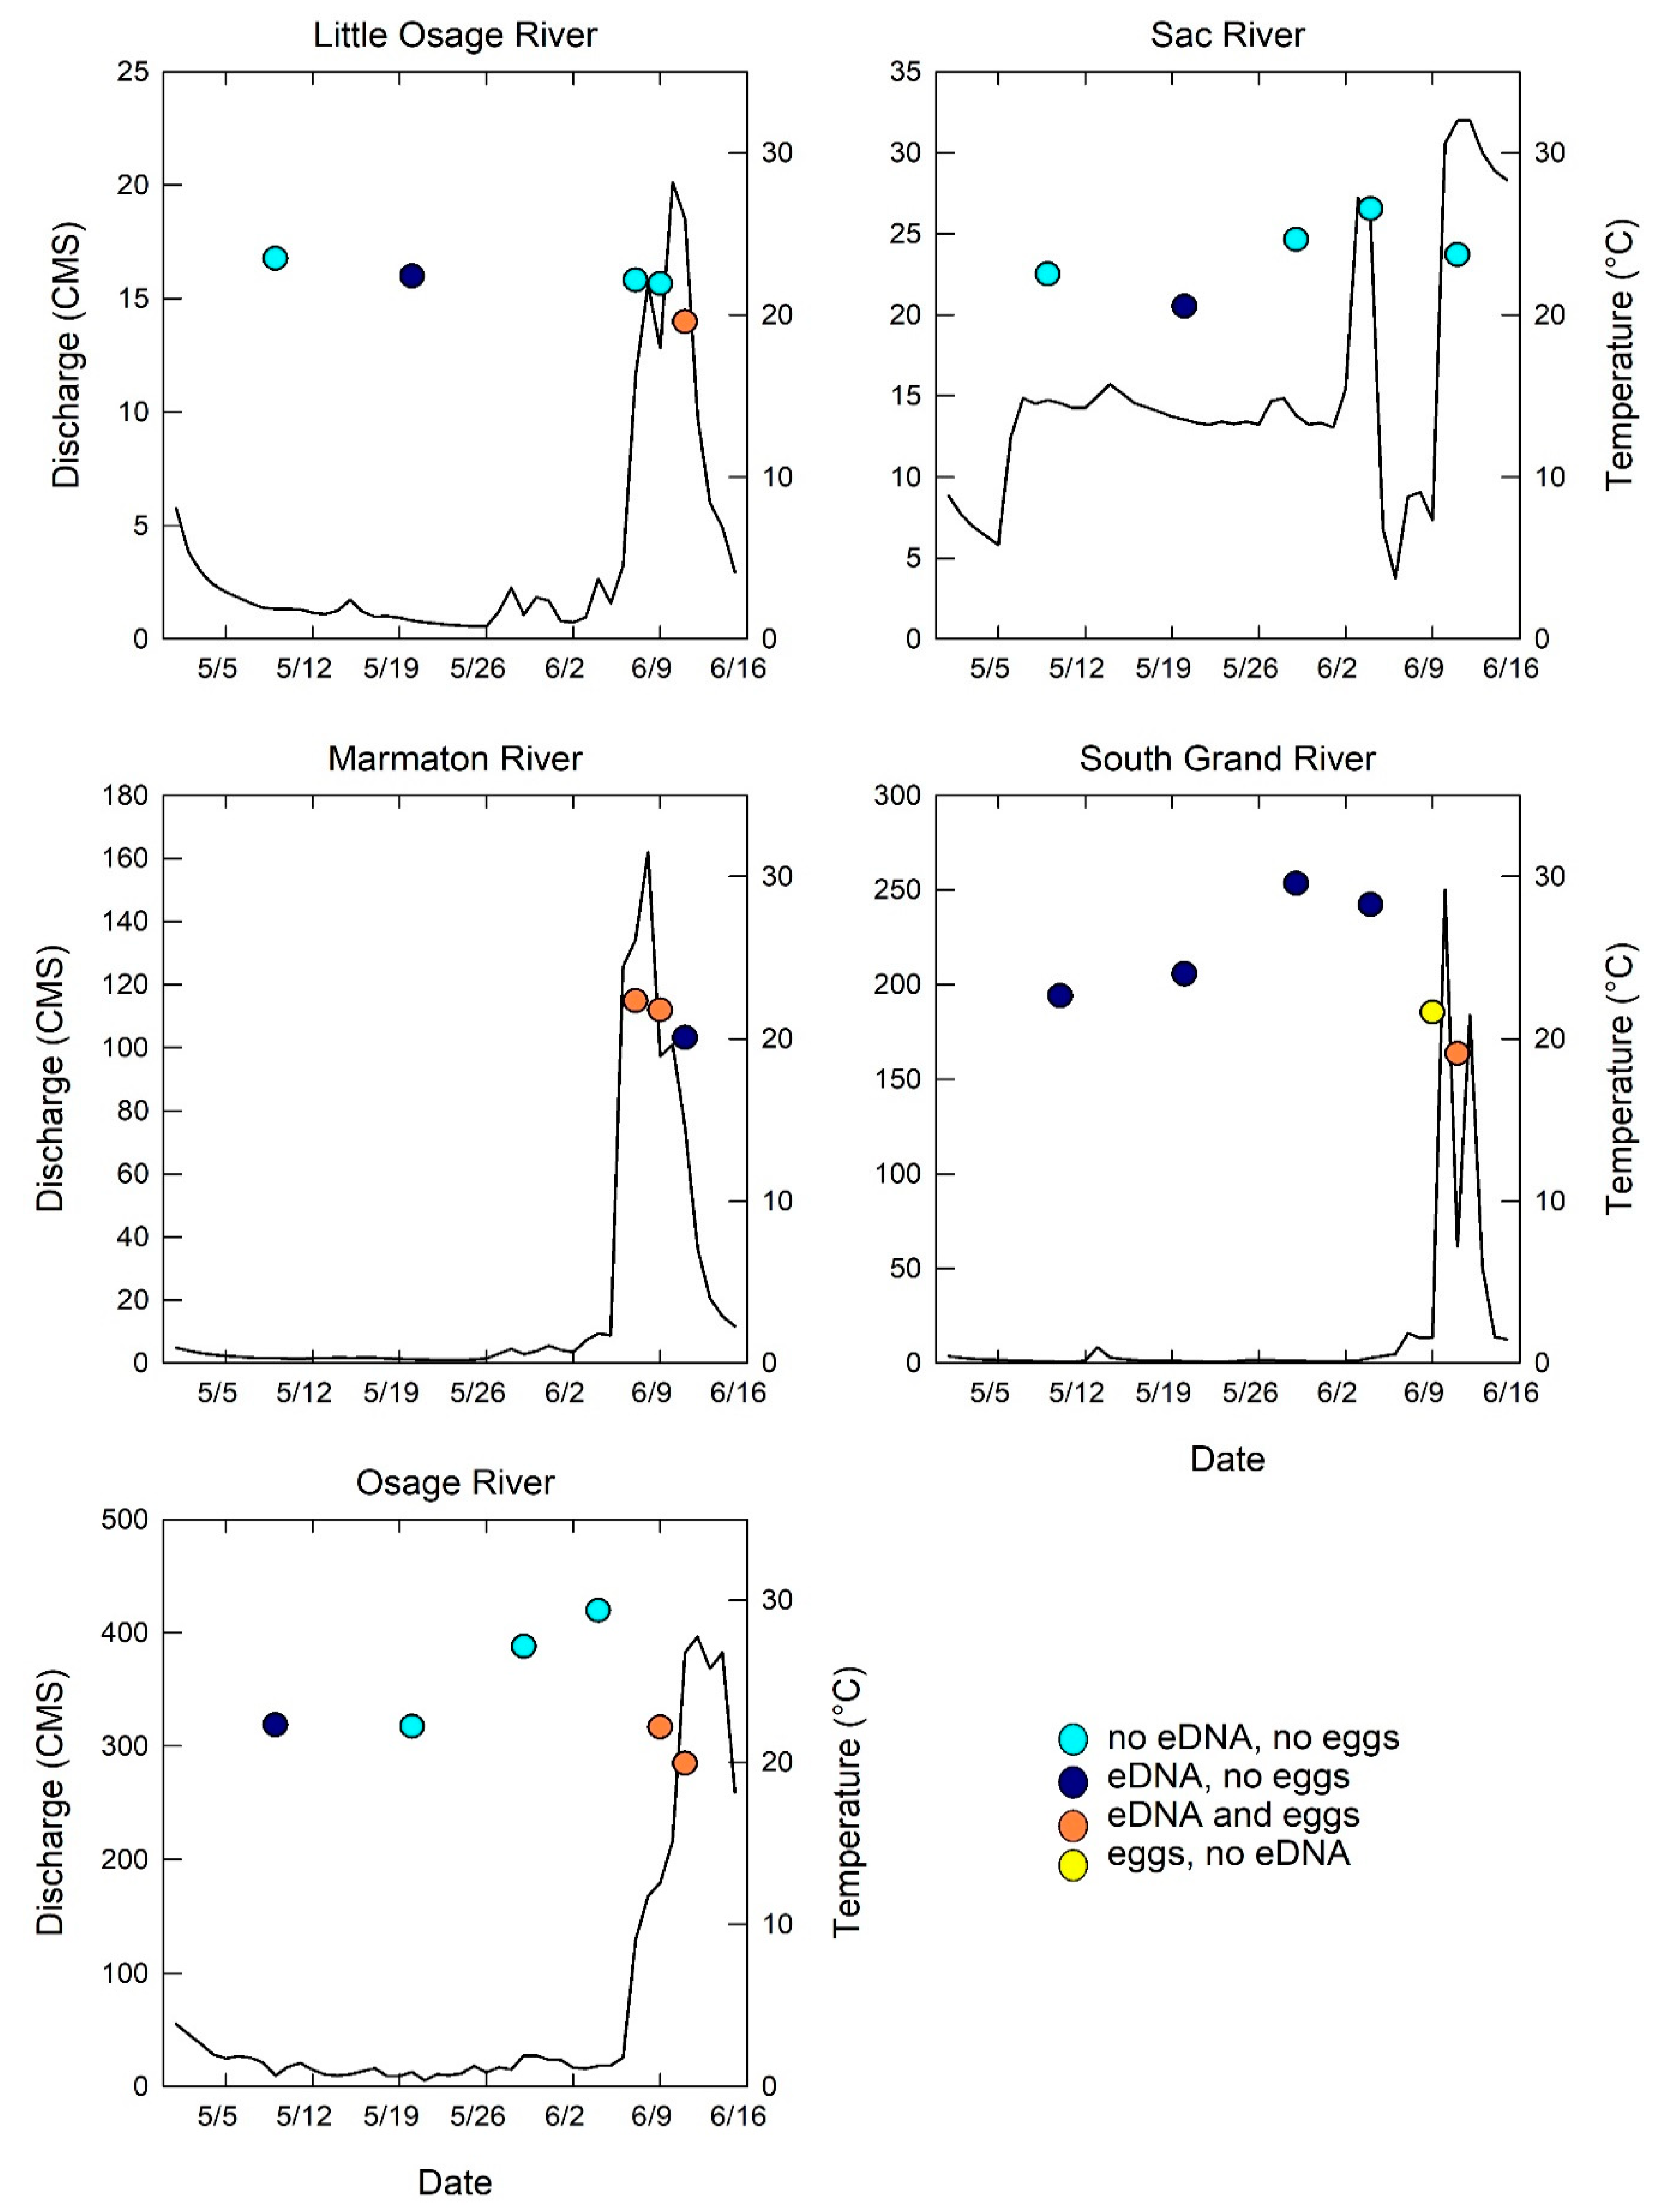
One hundred and eighty-eight grass carp eggs were collected from four of five sampled Truman Reservoir rivers (Figure 1, Table 1, Table S1) over a 5 day period (7 June to 11 June 2014) which corresponded to elevated and peak discharge events (Figure 2). Samples visually identified as containing grass carp eggs were verified to be grass carp by quantitative PCR analysis conducted on paired samples preserved in ethanol; a subset was further confirmed by DNA sequencing.
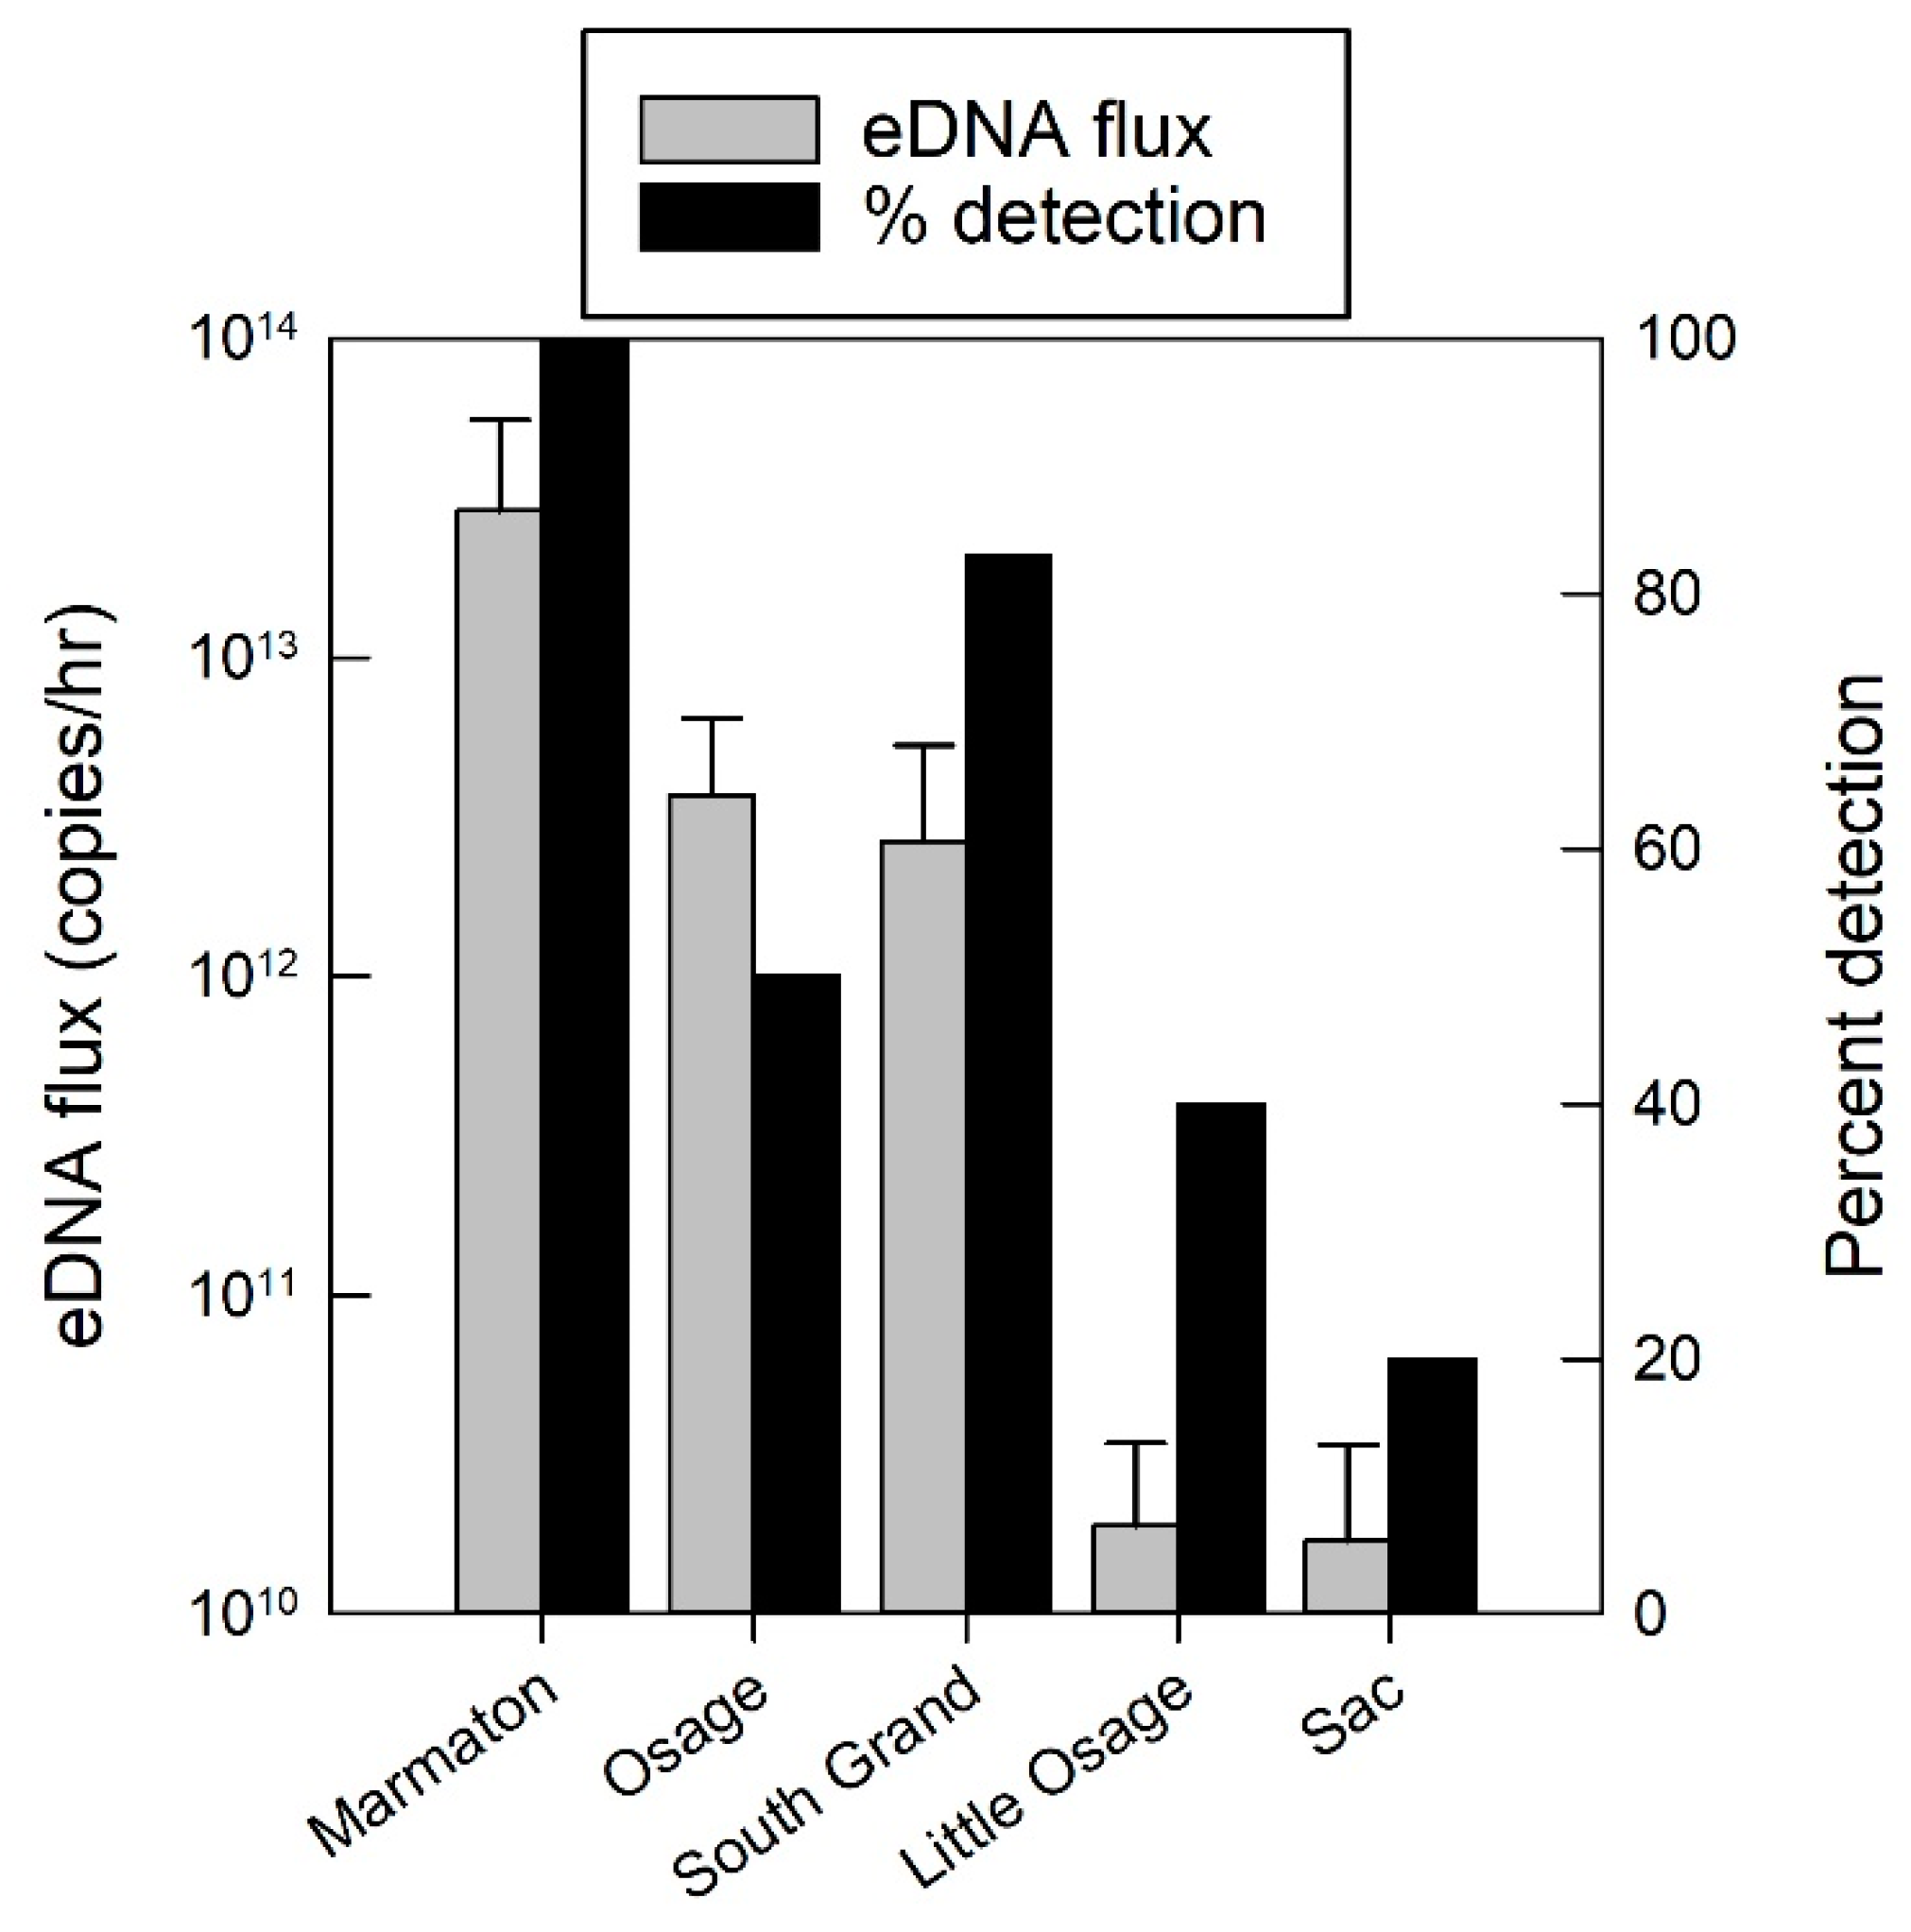
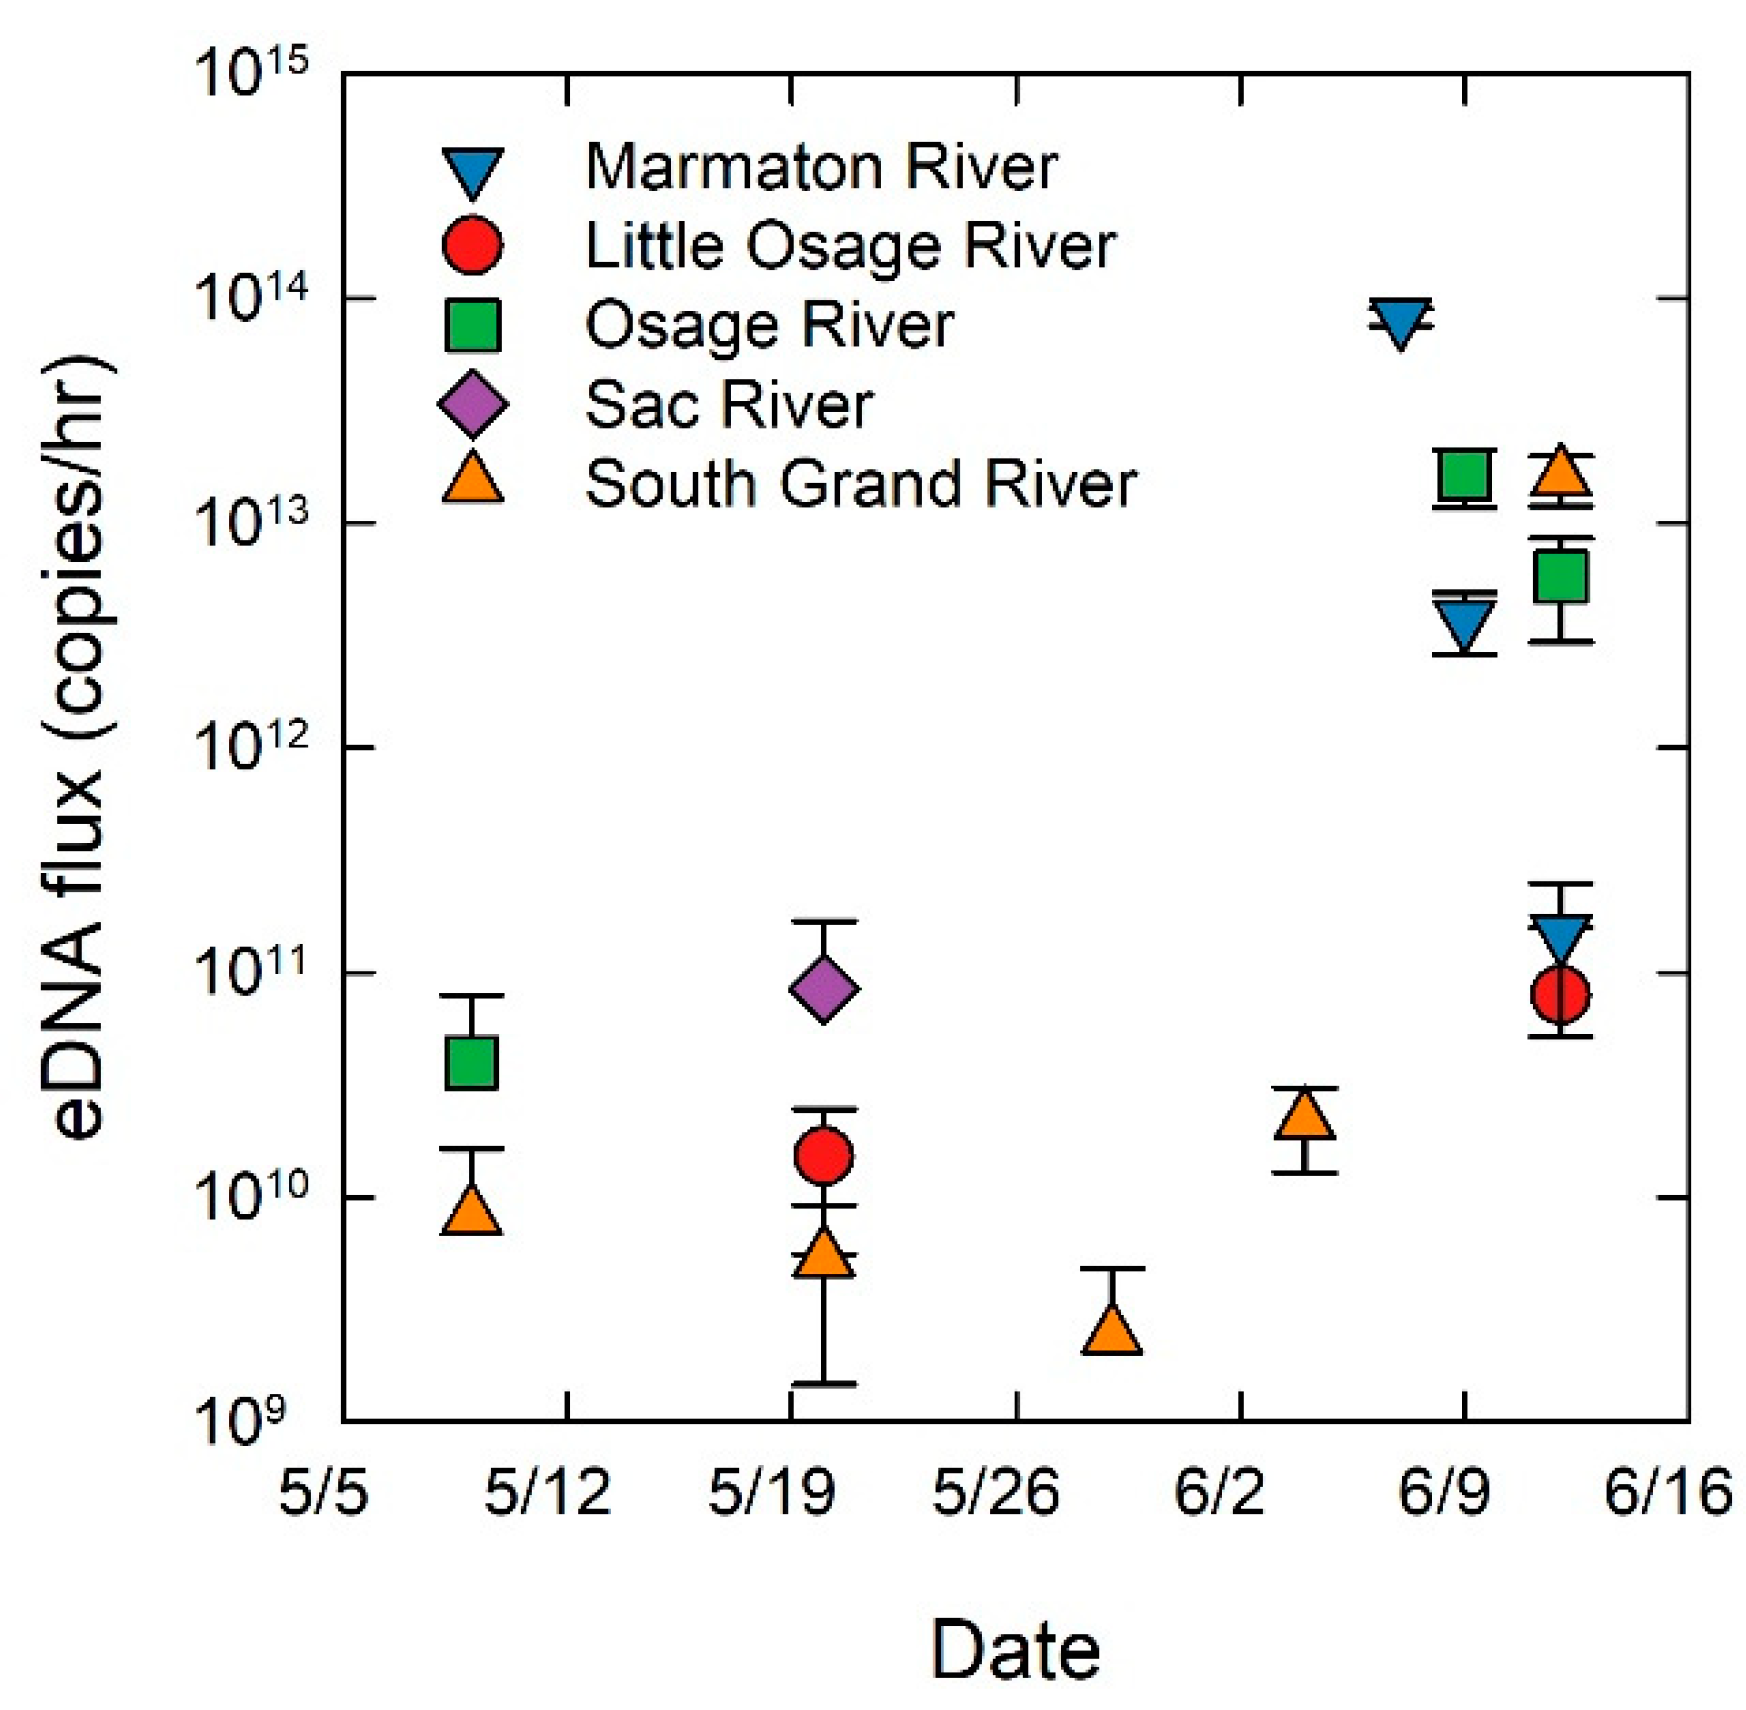
Grass carp eDNA was detected in water samples for 56% of the sampling occasions and was detected in all five sampled rivers (Figure 3). The flux of grass carp eDNA (copies/h) varied across rivers with the Marmaton, Osage, and South Grand Rivers having the highest grass carp eDNA flux values (Figure 4) and also had the most eggs collected over the duration of the study. The limit of quantification (LOQ) for the eDNA assay was 15.6 copies/reaction, and the effective LOQ for eDNA flux was 5.61 × 10¹⁰ copies/h per cubic meter per second (CMS) of river discharge [11]. Only three sampling events, the three highest points in Figure 4, had averages above the LOQ, therefore the quantification presented should be interpreted as the best available estimates, with greater than 35% coefficient of variation at each measurement below the LOQ. The highest grass carp eDNA detection rates occurred in the Marmaton and the South Grand rivers (Figure 3). Concentrations of grass carp eDNA were orders of magnitude higher in June than in May, corresponding to the elevated discharge, egg presence and egg flux (Figure 4). Results of the regression analysis between eDNA flux and egg flux showed a significant positive relationship (Figure 5).
3. Discussion
Grass carp eDNA was found at all sampling locations on at least one sampling occasion. The morphological identification of the collected eggs, eDNA analysis, and DNA sequencing confirm successful spawning (in the form of eggs) of grass carp in four of five sampled rivers in Truman Reservoir in June 2014. This finding represents only the second documentation in the peer-reviewed literature of grass carp spawning or reproduction in a North American reservoir ecosystem [12].
Environmental DNA from grass carp was detected in all five rivers throughout the study period, not only when eggs were detected, suggesting that grass carp were present in each river throughout the study time frame. Grass carp eDNA flux (copies/h) was lower when no eggs were present and was higher when velocities and discharge increased sharply and eggs were present. There was a positive relationship between the grass carp eDNA flux and egg flux. During spawning events, large amounts of sperm are released, up to 35 × 109 mL−1 [13]. Spermatozoa contain mitochondria, and thus contain the mitochondrial DNA target sequence for the qPCR assay we used to detect eDNA. The midpiece of a spermatozoon in silver and grass carp is rich in cytoplasmic material, containing spherical mitochondria. This midpiece is further joined with the head, which also contains mitochondria [14]. It follows that spawning events would release large amounts of eDNA into the water. In addition, grass carp spawn aggressively, and additional DNA may be released into the water by the sloughing of mucous, skin, scales, and blood. Increased eDNA in the water could also be indicative of increased biomass of fish resulting from spawning migrations and aggregations. Higher grass carp eDNA fluxes during spawning events suggest that this method could be used to detect spawning events, but the limited number of spawning events that occurred during this study limits interpretation. Other potential causes for the observed increases in eDNA flux could include seasonal changes in eDNA shedding or degradation rates, changes in grass carp ecological or feeding behaviors, or changes in the local abundance of different developmental stages. Furthermore, although the degradation rate of eDNA is an area of substantial research [15,16,17], and laboratory degradation rates of eDNA from the sperm of bigheaded carps (relatives of the grass carp with similar spawning behavior) have been studied [18], the persistence and degradation rate of eDNA resulting from spawning in flowing systems is inadequately understood, increased flow associated with spawning could affect eDNA detection probability, and these factors could complicate interpretation. Nevertheless, these data support further work in this area.
Grass carp egg flux was much lower relative to the combined bighead, silver, and grass carp egg flux reported in previous studies [19,20], but those studies were performed in much larger rivers. Elevated grass carp eDNA flux (copies/h) coincided with sampling events when eggs were present. We presume that the increase in eDNA is from spawning events; if no spawning had occurred, we would have expected a decrease in eDNA because of the dilution due to the increased river discharge. Further research is needed, but eDNA analysis could be used in addition to traditional sampling to detect spawning events, and to provide an additional, more effective, and less expensive tool to use in the detection of grass carp, or other mass spawners in flowing systems such as bighead carp and silver carp, in novel environments or at invasion fronts. In addition, because of the increased amount of eDNA released during spawning events, timing the collections of eDNA to periods when riverine fishes are spawning could increase detection sensitivity. The use of eDNA to detect spawning events using eDNA would require sampling at times when spawning is not occurring to set a baseline eDNA concentration. Some eDNA would always be present in the system if fish are present, but a spawning event would be expected to coincide with increased eDNA concentration above the baseline. Traditional ichthyoplankton sampling of semi-buoyant eggs is complicated by the distribution of eggs in the drift [6]. Eggs distribute more densely in the lower parts of the water column, especially under conditions of low turbulence, but it is difficult and sometimes dangerous to perform ichthyoplankton tows at depth. Thus, traditional ichthyoplankton tows might fail to detect a spawning event, or underestimate the magnitude of an event, if eggs are distributed deeper than the sampling gear. The detection of spawning events through eDNA would be less prone to this problem because the tiny particles targeted, with an apparent peak in size around 10 μm [21], would likely be more evenly distributed in the water column than the eggs. In addition, because of the laborious sample handling requirements of debris-laden ichthyoplankton tows taken during hydrograph peaks when grass carp are most likely to spawn, the use of eDNA technology to detect spawning events could represent substantial cost savings. Environmental DNA technology could benefit from further investigation of the relationship between the abundance of eDNA and spawning activities in laboratory and field experiments, including the influence of seasonal changes in movement, feeding, eDNA shedding rates, and eDNA degradation rates.
4. Materials and Methods
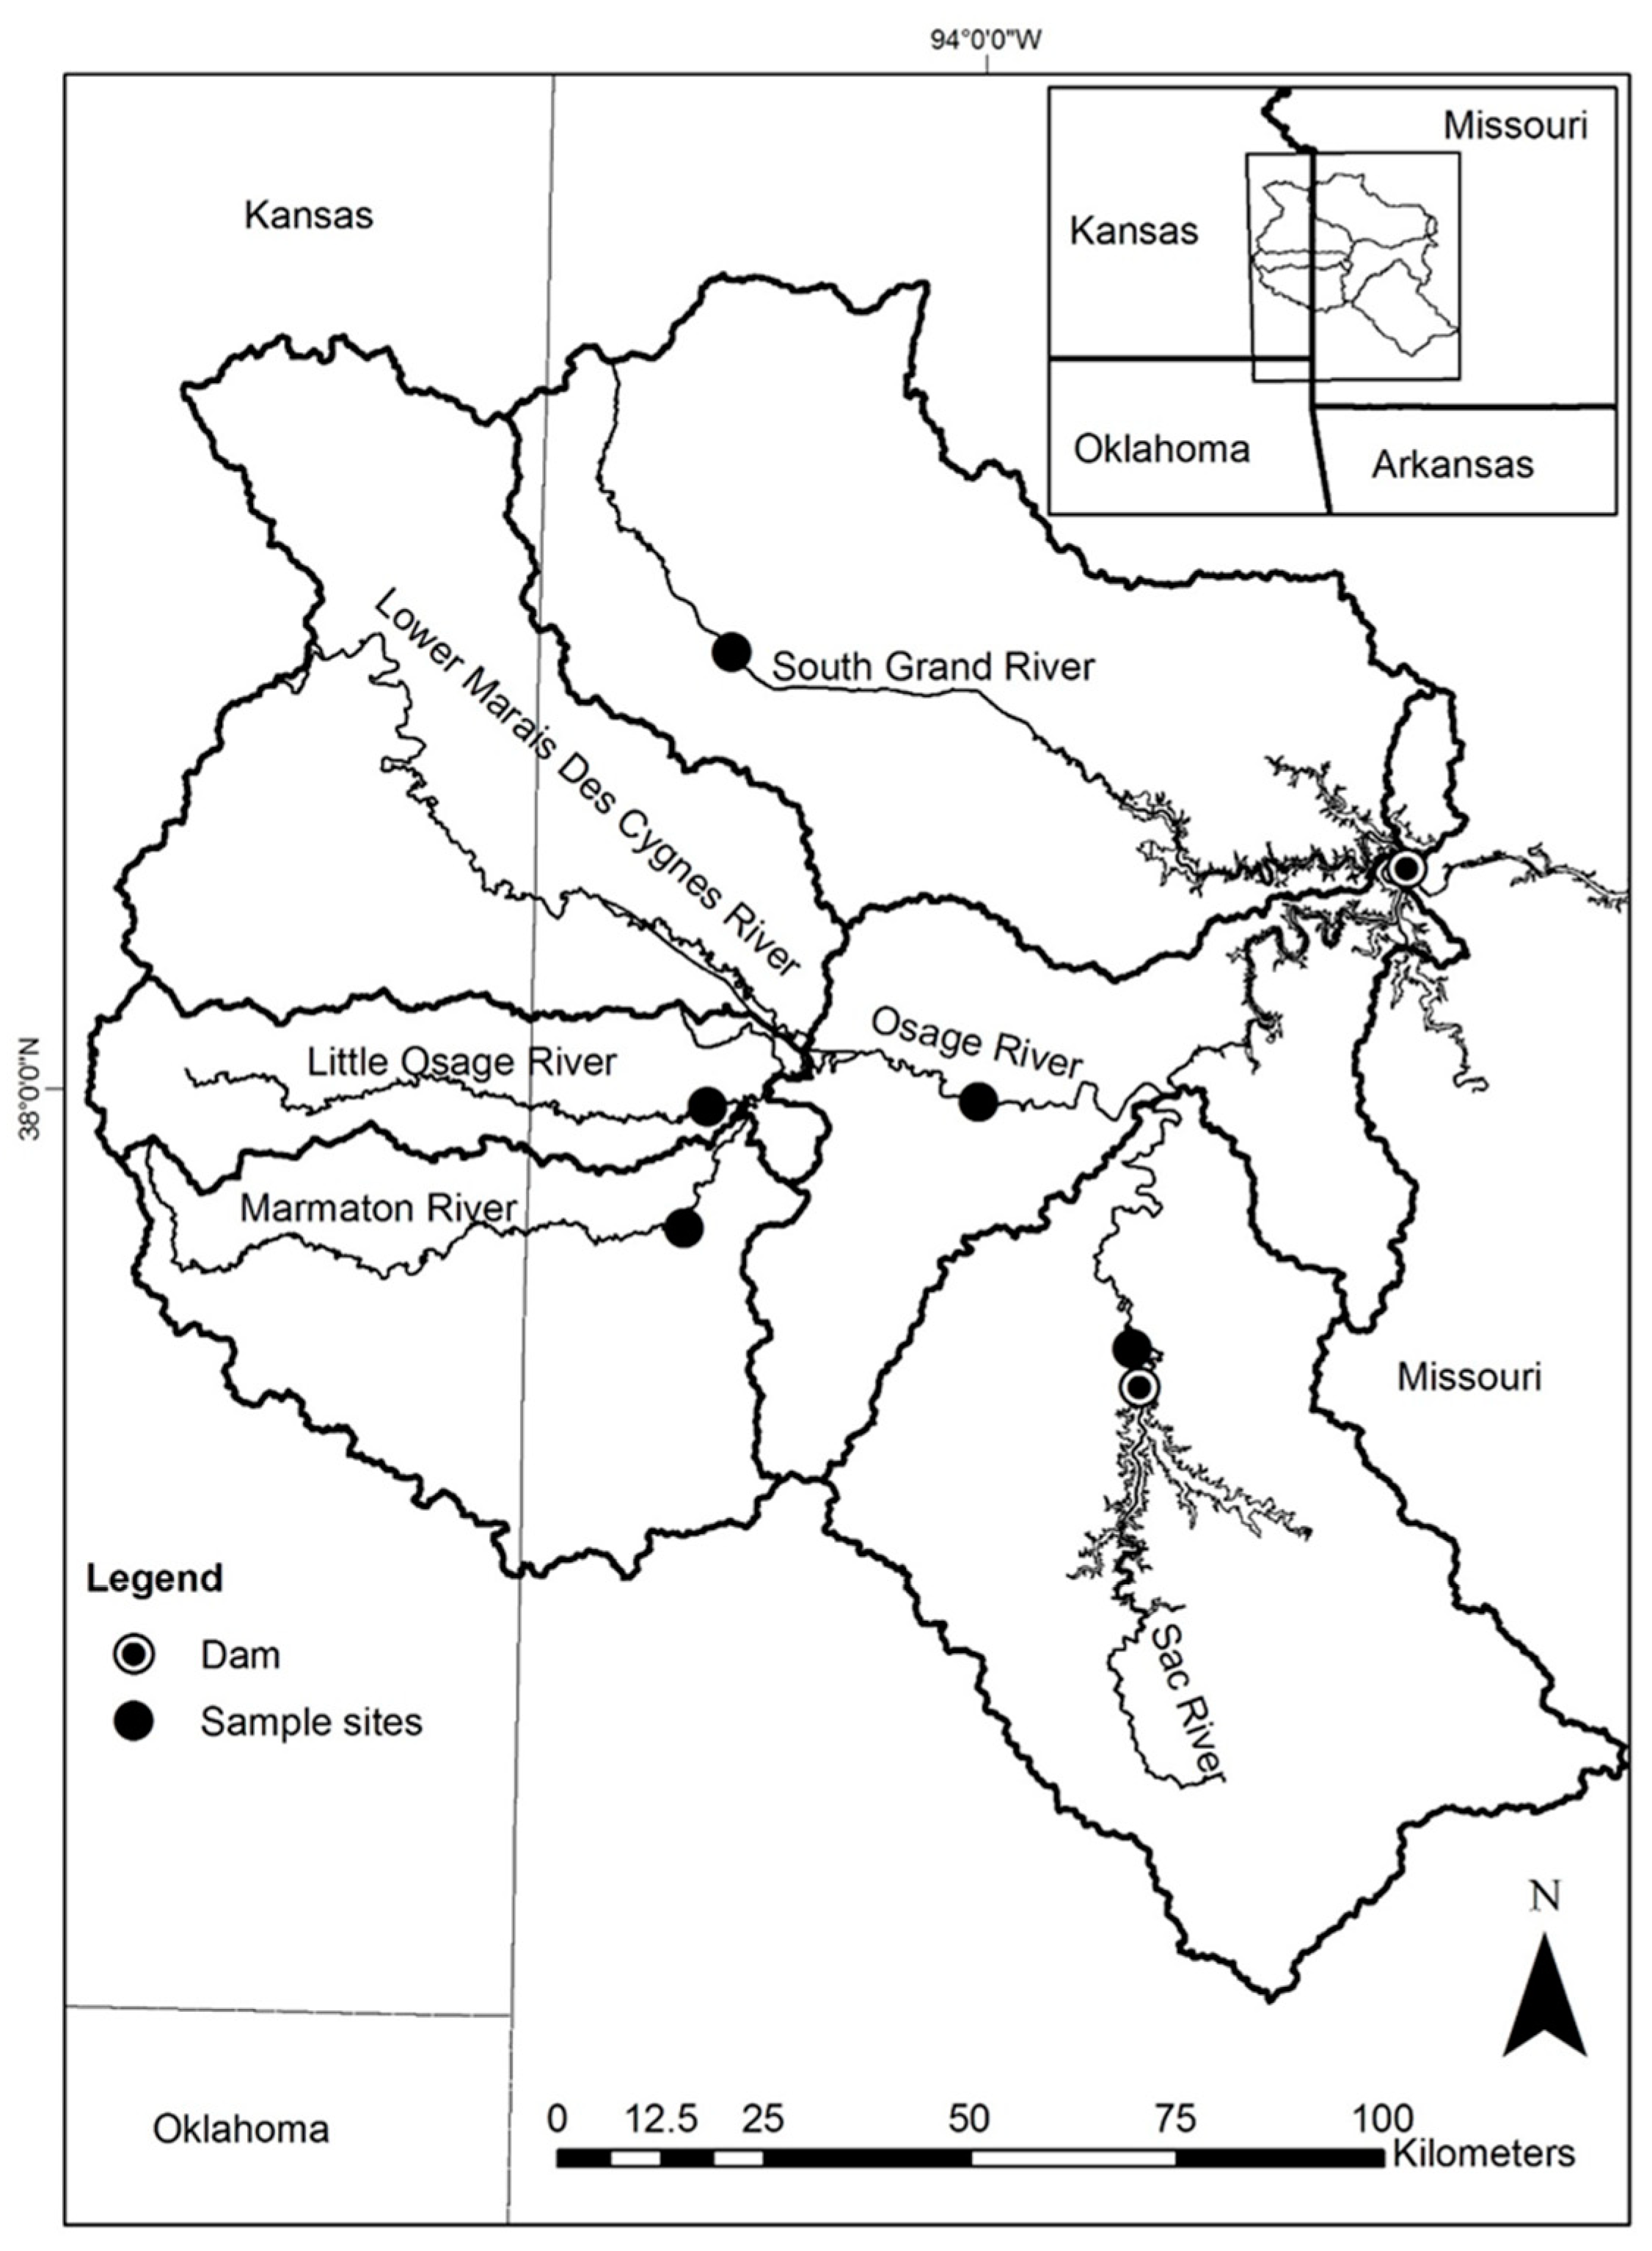
Harry S. Truman Reservoir (22,510 ha and approximately 196 km in length [22]) is a warmwater impoundment of the Osage River upstream of Lake of the Ozarks (another large impoundment) in west central Missouri (Figure 1). There are four main rivers that converge with the Osage River to flow into Truman Reservoir: Marais des Cygnes, Little Osage, Marmaton, and Sac rivers. The other major river, the South Grand River, flows directly into the Reservoir (Figure 1). To survey for grass carp spawning activity, we chose study sites on the Little Osage, Marmaton, Osage, Sac and South Grand Rivers (Figure 1) because they are small and flashy.
Standardized sampling for grass carp eggs and larvae occurred regularly for approximately one month (9 May to 11 June 2014), at one location, within each of five Truman Reservoir tributaries (N = 25 sampling events; Figure 1). This time frame was selected to incorporate a suite of environmental conditions and site characteristics (e.g., water temperature, base flows, change in hydrograph, and size of river) in which grass carp are known to spawn; we also chose conditions not known for grass carp spawning. At each site, ichthyoplankton tows were collected as paired samples with an ichthyoplankton bongo net (750 µm) for approximately ten minutes at a targeted velocity of 1 m/s relative to the water speed. The bongo net was equipped with a General OceanicsTM mechanical flow meter so that an estimate of the total volume of water sampled could be made. One sample was preserved in formalin for later visual identification, staging, enumeration, and measurement (length), and the other sample was preserved in ethanol for DNA analysis to independently identify the species composition of captured eggs, if necessary. Eggs preserved in ethanol were prepared for DNA extraction by removing ethanol with a pipette, leaving the remaining sample in a biological safety cabinet overnight to allow residual ethanol to evaporate, then suspending the egg in 250 µL of extraction buffer TD-S0 (AutoGen Inc., Holliston, MA, USA) and extracting DNA with the AGP245 automated DNA extraction system according to the manufacturer’s instructions (AutoGen Inc., Holliston, MA, USA). The instantaneous flux of eggs was calculated from the number of eggs captured, divided by the volume of water sampled and multiplied by the discharge at the nearest gage, thus obtaining an estimate of the total number of eggs in the drift at a point in time. Egg developmental stages for up to 30 eggs per sampling event were grouped into five categories (i.e., cell division (stage 1–9), blastula (stage 10–12), gastrula (stage 13–15), organogenesis (16–26), and near hatching (stage 27–30); [2,23]). The proportion of eggs within each developmental stage was computed for each sampling occasion.
For eDNA methods, every effort was taken prior to each sampling event to provide a sterile environment and avoid the contamination of water samples from outside sources. This process included the decontamination of all eDNA sampling supplies in 10% bleach for one hour between sampling events. In conjunction with ichthyoplankton sampling, a plastic 1 L water bottle was used to collect river water 2–4 inches below the water surface. A subsample of 50 mL water was extracted from the 1 L bottle with a disposable sterile serological pipette into a 50 mL polypropylene conical bottom tube. This procedure was repeated four times (N = 5 subsamples). Additionally, 1 blank sample was taken from a 1 L bottle of well water brought from the laboratory. Water samples were stored in the dark on ice until returned to the laboratory and stored in a refrigerator for up to 24 h before processing. The water samples were concentrated by centrifugation for 30 min at 5000 RCF at 4 °C, after which water was decanted off. After drying for 10–25 min at room temperature, pellets were suspended in 250 µL of the extraction buffer TD-S0 (AutoGen Inc., Holliston, MA). Total DNA was extracted into 50 µL nuclease-free water and 1 µL DNA sample per reaction was analyzed by qPCR for grass carp DNA quantity (see [24] for more detailed methods). For the qPCR assays, the samples were run using the appropriate species’ primer/probe set [25,26,27]. A qPCR reaction was considered positive for grass carp eDNA detection if there was exponential amplification within 40 cycles, a water sample was considered positive if at least one of three qPCR replicates was positive, and a sampling event was considered positive if at least one of five water subsamples was positive. Units of eDNA concentration are commonly expressed as copies per liter; however, to standardize these measurements among rivers for the detection of spawning events, eDNA concentrations in copies/liter were converted to eDNA flux (copies/h) based on discharge. A linear regression analysis was used to examine the relationships among eDNA flux and egg flux. All analyses were conducted in SAS software (SAS Institute, Cary, NC, USA) with an alpha level of 0.05.
Supplementary Materials
The following are available online at https://0-www-mdpi-com.brum.beds.ac.uk/2410-3888/5/3/27/s1, Table S1: Data summary per sampling event for use of environmental DNA (eDNA) to detect grass carp spawning events in waters of rivers in the Truman Reservoir, Missouri, USA. Blank cells = not measured; CMS = cubic meters per second.
Author Contributions
Conceptualization, C.-A.H., M.F.B., D.C.C., and C.A.R.; methodology, C.-A.H., A.G., C.A.R. and N.T.; formal analysis, C.-A.H.; data curation, A.G.; writing—original draft preparation, C.-A.H.; writing—review and editing, C.A.R. and D.C.C. All authors have read and agreed to the published version of the manuscript.
Funding
This research was funded by the USGS Ecosystems Mission Area, Invasive Species Program.
Acknowledgments
We would like to thank all those who helped to make this project possible. Specifically, we would like to recognize C. Byrd, J. Deters, B. Howell, T. Kobermann and A. Mueller for assistance in collecting field data, the Missouri Department of Conservation for providing assistance and knowledge of the Truman Reservoir and the development of this project, and K. Anderson for creating the study area map. Use of trade, product, or firm names does not imply endorsement by the U.S. Government.
Conflicts of Interest
The authors declare no conflict of interest. The funders had no role in the design of the study; in the collection, analyses, or interpretation of data; in the writing of the manuscript, or in the decision to publish the results.
References
- Kolar, C.S.; Chapman, D.C.; Courtenay, W.R., Jr.; Housel, C.M.; Williams, J.D.; Jennings, D.P. Bigheaded Carps: A Biological Synopsis and Environmental Risk Assessment; American Fisheries Society: Bethesda, MD, USA, 2007; p. 204. [Google Scholar]
- George, A.E.; Chapman, D.C. Embryonic and larval development and early behavior in grass carp, Ctenopharyngodon idella: Implications for recruitment in rivers. PLoS ONE 2015, 10, e0119023. [Google Scholar] [CrossRef] [PubMed] [Green Version]
- George, A.E.; Chapman, D.C. Aspects of embryonic and larval development in bighead carp Hypophthalmichthys nobilis and silver carp Hypophthalmichthys molitrix. PLoS ONE 2013, 8, e73829. [Google Scholar] [CrossRef] [Green Version]
- Murphy, E.A.; Jackson, P.R. Hydraulic and Water-Quality Data Collection for the Investigation of Great Lakes Tributaries for Asian Carp Spawning and Egg-Transport Suitability; Report. 2013-5106; U.S. Geological Survey: Reston, VA, USA, 2013; p. 40.
- Garcia, T.; Murphy, E.A.; Jackson, P.R.; Garcia, M.H. Application of the FluEgg model to predict transport of Asian carp eggs in the Saint Joseph River (Great Lakes tributary). J. Great Lakes Res. 2015, 41, 374–386. [Google Scholar] [CrossRef] [Green Version]
- George, A.E.; Garcia, T.; Chapman, D.C. Comparison of size, terminal fall velocity, and density of Bighead Carp, Silver Carp, and Grass Carp eggs for use in drift modeling. Trans. Am. Fish. Soc. 2017, 146, 834–843. [Google Scholar] [CrossRef]
- Ficetola, G.F.; Miaud, C.; Pompanon, F.; Taberlet, P. Species detection using environmental DNA from water samples. Biol. Lett. 2008, 4, 423–425. [Google Scholar] [CrossRef] [PubMed] [Green Version]
- Cudmore, B.; Mandrak, N.E.; Dettmers, J.M.; Chapman, D.C.; Conover, G.; Kolar, C.S. Binational Risk Assessment of Grass Carp in the Great Lakes; Research Document 2016/118; Fisheries and Oceans Canada; Canadian Science Advisory Secretariat: Ottawa, ON, Canada, 2017. [Google Scholar]
- Yi, B.; Yu, Z.; Liang, Z.; Sujuan, S.; Xu, Y.; Chen, J.; He, M.; Liu, Y.; Hu, Y.; Deng, Z.; et al. The distribution, natural conditions, and breeding production of the spawning ground of four famous freshwater fishes on the main stream of the Yangtze River. In Gezhouba Water Control Project and Four Famous Fishes in the Yangtze River; Yi, B., Yi, Z., Liang, Z., Eds.; Hubei Science and Technology Press: Wuhan, China, 1988. [Google Scholar]
- Larson, J.H.; Knights, B.C.; McCalla, S.G.; Monroe, E.; Tuttle-Lau, M.; Chapman, D.C.; George, A.E.; Vallazza, J.M.; Amberg, J. Evidence of Asian Carp spawning upstream of a key choke point in the Mississippi River. N. Am. J. Fish. Manag. 2017, 37, 903–919. [Google Scholar] [CrossRef]
- Klymus, K.E.; Merkes, C.M.; Allison, M.J.; Goldberg, C.S.; Helbing, C.C.; Hunter, M.E.; Jackson, C.A.; Lance, R.F.; Mangan, A.M.; Monroe, E.M.; et al. Reporting the limits of detection and quantification for environmental DNA assays. Environ. DNA 2019. [Google Scholar] [CrossRef] [Green Version]
- Hargrave, C.W.; Gido, K.B. Evidence of reproduction by exotic grass carp in the Red and Washita rivers, Oklahoma. Southwest. Nat. 2004, 49, 89–93. [Google Scholar] [CrossRef]
- Bozkurt, Y.; Öğretmen, F. Sperm quality, egg size, fecundity and their relationships with fertilization rate of grass carp (Ctenopharyngodon idella). Iran. J. Fish. Sci. 2012, 11, 755–764. [Google Scholar]
- Verma, D.K.; Routray, P.; Dash, C.; Dasgupta, S.; Jena, J.K. Physical and biochemical characteristics of semen and ultrastructure of spermatozoa in six carp species. Turk. J. Fish. Aquat. Sci. 2009, 9, 67–76. [Google Scholar]
- Barnes, M.A.; Turner, C.R.; Jerde, C.L.; Renshaw, M.A.; Chadderton, W.L.; Lodge, D.M. Environmental conditions influence eDNA persistence in aquatic systems. Environ. Sci. Technol. 2014, 48, 1819–1827. [Google Scholar] [CrossRef] [PubMed]
- Strickler, K.M.; Fremier, A.K.; Goldberg, C.S. Quantifying effects of UV-B, temperature, and pH on eDNA degradation in aquatic microcosms. Biol. Conserv. 2015, 183, 85–92. [Google Scholar] [CrossRef]
- Eichmiller, J.J.; Best, S.E.; Sorensen, P.W. Effects of temperature and trophic state on degradation of environmental DNA in lake water. Environ. Sci. Technol. 2016, 50, 1859–1867. [Google Scholar] [CrossRef] [PubMed]
- Lance, R.F.; Klymus, K.E.; Richter, C.A.; Guan, X.; Farrington, H.L.; Carr, M.R.; Thompson, N.; Chapman, D.C.; Baerwaldt, K.L. Experimental observations on the decay of environmental DNA from bighead and silver carps. Manag. Biol. Invasions 2017, 8, 343–359. [Google Scholar] [CrossRef] [Green Version]
- Deters, J.E.; Chapman, D.C.; McElroy, B. Location and timing of Asian carp spawning in the Lower Missouri River. Environ. Biol. Fishes 2013, 96, 617–629. [Google Scholar] [CrossRef]
- Coulter, A.A.; Keller, D.; Bailey, E.J.; Goforth, R.R. Predictors of bigheaded carp drifting egg density and spawning activity in an invaded, free-flowing river. J. Great Lakes Res. 2016, 42, 83–89. [Google Scholar] [CrossRef]
- Turner, C.R.; Barnes, M.A.; Xu, C.C.Y.; Jones, S.E.; Jerde, C.L.; Lodge, D.M. Particle size distribution and optimal capture of aqueous macrobial eDNA. Methods Ecol. Evol. 2014, 5, 676–684. [Google Scholar] [CrossRef] [Green Version]
- Michaletz, P.H.; Siepker, M.J. Trends and synchrony in Black Bass and Crappie recruitment in Missouri reservoirs. Trans. Am. Fish. Soc. 2013, 142, 105–118. [Google Scholar] [CrossRef]
- Yi, B.; Liang, Z.; Yu, Z.; Lin, R.; He, M. A study of the early development of grass carp, black carp, silver carp and bighead carp of the Yangtze River. In Early Development of Four Cyprinids Native to the Yangtze River; Chapman, D.C., Ed.; Data Series 239; U.S. Geological Survey: Reston, VA, USA, 2006; pp. 15–51. [Google Scholar]
- Klymus, K.E.; Richter, C.A.; Chapman, D.C.; Paukert, C. Quantification of eDNA shedding rates from invasive bighead carp Hypophthalmichthys nobilis and silver carp Hypophthalmichthys molitrix. Biol. Conserv. 2015, 183, 77–84. [Google Scholar] [CrossRef]
- Coulter, A.A.; Keller, D.; Amberg, J.J.; Bailey, E.J.; Goforth, R.R. Phenotypic plasticity in the spawning traits of bigheaded carp (Hypophthalmichthys spp.) in novel ecosystems. Freshwat. Biol. 2013, 58, 1029–1037. [Google Scholar] [CrossRef]
- Wilson, C.; Wright, E.; Bronnenhuber, J.; MacDonald, F.; Belore, M.; Locke, B. Tracking ghosts: Combined electrofishing and environmental DNA surveillance efforts for Asian carps in Ontario waters of Lake Erie. Manag. Biol. Invasions 2014, 5, 225–231. [Google Scholar] [CrossRef] [Green Version]
- Farrington, H.L.; Edwards, C.E.; Guan, X.; Carr, M.R.; Baerwaldt, K.; Lance, R.F. Mitochondrial genome sequencing and development of genetic markers for the detection of DNA of invasive bighead and silver carp (Hypophthalmichthys nobilis and H. molitrix) in environmental water samples from the United States. PLoS ONE 2015, 10, e0117803. [Google Scholar] [CrossRef] [PubMed] [Green Version]
Figure 1.
Study area of Truman Reservoir, Missouri, and the major tributary basins (represented by 8-digit hydrologic unit) for the sites sampled during May and June 2014 (map created by K. Anderson, U.S. Geological Survey).
Figure 1.
Study area of Truman Reservoir, Missouri, and the major tributary basins (represented by 8-digit hydrologic unit) for the sites sampled during May and June 2014 (map created by K. Anderson, U.S. Geological Survey).

Figure 2.
Mean daily discharge (lines, cubic meters per second (CMS)) and measured water temperature (circle symbols, °C) at each sampling event for 5 sampled tributaries to the Truman Reservoir in May and June 2014. The circle symbols are color coded to indicate the grass carp environmental DNA (eDNA) and egg detection results for each sampling event: light blue, no eDNA or eggs detected; dark blue, eDNA detected and eggs not detected; orange, both eDNA and eggs detected; yellow, eDNA not detected but eggs detected. Note that the y axis scales for mean daily discharge are not the same.

Figure 3.
Environmental DNA flux (copies/h) averaged over all the sampling events for each tributary and the percent of sampling events that were positive for eDNA detection in the tributaries to the Truman Reservoir, Missouri, during May and June 2014. Error bars represent one standard error.
Figure 3.
Environmental DNA flux (copies/h) averaged over all the sampling events for each tributary and the percent of sampling events that were positive for eDNA detection in the tributaries to the Truman Reservoir, Missouri, during May and June 2014. Error bars represent one standard error.

Figure 4.
Environmental DNA flux (copies/h) averaged over each sampling event by date for each river sampled in the Truman Reservoir, Missouri, during the period from May to June 2014. Note log scale on y axis. Sampling events that did not detect grass carp eDNA are not displayed. Error bars represent one standard error.

Figure 5.
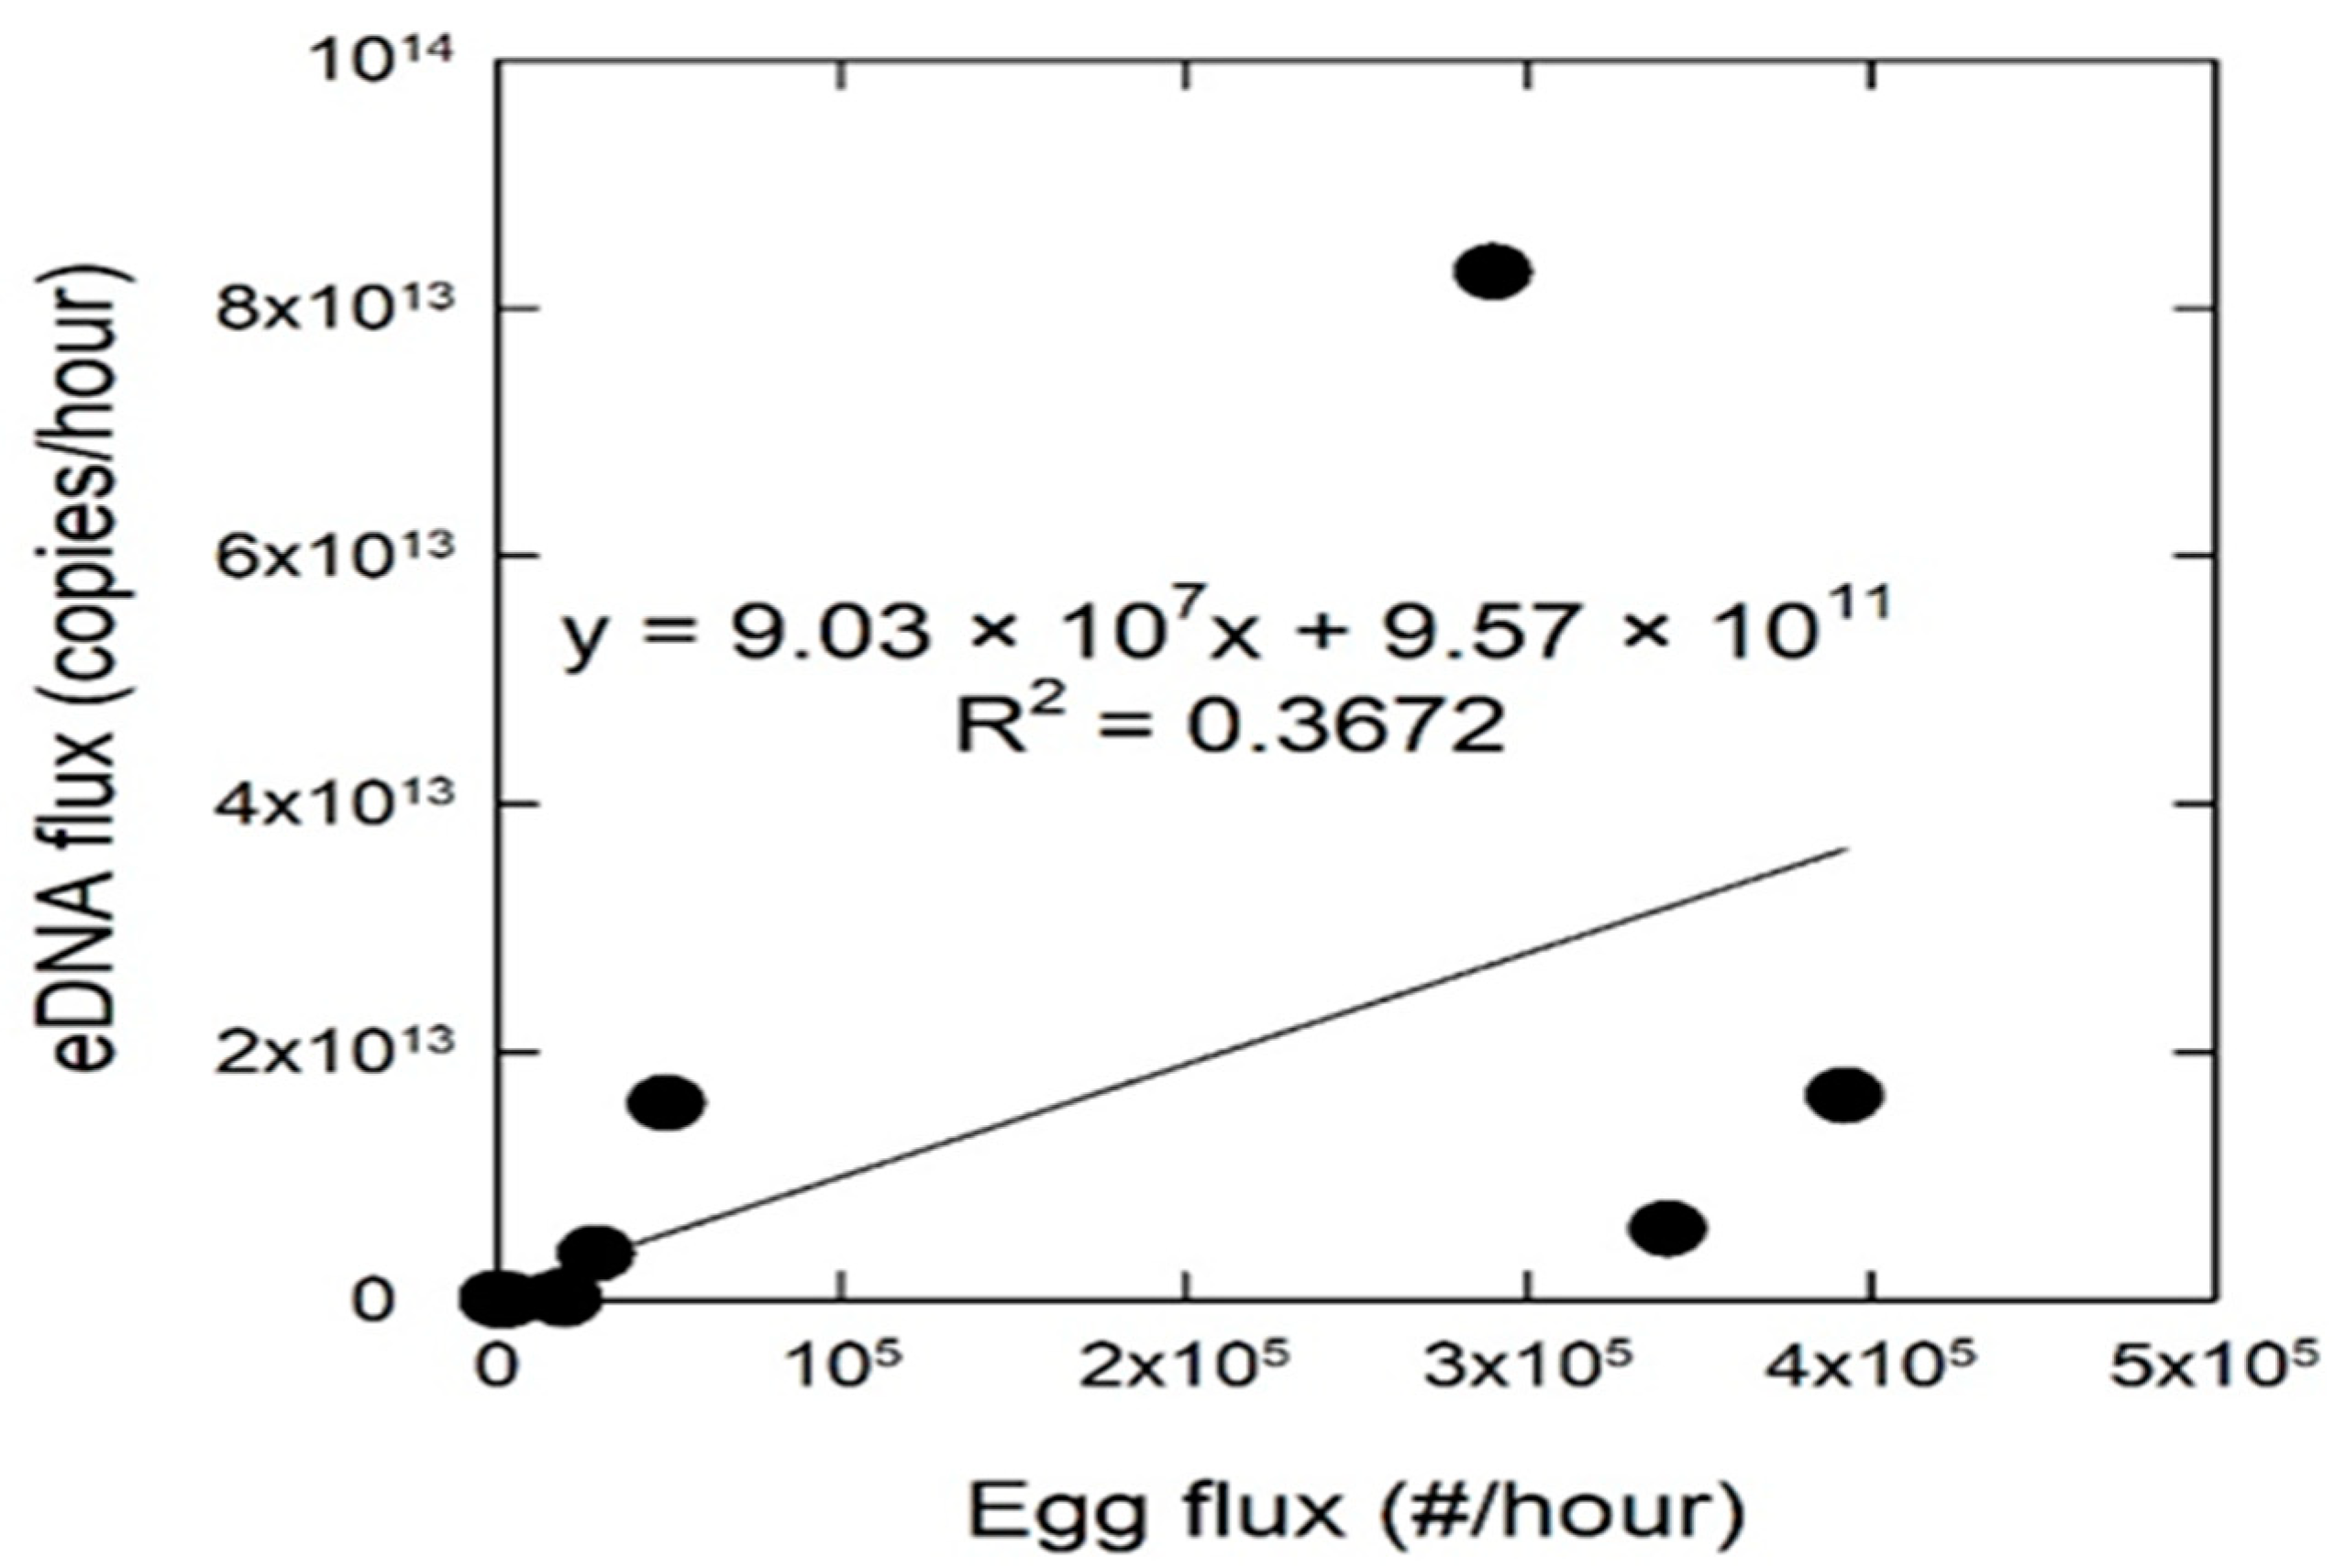
Regression analysis examining the relationship between environmental DNA flux (copies/h) and egg flux (eggs/h) sampled from the Truman Reservoir tributaries, Missouri, during May and June 2014. The regression was significant with an equation of eDNA flux = 9.03 × 10⁷x + 9.57 × 10¹¹.
Figure 5.
Regression analysis examining the relationship between environmental DNA flux (copies/h) and egg flux (eggs/h) sampled from the Truman Reservoir tributaries, Missouri, during May and June 2014. The regression was significant with an equation of eDNA flux = 9.03 × 10⁷x + 9.57 × 10¹¹.


Table 1.
U.S. Geological Survey (USGS) water gage and sample site descriptions from five rivers, tributaries to the Truman Reservoir, sampled in May/June 2014. Basin area refers to the basin area for the corresponding 8-digit hydrologic unit. All USGS water gages are upstream of the sampling site, except the Osage River gage, which was located at the sample site. See Figure 1 for a more detailed map of study area.
| River | USGS Gage Number | Distance (Gage to Site rkm 1) | Basin Area (km2) | Sample Site Latitude | Sample Site Longitude | Distance to Truman Reservoir (rkm) | Upstream Barrier Distance (rkm) |
|---|---|---|---|---|---|---|---|
| Little Osage | 06917060 | 8 | 1504 | 38.00658 | −94.31944 | 107 | |
| Marmaton | 06918060 | 26 | 2956 | 37.99797 | −94.31951 | 106 | |
| Osage | 06918250 | 0 | 3117 | 38.003889 | −93.99472 | 48 | |
| Sac | 0691990 | 26 | 5104 | 37.94902 | −93.76917 | 31 | Stockton Dam (40) |
| South Grand | 06921760 | 32 | 5302 | 38.45243 | −94.00636 | 28 |
1 rkm refers to river kilometers.
© 2020 by the authors. Licensee MDPI, Basel, Switzerland. This article is an open access article distributed under the terms and conditions of the Creative Commons Attribution (CC BY) license (http://creativecommons.org/licenses/by/4.0/).
Share and Cite
MDPI and ACS Style
Hayer, C.-A.; Bayless, M.F.; George, A.; Thompson, N.; Richter, C.A.; Chapman, D.C. Use of Environmental DNA to Detect Grass Carp Spawning Events. Fishes 2020, 5, 27. https://0-doi-org.brum.beds.ac.uk/10.3390/fishes5030027
AMA Style
Hayer C-A, Bayless MF, George A, Thompson N, Richter CA, Chapman DC. Use of Environmental DNA to Detect Grass Carp Spawning Events. Fishes. 2020; 5(3):27. https://0-doi-org.brum.beds.ac.uk/10.3390/fishes5030027
Chicago/Turabian StyleHayer, Cari-Ann, Michael F. Bayless, Amy George, Nathan Thompson, Catherine A. Richter, and Duane C. Chapman. 2020. "Use of Environmental DNA to Detect Grass Carp Spawning Events" Fishes 5, no. 3: 27. https://0-doi-org.brum.beds.ac.uk/10.3390/fishes5030027