Article

An Ecological and Economical Assessment of Integrated Amaranth (Amaranthus hybridus) and Nile Tilapia (Oreochromis niloticus) Farming in Dar es Salaam, Tanzania

by
Deogratias Pius Mulokozi
1,2,*,
Håkan Berg
1 and
Torbjörn Lundh
3
1
Department of Physical Geography, Stockholm University, SE 106 91 Stockholm, Sweden
2
Tanzania Fisheries Research Institute, Kigoma Centre, P.O. Box 90, Kigoma, Tanzania
3
Department of Animal Nutrition and Management, Swedish University of Agricultural Sciences, P.O. Box 7024, 750 07 Uppsala, Sweden
*
Author to whom correspondence should be addressed.
Submission received: 1 July 2020 / Revised: 20 August 2020 / Accepted: 22 August 2020 / Published: 18 September 2020

Abstract

:
Organic wastes can be recycled in an ecologically sound way in fishponds by applying integrated agriculture and aquaculture systems (IAA). This kind of waste recycling can help to protect the environment from pollution and improve fishpond yields. Additionally, IAA provides an opportunity for diversification of the output from two or more existing subsystems leading to higher overall farm economic returns. This study explored the potential application of amaranth wastes (AW) as a dietary ingredient for tilapia in a tilapia-amaranths integrated system (ITA). An experimental diet (AD) contained 10% (based on the control diet, CD) inclusion of AW collected from a nearby vegetable market. The experiments included triplicate treatments with; (i) fish fed on AD, where the pond water was used for irrigating the amaranth plants (IAA-fish), and (ii) fish fed on CD, where no pond water was used for irrigating the amaranth plants (non-IAA fish). 90 days after fish stocking, eighteen 4 m2 amaranth plots were prepared and treated with (i) tap water without fertilization (control amaranths), (ii) water from IAA-fish pond and organically fertilized (IAA amaranths), and (iii) tap water and inorganically fertilized (non-IAA amaranths). The use of AW improved the fish feed conversion ratio. The overall net income from ITA was 3.2, 2.3, 2.6, and 1.8 higher than from non-IAA amaranths, IAA-amaranths, non-IAA fish, and IAA fish sub-systems respectively.

1. Introduction

The urgent need for increasing protein production per unit area of farmed land is a priority worldwide [1]. Capture fisheries have been one of the major animal protein sources for many people in East Africa [2]. However, with the current declining wild fish yields and growing population, fish protein is increasingly becoming scarcer. Recent studies suggest that almost half of the African fish stocks are overexploited or fully exploited [3]. Hence, despite the dominance of capture fisheries in total fish production in the continent, the promise of aquaculture as the new frontier in fish production holds strong. About one-sixth of the total production of food fish in Africa in 2016 came from aquaculture [4]. The fish supply deficit in most African countries presents significant prospects for aquaculture development [5].
However, in order for aquaculture to fill this gap, a number of challenges, varying from one place to another, need to be addressed [4,6,7]. In Sub Saharan Africa (SSA) for example, insufficient availability of fish feeds, and water scarcity during the dry season have been outlined as major constraints [8,9,10]. The situation prompts initiatives to develop farming systems that optimize efficient use of resources and integrated agriculture and aquaculture (IAA) provides a good example of such systems [10,11,12,13]. IAA involves two or more subsystems of which at least one is aquaculture [14]. These systems have proved to be very productive food producing systems, providing a variety of goods such as fruits, vegetables, fish, and meat [15,16]. They have thus a potential to improve household nutrition and income, due to their ability to promote an efficient and economic use of available resources [17,18].
Vegetable farming in urban and peri-urban areas has become popular in many African Countries [19]. In Tanzania, amaranths (Amaranthus spp.) is one of the most important vegetable crops [20]. The genus Amaranthus, with more than 50 species, has a vital role to play in human and animal nutrition due its high nutritive value and resistance to drought, heat, and diseases [21,22]. The increased popularity of culturing amaranth is due to its high amount of protein (14–48%), vitamins, carbohydrate, and fat [21,23]. Moreover, amaranth species are reported to have the ability to prevent diseases like cancer, malaria, and diabetes, due to a high content of various metabolites with antioxidant, antimalarial and antiviral properties [24,25,26]. Amaranthus species are also reported to be rich in micronutrients like Ca, Fe, Mg, P, K, and Na [27].
Traditionally in Dar es Salaam, amaranth cultivation is normally done in low land areas like Yombo, Dovya, Tegeta, Mbweni, Msimabzi, Kitunda, and Boko-bunju. During the rainy season, these areas become flooded with water and silt, making it impossible to cultivate vegetables, which increase the demand of amaranth in the market. However, during the dry season, just after the rainy period, markets are oversupplied with amaranth vegetables. A high quantity of amaranth waste (mainly unsold plants) is collected and sent to city dumping places during this period. Thus, turning these wastes into fish and animal feeds would be a better use of this periodic surplus of amaranths.
Feeds account for more than 50% of the production costs in semi intensive fish farming [28]. The commonly used feed ingredients (fishmeal, soybean, and cereal bran) are increasingly becoming scarcer due to a decrease in production and an increase in competition from other consumers [29]. The use of vegetable wastes would therefore be a sustainable complement to improve the availability of fish feeds [30,31]. Despite the common use of vegetable wastes (insect damaged, unmarketable, or overgrown leaves) as fishpond inputs among small scale farmers in Tanzania [32,33], there is no clear information on the use of these by-products for improvements of the farm productivity and the farmer’s income. In the light of the above background, the present study aimed at using amaranth waste (AW) as an ingredient in feed for tilapia, and use pond water for irrigating amaranth plots in a tilapia-amaranth integration, as a way to improve the overall farm productivity and the economic return. The use of AW was also regarded as a way to recycle wastes, thus providing additional ecological benefits.

2. Results

2.1. Ingredients and Feeds

The Shrimp meal had the highest crude protein content followed by soybeans, amaranth and rice bran. Rice bran had higher levels of fibre and ash compared to the other ingredients (Table 1). Control and experimental diets had equal amount of protein (about 270 g/Kg DM) (Table 2). Vitamins, anti-nutritional factors, and mineral composition of AW used in the experimental diet are shown in Table 3.

2.2. Fish Growth Performance, Survival, Feed Utilization and Yield

Fish growth was not affected by the inclusion of AW in the fish diet (Table 4). There were no significant differences (p > 0.05) in terms of final weight, daily weight gain, specific growth rate, yield, condition factor and survival rate. Overall, there were no statistically significant differences in the growth between fish given the control and amaranth diets, although there appeared to be slight growth variation in the first 90 days (Figure 1). The feed conversion ratio was significantly lower in fish fed AD than in fish fed CD (p < 0.05). A similar trend was observed in terms of protein efficiency ratio (PER), where a PER value of 2.07 exhibited by the fish fed AD was 13% higher than 1.84 for the fish fed CD (p < 0.05).

2.3. Effect of Integrating Amaranth with Tilapia Farming

IAA amaranth plots had about 46% higher yield than non-IAA amaranth plots for the first harvest (p < 0.05), and comparable (p > 0.05) yields for the second harvest and for the overall farming cycle (Figure 2). The control group had significantly lower yields than the IAA and non-IAA groups. A similar trend was observed in terms of growth performance for the final harvest (Figure 3).

2.4. Economic Analysis of the Farming Systems

The economic performances of fish and amaranth grown separately and integrated, are presented in Figure 4, Figure 5 and Figure 6. IAA fish had significantly (p < 0.05) lower feed cost and total cost, and higher benefit cost ratio (BCR) with 1.28 times higher total net income than non-IAA fish. IAA amaranth had 1.12 and 1.34 times higher revenue and net profit, respectively, than the non-IAA amaranths with comparable BCR. The integration of fish and amaranths resulted in 4.4, 3.9, 1.27 and 1.30 times higher (p < 0.05) total revenue than non-IAA amaranths, IAA amaranths, non-IAA fish and IAA fish, respectively. Similarly, the net return for fish-amaranth integration was 3.2, 2.3, 2.6, and 1.8 times higher than (p < 0.05) non-IAA amaranths, IAA amaranths, non-IAA, and IAA fish, respectively.

2.5. Effects of IAA Farming on Water and Soil

Dissolved oxygen, water temperature and pH in the fishponds did not vary significantly between IAA and non-IAA fishponds (Table 5). The two IAA and non-IAA treatments had similar concentration of nitrogen and phosphate in the water but had significantly (p < 0.05) higher nutrient levels in the soil than the areas irrigated with tap water (control treatment) (Table 6). No NO2 or NH4 were detected in the tap water (Table 6). The IAA and non-IAA fishpond water had about 3.5, 2.4, and 7.8 times higher TN, PO4, and TP concentrations, respectively, than the tap water (Table 6). Similarly, in the soil samples, IAA and non-IAA amaranth plots had statistically higher nutrient concentrations at the end of the experiment compared to concentrations at the beginning of the experiment and compared to the control soil samples, except for TN, which varied significantly among treatments (Table 6).

3. Discussion

In this study, the effects of utilizing amaranth vegetable wastes in fish feed, and fishpond water for irrigating amaranth plots, on growth, yield and economic benefits were explored. The results demonstrate that the inclusion of AW in the fish feed does not compromise, but rather improves the feed utilization efficiency by the fish. Similar results were reported in Kenya when replacing fish meal with concentrates of amaranth in fish feeds for tilapia [35]. Feed conversion ratio (FCR) is an important proxy of the feed utilization efficiency [36]. The superior FCR for fish grown in IAA ponds compared with fish grown in non-IAA ponds in the present study, could be due to the fact that the inclusion of amaranth reduced the amount of rice brans (having high ash and fiber content) in the feed by 12%, thus improving the feed digestibility [37].
The crude protein level (47.4%) of freshwater shrimp in this study was lower than that (60%) reported by Litti et al. [38], but within the range (45–64%) reported by Munguti et al. [39]. The variation in crude protein levels could be related to prior handling processes by local suppliers, which involves recovery from the wild, drying, transportation and storage.
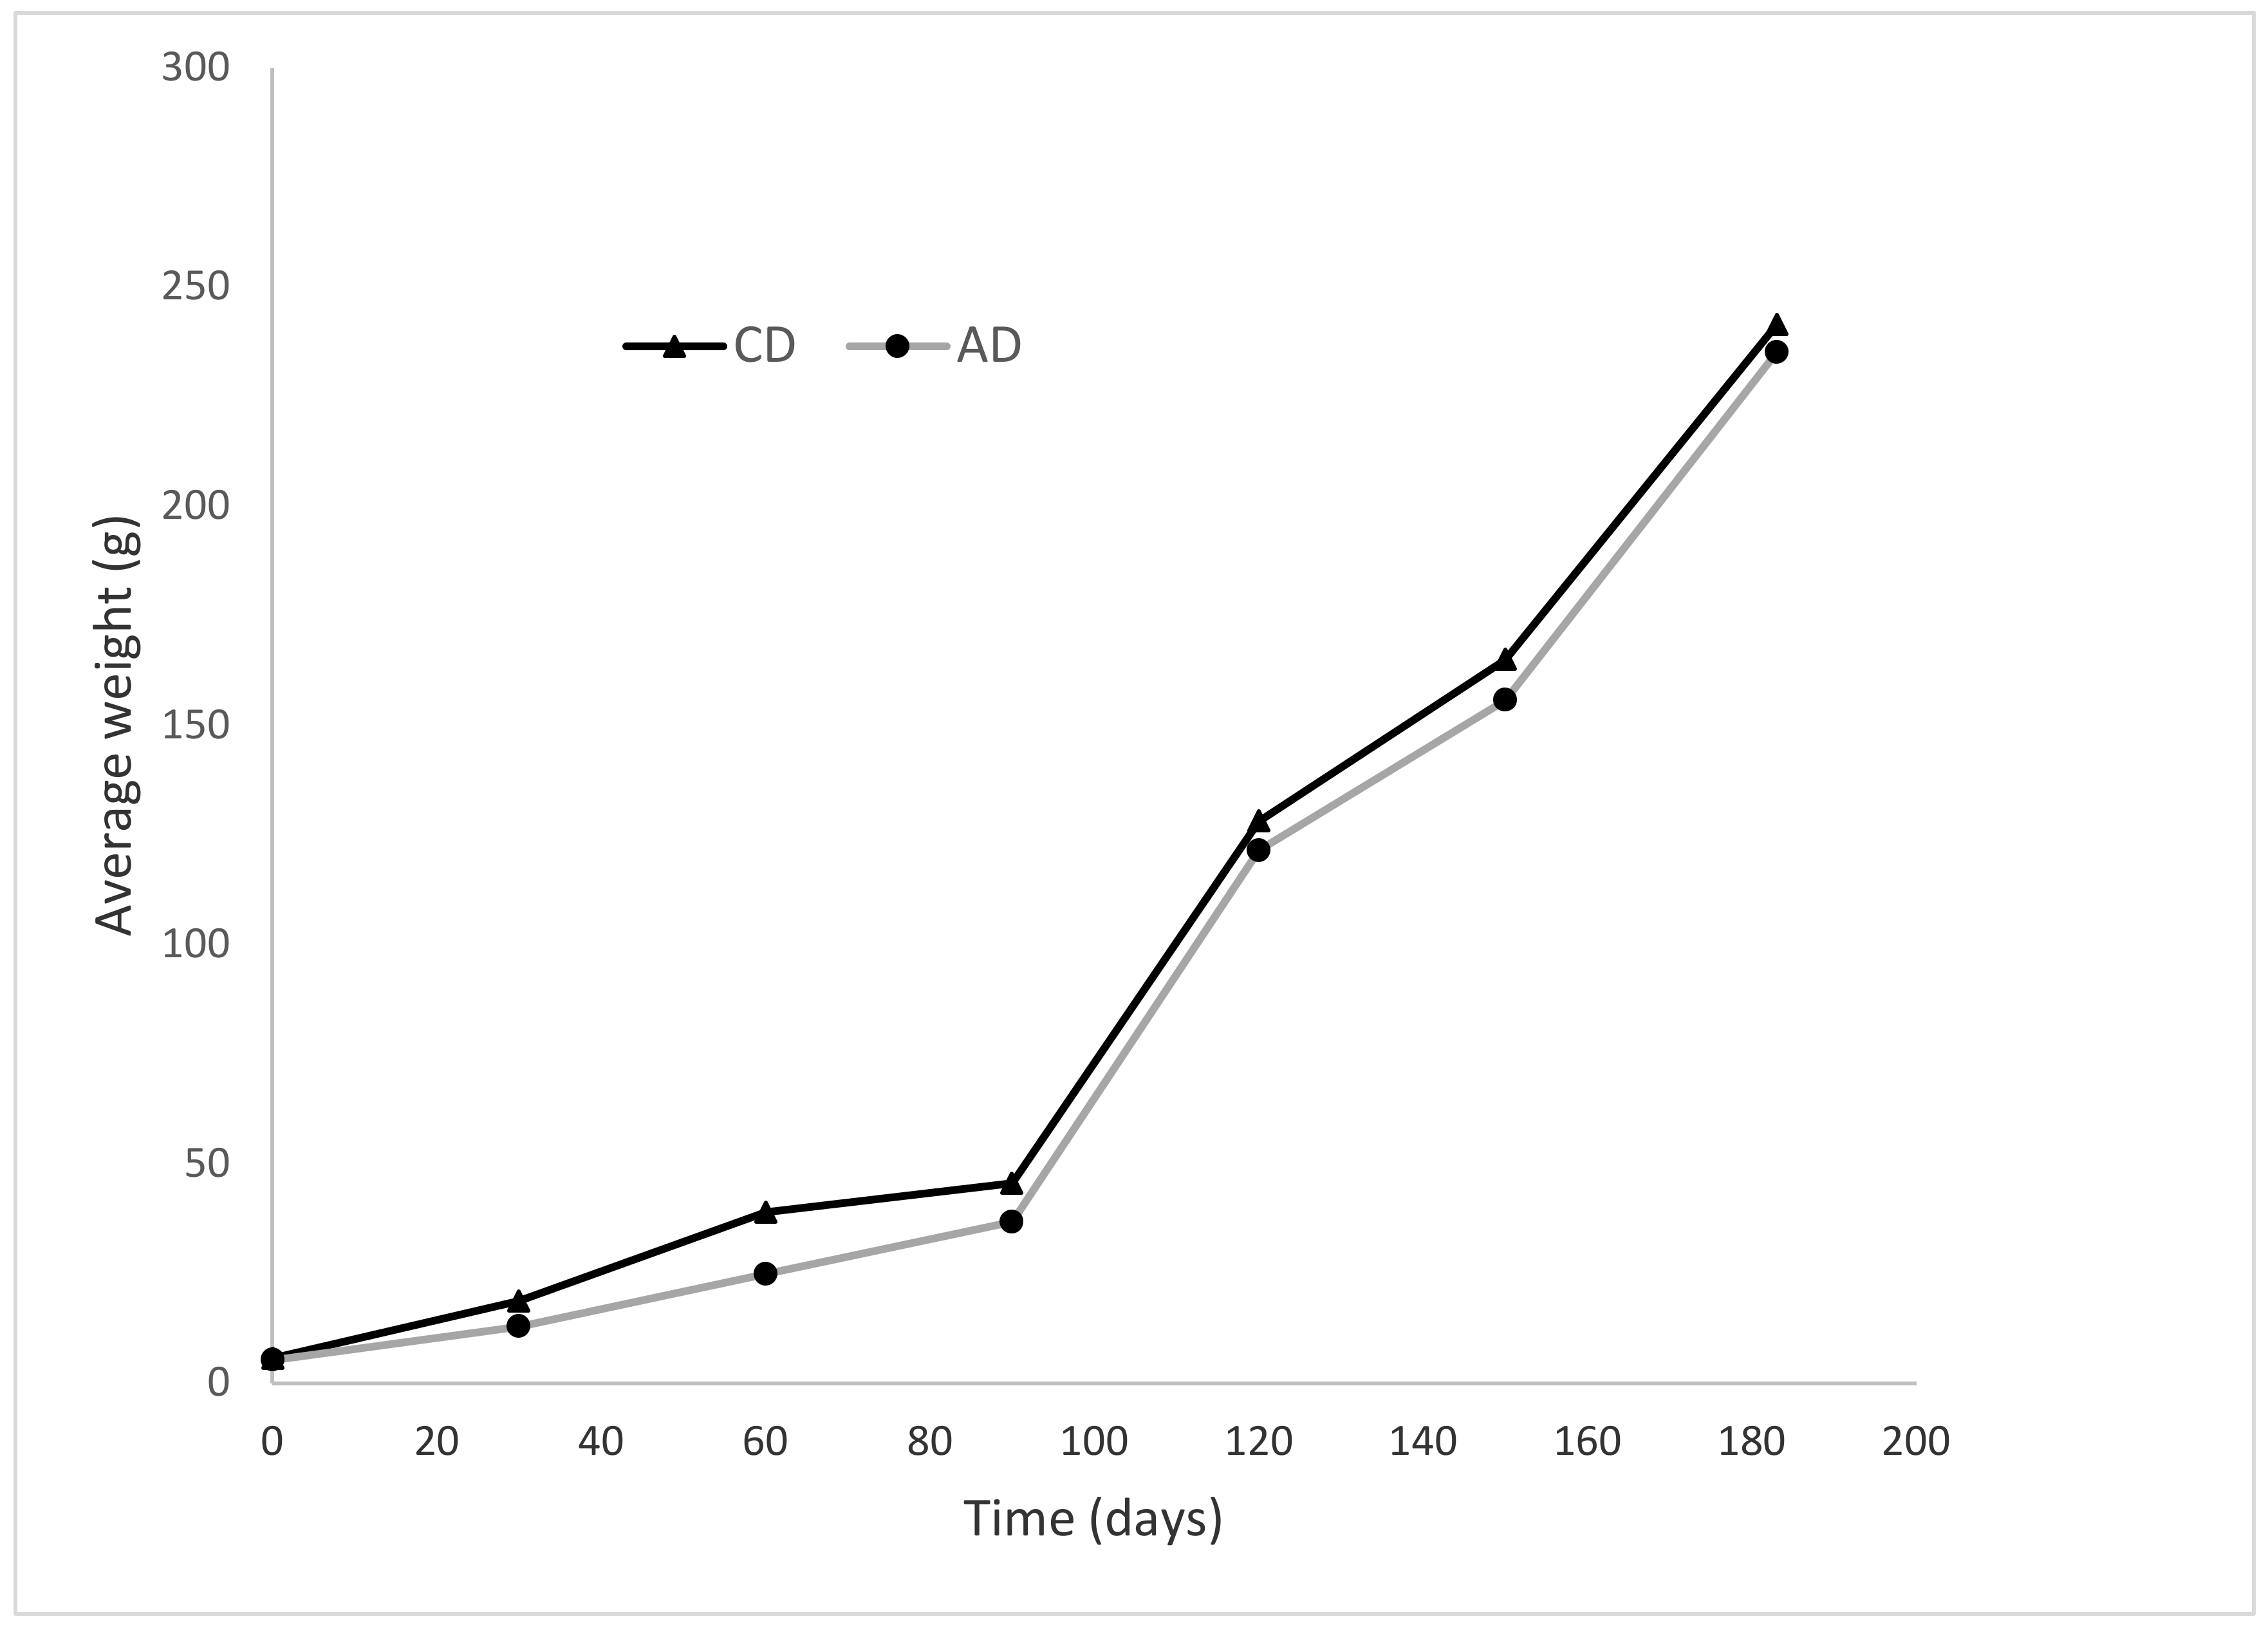
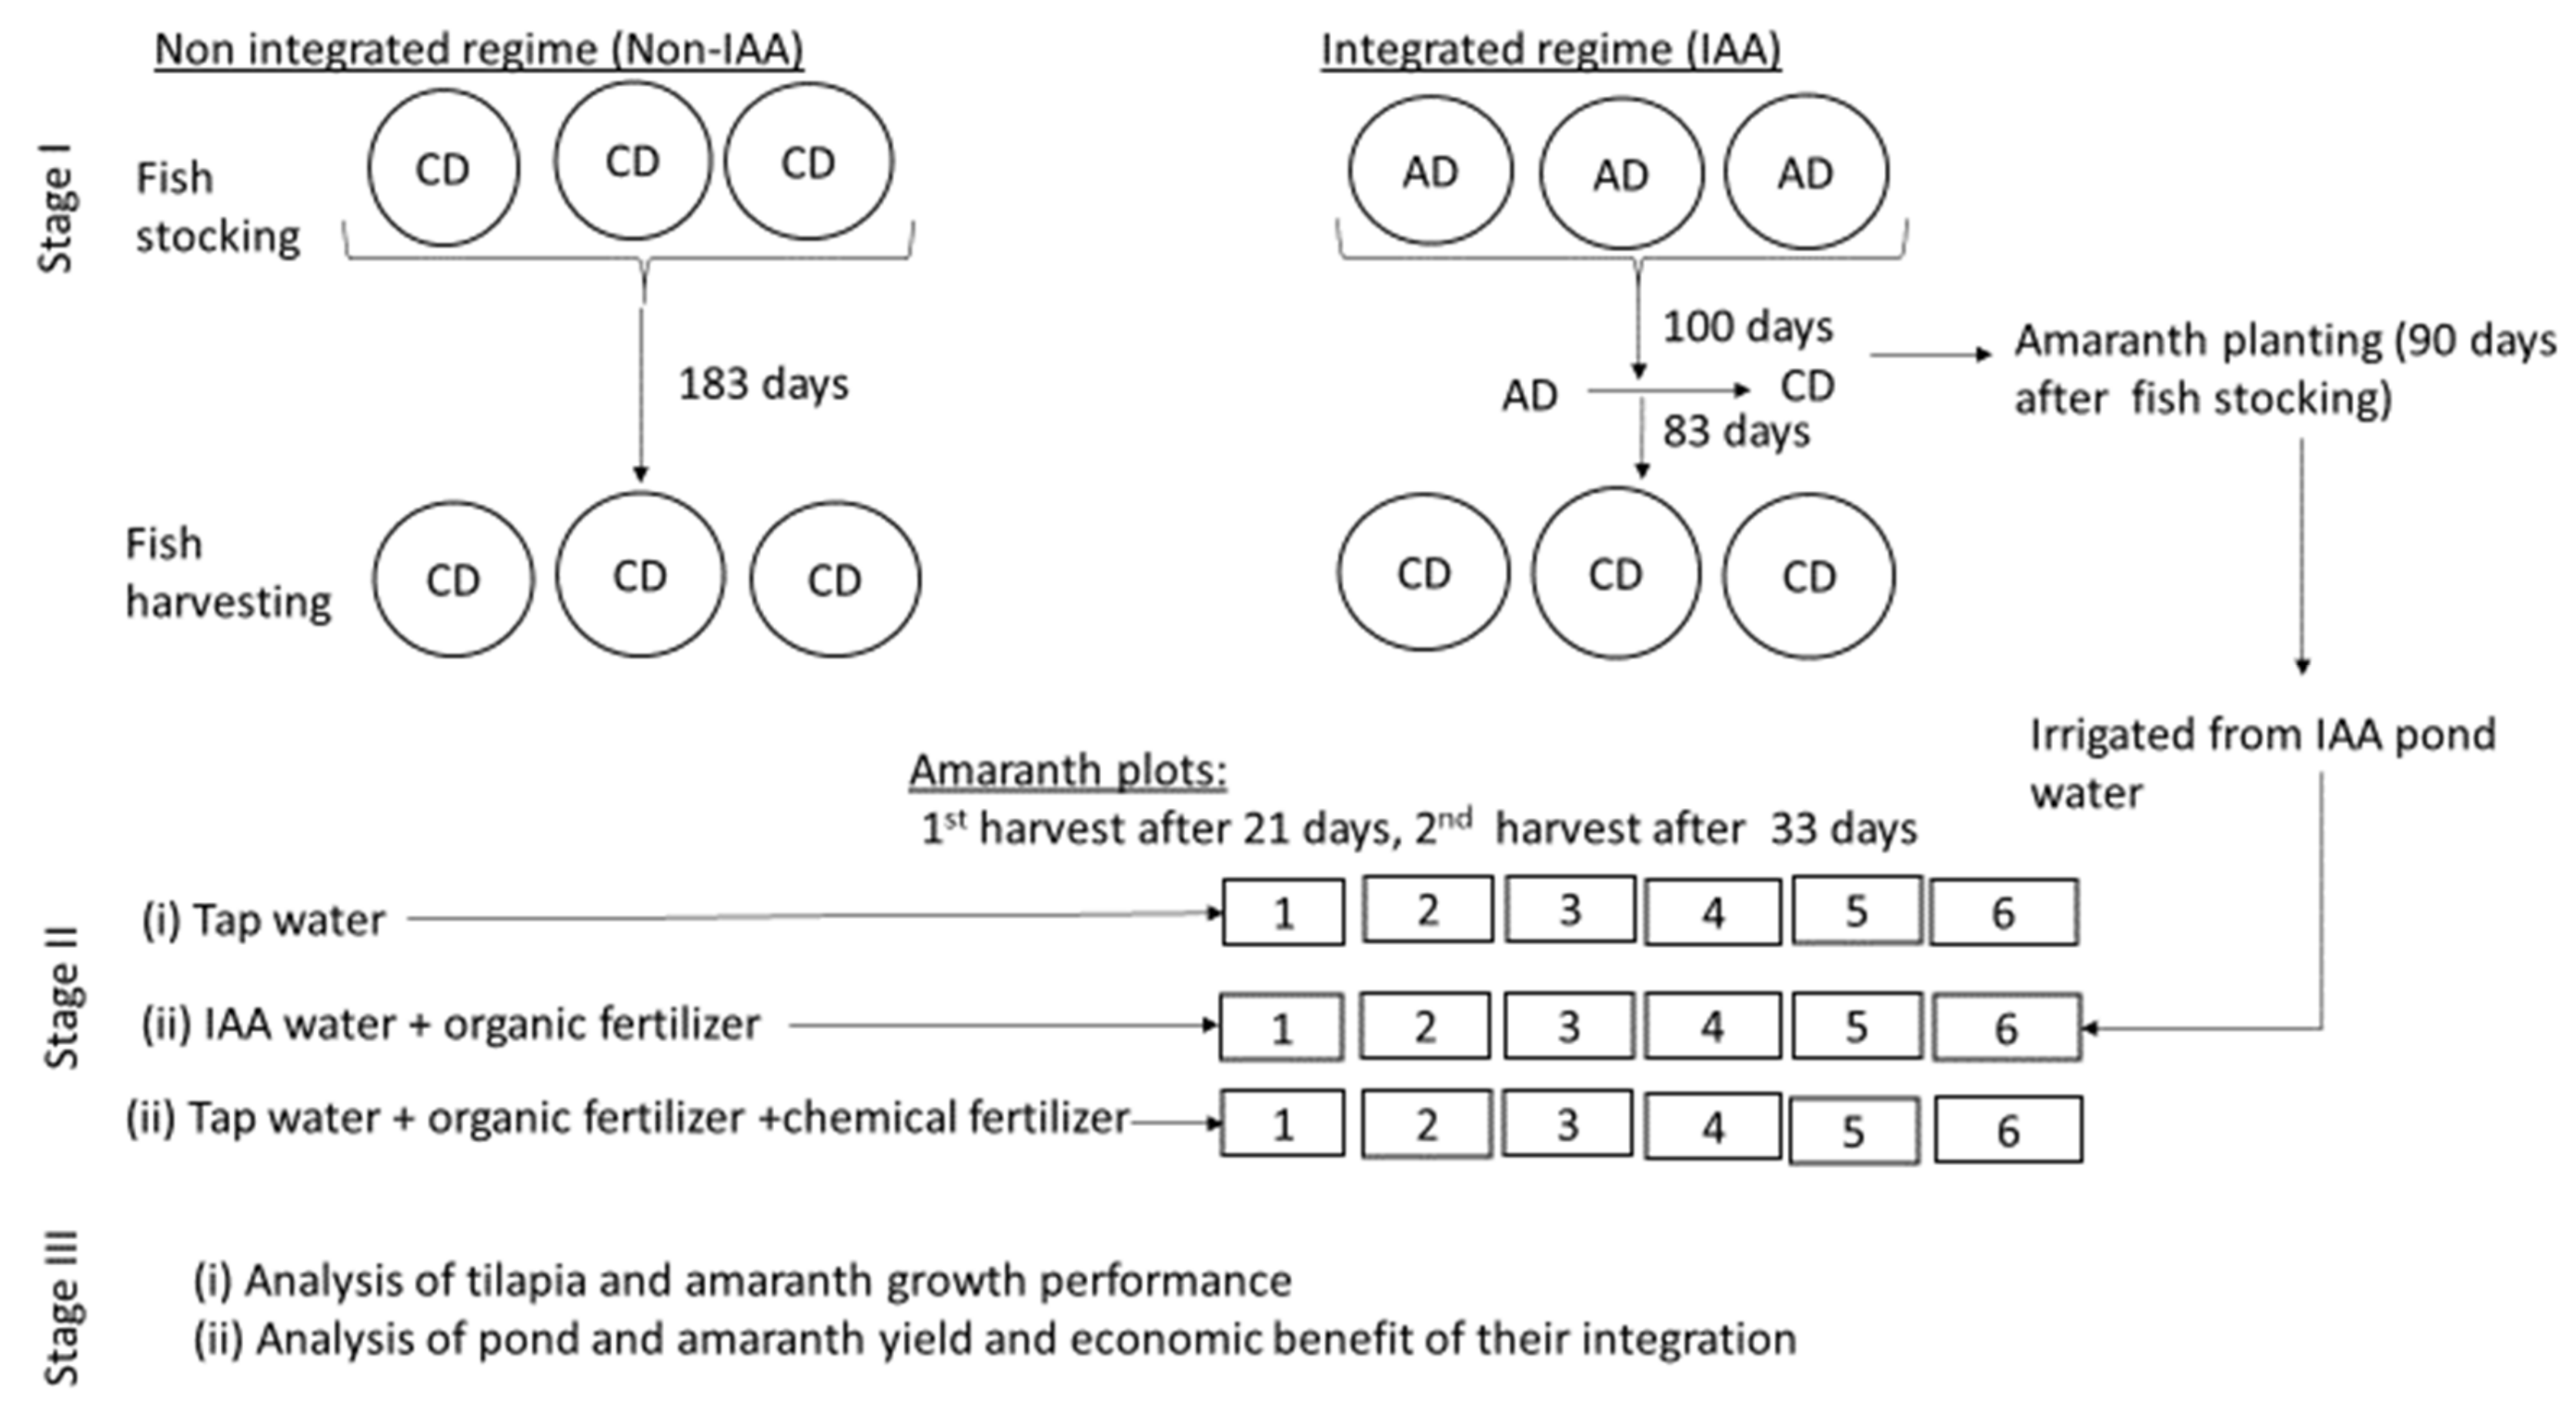
Despite a lower feed intake by the fish fed the AD diet, the overall growth was similar to the fish fed the control diet (CD). The lower feed intake corresponds to a relatively lower growth of fish in the first 100 days, when AD was fed to fish in the IAA regime. This is seen in the growth curve (Figure 1), which indicates that, on the 90th day when the last measurement was taken before shifting from the AD to the CD diet, fish fed the CD diet had about 24% higher growth than fish fed the AD diet. The reduced feed intake in fish fed the AD diet could be related to the pungent smell from amaranth inclusion that might have affected the feed flavor, and also a slightly lower survival rate compared to the fish fed the CD diet. However, all these factors did not significantly affect the overall fish growth and pond yield at harvest.
The yields of 17,720 kg fish/ha and 16,914 kg fish/ha for non-IAA and IAA ponds, respectively, were similar to that reported by Toma et al. [40] in Bangladesh, but were about three times higher than the yield reported by Chenyambuga et al. [41] in Mbarali and Mvomero in Tanzania. This difference could be because the present study involved the use of improved mono-sex tilapia strains with higher stocking density (8 fish/m2), as opposed to the use of mixed sex tilapia stocked at less than 4 fish/m2 in the previous studies in Tanzania [13,42].
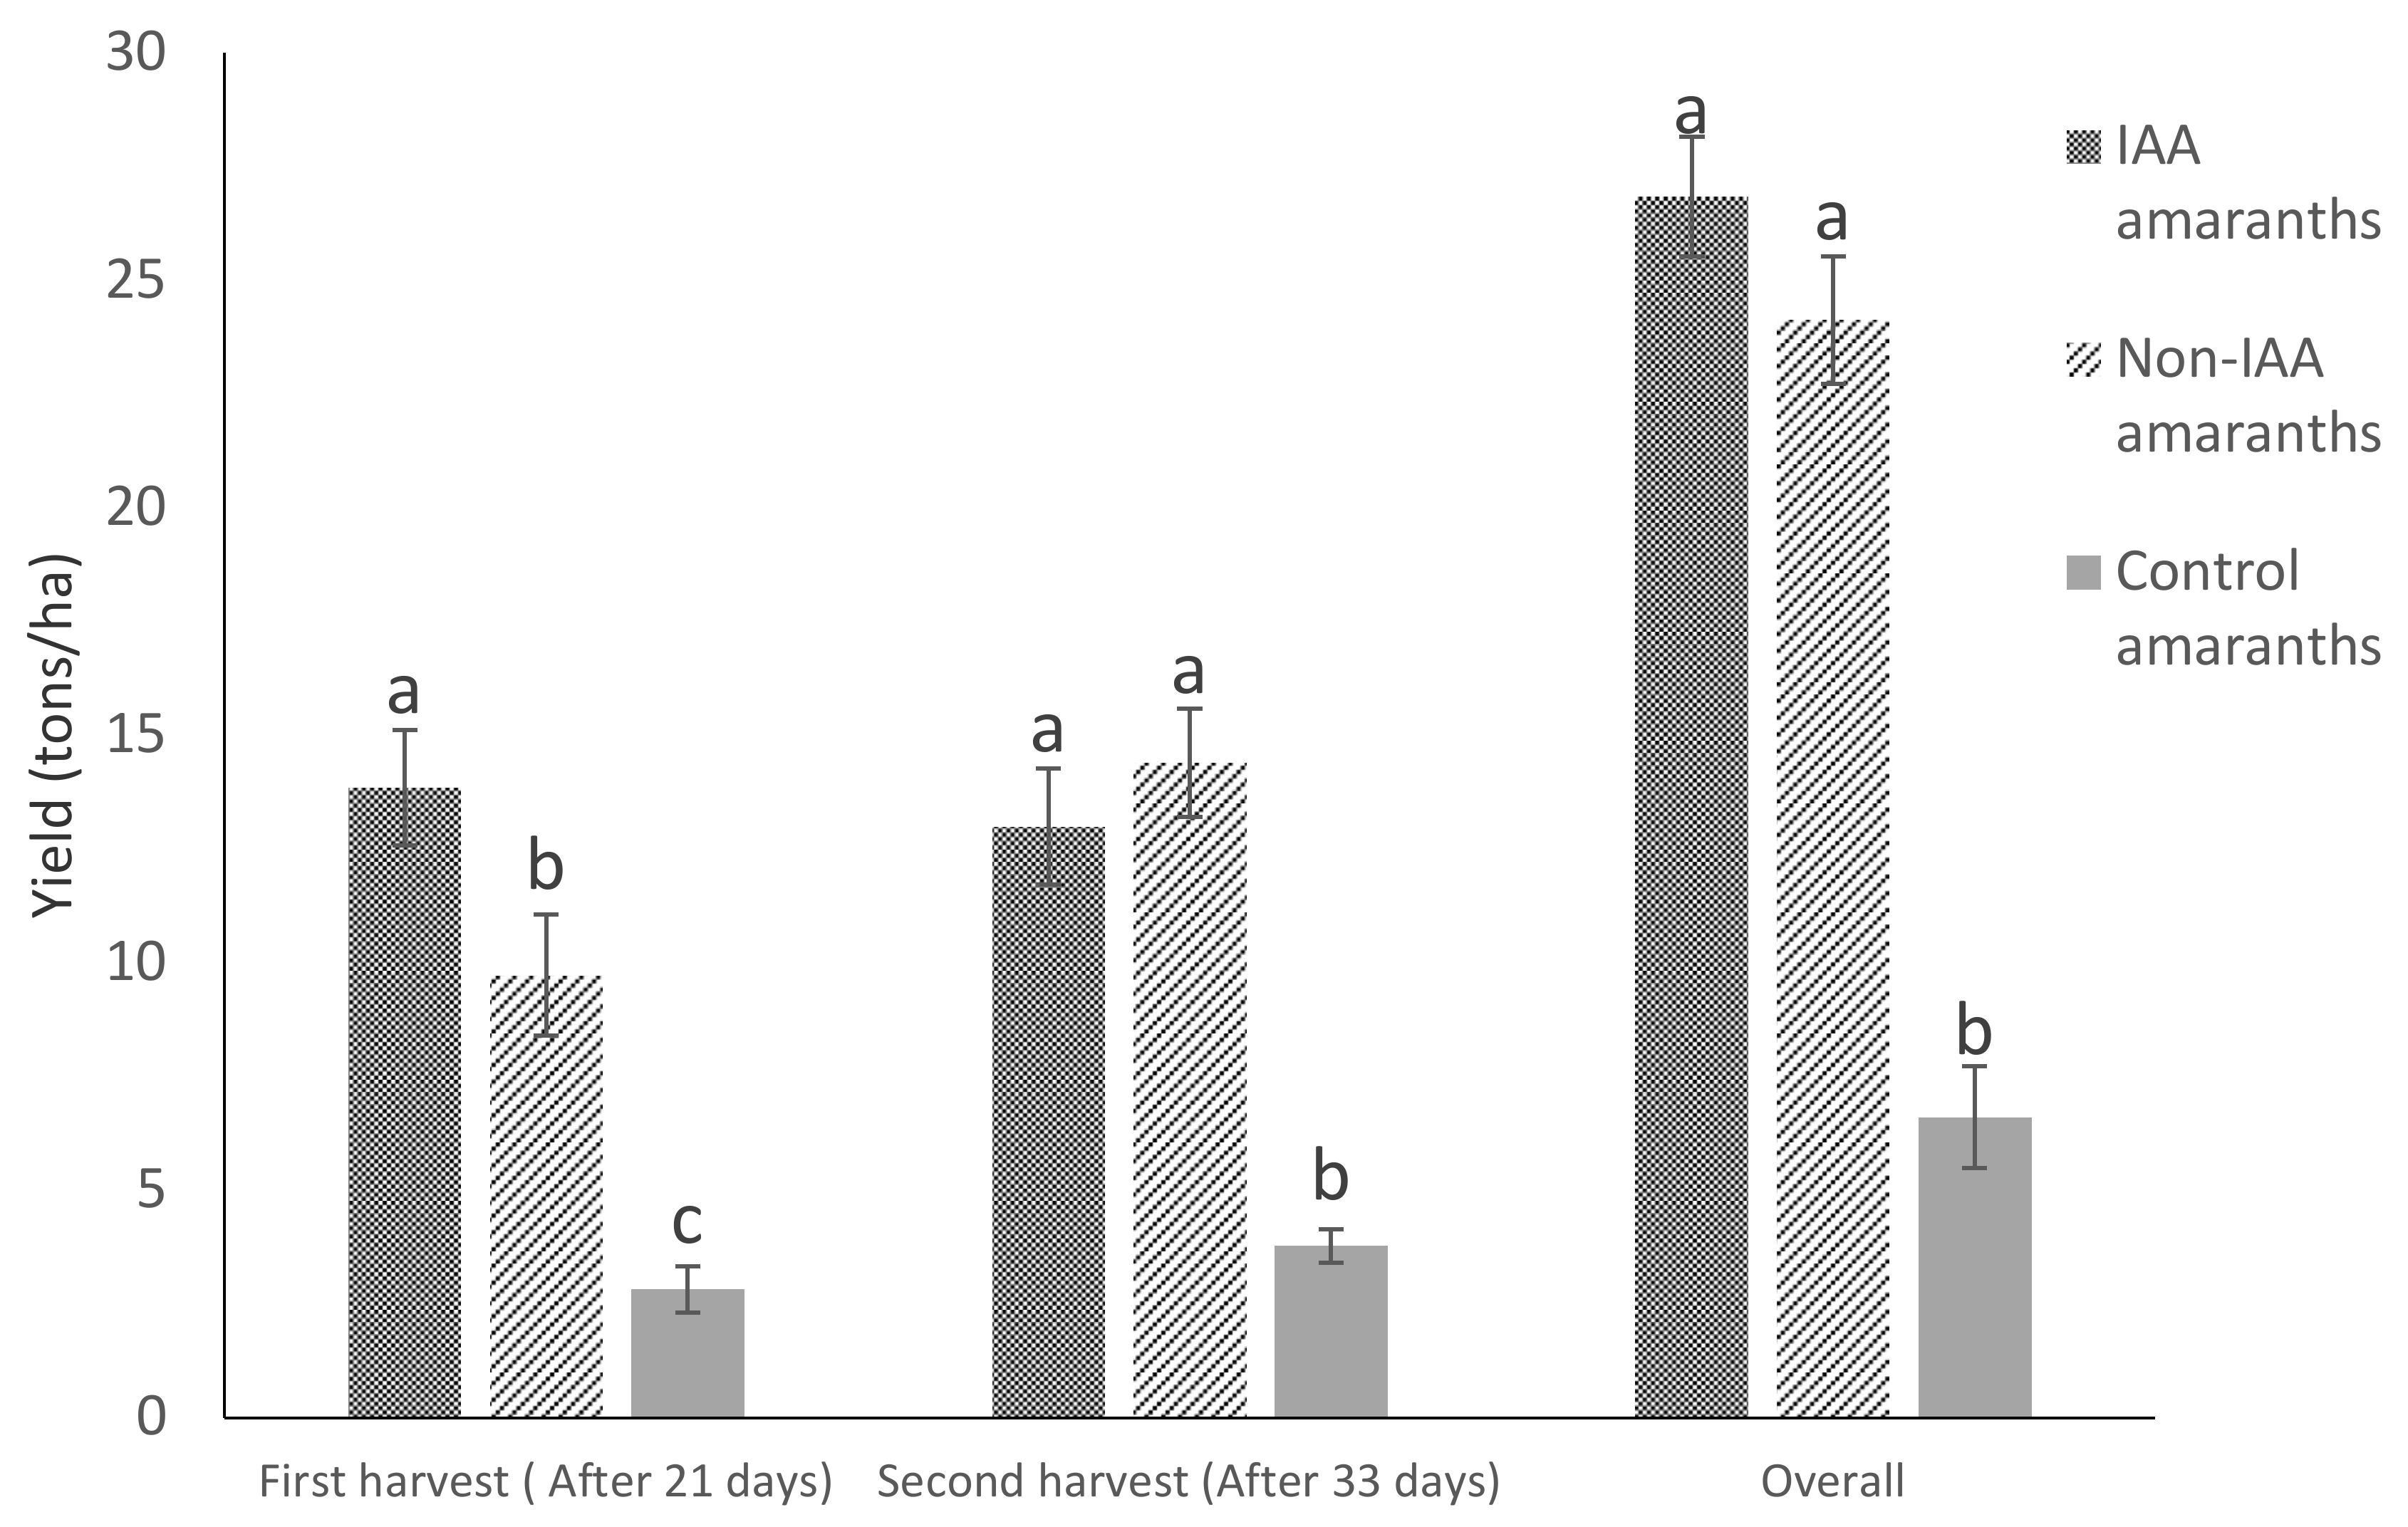
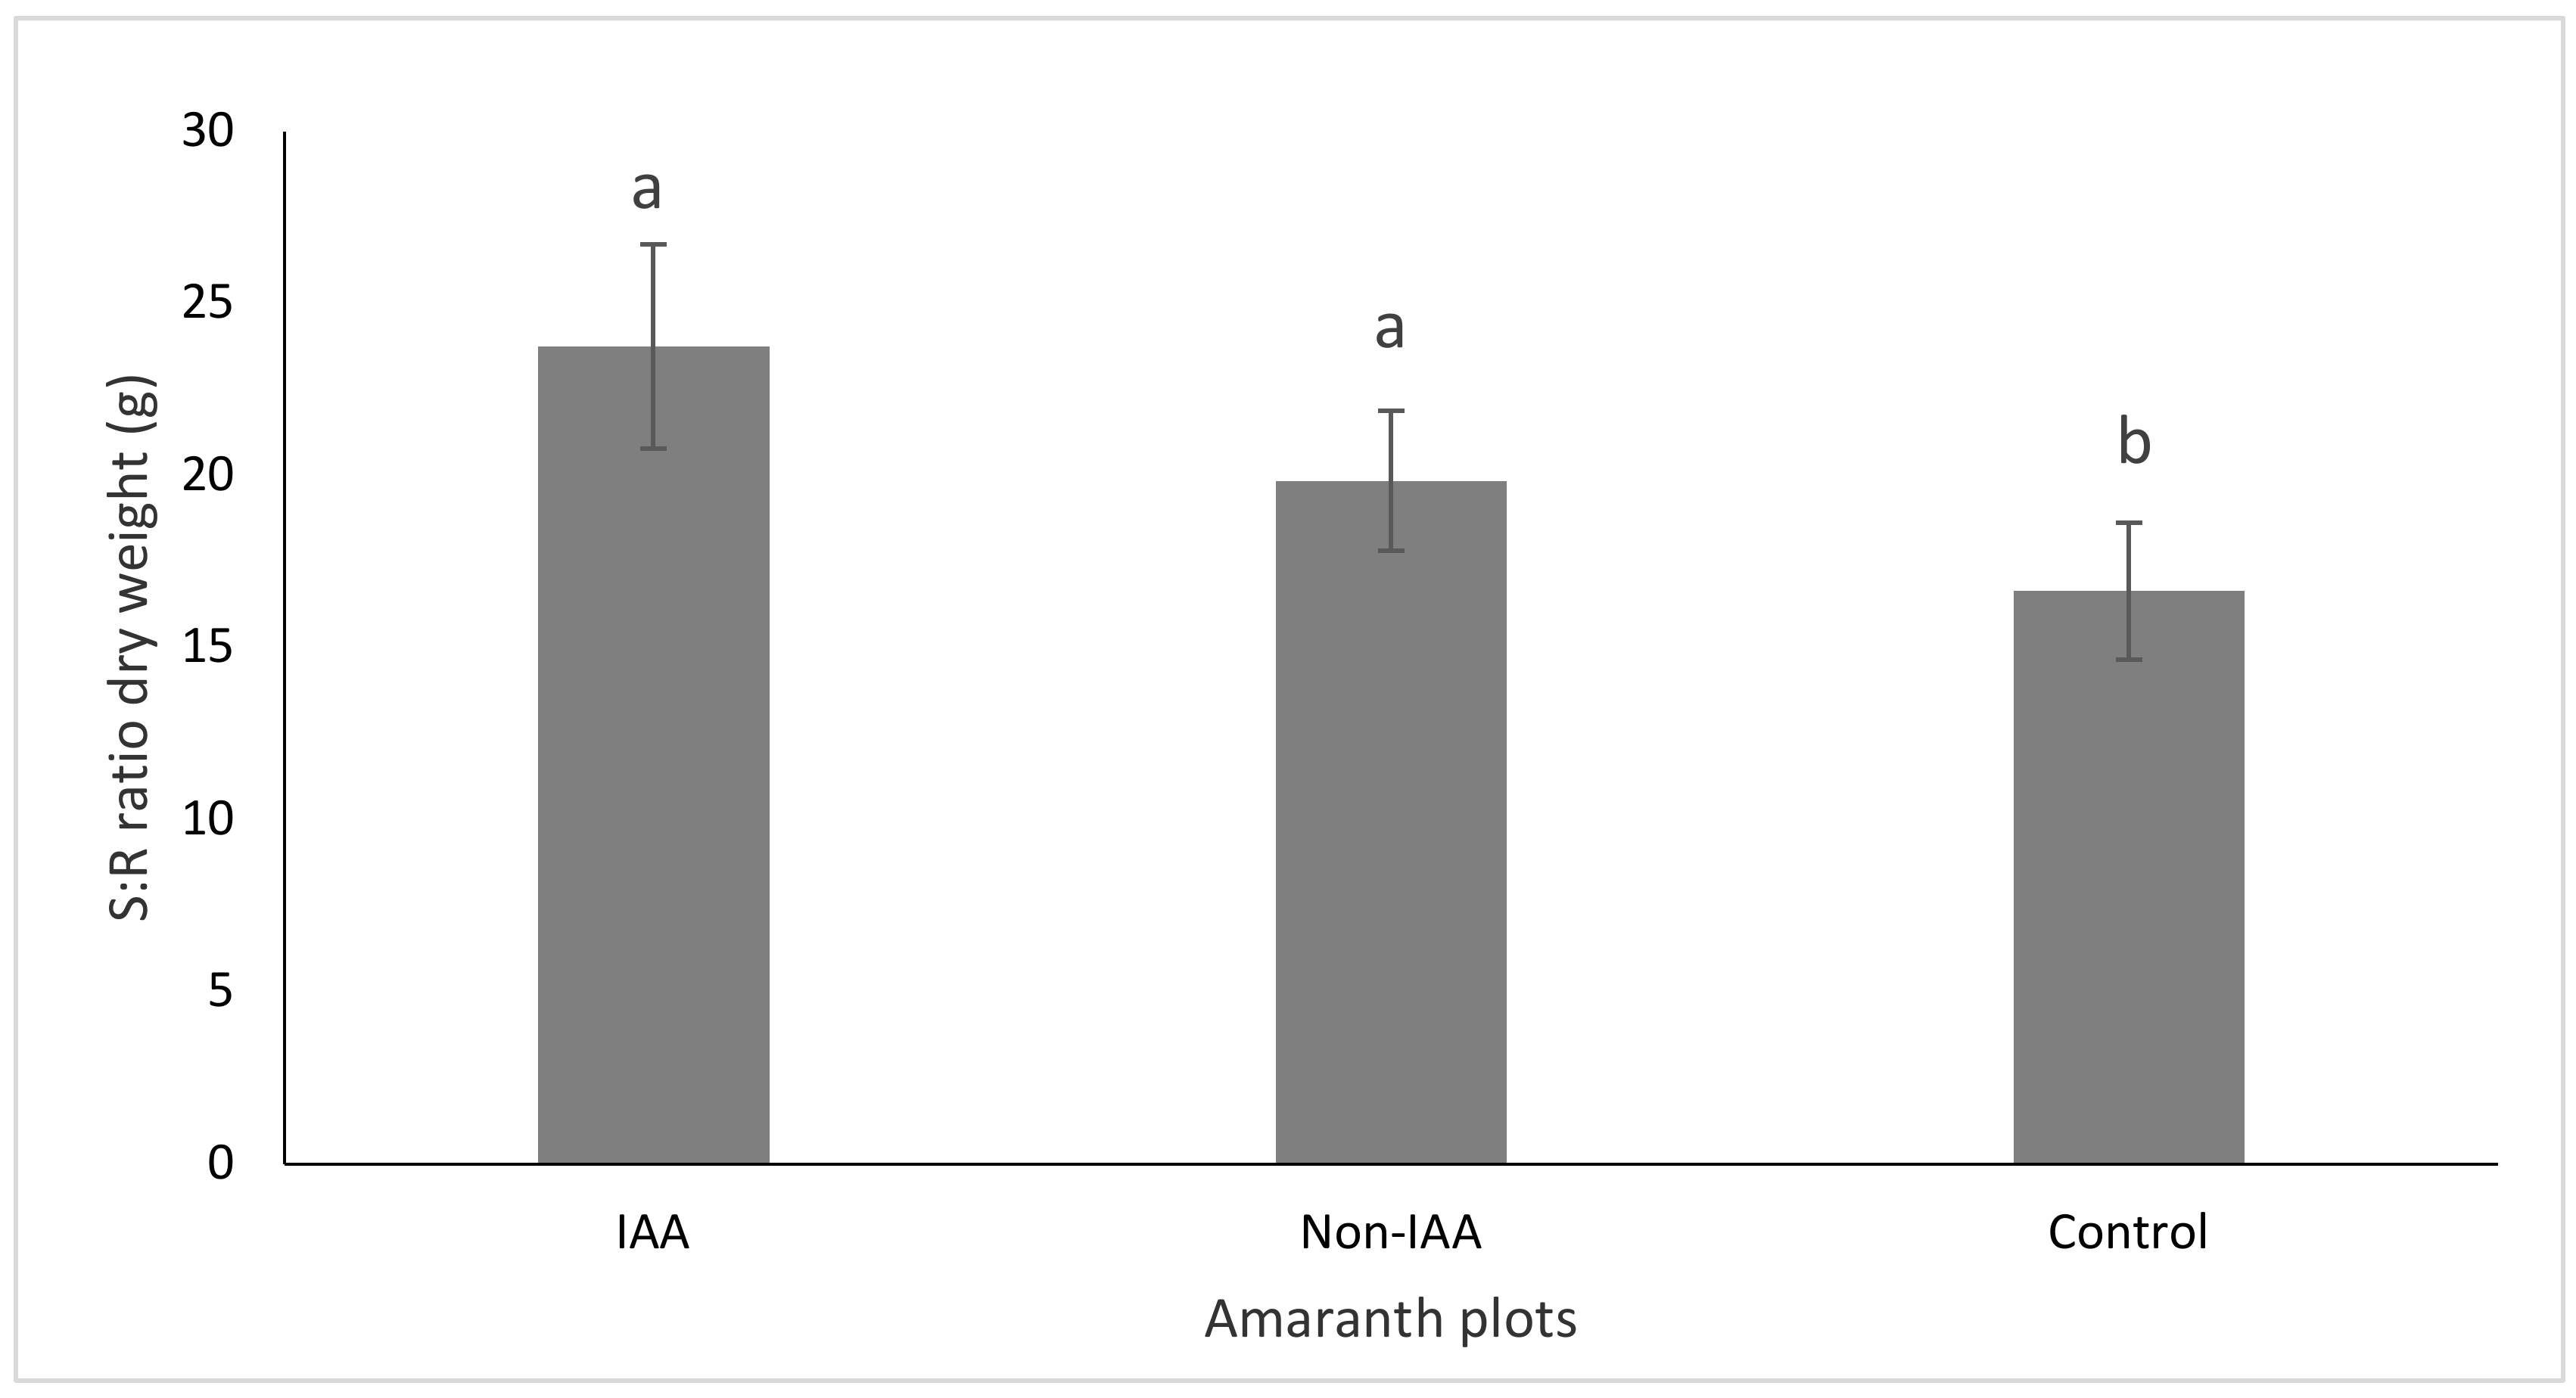
The positive effect of using pond water for amaranth irrigation was evident on the first amaranth harvest. IAA amaranth plots had 1.4 and 5.5 times higher yields than non-IAA and control plots respectively. This is due to the fact that pond water had higher nutrient concentration for promoting amaranth growth than the tap water. The increased yield for the non-IAA amaranths plots in the second harvest was probably due to the increase in the nitrogen supply from urea, which was provided as a booster fertilizer only in this treatment. Studies on higher plants, report an increased S:R ratio linked to an increased plant growth because of an increased nutrient supply, especially nitrogen [43,44]. This was also found in the present study, where IAA and non-IAA plots had significantly higher S:R ratio than the control plots. This may be attributed to a sufficient supply of nutrients for the IAA plots from the fish-pond water, and for the non-IAA plots from the chemical fertilizers.
The overall amaranth yields in this study were slightly higher than those reported from a study by Baitilwake et al. [45], who investigated the impact of different fertilization regimes on amaranth and spinach yield in Morogoro. The yields from the present study were also two times higher than those reported from a study by Mulandana et al. [46] in South Africa. The differences in amaranth yields observed between these studies could be related to differences in amaranth species used and also farming approaches between these studies. For example, in the present study, sowing was done by broadcasting, long cultivation cycle, and use of fishpond water for irrigation as opposed to transplant planting and non-integrated farming systems in previous studies.
Additionally, while it is recognized that the use of chemical fertilizers can significantly increase crop yield, these fertilizers could have adverse environmental effects, such as changing the soil pH and nutrient enrichment, which can disturb the ecosystem. In this regard, amaranth farming based on organic manure and nutrients from fishponds is more sustainable, from an environmental point of view, compared to farming systems which rely completely on chemical fertilizers [47].
In the IAA and non-IAA fishponds, no statistical differences were observed in the water temperature, DO, pH and nutrient concentrations, which were expected as the ponds were managed in the same way, except from a slightly different composition in the feed fed to the fish. Thus, the different FCR and PER were most likely related to the different feed compositions, while the slightly higher yield of the non-IAA fish was primarily related to a slightly higher survival rate. Although the nutrient concentration in the soil samples for IAA and non-IAA plots did not show any marked variation, there seemed to be a slightly higher accumulation of nutrients and especially nitrogen in the soil fertilized with fish-pond water. The slightly higher nutrient concentrations in the IAA plots could indicate that nutrients in the pond water sufficiently replaced the urea fertilizer. This could also be an explanation for the slightly higher amaranth yield in the IAA plots than in the non-IAA plots.
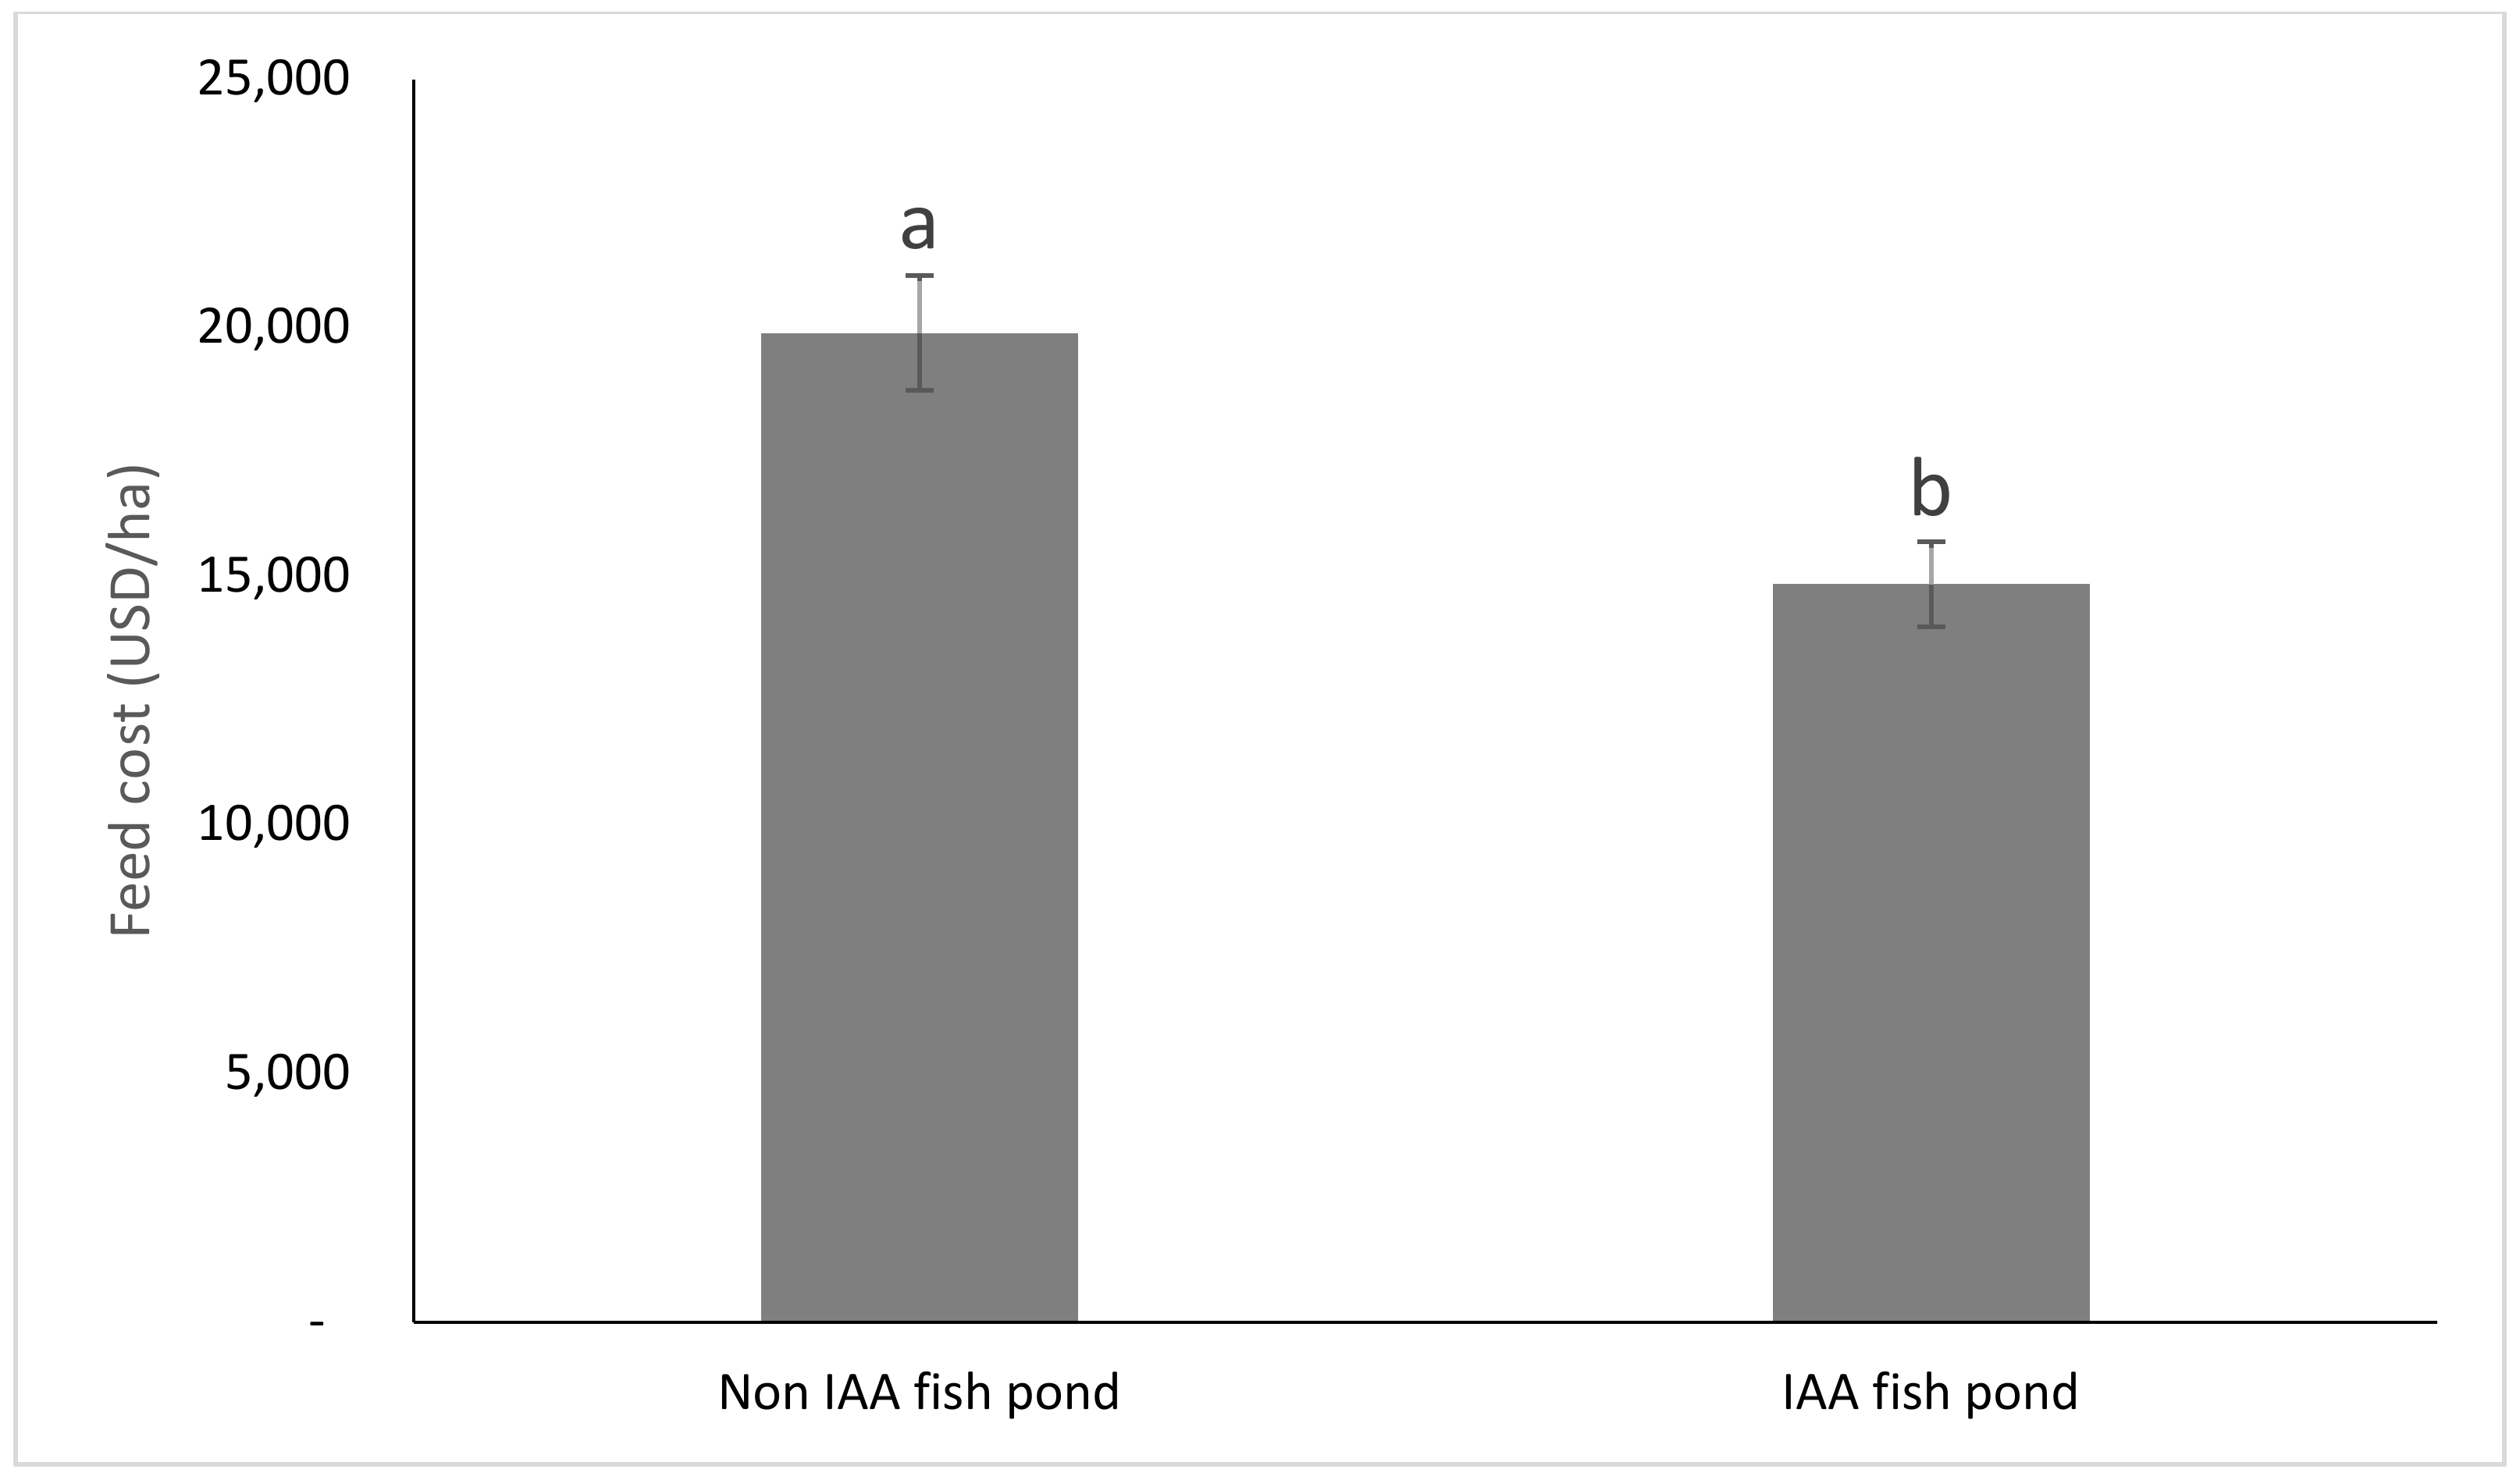
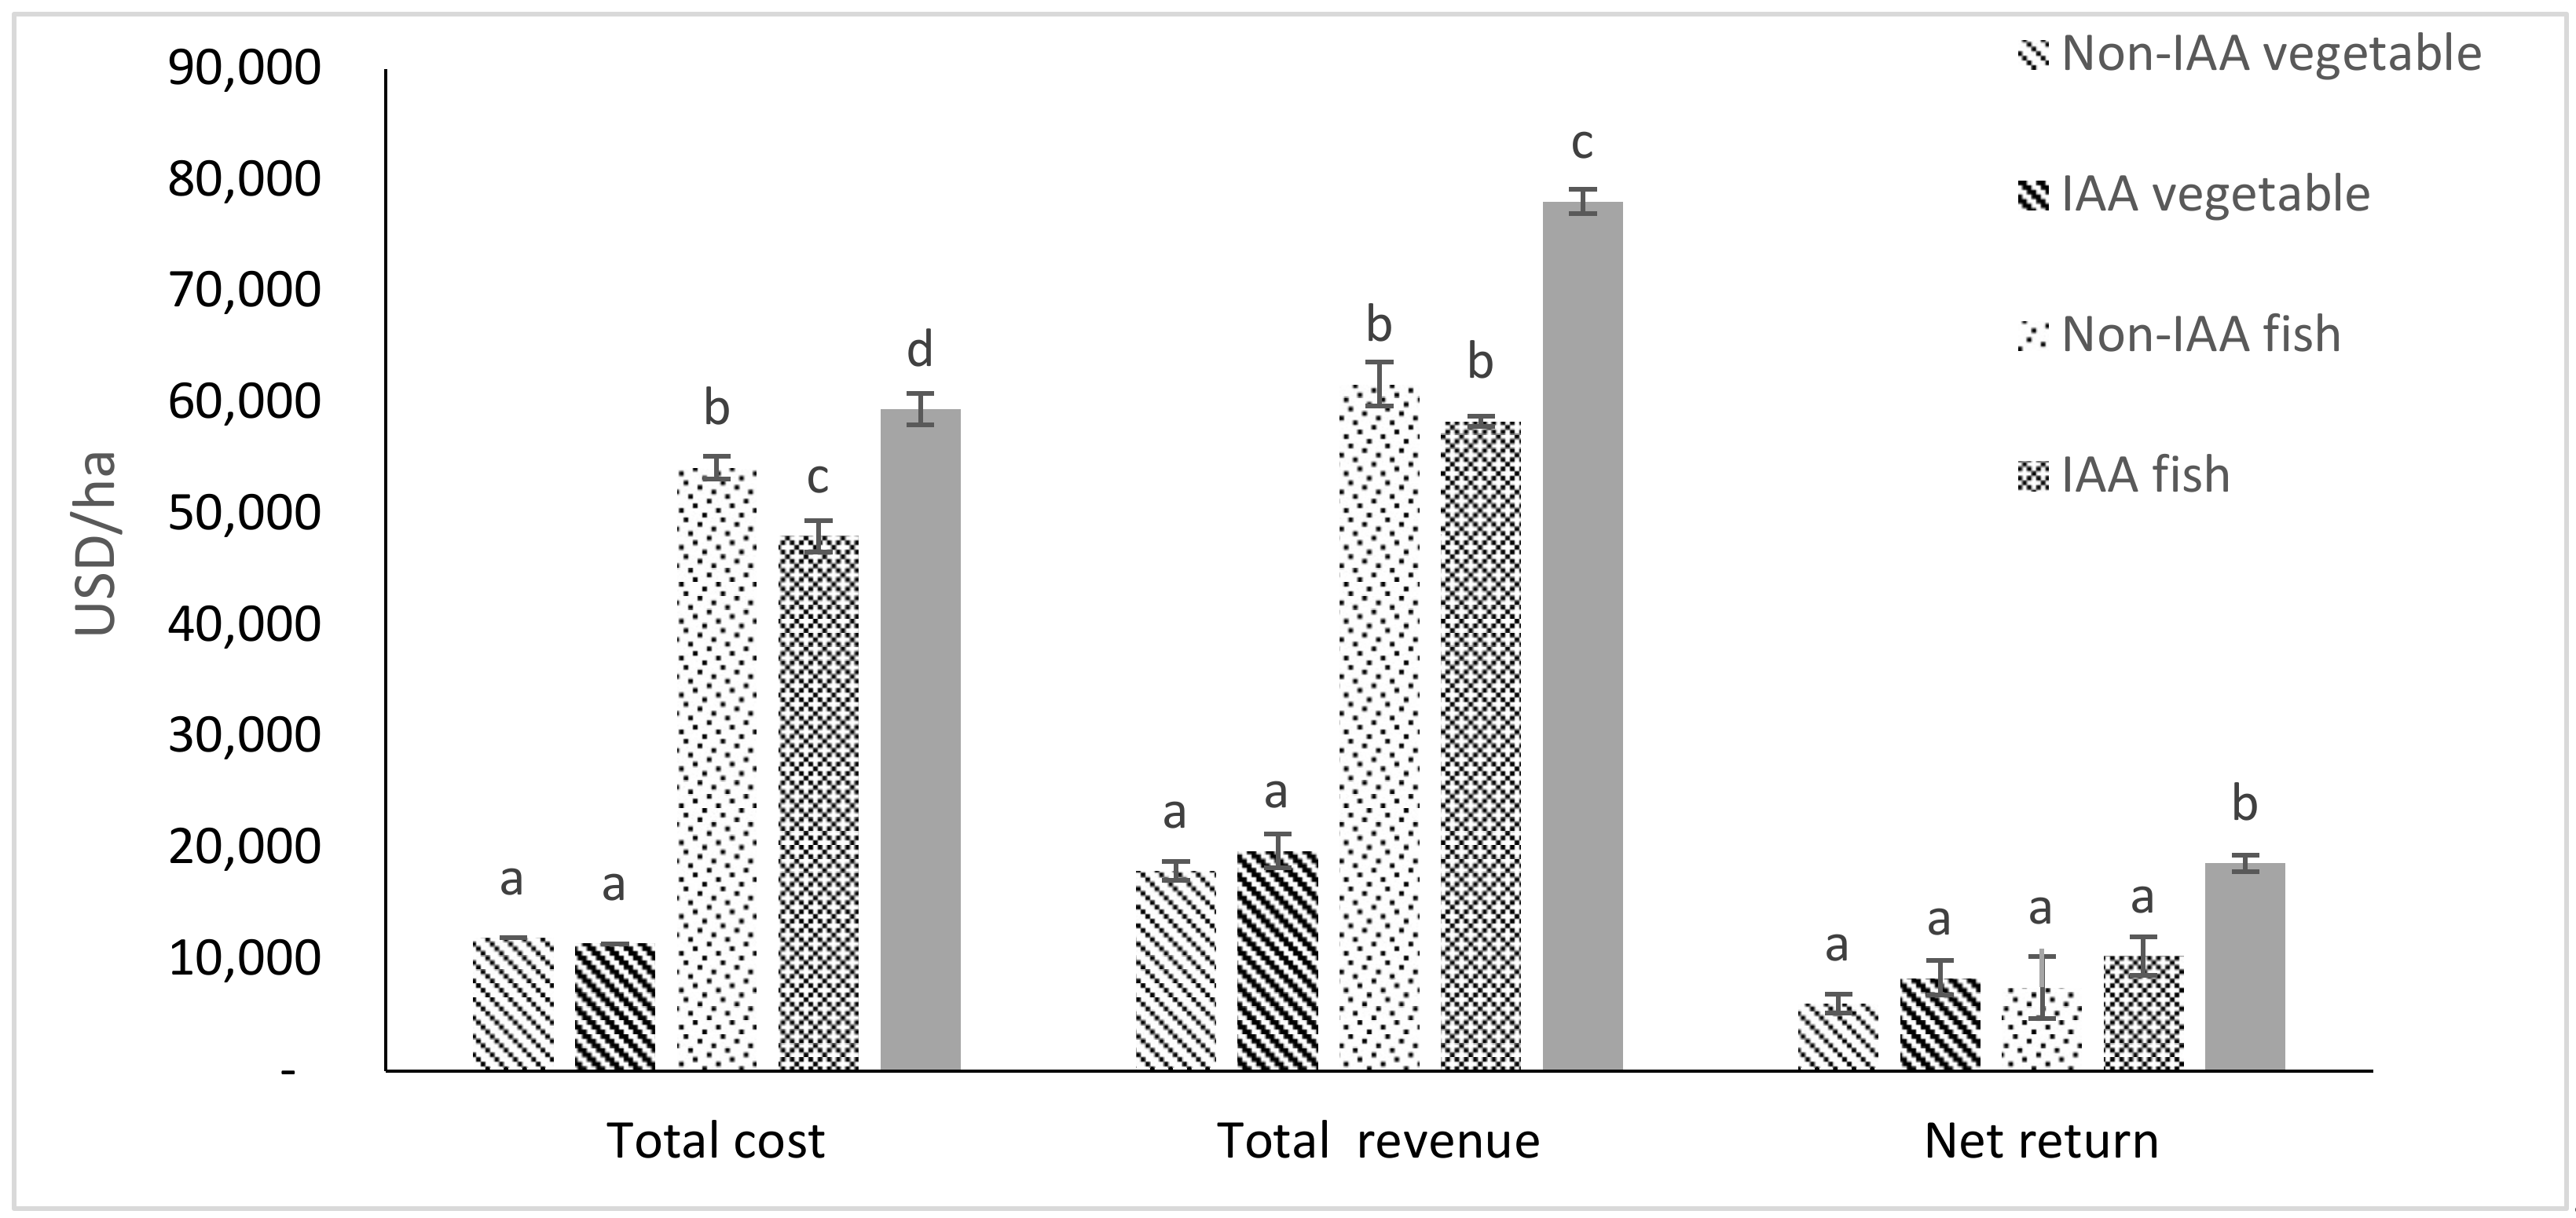
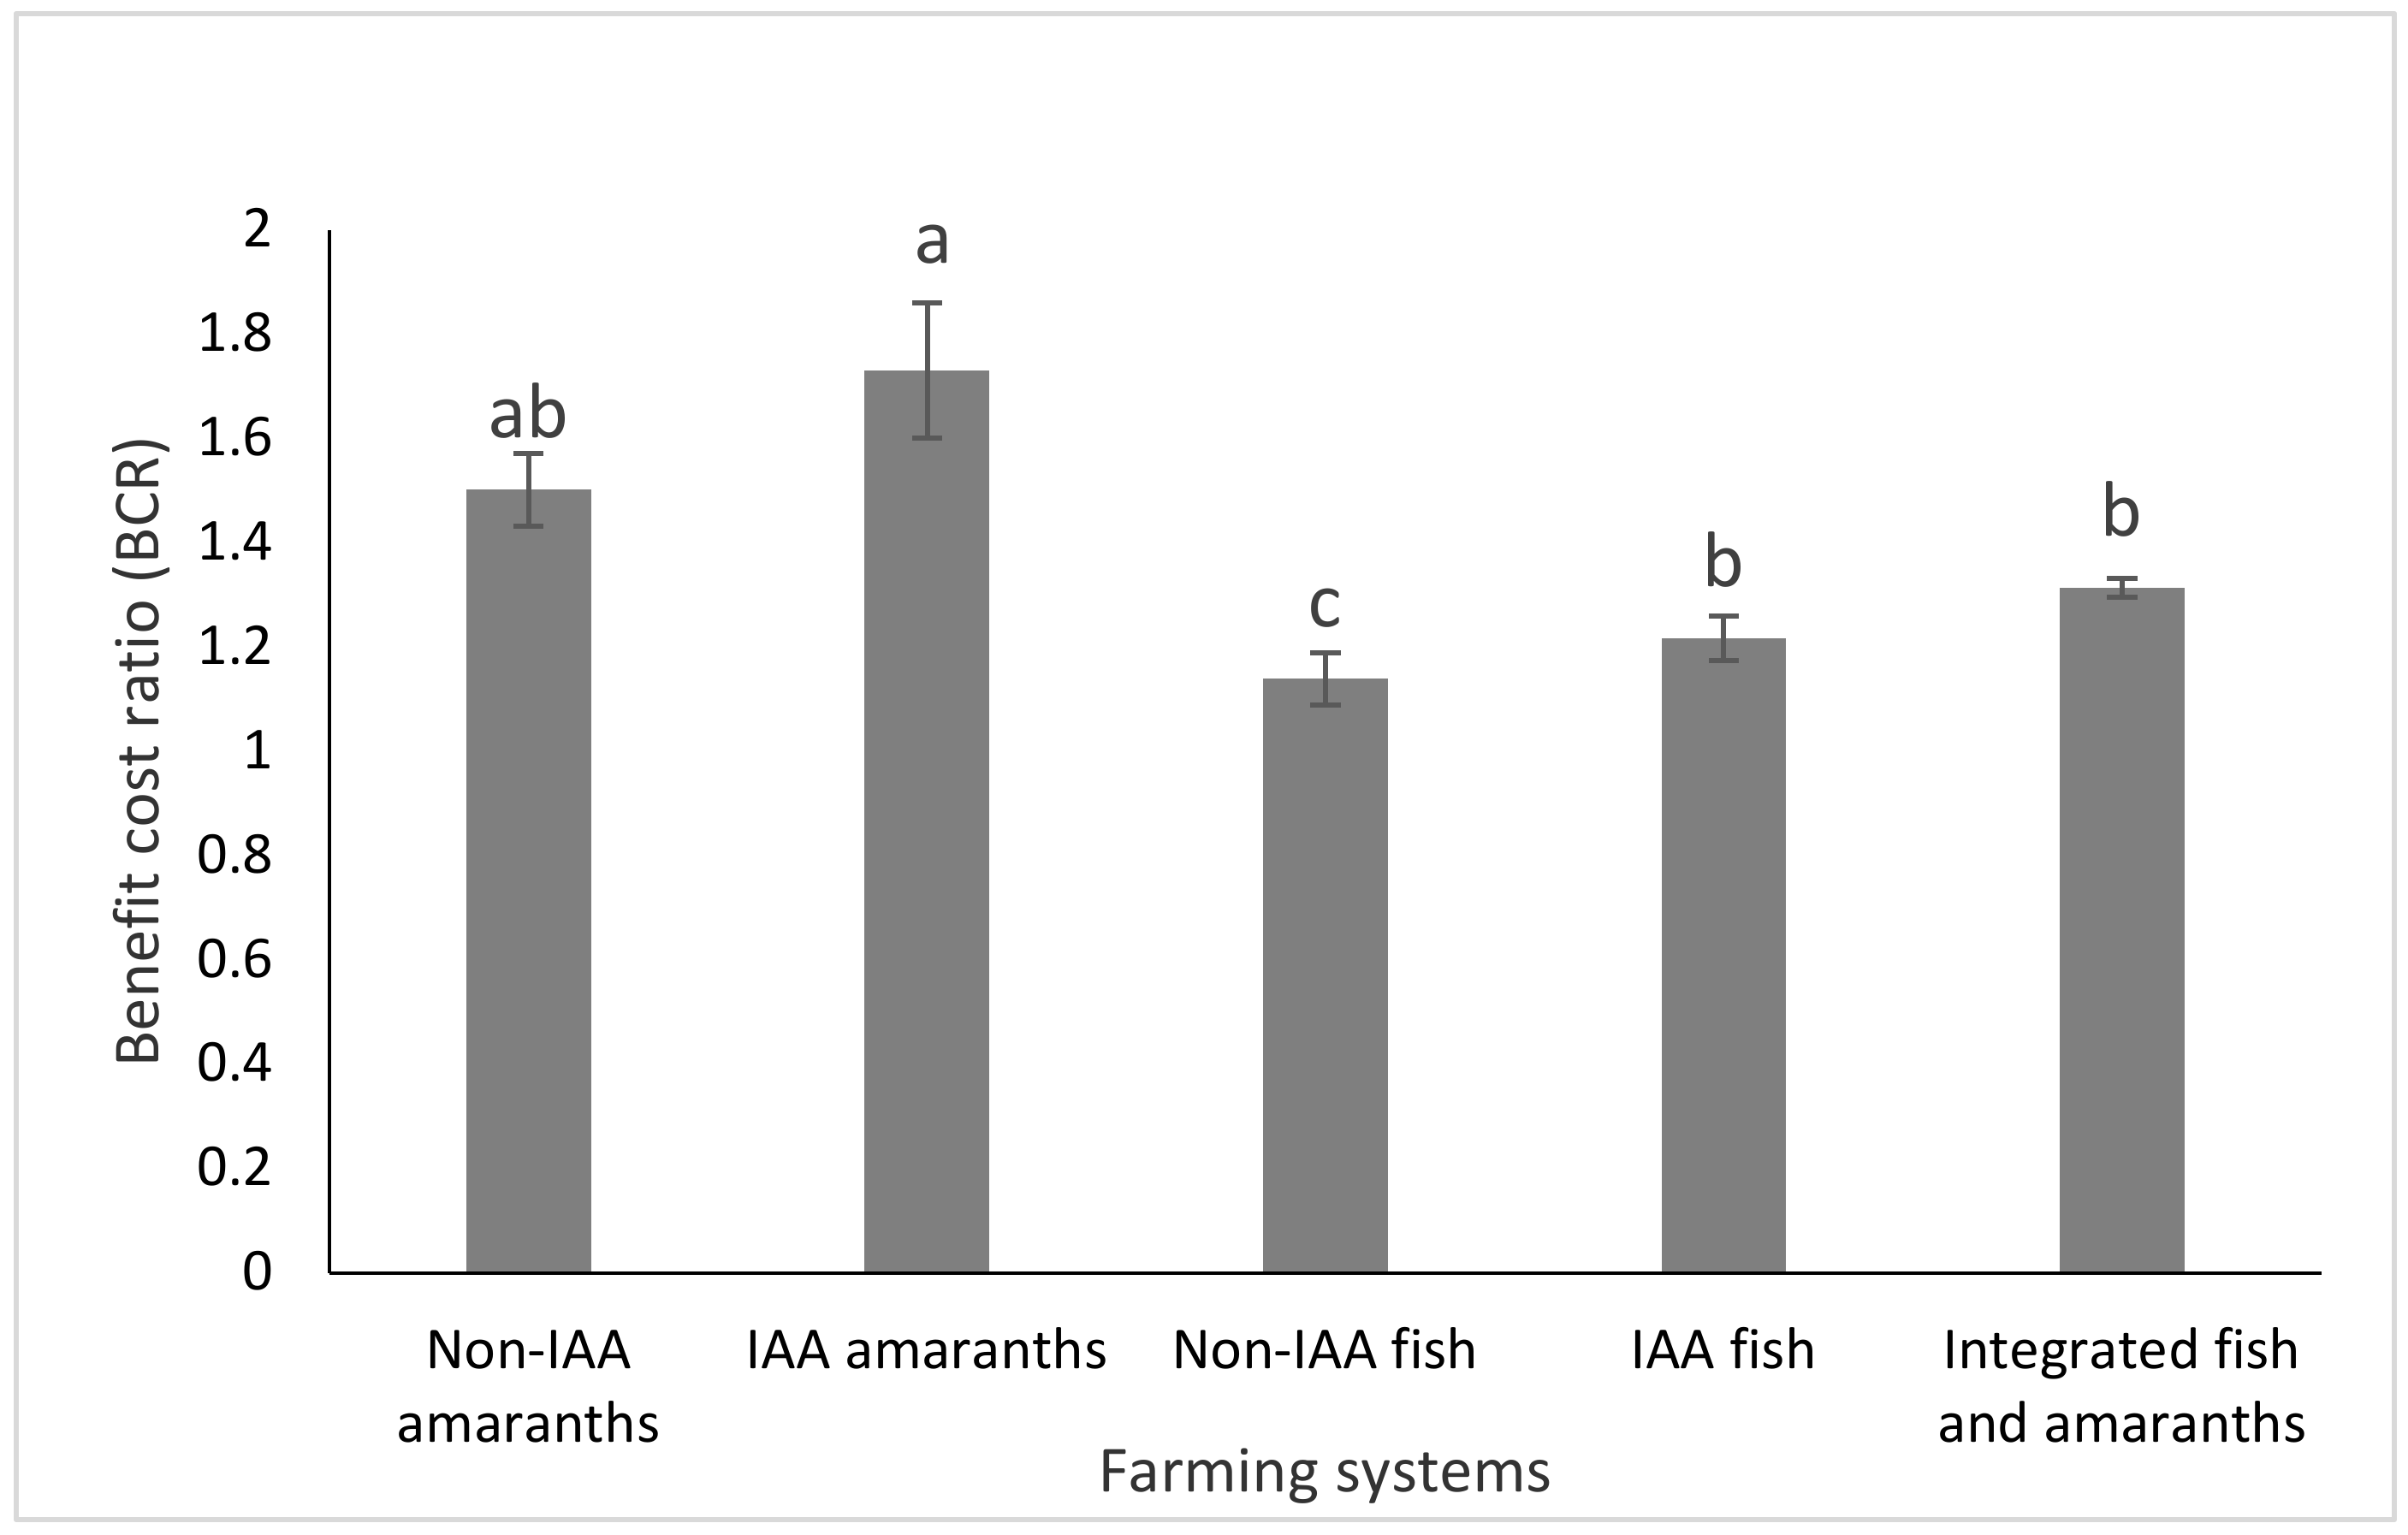
The significantly lower total cost and higher BCR obtained in the IAA fishponds show that the incorporation of AW in the tilapia feed improved the financial efficiency of the system. The incorporation of AW (considered to be of zero cost) as one of the ingredients in the fish feed lowered the feed cost from 0.51 to 0.45 US $/kg, which corresponds to a 12% decreased feed cost. Similar results were reported by Poot-López et al. [30], when tree spinach was used as a dietary ingredient for tilapia culture in an IAA system. Other examples of studies involving use of vegetables as fish feed, with similar results, include Mathia and Fotter [48] and Swain et al. [49]. The IAA and non-IAA plots had comparable revenues and net returns, despite that no chemical fertilizers were applied to the IAA plots. This implies that, the use of pond water (regarded as of zero cost) sufficiently covered for chemical fertilizer, which were applied in the non-IAA plots.
The integration of tilapia farming and amaranth cropping resulted in significantly higher net returns than when these subsystems were analyzed separately. Similar results were reported from previous studies by other researchers in Tanzania and some other parts of Africa. Limbu et al. [12], for example, reported a higher annual net cash flow from integrated tilapia-catfish-spinach farming, than when fish and vegetables were farmed separately. Similarly, a study by Dey et al. [18] in Malawi reported a 11% higher production from IAA farmers than non-IAA farmers. These findings are also corroborated by those by Shoko et al. [13], who reported that the highest economic returns could be attained from fish farming when integrated with agriculture. This may be explained by the fact that integrated agriculture and aquaculture systems build on an increased recycling of nutrients and matter, and provide room for diversification of the outputs from existing sub-systems leading to an overall higher farm yield and income [14,50].
In addition to increasing the overall farm yield and economic benefits, IAA technology could play an important role in improving household food security and providing diversified livelihoods in Tanzania. For a farmer applying an integrated tilapia-amaranth system, tilapia can become an important source of animal protein and high quality essential fatty acids, particularly long-chain polyunsaturated fatty acids (LCPUFA) and micronutrients, that are in higher quantities in fish than terrestrial based animal food sources [51]. Amaranth also contains essential metabolites such as minerals, vitamins (especially A and C), coloring, aromatic and thickening agents, that are essential for human growth and wellbeing. Hence, well designed integrated systems could provide diversified nutritional crops, which could help in the fight against “hidden hunger,” a term that describes people who do not get enough vitamins, proteins, minerals, zinc, and iron [52].
The growing human population and accelerating urbanization has led to an increased food demand but also increased amounts of agricultural wastes [53]. These wastes are usually seen as a problem impacting on both human health and the environment, but could also, if properly processed, be used as feed input in animal and fish production, and thus improve food security among small scale farmers [54]. Systems that rely on recycled agricultural by-products and simple technology have been able to double production of small farms, and although this has been done from a very low base, it has had substantial impact on rural food security [10]. Water storage in fishponds can also play a critical role for farmers who are exposed to increased frequency of droughts following from climate change [13]. It is believed that the results from this study shows that a diversified production through integrated agriculture-aquaculture can improve the ecological sustainability and economic durability of farming in Tanzania.

4. Methodology

4.1. Study Design

Briefly, our study involved three stages as follows: (1) A fish feed experiment, where the fish were fed either the control diet (CD) through-out the experiment (183 days) or the amaranth diet (AD) for the first 100 days and then the control diet (CD) for the remaining 83 days; (2) An amaranth fertilization experiment (90 days after fish stocking), where amaranth plots were irrigated with either tap water or pond water from fish fed the amaranth diet, and treated with various fertilizers; (3) Analysis of growth performance, yield and economic benefits of pond and amaranth farming when practiced as an integrated system or as separate activities (Figure 7).

4.1.1. Fish and Facilities

The study was conducted at the Tanzania Fisheries Research Institute (TAFIRI) Dar es Salaam center using six (7 m2 with mean depth of 1 m) round concrete ponds for 183 days. The geographical location of the site is 6°39′51.57″ S and 39°12′45.32″ E, at an elevation of 10 m above sea level. The experiment was intentionally designed to reflect small scale fish famers in Dar es Salaam, who usually combine two or more ingredients as feed for the fish. Nile tilapia (Oreochromis niloticus) mono-sex fingerlings were obtained from a commercial local hatchery and stocked at 8 fish per m2.

4.1.2. Fish Feed Experiment

Amaranth wastes (AW), including both unsold and unused amaranth leaves, were collected from Tegeta vegetable market (about 3 km from the study site). AW was washed with tap water to remove sediments and then soaked in boiling water for 10 min to reduce the potential high contents of anti-nutritional factors, such as phytates, saponins and tannis [55]. AW was solar dried (under a shade) to a constant weight, powdered using a kitchen blender, and then stored in a refrigerator until use. The AW powder was used as an ingredient in fish diet at 10% inclusion for the experimental diet [31,56]. Other ingredients (shrimp meal, soybean, and rice bran) were grounded separately, using a hammer mill at a milling factory in Dar es Salaam. The resulting mash was weighed and mixed accordingly. The resulting composition was blended using warm water to form a dough and subsequently extruded into pellets using a meat mincer. The extruded pellets were solar dried under a shade until complete dryness for about three days, and then stored in a cold dry room until it was used. The pelleted sinking diets were hand-fed to fish by dispensing it at the surface of each pond.
The compositions of the control (CD) and experimental (AD) diets are shown in Table 1 and Table 2. The two diets were formulated targeting a 30% protein inclusion. Fish were fed at 5% of their body weight divided in two portions per day, one given in the morning (around 9.00 am) and one given in the evening (around 4.00 pm). The feeding rate was reduced to 3% when the average weight of the fish reached over 120 g. Two treatments in triplicates were applied as follows; (i) fish fed control feed (CD) without inclusion of the AW, hereafter referred to as non-integrated fish ponds (non-IAA fish) and (ii) fish fed AD diet, hereafter referred to as integrated fish ponds (IAA fish), as the pond water was also used to irrigate the amaranth plots. Fish in the IAA ponds were fed with experimental diet for the first 100 days and then shifted to the control feed (CD) for the remaining 83 days until the end of the experiment. This is because AW is only readily available during the dry season (July–October), which is the peak for amaranth production in Dar es Salaam.

4.1.3. Amaranth Irrigation and Fertilization Experiment

Amaranth farming was done during the dry season, three months after stocking of the fish, to allow nutrients to accumulate in the pond water and also to avoid the influence from rainfall on the amaranth growth. During this period, no water was exchanged in the fishponds, and water was only added to compensate for the loss of water through evaporation. After the amaranth culturing had finished, three quarters of the water volume in each tank were replaced once a month. Irrigation (5 liters per 1 m2) was done once a day during the evening. Water from the three IAA ponds was blended and randomly irrigated to the IAA amaranth plots. Pond water for irrigation was compensated by adding tap water to maintain the pond water level for both treatments. Eighteen amaranths (Amaranthus hybridus) plots of 2 × 2 m were prepared nearby the IAA ponds. The experiment involved three treatments in six replicates.
Treatments were applied as follows: (i) amaranth plots irrigated with tap water without fertilization, hereafter referred to as control amaranths, (ii) amaranth plots irrigated with water from the IAA fish ponds above, and with only organic fertilizer applied, hereafter referred to as integrated amaranth (IAA amaranth) and (iii) amaranth plots irrigated with tap water, and fertilized with a combination of organic and chemical fertilizers (a practice commonly used by farmers in Dar es Salaam), hereafter referred to as non-integrated amaranth (non-IAA amaranth).
Before sowing, both IAA and non-IAA amaranth plots were fertilized with broiler manure at a rate of 10 Kg per m2. Manure applications were done a week before to allow for proper mineralization [57]. Sowing was done by mixing 10 g of amaranth seeds with 1 kg of sand to obtain uniform stands, and then broadcasted at a rate of 1 g of seeds per m2 [45,58]. The first harvest was done 21 days after sowing, to remove mature leaves for sale and give space for young plants to grow to maturity. After the first harvest, urea (a booster fertilizer) was applied at a rate 1 g per m2 on the non-IAA amaranth plants. No additional chemical fertilizer was applied on the IAA amaranth plants, which only were irrigated with the water from the IAA fishpond until the final harvest, which was done after 33 days.

4.2. Chemical Analysis

The proximate analyses of the experimental feeds were done to determine the content of moisture, ash, crude protein, crude lipid, and crude fiber. Moisture content was obtained by oven drying of the fresh samples at 60 °C overnight [59]. The crude protein (N X625) was determined using a semi-micro Kjeldahl digestion followed by indophenol-blue colorimetric method [59,60]. The crude lipid was determined according to the procedures described by Bligh and Dyer [61]. The crude fiber was analyzed gravimetrically by acid hydrolysis followed by an alkali extraction method [59,62]. Briefly, 1 g of sample was weighed in in a Pyrex beaker and added in boiling sulfuric acid (1.25% v/v). The mixture was rinsed with boiling water to eliminate the acid and then added to 1.25% sodium hydroxide for extraction. The solution was separated from the fiber using a suction pump. The fiber was washed with hot water followed by oven drying at 105 °C for 3 h. The weight of fiber in the sample was then determined gravimetrically. The ash content was determined by incinerating the fresh samples in a muffle furnace at 550 °C for 2 h.
The concentrations of calcium and iron minerals in the AW were determined by the acid oxidation method according to Emteryd [60] and Girmshaw et al. [63]. This was done by dissolving 1 g of AW sample in a mixture of 1 mL perchloric acid (HClO4) and 5 mL of nitric acid (HNO3) in the ratio of 1:5. The mixture was digested at 120 °C until it became colorless and the volume was reduced to 1 mL. The concentrations of the individual minerals were determined using an atomic absorption spectrophotometer (AA240 Varian, USA).
The contents of Vitamins A and C in AW samples were determined according to the procedures described by Rutkowski and Grzegorczyk [64]. The concentrations were determined from a calibration curve prepared using a standard solution: hydrophilic complex of retinol acetate with cyclodextrane for vitamin A and L-ascorbic acid for Vitamin C. For the fish samples, the concentration of vitamins (B1, B2, B3 and B6) were determined by the procedures described by Rajput et al. [65]. In brief, the working solution for the standard vitamins and fish samples were prepared by dissolving a known weight of the standard vitamin in a known volume of diluent in a volumetric flask. Riboflavin, nicotinamide, pyridoxine hydrochloride, and cyanocobalamin were used as stock solutions. The absorbance of the stock solution, feed samples and the blank were then read at 430 nm for vitamin B1, 444 nm for vitamin B2, 450 nm for vitamin B3, and 650 nm for vitamin B6 using a UV-visible spectrophotometer (Jenway 6305).
Water samples from the fishponds and tap water were collected bimonthly. Soil samples were collected at the start and end of the experiment. Three soil samples in each plot were randomly collected to a depth of 20 cm. The three soil samples were then mixed to obtain homogenous samples, and stored in sealed plastic bags and sent to the laboratory. The samples were analysed for the concentration of total nitrogen (TN), total phosphorus (TP), nitrite (NO2), nitrate (NO3) and ammonia (NH3) using standard methods [66,67]. Water quality parameters (pH, dissolved oxygen (DO) and temperature) was measured twice a day in the morning and evening around 9.00 am and 4.00 pm respectively. Water pH was measured using a pH meter (model Combo H198129), dissolved oxygen (DO) and temperature measurements were taken using a multiprobe kit (model Ecosense DO 200A China).

4.3. Calculation of Fish Growth Performance and Yield

For the fish, data was collected at a monthly interval until the end of experiment when the ponds were drained completely to assess the fish growth performance, yield and economic returns. Fish growth performance was calculated using the following formula:
Average daily weight gain (g/fish) (ADG)
ADG   =   ( W 2   W 1 ) / T
where W1 = mean initial weight (g), W2 = mean final weight (g), and T = experimental period (days)
Specific growth rate (SGR):
SGR   = (   Ln   W 2 Ln   W 1 T ) × 100
where Ln = natural Logarithm, W1 = mean initial weight (g), and W2 = mean final weight (g)
  FCR   =   Dry   feed   intake   ( g )   Live   weight   gain   ( g )
where FCR = feed conversion ratio.
PER   =   Live   weight   gain   ( g )   Protein   intake   ( g )
where PER = protein efficiency ratio.
SR =   NH NS × 100
where: SR = survival rate, NH = number of fish harvested, NS = number of fish stocked.
CF =   100 W ( g ) L 3 ( cm )
where CF = condition factor, W = body weight, and L = total length.
Yield =   TW ( Kg ) A ( ha )
where TW = total weight of the fish harvested, A = pond area.

4.4. Estimation of Amaranth Growth and Yield

For the amaranths, sampling was done 21 and 33 days after sowing (when marketable size had been achieved). In both cases sampling was carried out between 6 and 8 am in the morning. Sampling was done by harvesting an area of 30 × 30 cm in three different locations of a 4 m2 plot in each of the three different treatments. The above ground biomass of each sample was cleaned using a wet towel before weighing to obtain the yield. Twenty individual amaranth plants from each treatment were randomly sampled to assess growth performance in terms of shoot-root relationship.

4.5. Economic Return

A partial enterprises budget was used to assess the financial performance of the different farming systems when farmed as standalone activities and when farmed in integration. The input costs included pond construction (based on estimates by AMISODAGO, a fish pond construction consultancy), fish fingerlings, fish feeds, amaranth seed, manure, equipment, labour, transport (based on prevailing market price in Dar es Salaam), and water (according to DAWASA, Dar es Salaam Water and Sewerage Authority).
Except for amaranth waste (AW), that was obtained free of charge from the vegetable market, other dry ingredients were purchased from local suppliers at a cost of (USD/Kg): 1.09, 0.43, 0.13 and 0.22 for shrimp meal (Cardina nilotica), soya bean, rice bran and binder (cassava flour) respectively. The value of the fish and amaranth harvests were estimated from the prevailing market prices at Kunduchi in Dar es Salaam (Table 7). A US dollar exchange rate (at 2300 Tsh, December 2018), was used for the budget analysis.
Net farm income was calculated as follows:
NR = TR − TC
TR = PQ
BCR = TR/TC
where NR = net return, TR = total revenue, TC = total cost, BCR = benefit cost ratio, p = unit price of output, and Q = total quantity of output.

4.6. Statistical Analysis

Data was tested for normal distribution and homogeneity of variance using Shapiro-Wilk and Levene’s tests respectively. When homogeneity of variances was confirmed, t test was used to test the differences between experimental and control diets. Analysis of variance (ANOVA) was used to test for significant differences in growth performance, yield, and economic returns between IAA and non-IAA farming systems. When significant differences were detected, the Tukey post-hoc test was used to determine specific significant differences among farming systems. Statistical analysis was performed using excel 2016 and SPSS version 20.

5. Conclusions

In conclusion, the results of the present study suggest that amaranth wastes, which are in surplus during the dry season in Dar es salaam, can be used as a tilapia feed ingredient without comprising the fish growth. Compared to other ingredients, amaranths contain high quantities of protein, lipid, mineral, and vitamin with higher nutrient values than found in for example rice bran. These properties may have improved the feed utilization and the nutritional value of the cultured fish. Further, our study demonstrates that fish farmers can replace chemical fertilizer with nutrient rich pond water without affecting amaranth growth and yield. Our results also show that the integration of amaranth with tilapia is significantly more beneficial than when these subsystems are operated separately. With these findings, we suggest further studies using fresh vegetables as feed in fish farming, a practice commonly done by a number of rural fish farmers, but lacking scientific studies showing its implication on fish farming in Tanzania. We encourage farmers in Dar es Salaam to integrate fish and vegetable farming as a way to improve their farm productivity, household nutrition and income.

Author Contributions

Conceptualization, visualization, investigation, collected data, analyzed data, and writing original draft, D.P.M.; Conceptualization, analysed data, reviewed and edited the manuscript, H.B.; investigation, reviewed and edited the manuscript, T.L.; All authors have read and agreed to the published version of the manuscript.

Funding

This work was supported by the Institute of Marine Sciences, University of Dar es Salaam, through the Swedish International Cooperation Agency (Sida) Bilateral Marine Science Program [grant No. 51170071].

Acknowledgments

We are thankful to Tanzania Fisheries Research Institute (TAFIRI), Dar es Salaam Centre for providing a space and infrastructures for this study. We are also grateful to Charles Kweyunga from the Department of Botany University of Dar es Salaam for the technical assistance during the laboratory analysis. Three anonymous reviewers provided valuable comments.

Conflicts of Interest

The authors declare no conflict of interest.

References

  1. FAO. The Future of Food and Agriculture—Trends and Challenges; FAO: Rome, Italy, 2017. [Google Scholar]
  2. Van der Heijden, P.G.M.; Shoko, A.P. Review and Analysis of Small-Scale Aquaculture Production in East Africa. Part 3: Tanzania; Wageningen Centre for Development Innovation: Wageningen, The Netherlands, 2018. [Google Scholar]
  3. NEPAD. What is needed to realise the full economic potential of Africa’s fish resources? In The Pan-African Fisheries and Aquaculture Policy Framework and Reform Strategy: The Benefits of Fish-Resource Exploitation in Africa; NPCA, AU-IBAR: Midrand, South Africa, 2016. [Google Scholar]
  4. FAO. The State of World Fisheries and Aquaculture 2018—Meeting the Sustainable Development Goals; FAO: Rome, Italy, 2018. [Google Scholar]
  5. Chan, C.Y.; Tran, N.; Pethiyagoda, S.; Crissman, C.C.; Sulser, T.B.; Phillips, M.J. Prospects and challenges of fish for food security in Africa. Glob. Food Secur. 2019, 20, 17–25. [Google Scholar] [CrossRef]
  6. Bostock, J.; McAndrew, B.; Richards, R.; Jauncey, K.; Telfer, T.; Lorenzen, K.; Little, D.; Ross, L.; Handisyde, N.; Gatward, I.; et al. Aquaculture: Global status and trends. Philos. Trans. R. Soc. B 2010, 365, 2897–2912. [Google Scholar] [CrossRef] [PubMed]
  7. Kumar, G.; Engle, C.R. Technological advances that led to growth of shrimp, salmon, and tilapia farming. Rev. Fish. Sci. Aquac. 2015, 24, 136–152. [Google Scholar] [CrossRef]
  8. FAO. FAO Inland Water Resources and Aquaculture Service. Review of the State of World Aquaculture; FAO: Rome, Italy, 1999; p. 95. [Google Scholar]
  9. Mulokozi, D.P.; Mmanda, F.P.; Onyango, P.; Lundh, T.; Berg, H. Rural aquaculture: Assessment of its contribution to household income and farmers’ perception in selected districts, Tanzania. Aquac. Econ. Manag. 2020, 1–19. [Google Scholar] [CrossRef]
  10. Brummett, R.E.; Lazard, J.; Moehl, J. African aquaculture: Realizing the potential. Food Policy 2008, 33, 371–385. [Google Scholar] [CrossRef]
  11. Nagoli, J.; Valeta, J.; Kapute, F. Analysis of bio-resource utilization in integrated agriculture-aquaculture farming systems in Zomba district, Southern Malawi. Malawi J. Aquac. Fish. 2013, 2, 15–19. [Google Scholar]
  12. Limbu, S.M.; Shoko, P.A.; Lamtane, M.H.; Kishe-Machumu, M.A.; Mbonde, A.S.; Mgana, H.F.; Mgaya, Y.D. Fish polyculture systems integrated with vegetable improves yield and economic benefits on small scale farmers. Aquac. Res. 2017, 48, 3631–3644. [Google Scholar] [CrossRef]
  13. Shoko, A.P.; Limbu, S.M.; Lamtane, H.A.; Kishe-Machumu, M.A.; Sekadende, B.; Ulotu, E.E.; Masanja, J.C.; Mgaya, Y.D. The role of fish-poultry integration on fish growth performance, yields and economic benefits among smallholder farmers in sub-Saharan Africa, Tanzania. Afr. J. Aquat. Sci. 2019, 44, 15–24. [Google Scholar] [CrossRef]
  14. Prein, M. Integration of aquaculture into crop-animal system in Asia. Agric. Syst. 2002, 71, 127–146. [Google Scholar] [CrossRef]
  15. Karim, M.; Little, D.C.; Kabir, M.S.; Verdegem, M.J.C.; Telfer, T.; Wahab, M.A. Enhancing benefits from polycultures including tilapia (Oreochromis niloticus) within integrated pond-dike systems: A participatory trial with households of varying socio-economic level in rural and peri-urban areas of Bangladesh. Aquaculture 2011, 314, 225–235. [Google Scholar] [CrossRef]
  16. Huong, N.V.; Cuong, T.H.; Thu, T.T.G.; Lebailly, P. Efficiency of different integrated agriculture aquaculture systems in the Red River Delta of Vietnam. Sustainability 2018, 10, 493. [Google Scholar] [CrossRef] [Green Version]
  17. Dey, M.M.; Prein, M. Increasing and Sustaining the Productivity of Fish and Rice in the Flood-Prone Ecosystem in South and Southeast Asia. Final Report to IFAD; WorldFish Centre: Pnang, Malaysia, 2002; pp. 1–94. [Google Scholar]
  18. Dey, M.M.; Paraguas, F.J.; Kambewa, P.; Pemsl, D.E. The impact of integrated aquaculture–agriculture on small-scale farms in Southern Malawi. Agric. Econ. 2009, 41, 67–79. [Google Scholar] [CrossRef]
  19. Olasantan, F.O. Vegetable production in tropical Africa: Status and strategies for sustainable management. J. Sustain. Agric. 2007, 30, 41–70. [Google Scholar] [CrossRef]
  20. Putter, H.; Koesveld, M.J.; Visser, C.L.M. Overview of the Vegetable Sector in Tanzania. AfriVeg Report; Wageningen University and Research: Wageningen, The Netherlands, 2007. [Google Scholar]
  21. Rastogi, A.; Shukla, S. Amaranth: A new millennium crop of nutraceutical values. Crit. Rev. Food Sci. Nutr. 2010, 53, 109–125. [Google Scholar] [CrossRef]
  22. Achigan-Dako, E.G.; Sogbohossou, O.E.D.; Maundu, P. Current knowledge on Amaranthus spp.: Research avenues for improved nutritional value and yield in leafy amaranths in sub-Saharan Africa. Euphytica 2014, 197, 303–317. [Google Scholar] [CrossRef]
  23. Ramdwar, M.N.; Chadee, S.T.; Stoute, V.A. Estimating the potential consumption level of amaranth for food security initiatives in Trinidad, West Indies. Cogent Food Agric. 2017, 3, 1321475. [Google Scholar] [CrossRef]
  24. Shukla, S.; Bhargava, A.; Chatterjee, A.; Pandey, A.C.; Mishra, B. Diversity in phenotypic and nutritional traits in vegetable amaranth (Amaranthus tricolor), a nutritionally underutilized crop. J. Sci. Food Agric. 2010, 90, 139–144. [Google Scholar] [CrossRef]
  25. Neudeck, L.; Avelino, L.; Bareetseng, P.; Ngwenya, B.N.; Demel, T.; Motsholapheko, M.R. The contribution of edible wild plants to food security, dietary, diversity and income of households in Shorobe village, Northern Botswana. Ethnobot. Res. Appl. 2012, 10, 449–462. [Google Scholar]
  26. Spilioti, E.; Holmbom, B.; Papavassiliou, A.G.; Moutsatsou, P. Lignans 7-hydroxymatairesinol and 7-hydroxymatairesinol 2 exhibit anti-inflammatory activity in human aortic endothelial cells. Mol. Nutr. Food Res. 2013, 58, 749–759. [Google Scholar] [CrossRef]
  27. Alvarez-Jubete, L.; Arendt, E.K.; Gallagher, E. Nutritive value of pseudo-cereals and their increasing use as functional gluten-free ingredients. Trends Food Sci. Technol. 2009, 21, 106–113. [Google Scholar] [CrossRef]
  28. Vassiliou, V.; Charalambides, M.; Menicou, M.; Chartosia, N.; Tzen, E.; Evagelos, B.; Papadopoulos, P.; Loucaides, A. Aquaculture and feed management system powered by renewable energy sources: Investment justification. Aquac. Econ. Manag. 2015, 19, 423–443. [Google Scholar] [CrossRef]
  29. Rana, K.J.; Siriwardena, S.; Hasan, M.R. Impact of Rising Feed Ingredient Prices on Aquafeeds and Aquaculture Production; FAO: Rome, Italy, 2009; p. 63. [Google Scholar]
  30. Poot-López, G.R.; Hernández, J.M.; Gasca-Leyva, E.U. Input management in integrated agriculture—Aquaculture systems in Yucatan: Tree spinach leaves as a dietary supplement in tilapia culture. Agric. Syst. 2009, 103, 98–104. [Google Scholar] [CrossRef]
  31. Molina-Poveda, C.; Cardenas, R.; Jover, M. Evaluation of amaranth (Amaranthus caudatus L.) and quinoa (Chenopodium quinoa) protein sources as partial substitutes for fish meal in Litopenaeus vannamei grow-out diets. Aquac. Res. 2017, 48, 822–835. [Google Scholar] [CrossRef]
  32. Mwaijande, F.A.; Lugendo, P. Fish-farming value chain analysis: Policy implications for transformations and robust growth in Tanzania. J. Rural Community Dev. 2015, 10, 47–62. [Google Scholar]
  33. Mmanda, F.P.; Mulokozi, D.P.; Lindberg, J.E.; Haldén, A.N.; Mtolera, M.; Kitula, R.; Lundh, T. Fish farming in Tanzania: The availability and nutritive value of local feed ingredients. J. Appl. Aquac. 2020, 1–20. [Google Scholar] [CrossRef] [Green Version]
  34. National Research Council (NRC). Nutritional Requirements of Fish; National Academy Press: Washington, DC, USA, 1993; p. 114.
  35. Ngugi, C.; Oyoo-Okoth, E.; Manyala, J.O.; Fitzsimmons, K.; Kimotho, A. Characterization of the nutritional quality of amaranth leaf protein concentrates and suitability of fish meal replacement in Nile tilapia feeds. Aquac. Rep. 2017, 5, 62–69. [Google Scholar] [CrossRef]
  36. Verdal, H.; Komen, H.; Edwige, Q.; Chatain, B.; Allal, F.; Benzie, J.A.H.; Vandeputte, M. Improving feed efficiency in fish using selective breeding: A review. Rev. Aquac. 2018, 10, 833–851. [Google Scholar] [CrossRef]
  37. Li, M.H.; Oberle, D.F.; Lucas, P.M. Effects of dietary fiber concentrations supplied by corn bran on feed intake, growth, and feed efficiency of channel catfish. N. Am. J. Aquac. 2012, 74, 148–153. [Google Scholar] [CrossRef]
  38. Liti, D.M.; Waidbancher, H.; Straif, M.; Mbaluka, R.K.; Munguti, J.M.; Kyenze, M.M. Effects of partial and complete replacement of freshwater shrimp meal (Caridinea niloticus Roux) with a mixture of plant protein sources on growth performance of Nile tilapia (Oreochromis niloticus L.) in fertilized ponds. Aquac. Res. 2006, 37, 477–483. [Google Scholar] [CrossRef]
  39. Munguti, J.; Charo-Karisa, H.; Opiyo, M.A.; Ogello, E.O.; Marijani, E.; Nzayisenga, L.; Liti, D. Nutritive value and availability of commonly used feed ingredients for farmed Nile tilapia (Oreochromis niloticus L.) and African catfish (Clarias gariepinus, Burchell) in Kenya, Rwanda and Tanzania. Afr. J. Food Agric. Nutr. Dev. 2012, 12, 6135–6155. [Google Scholar]
  40. Toma, N.I.; Mohiuddin, M.; Alam, M.S.; Suravi, M.M. An economic study of small-scale tilapia fish farming in Mymensingh district of Bangladesh. J. Agric. Econ. Rural Dev. 2015, 2, 50–53. [Google Scholar]
  41. Chenyambuga, S.W.; Mwandya, A.; Lamtane, H.A.; Madalla, N.A. Productivity and marketing of Nile tilapia (Oreochromis niloticus) cultured in ponds of small-scale farmers in Mvomero and Mbarali districts, Tanzania. Livest. Res. Rural Dev. 2014, 26, 3–12. [Google Scholar]
  42. Shoko, A.P.; Mwayuli, G.G.; Mgaya, Y.D. Growth performance, yields and economic benefits of Nile tilapia Oreochromis niloticus and kales Brassica oleracea cultured under vegetable-fish culture integration. Tanzan. J. Sci. 2011, 37, 37–48. [Google Scholar]
  43. Andrews, A.; Sprent, J.; Raven, A.; Eady, P.E. Relationships between shoot and root, growth and leaf soluble Triticum aestivum under different nutrient deficiencies. Plant Cell Environ. 1999, 22, 949–958. [Google Scholar] [CrossRef]
  44. Ribeiro, J.E.M.M.; Combrink, N.J.J. Amaranthus tricolor L. leaf yields affected by salinity, harvesting stage and harvesting methods. S. Afr. J. Plant Soil 2006, 23, 29–37. [Google Scholar] [CrossRef]
  45. Baitilwake, M.A.; De Bolle, S.; Salomez, J.; Mrema, J.P.; De Neve, S. Effect of organic fertilizers on nitrate accumulation in vegetables and mineral nitrogen in tropical soils of Morogoro, Tanzania. Exp. Agric. 2012, 48, 111–126. [Google Scholar] [CrossRef]
  46. Mulandana, N.S.; Mamadi, N.E.; Du-Plooy, C.P.; Beletse, Y.G. Effect of spacing and transplanting time on amaranths yield. Afr. Crop Sci. Conf. Proc. 2009, 9, 243–246. [Google Scholar]
  47. Savci, S. Investigation of effect of chemical fertilizers on environment. APCBEE Procedia 2012, 1, 287–292. [Google Scholar] [CrossRef] [Green Version]
  48. Mathia, W.M.; Fotedar, R. Evaluation of boiled taro leaves, Colocasia esculenta (L.) Schott, as a freshwater shrimp, Caridina nilotica Roux protein replacement, in diets of Nile tilapia, Oreochromis niloticus (Linnaeus). Aquaculture 2012, 356, 302–309. [Google Scholar] [CrossRef]
  49. Swain, S.; Shyama, S.; Dinesh, K.; Sreenath, V.R.; Golanda, A. Exploring the possibility of dietary inclusion of vegetable waste in the feed of Nile Tilapia, Oreochromis niloticus. Res. J. Recent Sci. 2015, 4, 8–13. [Google Scholar]
  50. Tipraqsa, P.; Craswell, E.T.; Noble, A.D.; Schmidt-Vogt, D. Resource integration for multiple benefits: Multifunctionality of integrated farming systems in Northeast Thailand. Agric. Syst. 2007, 94, 694–703. [Google Scholar] [CrossRef]
  51. Kawarazuka, N.; Béné, C. The potential role of small fish species in improving micronutrient deficiencies in developing countries: Building evidence. Public Health Nutr. 2011, 14, 1927–1938. [Google Scholar] [CrossRef] [Green Version]
  52. Olasantan, F.O. Tropical vegetables and spices: Potential value and contributions to sustainable agriculture in Nigeria. Outlook Agric. 2001, 30, 55–67. [Google Scholar] [CrossRef]
  53. Sabiiti, E.N. Utilizing agricultural wastes to enhance food security and conserve the environment. Afr. J. Food Agric. Nutr. Dev. 2011, 11, 1–6. [Google Scholar]
  54. Oribhabor, B.J.; Ansa, E.J. Organic waste reclamation, recycling and re-use in integrated fish farming in the Niger Delta. J. Appl. Sci. Environ. Manag. 2006, 10, 47–53. [Google Scholar] [CrossRef] [Green Version]
  55. Mosha, T.C.; Gaga, H.E.; Pace, R.D.; Laswai, H.S.; Mtebe, K. Effect of blanching on the content of antinutritional factors in selected vegetables. Plant Foods Hum. Nutr. 1995, 47, 361–367. [Google Scholar] [CrossRef] [PubMed]
  56. Adewolu, M.A.; Adamson, A.A. Amaranthus spinosus leaf meal as potential dietary protein source in the practical diets for Clarias gariepinus (Burhell, 1822) fingerlings. Int. J. Zool. Res. 2011, 7, 128–137. [Google Scholar] [CrossRef] [Green Version]
  57. Dada, O.A.; Francis, I.; Anifowose, E.M. Growth and proximate composition of Amaranthus cruentus L on poor soil amended with compost and arbuscular mycorrhiza fungi. Int. J. Recycl. Org. Waste Agric. 2017, 6, 195–202. [Google Scholar] [CrossRef] [Green Version]
  58. Palada, M.C.; Chang, L.C. Suggested Cultural Practices for Vegetable Amaranth. In International Cooperator’s Guide; AVRDC: Tainan, Taiwan, 2003; pp. 1–4. [Google Scholar]
  59. Quarmby, C.; Allen, S.E. Organic constituents. In Chemical Analysis of Ecological Materials; Blackwell Scientific Publications: Oxford, UK; Boston, MA, USA, 1989; pp. 160–199. [Google Scholar]
  60. Emteryd, O. Chemical and Physical Analysis of Inorganic Nutrients in Plant, Soil, Water and Air; Swedish University of Agricultural Sciences, Department of Forest Site Research: Uppsala, Sweden, 1989. [Google Scholar]
  61. Bligh, E.G.; Dyer, W.J. A rapid method of total lipid extraction and purification. Can. J. Biochem. Physiol. 1959, 37, 911–917. [Google Scholar] [CrossRef] [PubMed] [Green Version]
  62. AOAC. Official Methods of Analysis of the Official Association of Analytical Chemists, 16th ed.; AOAC Arlington: Washington, DC, USA, 1999. [Google Scholar]
  63. Girmshaw, H.M.; Allen, S.E.; Parkinson, J. Nutrient elements. In Chemical Analysis of Ecological Materials, 2nd ed.; Blackwell Scientific Publications: Oxford, UK; Boston, MA, USA, 1989; pp. 81–159. [Google Scholar]
  64. Rutkowski, M.; Grzegorczyk, K. Modifications of spectrophotometric methods for antioxidative vitamins determination convenient in analytic practice. Acta Sci. Pol. Technol. Aliment. 2007, 6, 17–28. [Google Scholar]
  65. Rajput, G.K.; Kumar, A.; Kumar, A.; Srivastav, G. To develop a simple (UV-Vis spectrometric) method for the estimation of water-soluble vitamins. Int. J. Drug Res. 2011, 2, 232–239. [Google Scholar]
  66. Boyd, C.E.; Tucker, C.S. Pond Aquaculture Water Quality Management; Kluwer Academic Publishers: Norwell, MA, USA, 1998. [Google Scholar]
  67. APHA. Standard Methods for Examination of Water and Wastewater, 21st ed.; American Public Health Association; American Water Works Association; Water Pollution Control Federation: New York, NY, USA, 2005. [Google Scholar]
Figure 1. Growth curve for Oreochromis niloticus under different dietary treatments (AD, formulation with AW inclusion fed to fish for the first 100 days; CD, control diet without AW inclusion).
Fishes 05 00030 g001
Figure 2. Amaranth yield under different farming systems and harvesting periods (bars with different letters are significantly different, p < 0.05). (Bars represent means ± SE).
Fishes 05 00030 g002
Figure 3. Amaranth growth performance as shoot-root ratio (S:R) under IAA and non-IAA farming systems (bars with different letters are significantly different, p < 0.05). (Bars represent means ± SE).
Fishes 05 00030 g003
Figure 4. The Effect of supplementing the fish feed with AW on the feed cost between CD and AD diets (bars with different letters are significantly different, p < 0.05). (Bars represent means ± SE).
Fishes 05 00030 g004
Figure 5. Economic analysis for fish and amaranths grown as separate systems or as an integrated system (within each group, bars with different letters are significantly different, p < 0.05). (Bars represent means ± SE).
Fishes 05 00030 g005
Figure 6. Benefit cost ratio of tilapia and amaranth farming when conducted as integrated and non-integrated farming (bars with different letters are significantly different, p < 0.05). (Bars represent means ± SE).
Fishes 05 00030 g006
Figure 7. Schematic representation of the study design.
Fishes 05 00030 g007
Table 1. Proximate composition (g/Kg DM) of the ingredients used in the experimental diets to tilapia cultured in ponds.
IngredientDMCPCLCFAsh
Fish meal894.1473.884.922.753.7
Soybean meal891.4356.517.930.653.8
Rice bran920.063.437.3274.2202.3
Amaranth899.0170.165.572.366.9
DM stands for dry matter, CP for crude protein, CL for crude lipid and CF for crude fibre.
Table 2. Composition of the fish control diet (CD) and the diet with AW inclusion (AD) and the total cost to produce 1 kg of each feed.
Ingredients (g/kg)Control Diet (CD)Amaranth Diet (AD)
Shrimp meal a300250
Rice bran380330
Soya bean300300
Binder (cassava flour)2020
Amaranths0100
Total10001000
Feed cost (US $/Kg) b0.510.45
Proximate composition (g/kg DM)
Dry matter902.9898.5
Crude protein274.8268.9
Crude lipid44.938.7
Crude fibre117.5102.7
Ash107.5100.8
Nitrogen free extract NFE c310.8387.5
Gross Energy GE (MJ/Kg) d13.614.5
Notes: a Freshwater shrimp (Cardina nilotica), obtained locally. b Feed cost was calculated by including 25% processing costs of the ingredients. c Nitrogen free extract = 100 − (moisture content + crude protein + crude lipid + ash + fiber). d Gross energy calculated according to NRC [34] using the values of 23.6, 39.5 and 17.2 kJ/g for crude protein, lipid and total carbohydrates respectively.
Table 3. Concentrations of some vitamins, anti-nutritional factors and minerals in AW products used in the experimental diet for tilapia.
ParameterComposition (mg/100 g)
Vitamins
Vitamin A2.18
Vitamin C25.72
Anti-nutritional factors
Tannin0.55
Saponins1.20
Minerals
Fe3+9.37
Ca2+130.19
Table 4. Growth performance and yield of tilapia fed on control (CD) and experimental (AD) diets (mean ± SE).
Diet Statistics
ParameterCDADtp
Initial weight (g)5.71 ± 0.185.33 ± 0.092.67p = 0.50
Initial length (cm)6.09 ± 0.495.8 ± 0.733.14p = 0.25
Final length (cm)25.73 ± 1.1625.3 ± 1.442.98p = 0.87
Final weight (g)242.33 ± 3.92235 ± 2.741.37p = 0.24
Weight gain (g)236.28 ± 3.18229.88 ± 2.381.73p = 0.33
Daily weight gain (g/day)1.28 ± 2.101.24 ± 0.011.59p = 0.21
Specific growth ratio (SGR, % day−1)2.04 ± 0.022.06 ± 0.010.75p = 0.39
Feed intake per fish (g)428.43 ± 6.74369.76 ± 5.6343.15p < 0.01
Daily feed intake per fish (g)2.31 ± 0.661.99 ± 0.706.67p < 0.01
Food conversion ratio (FCR)1.82 ± 0.031.61 ± 0.0227.73p < 0.01
Protein efficiency ratio (PER)1.84 ± 0.032.07 ± 0.0327.61p < 0.01
Survival (%)88.04 ± 2.1185.01 ± 1.35.37p = 0.78
Condition Factor1.43 ± 0.051.45 ± 0.050.04p = 0.84
Yield;
Kg/pond12.4 ± 0.4011.2 ± 2.460.49p = 0.81
Kg/ha/183 days17720 ± 56716914 ± 3720.46p = 0.84
Table 5. Concentration of dissolved oxygen (DO), temperature and pH values in IAA and non-IAA fish ponds during the experimental period (mean ± SE).
TreatmentDissolved Oxygen (mg/L)Temperature (°C)pH
Non IAA fish pond4.71 ± 0.2627.75 ± 1.217.52 ± 0.17
IAA fish pond4.97 ± 0.2427.56 ± 1.187.56 ± 0.43
Table 6. Water and soil nutrient concentration (mg/L) in tap water and in water from IAA and non-IAA fish ponds (mean ± SE).
Water SamplesNO2NO3NH4TNPO4TP
Tap water ND0.00 ± 0.00 aND0.87 ± 0.11 a0.04 ± 0.01 a0.24 ± 0.03 a
IAA pond0.31 ± 0.01 a1.93 ± 0.21 b0.96 ± 0.12 b3.08 ± 0.36 b0.08 ± 0.01 b1.86 ± 0.26 b
Non-IAA pond0.38 ± 0.01 a2.01 ± 0.16 b1.03 ± 0.11 b3.28 ± 0.27 b0.06 ± 0.01 b1.48 ± 0.21 b
Soil Samples
Before experiment0.02 ± 0.01 a0.45 ± 0.03 a0.31 ± 0.01 a,b0.14 ± 0.00 a0.02 ± 0.00 a0.46 ± 0.03 a
Control plots0.01 ± 0.00 a0.32 ± 0.02 a0.22 ± 0.01 a0.67 ± 0.03 b0.01 ± 0.00 a0.28 ± 0.04 a
IAA plots0.03 ± 0.00 b1.23 ± 0.06 b0.35 ± 0.02 b1.85 ± 0.19 c0.03 ± 0.02 a0.82 ± 0.06 a
Non-IAA plots0.03 ± 0.01 b1.19 ± 0.04 b0.31 ± 0.03 a,b1.75 ± 0.04 d0.02 ± 0.0 a0.71 ± 0.03 a
Column with different letters differ significantly, p < 0.05. ND—not detected.
Table 7. Input information used for the partial enterprise budget analysis.
ExpenditureDescriptionCost (US $per pond/plot)
Fish pond construction@US $130 for 30-year depreciation period4.33
Labor in fish farming@US $0.24 per h for 15 person-h3.60
Water in fish farming@US $0.43 per unit for 7 m33.01
Fish seed@US $0.13 per fingering stocked at 56 fish7.28
Transport in fish farming@US $0.21 per month, for six months1.26
Amaranth seed cost@US $3.47 per kg, 20 g per plot (20 g× US $3.47/1000 g)0.07
Transport in amaranth farming@US $0.21 per month, for six months1.26
Amaranth seed cost@US $3.47 per kg, 20 g per plot (20 g× US $3.47/1000 g)0.07
Water in amaranth farming@10 liters per day for 33 days @US $0.43/m3 water0.14
Labor in amaranth farming@US $0.38 h for 3.85 person-h1.45
Chemical fertilizer@4 g per plot @ US $2.17/kg0.01
Manure@5 kg/m2 @ US $1.3/10 kg2.6
Equipment (hoe and bucket)@US $0.13590.14
Income:
Fish selling price@US $3.5 per kg
Amaranth selling price@US $0.74 per kg

