Article

Establishment of a Simplified System to Evaluate Salinity Preference and Validation of Behavioral Salinity Selection in the Japanese Medaka, Oryzias latipes

by
Hiroshi Miyanishi
* and
Katsuhisa Uchida
Department of Marine Biology and Environmental Sciences, Faculty of Agriculture, University of Miyazaki, Miyazaki 889-2192, Japan
*
Author to whom correspondence should be addressed.
Submission received: 24 February 2021 / Revised: 5 April 2021 / Accepted: 21 April 2021 / Published: 28 April 2021

Abstract

:
In fishes, it is necessary to select a salinity environment suitable for survival. However, little is known about the mechanisms regarding detection and selection of salinity environments in fish. This study involved the establishment of a simple aquarium system in which fish can swim between freshwater (FW) and seawater (SW) in a single tank. In this tank, the lower level contained SW, the upper level contained FW, and the FW and SW levels were clearly separated as different salinity areas. Behavioral experiments of salinity environment selection using this simplified system to evaluate salinity preference showed that FW-acclimated medakas preferred FW to SW. In contrast, SW-acclimated medakas preferred SW to FW. These results indicate that euryhaline medakas prefer the saline habitats to which they are acclimated, when able to select the salinity environment. We identified the taste receptor type-2 and polycystic kidney disease 2-like 1 genes as possibly related to high-salinity taste in medaka. The expression of these genes increased at certain time points after SW challenges. In this study, we established an aquarium system to facilitate a simple experiment for salinity preference. Our results suggest that the medaka is good model for research related to seawater environment selection in fish.

1. Introduction

Aquatic environments exhibit major differences in terms of salinity; these environments include freshwater (FW), brackish water, and seawater (SW). FW is a hypoosmotic environment, with an osmotic pressure of approximately 1–50 mOsm/kg. SW is a hyperosmotic environment, at approximately 1000 mOsm/kg. In teleost fish species, body fluid osmolality is maintained at approximately one third of that of SW (approximately 300 mOsm/kg) in both FW and SW environments [1,2,3,4]. Unlike terrestrial animals, aquatic animals live with their bodies in constant contact with water. Water and ions move passively through their body surfaces, depending on osmotic differences and concentration gradients. As such, fish species have developed specific osmoregulatory mechanisms to compensate for the effects of the ambient osmotic pressure. In FW environments, which are hypoosmotic, the osmotic difference between the body and the external environment causes water to flow into the body, whereas the ion concentration gradient causes ions to flow out from the body. Fish living in FW environments adapt by using the main osmoregulatory organs, the gills, kidneys, and intestines, to maintain bodily fluid osmolarity within the physiological range. Contrastingly, in hyperosmotic SW environments, the body becomes dehydrated and inflow of ions occurs. Fish living in SW must consume SW to maintain hydration. In order for the intestines of these fish to absorb water, Na+ and Cl ions primarily must be absorbed into the body, and the osmotic pressure in the intestines must be lower than that of body fluids. Excess Na+ and Cl ions in the body fluid are actively excreted via ionocytes in the gills [3,5]. Euryhaline fish can survive in both FW and SW environments. However, not all fish have this ability to adapt to FW or SW environments. Fish species that can survive only in a limited environment are referred to as stenohaline fish. Goldfish and zebrafish are FW stenohaline fish that cannot survive in hyperosmotic environments [3]. Diadromous fish species, such as salmon and eels, are euryhaline fish that utilize both FW and SW environments during their lifecycles. The European seabass, an amphidromous fish, is a euryhaline marine teleost species whose juveniles and adults tolerate a wide range of salinities [6]. Although its primary habitat is FW, the Japanese medaka (Oryzias latipes) is a euryhaline fish species that can adapt to both FW and SW environments. This species cannot survive a direct transfer from FW to SW; however, it can become acclimated to SW by exposure to diluted SW over several days [7,8]. Anadromous salmon do not always possess the ability to adapt to SW environments either. In fact, smoltification is an essential process for downstream migration in this species that enables adaptation to hyperosmotic SW. Hypoosmoregulatory ability and salinity preference increase in juvenile salmonids during smoltification [9,10]. As such, in salmonids, maladaptable salinity conditions for fish exist depending on developmental stages [11]. Therefore, selection between different salinity environments, such as FW and SW, is thought to be essential to the survival of fish species. Although salinity selection experiments using intracerebroventricular hormone administration have been attempted using rainbow trout, no evidence has been found regarding induction of descent and high-salt preference [12]. The mechanisms of salinity sensing and behavioral selection remain poorly understood. Osmosensing is the physiological process of perceiving a change in environmental salinity. Many factors have been reported to be involved in osmosensing, such as OSTF1 [13,14]. However, little is known about the influence of these osmosensory factors on fish behavior and salinity environment selection via neural pathways. The taste system is one of the important senses in vertebrates. In fish, taste receptors and a number of signal transduction molecules have been identified [15,16]. The neurons linked to taste bud cells connect to multiple areas of the brain [17]. The mechanism of high-salt taste perception in mammals has been clarified because of recent research. The response to inducible NaCl is received by epithelial cells expressing the epithelial sodium channel (enac) gene in taste buds [18]. It was further revealed that high salt concentrations stimulate, in addition to ENaC, the expression of the polycystic kidney disease 2-like 1 (pkd2l1) gene by sour taste receptor cells, as well as the expression of taste receptor type-2 (t2r) proteins by bitter taste receptor cells, via two basic taste aversion pathways [19]. In fish, the mechanisms of high-salt taste receptivity remain unclear. In teleost fish, the enac gene is absent and has not yet been identified [20]. Therefore, we focused on t2r and pkd2l1 in this study.
In previous reports, some systems for salinity preference experiments were established [12,21]. In this study, we first established a simplified aquarium system enabling switching between FW and SW in a single tank, using a salt wedge placed between layers of FW and SW to facilitate salinity preference experiments. Behavioral experiments of salt selection in FW- and SW-acclimated Japanese medakas were then conducted to evaluate salt selection in this system. Furthermore, the t2r and pkd2l1 genes, which are involved in detecting high sodium levels in mammals, were identified, and changes in gene expression occurring during the transfer from FW to SW were examined to obtain basic information regarding the relationship between detection of high sodium levels and salinity preference in the fish.

2. Results

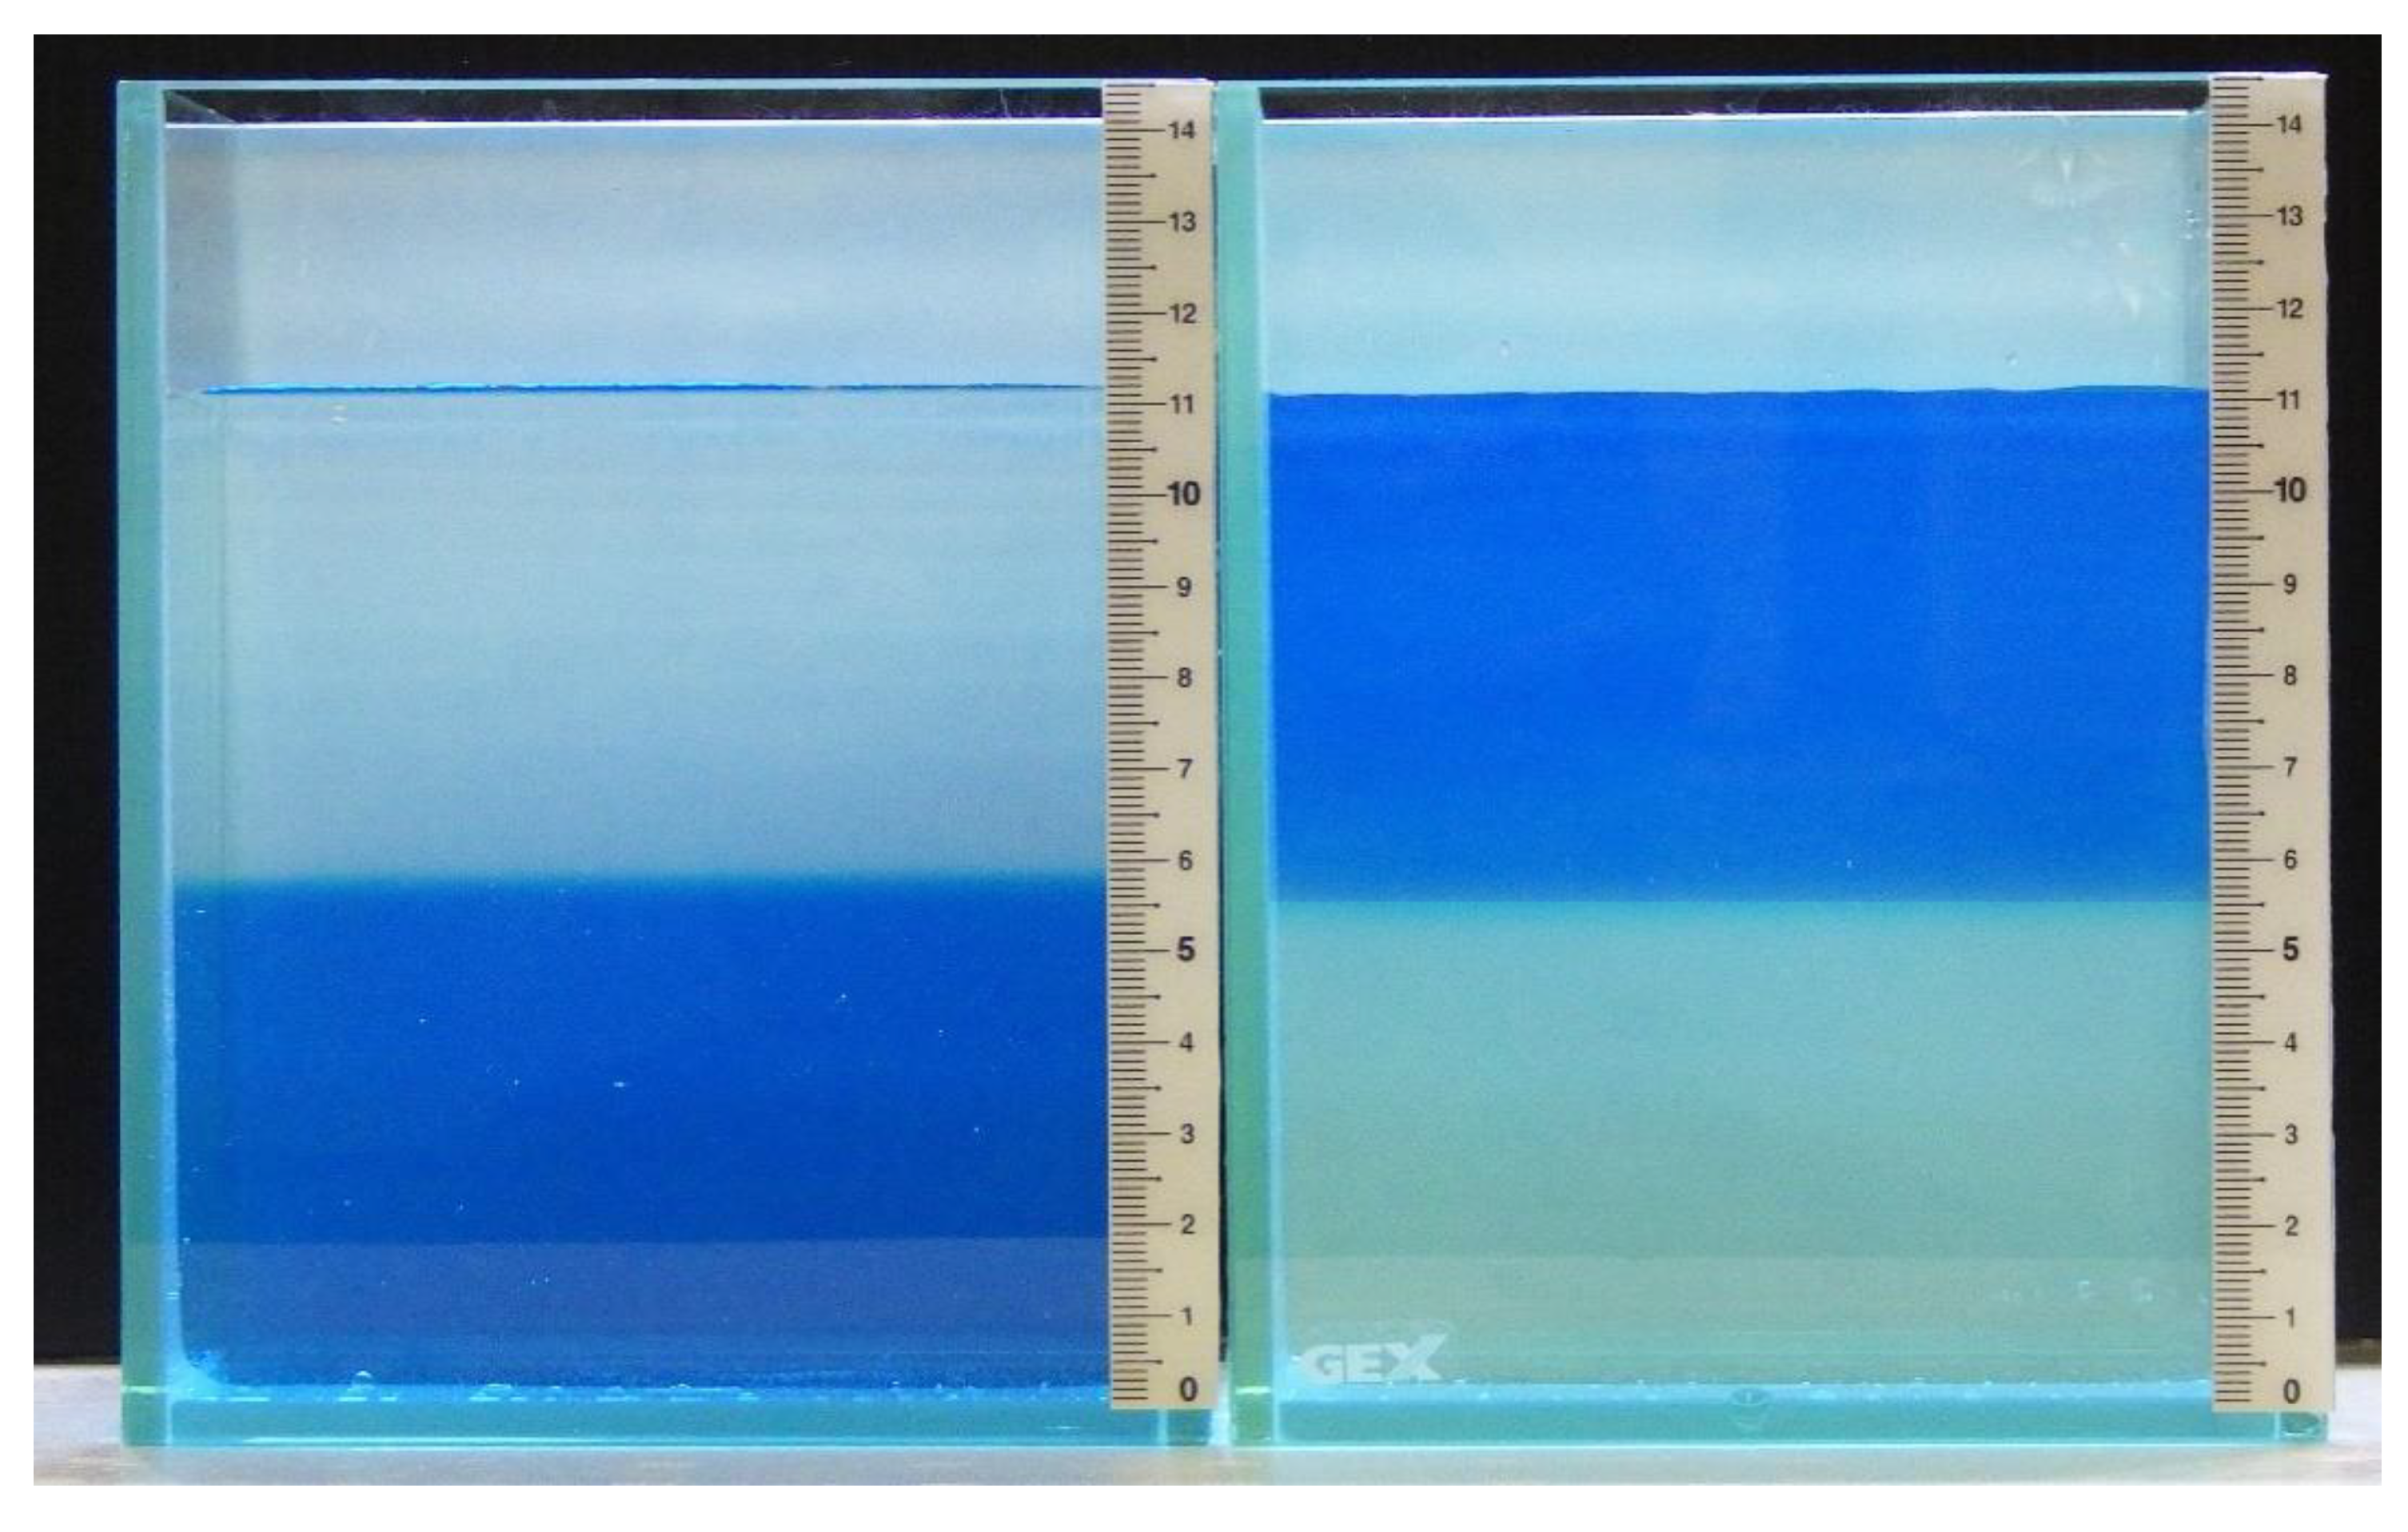
2.1. Establishment of a Simplified System to Test for Salinity Preference

A simple water tank was prepared for the salinity preference experiment (Figure 1). The lower level contained SW, the upper level contained FW, and the FW and SW levels were separated by a salt wedge positioned between the levels. The osmotic pressure at each depth in the tank is shown in Table 1. The FW osmotic pressure was 20.5 ± 1.8 mOsm/kg, and the SW osmotic pressure was 943 ± 1.4 mOsm/kg. The FW up to the midline of the salt wedge maintained osmotic pressure levels typical of FW environments, ranging from 24.5 ± 0.4 to 63.5 ± 16.0 mOsm/kg. From the midline of the salt wedge to the lower level, the osmotic pressure ranged from 861 ± 8.5 to 942 ± 1.4 mOsm/kg, which is similar to that of SW. The osmotic pressure changed remarkably beyond the midline of the salt wedge. The osmotic pressure of the simple aquarium remained almost unchanged for up to 15 min after filling, and the condition around the midline salt wedge was maintained (Table 2).

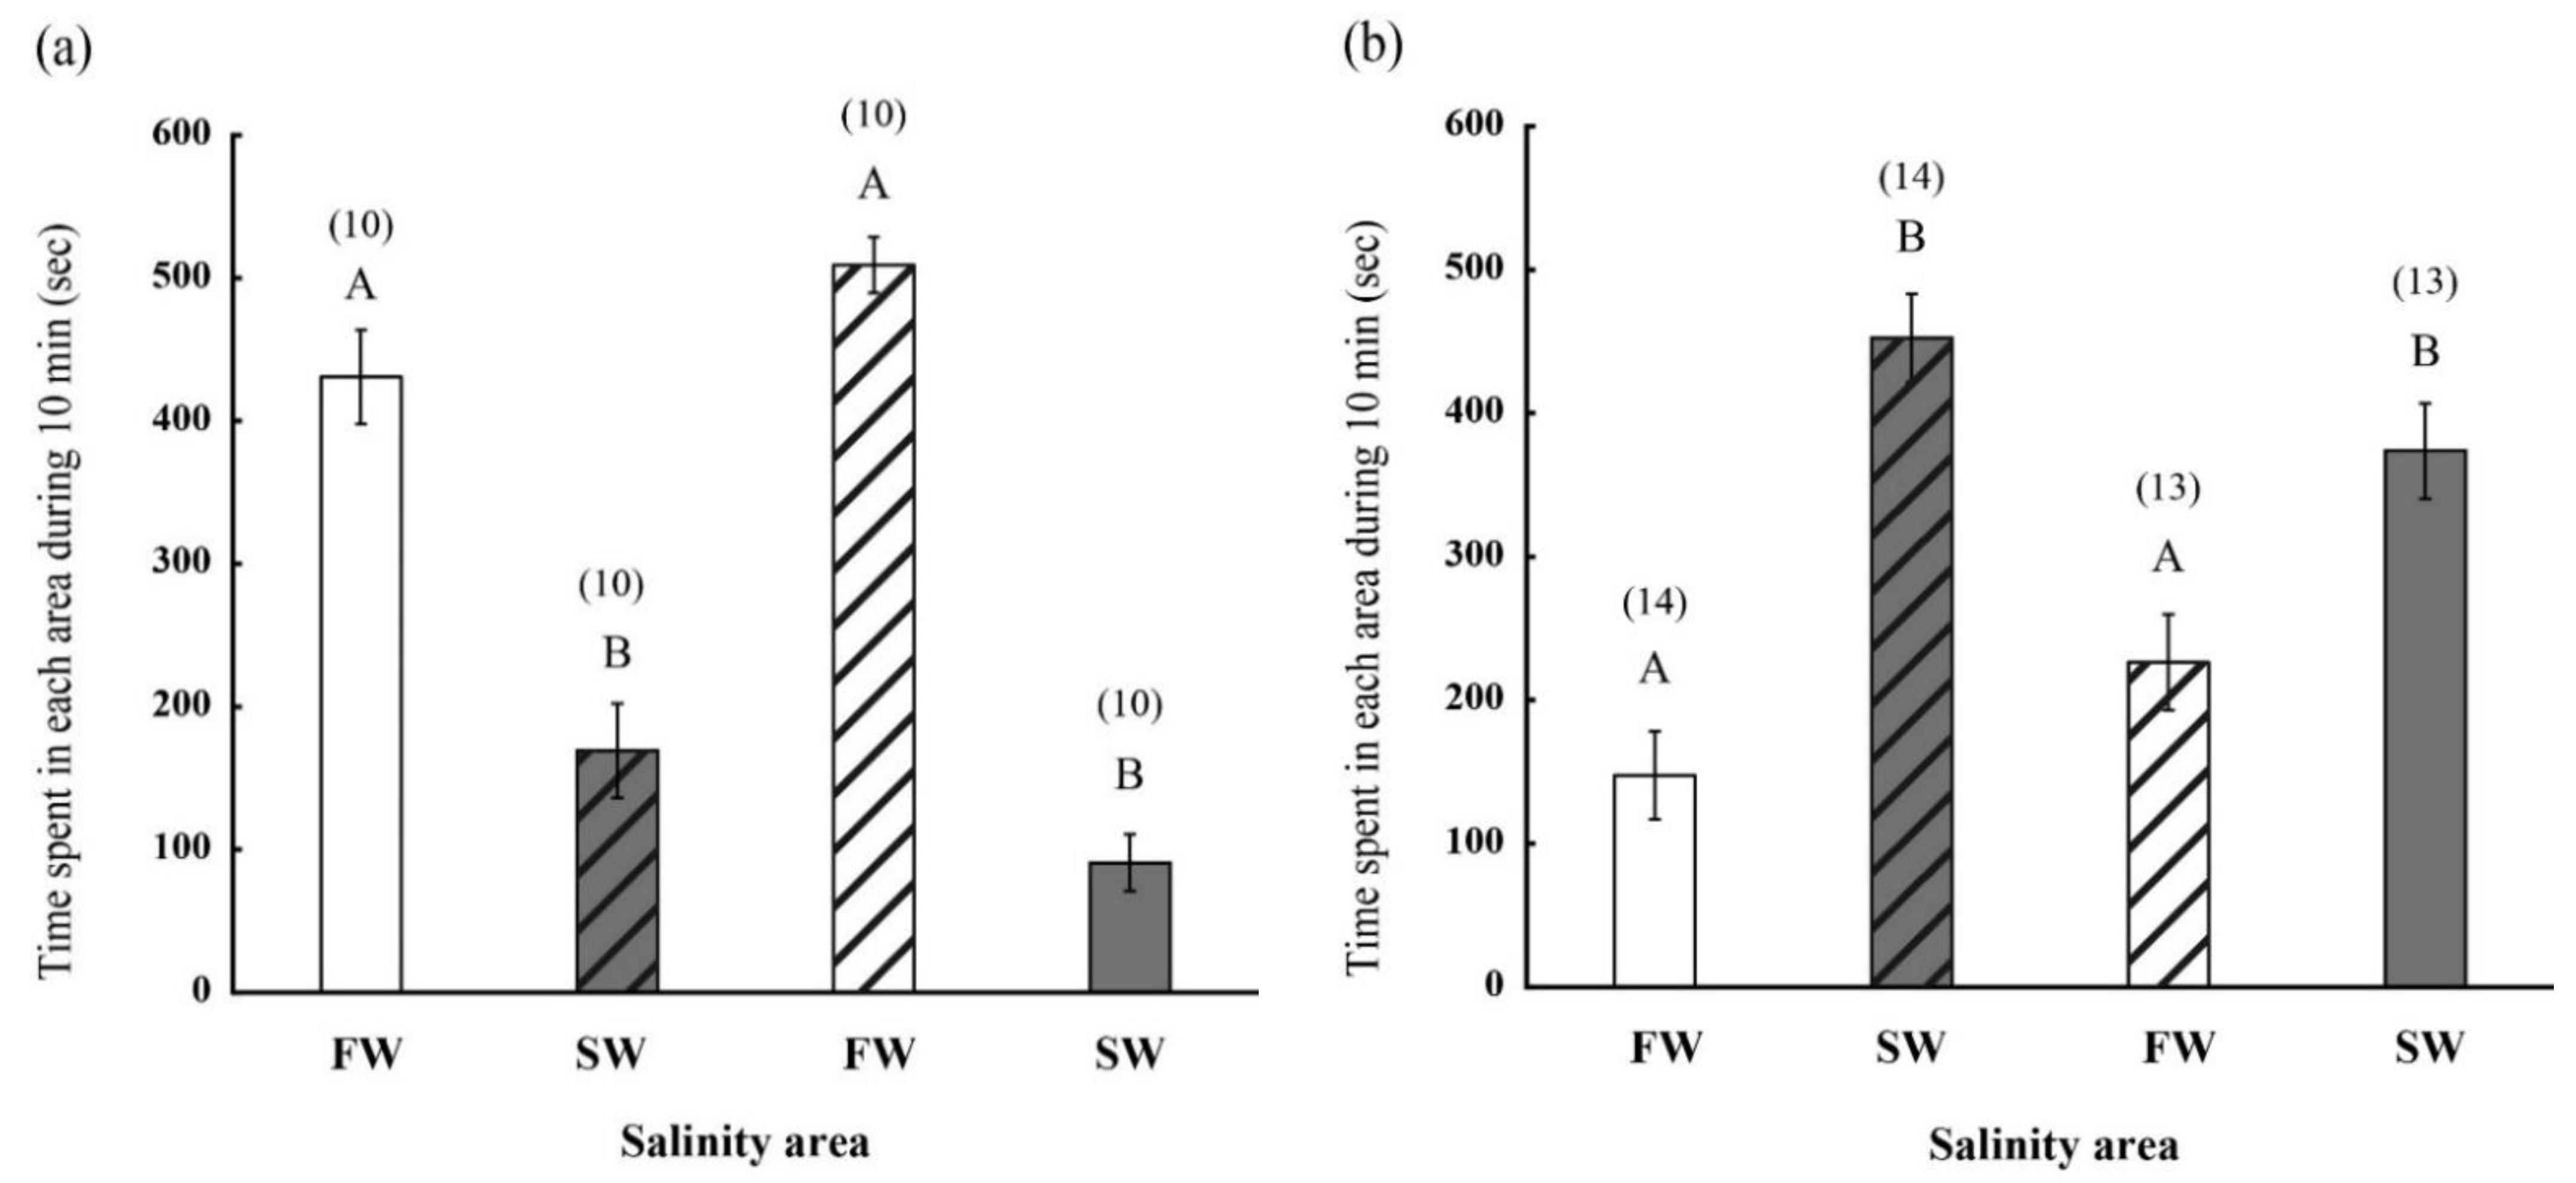
2.2. Behavior of FW- and SW-Acclimated Fish in Different Saline Environments

The time spent by FW-acclimated and SW-acclimated medakas in each environment in the aquarium, namely FW (colorless) and SW (blue), was measured (Figure 2). FW-acclimated medakas stayed in FW for 468.15 ± 22.0 s in a 10-min period, which was longer than the time spent in SW (Figure 2a). However, SW-acclimated medakas stayed in the SW environment for 419.5 ± 21.0 s in a 10-min period, which was longer than the time spent in FW and in direct contrast to the behavioral pattern exhibited by the FW-acclimated medakas (Figure 2b). Thereafter, in order to determine the effect of the water color on the time spent by the FW- and SW-acclimated medakas in the prepared water environments, the experiment was repeated using two aquarium environments: one filled with colored FW and one with colorless SW (Figure 2). No change in the previously observed behavioral pattern with respect to either aquarium environment was observed as a result of a change in color, for both FW- and SW-acclimated medakas (Figure 3).

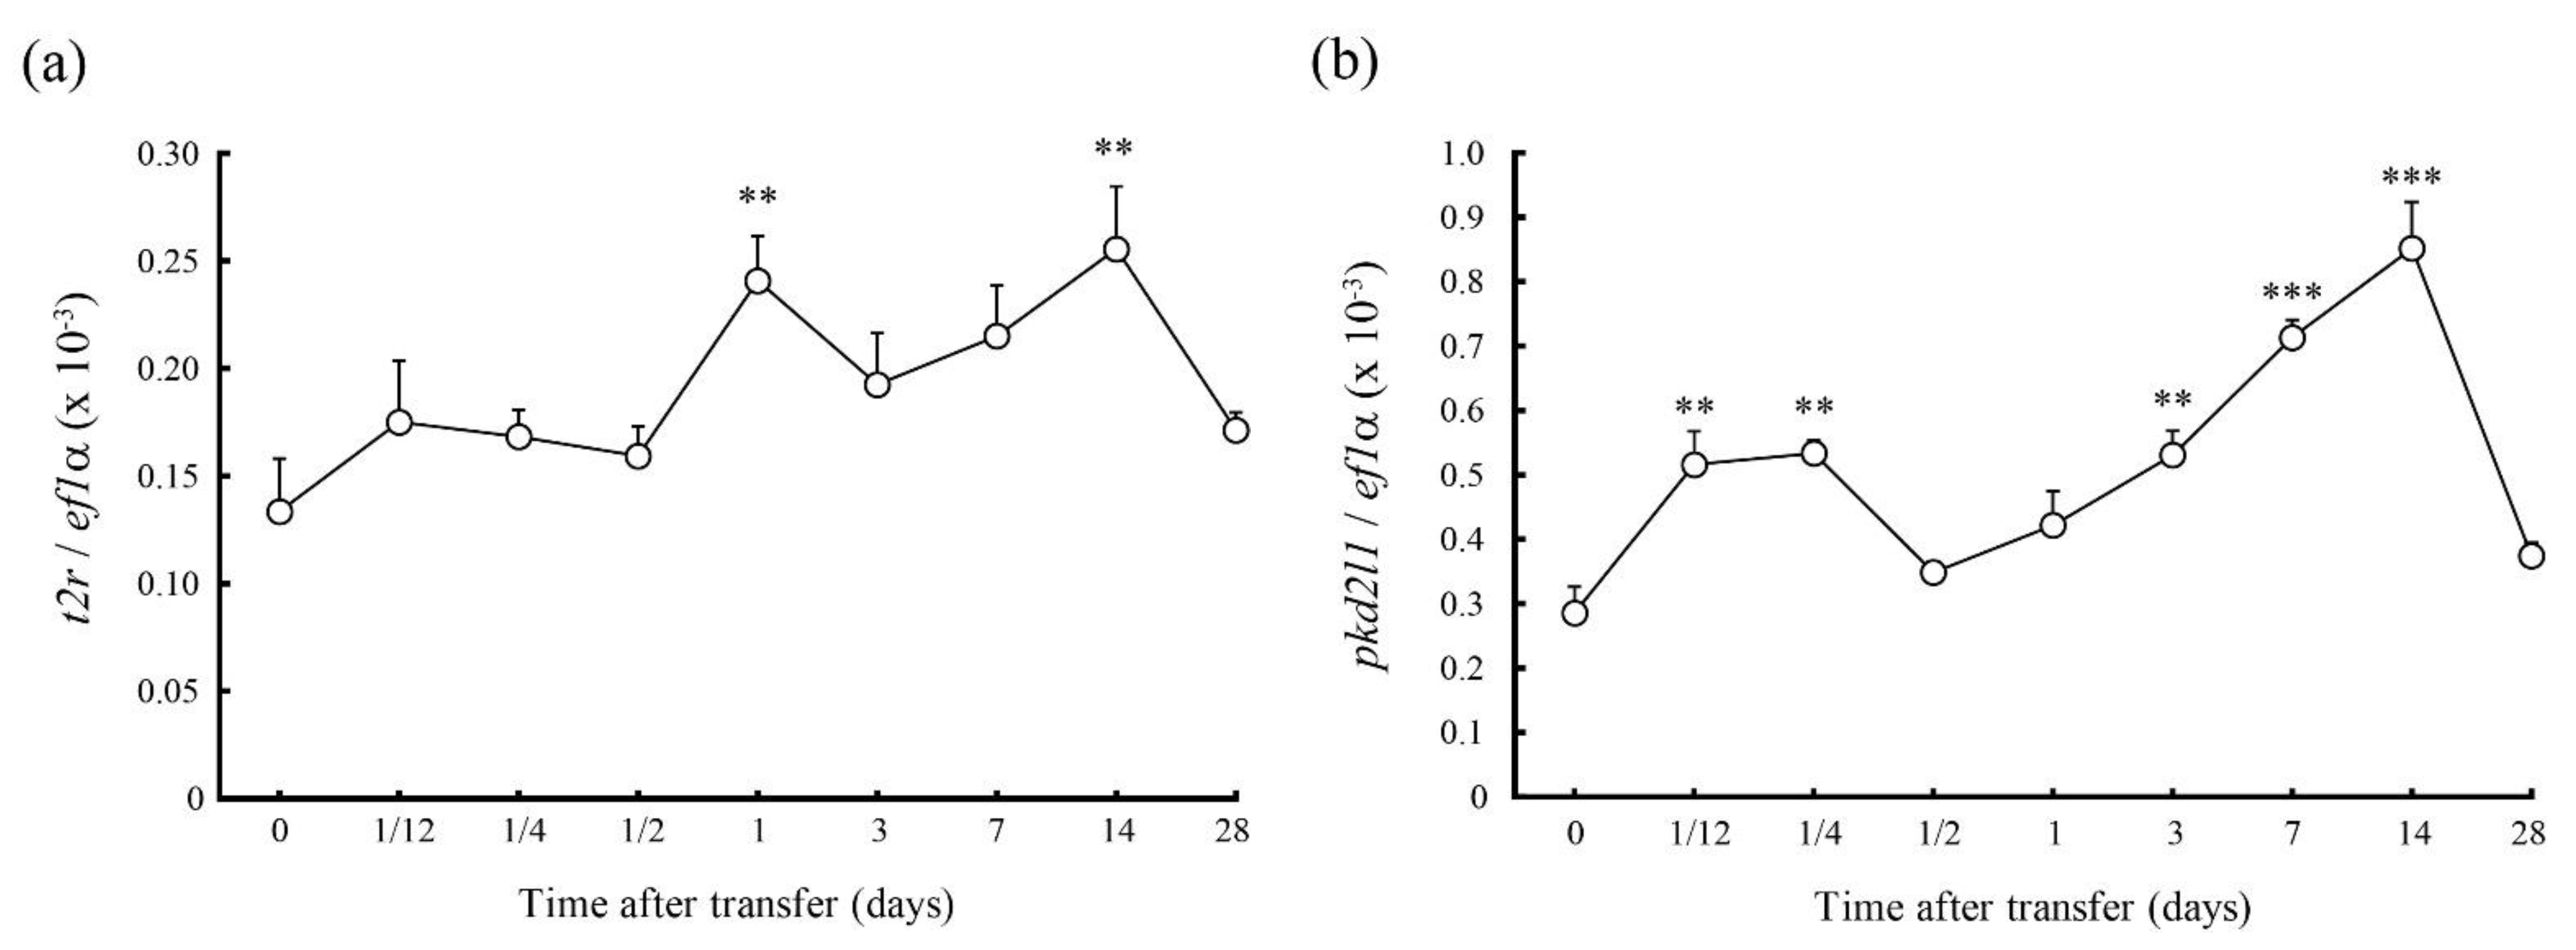
2.3. Changes in mRNA Expession of T2r and Pkd2l1 in 70% SW Challenge

A single gene was identified in medakas corresponding to the bitter taste receptor, t2r, and the sour taste receptor, pkd2l1. The mRNA level of t2r increased on days 1 and 14 after the transfer from FW to 70% SW and decreased to the original levels on day 28 after the transfer (Figure 4a). The pkd2l1 mRNA levels increased after 3 h, 6 h, 3 days, 7 days, and 14 days from transfer from FW to 70% SW and decreased to the same level as FW 28 day after transfer (Figure 4b).

3. Discussion

Changes in salinity environment have major effects on survival in fishes. Fish must have the ability to detect the salinity of the environment and select the appropriate salinity environment depending on their physiological condition. Currently, there is a lack of knowledge regarding the underlying mechanisms by which fish detect and select salinity environments. This study used a simple aquarium system to facilitate salinity preference experiments. As SW has a higher specific weight than FW, the salt wedge placed in the aquarium tank served to clearly separate SW into the lower level and FW into the upper level. The salt wedge is a common phenomenon in estuaries [22,23].
The body fluid osmolality of medakas in FW is approximately 300 mOsm/kg [8]. The aquarium system prepared in this study was divided into a low osmolality area (FW level) with less than 100 mOsm/kg and a high osmolality area with more than 800 mOsm/kg, and fish were able to freely move to either environment. Using this experimental system, it was found that FW-acclimated medakas preferred FW to SW. Although Japanese medakas are a euryhaline fish species, they cannot survive an immediate transition from FW to SW [7,8]. Specifically, FW-acclimated medakas prefer an FW environment, finding SW a potentially lethal environment. In contrast, SW-acclimated medakas preferred SW to FW. SW-acclimated medakas can survive a direct transfer to FW [8]. These results indicate that the simplified aquarium system established in this study is suitable for the study of salinity preference in fishes. Furthermore, coloring to distinguish between the freshwater and seawater did not affect the selection behavior for different salinity areas in fishes. The transfer to a hypoosmotic or hyperosmotic environment necessitates major adjustment in the ion regulatory mechanisms of the body. In an FW environment, 90% of ionocytes will be NHE3-expressing cells, which are involved in the uptake of scarce sodium [24]. These NHE3-expressing cells switch their function to SW-type ionocytes expressing CFTR after SW transfer [3,24,25,26]. Furthermore, the number of gill ionocytes increases at 4 weeks after transfer to an SW environment [8]. It requires functional changes in the existing FW-type ionocytes as well as the proliferation and differentiation of SW-type ionocytes to achieve SW acclimation in the gills [3]. Morphological changes in ionocytes and the body also occur in the transfer from SW to FW [2,3]. As such, this functional switch can be expected to place high energy demands on the fish and be stressful to the body. Thus, medakas can be expected to prefer the saline habitats to which they are acclimated, when able to select.
There is a possibility that fish also use taste to detect highly saline environments. Low-salinity water (<100 mM NaCl) produces attraction behavior and high-salinity water (>300 mM NaCl) produces avoidance behavior in mammals [19,27]. In mice lacking ENaCα, a major subunit of the ENaC protein, the gustatory neural response to low sodium concentrations and attraction behavior do not occur, and the ENaC-expressing taste cells are responsible for the reception of the attractive “good” salt taste [18]. In mice lacking the bitter and sour taste pathways, the gustatory response and avoidance behavior to high sodium concentrations are also missing. Furthermore, mice lacking the bitter and sour taste pathways have only the “good” taste pathway for salt, thus exhibiting a strong preference for high concentrations of sodium salts, which are avoided by wild-type mice [19].
This study examined the expression of the t2r and pkd2l1 genes in response to transfer to an SW environment. The expression of both genes was found to increase in SW or remain at the same level as in an FW environment. Changes in the expression of the t2r and pkd2l1 genes alone cannot explain the SW preference of SW-acclimated medakas. The localization of receptors and neurotransmission pathways at the taste cell level should be investigated in future study. Behavioral experiments using t2r and pkd2l1 knockout medakas are also important as future study. The observation that the FW-acclimated medakas used in this study preferred an FW over an SW environment is thought to be because of an avoidance behavior pattern to hyperosmotic environments. If this is also true for migratory fish species, the SW environment would be considered an environment to be avoided, which is therefore a barrier to entry into SW environments. In fact, juvenile salmonids experience smoltification after hatching in FW rivers and enter the sea [28,29]. Smoltification is a hormone-induced process that increases SW adaptability and salinity preference [9,10]. The results in this study, in which SW-acclimated medakas were observed to prefer SW, were similar to the changes in salinity preference observed in salmonids following smoltification.
This study involved the establishment of an aquarium system to facilitate a simple experiment for selection of salinity environments and validated that medakas can be used as experimental fish for this purpose. Therefore, we believe it will be possible to clarify the physiological mechanisms involved in seawater environment selection in fish, which is currently poorly understood.

4. Materials and Methods

4.1. Fish

Mature Japanese medakas of the d-rR strain, which were provided by the National Bio-Resource Project (National Institute for Basic Biology, Okazaki, Japan), were maintained in FW at 26 ± 0.5 °C in a re-circulating system under a 14:10 h light/dark cycle. All animal experiments were conducted in accordance with the Guideline for Care and Use of Animals by the Committees of the University of Miyazaki.

4.2. Simplified Aquarium System and Salinity Preference Experiment

Medaka fish that had never been acclimated to SW were used as FW-acclimated fish. SW-acclimated fish were acclimated to SW for more than 2 weeks. Aged tap water and artificial SW (Sealife, Nihonkaisui, Tokyo, Japan) were used as FW and seawater, respectively. The water temperature of both the FW and SW was adjusted at 25 ± 1 °C. The osmolarities of the FW and SW are shown in Table 1 and Table 2. To enable visual observation of the FW and SW areas, FW or SW was colored with 0.0004% methylene blue (Nichido, Tokyo, Japan; as shown in Figure 1). The experimental aquarium was prepared as shown in Figure 1. A 1 L glass tank (inside dimensions: width 11 mm, depth 82 mm, and height 14.5 mm; Gex, Tokyo, Japan) was used for the salinity preference experiment. The height from the bottom of the tank to the surface of the water was 11 cm. Initially, the glass tank was filled with 500 mL of SW. To avoid mixing SW with FW, a 10 mm-thick styrofoam board and Kimwipes were allowed to float on the SW, and FW (500 mL) was then gently poured into the tank on the styrofoam board (Supplemental Video S1). After retrieving the styrofoam and Kimwipes from the tank, the FW- or SW-acclimated medakas were then placed in the tank. Measurements of time spent by the fish in each environment were initiated five minutes after one medaka fish was placed in the FW section of the tank, and measurements lasted for periods of ten minutes. All experiments were performed using different fish. The video of behavioral experiments was acquired using a digital camera (WG-40w; Richo, Tokyo, Japan).

4.3. Measurement of Water Osmolarity

The water osmolarity was measured as described in a previous study [30]. In brief, 10 μL of the water sample was applied to a sample disc, and the osmolarity was measured using a vapor pressure osmometer (model 5520, Wescor, Logan, UT, USA). All measurements were made in duplicate.

4.4. Real-Time Quantitative PCR (Real-Time qPCR)

FW-acclimated medakas were transferred directly to 70% salinity SW, and the surviving fish were sampled at 0 h (FW), 3 h, 6 h, 12 h, 1 day, 3 days, 7 days, 14 days, and 28 days after transfer to saltwater. After administering anesthesia to the fish using 0.05% (v/v) 2-phenoxyethanol (Wako, Osaka, Japan), the gills were collected and frozen in liquid nitrogen. The samples were stored at −80 °C. Total RNA was extracted from the gills using ISOGEN II (Nippongene, Toyama, Japan). To eliminate genomic contamination, all total RNA samples were treated with one unit of TURBO DNase (Applied Biosystems; Life Technologies, Gaithersburg, MD, USA) according to the protocols of the manufacturer. Using a High-Capacity cDNA Reverse Transcription Kit (Applied Biosystems), 1 μg of DNase-treated total RNA was reverse-transcribed. Partial cDNAs were cloned using specific primer sets for t2r (AB290689, XM_023958656) [31], pkd2l1 (AB573427, NM_001136518) [32], and the elongation factor 1α (ef1α; NM_001104662), sequenced, and used as standards (Table 3). The amount of plasmid was determined in triplicate with a Nano-drop 2000 (Thermo Fisher Scientific, Waltham, MA, USA). The plasmid was serially diluted, and a standard curve was generated. The amount of mRNA was determined using real-time qPCR with a CFX connect real-time PCR system (Bio-Rad Laboratories, Hercules, CA, USA). Thereafter, expression levels were normalized to that of ef1α as an internal control, and expressed as the quantity relative to ef1α. Primer sets for real-time qPCR were designed using Primer Express software (Applied Biosystems) (Table 3). PCR was conducted in a 10 μL mixture consisting of 5 μL KAPA SYBR fast qPCR kit (KAPA Biosystems, Wilmington, MA, USA), 0.025 μL each of 100 μM forward and reverse primers, 2.5 μL plasmid standard or diluted cDNA template, and up to 10 μL of nuclease-free water. The specificity of PCR for each target gene was established using dissociation curve analysis with a CFX manager (Bio-Rad Laboratories).

4.5. Statistical Analyses

Data are expressed as means ± SEM. Data were analyzed using Steel–Dwass multiple-comparison test or Wilcoxon signed-rank test followed by one-way ANOVA, which was used for the salinity preference experiment. Dunnett’s test was used for time-course changes in real-time qPCR. Significance was set at p < 0.05. All statistical analyses were performed using Kyplot 6.0 (Kyenslab, Inc., Tokyo, Japan).

Supplementary Materials

Author Contributions

H.M. contributed in conceptualization, methodology, formal analysis, investigation, writing, data curation, review and editing, visualization, project administration, and funding acquisition. K.U. contributed in project administration. All authors have read and agreed to the published version of the manuscript.

Funding

This work was supported by the Inamori Foundation and JSPS KAKENHI Grant Number 19K15912.

Institutional Review Board Statement

Ethical review and approval were waived for this study, due to this research conducted in fish.

Informed Consent Statement

Not applicable.

Data Availability Statement

Not applicable.

Acknowledgments

The authors thank National Bio-Resource Project, National Institute for Basic Biology, for the kind provision of Japanese medakas of the d-rR strain.

Conflicts of Interest

The authors declare no conflict of interest.

References

  1. Evans, D.H.; Piermarini, P.M.; Choe, K.P. The Multifunctional Fish Gill: Dominant Site of Gas Exchange, Osmoregulation, Acid-Base Regulation, and Excretion of Nitrogenous Waste. Physiol. Rev. 2005, 85, 97–177. [Google Scholar] [CrossRef]
  2. Marshall, W.S.; Grosell, M. Ion transport, osmoregulation, and acid-base balance. In The Physiology of Fishes, 3rd ed.; Evans, D.H., Claiborne, J.B., Eds.; Talylor & Francis: Boca Raton, FL, USA, 2006; pp. 177–230. ISBN 13-978-0849320224. [Google Scholar]
  3. Kaneko, T.; Watanabe, S.; Lee, K.M. Functional Morphology of Mitochondrion-Rich Cells in Euryhaline and Stenohaline Teleosts. Aqua-BioSci. Monogr. 2008, 1, 1–62. [Google Scholar] [CrossRef]
  4. Takei, Y.; Balment, R.J. The neuroendocrine regulation of fluid intake and fluid balance. In Fish Physiology: Euryhaline Fishes; Bernier, N., van der Kraak, G., Farrell, A.P., Brauner, C.J., Eds.; Academic Press: San Diego, CA, USA, 2009; Volume 28, pp. 365–419. [Google Scholar] [CrossRef]
  5. Hwang, P.-P.; Lee, T.-H.; Lin, L.-Y. Ion regulation in fish gills: Recent progress in the cellular and molecular mechanisms. Am. J. Physiol. Integr. Comp. Physiol. 2011, 301, R28–R47. [Google Scholar] [CrossRef] [PubMed]
  6. Varsamos, S.; Connes, R.; Diaz, J.P.; Barnabe, G.F.; Charmantier, G. Ontogeny of osmoregulation in the European sea bass Dicentrarchus labrax L. Mar. Biol. 2001, 138, 909–915. [Google Scholar] [CrossRef]
  7. Inoue, K.; Takei, Y. Diverse Adaptability in Oryzias Species to High Environmental Salinity. Zool. Sci. 2002, 19, 727–734. [Google Scholar] [CrossRef] [PubMed]
  8. Miyanishi, H.; Inokuchi, M.; Nobata, S.; Kaneko, T. Past seawater experience enhances seawater adaptability in medaka, Oryzias latipes. Zool. Lett. 2016, 2, 12. [Google Scholar] [CrossRef] [Green Version]
  9. Iwata, M. Downstream migratory behavior of salmonids and its relationship with cortisol and thyroid hormones: A review. Aquaculture 1995, 135, 131–139. [Google Scholar] [CrossRef]
  10. McCormick, S.D. Smolt Physiology and Endocrinology. In Fish Physiology, Euryhaline Fishes; McCormick, S.D., Farrell, A.P., Brauner, C.J., Eds.; Academic Press: San Diego, CA, USA, 2012; Volume 32, pp. 199–251. [Google Scholar] [CrossRef]
  11. McCormick, S.D. Ontogeny and Evolution of Salinity Tolerance in Anadromous Salmonids: Hormones and Heterochrony. Estuaries 1994, 17, 26–33. [Google Scholar] [CrossRef]
  12. Takei, Y.; Miyanishi, H.; Nobata, S.; Wong, M.K.S.; Miyata, N.; Watanabe, T.; Ventura, A.; Shiozawa, A.; Hyodo, S.; Sato, K.; et al. Establishment and validation of aquarium system for salinity preference experiment using conscious rainbow trout. Coast. Mar. Sci. 2013, 36, 26–37. [Google Scholar]
  13. Kültz, D. Osmosensing. In Fish Physiology, Euryhaline Fishes; McCormick, S.D., Farrell, A.P., Brauner, C.J., Eds.; Academic Press: San Diego, CA, USA, 2012; Volume 32, pp. 45–68. [Google Scholar] [CrossRef]
  14. Takei, Y.; Hwang, P.-P. Homeostatic Responses to Osmotic Stress. In Fish Physiology, Biology of Stress in Fish; Schreck, C.B., Tort, L., Farrell, A.P., Brauner, C.J., Eds.; Academic Press: San Diego, CA, USA, 2016; Volume 35, pp. 207–249. [Google Scholar] [CrossRef]
  15. Ishimaru, Y.; Okada, S.; Naito, H.; Nagai, T.; Yasuoka, A.; Matsumoto, I.; Abe, K. Two families of candidate taste receptors in fishes. Mech. Dev. 2005, 122, 1310–1321. [Google Scholar] [CrossRef]
  16. Yoshida, Y.; Saitoh, K.; Aihara, Y.; Okada, S.; Misaka, T.; Abe, K. Transient receptor potential channel M5 and phospholipaseC-β2 colocalizing in zebrafish taste receptor cells. NeuroReport 2007, 18, 1517–1520. [Google Scholar] [CrossRef] [PubMed]
  17. Okada, S. The taste system of small fish species. Biosci. Biotechnol. Biochem. 2015, 79, 1039–1043. [Google Scholar] [CrossRef]
  18. Chandrashekar, J.; Hoon, M.A.; Ryba, N.J.P.; Zuker, C.S. The receptors and cells for mammalian taste. Nat. Cell Biol. 2006, 444, 288–294. [Google Scholar] [CrossRef] [PubMed]
  19. Oka, Y.; Butnaru, M.; Von Buchholtz, L.; Ryba, N.J.P.; Zuker, C.S. High salt recruits aversive taste pathways. Nat. Cell Biol. 2013, 494, 472–475. [Google Scholar] [CrossRef] [PubMed] [Green Version]
  20. Hanukoglu, I.; Hanukoglu, A. Epithelial sodium channel (ENaC) family: Phylogeny, structure–function, tissue distribution, and associated inherited diseases. Gene 2016, 579, 95–132. [Google Scholar] [CrossRef] [Green Version]
  21. Christensen, E.A.F.; Grosell, M. Behavioural salinity preference of juvenile yellow perch Perca flavescens. J. Fish Biol. 2018, 92, 1620–1626. [Google Scholar] [CrossRef] [PubMed]
  22. Geyer, W.R.; Farmer, D.M. Tide-Induced Variation of the Dynamics of a Salt Wedge Estuary. J. Phys. Oceanogr. 1989, 19, 1060–1072. [Google Scholar] [CrossRef] [Green Version]
  23. Ralston, D.K.; Geyer, W.R.; Lerczak, J.A. Structure, variability, and salt flux in a strongly forced salt wedge estuary. J. Geophys. Res. Space Phys. 2010, 115, 06005. [Google Scholar] [CrossRef] [Green Version]
  24. Shen, W.-P.; Horng, J.-L.; Lin, L.-Y. Functional plasticity of mitochondrion-rich cells in the skin of euryhaline medaka larvae (Oryzias latipes) subjected to salinity changes. Am. J. Physiol. Integr. Comp. Physiol. 2011, 300, R858–R868. [Google Scholar] [CrossRef] [PubMed] [Green Version]
  25. Hiroi, J.; McCormick, S.D. New insights into gill ionocyte and ion transporter function in euryhaline and diadromous fish. Respir. Physiol. Neurobiol. 2012, 184, 257–268. [Google Scholar] [CrossRef] [PubMed]
  26. Hsu, H.-H.; Lin, L.-Y.; Tseng, Y.-C.; Horng, J.-L.; Hwang, P.-P. A new model for fish ion regulation: Identification of ionocytes in freshwater- and seawater-acclimated medaka (Oryzias latipes). Cell Tissue Res. 2014, 357, 225–243. [Google Scholar] [CrossRef] [PubMed]
  27. Duncan, C.J. Salt Preferences of Birds and Mammals. Physiol. Zool. 1962, 35, 120–132. [Google Scholar] [CrossRef]
  28. Folmar, L.C.; Dickhoff, W.W. The parr—Smolt transformation (smoltification) and seawater adaptation in salmonids: A review of selected literature. Aquaculture 1980, 21, 1–37. [Google Scholar] [CrossRef]
  29. Hoar, W. The physiology of smolting salmonids. In Fish Physiology; Hoar, W.S., Randall, D.J., Eds.; Academic Press: New York, NY, USA, 1988; Volume 11B, pp. 275–343. [Google Scholar] [CrossRef]
  30. Miyanishi, H.; Okubo, K.; Kaneko, T.; Takei, Y. Role of cardiac natriuretic peptides in seawater adaptation of medaka embryos as revealed by loss-of-function analysis. Am. J. Physiol. Integr. Comp. Physiol. 2013, 304, R423–R434. [Google Scholar] [CrossRef] [PubMed] [Green Version]
  31. Oike, H.; Nagai, T.; Furuyama, A.; Okada, S.; Aihara, Y.; Ishimaru, Y.; Marui, T.; Matsumoto, I.; Misaka, T.; Abe, K. Characterization of Ligands for Fish Taste Receptors. J. Neurosci. 2007, 27, 5584–5592. [Google Scholar] [CrossRef]
  32. Kamura, K.; Kobayashi, D.; Uehara, Y.; Koshida, S.; Iijima, N.; Kudo, A.; Yokoyama, T.; Takeda, H. Pkd1l1 complexes with Pkd2 on motile cilia and functions to establish the left-right axis. Development 2011, 138, 1121–1129. [Google Scholar] [CrossRef] [PubMed] [Green Version]
Figure 1. A picture of a simplified system for salinity preference experiments. View of the preference aquarium consisting of a freshwater area (upper, left: colorless, right: blue-colored water) and seawater area (lower, left: blue-colored water, right: colorless).
Fishes 06 00018 g001
Figure 2. Time in each salinity area (FW or SW) during 10 min in FW-acclimated medakas (a) and SW-acclimated medakas (b). Numerals in parentheses indicate the number of fish examined. Data are expressed as means ± SEM. Asterisks indicate significant differences between the two groups (Wilcoxon signed-rank test, *** p < 0.001).
Fishes 06 00018 g002
Figure 3. Time in each salinity area (FW or SW) during 10 min in FW-acclimated medakas (a) and SW-acclimated medakas (b). The experiment was repeated using two aquarium environments: one set is colorless FW (white bar) and blue-colored SW (grey and diagonal bar), and the other set is blue-colored FW (white and diagonal bar) and colorless SW (grey bar). Numerals in parentheses indicate the number of fish examined. Data are expressed as means ± SEM. Different letters indicate significant differences within the same group (Steel–Dwass multiple-comparison test, p < 0.05).
Fishes 06 00018 g003
Figure 4. Changes in gene expressions of taste receptor type-2 (t2r) (a) and polycystic kidney disease 2-like 1 (pkd2l1) (b) after transfer of FW-acclimated medakas to 70% SW. Values are means ± SEM (N = 6–7). Asterisks indicate significant differences between FW (0 h) and time points of SW challenge (Dunnett’s multiple-comparison test, ** p < 0.01 and *** p < 0.001).
Fishes 06 00018 g004
Table 1. Water osmolality in simplified salinity preference system at the beginning of the experiment.
Water Depth (cm)Osmolality (mOsm/kg)
Freshwater20.5 ± 1.8
0.124.5 ± 0.4
2.230.5 ± 3.9
4.463.5 ± 16.0
6.6861 ± 8.5
8.8939 ± 0.5
11942 ± 1.4
Seawater943 ± 1.4
Table 2. Changes in water osmolality for a salinity preference experiment.
Water Depth (cm)Osmolality (mOsm/kg)
0 min after Setting15 min after Setting
Freshwater33
0.144.562
1.14666
2.248.568
3.364.583.5
4.47999
5.5530451.5
6.6597.5810.5
7.7745.5886
8.8854959
9.9923962
11998968.5
Seawater1002
Table 3. Primers used for real-time qPCR analyses.
Gene NameOligo NameSequence (5′–3′)Purposes
t2r
T2R-F1GGAGCGCATGCAGAACATTTStandard (STD) for real-time PCR
T2R-R1CCTCACAGGTCCAGCAAACTSTD for real-time PCR
T2R-F2GGCTGTGCTAACCATCTTCTTCreal-time PCR
T2R-R2TCACTTGGGCTTCTCTGCTTreal-time PCR
pkd2l1
PKD2L1-F1ATGAAGTCCCTGAACAATCGCSTD for real-time PCR
PKD2L1-R1ACCGTTCGGATCTGGTAGGASTD for real-time PCR
PKD2L1-F2CGGATCTGGTAGGAGGGAACreal-time PCR
PKD2L1-R2CCGAGTGGTCTTCATCGACTreal-time PCR
ef1α
EF1a-F4TTACCTGGTTAGGGGCAGCASTD for real-time PCR
EF1a-R1TATCAACAGCCTTGATGACACCSTD for real-time PCR
EF1a-F6AGAAGGAAGCCGCTGAGATGGreal-time PCR
EF1a-R6GCTCAGCCTTCAGTTTGTCCAAreal-time PCR
Publisher’s Note: MDPI stays neutral with regard to jurisdictional claims in published maps and institutional affiliations.

