
Effect of 3-Aminobenzoic Acid Ethyl Ester Methanesulfonate (MS-222) on Quality of Marine Cultured Turbot (Scophthalmus maximus) during Simulated Transport in Water


Abstract
:1. Introduction
2. Results
2.1. Water Quality Parameters
2.2. Proximate Results of Turbot Flesh
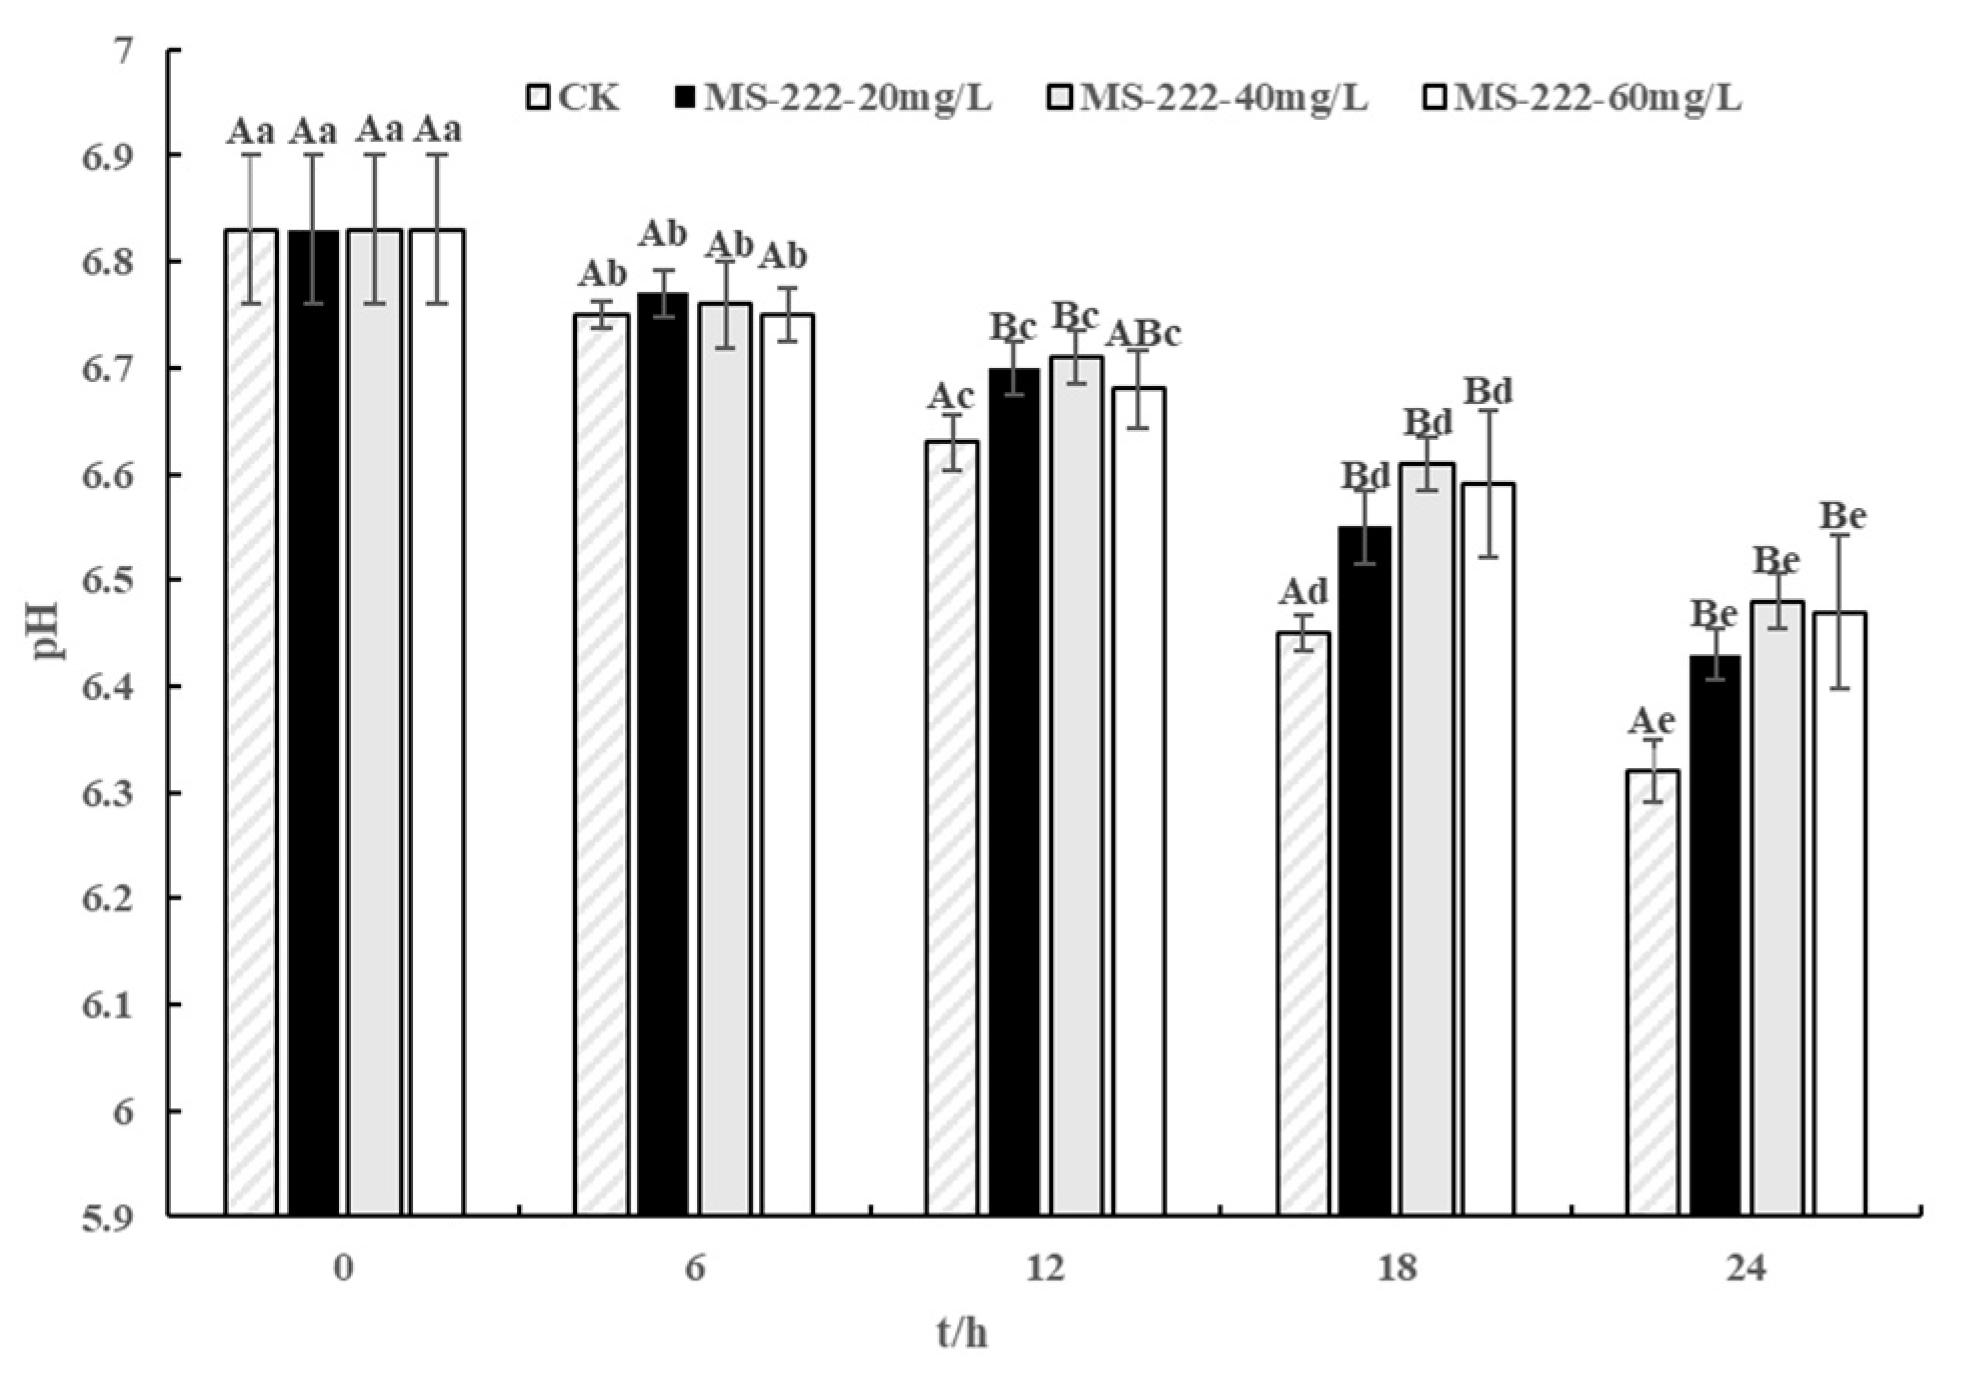
2.3. pH Values
2.4. Texture Profile Analysis (TPA) Results
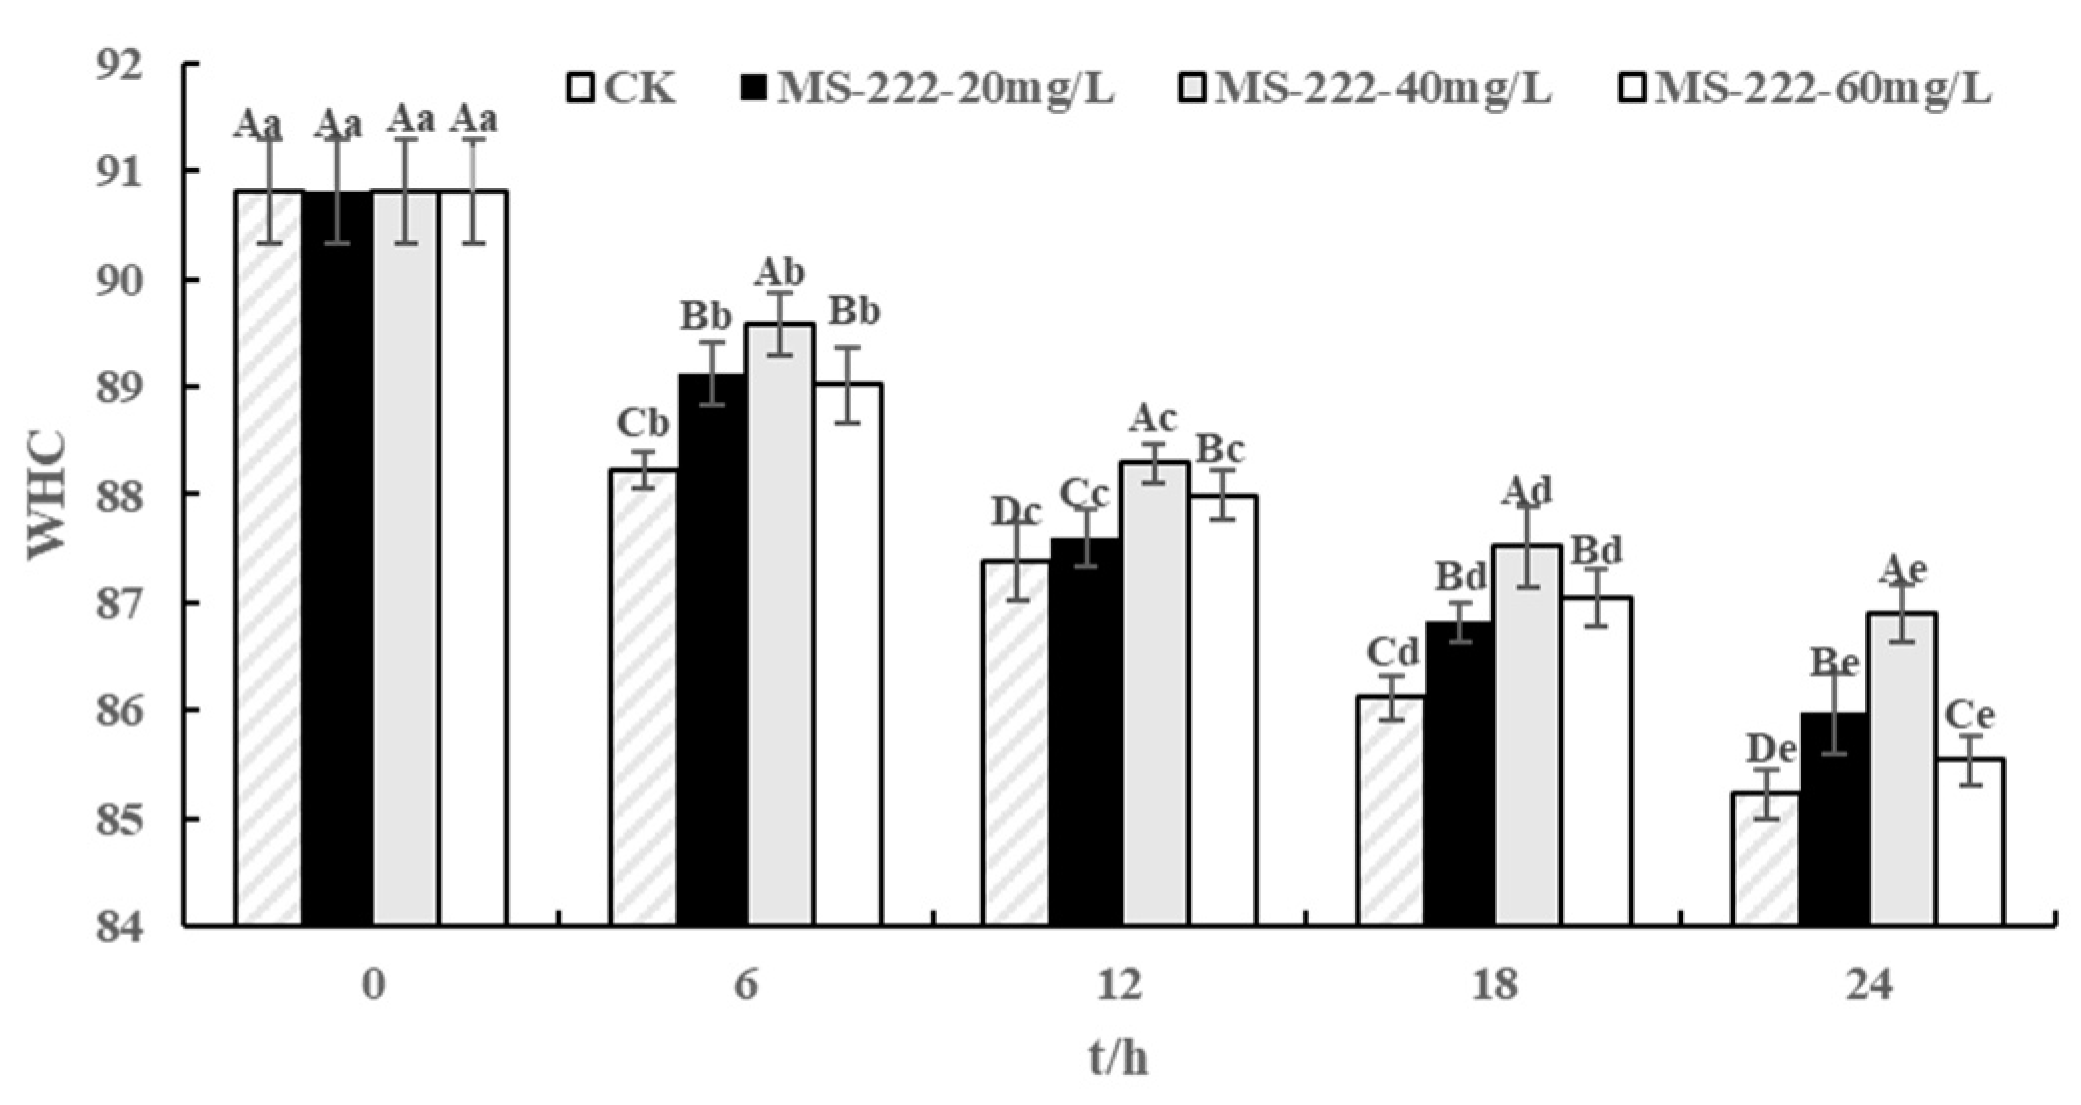
2.5. Water Holding Capacity (WHC) Values
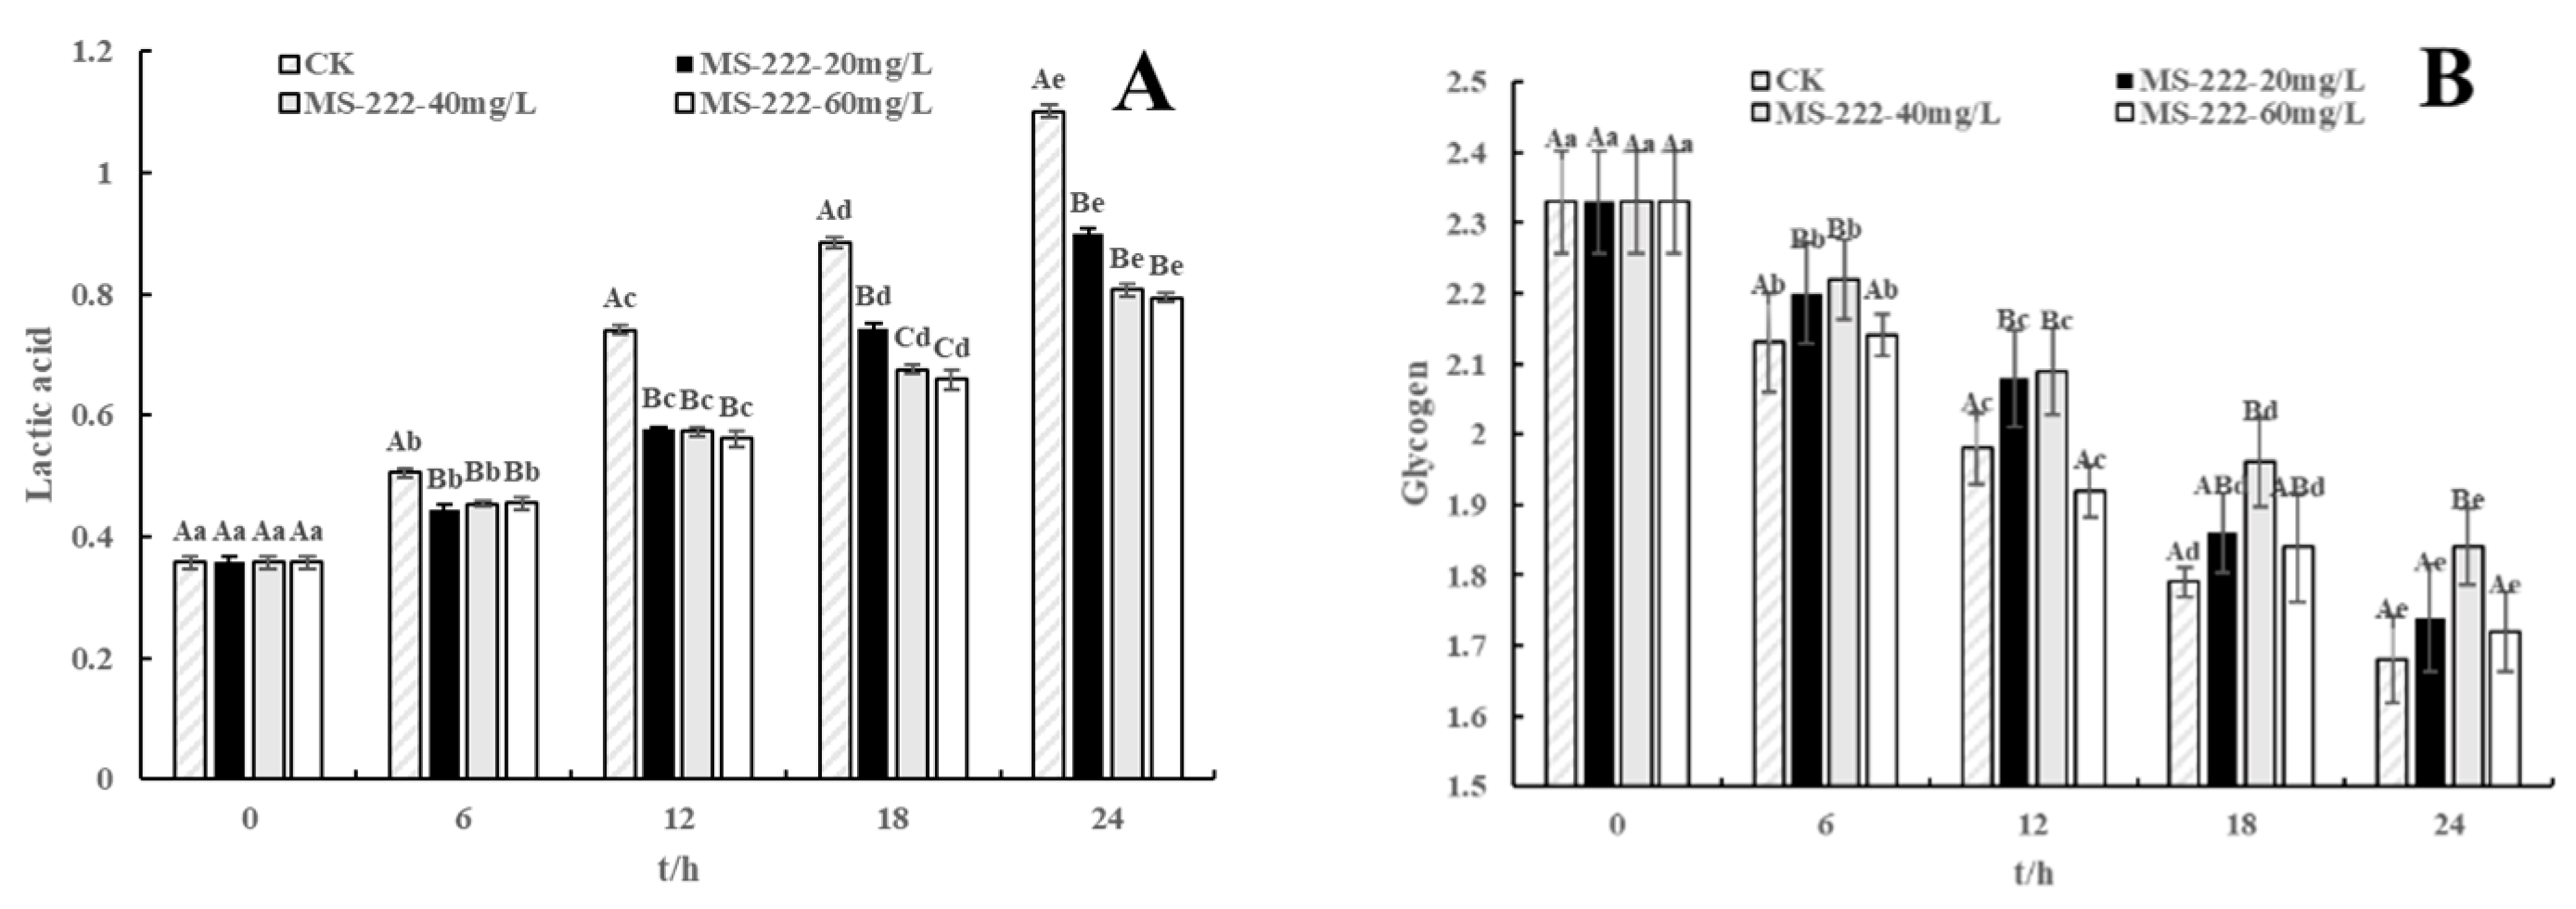
2.6. Glycogen and Lactic Acid Changes
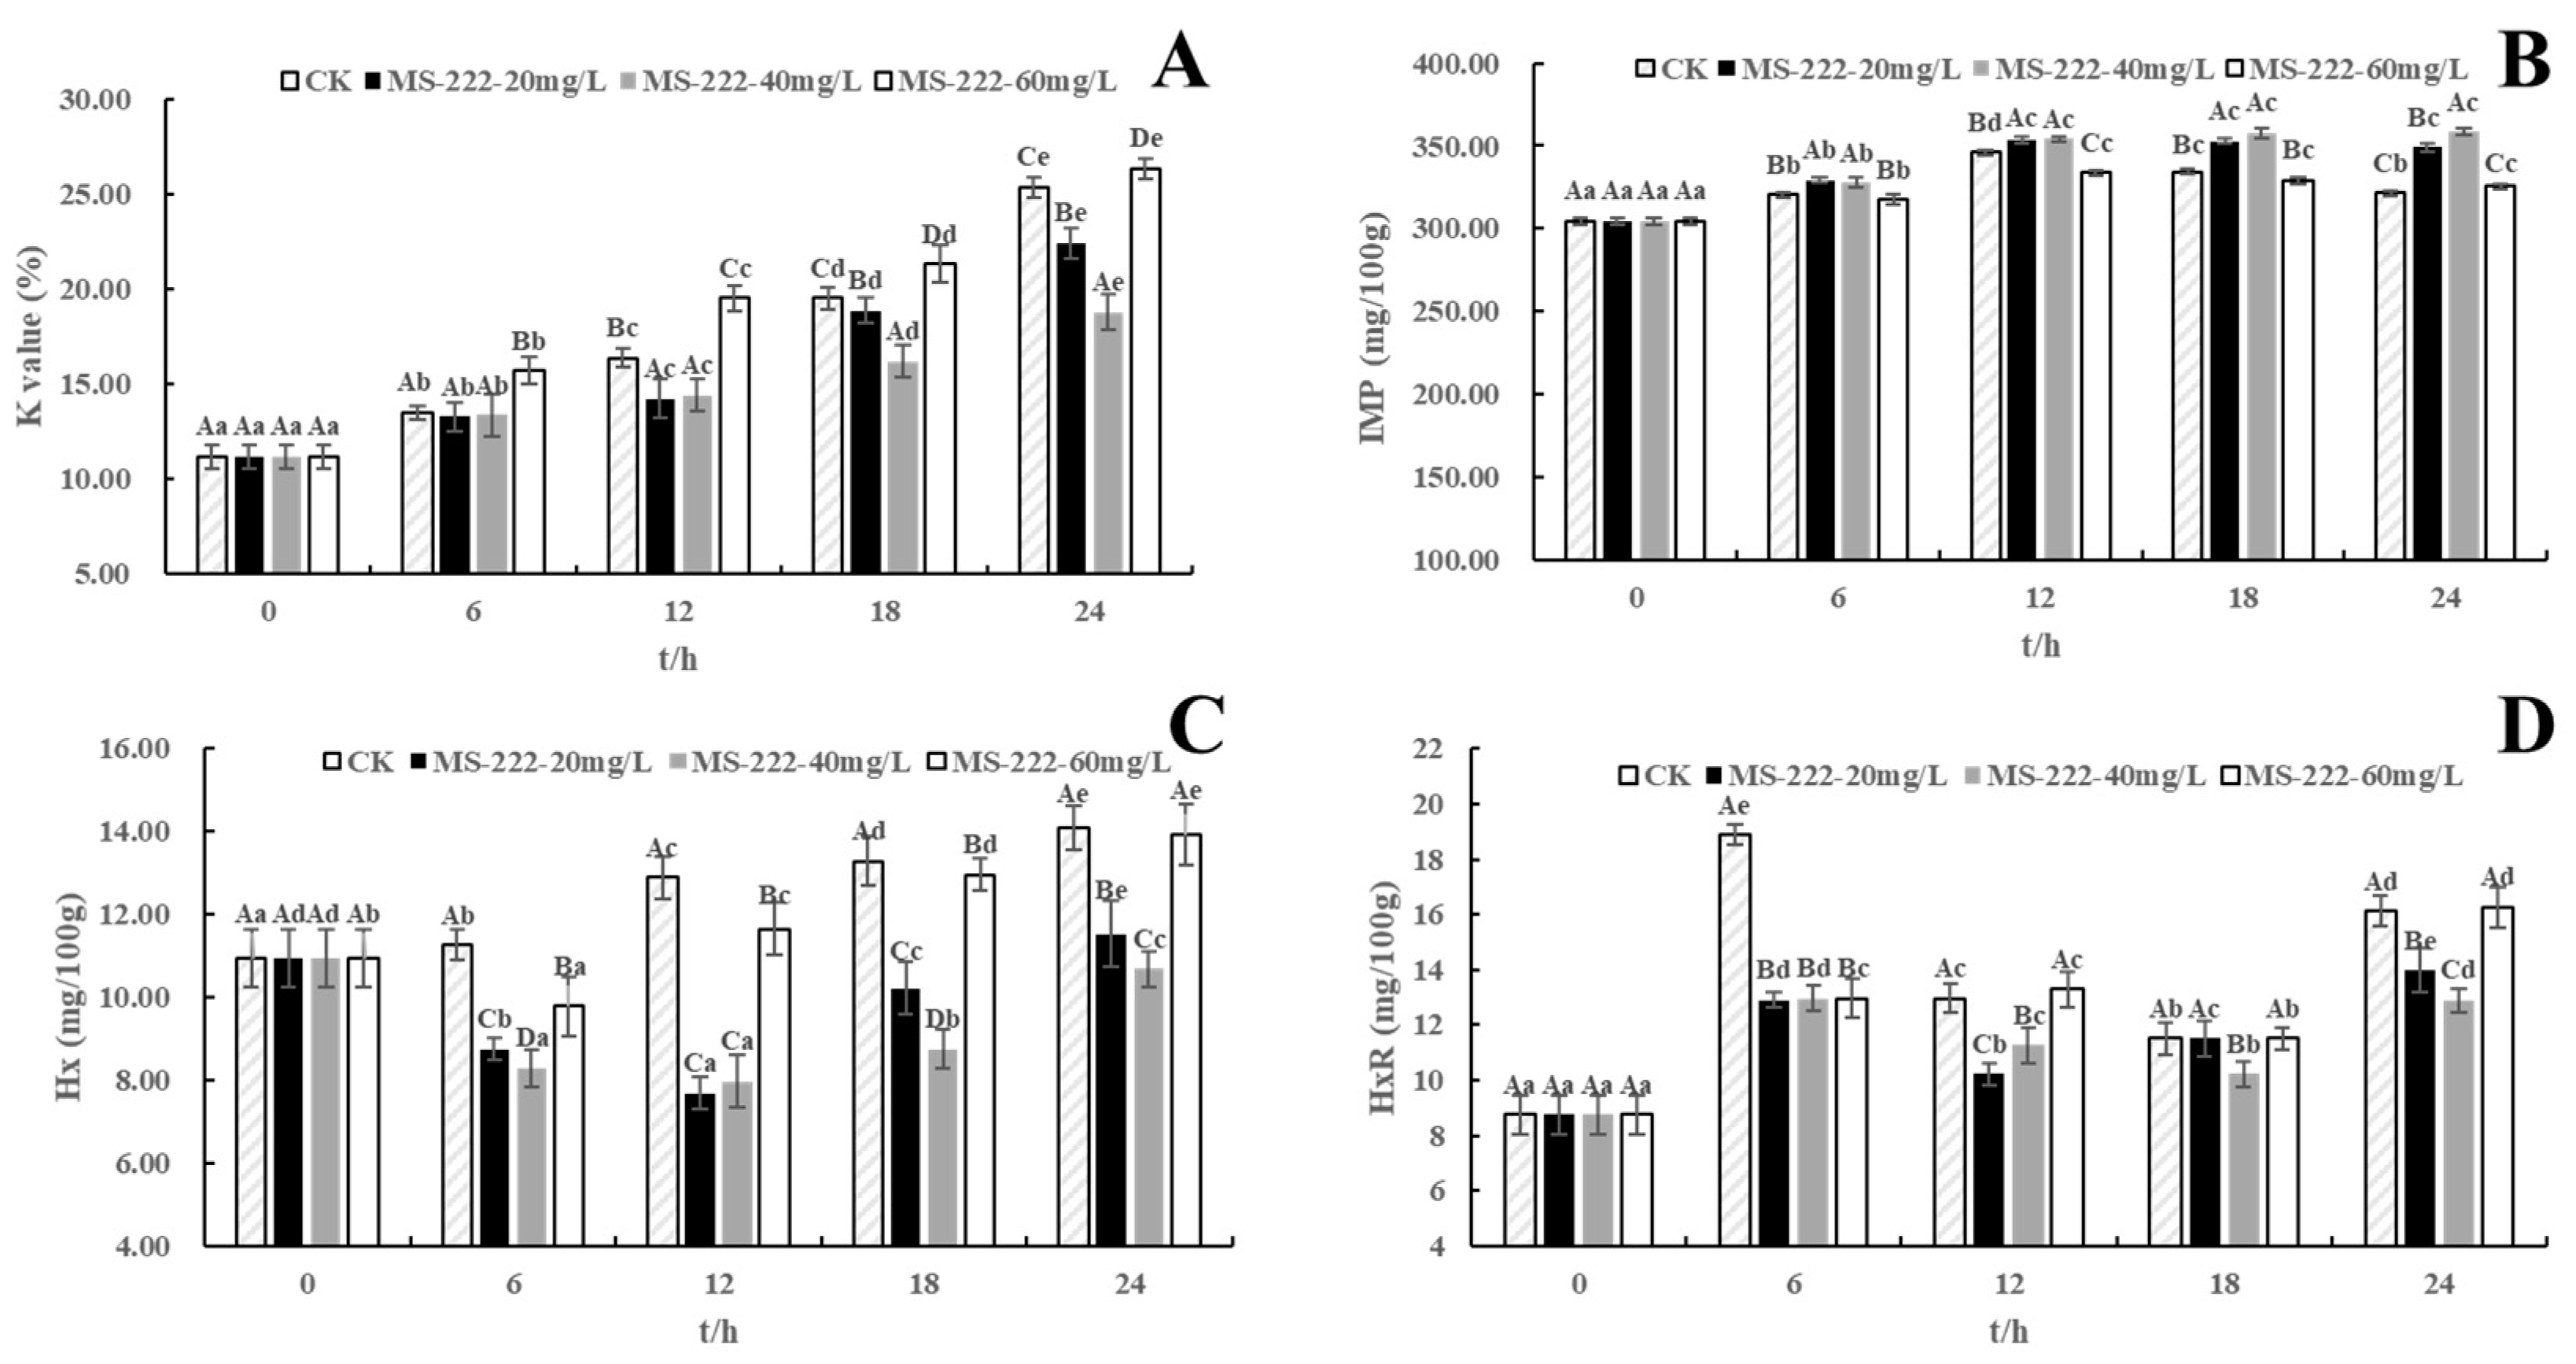
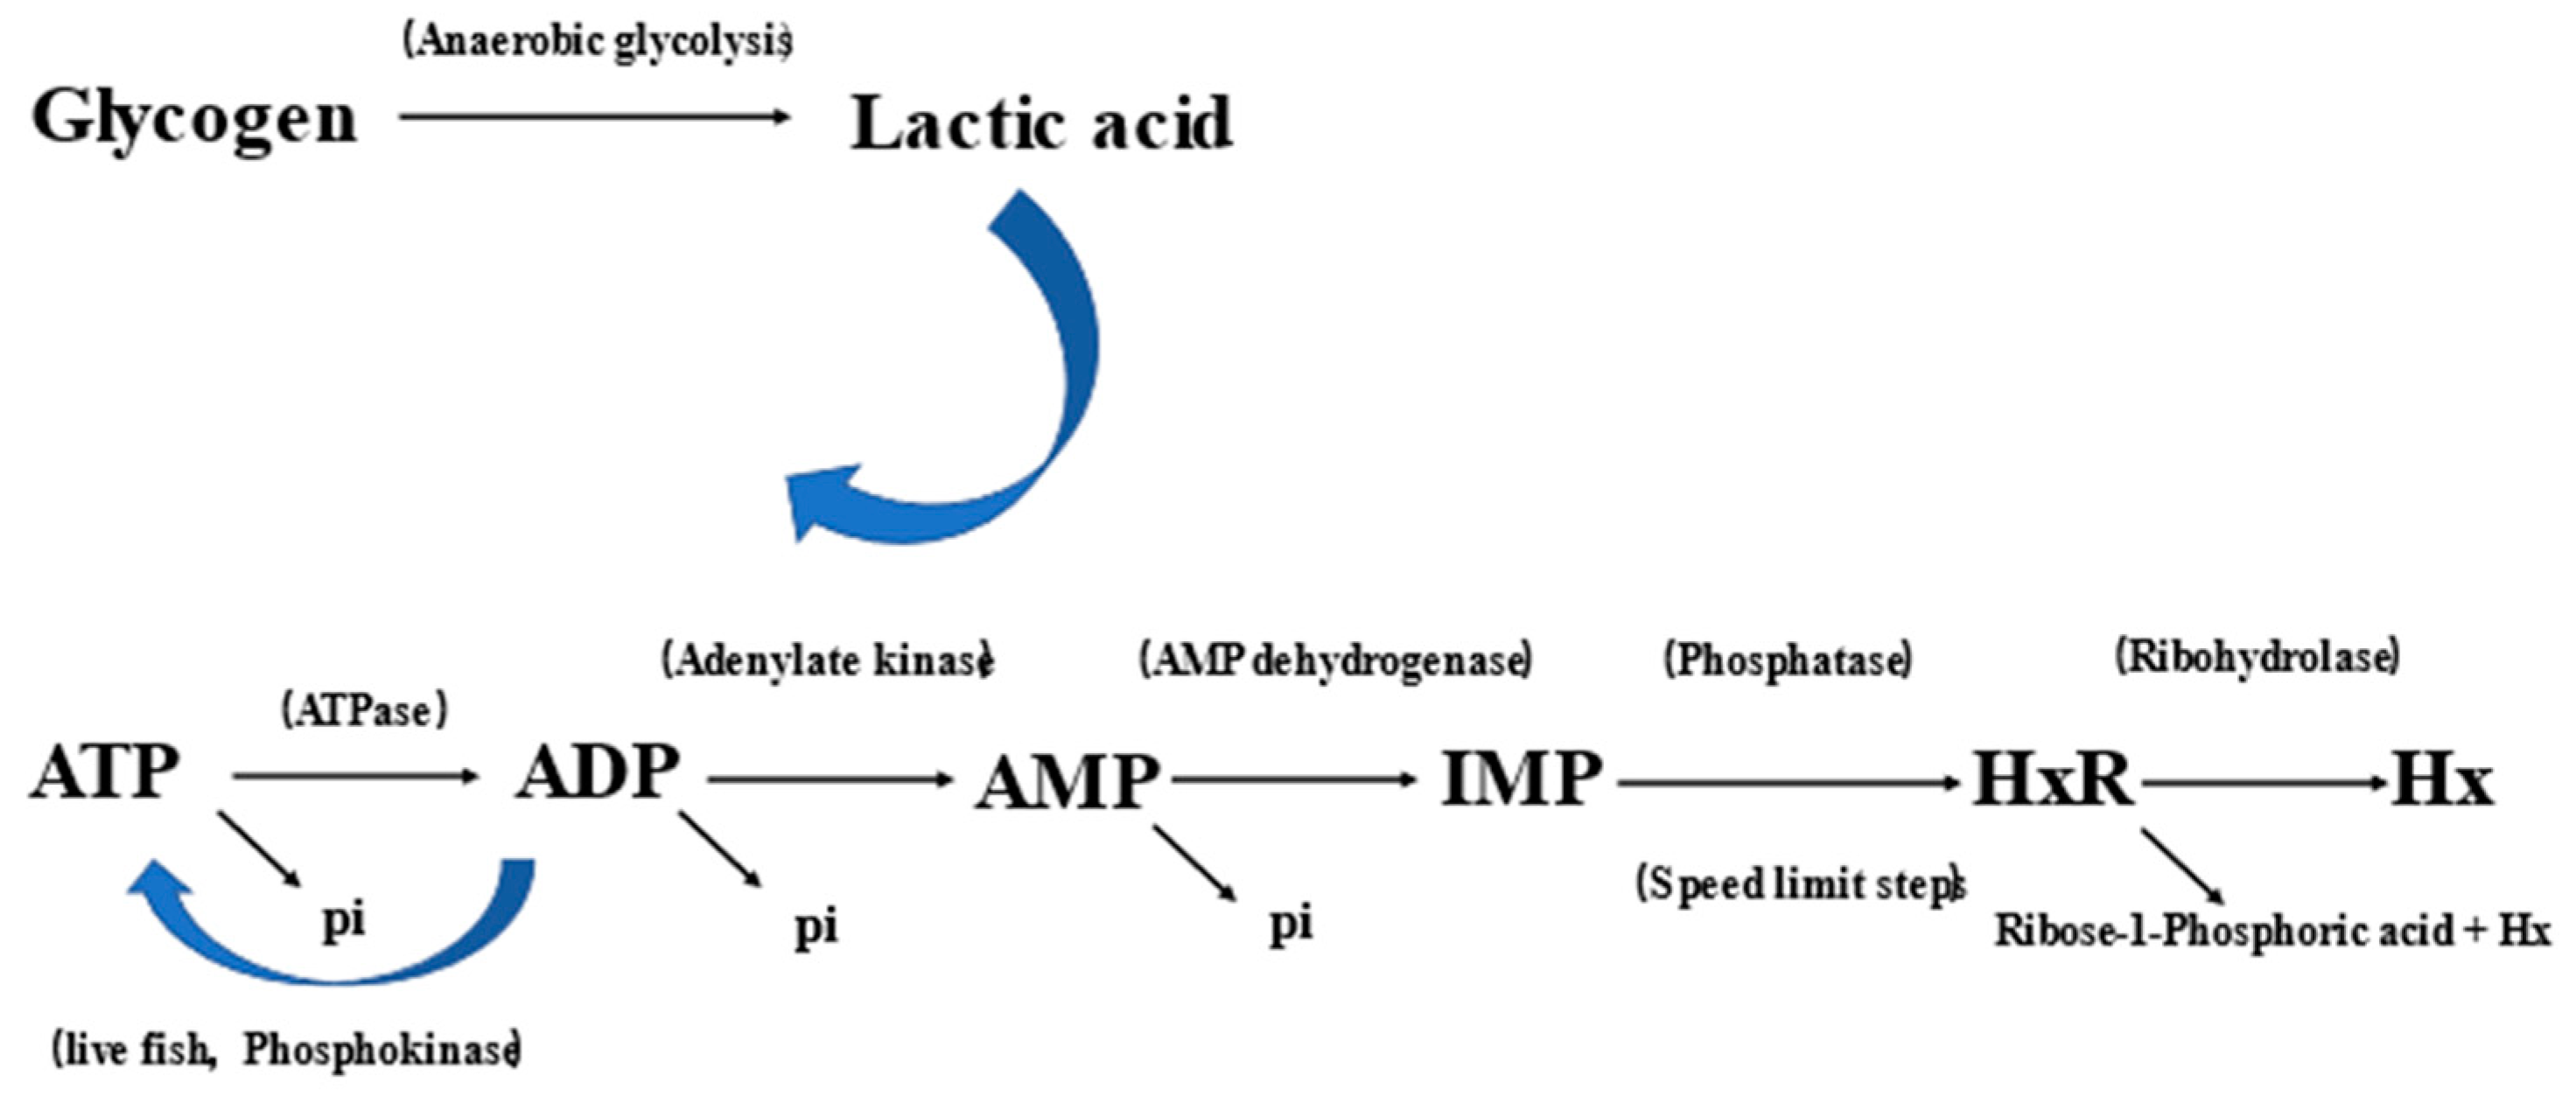
2.7. ATP-Related Compounds
2.8. Free Amino Acids (FAAs) Analysis
3. Discussion
4. Materials and Methods
4.1. Preparation of Turbot
4.2. Water Quality Index
4.3. Proximate Analysis of Fish Flesh
4.4. pH Measurement
4.5. Texture Profile Analysis
4.6. Determination of Water Holding Capacity (WHC)
4.7. Lactic Acid and Glycogen Determination
4.8. Determination of ATP-Related Compounds
4.9. Free Amino Acids (FAAs) Analysis
4.10. Statistical Analysis
5. Conclusions
Author Contributions
Funding
Institutional Review Board Statement
Conflicts of Interest
References
- Manuel, R.; Boerrigter, J.; Roques, J.; Van Der Heul, J.; Bos, R.V.D.; Flik, G.; Van De Vis, H. Stress in African catfish (Clarias gariepinus) following overland transportation. Fish Physiol. Biochem. 2013, 40, 33–44. [Google Scholar] [CrossRef] [PubMed]
- Tacchi, L.; Lowrey, L.; Musharrafieh, R.; Crossey, K.; Larragoite, E.T.; Salinas, I. Effects of transportation stress and addition of salt to transport water on the skin mucosal homeostasis of rainbow trout (Oncorhynchus mykiss). Aquaculture 2015, 435, 120–127. [Google Scholar] [CrossRef] [PubMed] [Green Version]
- Zahl, I.H.; Samuelsen, O.; Kiessling, A. Anaesthesia of farmed fish: Implications for welfare. Fish Physiol. Biochem. 2011, 38, 201–218. [Google Scholar] [CrossRef] [PubMed]
- Acar, Ü.; Parrino, V.; Kesbiç, O.S.; Paro, G.L.; Saoca, C.; Abbate, F.; Yılmaz, S.; Fazio, F. Effects of Different Levels of Pomegranate Seed Oil on Some Blood Parameters and Disease Resistance Against Yersinia ruckeri in Rainbow Trout. Front. Physiol. 2018, 9, 596. [Google Scholar] [CrossRef] [PubMed]
- Martins, T.; Valentim, A.; Pereira, N.; Antunes, L.M. Anaesthetics and analgesics used in adult fish for research: A review. Lab. Anim. 2018, 53, 325–341. [Google Scholar] [CrossRef] [PubMed]
- Correia, A.M.; Pedrazzani, A.S.; Mendonça, R.C.; Massucatto, A.; Ozório, R.A.; Tsuzuki, M.Y. Basil, tea tree and clove essential oils as analgesics and anaesthetics in Amphiprion clarkii (Bennett, 1830). Braz. J. Biol. 2017, 78, 436–442. [Google Scholar] [CrossRef] [PubMed] [Green Version]
- Popovic, N.T.; Strunjak-Perovic, I.; Coz-Rakovac, R.; Barisic, J.; Jadan, M.; Berakovic, A.P.; Klobucar, R.S. Tricaine methane-sulfonate (MS-222) application in fish anaesthesia. J. Appl. Ichthyol. 2012, 28, 553–564. [Google Scholar] [CrossRef] [Green Version]
- Park, I.-S.; Gil, H.W.; Lee, T.H.; Nam, Y.K.; Lim, S.G.; Kim, D.S. Effects of Clove Oil and Lidocaine-HCl Anesthesia on Water Parameter during Simulated Transportation in the Marine Medaka, Oryzias dancena. Dev. Reprod. 2017, 21, 19–33. [Google Scholar] [CrossRef] [Green Version]
- Fazio, F.; Saoca, C.; Costa, G.; Zumbo, A.; Piccione, G.; Parrino, V. Flow cytometry and automatic blood cell analysis in striped bass Morone saxatilis (Walbaum, 1792): A new hematological approach. Aquaculture 2019, 513, 734398. [Google Scholar] [CrossRef]
- Parrino, V.; Cappello, T.; Costa, G.; Cannavà, C.; Sanfilippo, M.; Fazio, F.; Fasulo, S. Comparative study of haematology of two teleost fish (Mugil cephalus and Carassius auratus) from different environments and feeding habits. Eur. Zool. J. 2018, 85, 193–199. [Google Scholar] [CrossRef] [Green Version]
- Devi, A.A.; Kamilya, D. Efficacy and effects of clove oil and MS-222 on the immune-biochemical responses of juvenile rohu Labeo rohita. Aquac. Res. 2019, 50, 957–963. [Google Scholar] [CrossRef]
- Rożyński, M.; Ziomek, E.; Demska-Zakęś, K.; Zakęś, Z. Impact of inducing general anaesthesia with MS-222 on haematological and biochemical parameters of pikeperch (Sander lucioperca). Aquac. Res. 2019, 50, 2125–2132. [Google Scholar] [CrossRef]
- Parrino, V.; Minutoli, R.; Paro, G.L.; Surfaro, D.; Fazio, F. Environmental assessment of the pesticides in Parablennius sanguinolentus along the Western Calabrian coast (Italy). Reg. Stud. Mar. Sci. 2020, 36, 101297. [Google Scholar] [CrossRef]
- Refaey, M.M.; Tian, X.; Tang, R.; Li, D. Changes in physiological responses, muscular composition and flesh quality of channel catfish Ictalurus punctatus suffering from transport stress. Aquaculture 2017, 478, 9–15. [Google Scholar] [CrossRef]
- Roth, B.; Slinde, E.; Arildsen, J. Pre or post mortem muscle activity in Atlantic salmon (Salmo salar). The effect on rigor mortis and the physical properties of flesh. Aquaculture 2006, 257, 504–510. [Google Scholar] [CrossRef]
- Gomes, L.D.; Araujo-Lima, C.; Roubach, R.; Urbinati, E.C. Assessment on the effect of salt and density on tambaqui fish transportation. Pesqui. Agropecu. Bras. 2003, 38, 283–290. [Google Scholar] [CrossRef] [Green Version]
- Sampaio, F.D.F.; Freire, C.A. An overview of stress physiology of fish transport: Changes in water quality as a function of transport duration. Fish Fish. 2016, 17, 1055–1072. [Google Scholar] [CrossRef]
- Santos, E.L.R.; Rezende, F.P.; Moron, S.E. Stress-related physiological and histological responses of tambaqui (Colossoma macropomum) to transportation in water with tea tree and clove essential oil anesthetics. Aquaculture 2020, 523, 735164. [Google Scholar] [CrossRef]
- Kamalam, B.S.; Patiyal, R.S.; Rajesh, M.; Mir, J.I.; Singh, A.K. Prolonged transport of rainbow trout fingerlings in plastic bags: Optimization of hauling conditions based on survival and water chemistry. Aquaculture 2017, 480, 103–107. [Google Scholar] [CrossRef]
- Anjos, G.M.D.; Soares, E.C.; Dantas, L.H.N.; Santos, R.B.D.; Pinheiro, D.M.; Albuquerque, Á.A. Eugenol, salt and plaster in the transport of tambaqui in closed systems. PUBEVT 2011, 5, 1064–1075. [Google Scholar]
- Jørpeland, G.; Imsland, A.; Stien, L.H.; Bleie, H.; Roth, B. Effects of filleting method, stress, storage and season on the quality of farmed Atlantic cod (Gadus morhua L.). Aquac. Res. 2015, 46, 1597–1607. [Google Scholar] [CrossRef]
- Dhanasiri, A.K.; Fernandes, J.M.; Kiron, V. Acclimation of Zebrafish to Transport Stress. Zebrafish 2013, 10, 87–98. [Google Scholar] [CrossRef] [PubMed]
- Costas, B.; Conceicao, L.; Aragão, C.; Martos, J.A.; Ruiz-Jarabo, I.; Mancera, J.M.; Afonso, A. Physiological responses of Senegalese sole (Solea senegalensis Kaup, 1858) after stress challenge: Effects on non-specific immune parameters, plasma free amino acids and energy metabolism. Aquaculture 2011, 316, 68–76. [Google Scholar] [CrossRef]
- El-Ebiary, E.Z.; Zaki, M.A. Effect of supplementing active yeast to the diets on growth performance, nutrient utilization, whole body composition and blood constituents of Mono-sex tilapia (Oreochromis niloticus). Egypt. J. Aquat. Biol. Fish 2003, 7, 127–139. [Google Scholar]
- Hernández, M.; López, M.; Álvarez, A.; Ferrandini, E.; García, B.G.; Garrido, M. Sensory, physical, chemical and microbiological changes in aquacultured meagre (Argyrosomus regius) fillets during ice storage. Food Chem. 2009, 114, 237–245. [Google Scholar] [CrossRef]
- Hultmann, L.; Phu, T.M.; Tobiassen, T.; Aas-Hansen, Ø.; Rustad, T. Effects of pre-slaughter stress on proteolytic enzyme activities and muscle quality of farmed Atlantic cod (Gadus morhua). Food Chem. 2012, 134, 1399–1408. [Google Scholar] [CrossRef] [PubMed]
- Molnár, T.; Molnár, M.; Ardó, L.; Jeney, Z.; Hanc, C.; Szabó, A.; Varga, D. Impact of Handling and Pre-Mortal Stress on the Flesh Quality of Common Carp (Cyprinus carpio L.). Isr. J. Aquac. Bamidgeh 2014, 66, 20746. [Google Scholar] [CrossRef]
- Kristoffersen, S.; Tobiassen, T.; Steinsund, V.; Olsen, R.L. Slaughter stress, postmortem muscle pH and rigor development in farmed Atlantic cod (Gadus morhua L.). Int. J. Food Sci. Technol. 2006, 41, 861–864. [Google Scholar] [CrossRef]
- Fuentes, A.; Fernández-Segovia, I.; Serra, J.A.; Barat, J.M. Comparison of wild and cultured sea bass (Dicentrarchus labrax) quality. Food Chem. 2010, 119, 1514–1518. [Google Scholar] [CrossRef]
- Dunajski, E. Texture of fish muscle. J. Texture Stud. 1980, 10, 301–318. [Google Scholar] [CrossRef]
- Ghalati, L.N.; Khodanazary, A.; Hosseini, S.M.; Matroodi, S. Combination Effect of Phosphate and Vacuum Packaging on Quality Parameters of Refrigerated Aurigequula fasciata Fillets. J. Packag. Technol. Res. 2017, 1, 101–112. [Google Scholar] [CrossRef]
- Wang, S.; Xiang, W.; Fan, H.Z.; Xie, J.; Qian, Y.F. Study on the mobility of water and its correlation with the spoilage process of salmon (Salmo solar) stored at 0 and 4 A degrees C by low-field nuclear magnetic resonance (LF NMR H-1). J. Food Sci. Technol. Mysore 2018, 55, 173–182. [Google Scholar] [CrossRef] [PubMed]
- Hertog-Meischke, M.D.; Vada-Kovács, M.; Smulders, F. The effect of simulated transport of fresh meats on their water-holding capacity as assessed by various methods. Meat Sci. 1997, 46, 1–8. [Google Scholar] [CrossRef]
- Moraes, G.; Avilez, I.M.; Altran, A.E.; Barbosa, C.C. Biochemical and hematological responses of the banded knife fish Gymnotus carapo (Linnaeus, 1758) exposed to environmental hypoxia. Braz. J. Biol. 2002, 62, 633–640. [Google Scholar] [CrossRef] [PubMed]
- Bonga, S.E.W. The stress response in fish. Physiol. Rev. 1997, 77, 591–625. [Google Scholar] [CrossRef] [PubMed]
- Vijayan, M.M.; Pereira, C.; Moon, T.W. Hormonal stimulation of hepatocyte metabolism in rainbow trout following an acute handling stress. Comp. Biochem. Physiol. Part C Pharmacol. Toxicol. Pharmacol. 1994, 108, 321–329. [Google Scholar] [CrossRef]
- Robertson, L.; Thomas, P.; Arnold, C. Plasma cortisol and secondary stress responses of cultured red drum (Sciaenops ocellatus) to several transportation procedures. Aquaculture 1988, 68, 115–130. [Google Scholar] [CrossRef]
- Li, P.; Chen, Z.; Tan, M.; Mei, J.; Xie, J. Evaluation of weakly acidic electrolyzed water and modified atmosphere packaging on the shelf life and quality of farmed puffer fish (Takifugu obscurus) during cold storage. J. Food Saf. 2020, 40, 14. [Google Scholar] [CrossRef]
- Osako, K.; Fujii, A.; Ruttanapornvareesakul, Y.; Nagano, N.; Kuwahara, K.; Okamoto, A. Differences in free amino acid composition between testis and ovary of sea urchin Anthocidaris crassispina during gonadal development. Fish Sci. 2007, 73, 660–667. [Google Scholar] [CrossRef]
- Wu, B.; Wang, Q.; Cao, J.; Mei, J.; Xie, J. Effects of Ascorbic Acid and β-1,3-Glucan on Survival, Physiological Response and Flesh Quality of Cultured Tiger Grouper (Epinephelus fuscoguttatus) during Simulated Transport in Water. Biology 2020, 9, 37. [Google Scholar] [CrossRef] [PubMed] [Green Version]
- Ntzimani, A.; Angelakopoulos, R.; Semenoglou, I.; Dermesonlouoglou, E.; Tsironi, T.; Moutou, K.; Taoukis, P. Slurry ice as an alternative cooling medium for fish harvesting and transportation: Study of the effect on seabass flesh quality and shelf life. Aquac. Fish 2021, 1. [Google Scholar] [CrossRef]
- Romotowska, P.E.; Gudjónsdóttir, M.; Karlsdóttir, M.G.; Kristinsson, H.G.; Arason, S. Stability of frozen Atlantic mackerel (Scomber scombrus) as affected by temperature abuse during transportation. LWT 2017, 83, 275–282. [Google Scholar] [CrossRef]
- Zhang, X.; Shen, Z.; Qi, T.; Xi, R.; Liang, X.; Li, L.; Tang, R.; Li, D. Slight Increases in Salinity Improve Muscle Quality of Grass Carp (Ctenopharyngodon idellus). Fishes 2021, 6, 7. [Google Scholar] [CrossRef]
- Zang, J.; Xu, Y.; Xia, W.; Jiang, Q. The impact of desmin on texture and water-holding capacity of ice-stored grass carp (Ctenopharyngodon idella) fillet. Int. J. Food Sci. Technol. 2016, 52, 464–471. [Google Scholar] [CrossRef]
- Karim, N.U.; Kennedy, J.T.; Linton, M.; Patterson, M.; Watson, S.; Gault, N. Determination of nucleotide and enzyme degradation in haddock (Melanogrammus aeglefinus) and herring (Clupea harengus) after high pressure processing. Peer J. 2019, 7, e7527. [Google Scholar] [CrossRef] [PubMed] [Green Version]
- Liu, W.; Shen, Y.; Li, N.; Mei, J.; Xie, J. Application of Gelatin Incorporated with Red Pitaya Peel Methanol Extract as Edible Coating for Quality Enhancement of Crayfish (Procambarus clarkii) during Refrigerated Storage. J. Food Qual. 2019, 2019, 1–8. [Google Scholar] [CrossRef] [Green Version]


| Samples | 0 h | 6 h | 12 h | 18 h | 24 h | |
|---|---|---|---|---|---|---|
| Dissolved oxygen (mg·L−1) | CK | 6.84 ± 0.17 Aa | 4.37 ± 0.20 Ab | 3.52 ± 0.13 Ac | 2.47 ± 0.08 Ad | 1.18 ± 0.23 Ae |
| MS-222-20 mg/L | 6.81 ± 0.09 Aa | 5.03 ± 0.26 Bb | 4.21 ± 0.33 Bc | 3.37 ± 0.28 Bd | 2.05 ± 0.17 Be | |
| MS-222-40 mg/L | 6.86 ± 0.08 Aa | 5.15 ± 0.25 Bb | 4.42 ± 0.16 Bc | 3.64 ± 0.23 Cd | 2.65 ± 0.16 Ce | |
| MS-222-60 mg/L | 6.83 ± 0.10 Aa | 5.61 ± 0.14 Cb | 5.08 ± 0.37 Cc | 4.32 ± 0.24 Dd | 3.23 ± 0.19 De | |
| TAN (mg·L−1) | CK | 0.09 ± 0.01 Aa | 1.83 ± 0.12 Ab | 2.73 ± 0.10 Ac | 3.62 ± 0.13 Ad | 4.14 ± 0.09 Ae |
| MS-222-20 mg/L | 0.10 ± 0.01 Aa | 1.22 ± 0.09 Bb | 2.03 ± 0.14 Bc | 3.02 ± 0.07 Bd | 3.51 ± 0.08 Be | |
| MS-222-40 mg/L | 0.08 ± 0.01 Aa | 1.14 ± 0.10 Bb | 1.91 ± 0.18 Bc | 2.68 ± 0.06 Cd | 3.09 ± 0.26 Ce | |
| MS-222-60 mg/L | 0.09 ± 0.01 Aa | 0.88 ± 0.55 Cb | 1.47 ± 0.55 Cc | 2.27 ± 0.03 Dd | 2.70 ± 0.08 De | |
| pH | CK | 7.53 ± 0.13 Aa | 7.32 ± 0.11 Ab | 7.14 ± 0.06 Ac | 6.92 ± 0.12 Ad | 6.79 ± 0.10 Ae |
| MS-222-20 mg/L | 7.49 ± 0.05 Aa | 7.40 ± 0.08 Bb | 7.29 ± 0.12 Bc | 7.13 ± 0.11 Bd | 6.98 ± 0.07 Be | |
| MS-222-40 mg/L | 7.50 ± 0.11 Aa | 7.41 ± 0.06 Bb | 7.31 ± 0.03 Bc | 7.18 ± 0.04 Cd | 7.06 ± 0.09 Ce | |
| MS-222-60 mg/L | 7.51 ± 0.09 Aa | 7.44 ± 0.07 Bb | 7.40 ± 0.08 Cc | 7.24 ± 0.09 Dd | 7.13 ± 0.04 De |
| Samples | 0 h | 6 h | 12 h | 18 h | 24 h | |
|---|---|---|---|---|---|---|
| Water content (%) | CK | 78.29 ± 0.17 Aa | 78.14 ± 0.08 Aa | 78.02 ± 0.10 Aab | 77.85 ± 0.08 Abc | 77.60 ± 0.19 Ac |
| MS-222-20 mg/L | 78.29 ± 0.17 Aa | 78.19 ± 0.06 Aa | 78.12 ± 0.04 Aa | 78.01 ± 0.13 ABab | 77.84 ± 0.07 ABb | |
| MS-222-40 mg/L | 78.29 ± 0.17 Aa | 78.20 ± 0.12 Aa | 78.15 ± 0.05 Aa | 78.09 ± 0.09 Ba | 78.01 ± 0.14 BCa | |
| MS-222-60 mg/L | 78.29 ± 0.17 Aa | 78.21 ± 0.13 Aab | 78.17 ± 0.10 Aab | 78.12 ± 0.09 Bab | 78.05 ± 0.03 Cb | |
| Crude fat (%) | CK | 1.44 ± 0.02 Aa | 1.26 ± 0.04 Ab | 1.07 ± 0.08 Ac | 0.81 ± 0.07 Ad | 0.67 ± 0.05 Ae |
| MS-222-20 mg/L | 1.44 ± 0.02 Aa | 1.32 ± 0.07 Bb | 1.19 ± 0.12 Bc | 0.91 ± 0.12 Bd | 0.77 ± 0.10 Be | |
| MS-222-40 mg/L | 1.44 ± 0.02 Aa | 1.33 ± 0.03 Bb | 1.22 ± 0.03 Bb | 1.04 ± 0.15 Cd | 0.92 ± 0.07 Ce | |
| MS-222-60 mg/L | 1.44 ± 0.02 Aa | 1.35 ± 0.03 Bb | 1.23 ± 0.06 Bb | 1.02 ± 0.08 Cd | 0.89 ± 0.04 Ce | |
| Crude protein (%) | CK | 18.53 ± 0.06 Aa | 18.77 ± 0.13 Ab | 18.90 ± 0.07 Ac | 19.19 ± 0.10 Ad | 19.55 ± 0.19 Ae |
| MS-222-20 mg/L | 18.53 ± 0.06 Aa | 18.69 ± 0.17 Bb | 18.83 ± 0.21 ABc | 18.98 ± 0.06 Bd | 19.28 ± 0.14 Be | |
| MS-222-40 mg/L | 18.53 ± 0.06 Aa | 18.61 ± 0.15 Cb | 18.72 ± 0.09 Bc | 19.86 ± 0.12 Bd | 19.15 ± 0.27 Ce | |
| MS-222-60 mg/L | 18.53 ± 0.06 Aa | 18.62 ± 0.21 Cb | 18.74 ± 0.10 Bc | 18.89 ± 0.17 Bd | 19.12 ± 0.11 Ce |
| Samples | 0 h | 6 h | 12 h | 18 h | 24 h | |
|---|---|---|---|---|---|---|
| Springiness (%) | CK | 0.838 ± 0.013 Aa | 0.832 ± 0.009 Ab | 0.821 ± 0.006 Ac | 0.814 ± 0.011 Ad | 0.798 ± 0.015 Ae |
| MS-222-20 mg/L | 0.838 ± 0.013 Aa | 0.835 ± 0.007 Bb | 0.827 ± 0.004 Bc | 0.819 ± 0.005 Bd | 0.812 ± 0.012 Be | |
| MS-222-40 mg/L | 0.838 ± 0.013 Aa | 0.836 ± 0.010 Bb | 0.830 ± 0.009 Cc | 0.824 ± 0.009 Cd | 0.816 ± 0.007 Be | |
| MS-222-60 mg/L | 0.838 ± 0.013 Aa | 0.836 ± 0.003 Bb | 0.829 ± 0.012 BCc | 0.822 ± 0.010 BCd | 0.815 ± 0.005 Be | |
| Hardness (g) | CK | 4815.13 ± 121.67 Aa | 4852.71 ± 132.93 Aa | 4895.40 ± 108.15 Aa | 4961.82 ± 133.05 Aa | 5015.46 ± 100.08 Ab |
| MS-222-20 mg/L | 4815.13 ± 121.67 Aa | 4843.27 ± 160.02 Aa | 4879.16 ± 152.58 Aa | 4921.64 ± 138.81 Aa | 4982.77 ± 108.28 Ab | |
| MS-222-40 mg/L | 4815.13 ± 121.67 Aa | 4838.07 ± 142.66 Aa | 4864.31 ± 136.14 Aa | 4900.36 ± 153.76 Aa | 4944.15 ± 171.84 Ab | |
| MS-222-60 mg/L | 4815.13 ± 121.67 Aa | 4826.78 ± 153.47 Aa | 4866.52 ± 106.63 Aa | 4895.48 ± 162.37 Aa | 4947.89 ± 152.79 Aa | |
| Chewiness | CK | 477.53 ± 12.17 Aa | 487.21 ± 16.37 Aa | 495.83 ± 16.82 Aab | 504.81 ± 13.17 Aab | 514.62 ± 12.07 Ab |
| MS-222-20 mg/L | 477.53 ± 12.17 Aa | 484.14 ± 13.56 Aa | 490.92 ± 10.43 Aab | 499.25 ± 14.53 Aab | 508.74 ± 11.07 Ab | |
| MS-222-40 mg/L | 477.53 ± 12.17 Aa | 482.63 ± 13.91 Aa | 486.87 ± 9.43 Aab | 494.26 ± 16.83 Aab | 502.48 ± 17.63 Ab | |
| MS-222-60 mg/L | 477.53 ± 12.17 Aa | 480.52 ± 8.66b Aa | 485.12 ± 12.73 Aa | 492.53 ± 13.68 Aa | 499.76 ± 16.89 Aa | |
| Cohesiveness | CK | 0.726 ± 0.014 Aa | 0.729 ± 0.005 Aa | 0.732 ± 0.009 Aa | 0.735 ± 0.011 Aa | 0.738 ± 0.012 Aa |
| MS-222-20 mg/L | 0.726 ± 0.014 Aa | 0.730 ± 0.008 Aa | 0.731 ± 0.014 Aa | 0.733 ± 0.005 Aa | 0.737 ± 0.007 Aa | |
| MS-222-40 mg/L | 0.726 ± 0.014 Aa | 0.727 ± 0.012 Aa | 0.729 ± 0.006 Aa | 0.731 ± 0.012 Aa | 0.734 ± 0.011 Aa | |
| MS-222-60 mg/L | 0.726 ± 0.014 Aa | 0.728 ± 0.011 Aa | 0.729 ± 0.012 Aa | 0.732 ± 0.007 Aa | 0.734 ± 0.009 Aa |
| Time | Samples | Aspartic Acid | Threonine | Serine | Glutamic Acid | Glycine |
|---|---|---|---|---|---|---|
| Not transported | 3.03 ± 0.36 | 15.87 ± 0.75 | 9.25 ± 0.28 | 13.02 ± 0.43 | 70.69 ± 0.49 | |
| 6 h | CK | 3.18 ± 0.13 Aa | 14.74 ± 0.18 Aa | 9.53 ± 0.31 Aa | 14.22 ± 0.26 Aa | 74.43 ± 0.62 Aa |
| MS-222-20 mg/L | 3.07 ± 0.22 ABa | 14.93 ± 0.25 ABa | 9.40 ± 0.19 Aa | 13.68 ± 0.18 Ba | 76.03 ± 0.43 Ba | |
| MS-222-40 mg/L | 2.84 ± 0.14 Ba | 15.13 ± 0.21 Ba | 9.42 ± 0.12 Aa | 13.72 ± 0.34 Ba | 75.29 ± 0.31 Ba | |
| MS-222-60 mg/L | 2.78 ± 0.22 Ba | 14.69 ± 0.13 Aa | 9.59 ± 0.28 Aa | 14.07 ± 0.21 ABa | 72.64 ± 0.28 Ca | |
| 12 h | CK | 3.37 ± 0.19 Aab | 13.95 ± 0.31 Ab | 9.98 ± 0.17 ABab | 15.11 ± 0.23 Ab | 77.19 ± 0.17 Ab |
| MS-222-20 mg/L | 3.15 ± 0.07 Aa | 14.42 ± 0.23 BCb | 9.76 ± 0.14 Ab | 14.37 ± 0.19 Bb | 79.62 ± 0.33 Bb | |
| MS-222-40 mg/L | 2.93 ± 0.13 Bab | 14.76 ± 0.11 Cb | 9.68 ± 0.21 Aab | 14.48 ± 0.25 Bb | 80.39 ± 0.19 Bb | |
| MS-222-60 mg/L | 3.09 ± 0.23 ABab | 14.08 ± 0.17 ABb | 10.17 ± 0.23 Bb | 15.28 ± 0.32 Abc | 75.57 ± 0.23 Cb | |
| 18 h | CK | 3.65 ± 0.26 Abc | 13.36 ± 0.24 Ac | 10.34 ± 0.26 ABbc | 16.24 ± 0.28 Ac | 80.46 ± 0.24 Ac |
| MS-222-20 mg/L | 3.37 ± 0.21 ABab | 13.85 ± 0.26 Bc | 10.09 ± 0.13 Ac | 15.12 ± 0.41 Bc | 84.53 ± 0.17 Bc | |
| MS-222-40 mg/L | 3.10 ± 0.14 Bb | 14.21 ± 0.08 Bc | 10.01 ± 0.24 Ab | 14.93 ± 0.13 Bc | 85.75 ± 0.36 Cc | |
| MS-222-60 mg/L | 3.28 ± 0.12 ABb | 13.24 ± 0.16 Ac | 10.58 ± 0.17 Bc | 15.84 ± 0.26 Ac | 78.35 ± 0.21 Dc | |
| 24 h | CK | 3.98 ± 0.11 Ac | 12.68 ± 0.27 Ad | 10.86 ± 0.31 Ac | 17.05 ± 0.16 Ad | 86.71 ± 0.43 Ad |
| MS-222-20 mg/L | 3.61 ± 0.15 Bb | 13.23 ± 0.14 Bd | 10.53 ± 0.18 Ad | 15.89 ± 0.28 Bd | 89.63 ± 0.18 Bd | |
| MS-222-40 mg/L | 3.27 ± 0.22 Cb | 13.88 ± 0.36 Cd | 10.42 ± 0.13 Ac | 15.56 ± 0.23 Bd | 92.57 ± 0.24 Cd | |
| MS-222-60 mg/L | 3.63 ± 0.17 Bc | 12.41 ± 0.22 Ad | 10.69 ± 0.23 Ac | 16.43 ± 0.22 Cd | 82.49 ± 0.17 Dd | |
| Time | Samples | Alanine | Valine | Methionine | Isoleucine | Leucine |
| Not transported | 28.36 ± 0.62 | 6.69 ± 0.31 | 6.07 ± 0.37 | 4.88 ± 0.34 | 8.53 ± 0.29 | |
| 6 h | CK | 29.22 ± 0.28 ABa | 6.98 ± 0.21 Aa | 6.15 ± 0.09 Aa | 5.12 ± 0.21 Aa | 8.76 ± 0.17 Aa |
| MS-222-20 mg/L | 29.62 ± 0.19 Aa | 6.77 ± 0.13 Aa | 6.22 ± 0.14 Aa | 5.00 ± 0.07 Aa | 8.56 ± 0.09 Aa | |
| MS-222-40 mg/L | 29.45 ± 0.23 Aa | 6.80 ± 0.11 Aa | 6.26 ± 0.07 Aa | 5.05 ± 0.11 Aa | 8.62 ± 0.11 Aa | |
| MS-222-60 mg/L | 28.92 ± 0.27 Ba | 6.92 ± 0.06 Aa | 6.14 ± 0.11 Aa | 5.16 ± 0.22 Aa | 8.74 ± 0.05 Aa | |
| 12 h | CK | 30.45 ± 0.16 Ab | 7.46 ± 0.23 Ab | 6.28 ± 0.11 Aab | 5.27 ± 0.14 Aa | 8.93 ± 0.14 Aa |
| MS-222-20 mg/L | 31.06 ± 0.24 Bb | 7.11 ± 0.17 Bb | 6.37 ± 0.04 Aab | 5.13 ± 0.09 Aab | 8.65 ± 0.06 Ba | |
| MS-222-40 mg/L | 31.14 ± 0.11 Bb | 7.05 ± 0.09 Bb | 6.42 ± 0.08 Ab | 5.15 ± 0.06 Aab | 8.70 ± 0.08 Ba | |
| MS-222-60 mg/L | 29.47 ± 0.26 Cb | 7.33 ± 0.13 ABb | 6.26 ± 0.13 Aab | 5.33 ± 0.13 Aa | 8.89 ± 0.16 ABa | |
| 18 h | CK | 31.46 ± 0.17 Ac | 8.03 ± 0.19 Ac | 6.40 ± 0.10 Ab | 5.44 ± 0.23 Aab | 9.08 ± 0.22 Aa |
| MS-222-20 mg/L | 32.06 ± 0.21 Bc | 7.62 ± 0.22 BCc | 6.58 ± 0.07 Ab | 5.30 ± 0.11 ABb | 8.74 ± 0.13 ABab | |
| MS-222-40 mg/L | 32.53 ± 0.23 Bc | 7.44 ± 0.14 Cc | 6.61 ± 0.14 Abc | 5.26 ± 0.08 Bb | 8.77 ± 0.11 ABa | |
| MS-222-60 mg/L | 30.38 ± 0.44 Cc | 7.89 ± 0.11 ABc | 6.43 ± 0.21 Aab | 5.43 ± 0.13 Aa | 9.16 ± 0.07 Bb | |
| 24 h | CK | 32.56 ± 0.36 Ad | 8.74 ± 0.08 Ad | 6.51 ± 0.15 Ab | 5.80 ± 0.09 Ab | 9.49 ± 0.14 Ab |
| MS-222-20 mg/L | 33.47 ± 0.25 Bd | 8.11 ± 0.33 BCd | 6.72 ± 0.06 ABc | 5.58 ± 0.12 ABc | 8.93 ± 0.21 Bb | |
| MS-222-40 mg/L | 34.12 ± 0.43 Cd | 7.86 ± 0.21 Cd | 6.80 ± 0.09 Bc | 5.44 ± 0.09 Bc | 8.96 ± 0.06 Bb | |
| MS-222-60 mg/L | 31.53 ± 0.17 Dd | 8.42 ± 0.27 ABd | 6.58 ± 0.12 Ab | 5.77 ± 0.14 Ab | 9.44 ± 0.12 Ac | |
| Time | Samples | Tyrosine | Phenylalanine | Lysine | Histidine | Arginine |
| Not transported | 8.37 ± 0.21 | 4.36 ± 0.28 | 38.54 ± 0.54 | 4.70 ± 0.25 | 9.59 ± 0.32 | |
| 6 h | CK | 8.51 ± 0.07 Aa | 4.48 ± 0.13 Aa | 38.79 ± 0.06 Aa | 4.83 ± 0.14 Aa | 9.86 ± 0.14 Aa |
| MS-222-20 mg/L | 8.40 ± 0.05 Aa | 4.40 ± 0.05 Aa | 38.59 ± 0.11 Aa | 4.75 ± 0.06 Aa | 9.67 ± 0.12 Aa | |
| MS-222-40 mg/L | 8.38 ± 0.07 Aa | 4.34 ± 0.08 Aa | 38.62 ± 0.07 Aa | 4.77 ± 0.10 Aa | 9.70 ± 0.08 Aa | |
| MS-222-60 mg/L | 8.47 ± 0.11 Aa | 4.46 ± 0.06 Aa | 38.74 ± 0.14 Aa | 4.92 ± 0.21 Aa | 9.88 ± 0.17 Aa | |
| 12 h | CK | 8.59 ± 0.04 Aa | 4.62 ± 0.11 Aab | 38.96 ± 0.10 Ab | 4.95 ± 0.07 ABab | 10.04 ± 0.13 Aa |
| MS-222-20 mg/L | 8.47 ± 0.07 Bab | 4.46 ± 0.07 ABa | 38.72 ± 0.07 Bab | 4.82 ± 0.04 Aa | 9.81 ± 0.07 Ba | |
| MS-222-40 mg/L | 8.42 ± 0.10 Bab | 4.42 ± 0.04 Bab | 38.71 ± 0.16 Bab | 4.83 ± 0.09 Aa | 9.83 ± 0.09 ABab | |
| MS-222-60 mg/L | 8.58 ± 0.03 Aa | 4.58 ± 0.06 ABa | 39.01 ± 0.13 Aa | 5.03 ± 0.11 Ba | 10.16±0.14 ABab | |
| 18 h | CK | 8.66 ± 0.04 Aab | 4.73 ± 0.08 Aab | 39.21 ± 0.14 Ac | 5.14 ± 0.14 ACbc | 10.37 ± 0.11 Ab |
| MS-222-20 mg/L | 8.53 ± 0.07 Bbc | 4.55 ± 0.04 Bb | 38.86 ± 0.11 Bb | 4.96 ± 0.05 ABb | 9.99 ± 0.08 Bb | |
| MS-222-40 mg/L | 8.48 ± 0.05 Bab | 4.49 ± 0.06 Bb | 38.79 ± 0.07 Bb | 4.90 ± 0.07 Bab | 9.94 ± 0.05 Bb | |
| MS-222-60 mg/L | 8.72 ± 0.12 Aa | 4.80 ± 0.11 Ab | 39.40 ± 0.16 Ab | 5.33 ± 0.18 Cb | 10.42 ± 0.14 Ab | |
| 24 h | CK | 8.73 ± 0.08 Ab | 4.86 ± 0.14 Ab | 39.52 ± 0.21 Ac | 5.33 ± 0.12 ACc | 10.55 ± 0.17 Ab |
| MS-222-20 mg/L | 8.60 ± 0.04 Bc | 4.67 ± 0.05 Bc | 39.11 ± 0.09 Bc | 5.09 ± 0.11 ABb | 10.12 ± 0.11 Bb | |
| MS-222-40 mg/L | 8.54 ± 0.03 Bb | 4.58 ± 0.07 Bb | 38.94 ± 0.11 Bb | 5.01 ± 0.06 Bb | 10.06 ± 0.09 Bb | |
| MS-222-60 mg/L | 8.81 ± 0.11 Ab | 4.89 ± 0.10 Ab | 39.52 ± 0.18 Ab | 5.47 ± 0.23 Cb | 10.68 ± 0.23 Ab | |
| Time | Samples | Proline | Total | |||
| Not transported | 7.09 ± 0.26 | 239.04 | ||||
| 6 h | CK | 7.43 ± 0.17 Aa | 242.23 | |||
| MS-222-20 mg/L | 7.16 ± 0.07 Ba | 246.61 | ||||
| MS-222-40 mg/L | 7.05 ± 0.13 Ba | 245.44 | ||||
| MS-222-60 mg/L | 7.33 ± 0.14 ABa | 243.45 | ||||
| 12 h | CK | 7.66 ± 0.15 Ab | 252.81 | |||
| MS-222-20 mg/L | 7.29 ± 0.11 Ba | 253.21 | ||||
| MS-222-40 mg/L | 7.18 ± 0.09 Bab | 254.19 | ||||
| MS-222-60 mg/L | 7.52 ± 0.08 Aa | 250.35 | ||||
| 18 h | CK | 7.90 ± 0.21 Abc | 260.47 | |||
| MS-222-20 mg/L | 7.46 ± 0.15 Bb | 261.61 | ||||
| MS-222-40 mg/L | 7.33 ± 0.14 Bbc | 258.05 | ||||
| MS-222-60 mg/L | 7.74 ± 0.11 Ab | 257.09 | ||||
| 24 h | CK | 8.23 ± 0.16 Ac | 271.60 | |||
| MS-222-20 mg/L | 7.69 ± 0.22 Bc | 270.98 | ||||
| MS-222-40 mg/L | 7.51 ± 0.09 Bc | 273.52 | ||||
| MS-222-60 mg/L | 7.94 ± 0.14 Ab | 264.70 | ||||
Publisher’s Note: MDPI stays neutral with regard to jurisdictional claims in published maps and institutional affiliations. |
© 2021 by the authors. Licensee MDPI, Basel, Switzerland. This article is an open access article distributed under the terms and conditions of the Creative Commons Attribution (CC BY) license (https://creativecommons.org/licenses/by/4.0/).
Share and Cite
Cao, J.; Wang, Q.; Mei, J.; Xie, J. Effect of 3-Aminobenzoic Acid Ethyl Ester Methanesulfonate (MS-222) on Quality of Marine Cultured Turbot (Scophthalmus maximus) during Simulated Transport in Water. Fishes 2021, 6, 20. https://0-doi-org.brum.beds.ac.uk/10.3390/fishes6020020
Cao J, Wang Q, Mei J, Xie J. Effect of 3-Aminobenzoic Acid Ethyl Ester Methanesulfonate (MS-222) on Quality of Marine Cultured Turbot (Scophthalmus maximus) during Simulated Transport in Water. Fishes. 2021; 6(2):20. https://0-doi-org.brum.beds.ac.uk/10.3390/fishes6020020
Chicago/Turabian StyleCao, Jie, Qi Wang, Jun Mei, and Jing Xie. 2021. "Effect of 3-Aminobenzoic Acid Ethyl Ester Methanesulfonate (MS-222) on Quality of Marine Cultured Turbot (Scophthalmus maximus) during Simulated Transport in Water" Fishes 6, no. 2: 20. https://0-doi-org.brum.beds.ac.uk/10.3390/fishes6020020