
Technical Efficiency and Output Losses in Shrimp Farming: A Case in Mekong Delta, Vietnam


1
School of Economics, Can Tho University, Can Tho 94000, Vietnam
2
Department of Agricultural and Resource Economics, Kangwon National University, Chuncheon 24341, Korea
3
College of Rural Development, Can Tho University, Can Tho 94000, Vietnam
*
Author to whom correspondence should be addressed.
Fishes 2021, 6(4), 59; https://0-doi-org.brum.beds.ac.uk/10.3390/fishes6040059
Submission received: 1 October 2021
/
Revised: 4 November 2021
/
Accepted: 8 November 2021
/
Published: 11 November 2021
Abstract
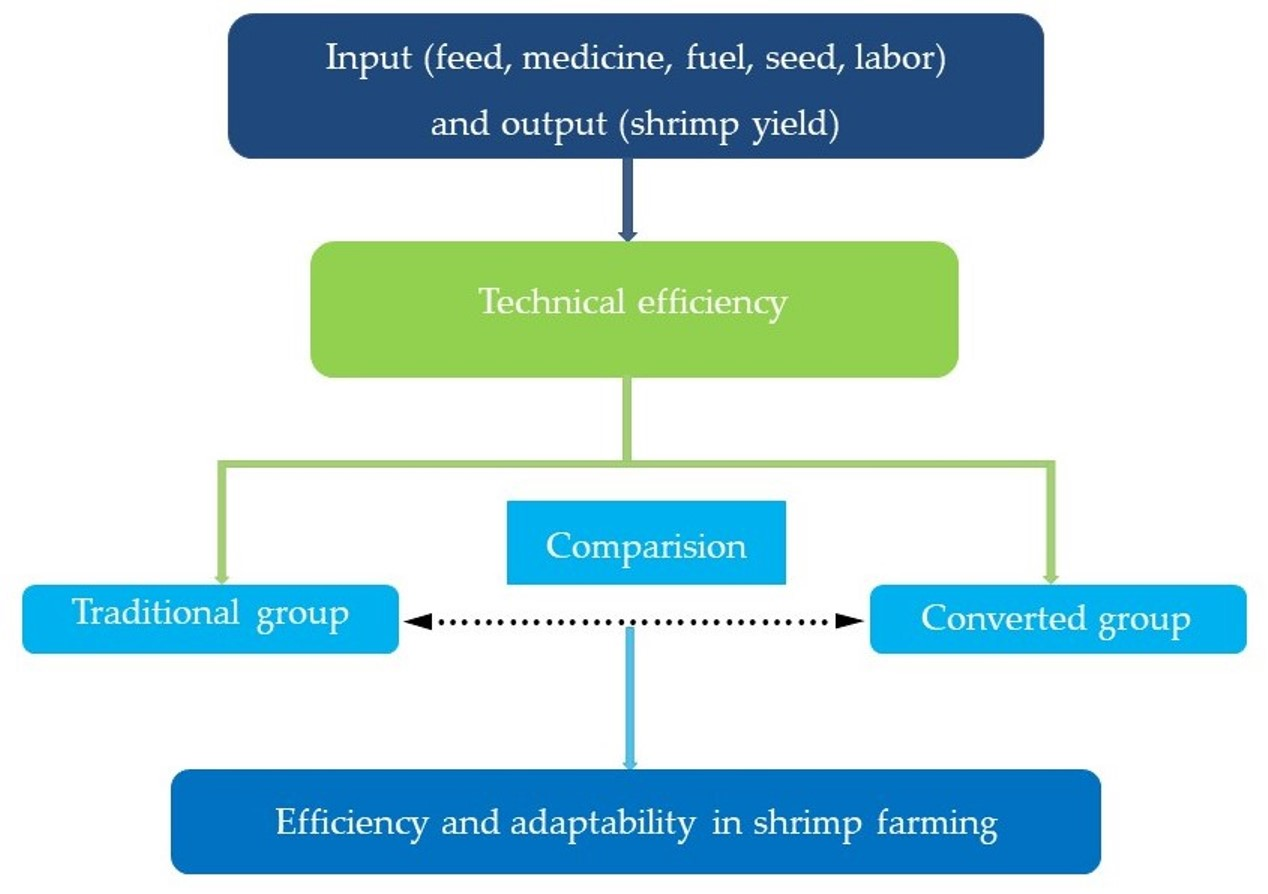
:The conversion from black tiger shrimp farming and crop farming to white leg shrimp production is widespread in Vietnam’s Mekong Delta provinces. However, this conversion trend also contains many risks related to the technical aspects of the production process. The study mainly aims to estimate the technical efficiency of white leg shrimp farming. It also compares the technical efficiency of white leg shrimp farming between the traditional group that historically has cultivated white leg shrimp and the group that recently converted from black tiger shrimp and crops to white leg shrimp, in order to evaluate the efficiency and adaptability of shrimp farming. Primary data were collected by directly interviewing 99 farmers in traditional areas and 101 farmers in recently converted areas in the study sites and analyzed by using the stochastic frontier method. The calculated technical efficiency was around 72.9 percent, suggesting that farmers could increase their output level by about 27.1%, given constant inputs. There was no difference in the technical efficiency of the two groups, indicating that the converted farms have sufficient adaptability when switching to white leg shrimp farming. The output loss in farmers’ production is still very high, with an average loss of 1973 kg/hectare.

1. Introduction
Aquaculture is a key economic sector across Vietnam and especially in the Mekong River Delta. The shrimp industry has played an important role in Vietnam’s seafood exports during the past two decades, with the two main species being black tiger shrimp and white leg shrimp. The shrimp industry annually contributes about 40–45% of the total seafood export value, equivalent to 3.5–4 billion USD [1]. The total shrimp farming area is over 750,000 ha with an output of nearly 900,000 t of which the farming area in the Mekong Delta is over 600,000 ha with an output of over 750,000 t [2]. In recent years, white leg shrimp has gradually become the main farmed species in the coastal provinces of the Mekong Delta. In the period 2015–2019, the production of white leg shrimp increased continuously and strongly by nearly 41%, with an average increase of 9% per year; while the output of black tiger shrimp increased by an average of 1.2% and after five years only increased by 3.1% (the yield of black tiger shrimp increased insignificantly compared to that of white leg shrimp). In 2019, the export turnover of white leg shrimp reached nearly $3.5 billion, accounting for 70% of the total shrimp export value, while black tiger shrimp accounted for only 20% of the total export value [1].
The conversion to white leg shrimp farming is becoming a popular choice among farmers because white-leg shrimp can be intensively farmed and have a reputation for being more disease-resistant and more adaptable [3,4,5]. In addition, environmental conditions in mangrove areas are increasingly unsuitable for black tiger shrimp farming, such as inappropriate pond construction, low-quality soil, low-quality water, high stress levels that result in a higher risk of disease [3]. Therefore, the transition from black tiger shrimp farming to white leg shrimp farming seems inevitable. In doing this, farmers have found that shrimp productivity has increased dramatically without converting additional land or constructing new ponds, and that income has significantly increased [3]. The total cost, revenue, profit, and profit margin for white leg shrimp are all higher than for black tiger shrimp but production costs are lower, indicating that the white leg shrimp farming model is more financially efficient than its counterpart [6]. Most shrimp farms in the Mekong Delta coastal areas are small-scale; many farm-households lack capital for production activities, while access to loans is also limited. They prefer white leg shrimp farming with low input costs due to the lower financial risk [3,7].
The shift from rice monoculture to other agricultural products such as fruits and aquaculture has been popular in the Mekong Delta. The conversion from rice to shrimp farming has proven effective, offering farmers to overcome poverty and have a significantly higher income, especially for farmers living in saline-affected land could typically cultivate only one low-yield rice crop a year [8]. Some agricultural areas in the Mekong River Delta will experience permanent salinity intrusion, and farmers would likely diversify their crops by growing shrimp cultures in the dry season [9]. Therefore, farmers have gradually switched from rice, sugarcane and other crops to super-intensive shrimp farming, especially white leg shrimp. Many sugarcane farmers in the Mekong Delta have switched to shrimp farming solely by growing white leg shrimp due to the unstable market and low productivity of sugarcane. However, the conversion requires high investment and good preparedness for production techniques, which results in high risks [10].
There are few recent studies on the input utilization of shrimp farming that estimate the technical efficiency of farmers’ white leg shrimp culture in the Mekong Delta [11]. It is especially true for farmers who recently converted from black tiger shrimp and other crops to white leg shrimp since this is a new conversion in the Mekong Delta provinces. Therefore, information on the efficiency in terms of technical aspects of white leg shrimp farming, especially for farm-households that recently converted from other crops to white leg shrimp farming, is minimal. It leads to failure to make appropriate policies to develop this converted shrimp farming sustainably.
Minh [6] evaluated the efficiency of the white leg shrimp production in Soc Trang by directly interviewing 30 farm-households producing black tiger shrimp and 30 households converting from black shrimp to white leg shrimp farming, then comparing the efficiency of the two models. The research results show that white leg shrimp farming is more efficient than its counterpart in terms of the financial aspect such as total revenue, cost, profit, profit margin. However, the research has not evaluated the technical efficiency of white leg shrimp farming, especially for farms that switched from black tiger shrimp and other crops to white leg shrimp. Long et al. [12] estimated the technical and financial efficiency of white leg farming in Ca Mau province by directly interviewing 34 white shrimp farming households in Ca Mau. However, the study only made some descriptive statistics on the indicators in the technical aspect of the model; the study did not estimate the level of technical efficiency of the farms. In addition, given the small sample size, the study results may not be representative of the entire Mekong River Delta region.
Trang et al. [10] evaluated the technical and environmental efficiency of the conversion from sugarcane to white leg shrimp farming by collecting information from 90 households in Cu Lao Dung district, Soc Trang province. The research results show that the switch to white leg shrimp farming in this area has not achieved high technical efficiency. However, this is only a study to evaluate the technical efficiency of a particular converted model to white leg shrimp culture.
From the earlier limitations, it is indicated that the technical efficiency of white leg shrimp farming, especially for farmers converting from black tiger shrimp and other crops to white leg shrimp at Mekong Delta provinces, has not been comprehensively studied. Information on the technical efficiency and the adaptability of this converted shrimp farming is minimal. Therefore, making appropriate policies to support this conversion will not be clear. By using the latest survey data on a larger scale, especially in the areas that converted from black tiger shrimp and other crops to white leg shrimp farming, this study estimates the technical efficiency in white leg shrimp farming of farmers in the Mekong Delta provinces to accurately assess the efficiency related to the technical aspects of this cultivation. In addition, this study compares the technical efficiency between the traditional group and the converted group to evaluate the efficiency and adaptability of the converted group when switching to white-leg farming in recent years. Based on that, some policy implications are proposed for the sustainable development of this converted model.
2. Methodology
2.1. Efficiency
Economic efficiency means to increase output without using more conventional inputs. The use of existing technologies is more cost-effective than applying new technologies if farmers cultivate their products with the existing technology inefficiently [13,14]. Economic efficiency can be classified into two parts: technical efficiency and allocative efficiency. Technical efficiency measures the ability of a farmer to achieve the maximum output with given and obtainable technology, while allocative efficiency tries to capture farmer’s ability to apply the inputs in optimal proportions with respective prices [15,16,17].
2.2. Technical Efficiency (TE)
Measuring technical efficiency is to use inputs and output quantity without introducing their prices. Technical efficiency can be decomposed into three components such as scale efficiency (the potential productivity gain from achieving optimal size of a firm), congestion (increase in some inputs could decrease output) and pure technical efficiency [15]. A production plan is technically inefficient if a higher level of output is technically attainable for the given inputs (output-oriented measure), or that the observed output level can be produced using fewer inputs (input-oriented measure) [17].
2.2.1. Input-Orientated Technical Efficiency
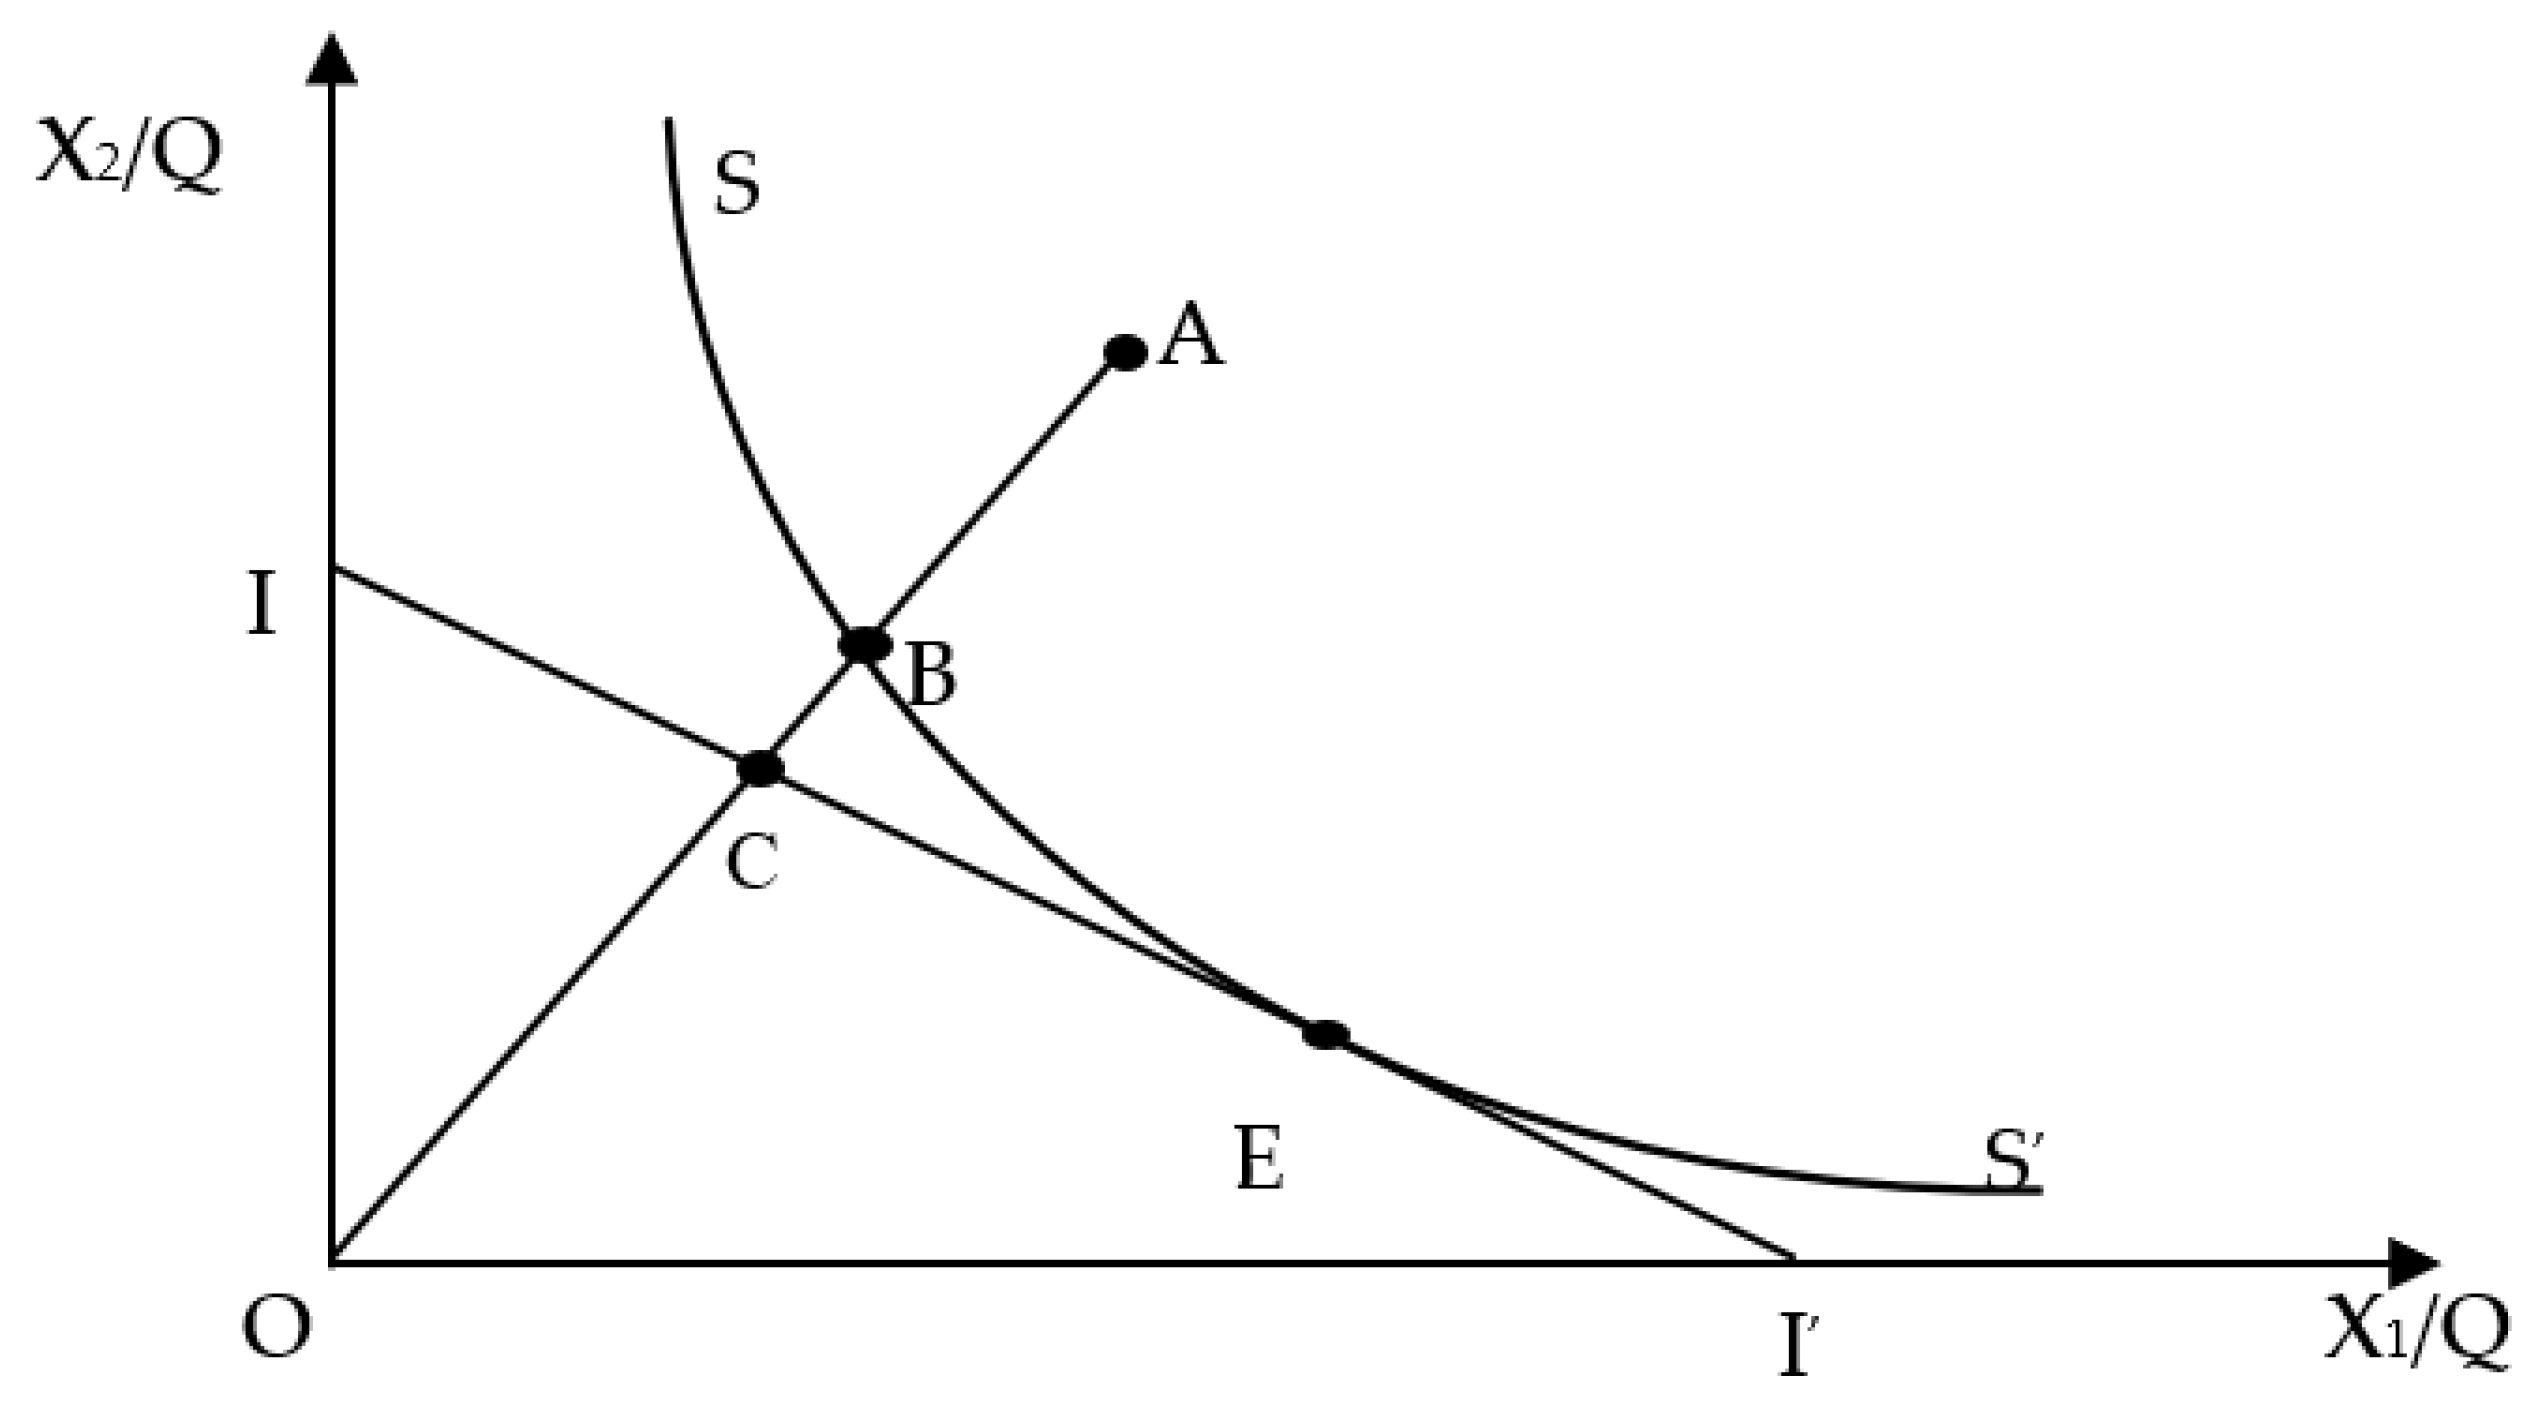
It is assumed that a firm uses two inputs (X1 and X2) to produce a single output (Q) under the assumption of constant returns to scale (Figure 1). The SS’ isoquant curve that represents full efficiency firms could permit measurement of technical efficiency. At point A, if the firm uses inputs to produce a unit of output, its technical inefficiency could be represented by the distance AB, which is the amount by which all inputs need could be proportionally reduced without a decline in output. It is usually expressed in percentage terms by the ratio BA/OA, representing the percentage by which all inputs need to be reduced to achieve technically efficient production. The ratio most commonly used to measure the technical efficiency (TE) of a firm is given:
TE = OB/OA
Its value ranges between 0 and 1 and represents the level of technical efficiency. Suppose TE is equal to 1, indicating that the firm produces fully technical efficiency. The firm could be fully technically efficient at point B because point B lies in the efficient isoquant curve.
With the input price ratio, represented by the slope of the II’ isocost line, allocative efficiency (AE) at A can be calculated and identified by the ratio:
AE = OC/OB
The production costs will decrease by the distance from B to C if a firm performs at the allocatively and technically efficient point E instead of at the technically efficient but allocatively inefficient point B. The total economic efficiency (EE) is defined to be the ratio:
EE = OC/OA
The distance from A to C also represents the cost cut in production if a firm produces at point C with the technical efficiency and allocative efficiency instead of at point A with technical inefficiency and allocative inefficiency. Economic efficiency is to combine technical efficiency and allocative efficiency.
2.2.2. Output-Orientated Technical Efficiency
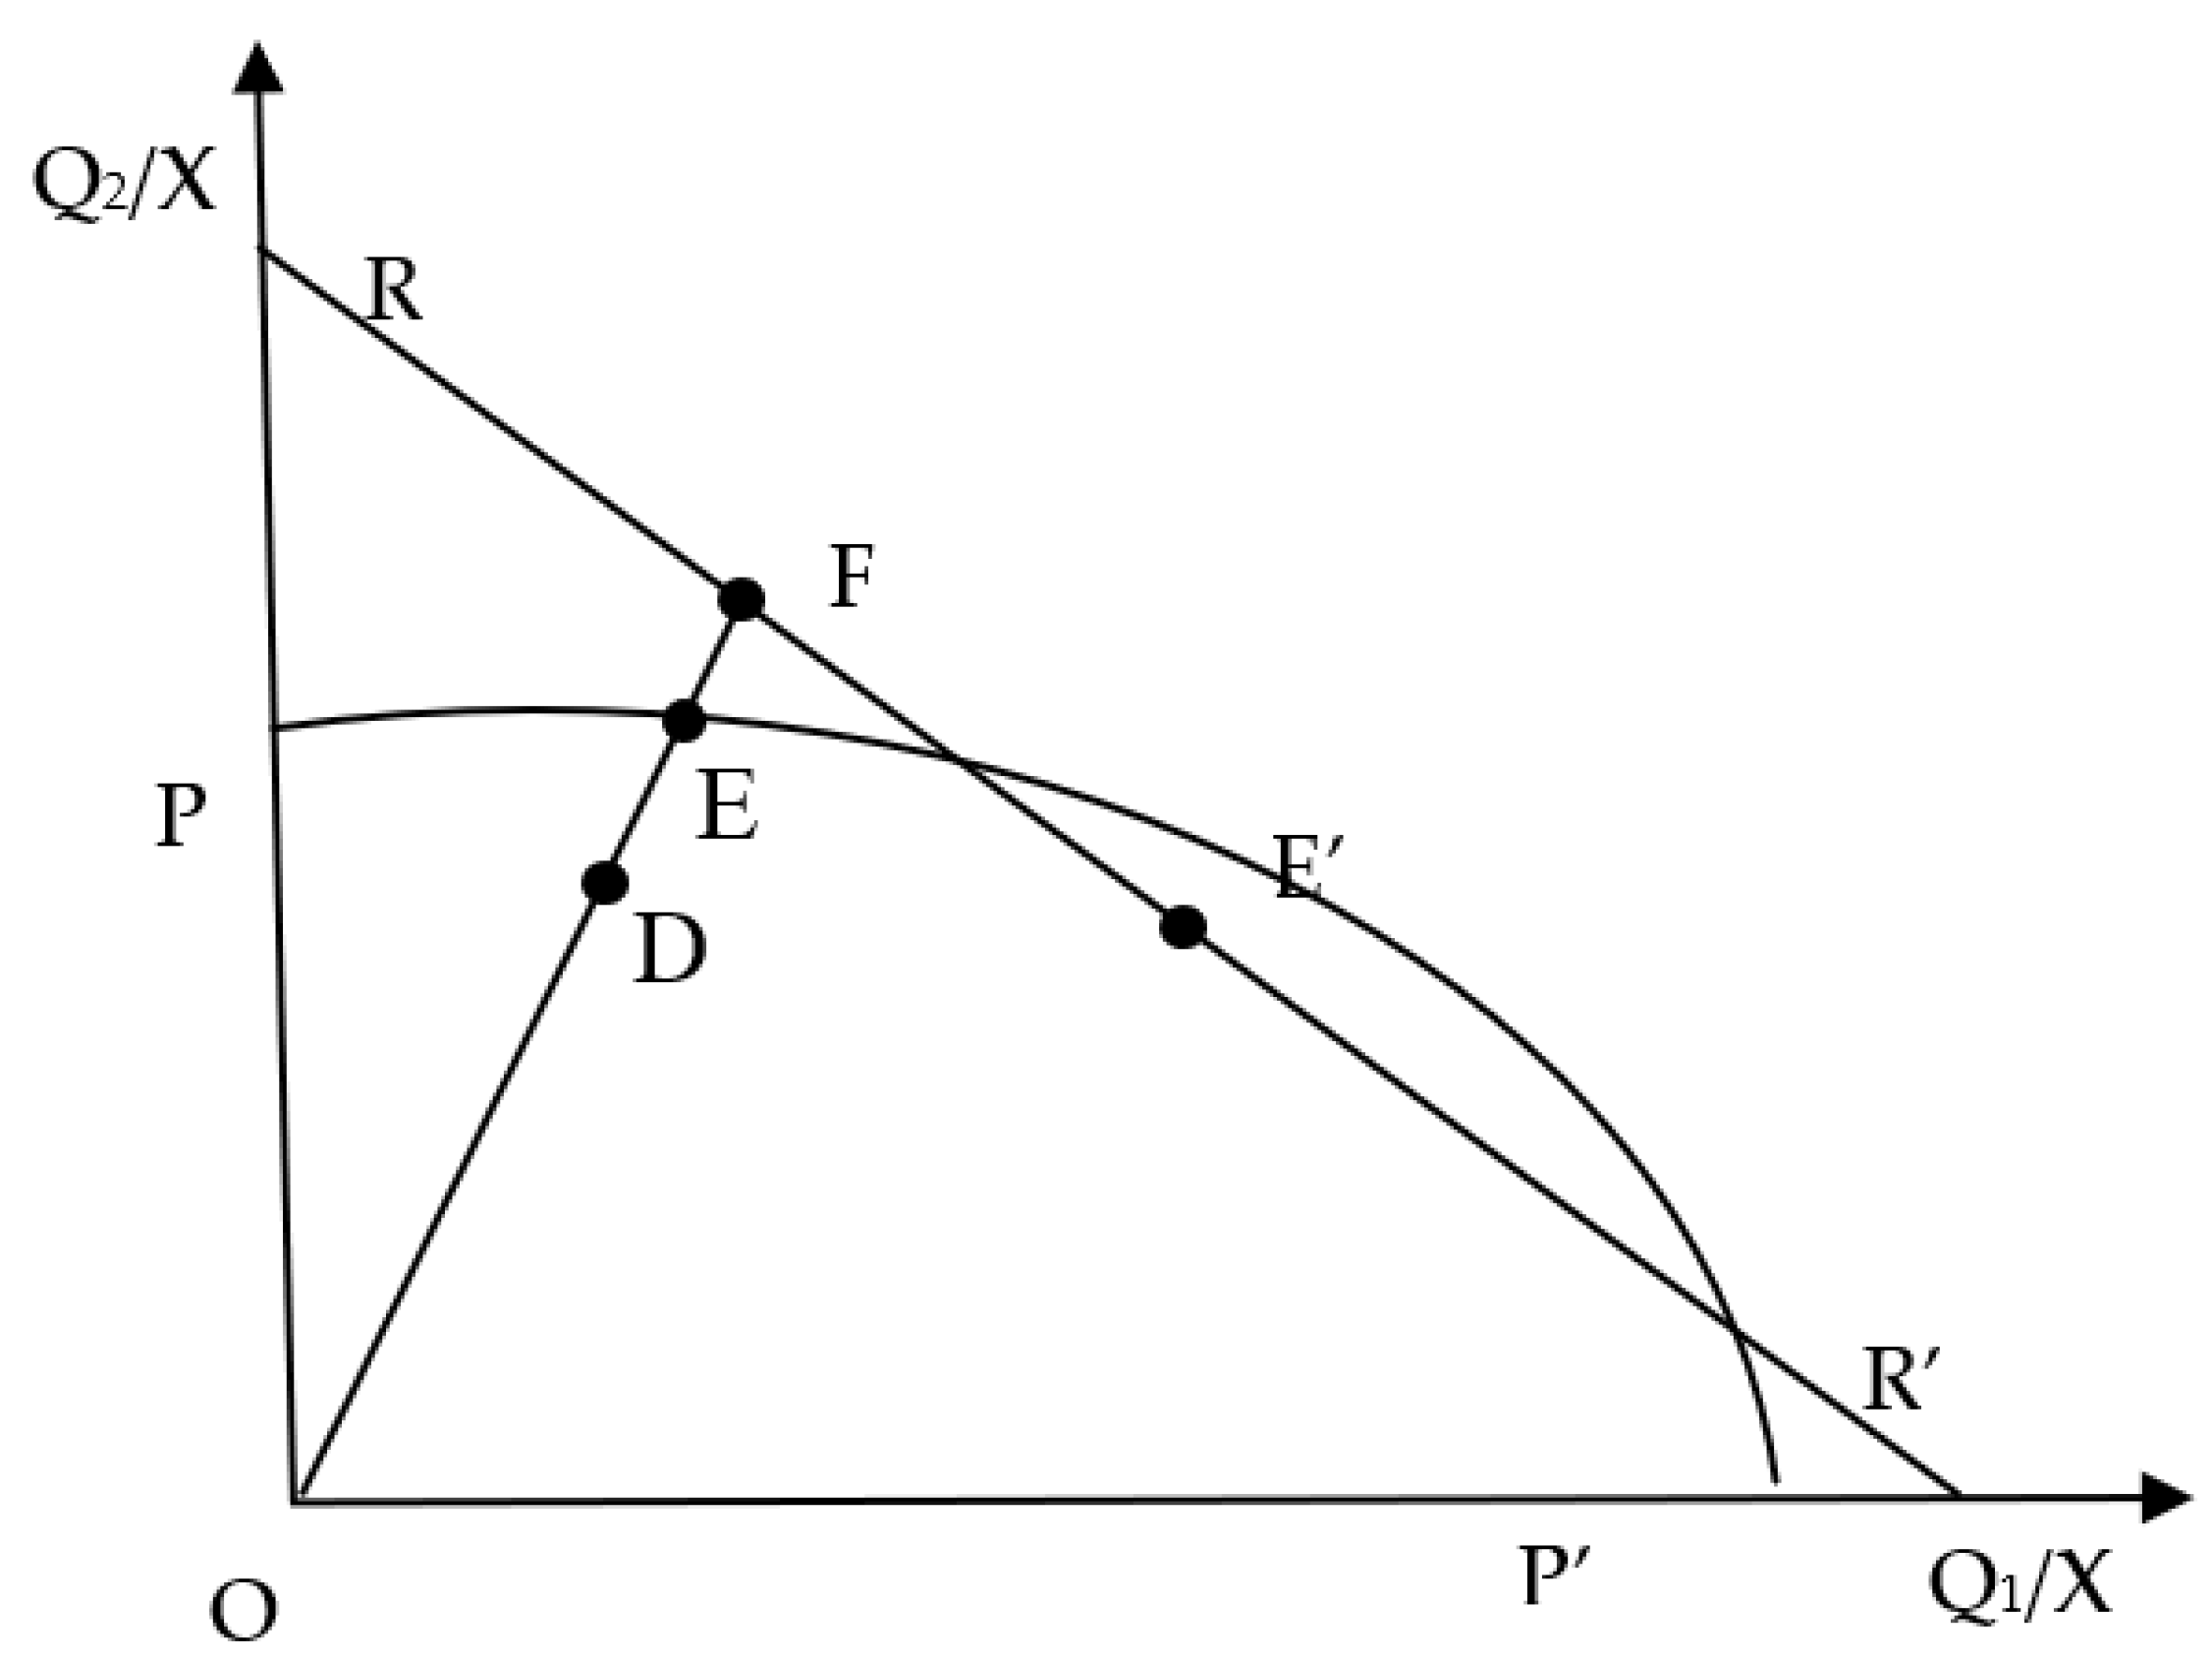
The input-orientated technical efficiency indicates how much input needs to be proportionally cut without changing the output. While the output-orientated technical efficiency answers the question of how much the output can be proportionally increased without changing the amount of input [16,17]. Suppose that a firm uses one input (X) to produce two outputs (Q1 and Q2) under the assumption of constant returns to scale (Figure 2). The PP’ production possibility curve represents the upper bound of the production possibilities, at point D where the firm is technically inefficient because it is below the PP’ curve. The distance from D to E represents technical inefficiency, which is the amount of the output that could be extended without increasing the inputs. Hence, the ratio measuring the output-oriented technical efficiency is given:
TE = OD/OE
The revenue efficiency (RE) can be defined for any observed output price represented by the RR’ line. Suppose the practical output of the given firm is represented at point D. In that case, point E represents the technically efficient production and the revenue efficiency associated with point E’, then the revenue efficiency is measured as follows:
RE = OD/OF
If we have price information, then we can draw the isorevenue line DD’; the allocative efficiency is measured by:
AE = OE/OF
2.3. Analytical Framework
The method widely used in the literature to estimate technical efficiency is an econometric approach [18]. It aims to develop stochastic frontier models based on the deterministic parameter frontier of Aigner et al. [19]. Since shrimp production is an example of single output and multiple-input production, this study focuses on the use of an econometric approach for measuring technical efficiency based on the production frontier model in Cobb–Douglas function form, which was commonly applied to estimate the stochastic production frontier in agricultural production [10,16,20,21,22,23,24,25,26]. The stochastic production function of the i-th farmer in Cobb–Douglas form is given as follows:
where all farms are indexed with a subscript i; j is numbers of explanatory variables; βij are parameters to be estimated; εi is a composed error term with εi = vi − ui, where vi is symmetric, independently and identically distributed as (vi∼N[0, ]), represents the exogenous effects such as impacts of adverse weather, natural disasters, measurement errors and other statistical noises; and ui is half-normal and nonnegative random error (ui ≥ 0), distributed as ui∼N+(0, ), represents the technical inefficiency effect of the i-th farmer. The used inputs including feed (kg/ha), medicine (thousand VND/ha/crop), fuel (thousand VND/ha/crop), seed (larvae/ha/crop), labors for farming activities (man-day/ha/crop) are commonly used in recent studies to estimate the technical efficiency of white leg shrimp farming [6,10,27].
The output-oriented TE of the i-th farmer is obtained by multiplying on both sites of Equation (1) and replacing the estimated parameters β with maximum likelihood estimates (MLE). This manipulation yields the measure of output-oriented TE as follows:
According to Jondrow et al. [28], ui is predicted by the conditional expectation of ui, given the value of random composed error variable εi. The expression of ui is given by
where σ* = (/σ2)1/2; and ϕ(.) and Φ(.) represent the standard normal density and cumulative distribution functions.
Output loss (OL) is the yield loss caused by technical inefficiency in production or the attainable output gain if farmers achieve optimal technical efficiency. The higher the technical inefficiency is, the greater the loss in output. Output loss is calculated based on TE and real output (RO)—the actual productivity of farm-households in farming. Estimating the real loss provides farmers an evidently current status of how efficient their production is. The output loss is calculated as follows:
OLi = (1 − TEi) × ROi
3. Data
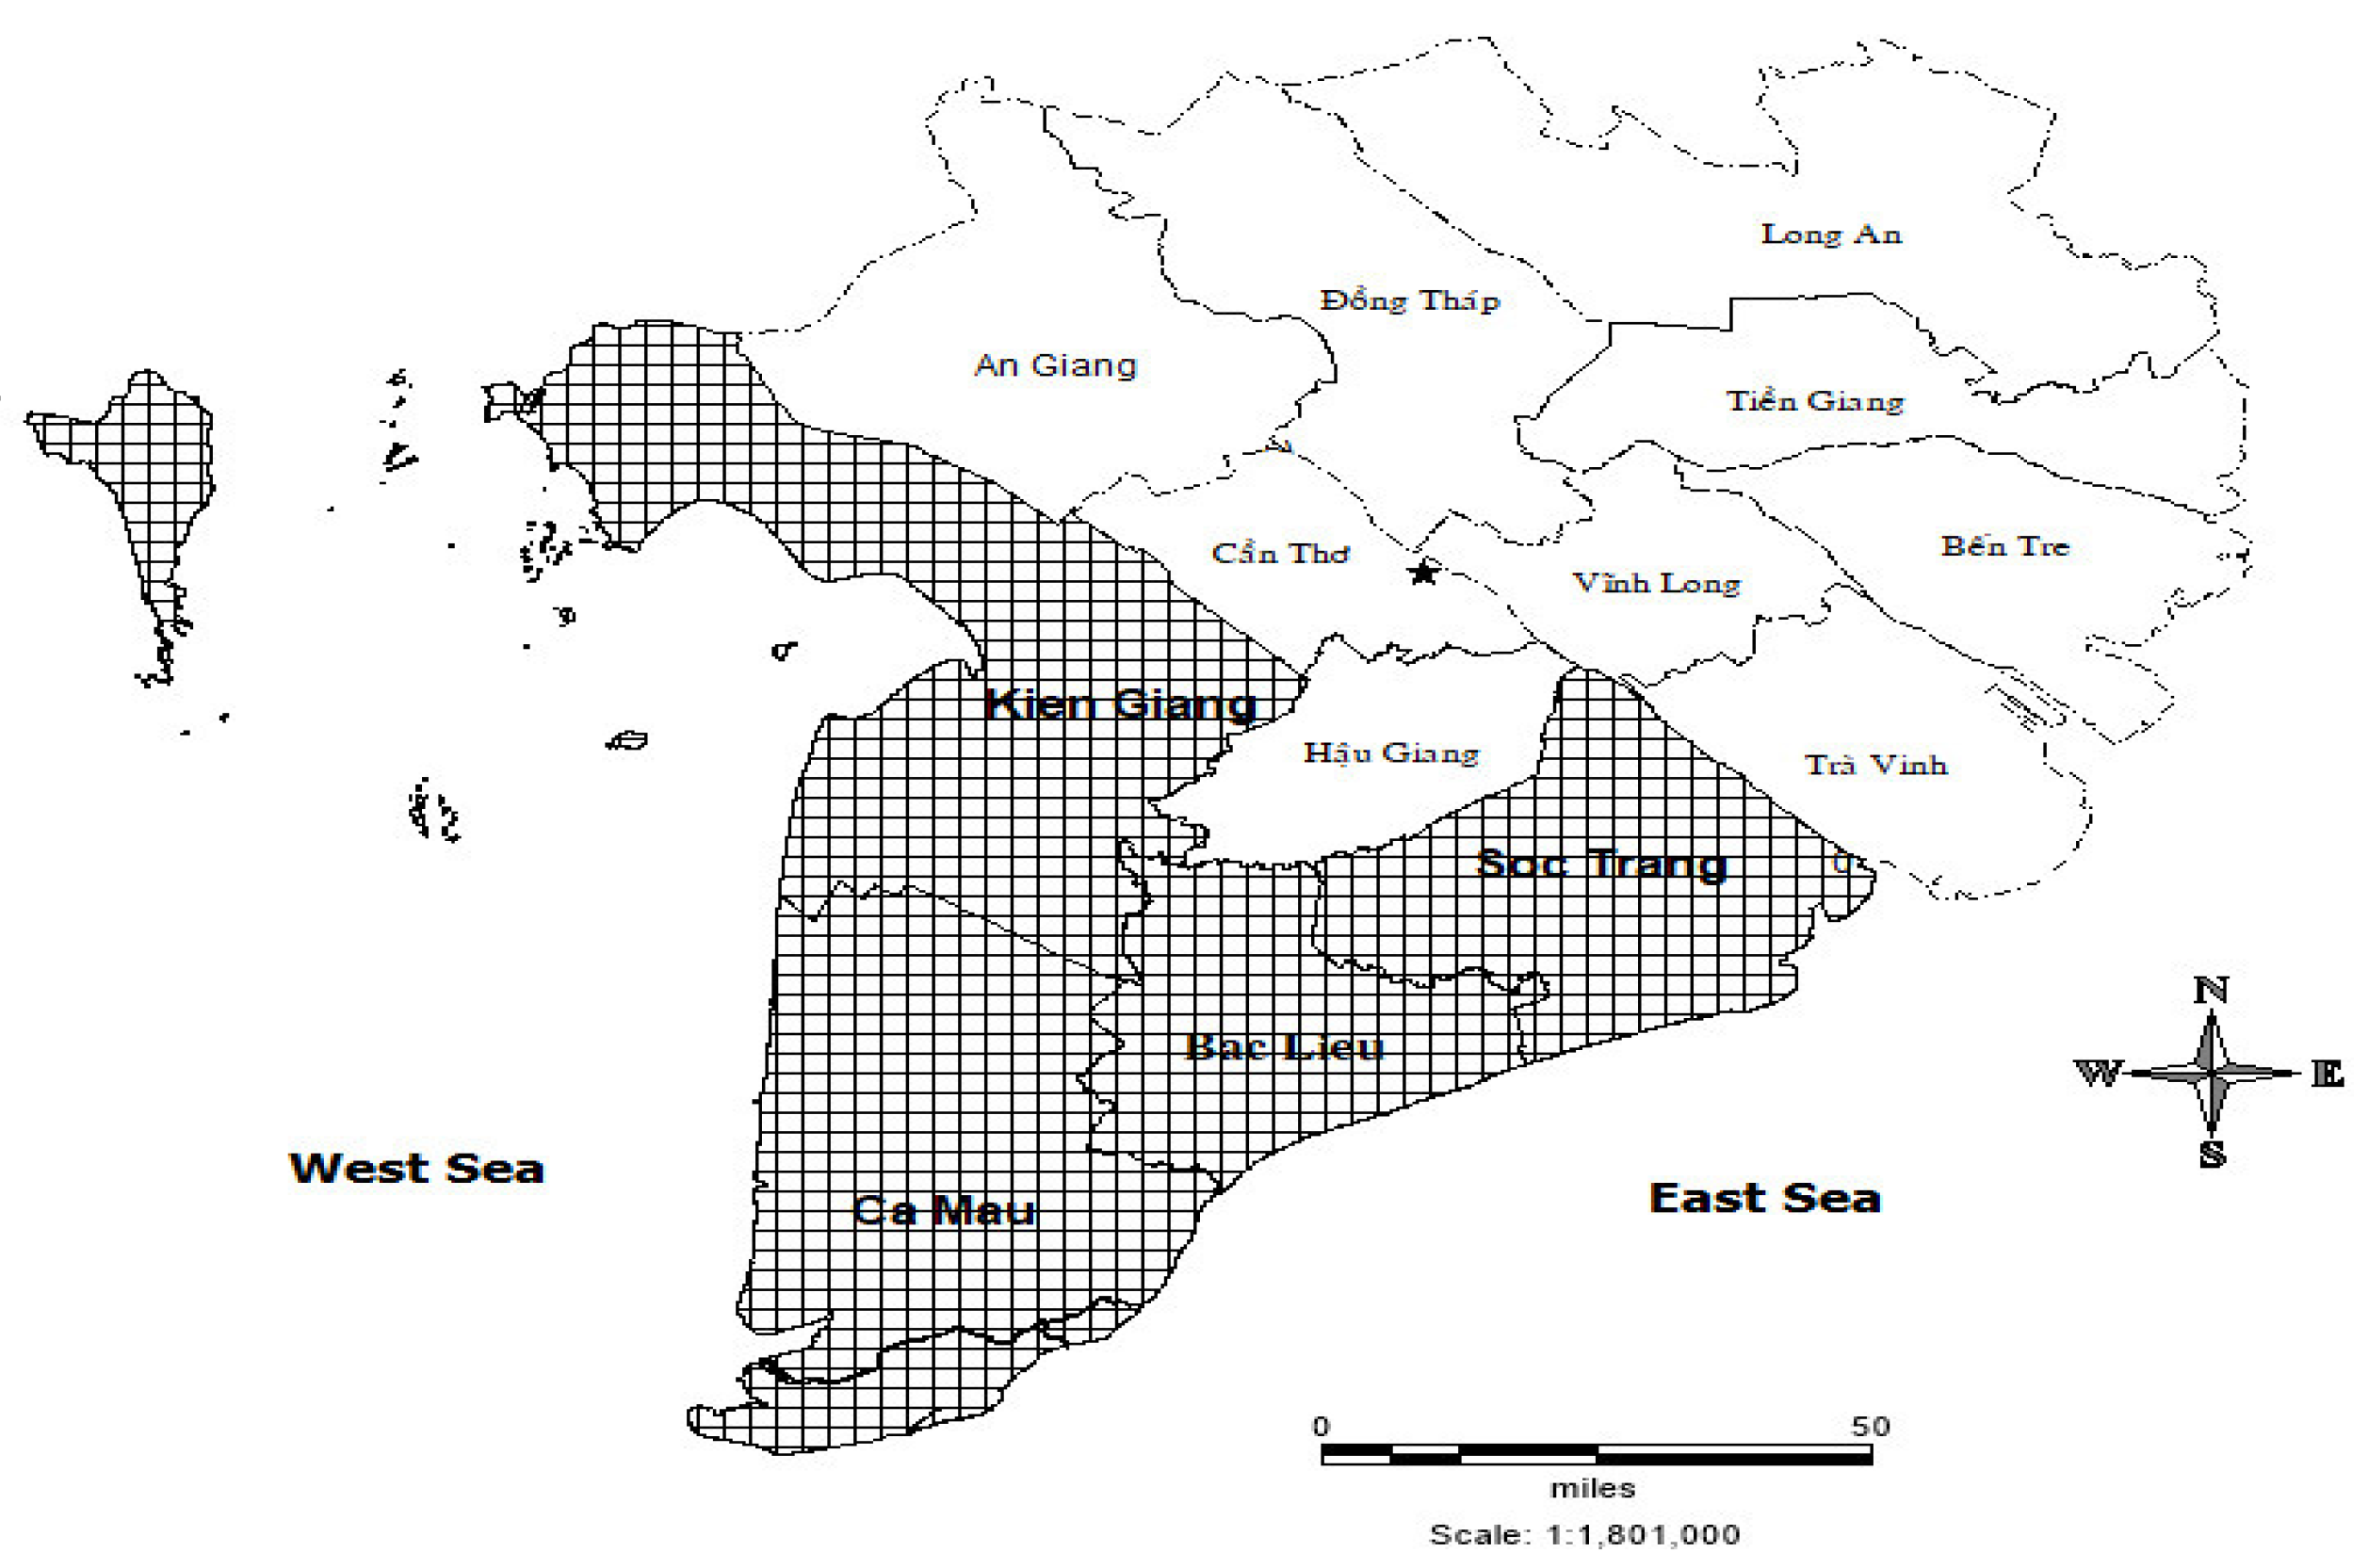
Figure 3 shows the allocation of the Mekong Delta includes 13 provinces of Long An, Tien Giang, Ben Tre, Vinh Long, Tra Vinh, Can Tho, Soc Trang, Bac Lieu, Ca Mau, Kien Giang, An Giang, Hau Giang, and Dong Thap. This region has a total natural area of 39,734 km2, accounting for 12.2% of the country’s natural size. Agriculture is the region’s primary economic activity, including fisheries, livestock, and rice farming. Aquaculture activities, mainly shrimp farming, are concentrated mainly in coastal provinces based on suitable environmental conditions. Soc Trang, Bac Lieu, Ca Mau, and Kien Giang are four provinces with long coastlines and proper environmental conditions for shrimp farming. Therefore, these are the four provinces with significantly large shrimp farming areas in the region.
According to the statistics from the Ministry of Agriculture and Rural Development in 2019 [29] presented in Table 1, the shrimp farming area in the Mekong Delta is nearly 700 thousand ha with two main species, black tiger shrimp and white leg shrimp. Ca Mau, Bac Lieu, Kien Giang, and Soc Trang are four provinces in the region with large shrimp farming areas. In recent years, the pond area has been gradually converted to white leg shrimp farming. Specifically, the area for white leg shrimp farming in Ca Mau was 84 ha in 2010; this number increased to more than 80 thousand ha in 2018. This shift also happened in the other three provinces, especially in Soc Trang: the white leg shrimp farming area surpassed the black tiger shrimp farming area in 2018 with an area of 32,678 ha, while the area for black tiger shrimp farming reached 23,482 ha.
From the above data, it can be seen that the shift to white leg shrimp farming in the Mekong River Delta is taking place quite strongly in the above four provinces. Therefore, it is entirely reasonable to choose the above four provinces as the study sites to evaluate the technical efficiency of this model in these areas in particular and to generalize to the whole Mekong River Delta region in general.
Primary data were collected by directly interviewing farmers in cultured white leg shrimp farming areas and areas recently converted from black tiger shrimp and other crops to white leg shrimp farming in the above four provinces. The questionnaire was designed to collect information related to the socioeconomic characteristics of farmers, information on inputs and productivity of white leg shrimp farming, and the advantages and disadvantages in production. The total number of observations was 200 farm-households (99 farmers in cultured areas and 101 farmers in converted areas) in four provinces of Soc Trang, Bac Lieu, Ca Mau, and Kien Giang. The number of observations collected in each region was stratified based on the farming area in each province. Therefore, the largest number of observations was collected in Soc Trang. Specifically, the samples in the four sections of Soc Trang, Bac Lieu, Ca Mau, and Kien Giang numbered 113, 22, 37, and 28, respectively.
4. Results and Discussion
This study applied stochastic frontier analysis to estimate the technical efficiency of white leg shrimp farms in the study site. In addition, we compare the technical efficiency between the traditional group and the converted group to consider how successfully converted farmers adapt to the new model. The inputs and output of white leg shrimp culture were described in Table 2. White leg shrimp culture has three environmentally detrimental inputs, including food (X1), medicine (X2), and fuel (X3), as well as two normal inputs such as seed (X4) and labor (X5).
This study only focuses on shrimp yield per hectare in the year. Other outputs in farming such as fish and crab can be termed as a result of ecological conditions, which does not reflect the production technology of the household will not be considered in this study because they are very few [10]. Table 2 shows that the output and input of shrimp farming models in the study area have a considerable variation. The reason is due to the influence of weather and the difference in management level and seed source of the farms [10]; the level of success and failure of the farms also varies.
To test for the presence of technical inefficiency in the study, we use the log-likelihood significant parameter in the half-normal model . If λ = 0, there were no effects of technical inefficiency, and all deviations from the frontier were due to noise [26]. According to Table 3, the estimated value of = 0.8058 significantly differed from zero. The null hypothesis that there is an absence of inefficiency effect was rejected at the 1 percent level using the Z-statistic, suggesting the existence of inefficiency effects for white leg shrimp farming in the Mekong River Delta.
Based on the frontier production model’s estimation and using Equations (8), we can calculate the output-oriented technical efficiency of white leg shrimp farms. The distributions of the efficiency were presented in Table 4. Table 4 shows that the average output-oriented technical efficiency of white leg shrimp farms in the study area was 72.9%, suggesting the farms could increase 27.1% of white leg shrimp yield with current inputs used. In addition, with an average of 72.9%, it indicates that the average household in the sample could save 16.5% (i.e., 1 − [72.9/87.3]) of costs, and the most technically inefficient could realize a 49.5% cost saving (i.e., 1 − [44.1/87.3]) compared with the TE level of his most efficient counterpart. Technical efficiency scores also largely varied among households. The maximum efficiency level was 87.3%, while the minimum was only 44.1%. These results indicate that many shrimp households face high risks in production, so the output-oriented technical efficiency is low. Most of the shrimp farms achieve technical efficiency in the range from 70% to 90%, accounting for about 71% of total sample observations. Households with efficiency in the field from 60% to 70% occupied approximately 23.5% of the total sample, and households with efficiency levels less than 60% occupied only 5.5% of the total sample.
The T-test was used to compare the difference in technical efficiency between the cultured area (the farms that have been producing white leg shrimp and have not changed to other agricultural farming) and the converted area (the area converted from black tiger shrimp or other crops). The result is presented in Table 5, the p-value of the T-test is 0.1979, i.e., there is no difference in technical efficiency between the two farming areas in the study sites. The average technical efficiency of farmers in cultured farming areas is mostly equal to the converted group. This is quite consistent with the reality in the study area. Since there are many farmers converting to white leg shrimp farming that used to produce black tiger shrimp, they already have experience in farming techniques and the conversion to white leg shrimp farming is relatively favorable for them. In addition, white leg shrimp farming is relatively uncomplicated, and farmers switching from other crops to white leg shrimp can also quickly grasp shrimp farming techniques by learning from other households in the area. Therefore, most of the converted farmers achieve almost the same efficiency as the traditional ones.
To determine the factors affecting the technical efficiency of white-leg shrimp farming in the study sites, the OLS regression model was used with TE as the dependent variable and some key socioeconomic and technical independent variables. The results are presented in Table 6. Farming density, pond size, and labor are three variables affecting the technical efficiency, in which the pond size variable has a nonlinear relationship with TE. Increasing the pond size positively affects TE; however, it reduces TE when the pond size is too large. This result is quite similar to the recent study of [30], which shows that the density and size of the pond are critical factors affecting the TE of shrimp farming.
Farmers’ experience does not affect TE, which is also relatively suitable with the actual situation in the study sites, this result is the same with the study of Le et al. [31]. Since the farmers mostly choose simple farming methods and have not yet applied advanced techniques to production activities, they can learn from each other quickly about these simple farming methods.
Whether or not farm-households have purifying ponds is not related to TE. Since most of the farming ponds in the areas are close to large rivers, farmers without settling purifying ponds directly discharge water from the farming ponds into the rivers, contributing to water pollution of the rivers. Then, the water from these rivers is pumped directly into the ponds for the following crops. Due to using the same water sources for farming, the farmers with settling purifying ponds are also affected by the discharge of polluted water into rivers by households without purifying ponds. Therefore, purifying ponds do not make a difference in the technical efficiency in this area. However, in the long run, the uncontrolled wastewater from aquaculture ponds and the increased use of chemicals to control diseases in an unchecked manner will contribute to environmental pollution, affecting future crops’ efficiency [32]. Another study [33] indicated that farmers had not used the environmental inputs efficiently, which impacts the environment in the long run. The ecological quality of white leg shrimp ponds is often lower than that of black tiger shrimp [34]. Therefore, the control of environmental pollution in shrimp farming is essential.
In addition, there is no difference in TE between the converted group and the traditional group, which shows that the converted farm-households and other farming conditions are productively adaptable to the new model. Therefore, the conversion to white leg shrimp farming has been a sustainable trend for farmers in this area.
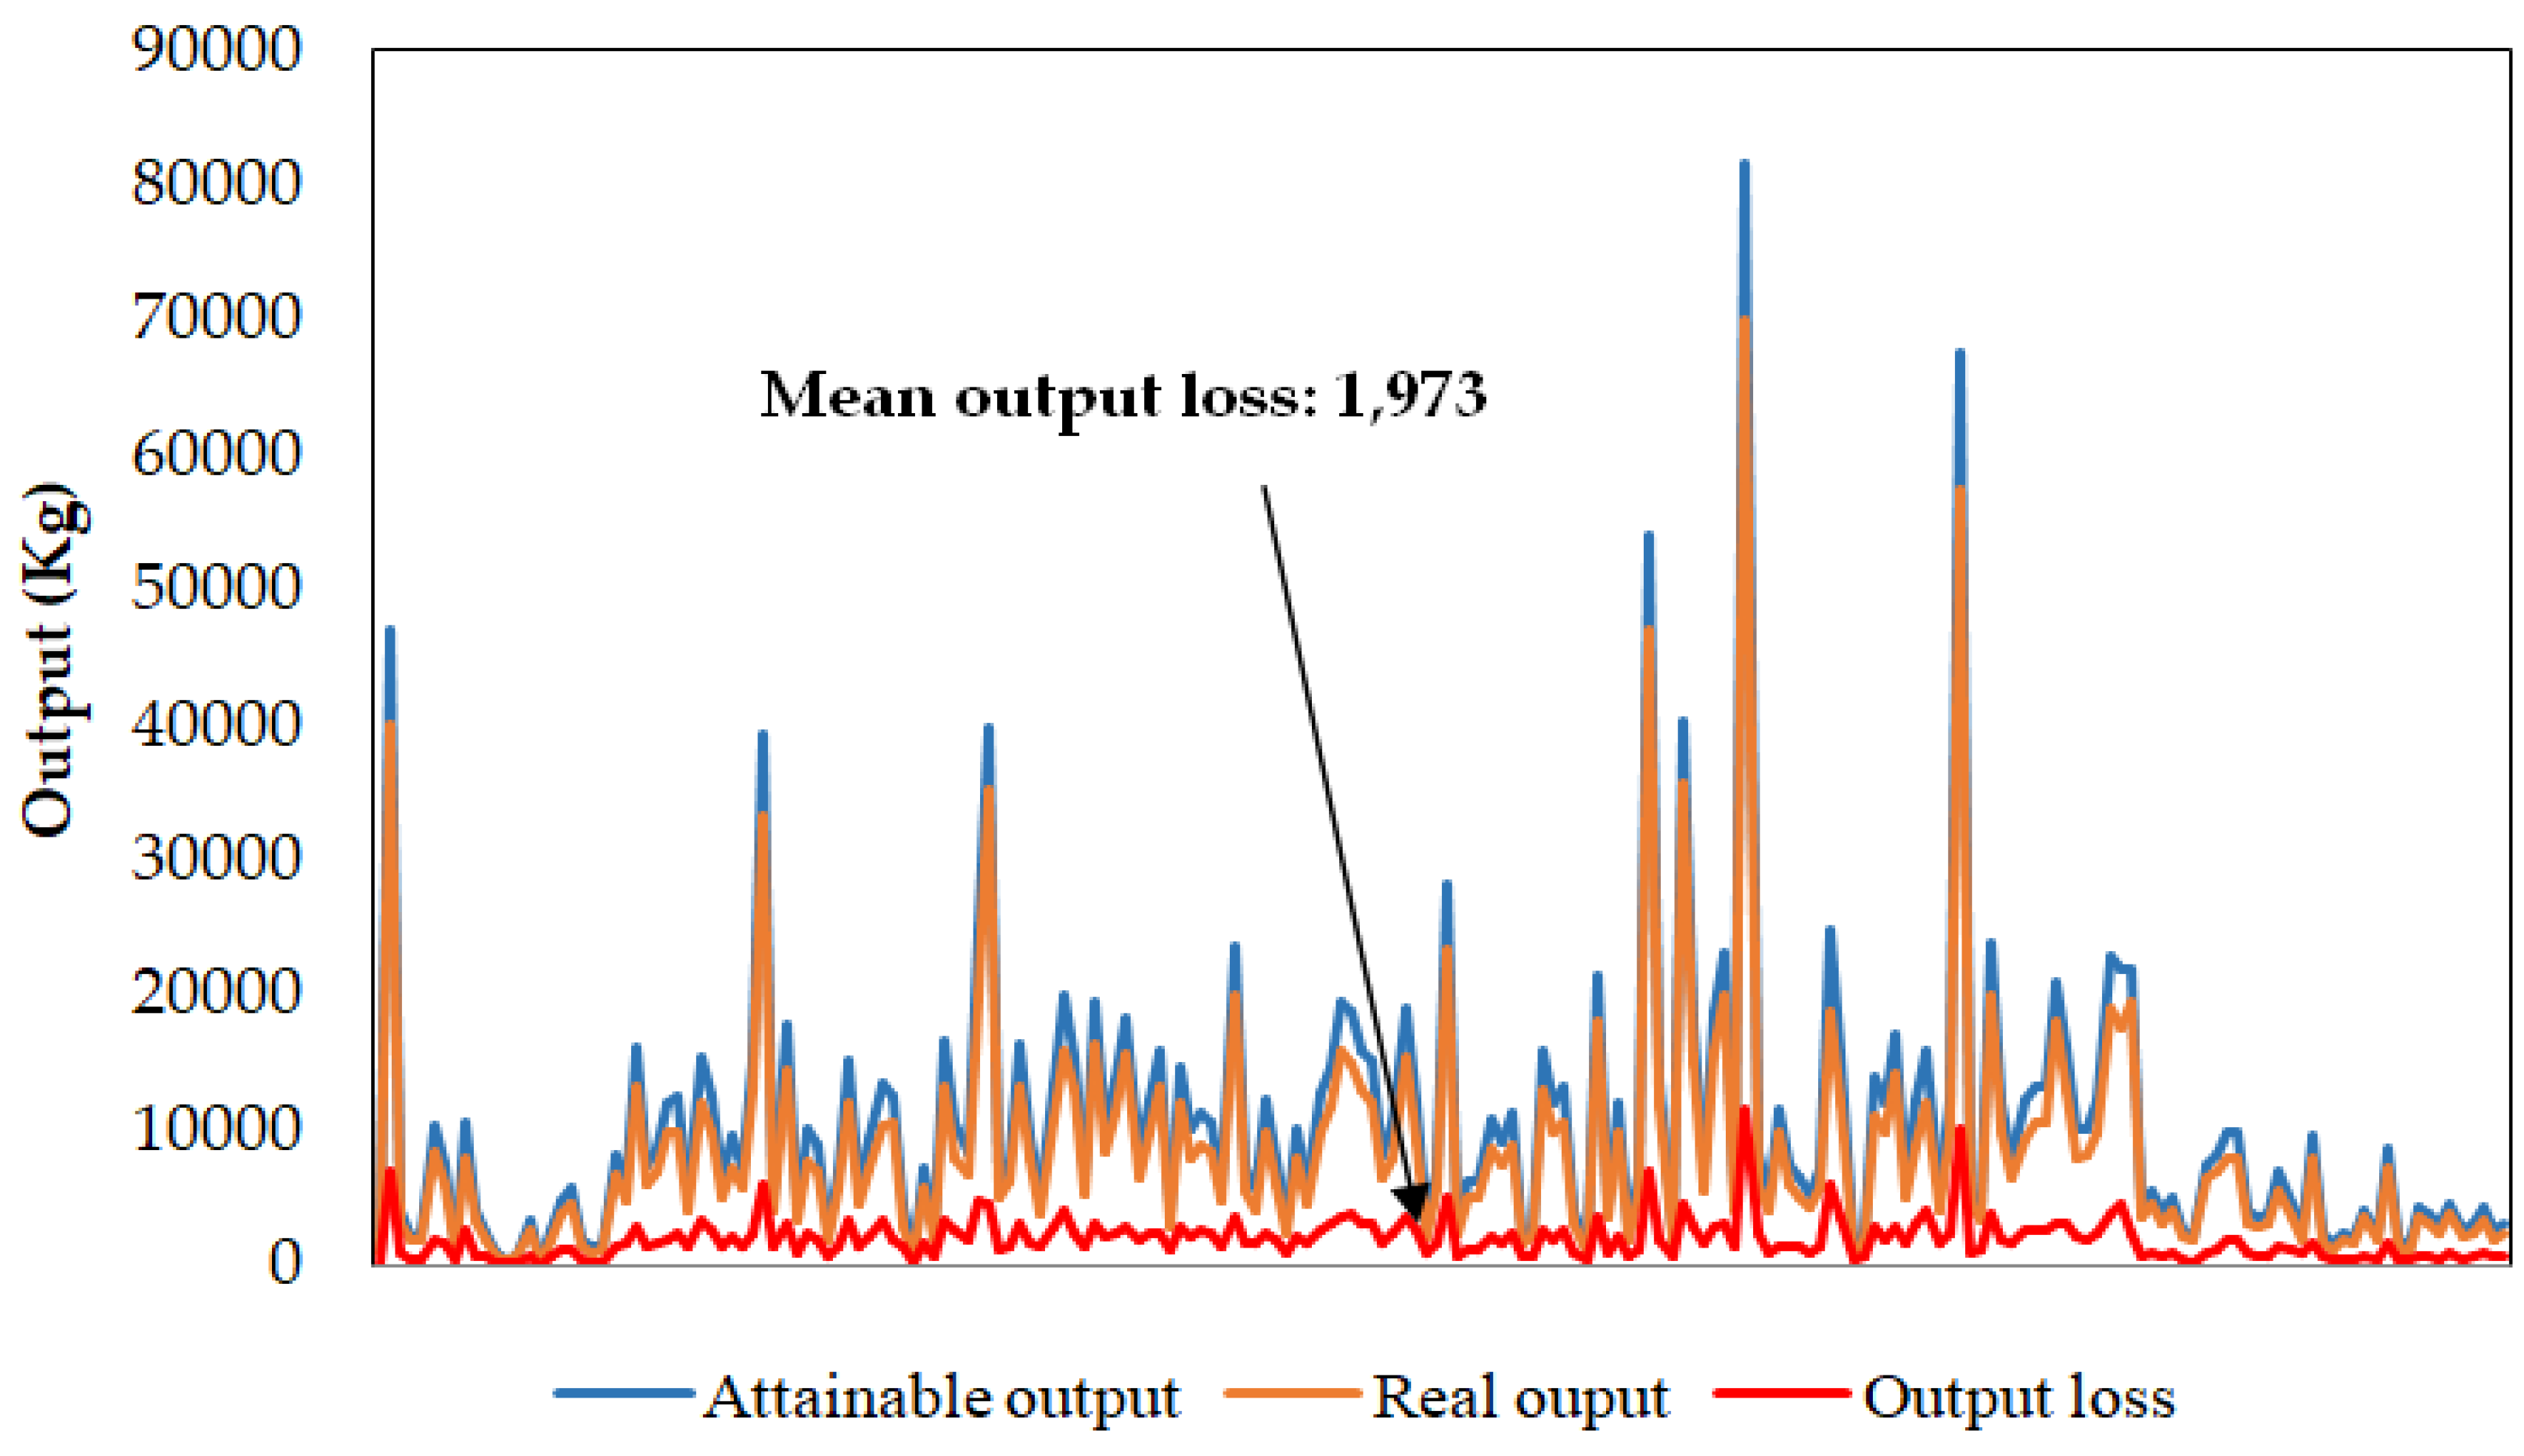
We can estimate the output losses using Equation (10) based on real output and technical efficiency. The results are illustrated in Figure 4 in which technical inefficiency caused significant output losses for white leg shrimp farming in the study sites. Figure 4 shows that the average output loss of farms is about 1973 kg/hectare. It indicates that these farms could have achieved higher productivity if the inputs were more efficiently used. This is the problem that most of the agricultural production sectors in Vietnam face. In another study [25] on resource use in rice farming in Vietnam also showed that resource use efficiency of most farmers is not high, significantly reducing the farmers’ profits. Therefore, resource use efficiency or inputs contraction is very crucial to increase farms’ productivity.
5. Conclusions
This study estimates the technical efficiency and output losses of white leg shrimp production in the Mekong River Delta. The stochastic frontier method and OLS regression model were used to analyze primary data related to the household’s socioeconomic characteristics, technical aspects, inputs, and outputs of the white leg shrimp farming collected from direct interviews with white leg shrimp farming households. The research found that the mean output-oriented technical efficiency of farms was 72.9%, pointing out that the farms have the ability to increase shrimp yield by 27.1% with present inputs application. There was a big difference in technical efficiency among farmers in the sample, especially many households still have very low technical efficiency. It indicates that many farms still have not made good use of their inputs in the most efficient way or are still facing risks in production.
In addition, the results also revealed that there is no difference in technical efficiency between the converted and traditional groups. This is a positive signal showing the high adaptability to the new model of converted households. Therefore, the white leg shrimp farming model has been a sustainable direction for these farmers. Although some environmental variables had been included in this research model, the ecological impacts from white leg shrimp production have not been estimated. This limitation will be the topic for the following study.
6. Recommendations
Given the results, it is essential to help these farms improve the technical efficiency in production by training them to use inputs more efficiently and avoid production risks. Significantly, the output loss is still very high, with an average loss of 1973 kg/ha; it has impacted farmers’ profits substantially; minimizing these losses by efficient use of input resources is the most practical solution. The relevant management agencies should strictly control the prices and quality of inputs to help farms minimize risks and increase production efficiency. They should be providing information on proper and optimal chemical use to help farmers make the right choices, helping to minimize the impact on the environment affecting future crops. Forecasts about changes in the environmental conditions, weather, and climate should be provided to farms promptly, allowing farmers to adjust the crop schedule and inputs use plan.
Author Contributions
Conceptualization, K.S.R.T. and H.T.V.; methodology, K.S.R.T.; formal analysis, K.S.R.T.; investigation, H.T.V.; data curation, H.T.V.; writing—original draft preparation, K.S.R.T.; writing—review and editing, K.S.R.T. and J.-Y.L. All authors have read and agreed to the published version of the manuscript.
Funding
This research is funded by Vietnam National Foundation for Science and Technology Development (NAFOSTED) under grant number 502.01–2020.27.
Data Availability Statement
The data used during the current study are available from the corresponding authors on reasonable request.
Conflicts of Interest
The authors declare no conflict of interest.
Abbreviations
| AE | Allocative Efficiency |
| EE | Economic Efficiency |
| OL | Output Loss |
| OLS | Ordinary Least Square |
| OTE | Output-oriented Technical Efficiency |
| RE | Revenue Efficiency |
| RO | Real Output |
| SFA | Stochastic Frontier Analysis |
| TE | Technical Efficiency |
References
- Vietnam Association of Seafood Exporters and Producers (VASEP). An Overview of the Shrimp Industry in Vietnam. 2019. Available online: http://vasep.com.vn/gioi-thieu/tong-quan-nganh (accessed on 5 September 2021).
- General Statistics Office of Viet Nam (GSO). 2019. Available online: https://www.gso.gov.vn/ (accessed on 5 September 2021).
- Holger, R.; Wemdy, W.; David, P.; Shalini, U.; Alexander, M.Z.F.; Sophie, Z.; Charlotte, L.; Carolin, L. A Strategic Approach to Sustainable Shrimp Production in Vietnam; Boston Consulting Group: Boston, MA, USA, 2019. [Google Scholar]
- Thakur, K.; Patanasatienkul, T.; Laurin, E.; Vanderstichel, R.; Corsin, F.; Hammell, L. Production characteristics of intensive white leg shrimp (Litopenaeus vannamei) farming in four Vietnam Provinces. Aquacult. Res. 2018, 49, 2625–2632. [Google Scholar] [CrossRef]
- Cuzon, G.; Lawrence, A.; Gaxiola, G.; Rosas, C.; Guillaume, J. Nutrition of Litopenaeus vannamei reared in tanks or in ponds. Aquaculture 2004, 235, 513–551. [Google Scholar] [CrossRef]
- Minh, T.H. The efficiency of converting from black tiger shrimp to white leg shrimp culture in Soc Trang province. Can Tho Univ. J. Sci. 2017, 51, 117–124. [Google Scholar] [CrossRef]
- Can, D.N. Transformation of farming systems in coastal Mekong Delta: Seeking for better management and sustainability. In Proceedings of the 6th International Symposium on Structural Transformation of Vietnamese Agriculture and Rural Society in the Period of Globalization, Industrialization, Modernization, Kagoshima University and Saga University, Kagoshima, Japan, 14–16 March 2011. [Google Scholar]
- Lan, N.T.P. From Rice to Shrimp: Ecological Change and Human Adaptation in the Mekong Delta of Vietnam. In Environmental Change and Agricultural Sustainability in the Mekong Delta, 1st ed.; Mart, A.T., Peter, A.C., Eds.; Springer: New York, NY, USA, 2011; Volume 45, pp. 271–285. [Google Scholar]
- CCAFS-SEA. Assessment Report: The Drought and Salinity Intrusion in the Mekong River Delta of Vietnam. 2016. Available online: https://ccafs.cgiar.org/resources/publications/drought-and-salinity-intrusion-mekong-river-delta-vietnam-assessment (accessed on 10 September 2021).
- Trang, N.T.; Khai, H.V.; Tu, V.H.; Hong, N.B. Environmental efficiency of transformed farming systems: A case study of change from sugarcane to shrimp in the Vietnamese Mekong Delta. For. Res. Eng. Int. J. 2018, 2, 56–62. [Google Scholar]
- Nguyen, K.T.; Fisher, T.C. Efficiency analysis and the effect of pollution in the Mekong river delta. Aquacult. Econ. Manag. 2014, 18, 325–343. [Google Scholar] [CrossRef]
- Long, N.T.; Hien, H.V. Analyzing technical and financial efficiency of white leg shrimps farming system in Ca Mau Province. Can Tho Univ. J. Sci. 2015, 37, 105–111. [Google Scholar]
- Belbase, K.; Grabowski, R. Technical efficiency in Nepalese agriculture. J. Dev. Areas 1985, 19, 515–525. [Google Scholar]
- Shapiro, K.H. Sources of technical efficiency: The roles of modernization and information. Econ. Dev. Cult. Chang. 1977, 25, 293–310. [Google Scholar] [CrossRef]
- Farrell, M.J. The measurement of productive efficiency. J. R. Stat. Soc. 1957, 120, 253–290. [Google Scholar] [CrossRef]
- Coelli, T.J.; Prasada, R.D.S.; Christopher, J.O.; George, E.B. An Introduction to Efficiency and Productivity Analysis, 2nd ed.; Springer: New York, NY, USA, 2005. [Google Scholar]
- Subal, C.K.; Hung-jen, W.; Alan, P.H. A Practitioner’s Guide to Stochastic Frontier Analysis Using Stata, 1st ed.; Cambridge University Press: Cambridge, UK, 2015. [Google Scholar]
- Khai, H.V.; Yabe, M. Technical efficiency analysis of rice production in Vietnam. J. Int. Soc. Southeast Asian Agric. Sci. 2011, 17, 135–146. [Google Scholar]
- Aigner, D.J.; Chu, S.F. On estimating the industry production function. Am. Econ. Rev. 1968, 58, 826–839. [Google Scholar]
- Battese, G.E. Frontier production functions and technical efficiency: A survey of empirical applications in agricultural economics. Agric. Econ. 1992, 7, 185–208. [Google Scholar] [CrossRef] [Green Version]
- Bravo-Ureta, B.E.; Pinheiro, A.E. Efficiency analysis of developing country agriculture: A review of the frontier function literature. Agric. Resour. Econ. Rev. 1993, 22, 88–101. [Google Scholar] [CrossRef]
- Bravo-Ureta, B.E.; Pinheiro, A.E. Technical, economic, and allocative efficiency in peasant farming: Evidence from the Dominican Republic. Dev. Econ. 1997, 35, 48–67. [Google Scholar] [CrossRef]
- Tu, V.H.; Yabe, M. Technical Efficiency of Ecologically Engineered Rice Production in the Mekong Delta of Vietnam: Application of SFA. Glob. J. Sci. Front. Res. D Agric. Vet. 2015, 15, 101–110. [Google Scholar]
- Vo, H.T.; Steven, W.K.; Nguyen, T.T.; Nguyen, B.H.; Mitsuyasu, Y. Land accumulation: An option for improving technical and environmental efficiencies of rice production in the Vietnamese Mekong Delta. Land Use Policy 2021, 108, 105678. [Google Scholar]
- Vo, H.T. Resource use efficiency and economic losses: Implications for sustainable rice production in Vietnam. Environ. Dev. Sustain. 2015, 19, 285–300. [Google Scholar]
- Aigner, D.J.; Lovell, C.A.K.; Schmidt, P. Formulation and estimation of stochastic frontier production function models. J. Econom. 1977, 6, 21–37. [Google Scholar] [CrossRef]
- Mamoud, M.; Agbekpornu, H.; Zhang, Z.; Zhu, W.; Yuan, X. Technical efficiency of white leg shrimp production using data envelopment analysis (DEA), case study: Jiangsu Province, China. Asian J. Fish. Aquat. Res. 2018, 1, 1–9. [Google Scholar]
- Jondrow, J.; Knox Lovell, C.A.; Materov, I.S.; Schmidt, P. On the estimation of technical inefficiency in the stochastic frontier production function model. J. Econom. 1982, 19, 233–238. [Google Scholar] [CrossRef] [Green Version]
- Ministry of Agriculture and Rural Development (MARD). 2019. Available online: https://www.mard.gov.vn/ (accessed on 25 October 2019).
- Dang, T.P.; Huynh, V.H.; Nguyen, T.K.Q.; Le, N.D.K.; Nobuyuki, Y. Technical efficiency of white leg shrimp farming systems at household scale in the Mekong Delta. Can Tho Univ. J. Sci. 2020, 56, 110–116. [Google Scholar]
- Le, V.T.; Le, K.L.; Nguyen, T.H. Analysis of technical efficiency of intensive white-leg shrimp farming in Ninh Thuan, Vietnam: An application of the double-bootstrap data envelopment analysis. In Proceedings of the Eighteenth Biennial Conference of the International Institute of Fisheries Economics and Trade, Aberdeen, UK, 11–15 July 2016. [Google Scholar]
- Kim, A.T.N.; Tram, A.T.N.; Curtis, J.; Brice, M.N. Economic efficiency of extensive and intensive shrimp production under conditions of disease and natural disaster risks in Khanh Hoa and Tra Vinh Provinces, Vietnam. Sustainability 2020, 12, 2140. [Google Scholar]
- Nguyen, T.T.; Huynh, V.K.; Vo, H.T.; Tran, M.H. Theoretical and empirical frameworks for measuring environmental efficiency in agricultural production: A case study of shrimp farming in transforming areas of Kien Giang province. Ho Chi Minh City Open Univ. J. Sci. 2019, 14, 128–141. [Google Scholar]
- Vo, N.S.; Truong, T.N.; Nguyen, T.P. Comparison of technical and environment characteristics of White leg shrimp and Tiger shrimp intensive systems in the Soc Trang province. Can Tho Univ. J. Sci. 2014, 2, 70–78. [Google Scholar]
Figure 1.
Technical, allocative and economic efficiency.

Figure 2.
Technical and allocative efficiency from an output orientation.

Figure 3.
The map of the Mekong Delta, Vietnam.

Figure 4.
Output losses due to technical inefficiency.


Table 1.
The farming area of black tiger shrimp and white leg shrimp in the period 2010–2018.
| Provinces | Latitudes and Longtitudes | Unit | 2010 | 2012 | 2013 | 2014 | 2018 | |||||
|---|---|---|---|---|---|---|---|---|---|---|---|---|
| BTS | WLS | BTS | WLS | BTS | WLS | BTS | WLS | BTS | WLS | |||
| Long An | 10.69° N, 106.24° E | 1000 ha | 2.19 | 0.95 | 1.48 | 2.40 | 1.10 | 2.71 | 1.00 | 5.70 | 0.76 | 6.28 |
| Tien Giang | 10.44° N, 106.34° E | 1000 ha | 3.71 | 0.66 | 3.38 | 0.83 | 2.74 | 1.34 | 2.65 | 1.38 | 1.93 | 2.45 |
| Ben Tre | 10.24° N, 106.37° E | 1000 ha | 30.03 | 0.77 | 28.79 | 2.44 | 26.05 | 5.39 | 29.51 | 5.11 | 25.75 | 10.35 |
| Tra Vinh | 9.95° N, 106.33° E | 1000 ha | 25.38 | 0.03 | 23.97 | 0.52 | 25.89 | 2.32 | 20.65 | 5.15 | 25.00 | 7.60 |
| Soc Trăng | 9.60° N, 105.96° E | 1000 ha | 48.34 | 0.29 | 39.26 | 4.41 | 30.48 | 15.54 | 57.05 | 27.01 | 23.48 | 32.67 |
| Bac Lieu | 9.25° N, 105.51° E | 1000 ha | 124.98 | 3.42 | 116.02 | 3.24 | 119.30 | 4.89 | 122.21 | 8.07 | 140.26 | 8.48 |
| Ca Mau | 9.15° N, 105.19° E | 1000 ha | 266.54 | 0.08 | 264.20 | 2.36 | 263.52 | 3.53 | 262.80 | 6.60 | 261.85 | 8.03 |
| Kien Giang | 9.82° N, 105.12° E | 1000 ha | 80.98 | 0.74 | 85.99 | 1.06 | 86.84 | 1.15 | 94.42 | 1.91 | 121.77 | 2.44 |
| Total | 1000 ha | 582.18 | 6.98 | 563.11 | 17.29 | 555.95 | 36.91 | 590.31 | 60.95 | 600.82 | 78.32 | |
Note: BTS: black tiger shrimp; WLS: white leg shrimp.
Table 2.
Descriptive statistics of inputs and output in white leg shrimp cultivation.
| Item | Notation | Unit | Mean | Std. Dev. | Min. | Max. |
|---|---|---|---|---|---|---|
| Yield | Y | Kg/ha | 8541.39 | 8956.64 | 174.00 | 70,000.00 |
| Feed | X1 | Kg/ha | 6736.23 | 7303.80 | 60.00 | 55,000.00 |
| Medicine | X2 | 1000 VND/ha | 102,199.40 | 164,827.40 | 300.00 | 1,259,737.00 |
| Fuel | X3 | 1000 VND/ha | 4180.52 | 5.12128 | 58.82 | 52,500.00 |
| Seed | X4 | larvae/ha | 795,386.10 | 613,786.60 | 40,000.00 | 4,411,765.00 |
| Labor | X5 | man day/ha | 334.25 | 221.51 | 9.56 | 1125.00 |
Table 3.
Stochastic frontier production estimates.
| Variables | Stochastic Frontier | |
|---|---|---|
| Coefficients | Standard Error | |
| Feed quantity | 0.3280 *** | 0.0490 |
| Medicine costs | 0.1119 *** | 0.0324 |
| Fuel and raw materials costs | 0.1204 ** | 0.0473 |
| Seed quantity | 0.1624 ** | 0.0743 |
| Labors for farming activities | 0.2017 *** | 0.0550 |
| Constant | 0.8876 | 0.7209 |
| −1.227 | 0.3249 | |
| 1.6589 | 1.3465 | |
| 0.5414 | 0.0879 | |
| 0.4362 | 0.2937 | |
| 0.4834 | 0.1720 | |
| 0.8058 *** | 0.3766 | |
| Log Likelihood | −182.1696 | |
| Wald χ2 value | 285.47 | |
Notes: ***, ** statistical significance at 1%, 5%, respectively.
Table 4.
Frequency distribution of technical efficiency for white leg shrimp farming.
| Output-Oriented Technical Efficiency (%) | Number of Farm | Percentage | Cumulative |
|---|---|---|---|
| >90 ≤ 100 | 0 | 0 | 0 |
| >80 ≤ 90 | 30 | 15 | 15 |
| >70 ≤ 80 | 112 | 56 | 71 |
| >60 ≤ 70 | 47 | 23.5 | 94.5 |
| >50 ≤ 60 | 9 | 4.5 | 99 |
| ≤50 | 2 | 1 | 100 |
| Mean TE (%) | 72.9 | ||
| Minimum TE (%) | 44.1 | ||
| Maximum TE (%) | 87.3 | ||
Table 5.
The difference in TE between the two farmer groups.
| Farmer Groups | Number of Farm | Mean | Std. Deviation | Std. Error Mean | Pr (|T|>|t|) |
|---|---|---|---|---|---|
| Traditional group | 99 | 0.7359 | 0.0842 | 0.0084 | 0.1979 ns |
| Converted group | 101 | 0.7222 | 0.0644 | 0.0064 |
Notes: ns = non-significance.
Table 6.
Factors associated with technical efficiency.
| Variables | Coefficients | Robust Standard Error |
|---|---|---|
| Constant | 0.6707 *** | 0.0217 |
| Experience | −0.0004 ns | 0.0011 |
| Farming density | 0.0001 ** | 0.0000 |
| Pond size | 0.0086 * | 0.0045 |
| Pond size square | −0.0003 ** | 0.0001 |
| Labor | 0.0078 ** | 0.0038 |
| Pond | 0.0028 ns | 0.0033 |
| Purifying pond | 0.0025 ns | 0.0115 |
| Conversion | −0.0080 ns | 0.0126 |
Notes: *, **, and *** represent statistical significance at 10%, 5%, and 1%, respectively; ns = non-significance.
Publisher’s Note: MDPI stays neutral with regard to jurisdictional claims in published maps and institutional affiliations. |
© 2021 by the authors. Licensee MDPI, Basel, Switzerland. This article is an open access article distributed under the terms and conditions of the Creative Commons Attribution (CC BY) license (https://creativecommons.org/licenses/by/4.0/).
Share and Cite
MDPI and ACS Style
Thach, K.S.R.; Vo, H.T.; Lee, J.-Y. Technical Efficiency and Output Losses in Shrimp Farming: A Case in Mekong Delta, Vietnam. Fishes 2021, 6, 59. https://0-doi-org.brum.beds.ac.uk/10.3390/fishes6040059
AMA Style
Thach KSR, Vo HT, Lee J-Y. Technical Efficiency and Output Losses in Shrimp Farming: A Case in Mekong Delta, Vietnam. Fishes. 2021; 6(4):59. https://0-doi-org.brum.beds.ac.uk/10.3390/fishes6040059
Chicago/Turabian StyleThach, Keo Sa Rate, Hong Tu Vo, and Ji-Yong Lee. 2021. "Technical Efficiency and Output Losses in Shrimp Farming: A Case in Mekong Delta, Vietnam" Fishes 6, no. 4: 59. https://0-doi-org.brum.beds.ac.uk/10.3390/fishes6040059