Study of the FTM Detector Performance with Garfield++


1
College of Engineering and Technology, American University of the Middle East, Egaila 54200, Kuwait
2
Istituto Nazionale di Fisica Nucleare, Sezione di Bari, 70126 Bari, Italy
*
Author to whom correspondence should be addressed.
Instruments 2020, 4(4), 37; https://0-doi-org.brum.beds.ac.uk/10.3390/instruments4040037
Submission received: 31 October 2020
/
Revised: 27 November 2020
/
Accepted: 2 December 2020
/
Published: 6 December 2020
Abstract
:The Fast Timing Micro-Pattern Gaseous Detector (FTM) has been recently introduced as a promising alternative for applications that require improved time resolution, such as high-luminosity accelerators and medical imaging. The FTM consists of a stack of several coupled gas layers alternating drift and multiplication stages. The time resolution is determined by the time of the fastest signal among all amplification stages, read out by external electrodes through capacitive couplings. In the present work, we use the Garfield++ simulation toolkit in order to investigate and optimize the FTM performances. Gain, timing, and efficiency of the FTM are studied as a function of different parameters, such as detector geometry, gas mixture, and applied electric fields. The simulations that are presented in this paper show that a time resolution as low as 160 ps can be reached with a 32-layers FTM.
Keywords:
gas detector; MPGD; GEM; WELL; DLC; monte-carlo simulation; Garfield++; ANSYS; FEM; time resolution; gain; detection efficiency; collection efficiency; gain1. Introduction
Micro-Pattern Gaseous Detectors (MPGD) witnessed a significant growth over the past twenty years. With their excellent spatial resolution, radiation hardness, flexible geometry, and relatively lower production and operation constraints, different MPGD detectors, such as GEM (Gas Electron Multiplier) and Micromegas, have been playing essential roles in many high energy physics experiments [1]. However, MPGDs are generally vulnerable to electric discharges, particularly in high rate environments, eventually causing potential damages to the readout electronics, as well as increasing the noise, which can result in data loss [2].
Although resistive materials have been recently introduced for building compact spark-protected MPGDs [3,4,5], also opening the possibility to make electrically transparent structures with external signal pick-up, current MPGDs still suffer from a relatively poor time resolution of few nanoseconds, which makes them less performing in environments such as high-luminosity accelerators and medical imaging, which require sub-ns time resolution in order to reduce the background.
Time resolution, which is dominated by the fluctuations on the position of the ionization cluster that is closest to the amplification region, is improved in the novel Fast Timing Micro-Pattern Gaseous Detector (FTM) by dividing the drift gap into several smaller gaps, each with its own amplification structure. This leads to a reduction of the fluctuations in the distance between the closest ion-electron pair and amplification structure. Thanks to its fully resistive structure, signals from any FTM layer can be picked-up by the external readout strips. The time resolution, which is inversely proportional to the number of layers, is then given by the best timing among all layers [6].
In a previous work [7], simulations have shown that a time resolution below 400 ps can be obtained with a 16-layers FTM operated in an Ar/CO (70/30) gas mixture with 3 kV/cm drift field, 120 kV/cm amplification field (which corresponds to 600 V voltage difference over the 50 m well height), and with up to 4000 electrons cut-off on the integrated electron signal that is used to mimic the electronic noise threshold. The time benefit of the FTM was experimentally proven with the first two-layers FTM built and tested at CERN (European Organization of Nuclear Research) in 2014 [8]. The simulations have also revealed that, for large number of FTM thin layers, the reduction of time resolution is moving away from linearity, which is expected, as some detector effects would start to play an important role [7]. In the present work, we extend the simulations to 32 layers and investigate the reasons for the time resolution deviating from the linear expected behavior. Besides, we study the performance of the FTM detector in terms of timing, gain, and efficiency as a function of different parameters, such as the gas mixture and hole configuration. While a wider hole diameter leads to gain deterioration in GEMs [9], we show that an improved time resolution is obtained in wide holes FTM due to an increased collection efficiency.
2. Setup and Simulations
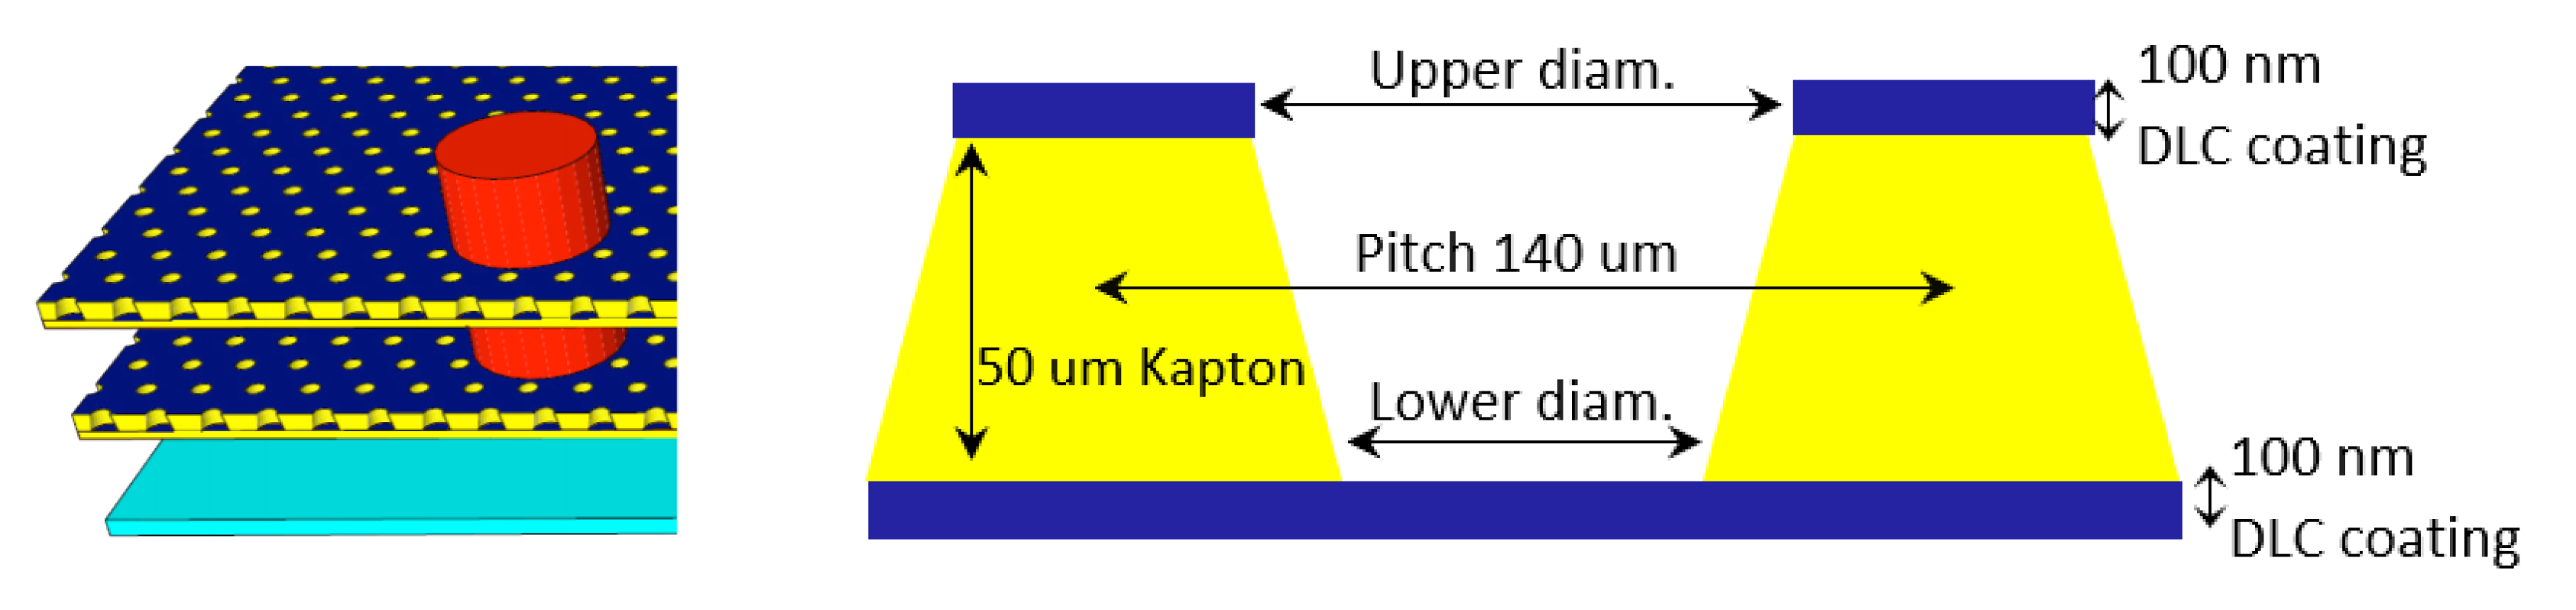
The FTM is realized by creating successive drift and amplification layers, with a constant total drift thickness of 4 mm for all configurations (1 layer of 4 mm, 2 layers of 2 mm, ..., 32 layers of 0.125 mm), as shown in Figure 1. An amplification structure is realized by perforating 140 m-pitch holes on a 50 m thick Kapton foil, coated with resistive Diamond Like Carbon (DLC) on both the top and bottom sides: while the upper DLC induces the high electric field inside the hole, the bottom DLC coating serves as the drift electrode for the next FTM layer. A top plane that is made of a Kapton foil covered with ∼100 nm DLC constitutes the drift electrode, while the bottom layer of the FTM is kept at ground. The overall structure is assumed to be transparent to the signals created in any layer. Indeed, the transparency depends on the capacitance between each layer and the signal electrodes as well as the surface resistivity of the electrodes. We believe that a careful choice of materials and thickness will allow finding a configuration with nearly 100% transparency.
While the electric field map in the FTM was calculated using ANSYS Mechanical APDL suite [10], the detector and the charge transport simulations were performed using Garfield++ [11] (the reader could ask authors for codes). Solving the charge transport equation of motion can be done in Garfield++ with Runge-Kutta-Fehlberg (RKF) integration or Microscopic Tracking. RKF is suitable for tracking electrons over large distances and in cases where detailed calculations of ionization and excitation processes are not required. On the other hand, Microscopic Tracking, which is used in this work, is the method of choice for accurate and detailed simulations of electron trajectories in small-scale structures [12].
Three different hole configurations were studied in the present work, as shown in Table 1: Hole-1 with 90 m diameter at the top and 40 m at the base, hole-2 with 70 m diameter at the top and 50 m at the base, and hole-3 with 100 m diameter at the top and 70 m at the base. Those different hole configurations were the actual experimental configurations that were obtained after the etching of the DLC-clad polyimide foils of various prototypes built and tested at CERN since 2014 [8].
3. Results and Discussion
Time resolution, gain, and efficiency are investigated in order to study the performance of the FTM detector. Time performance is studied as a function of the drift field, the number of FTM layers, and for different gas mixtures. The detector gain is plotted as a function of electric fields and for different gas mixtures. Finally, we study the detector efficiency in order to understand the timing and gain behaviors. For all studies, a minimum of 2000 events are simulated each time, enough to minimize statistical uncertainties.
3.1. Time Performance
The time performance is the most important parameter as the detector was mainly proposed in light of improving the general MPGD time resolution. For a FTM, the time resolution is expected to linearly decrease with increasing number of layers following the equation: [6]
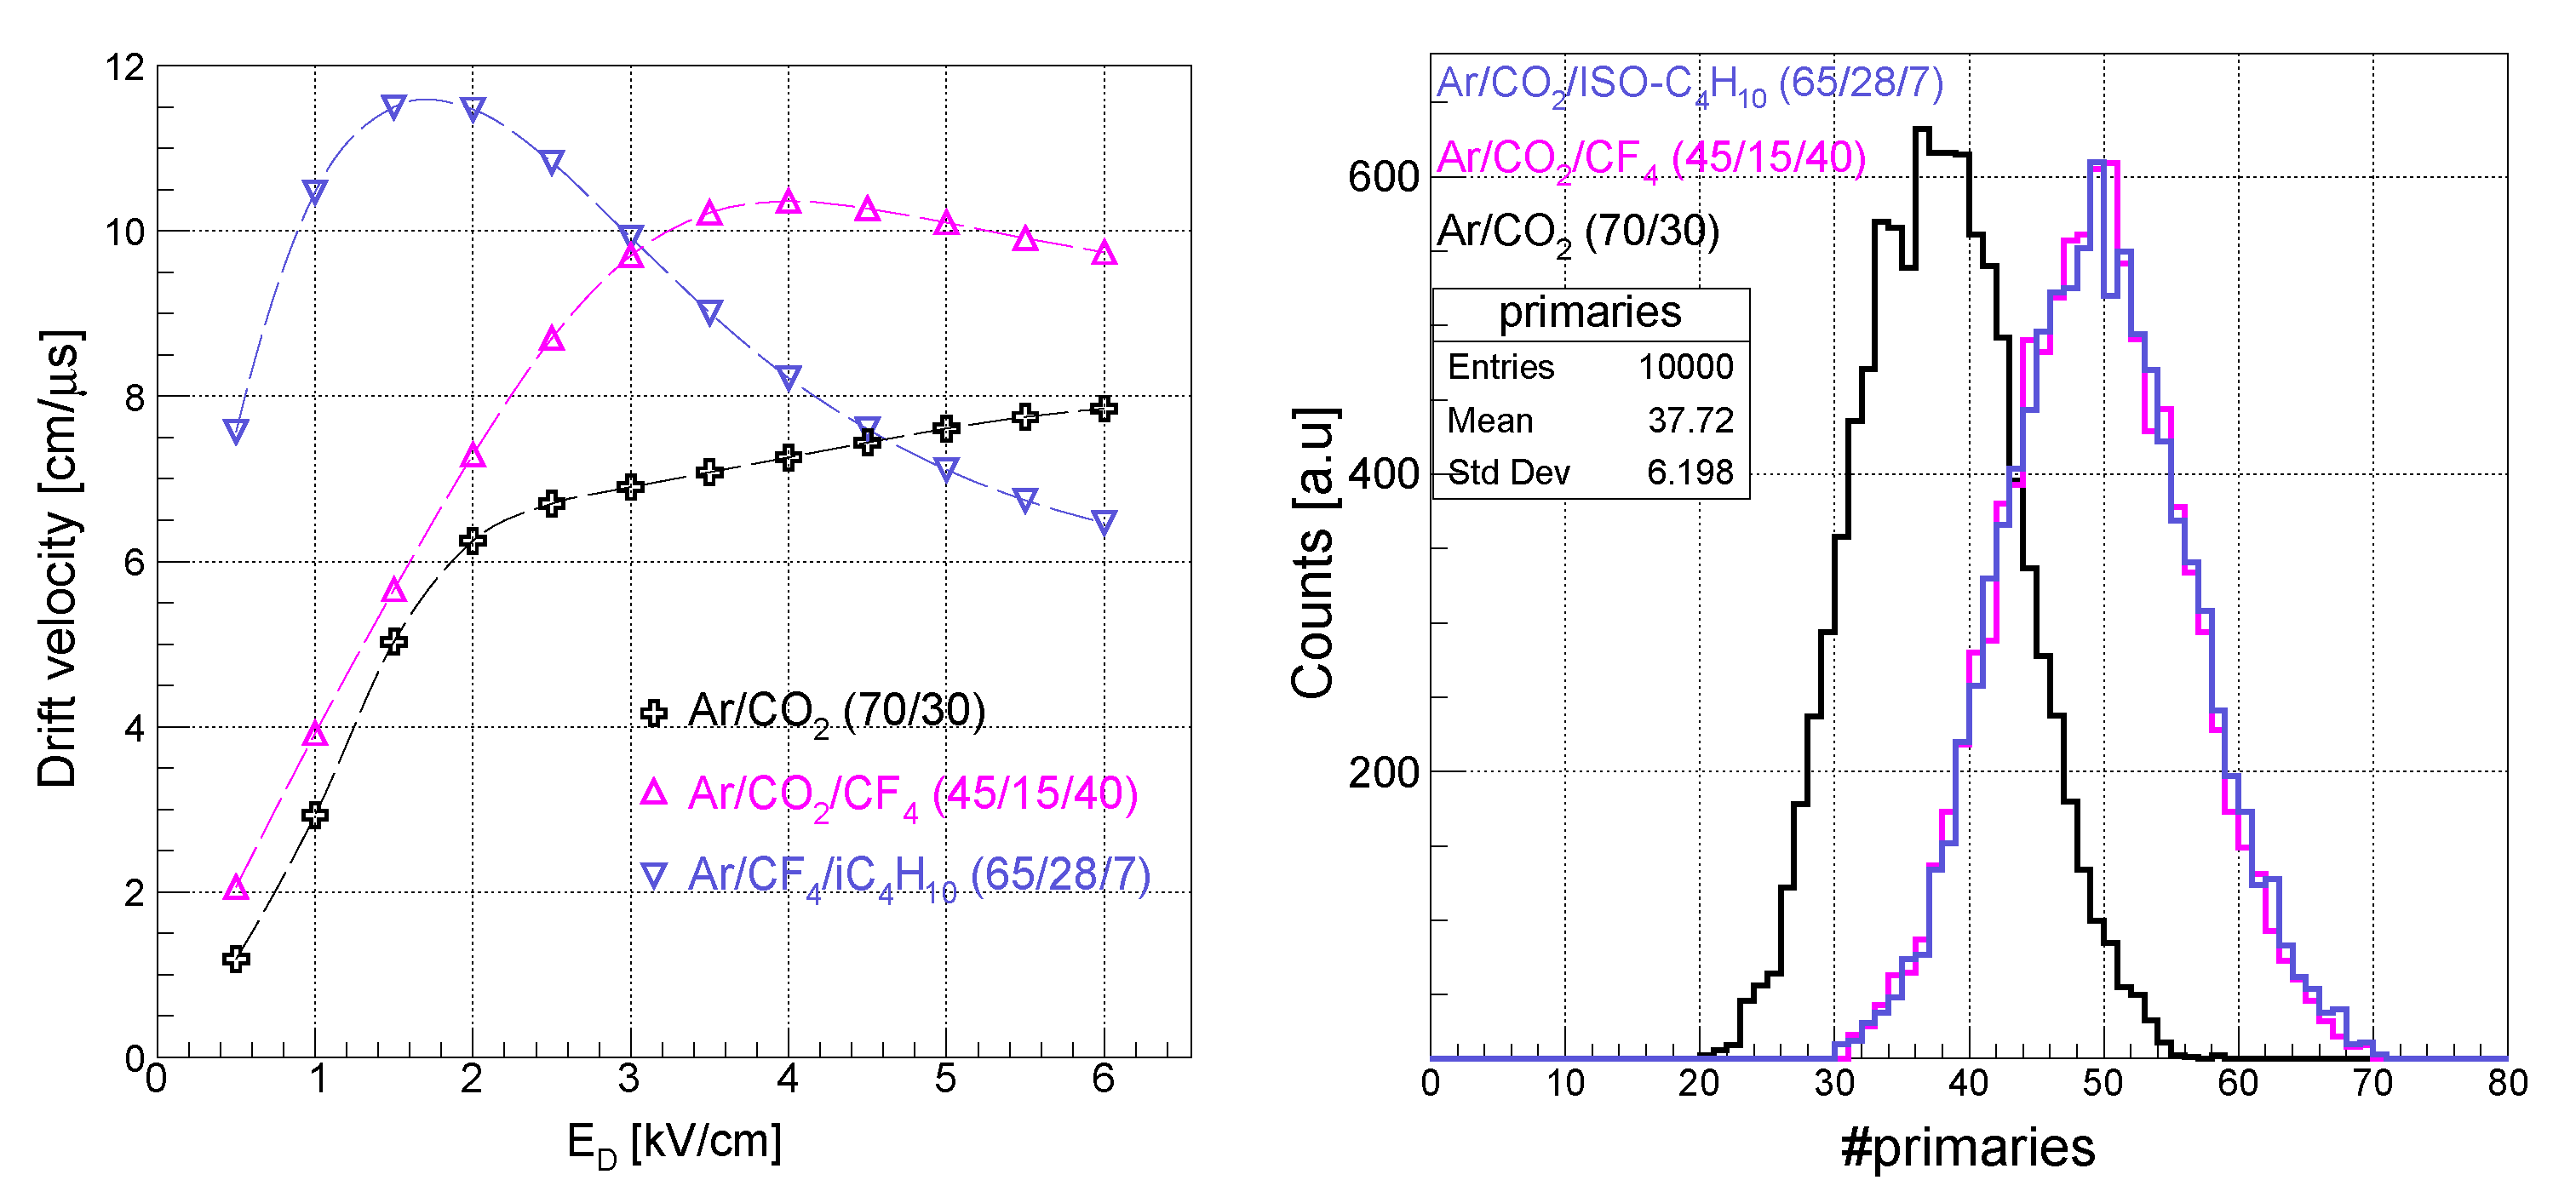
where is the average number of primary clusters that were generated by an ionising particle inside the gas (whose occurrence is a Poisson process), is the number of the FTM drift layers, and is the drift velocity. Cluster density and drift velocity, which both depend on the gas mixture, were estimated with Garfield++, as shown in Figure 2.
In this work, time studies were performed with 50 GeV/c muons coming vertically downward. Garfield++ calculations were done using the Microscopic Tracking method that offers two tracing functions: DriftElectron, which only traces the primary electrons, but not the secondaries produced along the drift path, and AvalancheElectron, which traces all of the electrons produced in the avalanche, as mentioned in Section 1. DriftElectron was preferred over AvalancheElectron, as this results in a considerable reduction of the computation times by approx. one order of magnitude, without altering the time resolution (which is given by the RMS of the distribution of the arrival time of the fastest electrons among all layers), provided that the amplification field () is above 110 kV/cm as the time resolution becomes independent of the value of the noise threshold [7].
3.1.1. Time Resolution as a Function of the Drift Field
Figure 3 shows the time resolution as a function of the drift field at an amplification field of 120 kV/cm for a single layer FTM with gap thickness = 4 mm in Ar/CO (70/30) gas mixture. Hole-3 shows a better time resolution when compared to both other configurations: time resolution as a function of drift field seems to improve with wider holes due to increasing collection efficiency, which will be discussed in Section 3.3.
3.1.2. Time Resolution as a Function of FTM Number of Layers
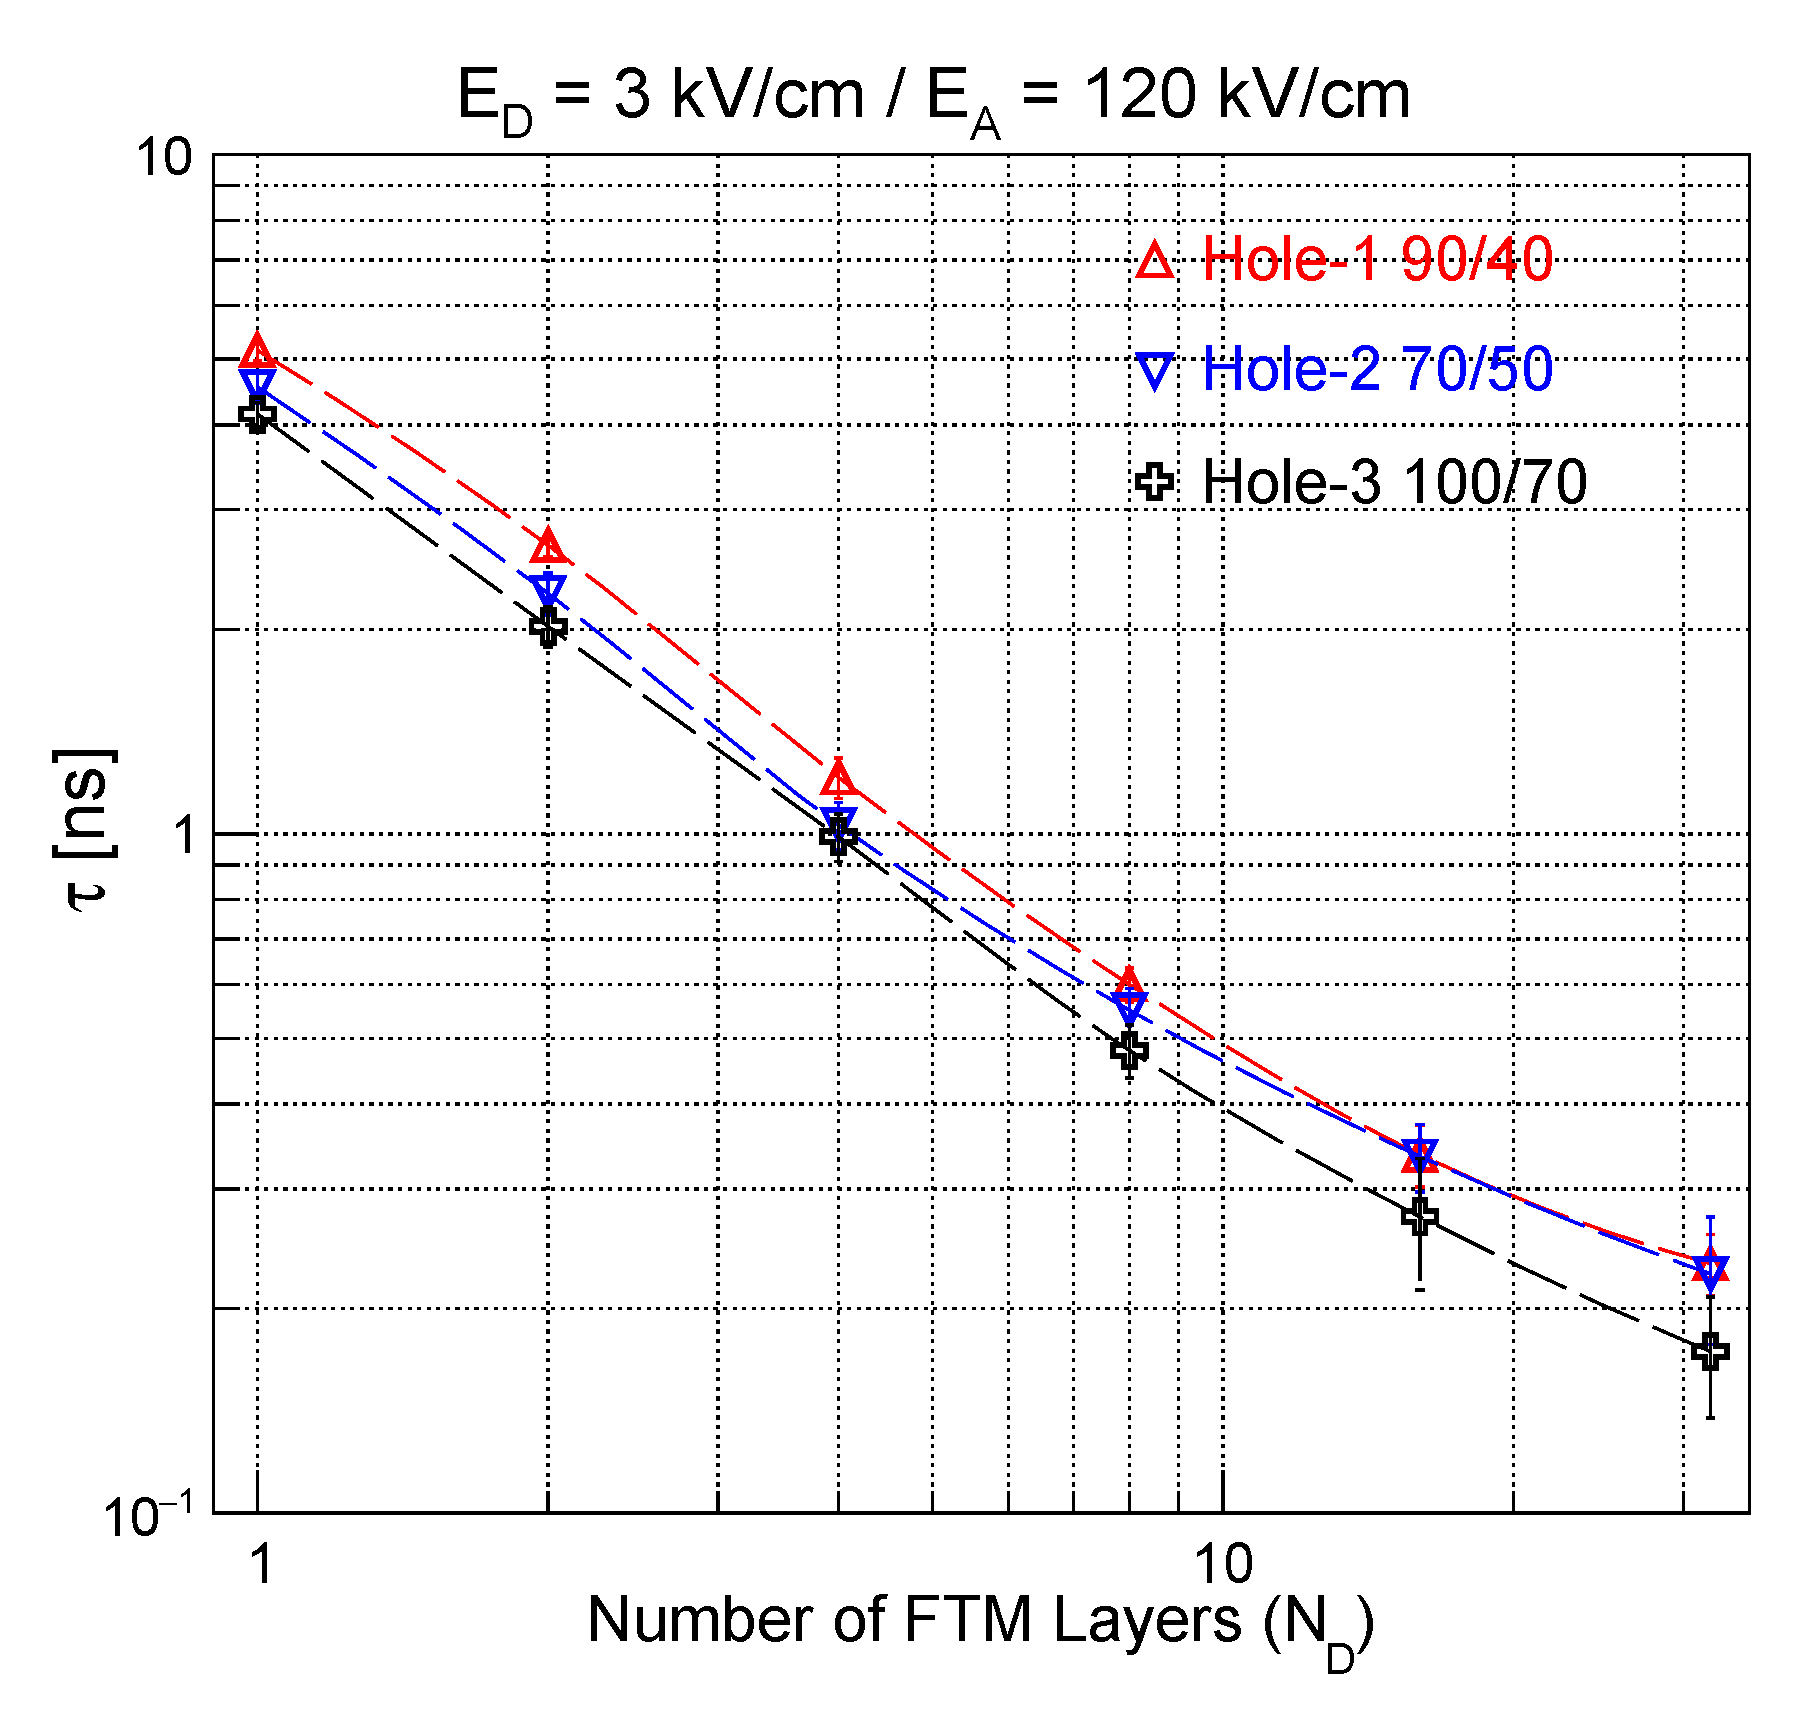
Time resolution (under the assumption of total signal transparency) was then plotted as a function of the number of FTM-layers for a drift field of 3 kV/cm and an amplification field of 120 kV/cm. Figure 4 shows that the time resolution is inversely proportional to the number of layers, as expected from Equation (1). The resolution is also in good agreement with experimental results published in [8].
However, a certain deviation from the linear behavior is observed with an increasing number of layers. It will be demonstrated in Section 3.3 that this deviation must be due to a reduced electron collection efficiency in thin layers. On the other hand, hole-3 shows a better timing performance with a less pronounced deviation as compared to both other configurations: Hole-3 has the wider hole diameter at the top and, hence, is expected to have better collection efficiency.
For a 32-layers FTM, a time resolution of 173 ps is obtained with hole-3 configuration in Ar/CO (70/30), ∼30% better than both other configurations. No timing simulations were preformed beyond 32 layers, as the technical realisation would become increasingly more difficult and the reduced size of the drift gap would not be thick enough for efficient electron collection in the holes.
3.1.3. Time Resolution with Different Gas Mixtures
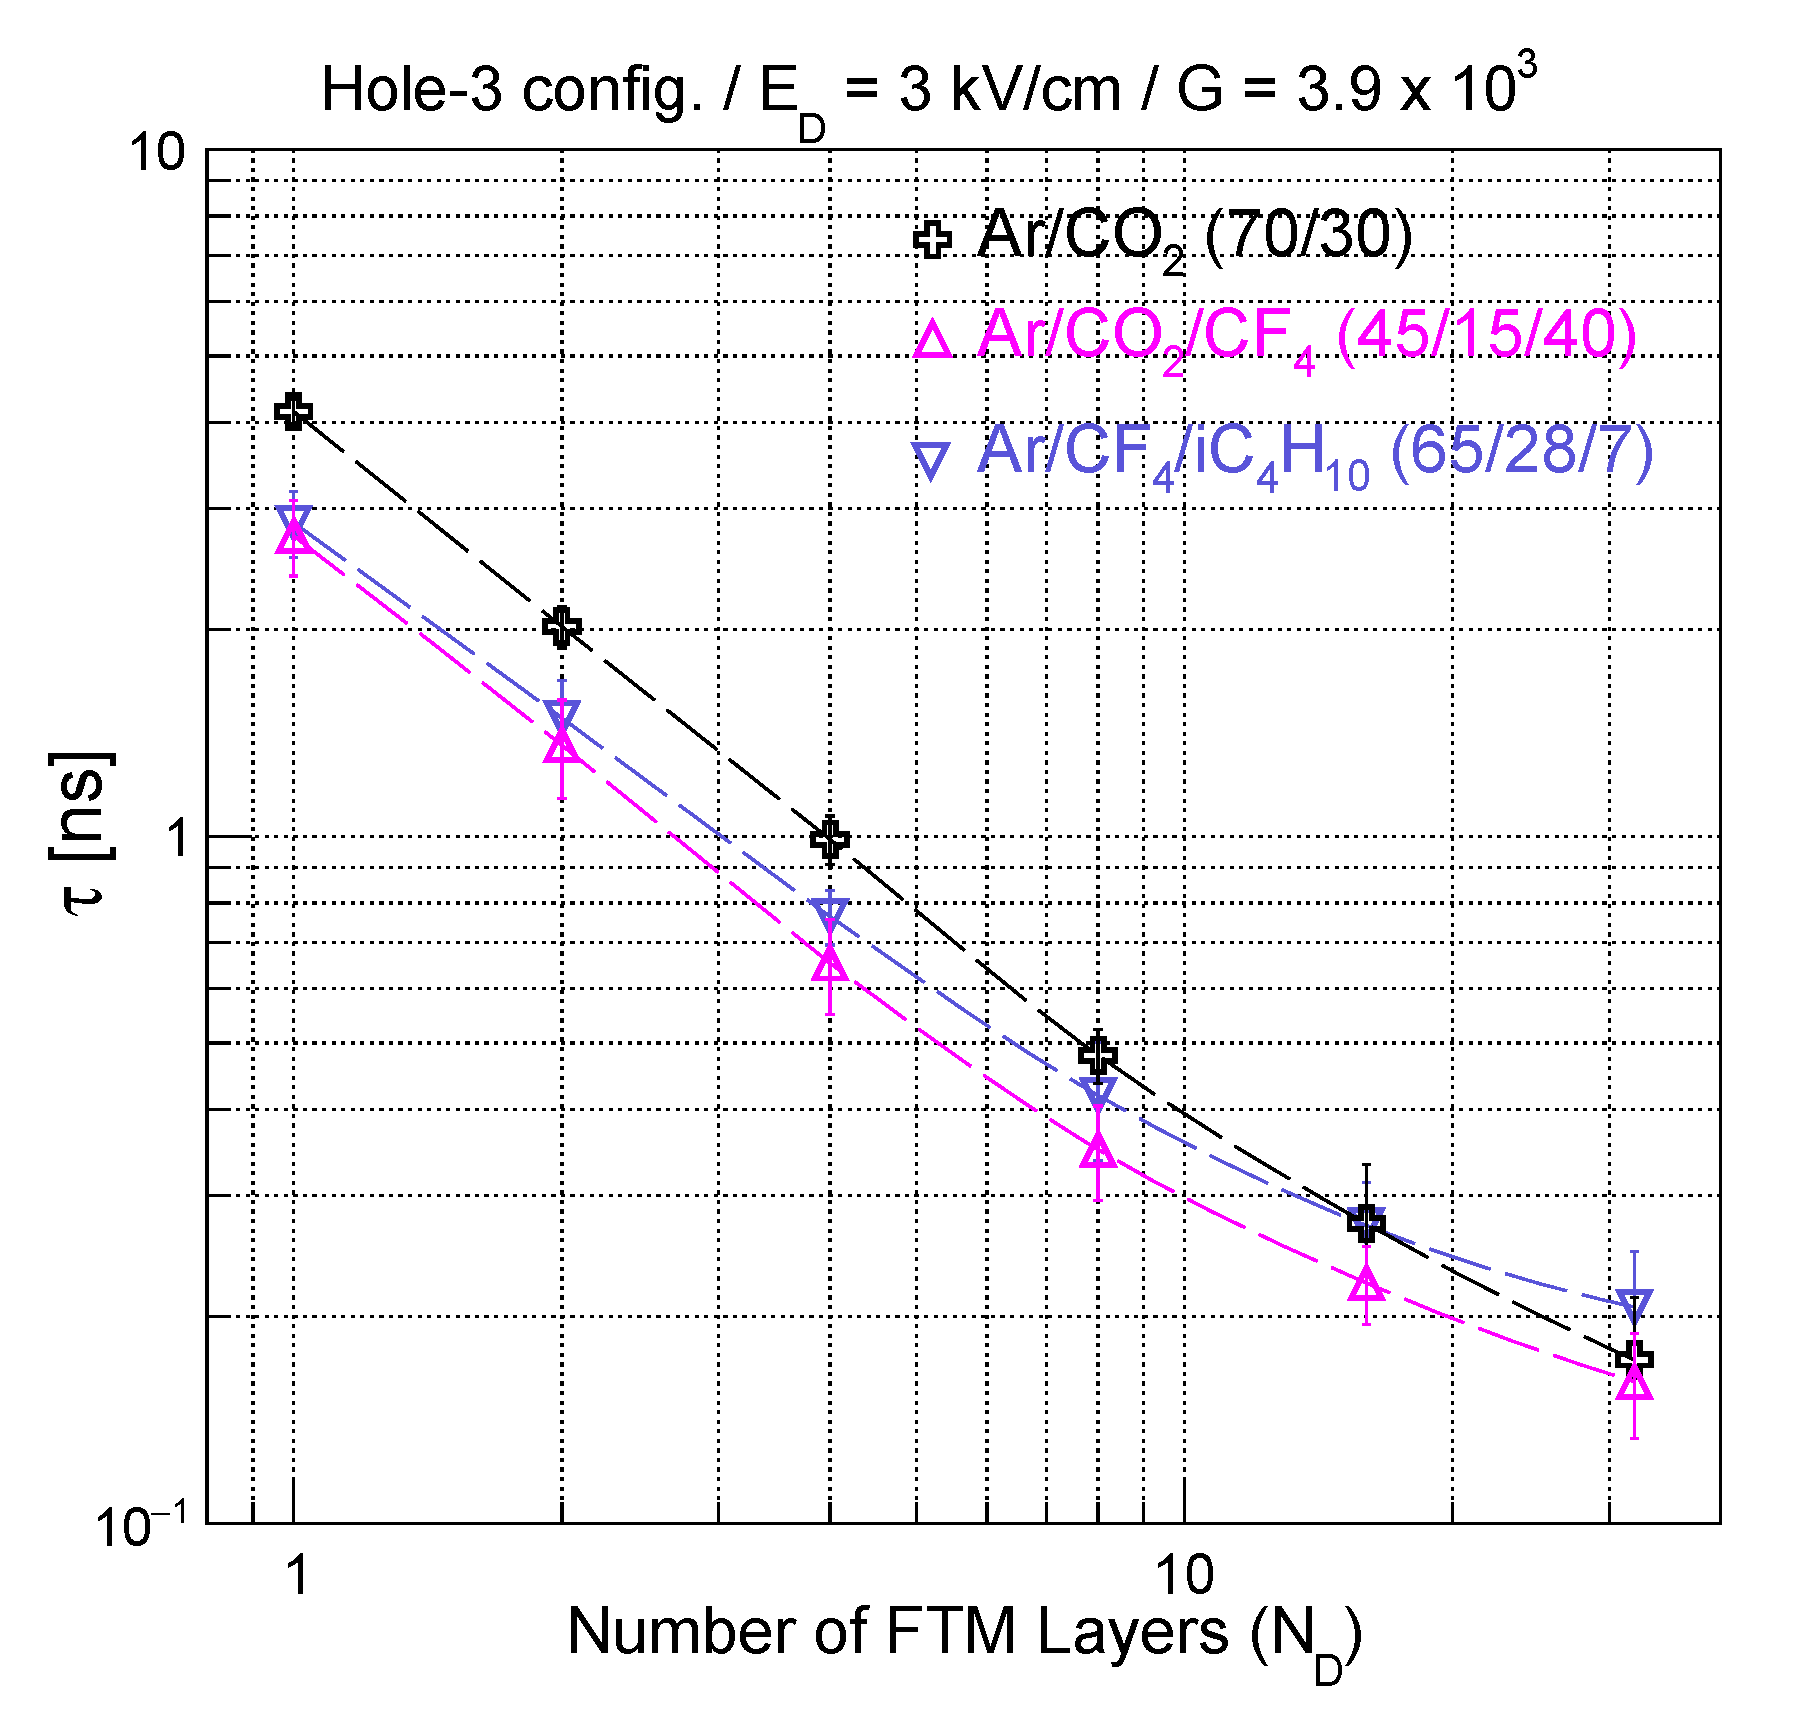
Time resolution was simulated with two additional gas mixtures: Ar/CO/CF (45/15/40), and Ar/CO/ISO-CH (65/28/7). Both of the gases have shown an improved time resolutions in GEM-based detectors [13,14]. The time resolution is compared in Figure 5 for the three gas mixtures at an equivalent total charge of ∼3.9 × 10 electrons (which corresponds to an amplification field of 120 kV/cm for Ar/CO, 124.66 kV/cm for Ar/CO/CF and 91.67 kV/cm for Ar/CO/ISO-CH). The Ar/CO/CF mixture seems to achieve the best timing performance with a resolution of 160 ps in a 32-layers FTM. However, the deviation from the linear behavior looks more pronounced with Ar/CO/ISO-CH and Ar/CO/CF when compared to Ar/CO, which will be investigated in a future work.
3.2. Gain
3.2.1. Gain as a Function of the Electric Fields
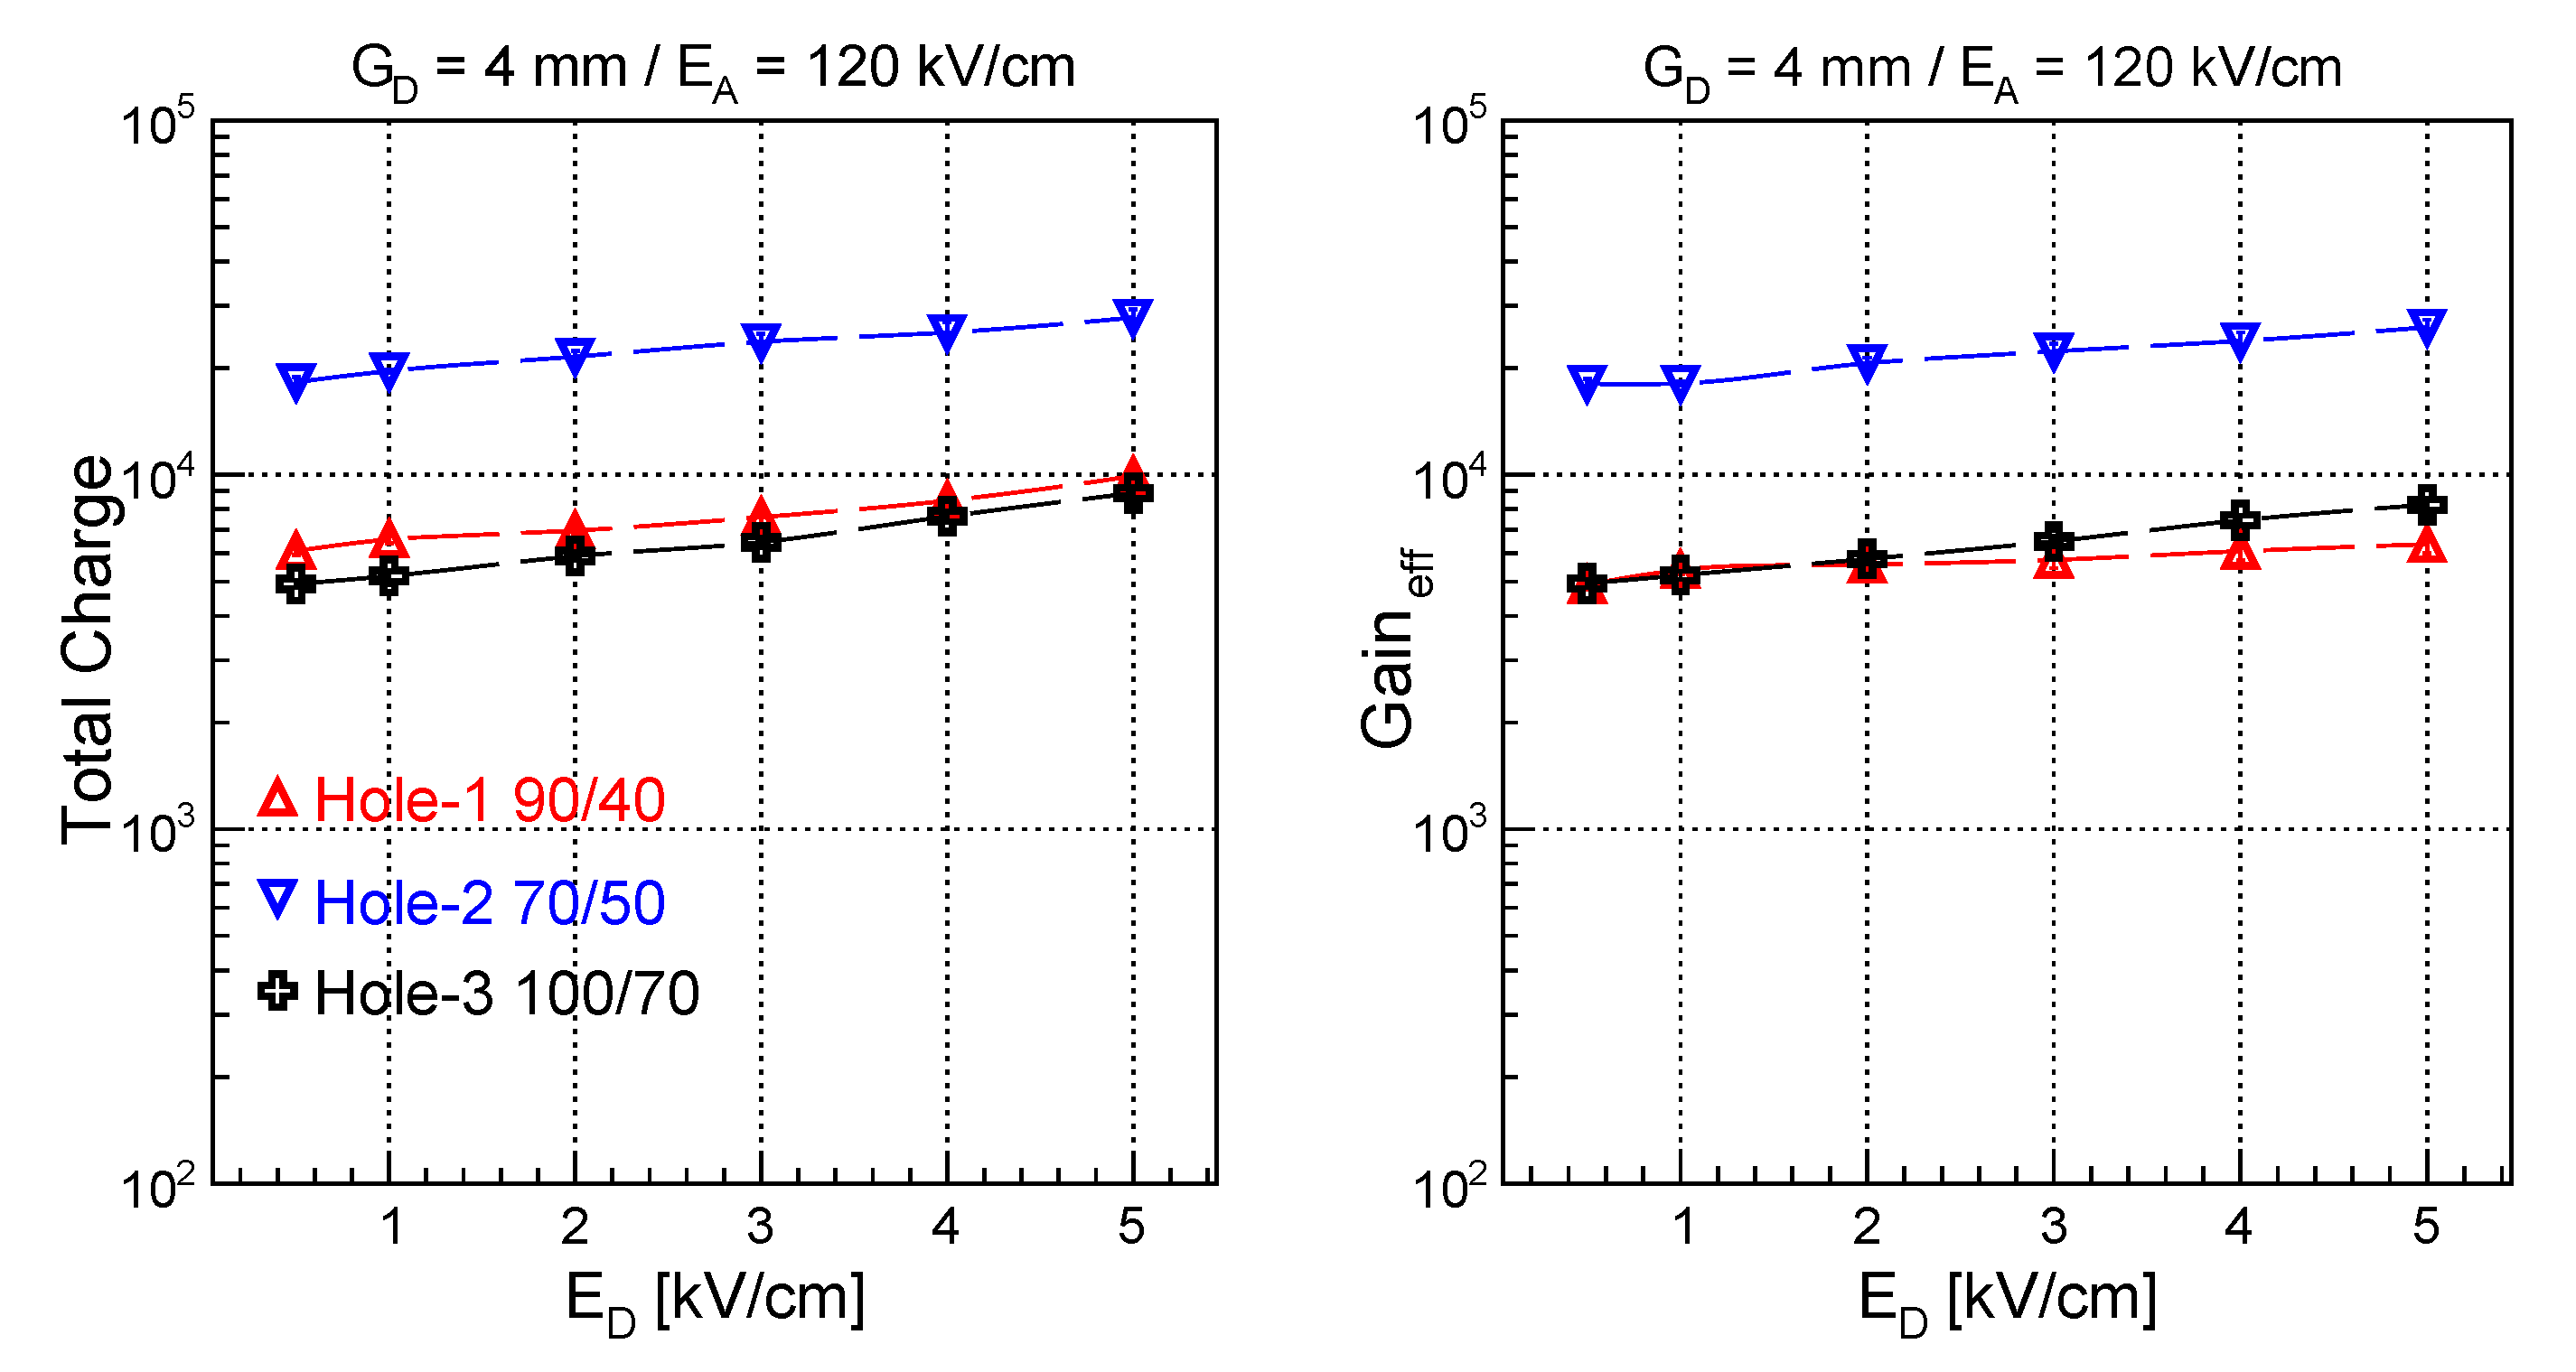
A scan of the gain as a function of the drift and amplification fields was performed in a 4 mm thick single FTM layer while using the AvalancheElectron function in Garfield++. For the three hole configurations, both the total charge produced in the avalanches and the effective gain (defined as the number of electrons reaching the readout plane) were simulated in Ar/CO (70/30) for drift fields between 0.5 and 5 kV/cm (Figure 6) and for amplification fields between 90 and 130 kV/cm (Figure 7). Hole-2 configuration exhibits significantly higher gain when compared to both other configurations that show an almost similar total and effective gains. Indeed, the gain is expected to be higher for diameters closer to the foil thickness [2] and it is supposed to be increasing with narrower holes due to increasing fields [9].
3.2.2. Gain with Different Gas Mixtures
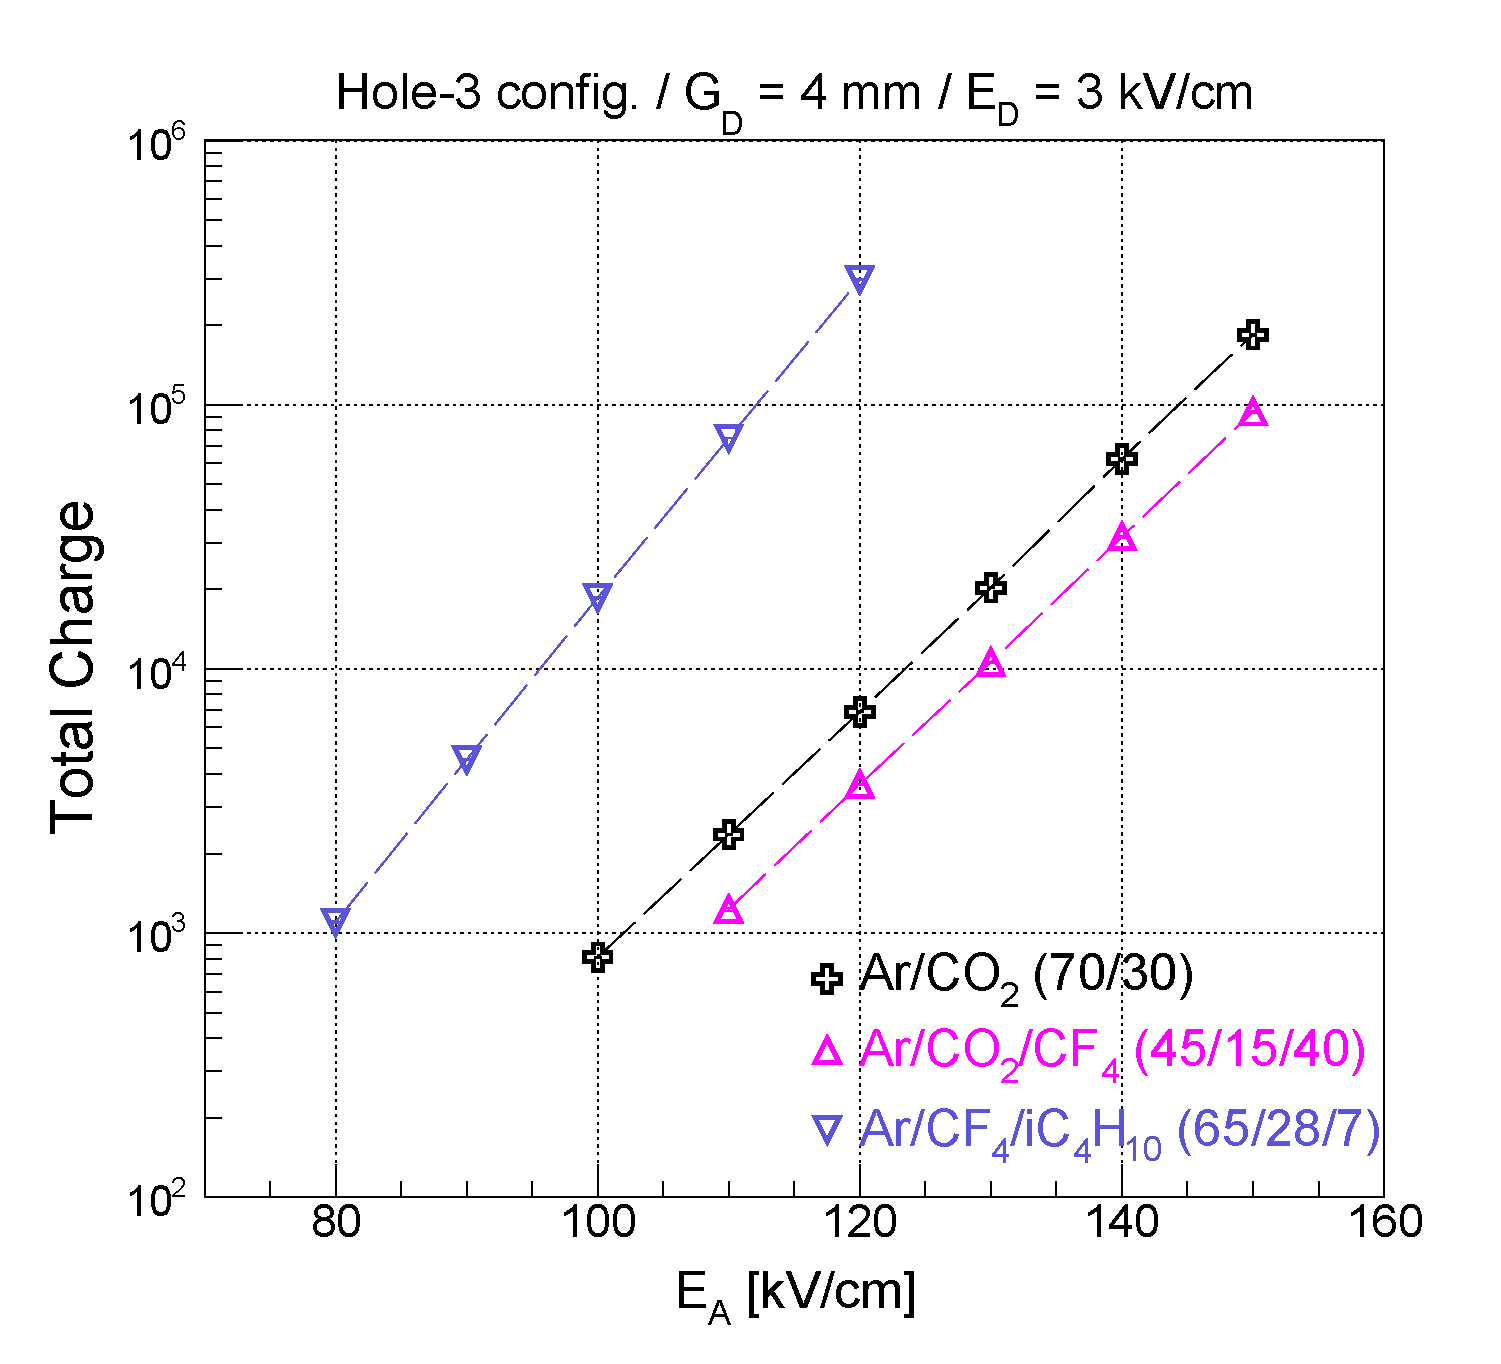
The total charge was compared for the three gas mixtures in hole-3 configuration at = 3 kV/cm. The use of Ar/CO/ISO-CH (65/28/7) results in a gain more than one order of magnitude higher when compared to both other gas mixtures at even lower fields, as shown in Figure 8.
3.3. FTM Efficiency
A detailed analysis of the efficiency is required in order to analyze the performance of the FTM and to understand the deviation of the time resolution from the expected linear behavior observed for a high number of layers, which is less pronounced with hole-3 configuration. We first propose the two following definitions of efficiency that will be presented in this section: (1) the collection efficiency defined as the number of electrons entering a hole divided by the total number of initial electrons and (2) the detection efficiency defined as the number of electrons reaching the readout plane divided by the total number of initial electrons: the detection efficiency can be considered to be the ratio of electrons that have contributed to the signal. In both cases, we simulate a minimum of 2000 electrons in Ar/CO (70/30) and we trace them using the DriftElectron function in Garfield++.
3.3.1. Efficiency as a Function of the Drift Field
Figure 9 shows the collection and detection efficiencies as a function of the drift field, obtained by simulating electrons drifting in a 4 mm thick single-layer FTM at 120 kV/cm amplification field. The behavior of FTM efficiency as a function of the drift field is generally similar to the GEM efficiency found in [9]. While collection efficiency is almost similar for all hole configurations below 4 kV/cm, it tends to decrease with decreasing top diameters for > 4 kV/cm. Besides, hole-3 configuration shows an improved detection efficiency, 5–10% higher than hole-2 and up to 20% higher than hole-1, which indicates that the bottom diameter might also affect the fields inside the hole. Indeed, while both efficiencies show the same functional behavior, the detection efficiency declines with decreasing lower diameter: electrons are lost on the internal kapton surface inside the hole.
3.3.2. Efficiency as a Function of the Amplification Field
Similarly, collection and detection efficiencies were computed as a function of the amplification field at a fixed drift field of 3 kV/cm, as shown in Figure 10. While the collection efficiency is similar for all configurations, hole-3 configuration exhibits an improved detection efficiency, being almost 15% higher than hole-1 at 120 kV/cm. This further indicates that, in narrower holes, more electrons get attached to the walls, which results in a loss in the signal.
3.3.3. Muon Efficiency as a Function of the Drift Gap Thickness
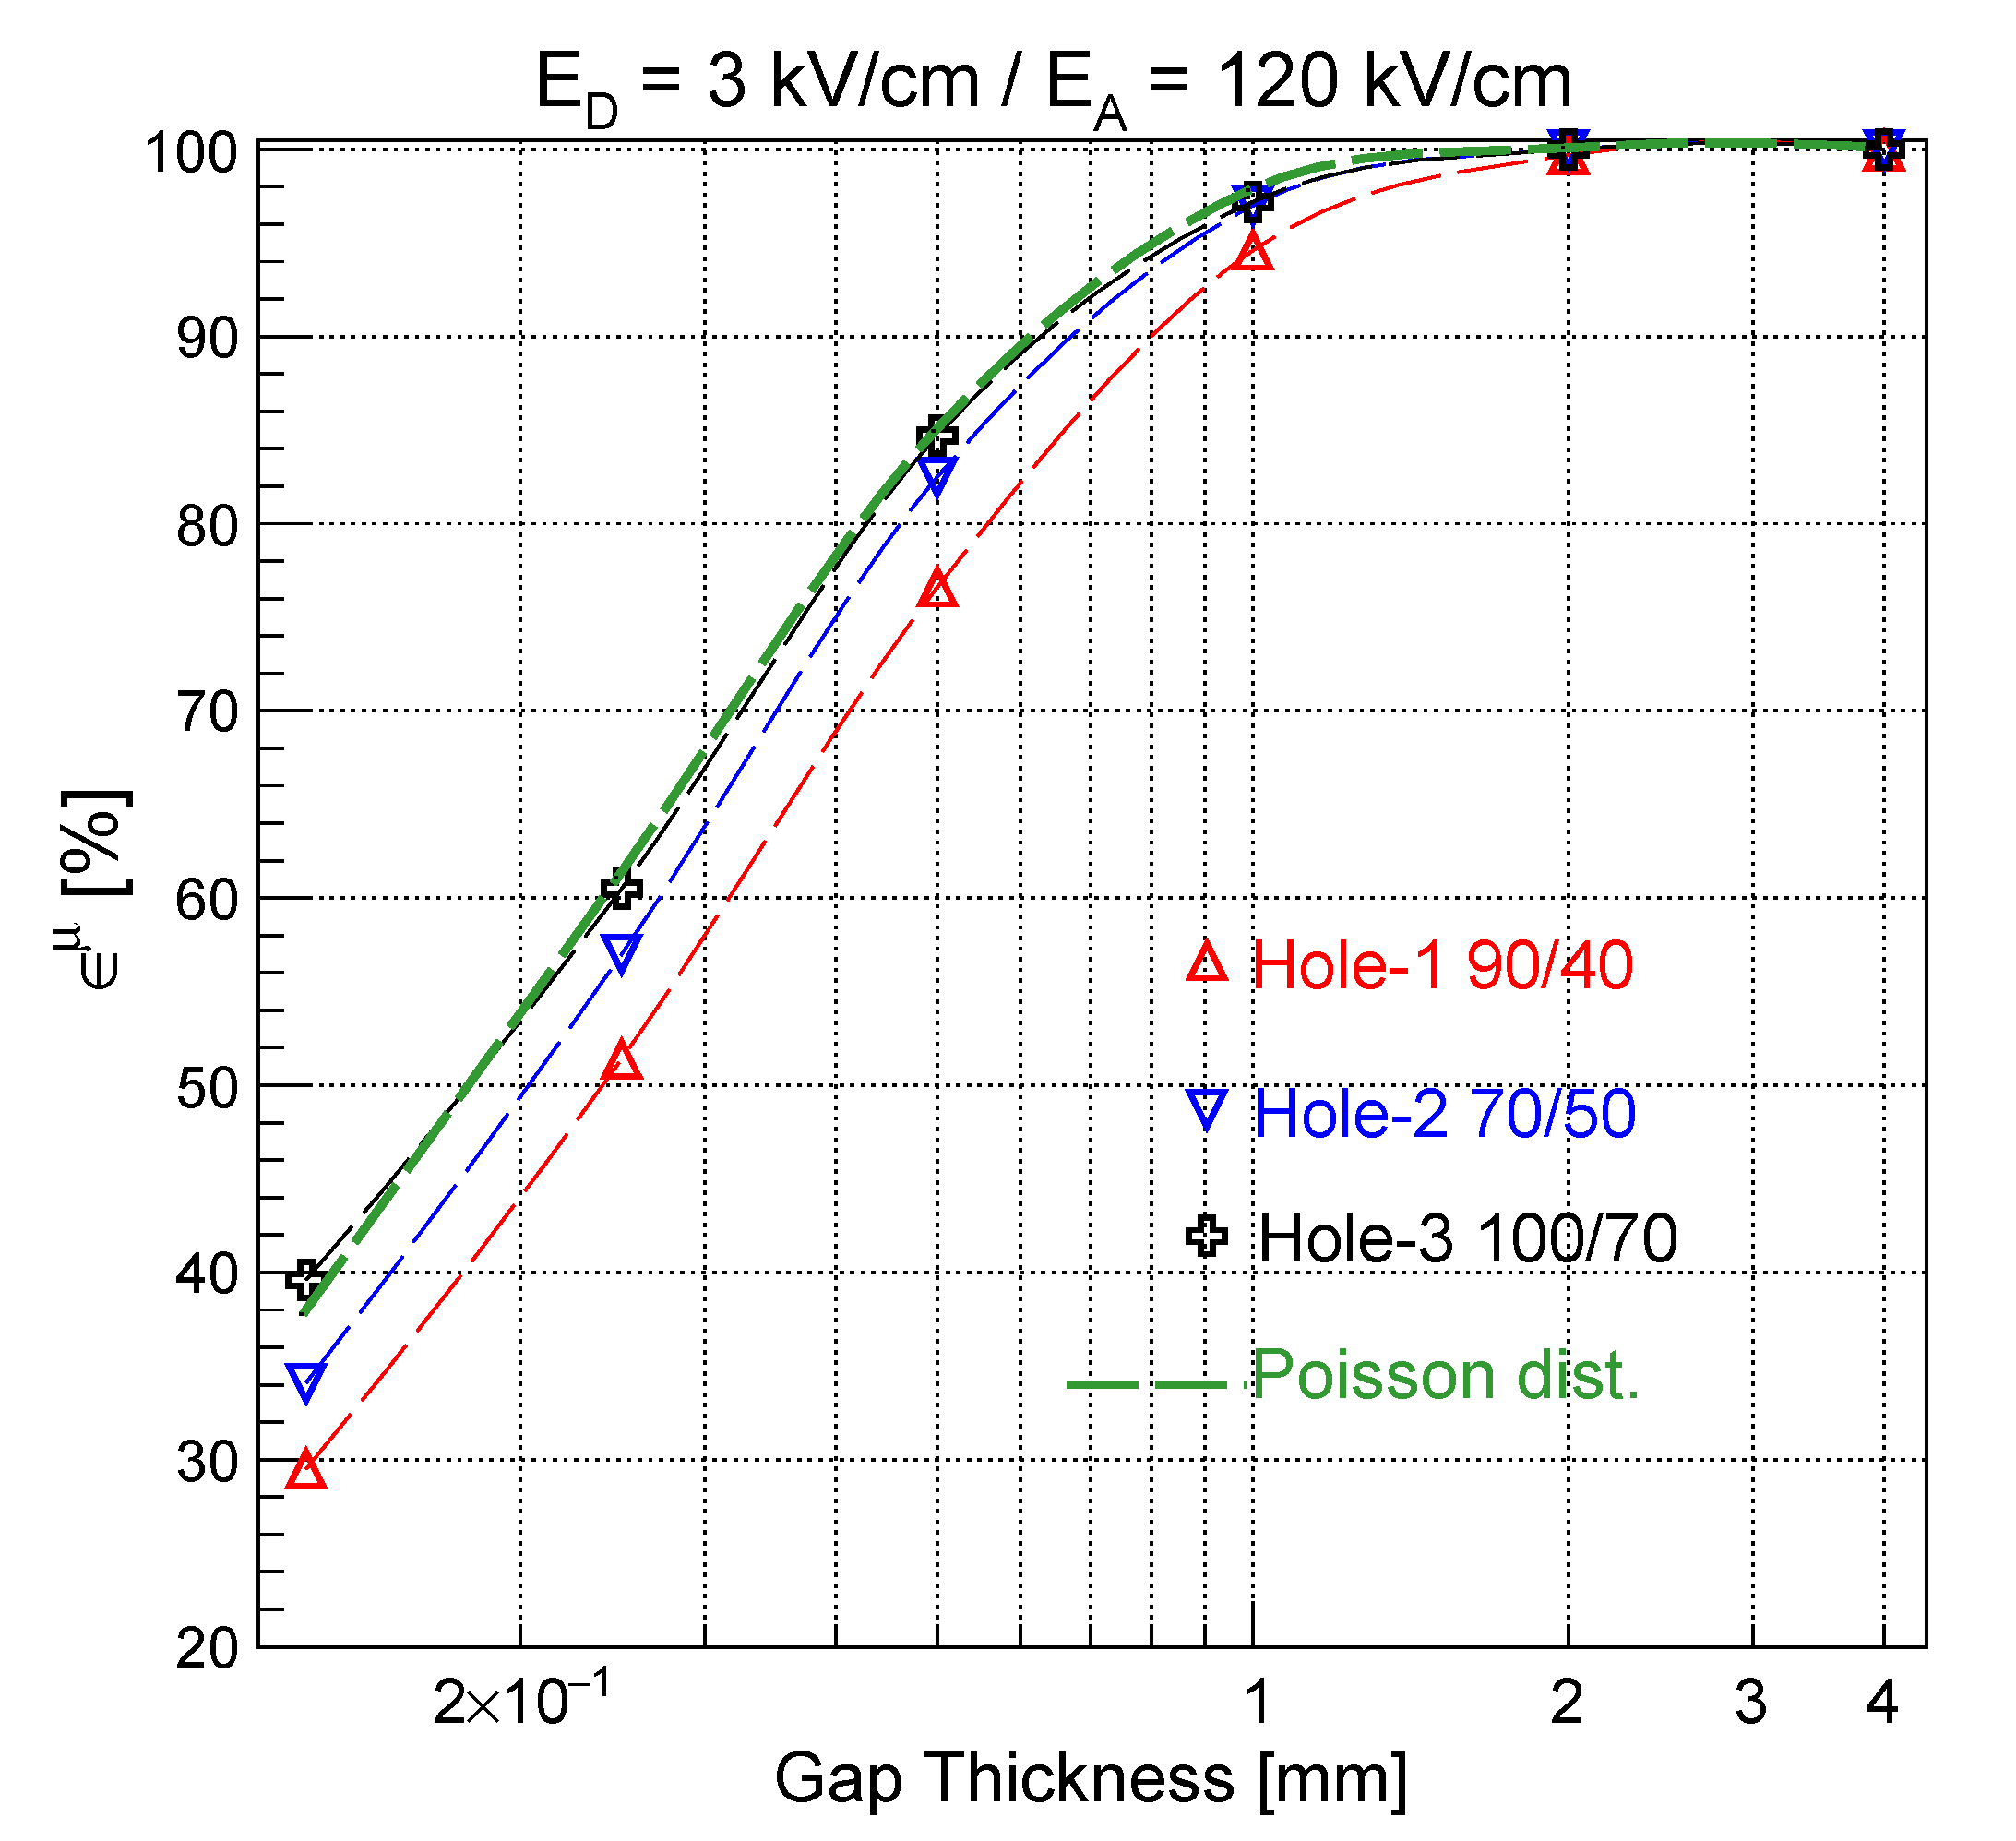
The deviation from the linear behavior that is observed in Figure 4 can be explained by the deterioration of the efficiency in thin layers. Figure 11 shows the collection efficiency of primary ionization electrons that are produced by the passage of a 50 GeV/c muon in Ar/CO (70/30), as a function of the FTM layer thickness. While the efficiency is maximal in 4 mm thick layer, it decreases to below 40% in 0.125 mm thick layer (which corresponds to a 32-layers FTM). Besides, the hole-3 configuration shows a 10% higher efficiency as compared to hole-1 and 5% higher compared to hole-2, further confirming the time resolution variations observed in Figure 4 for a large number of layers.
Figure 11 shows the theoretical maximum that is expected from the Poisson distribution. This maximum is obtained by multiplying the number of primary ionization clusters (∼3.75 cls/mm in Ar/CO (70/30) from Figure 2) with the gap thickness, which gives the probability to have a primary electron in the gap. The maximum theoretical efficiency is then obtained by:
where x is the event of having a primary electron in the gap and P(x) is the probability of this event.
3.3.4. Efficiency as a Function of the Initial Electron Position
The electron collection efficiency was computed as a function of the initial x-position of the simulated electron with a fixed y and z positions in a 0.5, 0.25, and 0.125 mm thick single-layer FTM, respectively. Figure 12 shows how the efficiency is maximal when the electron is created around the center of the hole, but declines when the electron is created away from the center. There is more than 10% loss in collection efficiency in a 0.25 mm layer and more than 15% loss in a 0.125 mm layer when compared to a 0.5 mm thick layer. This result might contribute to the understanding of the deviation of the time resolution from the model expectations in very thin layers, as observed in Figure 4 and in [7].
4. Summary and Conclusions
In this paper, we discussed the performance of the FTM detector, which was recently introduced in view of improving the timing performance of the MPGD detectors, a crucial parameter in future collider experiments and medical applications.
Time resolution, gain, and efficiency have been investigated using ANSYS and Garfield++ codes. Three hole configurations with different diameters and three gas mixtures were tested. The simulations show that a time resolution of 173 ps can be reached in a 32-layers FTM with hole-3 configuration operated in an Ar/CO (70/30) gas mixture at a drift field of 3 kV/cm and an amplification field of 120 kV/cm. This value is ∼30% higher than the theoretical value of 134 ps that is expected from Equation (1). This observed deviation of time resolution from the expected linear behavior at high number of layers seems to be mainly due to an increasing loss of efficiency with decreasing layer thickness. Besides, time resolution is becoming worse with hole-1 and hole-2 configurations (233 ps and 225 ps respectively) also due to efficiency deterioration. The efficiency seems to be impacted by both top and bottom diameters: while the top diameter might impact on the way electron drift on the hole, the bottom diameter might impact the field of the hole and so on the amplification. This assumption can be verified by studying the field intensity inside the hole, which will be investigated in a future work.
Finally, two other gas mixtures were tested: Ar/CO/CF (45/15/40) and Ar/CO/ISO-CH (65/28/7). While Ar/CO/ISO-CH resulted in a much higher gain with no benefit in terms of time resolution, Ar/CO/CF showed a slightly better timing performance (∼160 ns with Ar/CO/CF and 206 ns with Ar/CO/ISO-CH for a 32-layers FTM) along with a lower gain. Therefore, the use of Ar/CO/CF seems to bring a limited benefit to the FTM, especially with the increasing restrictions concerning the use of fluorine-based gases [15].
In conclusion, the results that are presented in this work suggest that the FTM detector would be better performing in terms of timing and efficiency with hole-1 configuration (100 microns at the top and 70 microns at the bottom), operated in Ar/CO (70/30) gas mixture at 3 kV/cm drift and 120 kV/cm amplification fields, which provides a gain of ∼10. These results need to be further confirmed and developed with additional simulations and experimental tests.
Author Contributions
Y.M. contributed with simulations and writing of the manuscript. A.Y. contributed with simulations. P.V. and M.M. provided technical input, guidance to the simulations, discussion of the results, and revision of the manuscript. All authors have read and agreed to the published version of the manuscript.
Funding
This research received no external funding.
Acknowledgments
ANSYS and Garfield++ calculations were performed on the Phoenix High Performance Computing Facility at the American University of the Middle East (AUM), Kuwait. P. Verwilligen gratefully acknowledges INFN, Italy for supporting the research on the FTM through the grant for young researchers “MPGD_FatimA”.
Conflicts of Interest
The authors declare no conflict of interest.
References
- Titov, M.; Ropelewski, L. Micro-pattern gaseous detector technologies and RD51 Collaboration. Mod. Phys. Lett. A 2013, 28, 1340022. [Google Scholar] [CrossRef]
- Sauli, F. The gas electron multiplier (GEM): Operating principles and applications. Nucl. Instr. Methods A 2016, 805, 2–24. [Google Scholar] [CrossRef]
- Bencivenni, G.; Oliveira, R.D.; Morello, G.; Lener, M.P. The micro-Resistive WELL detector: A compact spark-protected single amplification-stage MPGD. J. Instrum. 2015, 10, P02008. [Google Scholar] [CrossRef] [Green Version]
- Alexopoulos, T.; Burnens, J.; de Oliveira, R.; Glonti, G.; Pizzirusso, O.; Polychronakos, V.; Sekhniaidze, G.; Tsipolitis, G.; Wotschack, J. A spark-resistant bulk-micromegas chamber for high-rate applications. Nucl. Instr. Methods A 2011, 640, 110–118. [Google Scholar] [CrossRef] [Green Version]
- Oliveira, R.; Peskov, V.; Pietropaolo, F.; Picchi, P. First tests of thick GEMs with electrodes made of a resistive kapton. Nucl. Instr. Methods A 2007, 576, 362–366. [Google Scholar] [CrossRef] [Green Version]
- Oliveira, R.; Maggi, M. A novel fast timing micropattern gaseous detector: FTM. arXiv 2015, arXiv:1503.05330. [Google Scholar]
- Maghrbi, Y.; Verwilligen, P.; Maggi, M. Fast Timing Micropattern Gaseous Detector (FTM) simulations for future colliders and medical applications. Nucl. Instr. Methods A 2020, 954, 161666. [Google Scholar] [CrossRef]
- Abbaneo, D.; Abbas, M.; Abbrescia, M.; Abi Akl, M.; Aboamer, O.; Acosta, D.; Ahmad, A.; Ahmed, W.; Bari, U.; Aleksandrov, A.; et al. R&D on a new type of micropattern gaseous detector: The Fast Timing Micropattern detector. Nucl. Instr. Methods A 2017, 845, 313–317. [Google Scholar]
- Bachmann, S.; Bressan, A.; Ropelewski, L.; Sauli, F.; Sharma, A.; Mörmann, D. Charge amplification and transfer processes in the gas electron multiplier. Nucl. Instrum. Methods A 1999, 438, 376–408. [Google Scholar] [CrossRef]
- ANSYS, Inc. Academic Research. Release 2020 R1. Available online: www.ansys.com (accessed on 1 January 2019).
- Garfield++, Simulation of Tracking Detectors. Available online: http://garfieldpp.web.cern.ch (accessed on 1 January 2019).
- Schindler, H. Microscopic Simulation of Particle Detectors. Ph.D. Thesis, Vienna Technical University, Vienna, Austria, 2012. Available online: http://cds.cern.ch/record/1500583 (accessed on 1 June 2020).
- Lener, M.P. Triple-GEM Detectors for the Innermost Region of the Muon Apparatus at the LHCb Experiment. Ph.D. Thesis, Tor Vergata University of Rome, Roma, Italy, 2005. Available online: http://cds.cern.ch/record/940631 (accessed on 1 March 2020).
- Bencivenni, G.; de Simone, P.; Murtas, F.; Lerner, M.P.; Bonivento, W.; Cardini, A.; Deplano, C.; Pinci, D.; Raspino, D. Advances in triple-GEM detector operation for high-rate particle triggering. Nucl. Instr. Methods A 2003, 513, 264–268. [Google Scholar] [CrossRef]
- CMS Collaboration. The Phase-2 Upgrade of the CMS Muon Detectors. 2016. Available online: http://cds.cern.ch/record/2283189/files/CMS-TDR-016.pdf (accessed on 1 July 2020).
Figure 1.
(Left): sketch of a 2-layers Fast Timing Micro-Pattern Gaseous Detector (FTM) (without upper drift electrode). (Right): detailed view of the amplification region.
Figure 1.
(Left): sketch of a 2-layers Fast Timing Micro-Pattern Gaseous Detector (FTM) (without upper drift electrode). (Right): detailed view of the amplification region.

Figure 2.
(Left) drift velocity vs. drift field (). (Right) number of primary clusters in 1 cm gas.

Figure 3.
Time resolution vs. in a single FTM in Ar/CO (70/30). Hole-3 shows the best resolution. Lines are only to guide the eye.
Figure 3.
Time resolution vs. in a single FTM in Ar/CO (70/30). Hole-3 shows the best resolution. Lines are only to guide the eye.

Figure 4.
Time resolutions vs. . For a 32-layers FTM, a time resolution of 173 ps is obtained with hole-3 in Ar/CO (70/30), ∼30% better than both other configurations.
Figure 4.
Time resolutions vs. . For a 32-layers FTM, a time resolution of 173 ps is obtained with hole-3 in Ar/CO (70/30), ∼30% better than both other configurations.

Figure 5.
Time resolution for different gas mixtures at an sequivalent total charge. A time resolution of 160 ps is obtained with Ar/CO/CF (45/15/40) in a 32-layer FTM.
Figure 5.
Time resolution for different gas mixtures at an sequivalent total charge. A time resolution of 160 ps is obtained with Ar/CO/CF (45/15/40) in a 32-layer FTM.

Figure 6.
Total charge (left) and effective gain (right) vs. . Hole-2 configuration leads to higher gains.
Figure 6.
Total charge (left) and effective gain (right) vs. . Hole-2 configuration leads to higher gains.

Figure 7.
Total charge (left) and effective gain (right) vs. . Hole-2 configuration leads to higher gains.
Figure 7.
Total charge (left) and effective gain (right) vs. . Hole-2 configuration leads to higher gains.

Figure 8.
Gain for different gas mixtures.

Figure 9.
Collection efficiency (left) and detection efficiency (right) vs. .

Figure 10.
Collection efficiency (left) and detection efficiency (right) vs. .

Figure 11.
Global detector efficiency for muons vs. drift gap thickness, compared to the theoretical prediction from Poisson distribution, showing the deterioration of efficiency in thin layers. Hole-3 shows 10% higher efficiency as compared to hole-1 config.
Figure 11.
Global detector efficiency for muons vs. drift gap thickness, compared to the theoretical prediction from Poisson distribution, showing the deterioration of efficiency in thin layers. Hole-3 shows 10% higher efficiency as compared to hole-1 config.

Figure 12.
Electron collection efficiency vs. initial electron x-position. Efficiency declines when the electron is created away from the hole center. There is more than 10% loss in collection efficiency in a 0.25 mm layer and more than 15% loss in a 0.125 mm layer when compared to a 0.5 mm thick layer.


Table 1.
Studied hole configurations.
| Config. Name | Hole-1 | Hole-2 | Hole-3 |
|---|---|---|---|
| Upper diameter (m) | 90 | 70 | 100 |
| Lower diameter (m) | 40 | 50 | 70 |
Publisher’s Note: MDPI stays neutral with regard to jurisdictional claims in published maps and institutional affiliations. |
© 2020 by the authors. Licensee MDPI, Basel, Switzerland. This article is an open access article distributed under the terms and conditions of the Creative Commons Attribution (CC BY) license (http://creativecommons.org/licenses/by/4.0/).
Share and Cite
MDPI and ACS Style
Maghrbi, Y.; Yehia, A.; Maggi, M.; Verwilligen, P. Study of the FTM Detector Performance with Garfield++. Instruments 2020, 4, 37. https://0-doi-org.brum.beds.ac.uk/10.3390/instruments4040037
AMA Style
Maghrbi Y, Yehia A, Maggi M, Verwilligen P. Study of the FTM Detector Performance with Garfield++. Instruments. 2020; 4(4):37. https://0-doi-org.brum.beds.ac.uk/10.3390/instruments4040037
Chicago/Turabian StyleMaghrbi, Yasser, Ahmed Yehia, Marcello Maggi, and Piet Verwilligen. 2020. "Study of the FTM Detector Performance with Garfield++" Instruments 4, no. 4: 37. https://0-doi-org.brum.beds.ac.uk/10.3390/instruments4040037