Article

Non-Intrusive Load Monitoring of Residential Water-Heating Circuit Using Ensemble Machine Learning Techniques

1
School of Engineering, Computer, and Mathematical Sciences, Auckland University of Technology, Auckland 1010, New Zealand
2
Brice Vallès Consulting, Auckland 1010, New Zealand
3
School of Engineering, Manukau Institute of Technology, Auckland 2023, New Zealand
*
Author to whom correspondence should be addressed.
Submission received: 25 September 2020 / Revised: 10 November 2020 / Accepted: 18 November 2020 / Published: 23 November 2020
(This article belongs to the Special Issue Application of Machine Learning in Power Systems)

Abstract

:
The recent advancement in computational capabilities and deployment of smart meters have caused non-intrusive load monitoring to revive itself as one of the promising techniques of energy monitoring. Toward effective energy monitoring, this paper presents a non-invasive load inference approach assisted by feature selection and ensemble machine learning techniques. For evaluation and validation purposes of the proposed approach, one of the major residential load elements having solid potential toward energy efficiency applications, i.e., water heating, is considered. Moreover, to realize the real-life deployment, digital simulations are carried out on low-sampling real-world load measurements: New Zealand GREEN Grid Database. For said purposes, MATLAB and Python (Scikit-Learn) are used as simulation tools. The employed learning models, i.e., standalone and ensemble, are trained on a single household’s load data and later tested rigorously on a set of diverse households’ load data, to validate the generalization capability of the employed models. This paper presents a comprehensive performance evaluation of the presented approach in the context of event detection, feature selection, and learning models. Based on the presented study and corresponding analysis of the results, it is concluded that the proposed approach generalizes well to the unseen testing data and yields promising results in terms of non-invasive load inference.

1. Introduction

Energy monitoring is considered an integral part of the future smart power grid system. With an increasing number of prosumers and microgrid systems, it is vital to monitor the energy consumption effectively and predict the consumption behavior for the long-term stability of a power grid. In this context, advanced metering infrastructure (AMI) plays a significant role by enabling the utilities not only to monitor the energy consumption of customers [1] but also to offer numerous incentive-based programs to consumers toward energy efficiency [2,3]. AMI is a closed loop where the feedback regarding energy consumption to consumers can be broadly classified into direct and indirect feedback. Direct feedback refers to real-time appliance/circuit level energy consumption information (segregated energy monitoring), while indirect feedback relates to monthly bills (aggregated energy monitoring) [4].

1.1. Motivation

Today the smart grid concept transforms the end-users from passive to active consumers, who can play a significant role in energy efficiency [5]. However, without direct feedback, it is unrealistic to expect consumers to play an effective role in a sustainable and efficient energy system [4]. As with direct feedback, consumers are not only able to monitor their electricity consumption effectively but also contribute to energy saving [4,6]. In this context, Martinez et al. [7] present a comprehensive review of more than 60 studies regarding feedback mechanism and concluded that direct feedback leads to more energy savings as opposed to indirect feedback. Therefore, towards energy saving and successful development of the smart grid system, effective energy monitoring at the segregated level, i.e., direct feedback, is inevitable. Segregated energy monitoring could not only contribute to the stability of the grid but also facilitate numerous real-world applications in the context of energy efficiency and conservation.

1.2. Literature Review

One of the techniques toward segregated energy monitoring is referred to as load disaggregation, also known as energy disaggregation [8] or power disaggregation [9]. Load disaggregation refers to a broad range of methodologies where the accumulated load profile is converted into a segregated one using numerous techniques. Mostly, it can be classified into two categories, namely hardware methods and software methods. The former is categorized into intrusive load monitoring (ILM) techniques and smart appliances. Hardware methods are relatively simple to deploy, however, not widely used because of constraints like scalability, reliability, interoperability, and high cost [10,11]. An alternative and attractive load disaggregation technique is a software method commonly referred to as non-intrusive load monitoring (NILM). The NILM process employs numerous pattern recognition techniques to estimate the individual appliance/circuit operation state within the aggregated load data, i.e., acquired from a single metering point [12]. Because of single-point measurements and its non-invasive nature, NILM not only provides a cost-effective segregated energy monitoring solution but also address consumers’ privacy concerns [13]. The NILM methodologies can be grouped into two categories: event-based and eventless, in the context of working principles. Event-based NILM systems are computationally more efficient compared to the eventless approach, as for the latter, all the samples of the acquired load data are considered for inference [14]. An event-based NILM system comprises four building blocks, namely data acquisition, event detection, feature extraction, and load classification. Further details of the existing state of the art on NILM methodologies are presented in [15,16,17].
Data acquisition is a prerequisite of the NILM process that impacts the following stages in terms of the selection of tools/methodologies as well as the type/number of appliances to be accurately classified [6]. Numerous datasets have been collected at a different data granularity level and publicly released. Some of the NILM datasets are Reference Energy Disaggregation Dataset (REDD) [18], Building-Level fUlly-labeled dataset for Electricity Disaggregation (BLUED) [19], UK Domestic Appliance Level Electricity (UK-DALE) [20], GREEN Grid [21], and Pecan Street Inc. Dataport [22]. A recent trend revolves around high data granularity; consequently, most of the research is based on high sampling NILM systems [23]. In this context, Guillén-García et al. [24] acquired voltage and current measurements at 8 kHz of the sampling rate for electrical load identification using the C-means algorithm. De Baets et al. [25] employed two distinct publicly available datasets that include voltage/current measurements sampled at 30 kHz and 44 kHz respectively. Gupta et al. [26] proposed a single point sensing approach for household electrical event detection and classification, where the data acquisition system works in the range of 36–500 kHz. Moreover, Chang [27] proposed an approach based on the wavelet transform of the time-frequency domain where the data granularity is approximately 30 kHz. As high data granularity leads to transient features, consequently, it leads to the inference of a greater number of appliances with higher accuracy [6,15]. However, the said performance comes at a price of high cost and computational complexity due to the requirement of additional high-end measurement devices [28]. Moreover, on social grounds, high data granularity also raises concerns regarding consumers’ privacy as their activities can be detected [29]. Most importantly, high data granularity is not compatible with the existing metering infrastructure.
Recent advancements in computational capabilities significantly aided the NILM classification methodologies. In this context, numerous techniques are adopted by the research community for the NILM process, which include but are not limited to dynamic time wrapping [28,30], optimization [12,31], machine learning [32,33,34,35,36], neural networks [25,37], and deep learning [38,39]. However, in the context of NILM, supervised machine-learning models are more frequently used as compared to other methodologies. For NILM classification, most of the existing research mainly focuses to employ the learning models in a standalone configuration, where some research work presents a comparative analysis of different independent learning models. For example, Azaza and Wallin [40] presented a comparative performance evaluation of five different machine learning models, where the presented study is based on a high data granularity of 30 kHz.
Based on the review of the existing NILM literature, it is observed that most of the research is based on high data granularity. However, the existing metering infrastructure, e.g., revenue meter, is generally not capable of high sampling data measurements, consequently, the high sampling NILM systems are not a viable option for the existing metering infrastructure. Furthermore, load classification in the NILM domain is mostly carried out using standalone machine learning models. However, in the machine learning domain, “one size fits all” is not a case, consequently, standalone machine learning models’ performance varies from case to case. In this context, ensemble learning, i.e., combining different machine learning models to form a single optimal model, is a promising technique to balance the performance of different standalone models. However, it is noted that very little research has been done in terms of ensemble learning techniques in the context of NILM systems.

1.3. Contributions

To address the aforesaid limitations of the existing NILM literature, this research work proposes a low complexity and low data granularity based non-invasive load inference approach for the existing metering infrastructure. The proposed approach is assisted by ensemble learning techniques and only relies on mean power as an input variable. Moreover, to realize the real-world applications, the proposed approach is evaluated using one of the most significant and high-potential demand response residential load elements, i.e., water heating. Further, in the context of NILM, categorical key contributions of this research work are summarized as:
  • To realize the real-world implementation, the proposed approach is,
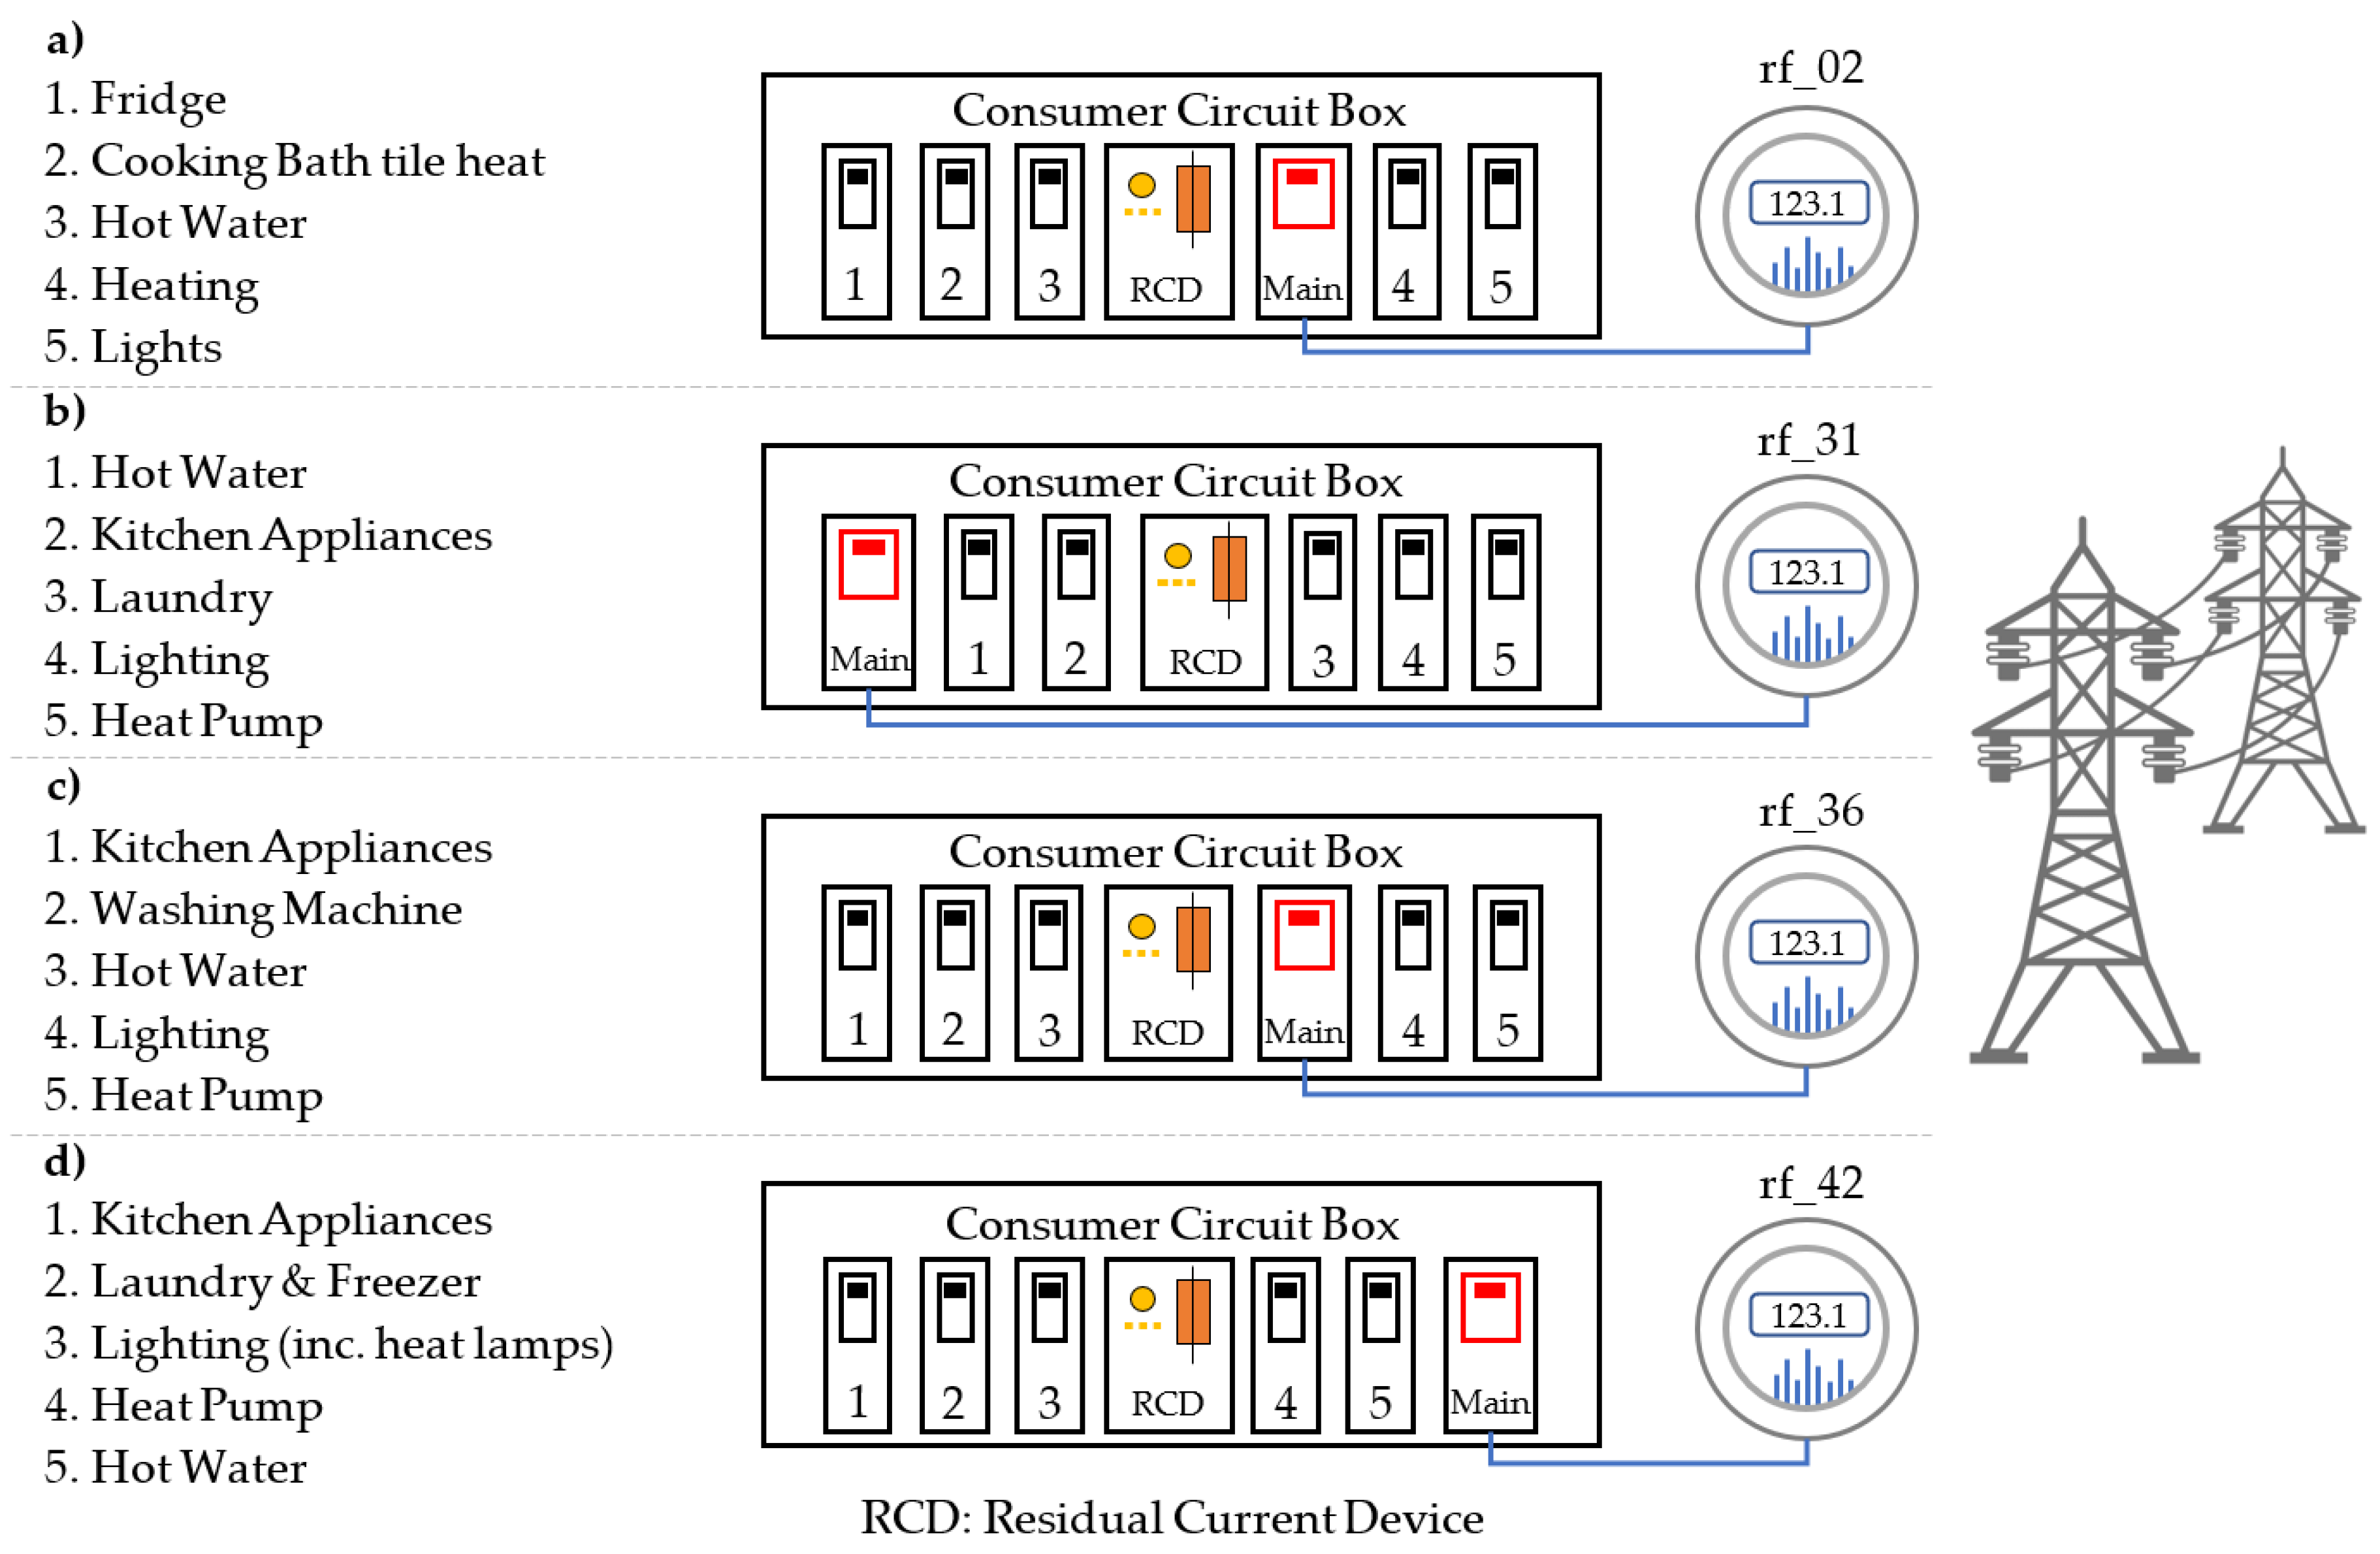
    • Thoroughly evaluated on real-world load measurements acquired at low data granularity of 1/60 Hz, i.e., 1-min interval measurements;
    • Based on only a single input variable, i.e., mean power (in Watts).
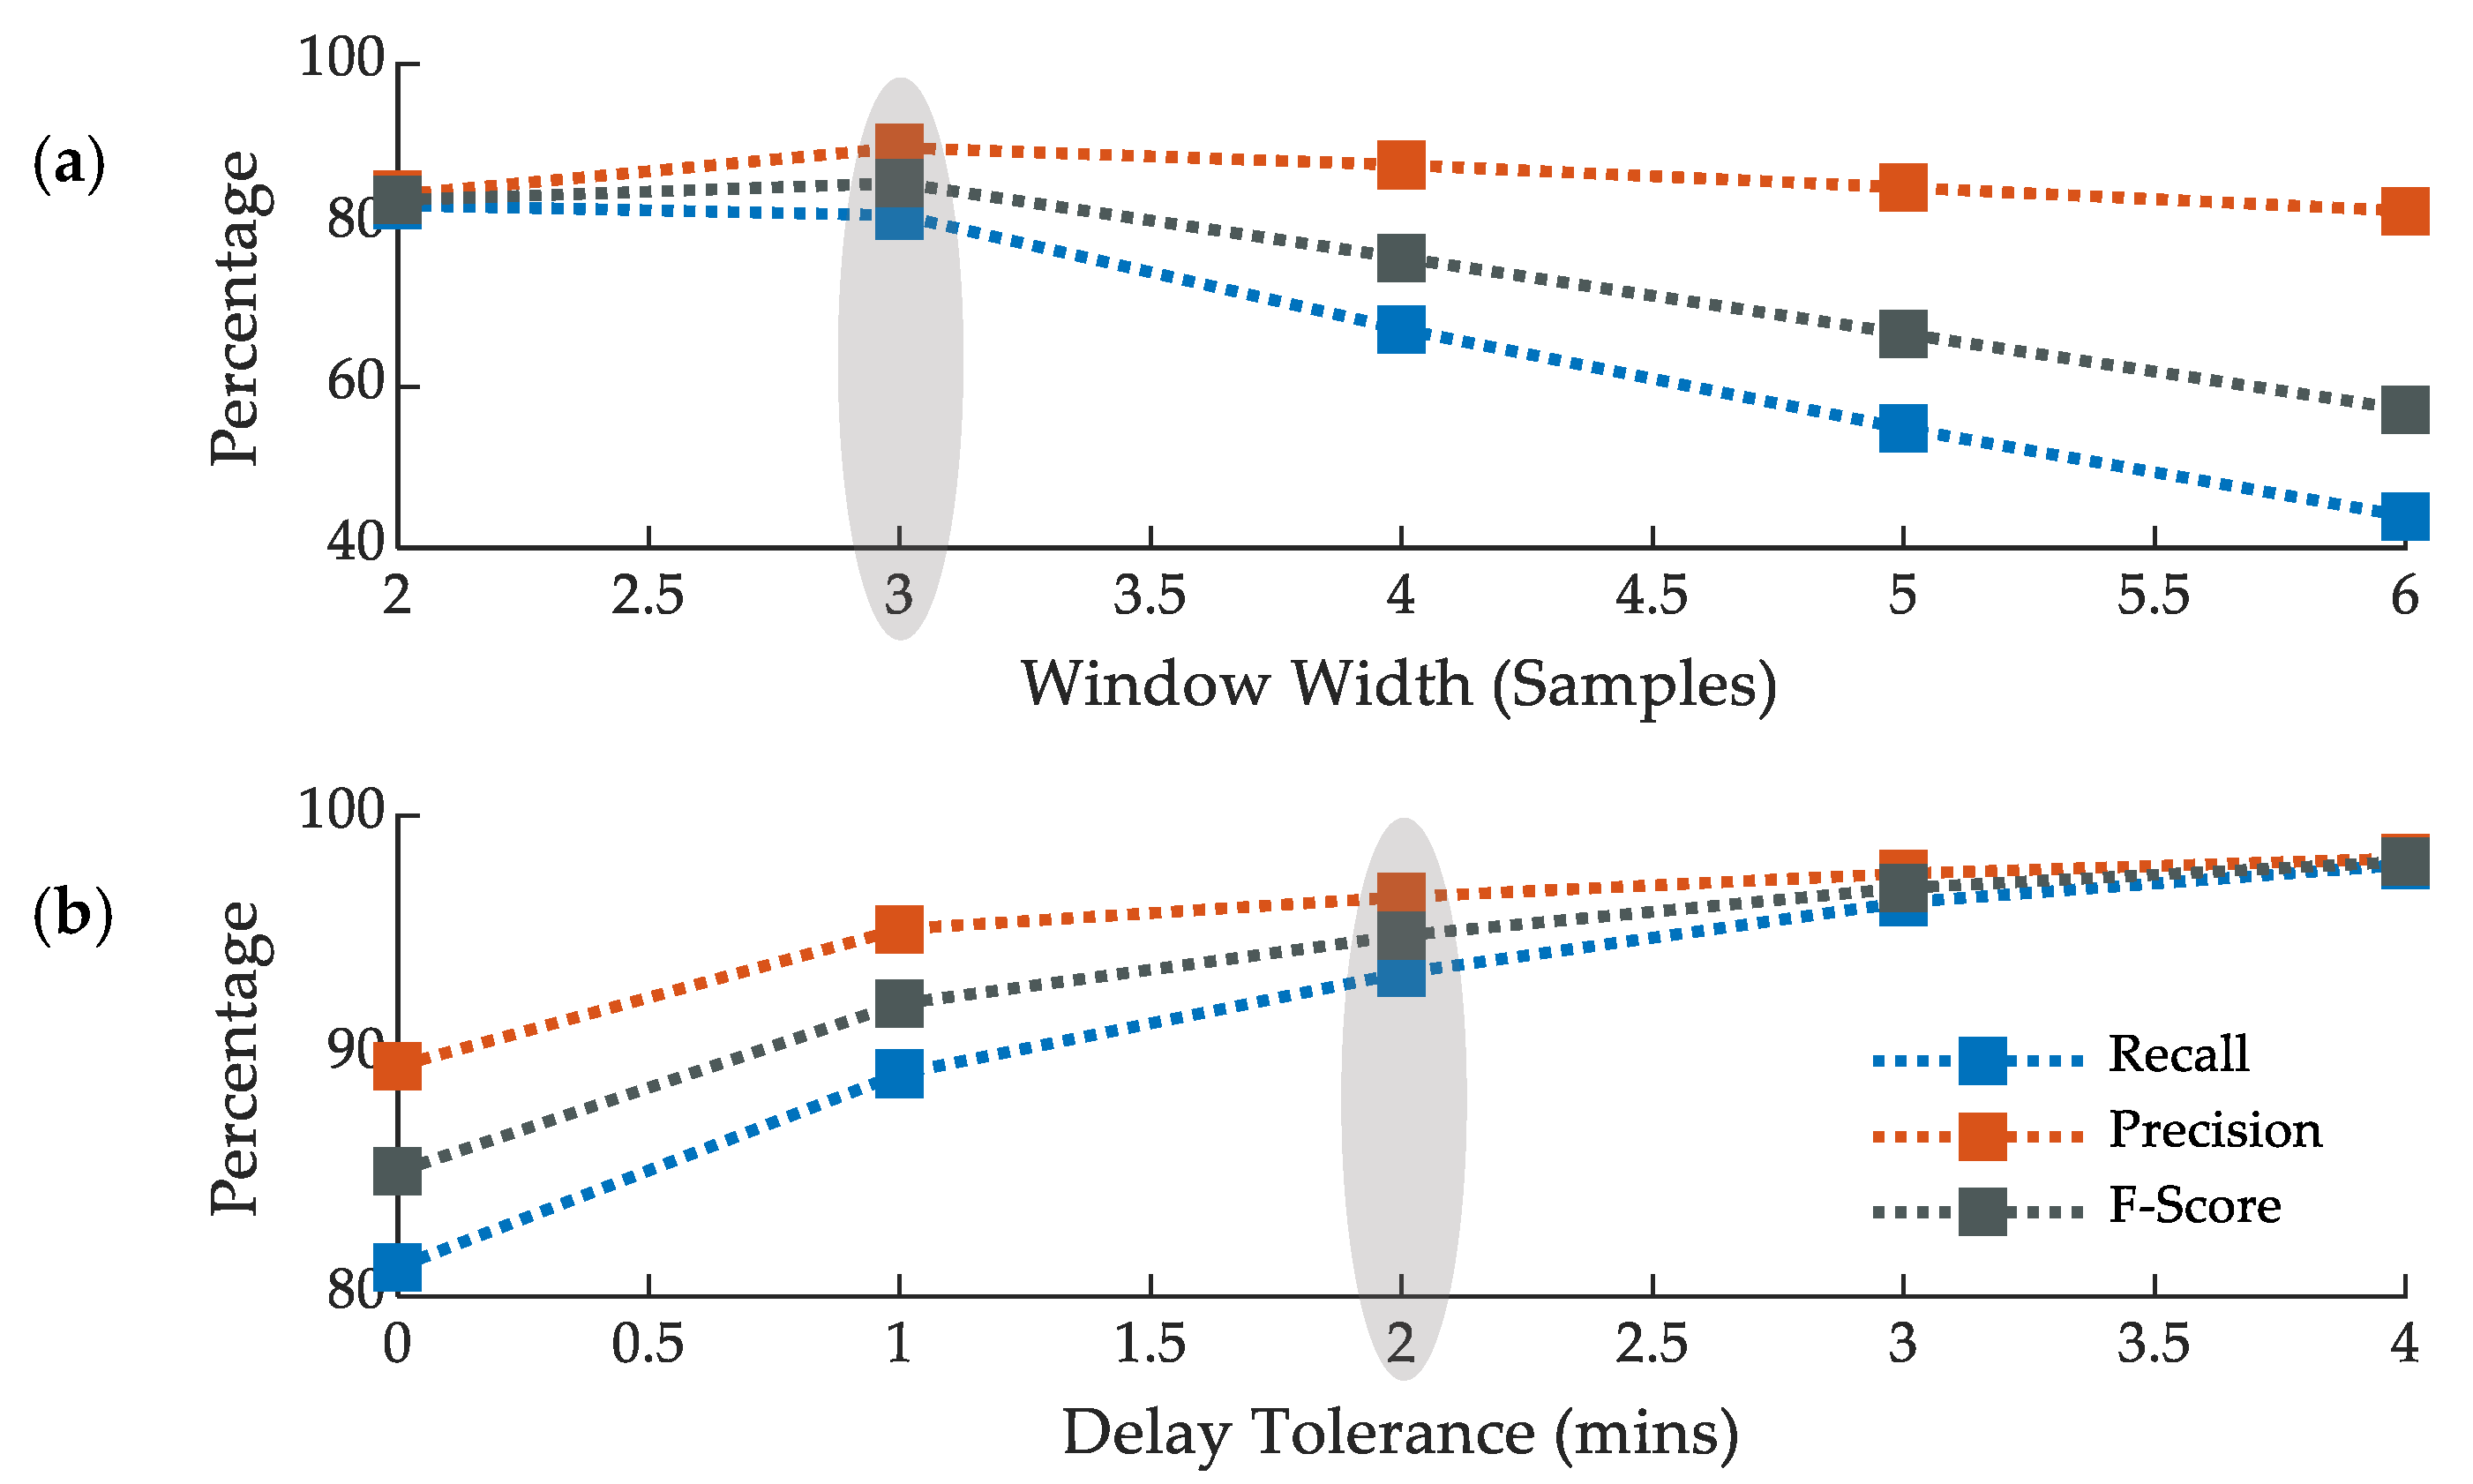
  • Event Detection: As an extension of our previously proposed event detection algorithm [41], a post-processing criterion is incorporated to further improve the event detection performance. The extracted results are validated using an extensive sensitivity analysis.
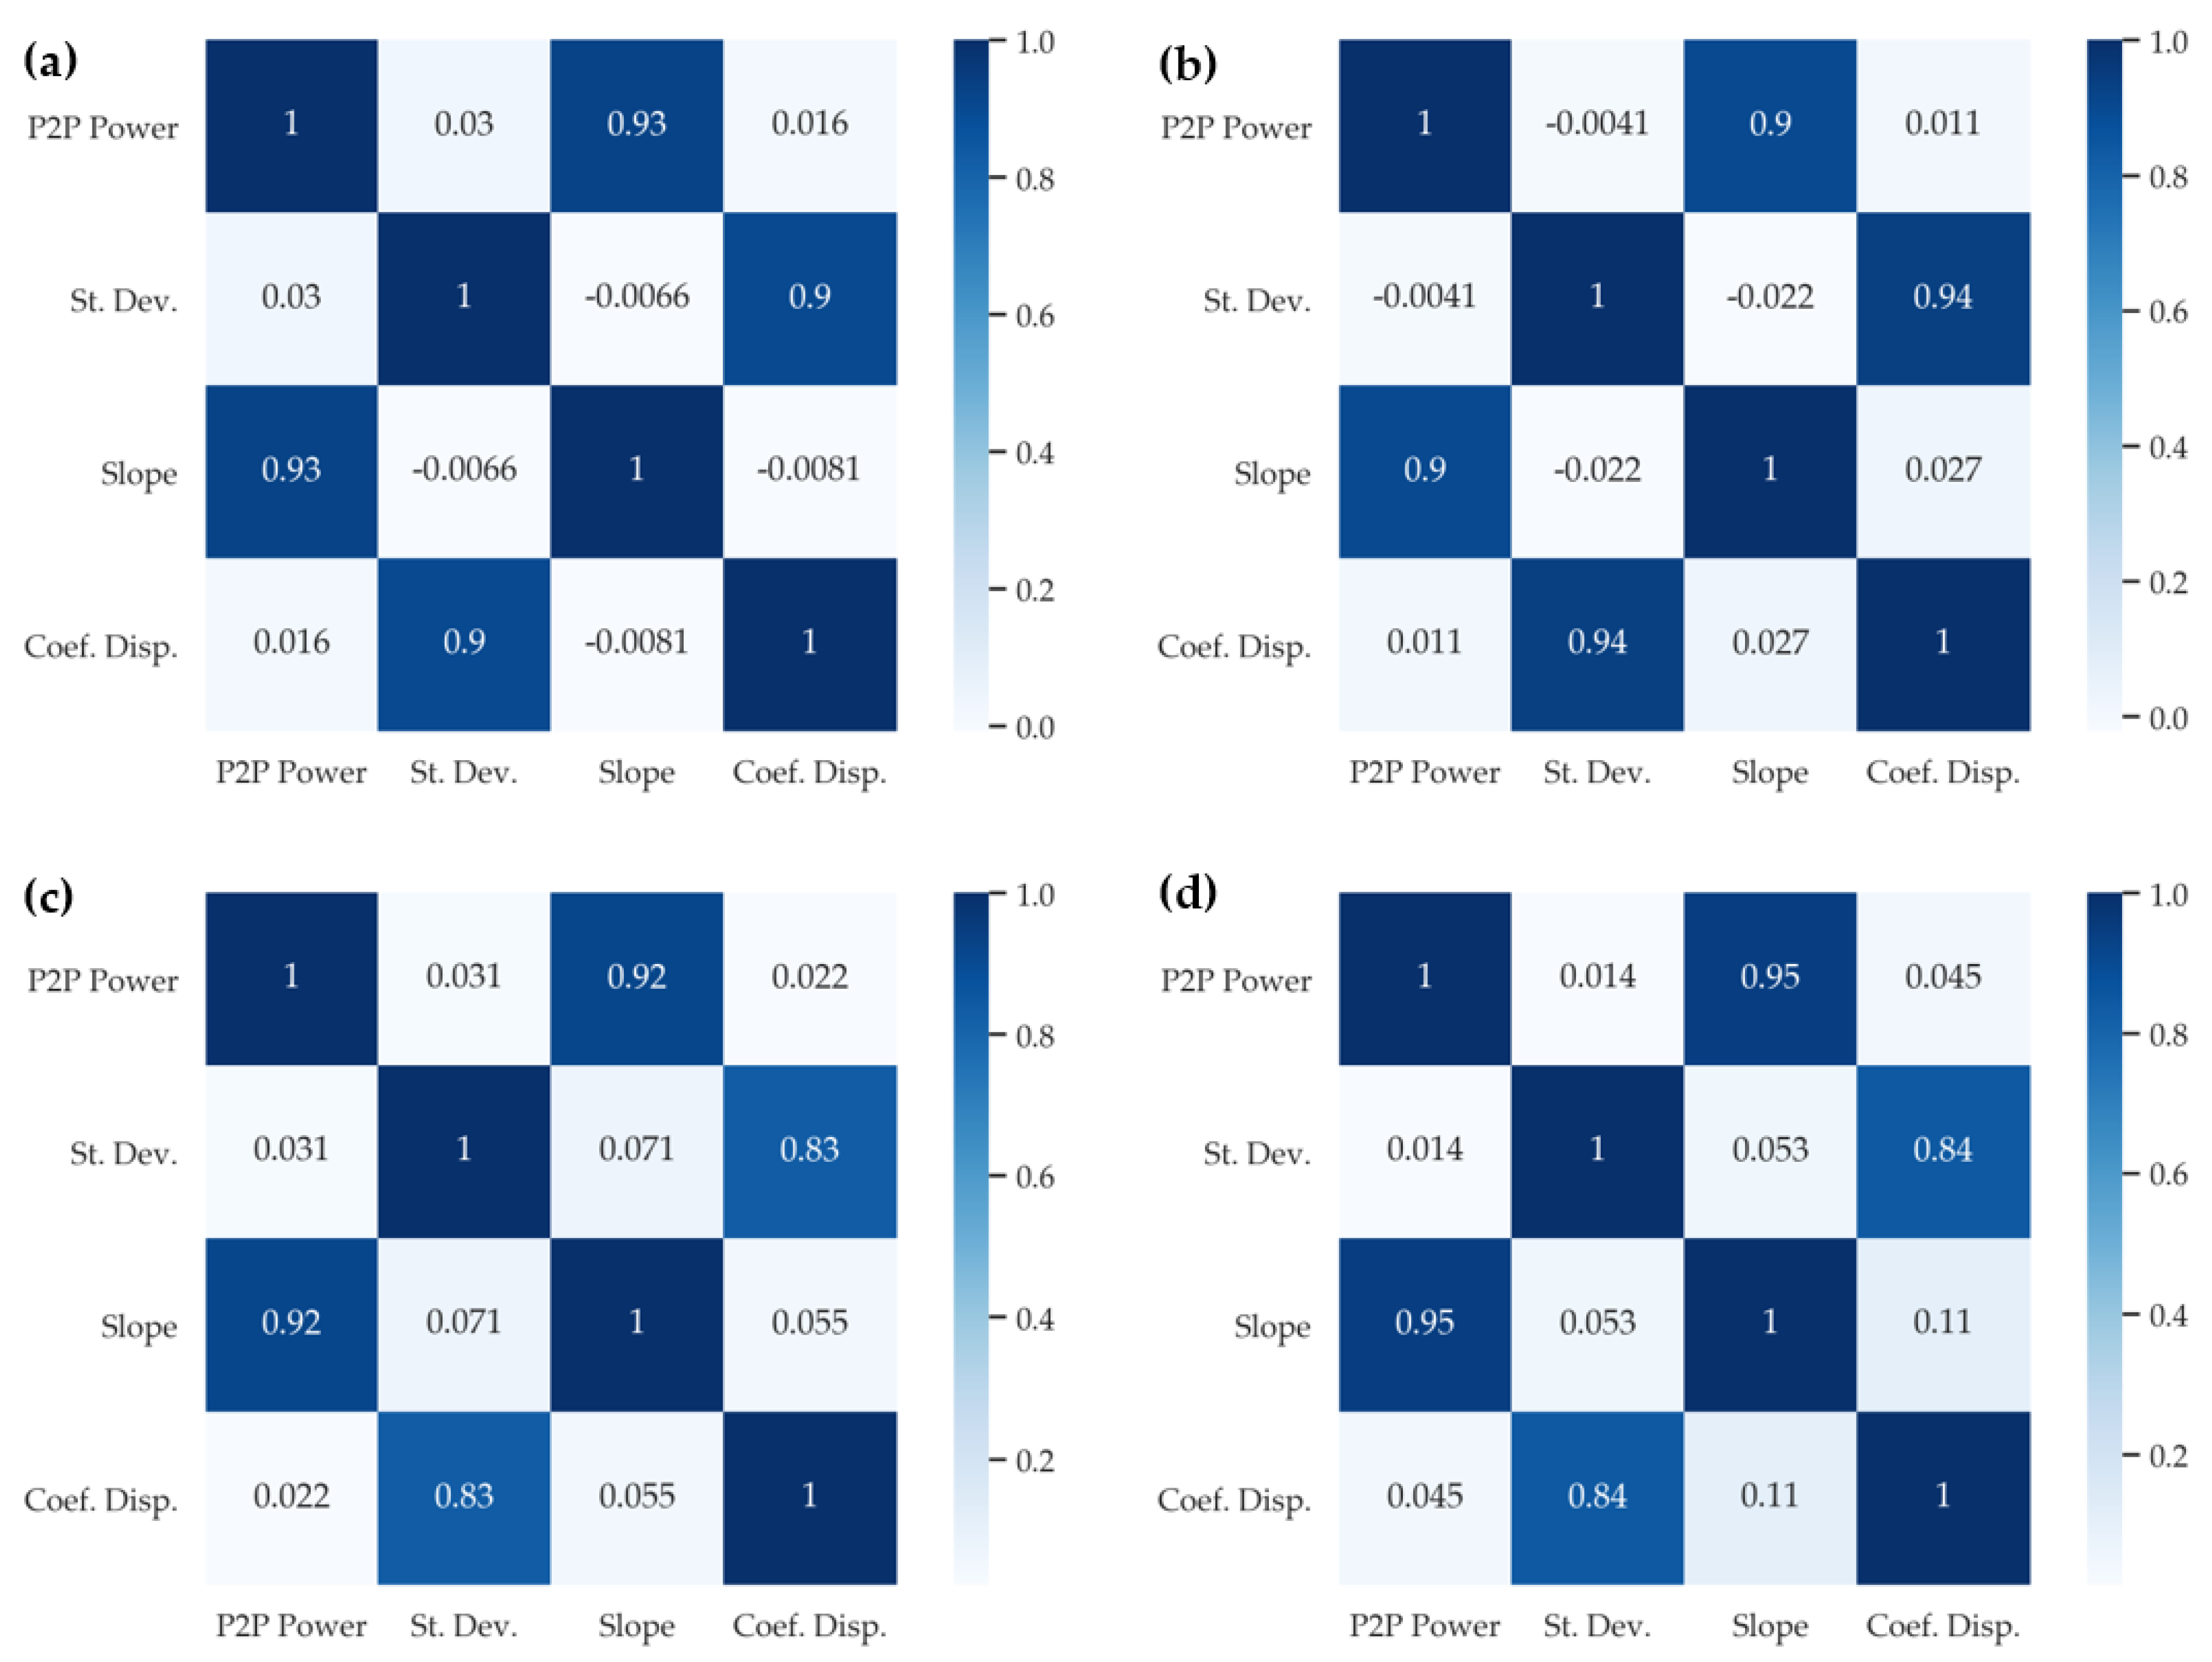
  • Load Features: Four distinct load features are extracted for each detected event and further analyzed using correlation-based feature selection methodology to identify the most significant load features.
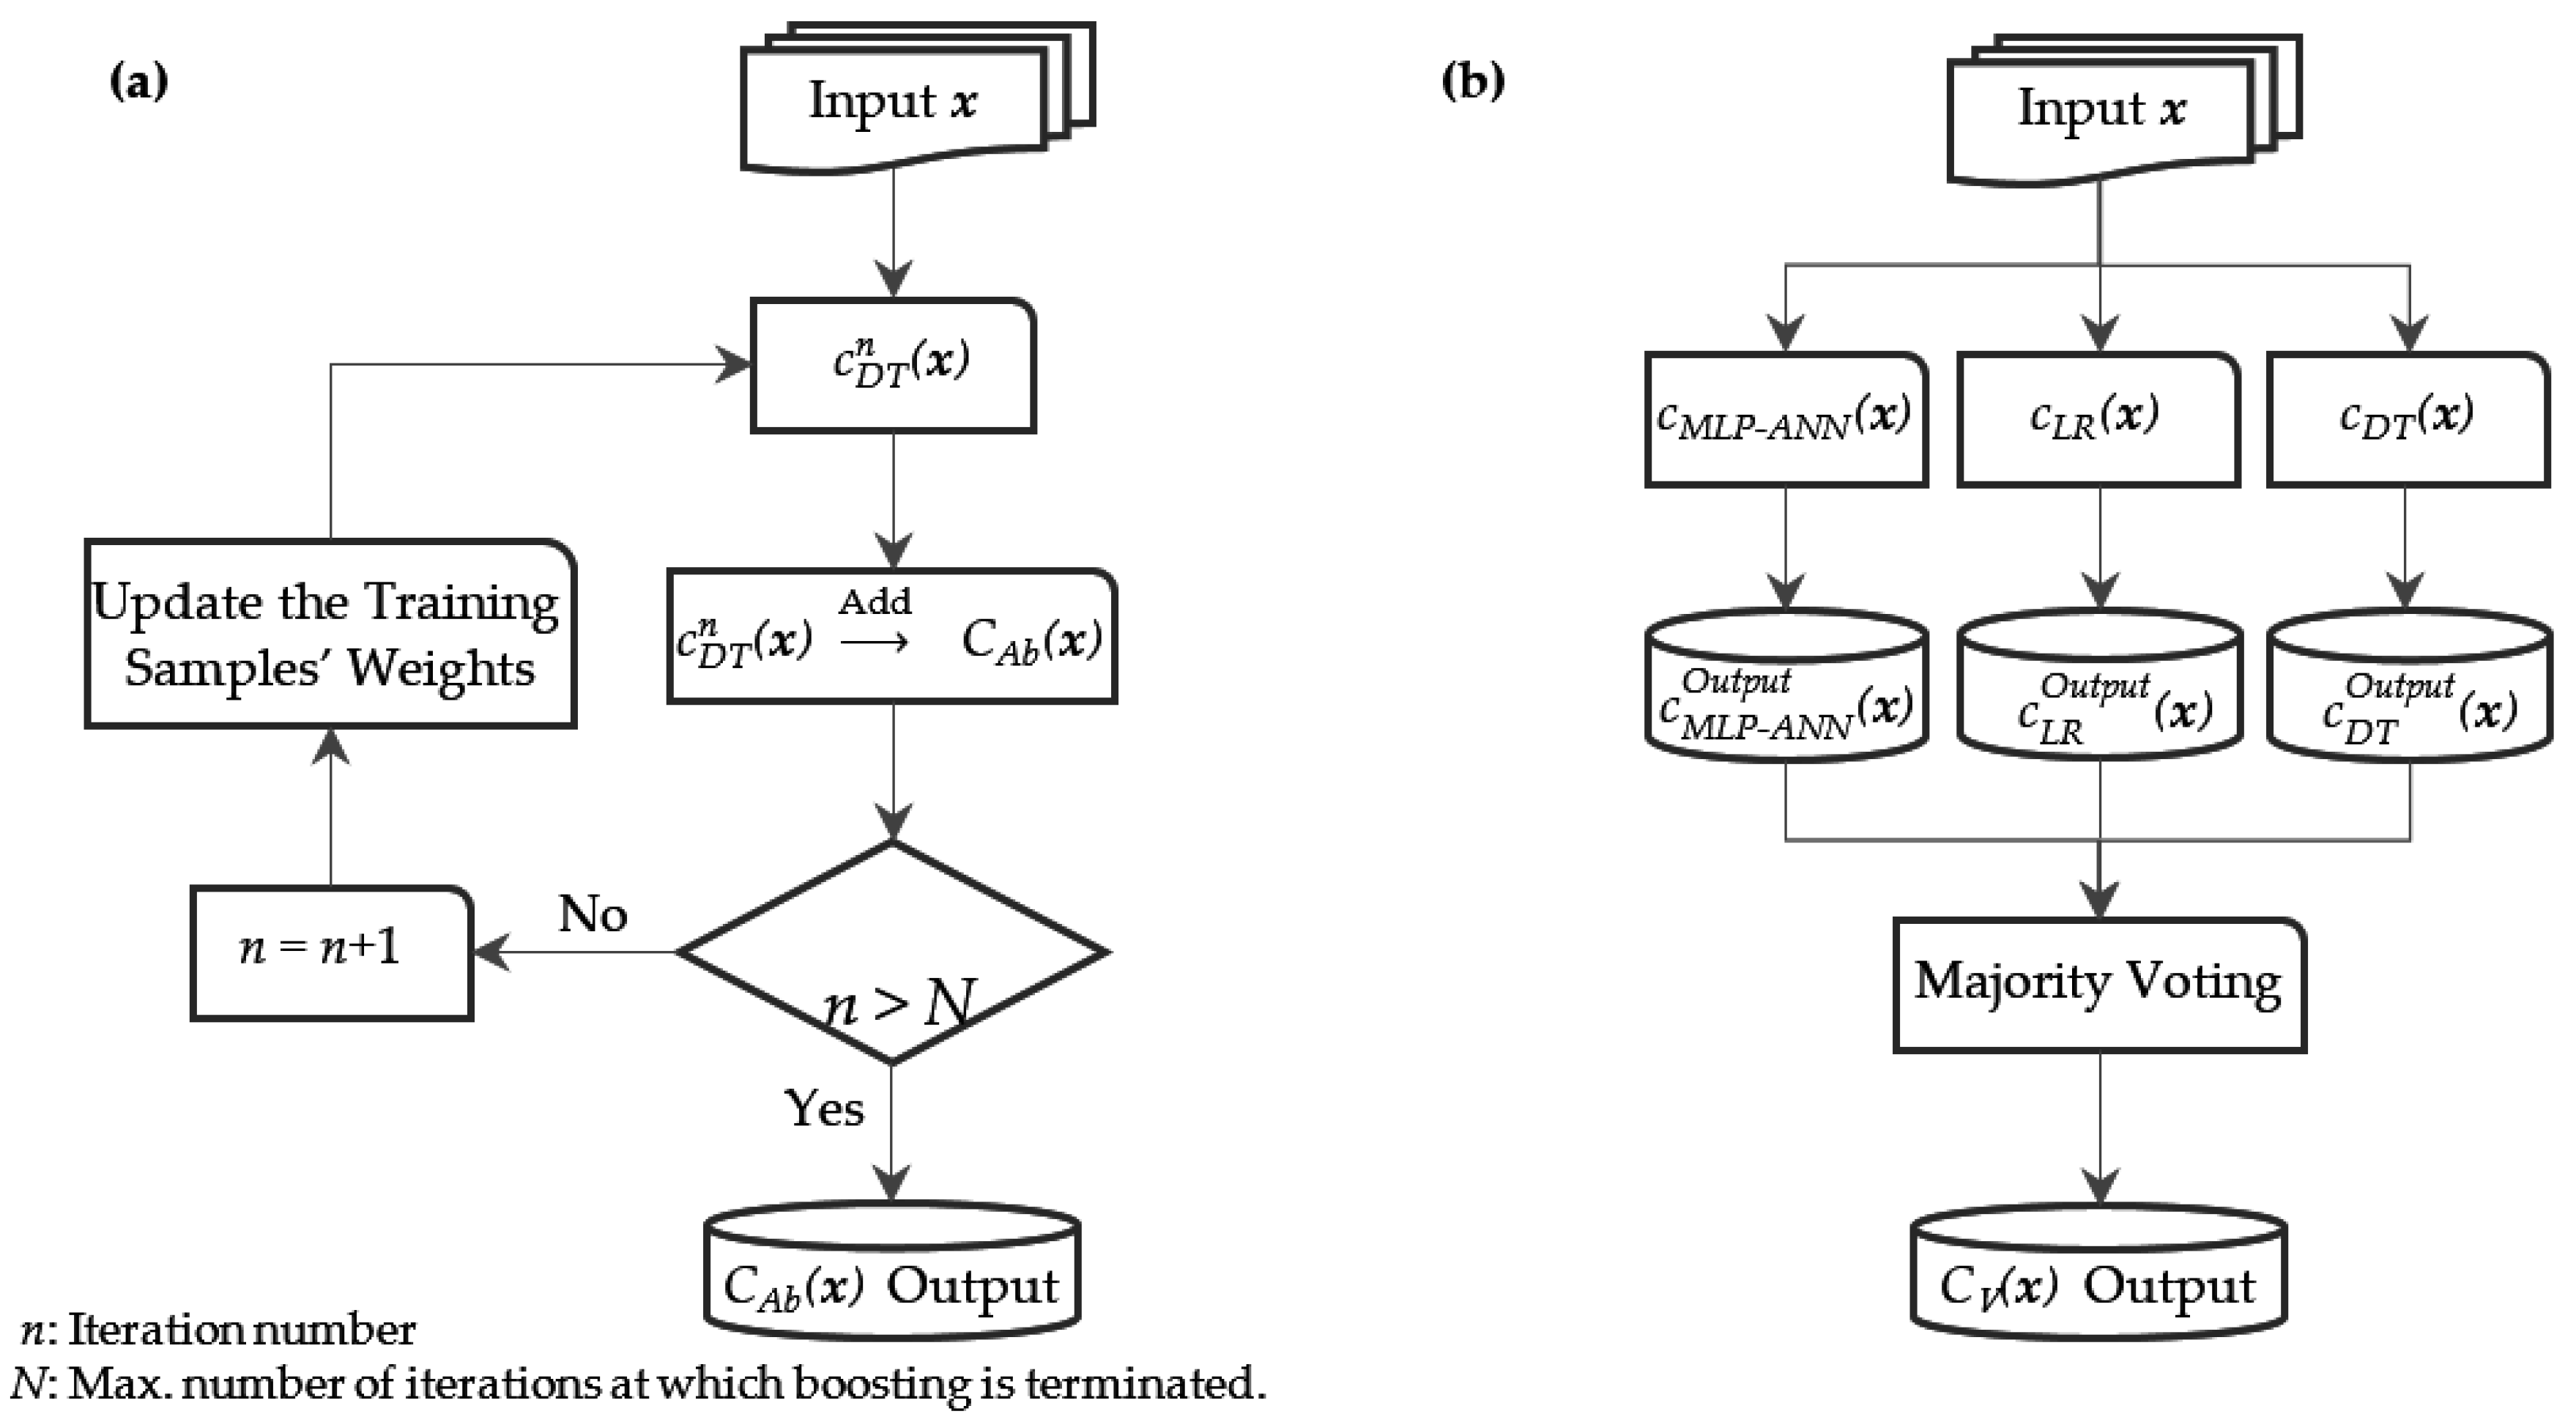
  • Classification: To facilitate the classification performance, this research work introduces two diverse ensemble learning techniques, based on a combination of machine learning and artificial neural network models, in the context of the NILM domain and comprehensive performance evaluation and comparative analysis are presented.
  • A brief outlook in the context of real-world applications of the proposed approach is presented.
Overall, the proposed non-invasive inference approach for the residential water-heating circuit is based on low sampling real-world load measurements and assisted by improved event detection, feature selection, and ensemble learning techniques, aiming to facilitate the real-world deployment of NILM systems.
The rest of the paper is organized as follows: Section 2 presents the details of the system formulations in terms of the problem statement, methodologies, and performance evaluation criteria. Section 3 discusses the simulation studies carried out in this research work and the corresponding analysis of the extracted results. Section 4 presents a brief outlook of the proposed approach. Finally, Section 5 concludes this research paper.

2. System Formulation

This section describes the overall proposed system architecture presented in this paper, i.e., problem statement and research methodologies regarding data acquisition, event detection, feature extraction, and classification toward NILM-based load inference.

2.1. Problem Statement
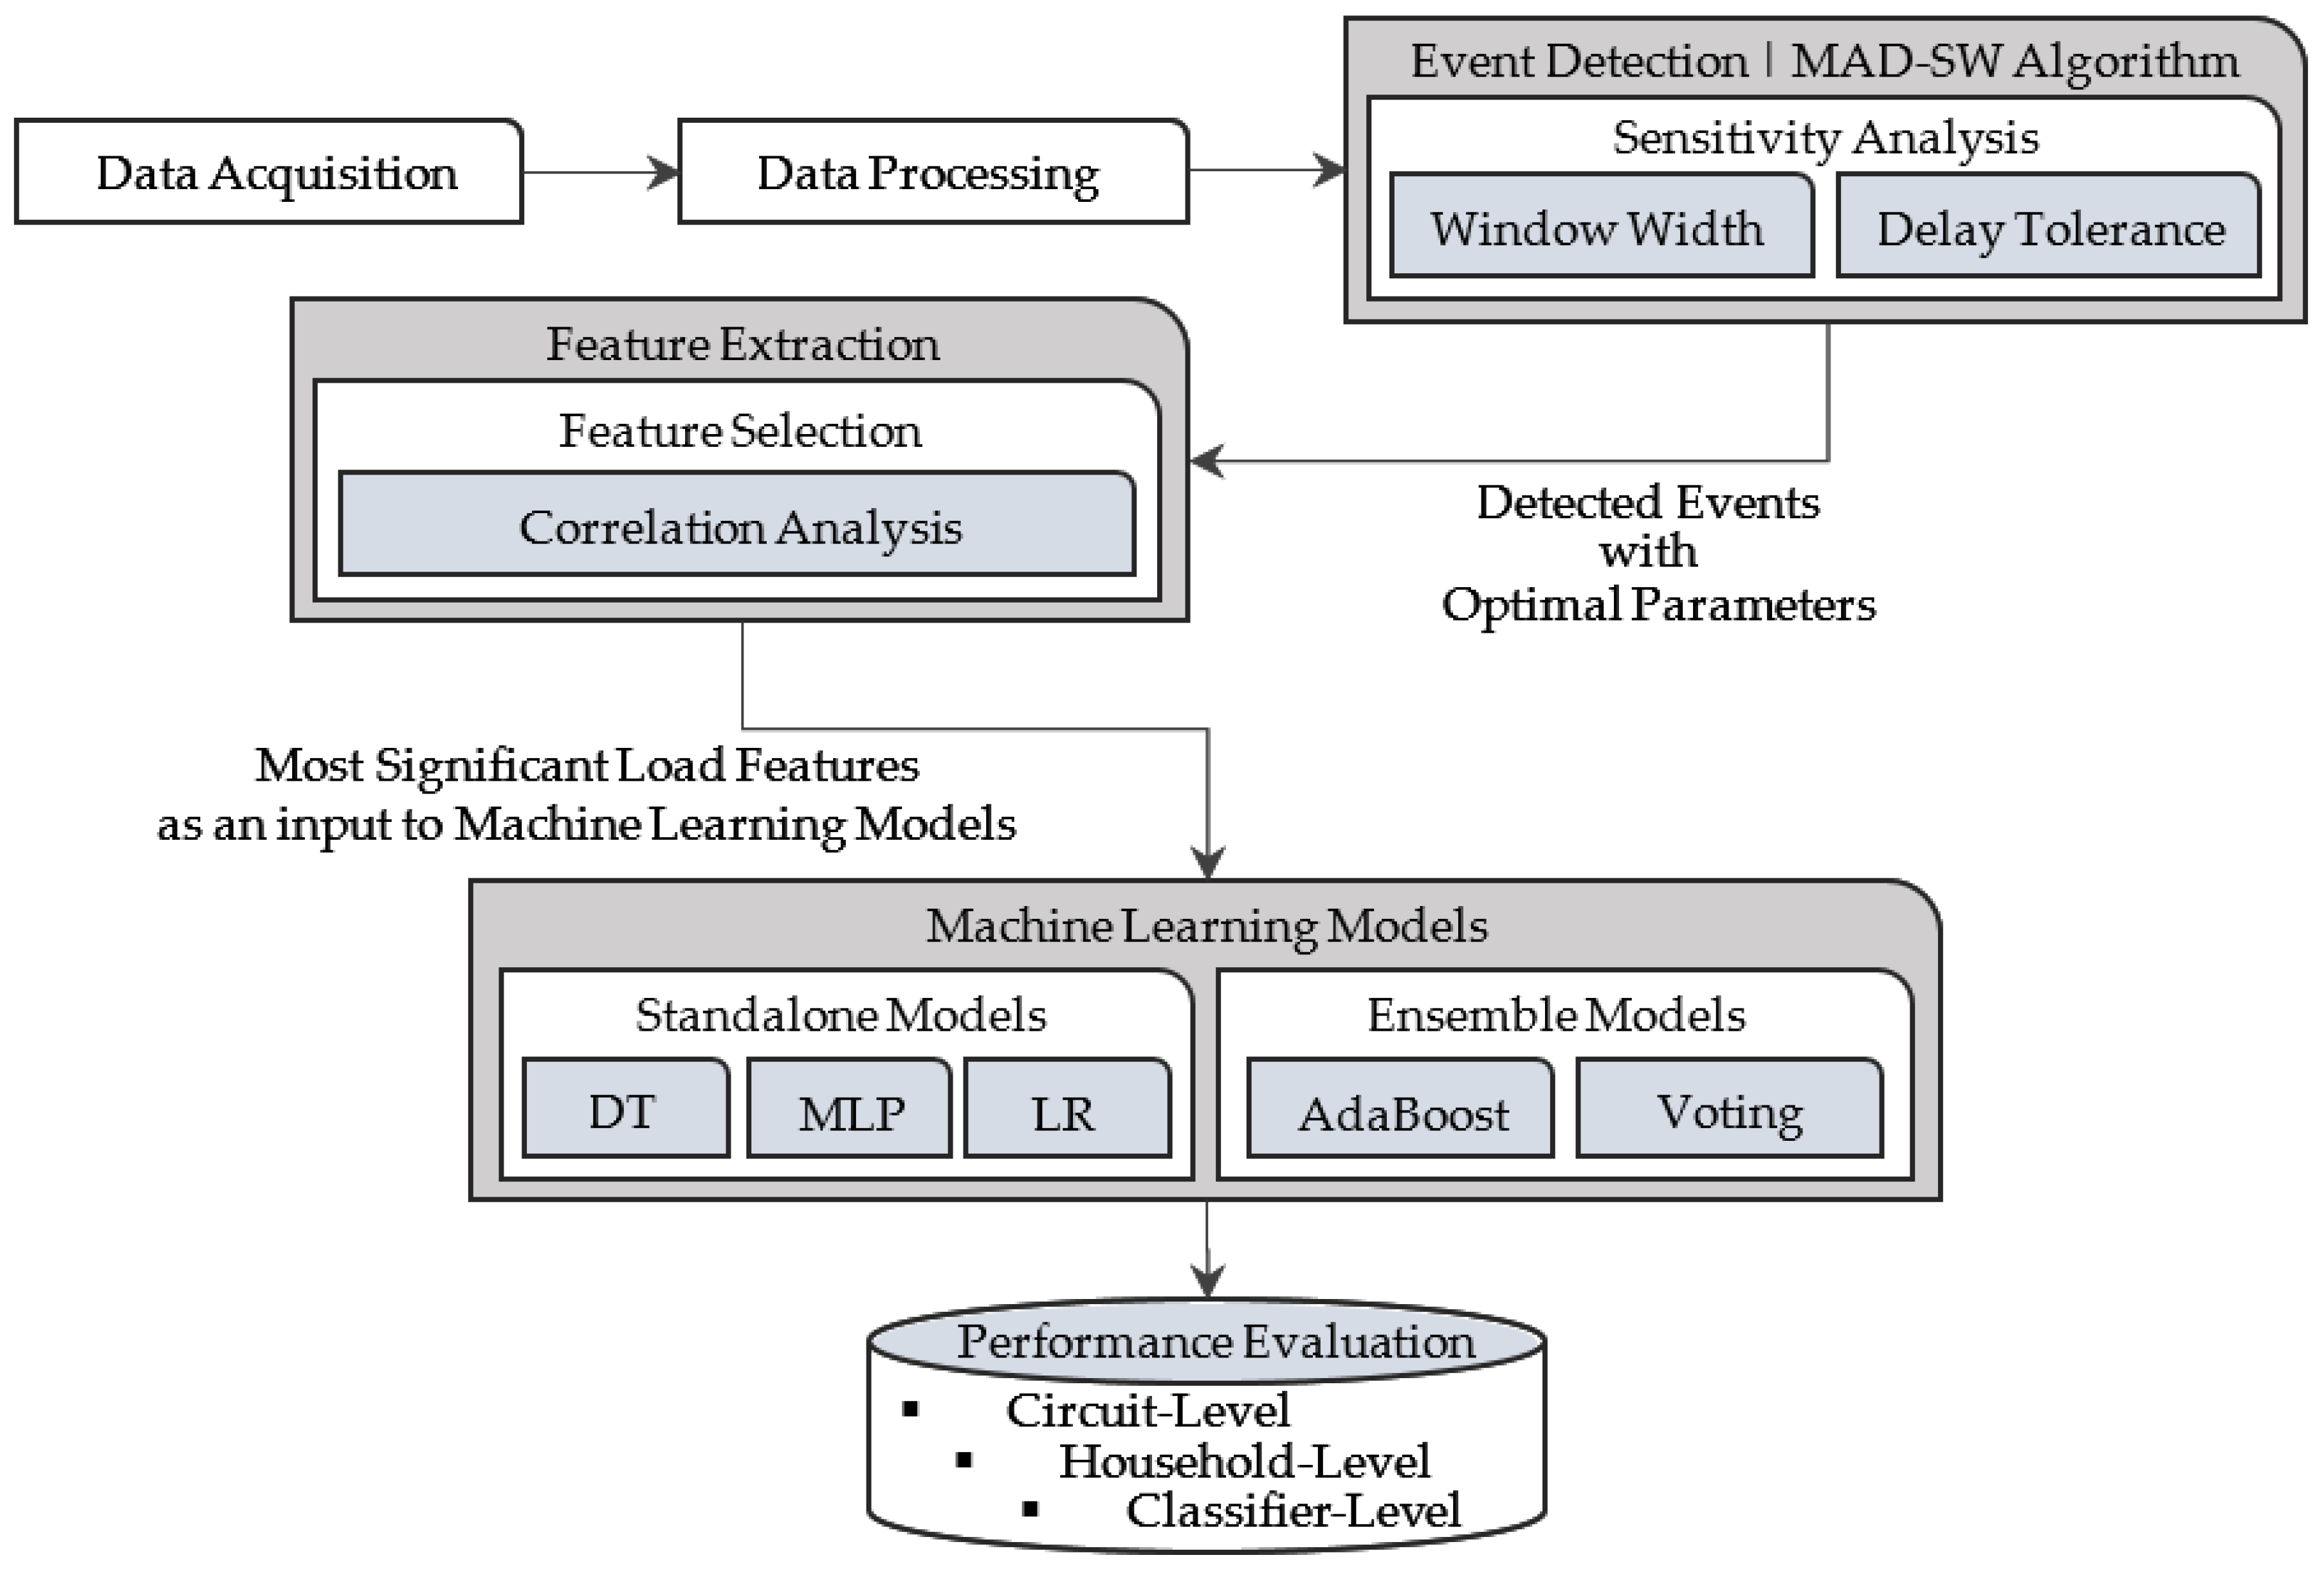
At a single metering point, the monitored time-series aggregated power load profile can be weighed as an algebraic summation of m numbers of individual circuits’ power load profile, as presented mathematically in (1).
Ƿ д ( t ) = i = 1 m Ƿ i ( t ) + n ( t )
where Ƿ д ( t ) is the aggregated power load at the metering point at time instant t, Ƿ i ( t ) represents power load of ith circuit at time instant t, m represents the total numbers of individual circuits, and n(t) is the measurement noise. In the context of this research work, Ƿ д ( t ) can be redefined as shown in (2).
Ƿ д ( t ) = Ƿ Ϣ Ϧ ( t ) + Ƿ ( t ) + n ( t )
where Ƿ Ϣ Ϧ ( t ) refers to the power load profile of the water-heating circuit and Ƿ ( t ) encompasses all other miscellaneous circuits’ power load profiles that are not under consideration within the scope of this research work. Within the scope of this paper, the main task is to infer the operating status of the water-heating circuit with the only information of the main circuit, i.e., aggregated power load. Water heating is not only one of the major load elements in the residential sector [42,43,44] but is also a flexible/interruptible load element [45]. The said properties of the water-heating circuit make it a high potential load toward numerous real-world energy efficiency applications, e.g., demand response [44,46], power regulations [43], and peak shifting, and frequency response [47]. Consequently, non-invasive inference of water-heating circuit is of utmost importance in the context of real-world energy efficiency applications.

2.2. Methodology

An event-based low sampling NILM system, depicted in Figure 1, is employed in this research work. It is worth noting that within the scope of this research the presented methodology is employed for non-invasive inference of water-heating circuits, however, this can be further extended for the non-invasive inference of other load elements; depending on the availability of load disaggregation databases. Details of employed techniques at each stage/block presented in Figure 1 are explained below.

2.2.1. Data Acquisition and Preprocessing

For this research work, New Zealand (NZ) based electricity database, namely GREEN Grid (https://reshare.ukdataservice.ac.uk/853334/) [21] is used. The recently released database is first of its kind for New Zealand, where the data have been collected from 2014 to 2018 from a sample of 45 households, as part of the Renewable Energy and the Smart Grid (NZ GREEN Grid) project, a joint venture of the University of Canterbury and the University of Otago, New Zealand. The NZ GREEN Grid dataset contains a 1-min interval measurement of mean power (in watts) data for individual circuits and main (total incoming power) circuit.
As the acquired load data are based on real-world measurements, numerous measurement uncertainties, e.g., noise, data spikes, and missing values are inevitable. Therefore, the acquired data have been thoroughly pre-processed to take care of the said measurement uncertainties. Initially, for simulation purposes, data are acquired from the timeframes that have consistent measurement entries without any missing or error values. Further, the acquired raw data are re-arranged in a more categorical (tabular) form for better visualization and validation for later stages. In terms of eliminating the noise/data spikes that interfere with event detection, the acquired aggregated load data are processed using the median filtering technique: a digital filtering technique that preserves the edges while eliminating the undesirable noise/data spikes. A detailed explanation of median filtering and its working phenomenon is presented in [48].

2.2.2. Event Detection

An event is defined as a transient portion within a signal when it deviates from the previous steady-state and lasts until the next one [49]. The aggregated load power profile varies with each transition in individual loads’ power profile. Event detection algorithms detect these changes in the aggregated profile initiated by individual loads. So far, numerous event detection algorithms have been proposed that can be broadly classified into three categories, namely expert heuristics, matched filters, and probabilistic models [50].
This research work relies on an extended version of our recently proposed event detection algorithm known as the mean absolute deviation-sliding window (MAD-SW) algorithm [41]. The MAD-SW algorithm is extended by incorporating a post-processing step to further improve the event detection performance. Table 1 presents a detailed description of the extended MAD-SW algorithm.
The output of the MAD-SW algorithm in the form of starting and ending time indices (successive ones) are linked together to acquire all the detected events (transient portions), within the aggregated load power profile, for further processing according to the methodology presented in Figure 1.

2.2.3. Feature Extraction and Selection

The output of the event detection is merely an indication of transitions that occurred at different time instances within the aggregated load and does not provide any information regarding explicit circuits’ identification and corresponding status, i.e., turn-on or turn-off. To identify this, different load features (also known as signatures) are extracted for each detected event, to be used as an input to classification models. Features refer to the unique consumption pattern of a circuit and enable the appropriate monitoring and classification of an explicit status of the given circuit from the aggregated load profile.
In this research work, a feature set ( F ) comprising of four distinct load features based on statistical, power, and geometrical features have been extracted. The proposed F is expressed in (3).
F = { S Ɛ ,   σ ,   P peak 2 peak ,   C Disp . }
S Ɛ , C Disp . , σ , and P peak 2 peak represent the slope, coefficient of dispersion, standard deviation, and peak-to-peak power magnitude of the detected events, mathematically given as in (4)–(7), respectively.
S Ɛ = Power Event _ End Power Event _ Start Time _ Instance Event _ End Time _ Instance Event _ Start
C Disp . = σ 2 μ
σ = 1 N   i = 1 N ( x i μ ) 2
P peak 2 peak = Power Event _ End Power Event _ Start
where μ and σ 2 represent the mean and variance of the transient portion, i.e., event, given as in (8) and (9), respectively.
μ = 1 N i = 1 N x i
σ 2 = 1 N   i = 1 N ( x i μ ) 2
Within the scope of this research work, the extracted load features are further evaluated using feature selection methodology, i.e., correlation analysis, to identify the most significant load features for further processing. Correlation analysis is employed to identify the highly correlated features within the extracted feature set, F , as features with high correlation are linearly dependent, consequently, having the same effect on target class in the context of classification. The employed methodology will not only identify the most significant load features as an input to learning models for better classification performance but also reduce the feature space dimensionality that plays a key role in reducing algorithm complexity and training time.

2.2.4. Classification

The selection of classification models for a specific domain is a critical phase. A variety of factors are involved when evaluating a classifier that includes but is not limited to features selection, training set size, the dimensionality of the problem, and parameter tuning [51]. This research work aims to introduce ensemble learning models for NILM classification. The ensemble learning [52] refers to a range of methodologies that combine independent (base) learning models to generate one optimal learning model/classifier for the given problem. It is mostly employed to improve the classification performance and is considered a trustworthy methodology in the said context [53]. Ensemble learning methodologies can be broadly classified into two categories, namely sequential and parallel ensemble learners. In the former, the base-learners are sequentially generated, however, the latter refers to a technique where the base-learners are generated in parallel. Both methodologies are employed in this research work, where AdaBoost- and Voting-based classifiers are used in the context of sequential and parallel ensemble techniques, respectively. The AdaBoost algorithm uses a weak base-learner to build a strong learning model by adaptively adjusting the weights at each iteration [54]. The Voting classifier merges several base-learners and the final prediction is based on a voting system, namely hard voting or soft voting [55]. Hard voting refers to the majority voting, where soft voting is based on average predicted probabilities.
Furthermore, for the employed sequential and parallel ensemble learners, the homogeneous (employs single base-learner) and heterogeneous (employs diverse base-learners) structure, respectively, are adopted. For said purposes, three independent and diverse supervised learning models including two machine learning models, i.e., logistic regression (LR) [56], decision trees (DT) [57], and one neural network model, i.e., multi-layer perceptron-artificial neural network (MLP-ANN) [58], are used to build the diverse ensemble learning models. Figure 2 graphically depicts the detailed methodologies of the proposed ensemble learning models, employed in this research work.

2.3. Performance Evaluation

For evaluation purposes, well-known performance metrics namely, f-score, recall, and precision are used. F-score is a measure of a test’s accuracy and is defined as harmonic-mean of the recall and precision, mathematically defined as in (10) [59].
F - Score = ( Precision 1 + Recall 1 2 ) 1 = 2 × Precision × Recall Precision + Recall
Recall is defined as the number of relevant items selected, where precision refers to the number that selected items are relevant. Recall and precision are mathematically given as in (11) and (12), respectively [59].
Recall = TP TP + FN
Precision = TP TP + FP
Accuracy is another performance metric used for the evaluation of classification models and is defined as the fraction of predictions the model classifies correctly [60], given as in (13).
Accuracy = TP + TN TP + TN + FP + FN
The terminologies of TP, FP, FN, and TN represent true positive, false positive, false negative, and true negative respectively, and are well defined in [35].

3. Simulations and Results

Based on the presented research methodologies, comprehensive digital simulation studies have been carried out using Core i7 (8th Generation) desktop PC having 32 GB RAM. Moreover, in terms of simulation tools, MATLAB® R2018b and Python 3.6.7 (scikit-learn (https://github.com/scikit-learn/scikit-learn) version 0.21.3 [55]) are used. The following subsections present the details of simulation studies in terms of simulation parameters, extracted results, and corresponding analysis for each building block of the research methodology presented in Figure 1.

3.1. Event Detection Results

For event detection simulation, 30 days of load measurements are acquired from a real-world household of the NZ GREEN Grid database. To accommodate the diversity of consumption patterns of different load elements, the acquired load data are taken from different months of a year. For event detection simulation purposes, the details of the acquired load data and event detector parameters are presented in Table 2.
Based on the attributes presented in Table 2, comprehensive simulations are carried out to assess different input parameters on the performance of the event detection algorithm. Table 3 presents a detailed performance evaluation of the event detection algorithm at different values of window width, where the delay tolerance is fixed at 0, i.e., exact match.
From Table 3, it is observed that MAD-SW performs optimally at a window width of 3 yieldings to the results of around 81, 89, and 85 percent in terms of recall, precision, and f-score, respectively. It is also observed that a continuous drop in all concerned performance metrics has been occurred with an increase in window width. The observed decline in recall performance metric is due to the drastic upsurge in false negative detection with an increase in window width. The same phenomenon was observed in [41] for the load data of the Pecan Street Inc. Dataport [22] database.
Further, Table 4 presents MAD-SW performance evaluation and sensitivity analysis in terms of delay tolerance “Δt” where the window width is kept constant at ω = 3 because of the optimal performance of MAD-SW as shown in Table 3.
It is evident from Table 4 that the incorporation of Δt significantly improves the performance of the MAD-SW algorithm. As a consistent increase in true positive detection with an increase in delay tolerance value is recorded, consequently, leading to a persistent increase in algorithms overall performance. This determined that Δt defines the event detector accuracy and is directly proportional to the performance [61], however, an optimal value must be selected to minimize the tradeoff between event detection performance and estimation of energy consumption at later stages. Hence, based on the presented results in Table 4, Δt = 2 is selected as an optimal value. For Δt > 2, the event detection f-score improvement is marginal, however, at a later stage larger Δt will lead to higher error in the estimated and actual energy consumption. Figure 3 depicts the overall performance trend of the event detection algorithm in terms of ω and Δt.
Based on the extracted results and the presented analysis, ω = 3 and Δt = 2 are selected as the optimal parameters for further event detection simulations. Table 5 presents different attributes of diverse real-world households employed in this research work for non-invasive load inference of water heating, along with the corresponding event detection results based on the optimal parameters for event detection algorithm.
It is worth noting that all the selected (testing) households, presented in Table 5, possess mostly different individual load circuits along with diverse consumption patterns. Even the similar load circuits in different testing households have different installation configurations, e.g., household ID rf_42 has a single circuit configured for laundry and freezer having a circuit label of “Laundry & Freezer$4128” [62]. In contrast, household ID rf_36 has two dedicated circuits for the said having the circuit labels of “Washing Machine$4146” and “Kitchen Appliances$4145” [62]. Likewise, household ID rf_42 has a load circuit labeled as “Lighting (inc heat lamps)$4129” where household ID rf_36 has a load circuit labeled as “Lighting$4149,” which potentially implies that the latter has no heat lamps. A detailed layout of the individual circuits within the employed testing residential households are depicted in Figure 4, where further details can be found in [62]. All these constraints lead to a widely varied consumption pattern which is not only hard to predict precisely but also yield variable inference performance.

3.2. Feature Extraction and Selection Results

As per the methodology presented in Section 2.2.3, four distinct load features, as given in (3), are extracted for each detected event of all households given in Table 5. The extracted load features are further evaluated using correlation analysis to identify the most significant ones for accurate load classification. Figure 5 presents the feature selection, i.e., correlation analysis, results for different testing households’ data.
It is evident from the results presented in Figure 5 that for all testing households the load features, i.e., S Ɛ (Slope) and P peak 2 peak (P2P Power) are highly correlated to each other, i.e., ≥0.9. Similarly, C Disp . (Coef. Disp.) and σ (St. Dev.) are highly correlated to each other with a correlation ≥0.83. Hence, from the larger perspective of models’ performance, complexity, and computational need, the highly correlated features are excluded and a new feature set, F Input , is formulated that will act as an input to the models for classification purposes within the scope of this research work. The newly formulated load feature set, F Input , is expressed as in (14).
F Input = { S Ɛ ,   C Disp . }

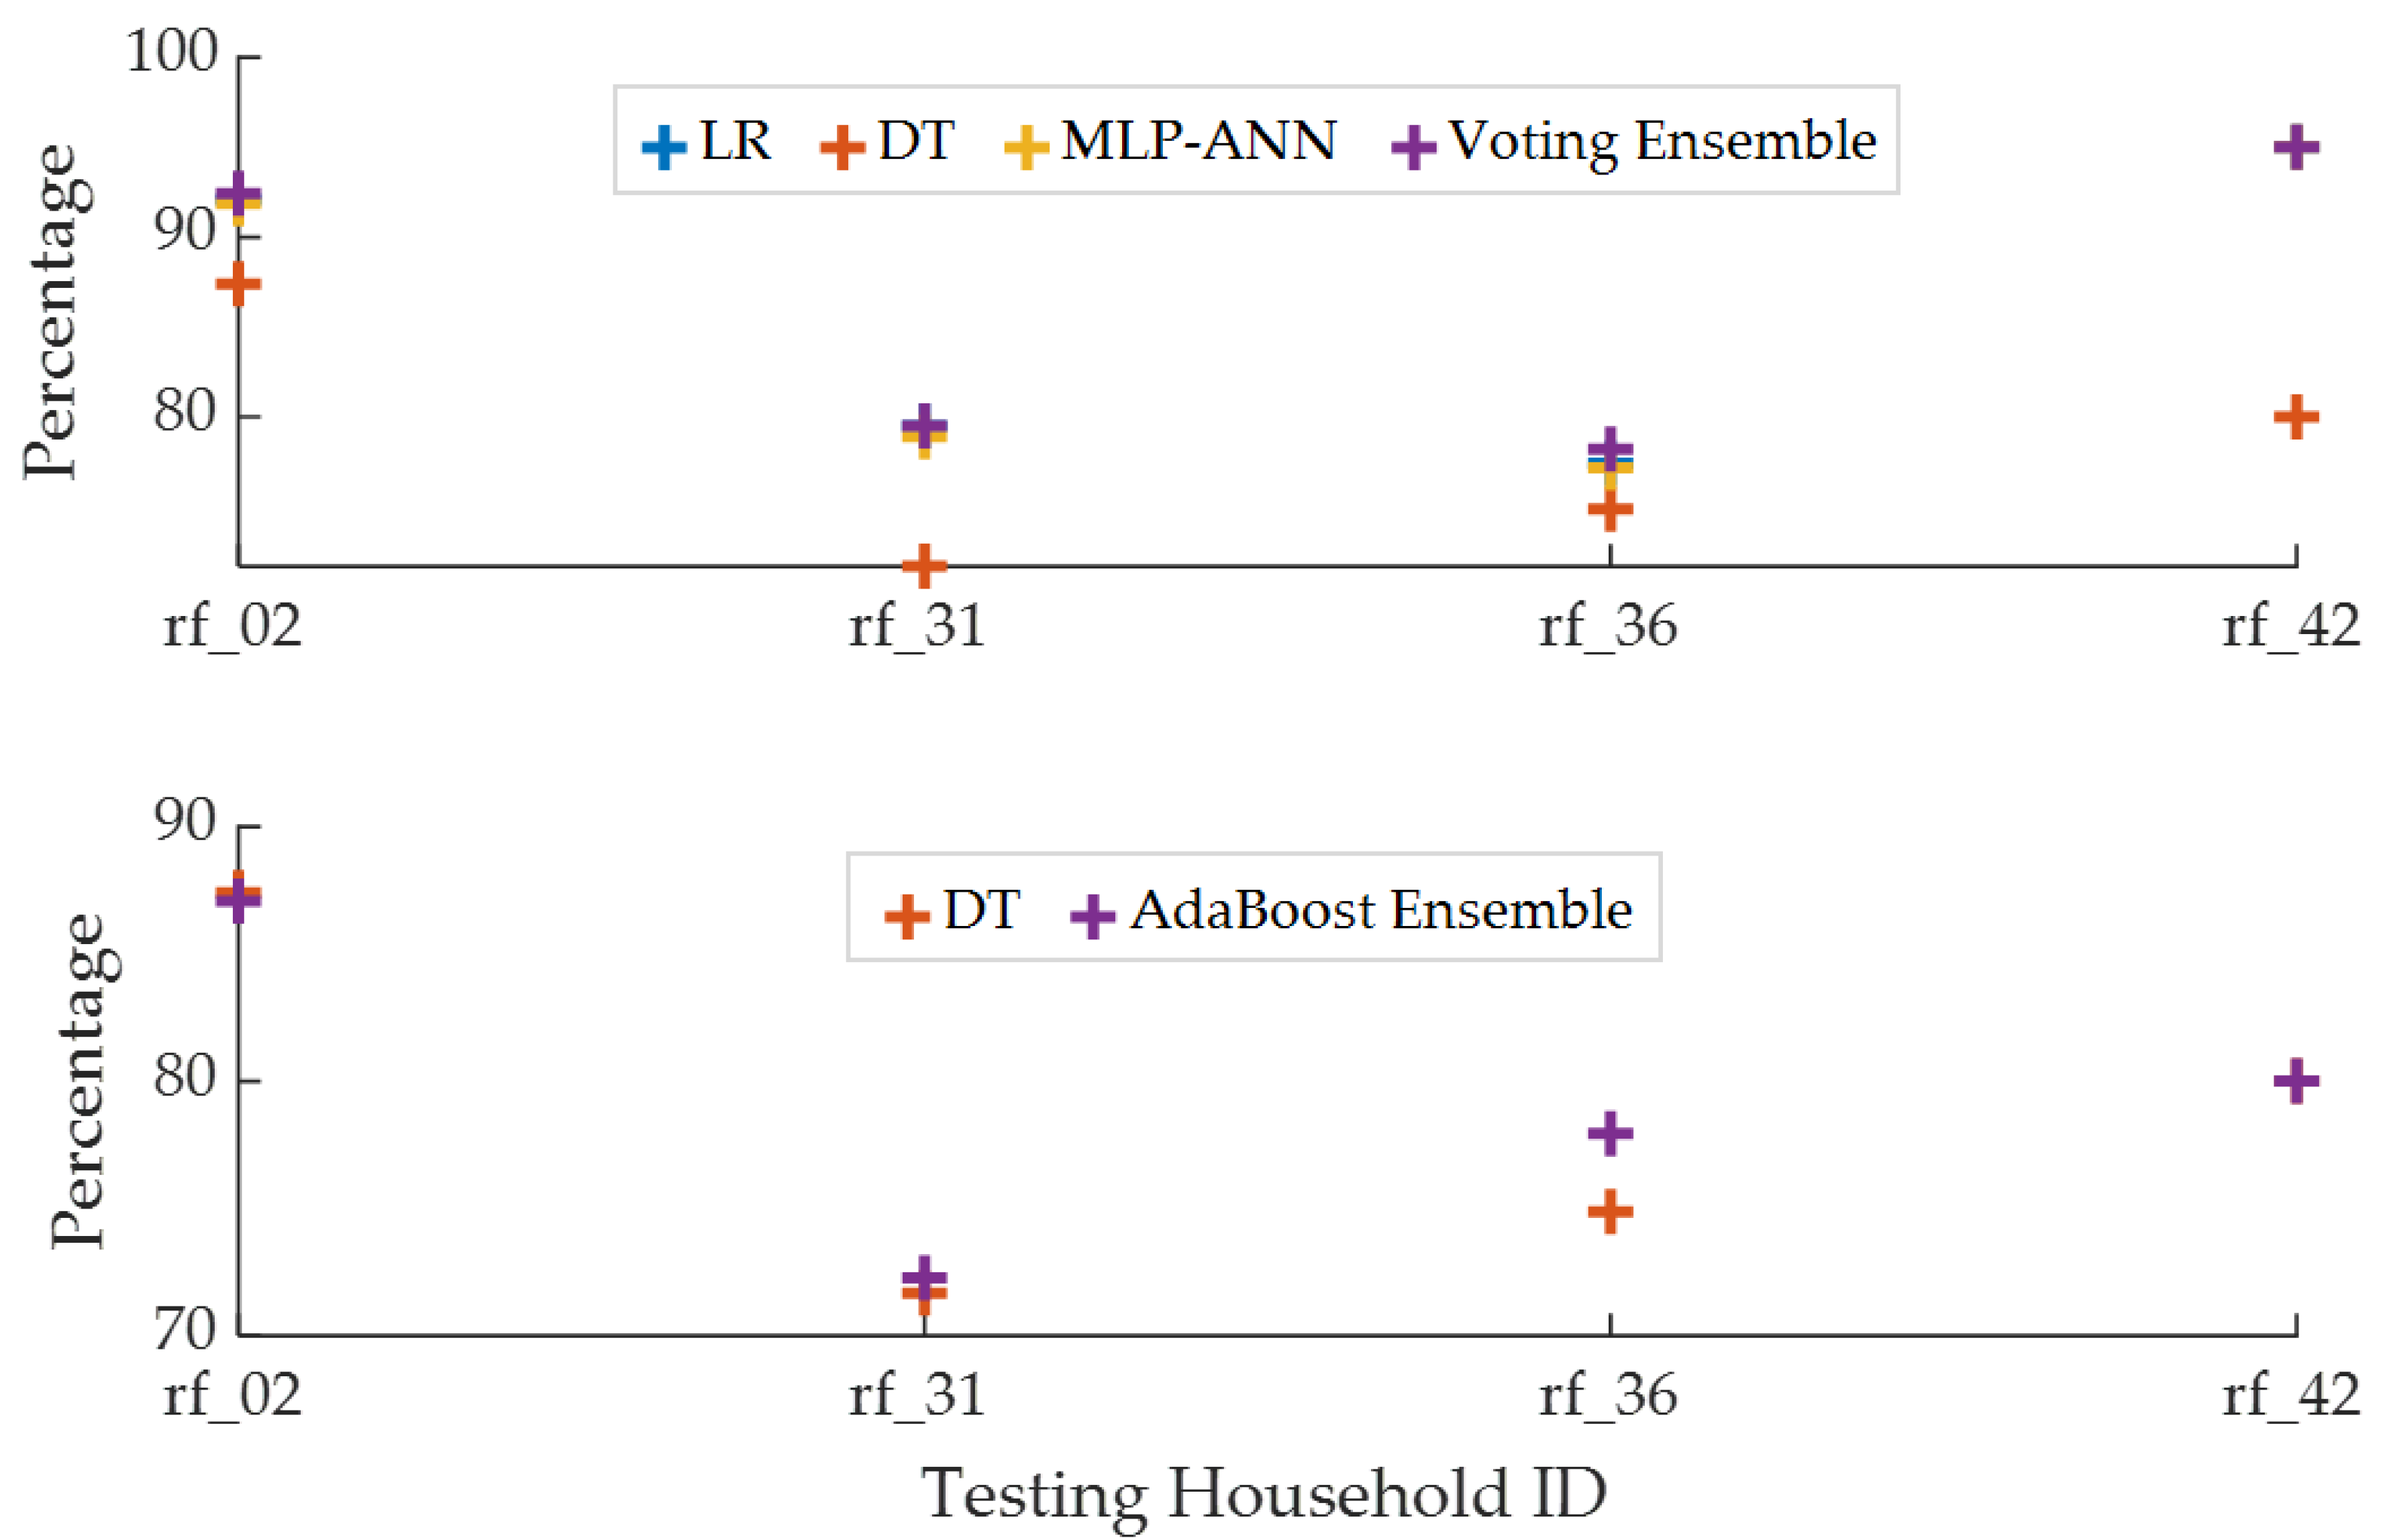
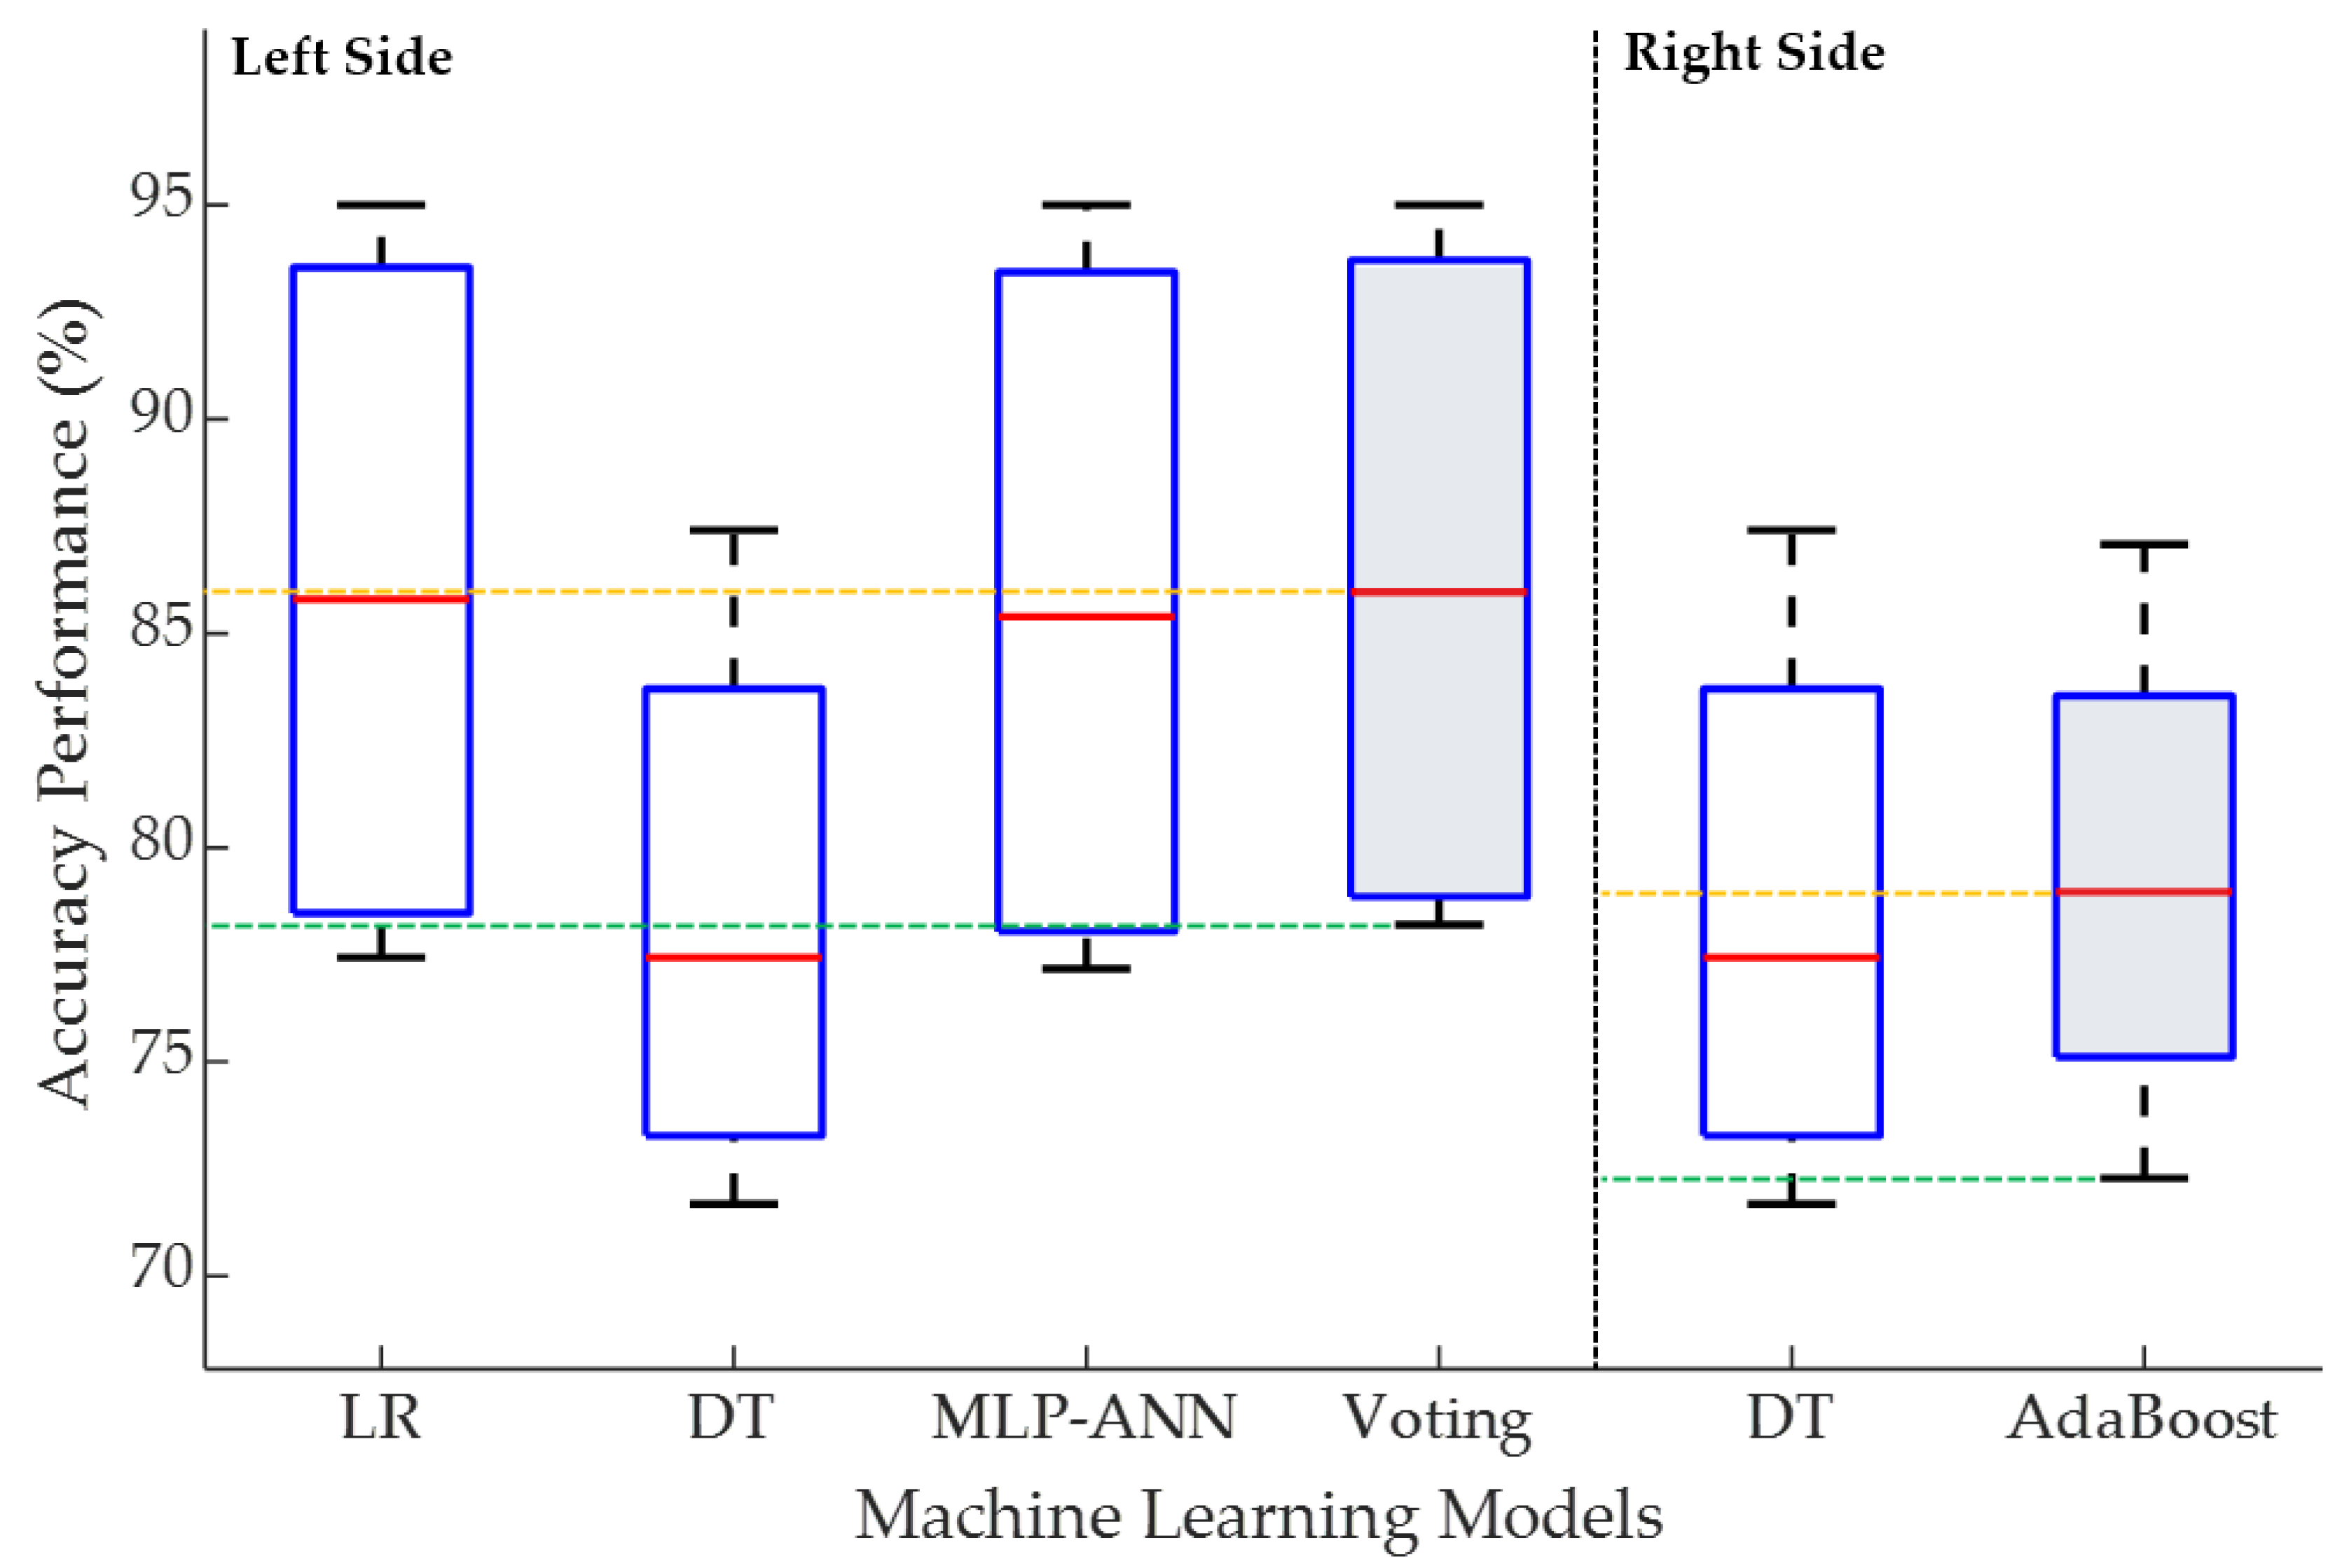
3.3. Classification Results

For classification purposes, the methodologies discussed in Section 2.2.4 are employed and comprehensive simulation studies are carried out on load data presented in Table 5. To further validate the effectiveness of the proposed approach in terms of generalization capability of learning models, four different households, as given in Table 5, are employed for evaluation purposes. It is worth noting that the employed households for training and testing purposes of the learning models have dedicated water-heating load circuits, however, the other individual circuits may vary in terms of availability and installation configuration [62]. Initially, all employed models are evaluated using k-fold cross-validation to validate their effectiveness toward unseen testing data. Later, all employed learning models are trained on 20 days of load data from a single (training) household and rigorously tested on a diverse set of testing households. The testing households also include the same household as used for training purposes, however, the data acquired for testing purposes are entirely unseen for the training phase. In the given context, Table 6 presents the details of different learning models’ parameters adopted for the digital simulation within the scope of this research.
Based on the simulation studies, the extracted results in terms of individual circuit operation status inference and overall performance are presented in Table 7. It is worth noting that in Table 7, WHON, WHOFF, Misc.ON, Misc.OFF, P, R, and F represent water-heating circuit turn-on, water-heating circuit turn-off, miscellaneous circuit turn-on, miscellaneous circuit turn-off, precision, recall, and f-score, respectively. Moreover, C Ab ( x ) and C V ( x ) represent the AdaBoost and Voting ensemble learning models/classifiers, respectively.
As evident from the results presented in Table 7, all the employed learning models attained promising performance for unseen testing data at circuit level inference. However, the DT model relatively lags in performance compared to the others. It is also observed that household ID rf_31 makes itself a prominent candidate in terms of water-heating circuit inference results, where all the employed models yield zero inference results. However, it is worth noting that the achieved results do not correspond to the worst performance of the employed models, as in reality there was no ground-truth water-heating circuit activity for the given data acquisition timeframe of household ID rf_31.
The employed learning models are also evaluated in the context of individual households and for the said purpose the accuracy performance metric, given in (13), is employed. The corresponding results are presented in Table 8, where all the results are in percentages.
For the given testing households, the results presented in Table 8 are further depicted in Figure 6 to better visualize the performance comparison among different employed ensemble learners and their respective standalone base-learner/s.
As evident from the detailed results presented in Table 8 and performance comparison presented in Figure 6, in most of the cases the ensemble learners attained higher accuracy performance compared to their respective standalone base-learner/s. Except for a single case, where the AdaBoost ensemble learner lags in performance compared to its respective base-learner, i.e., the DT model, however, the performance lag is marginal, i.e., 0.33% only. Further, it is also observed that the accuracy performance of all the learning models varies from house to house. This is expected because of diverse set of testing households as well as the corresponding testing households’ data are entirely unseen in the training phase of the learning models.
The employed learning models are also evaluated in terms of an entire set of diverse testing households within the scope of this research work. In this context, Figure 7 (in the form of boxplot) presents an overall accuracy performance of the employed learning models, i.e., ensemble learners vs. respective standalone base-learners.
The red horizontal line within the box in Figure 7 represents the median values. Similarly, in Figure 7, the yellow and green dotted lines represent the median and minimum performance attained by the employed ensemble learners. It is seen in Figure 7 that both ensemble learners attained better overall accuracy performance compared to their respective standalone base-learner/s. As the AdaBoost learner enhances the performance of the weak base-learner, i.e., the DT model, by attaining a median accuracy performance improvement of 1.54%. On the other side, the voting ensemble model balances out the individual shortcomings of its respective base-learner members, i.e., LR, DT, and MLP-ANN, and attained a median accuracy performance improvement in a range of 0.17% to 8.53% compared to its respective base-learner members. From the extracted results, seen in Figure 7 (Left Side), it is also noted that the voting ensemble achieves a marginal improvement of 0.17% compared to one of its respective members, i.e., the LR model. But it is worth noting that there is a probability that in the presence of the best-performing member, the ensemble model does not lead to any performance improvement [63]. However, for the given problem, i.e., non-invasive load inference, both employed ensemble leaners, i.e., homogeneous and heterogeneous, achieved classification performance improvement.

4. Outlook

In the context of real-world deployment, low data granularity based non-invasive load inference technique is of utmost importance, as it can be extended to disaggregate the major residential load elements, e.g., water heating, electric vehicles, air-conditioning units. More importantly, disaggregation of these load elements can further facilitate the demand side management strategies as the corresponding outcome in form of appliance or circuit level feedback will significantly facilitate the consumers to effectively manage their loads’ operation. This could not only help the sustainable operation of energy systems but also facilitate the consumers in terms of savings due to load shifting of their high consumption load elements [64]. Non-invasive load inference can also facilitate the commercial and industrial sectors, e.g., in the commercial sector, the proposed non-invasive load inference approach can play a significant role in terms of monitoring distinct load patterns (energy audit) without affecting the individual vendors’ privacy. Moreover, the proposed approach facilitates the industrial sector not only in terms of load monitoring, i.e., operation patterns, fault diagnosis, but also helps in terms of potential load identification for demand response applications.
Further, in the context of system perspective, the authors of [65] presented a comprehensive overview of NILM applications; exploring numerous NILM-assisted real-world applications including but not limited to, homecare monitoring systems, appliance scheduling, energy audit, personalized recommendation systems, demand response, and fault detection. The study broadly classified numerous NILM applications into four categories, namely consumer-based applications, utility-based applications, policy-based applications, and manufacturer-based applications [65]. Concisely, the non-intrusive load inference approach has solid potential toward energy efficiency, and further research particularly in the context of low data granularity and real-world applications will significantly facilitate all the stakeholders including but not limited to utility providers, consumers, policymakers, and manufacturers.

5. Conclusions

This paper proposed a non-invasive load inference approach for water-heating circuit using ensemble machine learning methodologies. For the said purpose, an event-based NILM methodology, assisted by correlation-based feature selection technique and diverse machine learning models, is adopted, and comprehensive digital simulations are carried out on real-world low granularity (1-min sampling rate, i.e., 1/60 Hz) load measurements: NZ GREEN Grid database.
In the context of event detection, the MAD-SW algorithm’s performance is improved with post-processing. Similarly, the extracted load features of detected events are further evaluated using feature selection methodology to identify the most significant load features for classification purposes. For NILM classification, two diverse ensemble learning techniques are introduced to facilitate inference performance. Under the given conditions, homogeneous sequential (AdaBoost) and heterogeneous parallel (Voting) ensemble learning techniques are successfully employed. Based on the presented analysis of the extracted results, it is concluded that the proposed non-invasive load inference approach not only attained promising inference results but also showed good generalization capabilities in the context of unseen testing data. Further, it is noted that the employed ensemble learners provide classification performance improvement compared to their respective standalone base-learners. However, it is worth noting that the performance improvement allowed by the employed ensemble models came at a price of model complexity and computational power. Consequently, a trade-off exists between the performance and computational requirements. Hence, it is exclusively the choice of the end-user as well as the sensitivity-level of the given problem to prefer performance over computational efficiency or vice-versa.
Based on the presented research work and corresponding findings, it is concluded that ensemble learning can facilitate non-intrusive load monitoring, even at low data granularity. Further, the outcome of non-invasive load inference of water heating has a solid potential to facilitate numerous real-world energy efficiency applications, e.g., demand response, load forecasting, and load scheduling strategies. In the future, this research will be extended in terms of broader applications of the proposed approach toward energy efficiency.

Author Contributions

Conceptualization, A.U.R.; formal analysis, A.U.R.; methodology, A.U.R.; software, A.U.R.; supervision, T.T.L. and B.V.; validation, A.U.R., T.T.L., B.V., and S.R.T.; writing—original draft, A.U.R.; writing—review and editing, T.T.L., B.V., and S.R.T. All authors have read and agreed to the published version of the manuscript.

Funding

This research received no external funding.

Acknowledgments

The authors would like to acknowledge the Auckland University of Technology, Genesis Energy Limited, and Callaghan Innovation for their valuable support.

Conflicts of Interest

The authors declare no conflict of interest.

References

  1. Mohassel, R.R.; Fung, A.; Mohammadi, F.; Raahemifar, K. A survey on advanced metering infrastructure. Int. J. Electr. Power Energy Syst. 2014, 63, 473–484. [Google Scholar] [CrossRef] [Green Version]
  2. Egarter, D.; Bhuvana, V.P.; Elmenreich, W. PALDi: Online Load Disaggregation via Particle Filtering. IEEE Trans. Instrum. Meas. 2015, 64, 467–477. [Google Scholar] [CrossRef]
  3. Chang, H.; Lin, L.; Chen, N.; Lee, W. Particle-Swarm-Optimization-Based Nonintrusive Demand Monitoring and Load Identification in Smart Meters. IEEE Trans. Ind. Appl. 2013, 49, 2229–2236. [Google Scholar] [CrossRef]
  4. Zoha, A.; Gluhak, A.; Imran, M.A.; Rajasegarar, S. Non-intrusive load monitoring approaches for disaggregated energy sensing: A survey. Sensors 2012, 12, 16838–16866. [Google Scholar] [CrossRef] [PubMed] [Green Version]
  5. Amenta, V.; Tina, G.M. Load Demand Disaggregation based on Simple Load Signature and User’s Feedback. Energy Procedia 2015, 83, 380–388. [Google Scholar] [CrossRef] [Green Version]
  6. Carrie Armel, K.; Gupta, A.; Shrimali, G.; Albert, A. Is disaggregation the holy grail of energy efficiency? The case of electricity. Energy Policy 2013, 52, 213–234. [Google Scholar] [CrossRef] [Green Version]
  7. Ehrhardt-Martinez, K.; Donnelly, K.A.; Laitner, S. Advanced Metering Initiatives and Residential Feedback Programs: A Meta-Review for Household Electricity-Saving Opportunities; American Council for an Energy-Efficient Economy: Washington, DC, USA, 2010. [Google Scholar]
  8. Ebrahim, A.F.; Mohammed, O.A. Pre-processing of energy demand disaggregation based data mining techniques for household load demand forecasting. Inventions 2018, 3, 45. [Google Scholar] [CrossRef] [Green Version]
  9. Liao, J.; Elafoudi, G.; Stankovic, L.; Stankovic, V. Power disaggregation for low-sampling rate data. In Proceedings of the 2nd International Non-intrusive Appliance Load Monitoring Workshop, Austin, TX, USA, 3 June 2014. [Google Scholar]
  10. Shaw, S.R.; Leeb, S.B.; Norford, L.K.; Cox, R.W. Nonintrusive load monitoring and diagnostics in power systems. IEEE Trans. Instrum. Meas. 2008, 57, 1445–1454. [Google Scholar] [CrossRef]
  11. Lin, Y.H.; Tsai, M.S. An Advanced Home Energy Management System Facilitated by Nonintrusive Load Monitoring With Automated Multiobjective Power Scheduling. IEEE Trans. Smart Grid 2015, 6, 1839–1851. [Google Scholar] [CrossRef]
  12. Wang, H.; Yang, W.; Chen, T.; Yang, Q. An optimal load disaggregation method based on power consumption pattern for low sampling data. Sustainability 2019, 11, 251. [Google Scholar] [CrossRef] [Green Version]
  13. Kwak, Y.; Hwang, J.; Lee, T. Load disaggregation via pattern recognition: A feasibility study of a novel method in residential building. Energies 2018, 11, 1008. [Google Scholar] [CrossRef] [Green Version]
  14. Wong, Y.F.; Şekercioğlu, Y.A.; Drummond, T.; Wong, V.S. Recent approaches to non-intrusive load monitoring techniques in residential settings. In Proceedings of the 2013 IEEE Computational Intelligence Applications in Smart Grid (CIASG), Singapore, 16–19 April 2013; pp. 73–79. [Google Scholar]
  15. Hernández, Á.; Ruano, A.; Ureña, J.; Ruano, M.; Garcia, J. Applications of NILM Techniques to Energy Management and Assisted Living. IFAC-PapersOnLine 2019, 52, 164–171. [Google Scholar]
  16. Ruano, A.; Hernandez, A.; Ureña, J.; Ruano, M.; Garcia, J. NILM Techniques for intelligent home energy management and ambient assisted living: A review. Energies 2019, 12, 2203. [Google Scholar] [CrossRef] [Green Version]
  17. Zhuang, M.; Shahidehpour, M.; Li, Z. An Overview of Non-Intrusive Load Monitoring: Approaches, Business Applications, and Challenges. In Proceedings of the 2018 International Conference on Power System Technology (POWERCON), Guangzhou, China, 6–8 November 2018; pp. 4291–4299. [Google Scholar]
  18. Kolter, J.Z.; Johnson, M.J. REDD: A public data set for energy disaggregation research. In Proceedings of the Workshop on Data Mining Applications in Sustainability (SIGKDD), San Diego, CA, USA, 21 August 2011; pp. 59–62. [Google Scholar]
  19. Anderson, K.; Ocneanu, A.; Benitez, D.; Carlson, D.; Rowe, A.; Berges, M. BLUED: A fully labeled public dataset for event-based non-intrusive load monitoring research. In Proceedings of the 2nd KDD Workshop on Data Mining Applications in Sustainability (SustKDD), Beijing, China, 12–16 August 2012; pp. 1–5. [Google Scholar]
  20. Kelly, J.; Knottenbelt, W. The UK-DALE dataset, domestic appliance-level electricity demand and whole-house demand from five UK homes. Sci. Data 2015, 2, 150007. [Google Scholar] [CrossRef] [PubMed] [Green Version]
  21. Anderson, B.; Eyers, D.; Ford, R.; Ocampo, D.G.; Peniamina, R.; Stephenson, J.; Suomalainen, K.; Wilcocks, L.; Jack, M. New Zealand GREEN Grid Household Electricity Demand Study 2014–2018; UK Data Service: Colchester, UK, 2018. [Google Scholar]
  22. “Pecan Street Inc. Dataport 2020”, United States of America. Available online: https://www.pecanstreet.org/dataport/ (accessed on 23 November 2020).
  23. Basu, K.; Debusschere, V.; Bacha, S.; Maulik, U.; Bondyopadhyay, S. Nonintrusive Load Monitoring: A Temporal Multilabel Classification Approach. IEEE Trans. Ind. Inform. 2015, 11, 262–270. [Google Scholar] [CrossRef]
  24. Guillén-García, E.; Morales-Velazquez, L.; Zorita-Lamadrid, A.L.; Duque-Perez, O.; Osornio-Rios, R.A.; de Jesús Romero-Troncoso, R. Identification of the electrical load by C-means from non-intrusive monitoring of electrical signals in non-residential buildings. Int. J. Electr. Power Energy Syst. 2019, 104, 21–28. [Google Scholar] [CrossRef]
  25. De Baets, L.; Develder, C.; Dhaene, T.; Deschrijver, D. Detection of unidentified appliances in non-intrusive load monitoring using siamese neural networks. Int. J. Electr. Power Energy Syst. 2019, 104, 645–653. [Google Scholar] [CrossRef]
  26. Gupta, S.; Reynolds, M.S.; Patel, S.N. ElectriSense: Single-point sensing using EMI for electrical event detection and classification in the home. In Proceedings of the 12th ACM International Conference on Ubiquitous Computing, Copenhagen, Denmark, 26–29 September 2010; pp. 139–148. [Google Scholar]
  27. Chang, H.-H. Non-intrusive demand monitoring and load identification for energy management systems based on transient feature analyses. Energies 2012, 5, 4569–4589. [Google Scholar] [CrossRef] [Green Version]
  28. Wang, H.; Yang, W. An iterative load disaggregation approach based on appliance consumption pattern. Appl. Sci. 2018, 8, 542. [Google Scholar] [CrossRef] [Green Version]
  29. Basu, K.; Debusschere, V.; Douzal-Chouakria, A.; Bacha, S. Time series distance-based methods for non-intrusive load monitoring in residential buildings. Energy Build. 2015, 96, 109–117. [Google Scholar] [CrossRef]
  30. Elafoudi, G.; Stankovic, L.; Stankovic, V. Power disaggregation of domestic smart meter readings using dynamic time warping. In Proceedings of the 2014 6th International Symposium on Communications, Control and Signal Processing (ISCCSP), Athens, Greece, 21–23 May 2014; pp. 36–39. [Google Scholar]
  31. Egarter, D.; Elmenreich, W. Load disaggregation with metaheuristic optimization. In Proceedings of the 2015 Energieinformatik Conference, Karlsruhe, Germany, 12–13 November 2015; pp. 1–12. [Google Scholar]
  32. Rehman, A.U.; Lie, T.T.; Vallès, B.; Tito, S.R. Low Complexity Non-Intrusive Load Disaggregation of Air Conditioning Unit and Electric Vehicle Charging. In Proceedings of the 2019 IEEE Innovative Smart Grid Technologies—Asia (ISGT Asia), Chengdu, China, 21–24 May 2019; pp. 2607–2612. [Google Scholar]
  33. Su, S.; Yan, Y.; Lu, H.; Kangping, L.; Yujing, S.; Fei, W.; Liming, L.; Hui, R. Non-intrusive load monitoring of air conditioning using low-resolution smart meter data. In Proceedings of the 2016 IEEE International Conference on Power System Technology (POWERCON), Wollongong, Australia, 28 September–1 October 2016; pp. 1–5. [Google Scholar]
  34. Wu, X.; Gao, Y.; Jiao, D. Multi-label classification based on random forest algorithm for non-intrusive load monitoring system. Processes 2019, 7, 337. [Google Scholar] [CrossRef] [Green Version]
  35. Aiad, M.; Lee, P.H. Unsupervised approach for load disaggregation with devices interactions. Energy Build. 2016, 116, 96–103. [Google Scholar] [CrossRef]
  36. Yang, C.C.; Soh, C.S.; Yap, V.V. A non-intrusive appliance load monitoring for efficient energy consumption based on Naive Bayes classifier. Sustain. Comput. Inform. Syst. 2017, 14, 34–42. [Google Scholar] [CrossRef]
  37. Chang, H.; Lian, K.; Su, Y.; Lee, W. Power-Spectrum-Based Wavelet Transform for Nonintrusive Demand Monitoring and Load Identification. IEEE Trans. Ind. Appl. 2014, 50, 2081–2089. [Google Scholar] [CrossRef]
  38. Cho, J.; Hu, Z.; Sartipi, M. Non-Intrusive A/C Load Disaggregation Using Deep Learning. In Proceedings of the 2018 IEEE/PES Transmission and Distribution Conference and Exposition (T&D), Denver, CO, USA, 16–19 April 2018; pp. 1–5. [Google Scholar]
  39. Kong, W.; Dong, Z.Y.; Wang, B.; Zhao, J.; Huang, J. A practical solution for non-intrusive type II load monitoring based on deep learning and post-processing. IEEE Trans. Smart Grid 2019, 11, 148–160. [Google Scholar] [CrossRef]
  40. Azaza, M.; Wallin, F. Evaluation of classification methodologies and Features selection from smart meter data. Energy Procedia 2017, 142, 2250–2256. [Google Scholar] [CrossRef]
  41. Rehman, A.U.; Lie, T.T.; Vallès, B.; Tito, S.R. Event-Detection Algorithms for Low Sampling Nonintrusive Load Monitoring Systems Based on Low Complexity Statistical Features. IEEE Trans. Instrum. Meas. 2020, 69, 751–759. [Google Scholar] [CrossRef]
  42. Electricity in New Zealand; Electricity Authority New Zealand: Wellington, New Zealand, November 2018.
  43. Yang, Y.; Zengqiang, M.; Zheng, X.; Chang, D. Accommodation of curtailed wind power by electric water heaters based on a new hybrid prediction approach. J. Mod. Power Syst. Clean Energy 2019, 7, 525–537. [Google Scholar]
  44. Wu, M.; Bao, Y.-Q.; Zhang, J.; Ji, T. Multi-objective optimization for electric water heater using mixed integer linear programming. J. Mod. Power Syst. Clean Energy 2019, 7, 1256–1266. [Google Scholar] [CrossRef] [Green Version]
  45. Haider, Z.M.; Mehmood, K.K.; Rafique, M.K.; Khan, S.U.; Soon-Jeong, L.; Chul-Hwan, K. Water-filling algorithm based approach for management of responsive residential loads. J. Mod. Power Syst. Clean Energy 2018, 6, 118–131. [Google Scholar] [CrossRef] [Green Version]
  46. Pipattanasomporn, M.; Kuzlu, M.; Rahman, S.; Teklu, Y. Load profiles of selected major household appliances and their demand response opportunities. IEEE Trans. Smart Grid 2013, 5, 742–750. [Google Scholar] [CrossRef]
  47. Clarke, T.; Slay, T.; Eustis, C.; Bass, R.B. Aggregation of Residential Water Heaters for Peak Shifting and Frequency Response Services. IEEE Open Access J. Power Energy 2019, 7, 22–30. [Google Scholar] [CrossRef]
  48. Liu, M.; Yong, J.; Wang, X.; Lu, J. A new event detection technique for residential load monitoring. In Proceedings of the 2018 18th International Conference on Harmonics and Quality of Power (ICHQP), Ljubljana, Slovenia, 13–16 May 2018; pp. 1–6. [Google Scholar]
  49. Wild, B.; Barsim, K.S.; Yang, B. A new unsupervised event detector for non-intrusive load monitoring. In Proceedings of the 2015 IEEE Global Conference on Signal and Information Processing (GlobalSIP), Orlando, FL, USA, 14–16 December 2015; pp. 73–77. [Google Scholar]
  50. Anderson, K.D.; Bergés, M.E.; Ocneanu, A.; Benitez, D.; Moura, J.M. Event detection for non intrusive load monitoring. In Proceedings of the IECON 2012-38th Annual Conference on IEEE Industrial Electronics Society, Montreal, QC, Canada, 25–28 October 2012; pp. 3312–3317. [Google Scholar]
  51. Kotsiantis, S.B. Supervised Machine Learning: A Review of Classification Techniques. Emerg. Artif. Intell. Appl. Comput. Eng. 2007, 160, 3–24. [Google Scholar]
  52. Polikar, R. Ensemble based systems in decision making. IEEE Circuits Syst. Mag. 2006, 6, 21–45. [Google Scholar] [CrossRef]
  53. Leon, F.; Floria, S.-A.; Bădică, C. Evaluating the effect of voting methods on ensemble-based classification. In Proceedings of the 2017 IEEE International Conference on INnovations in Intelligent SysTems and Applications (INISTA), Gdynia, Poland, 3–5 July 2017; pp. 1–6. [Google Scholar]
  54. An, T.-K.; Kim, M.-H. A new diverse AdaBoost classifier. In Proceedings of the 2010 International Conference on Artificial Intelligence and Computational Intelligence, Sanya, China, 23–24 October 2010; pp. 359–363. [Google Scholar]
  55. Pedregosa, F.; Varoquaux, G.; Gramfort, A.; Michel, V.; Thirion, B.; Grisel, O.; Blondel, M.; Prettenhofer, P.; Weiss, R.; Dubourg, V. Scikit-learn: Machine learning in Python. J. Mach. Learn. Res. 2011, 12, 2825–2830. [Google Scholar]
  56. Kleinbaum, D.G.; Dietz, K.; Gail, M.; Klein, M.; Klein, M. Logistic Regression; Springer: Berlin/Heidelberg, Germany, 2002. [Google Scholar]
  57. Quinlan, J.R. Induction of decision trees. Mach. Learn. 1986, 1, 81–106. [Google Scholar] [CrossRef] [Green Version]
  58. Asres, M.W.; Girmay, A.A.; Camarda, C.; Tesfamariam, G.T. Non-intrusive load composition estimation from aggregate ZIP load models using machine learning. Int. J. Electr. Power Energy Syst. 2019, 105, 191–200. [Google Scholar] [CrossRef]
  59. Faustine, A.; Mvungi, N.H.; Kaijage, S.; Michael, K. A Survey on Non-Intrusive Load Monitoring Methodies and Techniques for Energy Disaggregation Problem. arXiv 2017, arXiv:1703.00785. [Google Scholar]
  60. Alcala, J.; Urena, J.; Hernandez, A.; Gualda, D. Event-Based Energy Disaggregation Algorithm for Activity Monitoring From a Single-Point Sensor. IEEE Trans. Instrum. Meas. 2017, 66, 2615–2626. [Google Scholar] [CrossRef]
  61. Meziane, M.N.; Ravier, P.; Lamarque, G.; Le Bunetel, J.-C.; Raingeaud, Y. High accuracy event detection for Non-Intrusive Load Monitoring. In Proceedings of the 2017 IEEE International Conference on Acoustics, Speech and Signal Processing (ICASSP), New Orleans, LA, USA, 5–9 March 2017; pp. 2452–2456. [Google Scholar]
  62. Anderson, B.; Eyers, D.; Ford, R.; Ocampo, D.G.; Peniamina, R.; Stephenson, J.; Suomalainen, K.; Wilcocks, L.; Jack, M. NZ GREEN Grid Household Electricity Demand Study: 1 Minute Electricity Power (Version 1.0); Centre for Sustainability, University of Otago: Dunedin, New Zealand, 2018. [Google Scholar]
  63. Polikar, R. Ensemble learning. In Ensemble Machine Learning; Springer: Berlin/Heidelberg, Germany, 2012; pp. 1–34. [Google Scholar]
  64. Logenthiran, T.; Srinivasan, D.; Shun, T.Z. Demand Side Management in Smart Grid Using Heuristic Optimization. IEEE Trans. Smart Grid 2012, 3, 1244–1252. [Google Scholar] [CrossRef]
  65. Rehman, A.U.; Tito, S.R.; Nieuwoudt, P.; Imran, G.; Lie, T.T.; Vallès, B.; Ahmad, W. Applications of Non-Intrusive Load Monitoring Towards Smart and Sustainable Power Grids: A System Perspective. In Proceedings of the 2019 29th Australasian Universities Power Engineering Conference (AUPEC), Nadi, Fiji, 26–29 November 2019; pp. 1–6. [Google Scholar]
Figure 1. Research methodology.
Inventions 05 00057 g001
Figure 2. Ensemble learning models: (a) AdaBoost Ensemble; c DT n ( x ) and C Ab ( x ) represent the DT and generated AdaBoost ensemble classifier, respectively (b) Voting Ensemble; c MLP - ANN ( x ) , c DT ( x ) , c LR ( x ) , and C V ( x ) represent the MLP-ANN, DT, LR, and generated Voting classifier, respectively.
Inventions 05 00057 g002
Figure 3. Event detection performance results (a) window width, (b) delay tolerance (shaded region represents the best results).
Inventions 05 00057 g003
Figure 4. Testing households’ circuits configuration (a) rf_02, (b) rf_31, (c) rf_36, and (d) rf_42.
Inventions 05 00057 g004
Figure 5. Correlation analysis based feature selection results for different testing households data (a) rf_02, (b) rf_31, (c) rf_36, (d) rf_42.
Inventions 05 00057 g005
Figure 6. Household-level performance comparison.
Inventions 05 00057 g006
Figure 7. Classifier-level overall accuracy performance comparison, (Left Side): heterogeneous parallel ensemble learner vs. respective diverse base-learners, (Right Side): homogeneous sequential ensemble learner vs. respective single base-learner (shaded boxes represent the ensemble learners).
Inventions 05 00057 g007
Table 1. Event detection algorithm methodology.
MAD-SW
Input
Preprocessed aggregated load data, x
Process
 1.
Select sliding window width, ω
 2.
Initialize the filter having window width, ω, with the MAD value of input x
  •               MAD = 1 N i = 1 N | x i μ x |
  •          where,
  •               μ x = 1 N i = 1 N x i
 3.
Using the sliding window concept and pre-selected window width, ω, compute iteratively the MAD value
 4.
Select a threshold value, δ, and compute the thresholding signal as
  •   for i = length of x do
  •    if MAD ≤ δ then
  •     thresholding_signal(i) = 0
  •    else
  •     thresholding_signal(i) = 1
  •    end if
  •   end for
 5.
Use derivative to compute the edges and extract the corresponding starting and ending time instances of the detected events
 6.
Post-processing
  • Ending time instance delay correction because of window width
  • Final event approval
  • Delay tolerance incorporation, i.e., the detected event is considered a true event if,
    •    |tgound_truthtdetected| t
    • where, tground_truth, tdetected, and ∆t represent the ground-truth event starting time instance, detected event starting time instance, and delay tolerance, respectively.
Output
Starting and Ending time instances of the detected events
Table 2. Load data and event detection attributes.
Household Data IDrf_01
Data Timeframe
(In 2014)
11–15 March; 11–13 April; 12–13 May
12–15 June; 14–15 July; 11–15 August
11–14 September; 11–15 October
Duration; No. of Data Samples30 Days; 43,200
Threshold Value150 W
Table 3. Performance evaluation in the context of window width.
Delay Tolerance (mins)0
Window Width (Samples)2 *3456
Total Detected Events36513367285324122005
True Positive30583016249520421639
False Positive593351358370366
False Negative651698122416842093
Precision %83.7689.58 87.45 84.66 81.75
Recall %82.4581.21 67.09 54.80 43.92
F-Score %83.1085.19 75.93 66.54 57.14
* Minimum two sample values are required to extract meaningful MAD values.
Table 4. Performance evaluation in the context of delay tolerance.
Window Width (Samples)3
Delay Tolerance (mins)01234
True Positive30163208325332863307
False Positive3511591148160
False Negative69838622812369
Precision (%)89.5895.2896.6197.5998.22
Recall (%)81.2189.2693.4596.3997.96
F-Score (%)85.1992.1795.0196.9998.09
Table 5. Training and testing household data attributes and event detection results.
Training Data Testing Data
Data IDrf_02rf_02rf_31rf_36rf_42
Data Timeframe11–30 May 20141–10 July 20141–7 September 201621–27 June 20177–13 January 2017
No. of Days/Samples20/28,800 10/14,4007/10,0807/10,8007/10,800
Detected Events150489816639060
Table 6. Learning models’ parameters.
ModelsParameter *
MLP-ANNactivation = ‘relu’; solver = ‘sgd’; hidden_layer_size = (100)
DTcriterion = ‘gini’; splitter = ‘best’
Voting Ensemblevoting = ‘hard’
AdaBoost EnsembleN = 50; algorithm = ‘SAMME.R’
* Explanation and further details of the given parameters can be found in [55].
Table 7. Circuit-level inference results (in percentages).
Standalone ModelsEnsemble Model
LRDTMLP-ANN C V ( x ) C Ab ( x )
IDStatusPRFPRFPRFPRFPRF
rf_02WHOFF948891858887948590948891858786
WHON908588798481908788908788798481
Misc.ON919493908688929493929493908688
Misc.OFF939795939192919794939795929091
Weighted Avg.929292888787929292929292878787
rf_31WHOFF000000000000000
WHON000000000000000
Misc.ON10083911007384100829010083911007384
Misc.OFF10072841006982100728410072841007183
Weighted Avg.10080881007283100798810080881007284
rf_36WHOFF877279728377867278877380788582
WHON796974747976787074807175757877
Misc.ON728277777275728176738277777476
Misc.OFF748881786470748780758881827478
Weighted Avg.787777757575787777797878787878
rf_42WHOFF71100833810056711008371100833810056
WHON83100915610071831009183100915610071
Misc.ON10096981008491100969810096981008491
Misc.OFF10092961006881100929610092961006881
Weighted Avg.969595918082969595969595918082
Table 8. Household-level accuracy performance results (%).
Voting Based EnsembleAdaBoost Ensemble
Testing Households IDs LR DT MLP-ANN C V ( x ) DT C Ab ( x )
rf_0292.0987.4191.8792.4287.4187.08
rf_3179.5171.6878.9179.5171.6872.28
rf_3677.4374.8777.1778.2074.8777.94
rf_42958095958080
Publisher’s Note: MDPI stays neutral with regard to jurisdictional claims in published maps and institutional affiliations.

