Deterioration of the Mechanical Properties of FFF 3D-Printed PLA Structures

1
Department of Mechanical Engineering, Graduate School of Engineering, Aichi Institute of Technology, 1247 Yachigusa, Yakusa-cho, Toyota-city, Aichi 470-0392, Japan
2
Department of Mechanical Engineering, Faculty of Engineering, Aichi Institute of Technology, 1247 Yachigusa, Yakusa-cho, Toyota-city, Aichi 470-0392, Japan
*
Author to whom correspondence should be addressed.
Inventions 2021, 6(1), 1; https://0-doi-org.brum.beds.ac.uk/10.3390/inventions6010001
Submission received: 9 November 2020
/
Revised: 12 December 2020
/
Accepted: 19 December 2020
/
Published: 22 December 2020
(This article belongs to the Section Inventions and Innovation in Biotechnology and Materials)
Abstract
:Poly(lactic acid) (PLA) is a biodegradable polymer material used for the fabrication of objects by fused filament fabrication (FFF) 3D printing. FFF 3D printing technology has been quickly spreading over the past few years. An FFF-3D-printed object is formed from melted polymer extruded from a nozzle layer-by-layer. The mechanical properties of the object, and the changes in those properties as the object degrades, differ from the properties and changes observed in bulk objects. In this study we evaluated FFF-3D-printed objects by uniaxial tensile tests and four-point flexural tests to characterize the changes of three mechanical properties, namely, the maximum stress, elastic modulus, and breaking energy. Eight types of test pieces printed directly by an FFF 3D printer using two scan patterns and two interior fill percentages (IFPs) were tested by the aforesaid methods. The test pieces were immersed in saline and kept in an incubator at 37 °C for 30, 60, or 90 days before the mechanical testing. The changes in the mechanical properties differed largely between the test piece types. In some of the test pieces, transient increases in strength were observed before the immersion degraded the strength. Several of the test piece types were found to have superior specific strength in the tests. The results obtained in this research will be helpful for the design of PLA structures fabricated by FFF 3D printing.
1. Introduction
Poly(lactic acid) (PLA), a biodegradable polymer derived from plants such as corn and cassava, is one of the most widely applied materials in its class [1,2,3,4,5,6]. PLA can be formed into decomposable products such as packaging materials or medical devices [2,3,7,8,9,10,11,12,13,14,15]. The mechanical properties of PLA structures processed by injection molding (IM) deteriorate by hydrolysis when exposed to moisture [5,7,16,17,18]. Though PLA is now widely adopted as a filamentary material for fused filament fabrication (FFF) 3D printers [19,20,21,22,23,24,25,26,27], few studies have examined how the mechanical properties of FFF-3D-printed PLA structures deteriorate [28,29].
An FFF 3D printer builds up objects by depositing melted polymer extruded from a fine nozzle. The 3D objects printed by this method are designed using computer-aided design (CAD) systems [30,31]. The nozzle of the 3D printer traces an XY plane based on slice data, and repeats layer-by-layer. The structure is built up by a filament of a uniform diameter, with some clearance left between neighboring filaments. The mechanical properties of the structure are therefore partly determined by an internal structure that can vary according to the nozzle scan pattern used for the fabrication [31,32,33,34,35,36,37].
Understanding the mechanical properties of a material is important for the design of objects. Tensile tests, flexural tests, and compression tests have been used to evaluate the strengths of PLA structures fabricated both by IM [16] and by 3D-printing [32,33,34,35,36,37]. The deterioration of the mechanical properties is an essential factor to consider in the design of a structure, if the strength is to be adequately maintained or controlled during the structure’s lifetime. The strength deterioration of PLA formed by IM has been evaluated by tensile tests [10,12,18,38] and flexural tests [10,39] for medical applications. While FFF-3D-printed PLA structures are becoming essential components of medical devices and environment-friendly products, the mechanical properties of 3D-printed structures so far reported have yet to form a sufficient basis for design guidelines [28,29].
The deterioration rate of PLA depends on several immersion conditions, such as the buffer used, the pH of the buffer solution, and the immersion temperature [29,40,41,42]. These conditions are difficult to compare in published studies, as they have varied among test pieces and have only been partially described [40]. As a consequence, scanty data have been obtained from tensile and flexural testing of test pieces prepared under uniform fabrication and immersion conditions.
Our group previously performed uniaxial tensile tests on FFF-3D-printed PLA test pieces to evaluate how the mechanical properties deteriorated after the test pieces were immersed in saline for certain periods [28]. The tests evaluated test pieces printed using four nozzle scan patterns with interior fill percentages (IFPs) set at 100%, for comparison with data obtained on control test pieces produced by IM. The deterioration observed in the tests varied according to the nozzle scan pattern used to print the test pieces. Flexural testing is another important method for the mechanical testing of materials, along with assessments of test piece failure. Yet few data have been reported on flexural tests to evaluate the deterioration of FFF-3D-printed PLA structures. The IFP is a major fabrication parameter, alongside the nozzle scan pattern, in FFF 3D printing. Experiments to compare the mechanical properties of test pieces produced by different IFPs and nozzle scan patterns are also furnishing useful data on how the responses of structures differ according to the load direction.
In this study we used uniaxial tensile tests and four-point flexural tests to evaluate the mechanical properties of a series of FFF-3D-printed test pieces formed from PLA. Most of the conditions used to prepare the test pieces were the same, the exceptions being the shapes, nozzle scan patterns, and IFPs. The structures were printed out using two different scan patterns, namely, in parallel with the longitudinal direction (P.) and cross-hatched at opposing diagonal angles to the longitudinal direction (C.) The IFPs were set at 100% and 80% for the test pieces printed by each scan pattern. The test pieces were immersed in saline for 30, 60, or 90 days. The following mechanical properties were examined: the maximum tensile or flexural stress, the tensile or flexural modulus, and the tensile or flexural breaking energy.
2. Materials and Methods
2.1. Test Piece Preparation
Two kinds of test pieces were prepared, one for tensile testing and the other for flexural testing. Figure 1a,b shows the shapes and dimensions of the test pieces. The tensile test piece (a) was formed in a flat-dumbbell shape and the flexural test piece (b) was rectangular. Both were designed with a square section (3 × 3 mm) around the breakage section. The dimensions of the tensile test piece were based on the ASTM D638 Type V standard, with two modifications: reduction of the width from 3.18 to 3.0 mm to unify the cross section with the flexural test piece, and reduction of the overall length from 63.5 mm to 30.0 mm to reduce the volume of the immersion solution. The model test pieces were designed on a three-dimensional computer-aided design (3D-CAD) system (AutoCAD, Autodesk Inc., Mill Valley, CA, USA) and the model data were output in a standard triangulated language (STL) format. All of the test pieces were composed of white, translucent, commercially available PLA (Waves, Osaka, Japan) with a filament diameter of 1.75 mm, and printed with an FFF 3D printer (Lepton2, MagnaRecta Inc., Tokyo, Japan) using slicing and controlling software (Simplify3D, Simplify3D LLC, Cincinnati, OH, USA). The nozzle diameter, nozzle scan speed, nozzle temperature, modeling stage temperature, test piece IFP, and layer thickness were set at φ0.4 mm, 480 mm/min, 200 °C, 70 °C, 100% or 80%, and 0.2 mm, respectively.
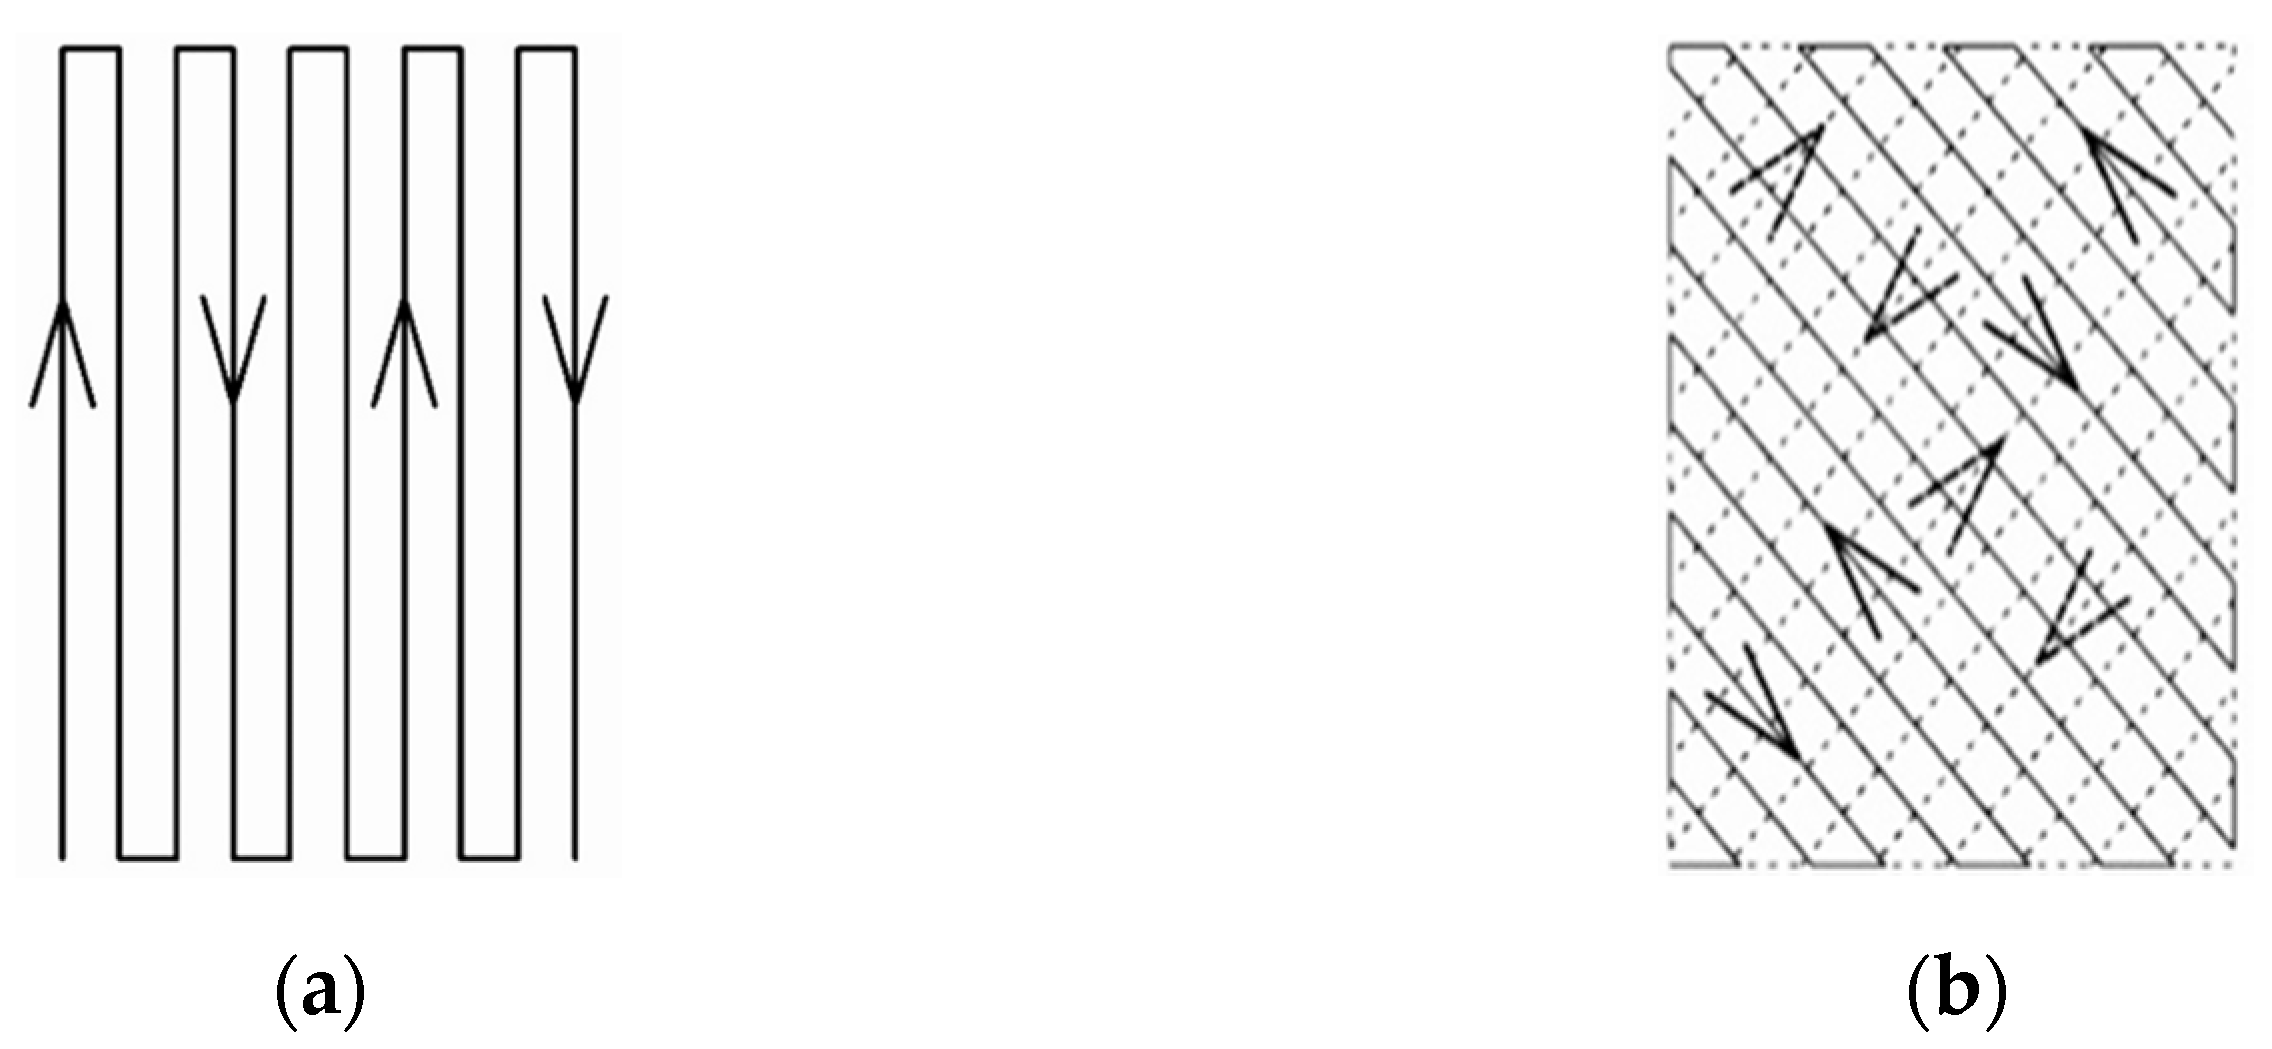
Figure 2 shows the two nozzle scan patterns used for the 3D printing. The first was a unidirectional pattern running in parallel with the longitudinal direction, and the second was a bidirectional pattern cross-hatched at opposing diagonal angles to the longitudinal direction [28]. In this paper we define P.100% as the P. test piece printed with an IFP of 100%, and apply corresponding definitions to P.80%, C.100%, and C.80%. The test pieces were fabricated in a room maintained at room temperature (R.T.) (22–25 °C) and then weighed with an electronic balance.
2.2. Test Piece Immersion in Saline Solution
All of the test pieces but those used for the non-immersed test were immersed in solution before the strength tests. Each test piece was immersed in a small styrene case containing 8 mL of saline (0.9% NaCl) set within an incubator at a constant temperature of 37 °C for 30, 60, or 90 days. After incubation, the test piece was wiped free of moisture and dried in a vacuum pump for 5 min. to obtain a stable dry condition [28].
2.3. Strength Test
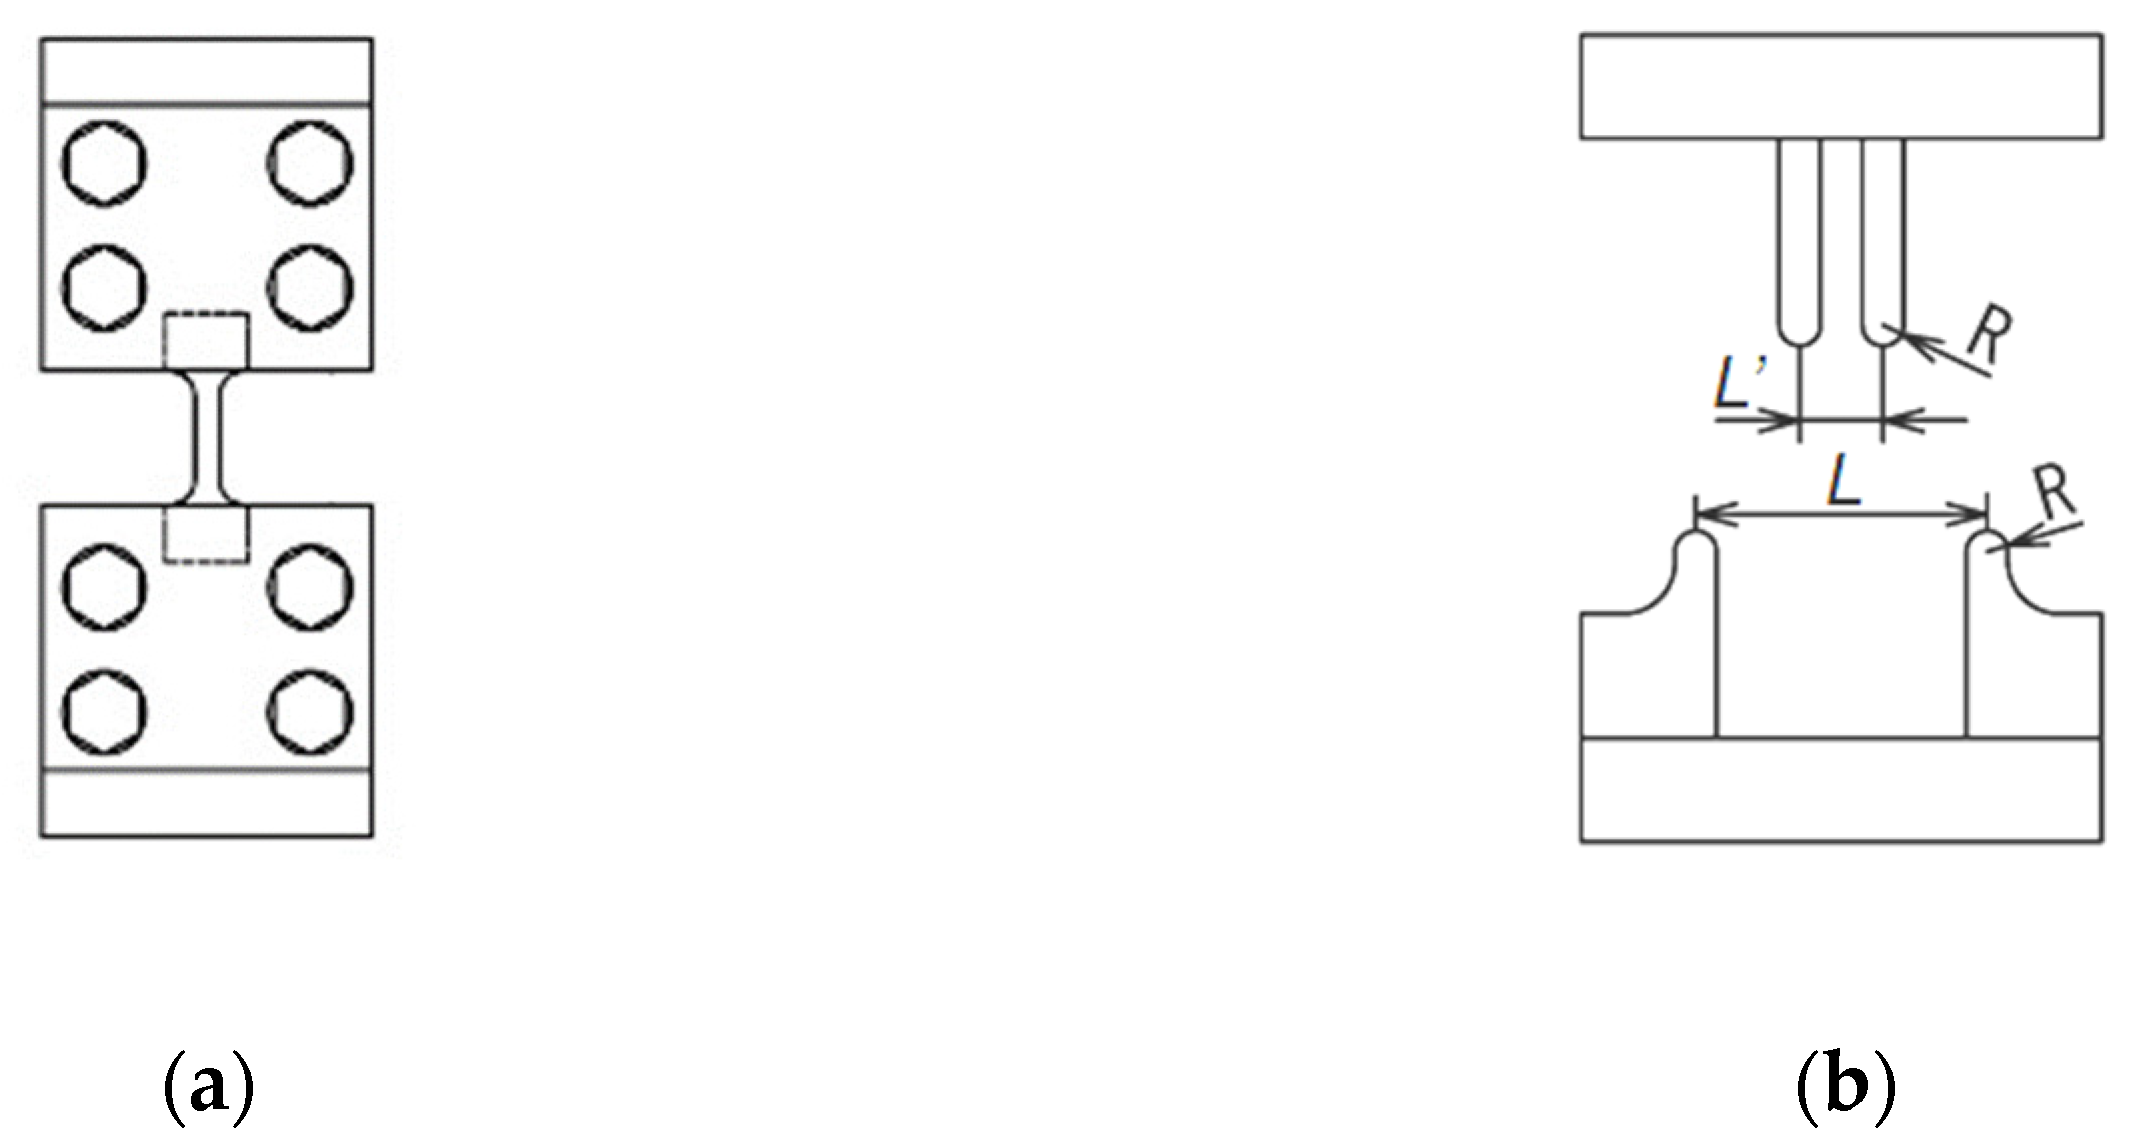
The mechanical properties of interest were examined by two test methods, a uniaxial tensile test and a four-point flexural test, using a universal testing machine (EZ-Graph, Shimadzu Corp., Kyoto, Japan) (Appendix A). The loads were measured with a 5 kN load cell (Teada-Huntleigh, Model 615, VPG Transducers, Hampshire, UK). Figure 3 shows the shapes of the testing jigs, both of which were specially manufactured by our group. L and L′ in Figure 3b represent the fulcrum distance (28 mm) and indenter distance (8 mm) of the flexural test jig, respectively, and R is the radius of curvature (2 mm). The crosshead moving speed in the tensile test and flexural test was set at 1.2 mm/min. for each load direction. A moving limit of 7 mm was set for the head of the 3 mm thick test piece in the flexural test jig. The tensile test and flexural test were both performed at R.T. The strength of the non-immersed test piece was measured within 12 h of the test piece printing.
The mechanical properties of each test piece were calculated by the following formulas [43,44,45].
where σT is the tensile stress (MPa), P is the test load (N), A is the outer cross-sectional area of the test piece (mm2), b and h are the width (mm) and thickness (mm) of the tensile test piece measured before the strength test, ET is the tensile elastic modulus (GPa), εT is the strain in the tensile test (−), δ is the displacement of the crosshead (mm), l0 is the gauge length (10 mm), UT is the tensile breaking energy (MJ/m3), εTb is the breaking strain in the tensile test (−), σF is the flexural stress (MPa), b’ and h’ are the width (mm) and thickness (mm) of the flexural test piece measured before the strength test, EF is the flexural elastic modulus (GPa), εF is the deflection rate in the flexural test (−), UF is the flexural breaking energy (MJ/m3), and εTσmax is the deflection rate at maximum flexural stress. For the flexural tests, we defined a deflection rate, εF, as Equation (7). The breaking energy of the flexural test was calculated by integrating the flexural stress with respect to the deflection rate from zero to the maximum stress at which structurally stable deformation is maintained in the region [44,45]. The deflection rate expresses a slope of the test piece deflection, or the steepness of the deflection, in response to loading.
The dimensions of the test piece were measured immediately before the strength test to derive accurate values of the mechanical properties. The b and h were measured at three points within the gauge length, and the cross-sectional area of the outer shape was calculated from the width and thickness closest to the fractured part. The b’ and h’ were measured at the central portion, and the cross-sectional area of the outer shape was calculated from the measured values. The maximum tensile and flexural stresses were the highest points on the stress–strain curve and stress–deflection rate curve, respectively. The maximum stress was considered to be the strength determined by the test method. ET was calculated from the slope by the least-squares approximation in the strain range of 2.2–2.5% of the stress–strain curve. For the testing of the immersed test piece, the maximum stresses in the tensile and flexural tests were compared by the values divided by the averaged maximum tensile and flexural stresses of the non-immersed test pieces, respectively. ET and EF were compared by the values divided by the ET and EF of the non-immersed test pieces of the same test piece type, respectively.
3. Results
3.1. Test Pieces
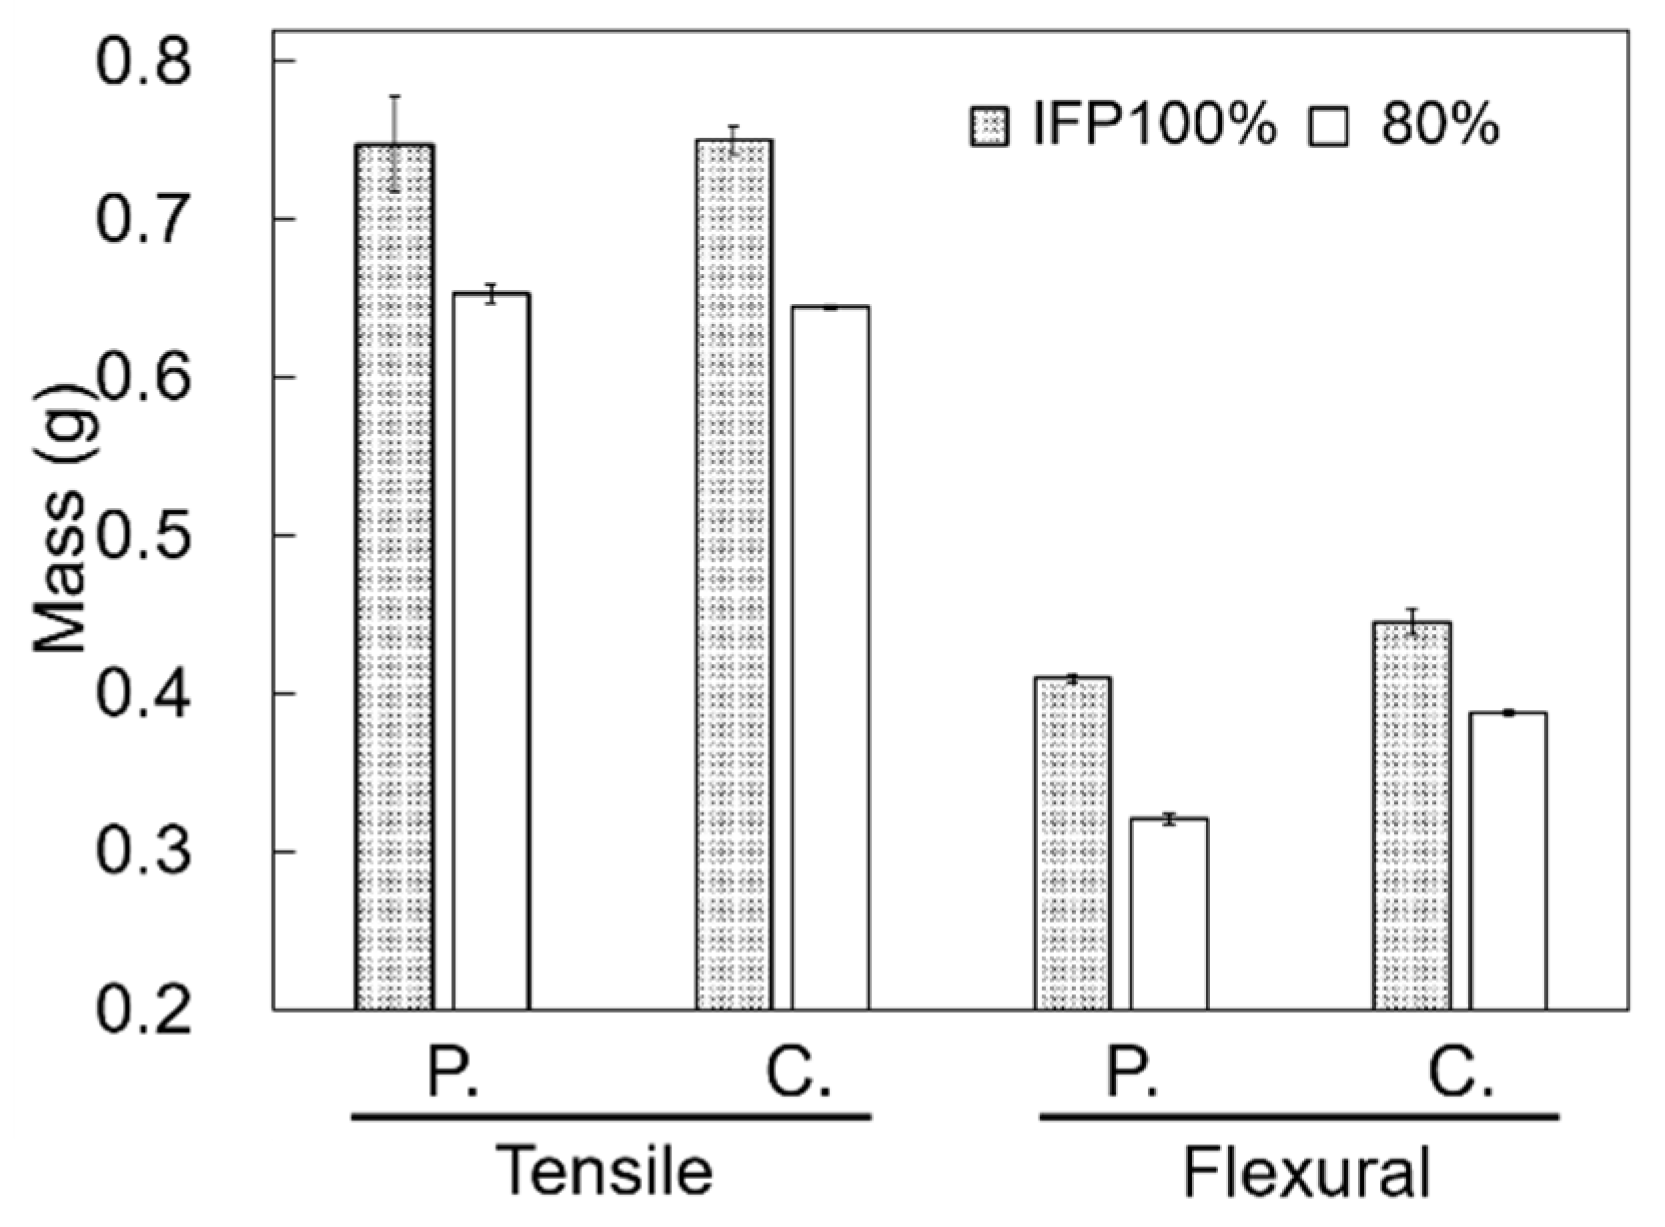
Figure 4 shows photographs of the tensile test pieces (upper row (a)) and flexural test pieces (lower row (b)). The convex patterns on the test piece surfaces vary according to the nozzle scanning direction and IFP. Figure 5 compares the average masses of non-immersed test pieces. The average masses of the tensile test pieces were P.100%, 0.748 [28]; P.80%, 0.653; C.100%, 0.750 [28]; and C.80%, 0.644 g. When the IFP was decreased from 100% to 80%, the masses of the tensile test pieces P. and C. decreased by 21.8% and 13.0%, respectively. The average masses of the flexural test pieces were P.100%, 0.410; P.80%, 0.321; C.100%, 0.445; and C.80%, 0.388 g. With same reduction in the IFP, from 100% to 80%, the masses of the flexural test pieces P. and C. decreased by 12.7% and 14.1%, respectively.
3.2. Stress-Strain Curves and Stress-Deflection Rate Curves
Figure 6 shows representative changes in the stress–strain curves obtained from the tensile tests in saline. The curves of the non-immersed (0 days) test pieces reached the maximum stress with increased strain, then decreased gradually (a–d). The non-immersed P. test pieces broke at large strain (P.100%; 236% and P.80%; 45.8%) (e). In the non-immersed tests, the breaking energies of the P. test pieces were larger than those of the C. test pieces (ab–cd). The breaking energies of test pieces P. and C. changed differently in response to the immersion, with that of P. decreasing sharply as the immersion period increased, and that of C. hardly changing (a–d).
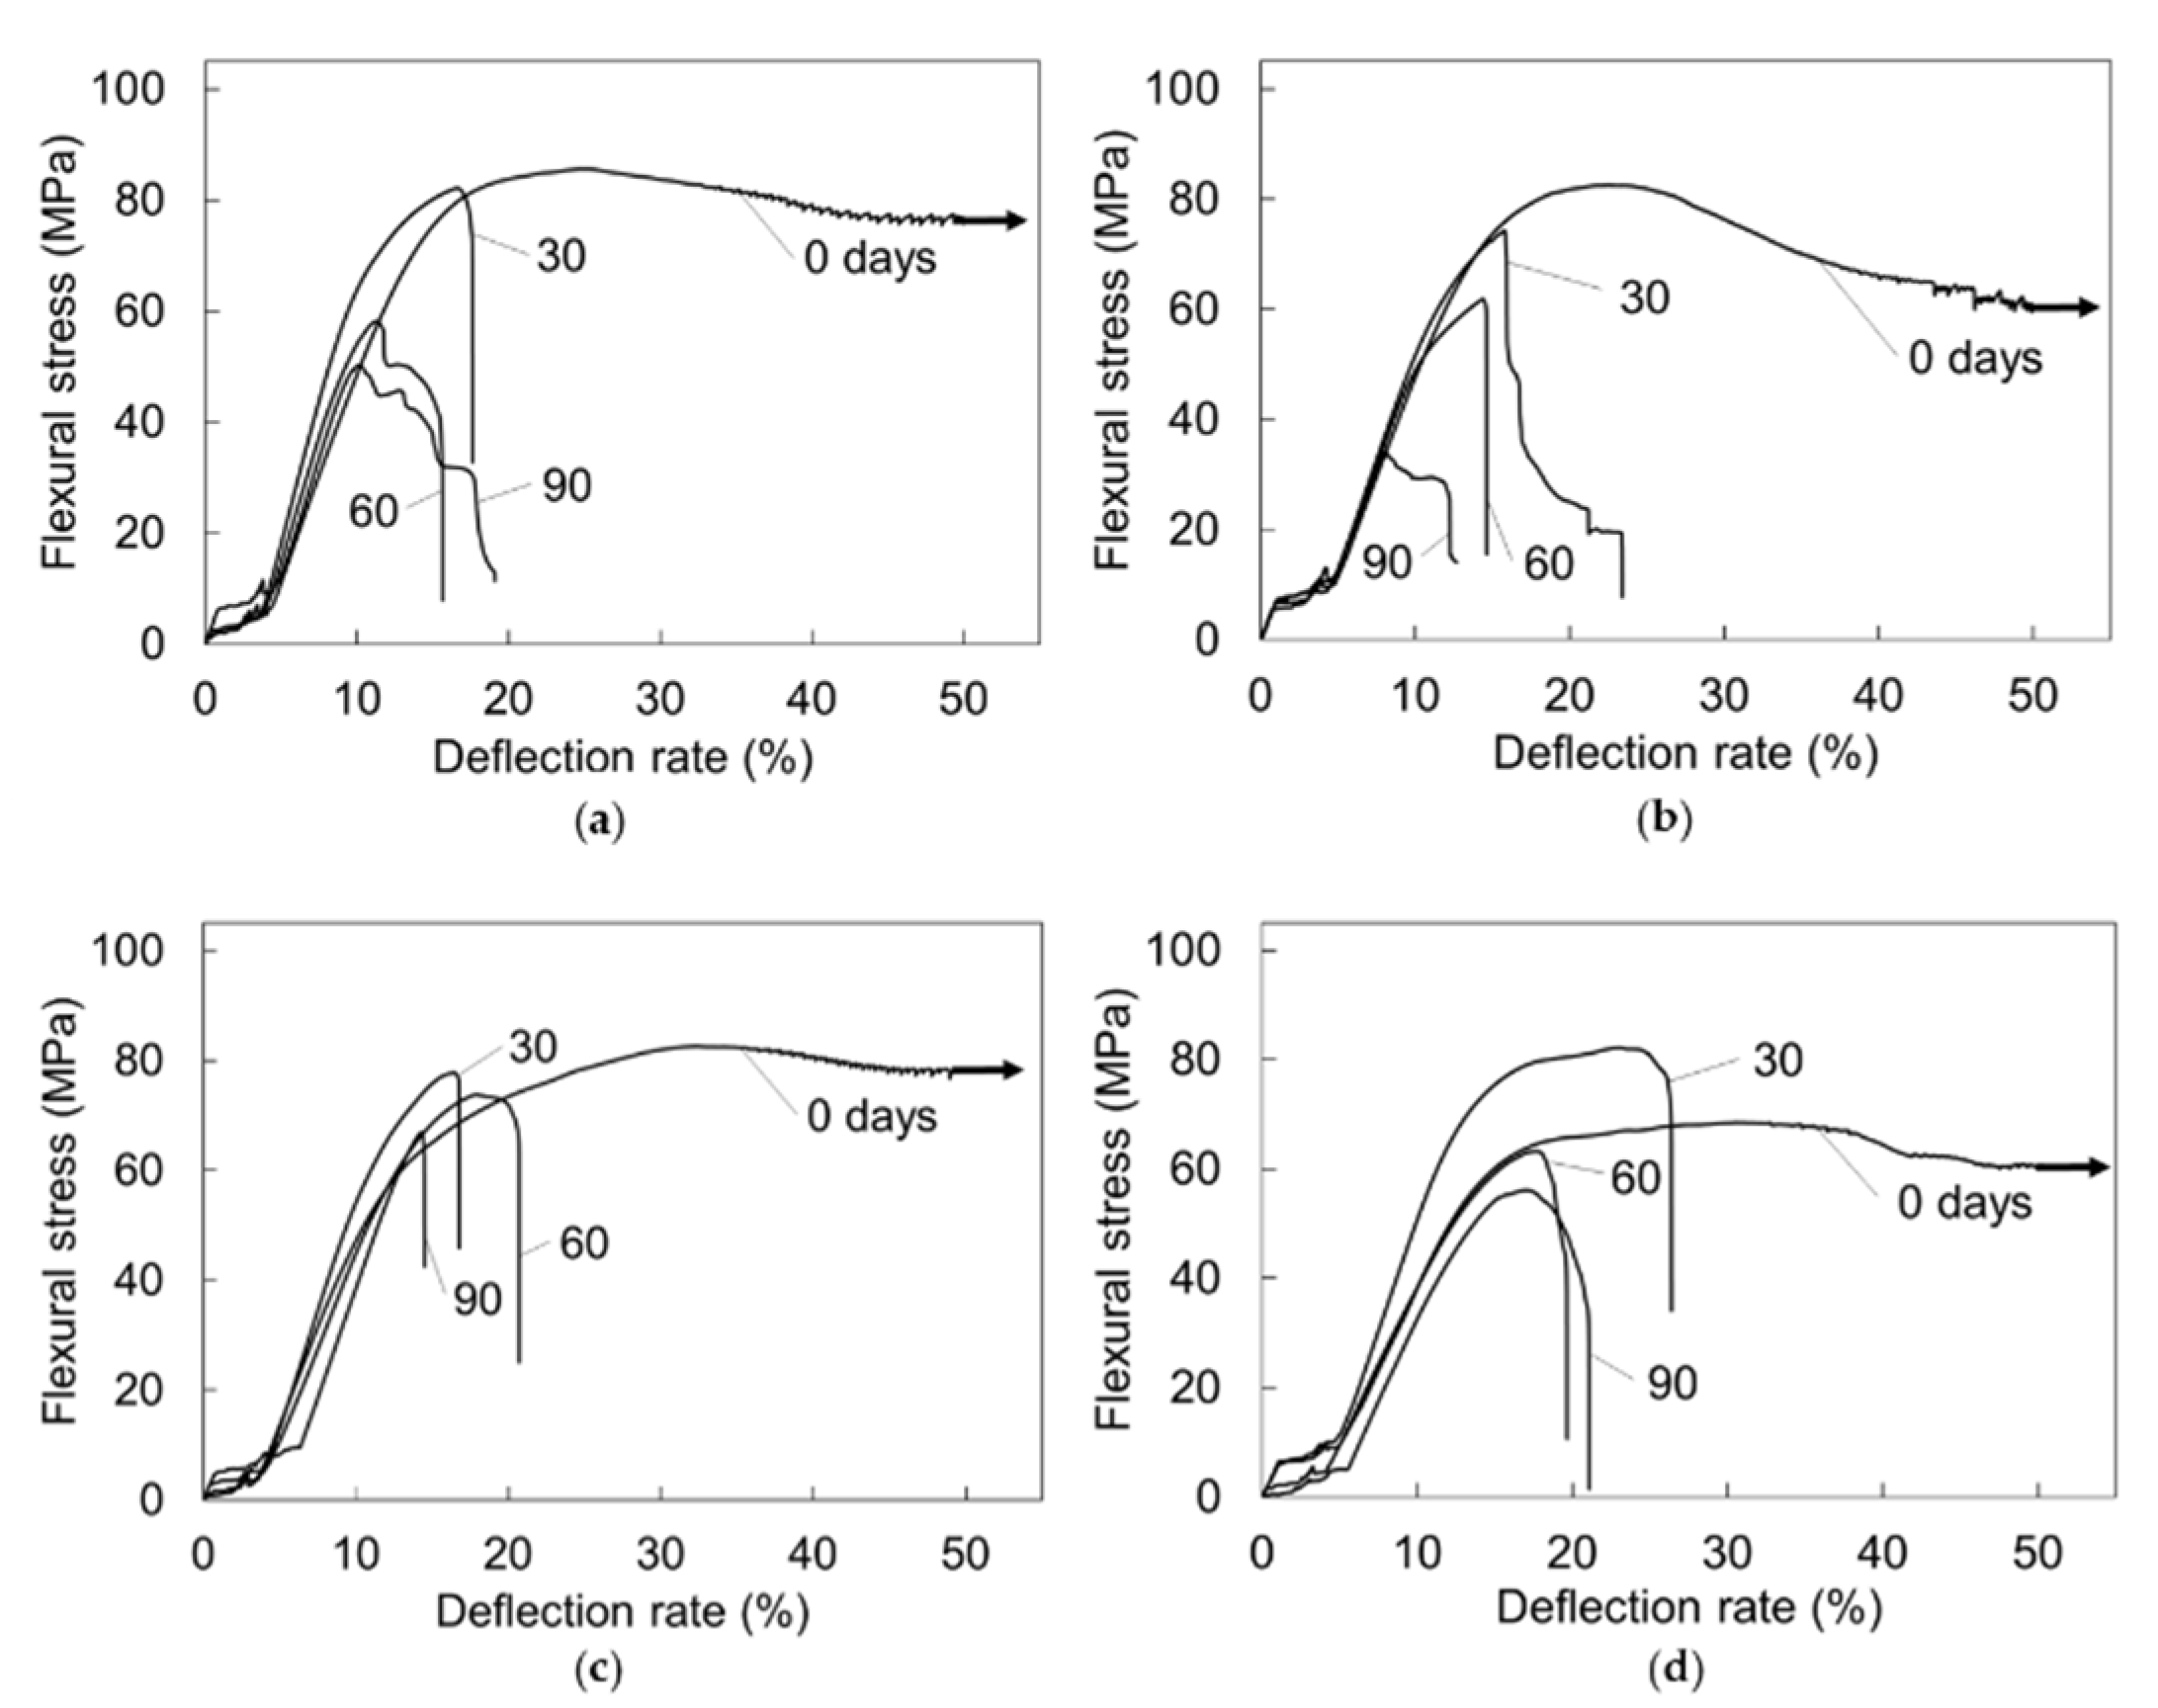
Figure 7 shows representative changes of the stress–deflection rate curves obtained in the flexural tests in response to immersion. The curves of the non-immersed test piece increased to the maximum stress with increased deflection, then slowly decreased (a–d). The non-immersed test pieces did not reach breaking point at a deflection rate of 50%, a level of deflection corresponding to a moving range of 7 mm (a–d). The maximum flexural stress of the P. test pieces decreased sharply as the immersion period increased (a,b). The non-immersed C.80% test piece showed the smallest maximum flexural stress among the four non-immersed test pieces examined (a–d). The C. test pieces showed greater declines in both maximum flexural stress and breaking energy than the P. test pieces (a–d).
3.3. Non-Immersion Test
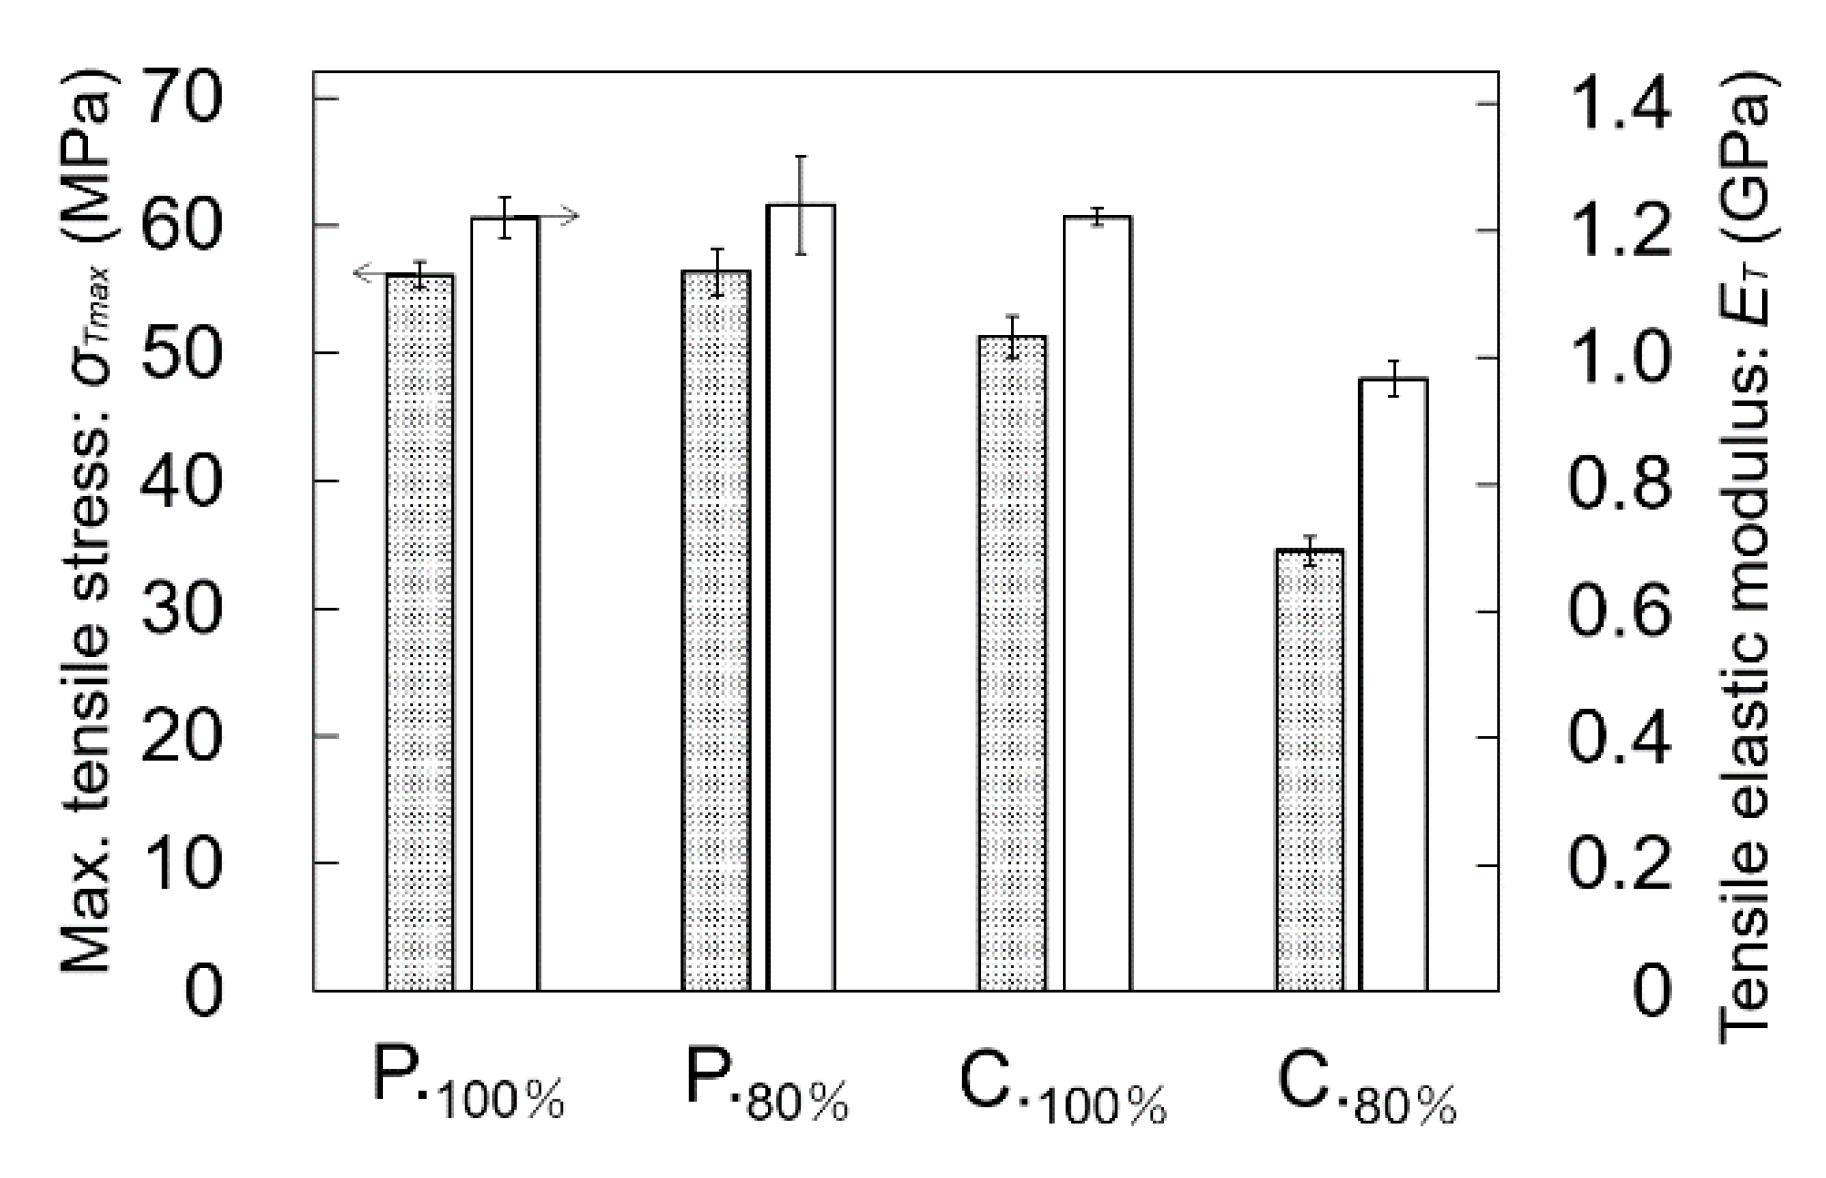
Figure 8 shows the maximum tensile stresses and tensile elastic moduli of the four types of non-immersed test pieces examined. The average maximum tensile stresses were P.100%, 56.1 [28]; P.80%, 56.4; C.100%, 51.3 [28]; and C.80%, 34.5 MPa. The maximum stress of P.80% was almost equal to that P.100%. C.80% had the smallest maximum stress among the non-immersed test pieces. The maximum stress of C.80% was 32.7% lower than that of C.100%. The average tensile elastic moduli were P.100%, 1.22 [28]; P.80%, 1.24; C.100%, 1.22 [28]; and C.80%, 0.97 GPa. The elastic modulus of P.80% was almost equal to that P.100%. The elastic modulus of C.80% was 20.5% lower than that of C.100%.
Figure 9 shows the maximum flexural stresses and flexural elastic moduli of the four types of non-immersed test pieces examined. The average maximum stresses were P.100%, 81.2; P.80%, 78.1; C.100%, 80.7; and C.80%, 69.9 MPa. The maximum stress of P.80% was almost equal to that of P.100%. The maximum stress of C.80% was 13.4% lower than that C.100%. The average flexural elastic moduli were P.100%, 2.87; P.80%, 2.77; C.100%, 2.48; and C.80%, 2.28 GPa. The elastic modulus of P.80% was nearly equal to that of P.100%. The elastic modulus of C.80% was 7.85% lower than that of C.100%.
3.4. Immersion Test
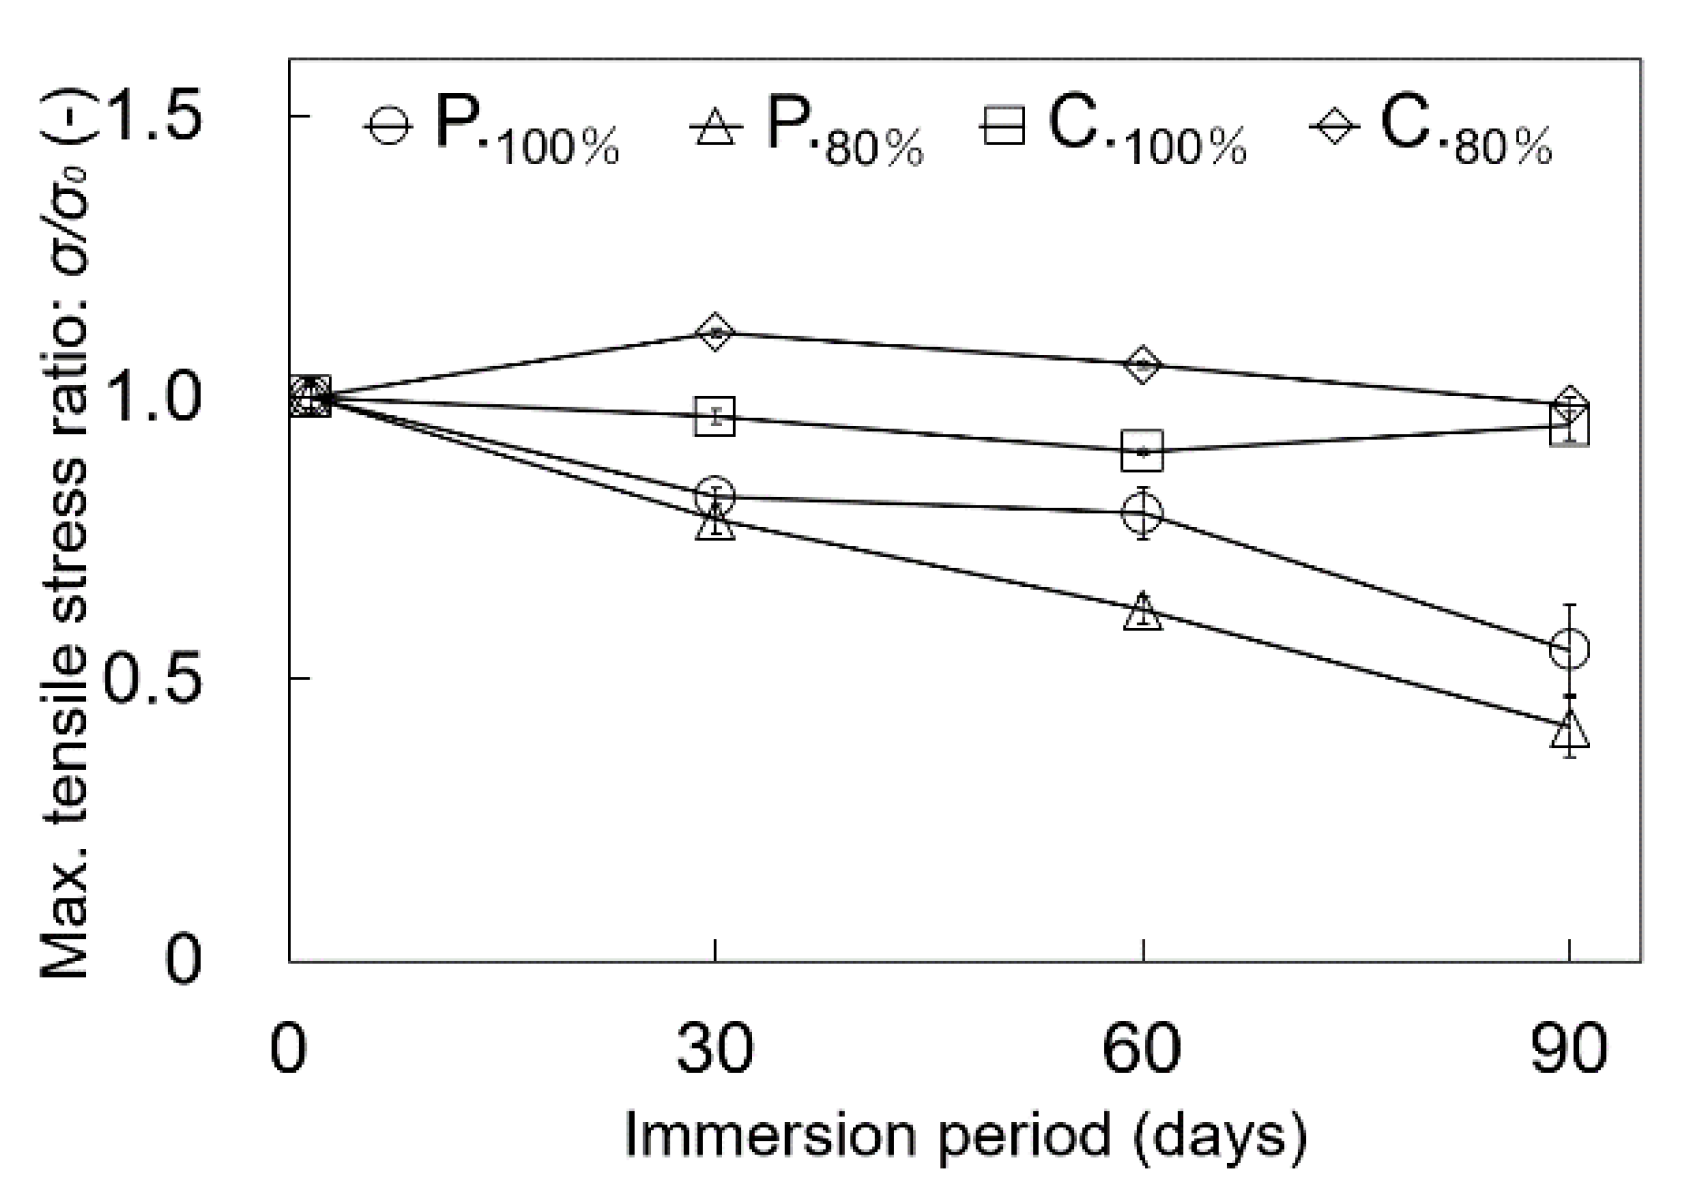
Figure 10 compares the changes of the average maximum tensile stresses of the four test piece types after immersion for sequentially increased periods. After 30 days of immersion, the changes of the maximum tensile stresses were P.100%, −17.6%; P.80%, −21.7%; C.100%, −3.47%; and C.80% +11.5%. After 60 days, the changes of the maximum stresses were P.100%, −20.6%; P.80%, −37.8%; C.100%, −9.67%; and C.80%, +5.82%. After 90 days, the changes were P.100%, −44.8%; P.80%, −58.5%; C.100%, −5.07%; and C.80%, −1.28%. The maximum stresses of the P. test pieces gradually decreased over the 90 days of immersion, while the maximum stress of the C. test pieces hardly changed.
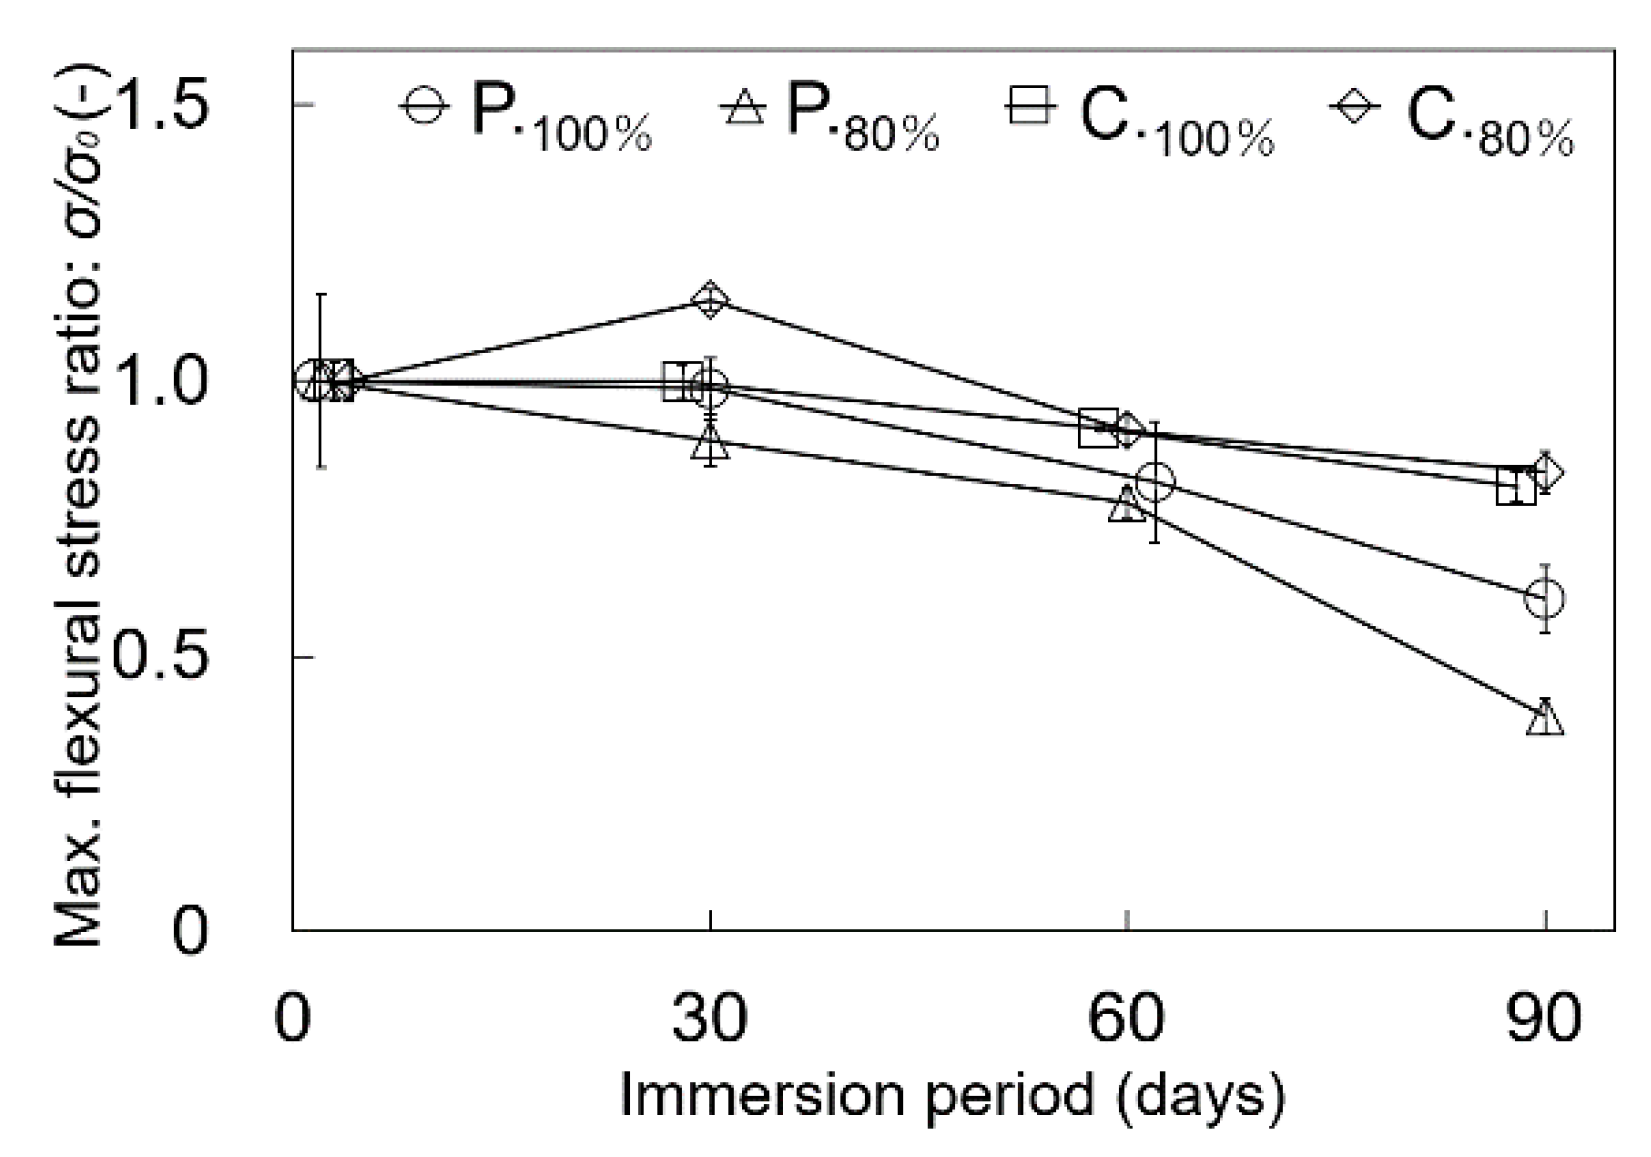
Figure 11 compares the changes of the average maximum flexural stresses of the four test piece types after immersion for sequentially increased periods. After 30 days of immersion, the changes of the maximum flexural stresses were P.100%, −1.50%; P.80%, −10.9%; C.100%, −0.18%; and C.80%, +14.7%. After 60 days, the changes were P.100%, −18.5%; P.80%, −22.1%; C.100%, −8.68%; and C.80%, −9.04%. After 90 days, the changes were P.100%, −39.7%; P.80%, −60.8%; C.100%, −19.2%; and C.80%, −16.6%. The maximum flexural stresses of all of the test piece types declined after 90 days of immersion, with those of the P. test pieces dropping steeply.
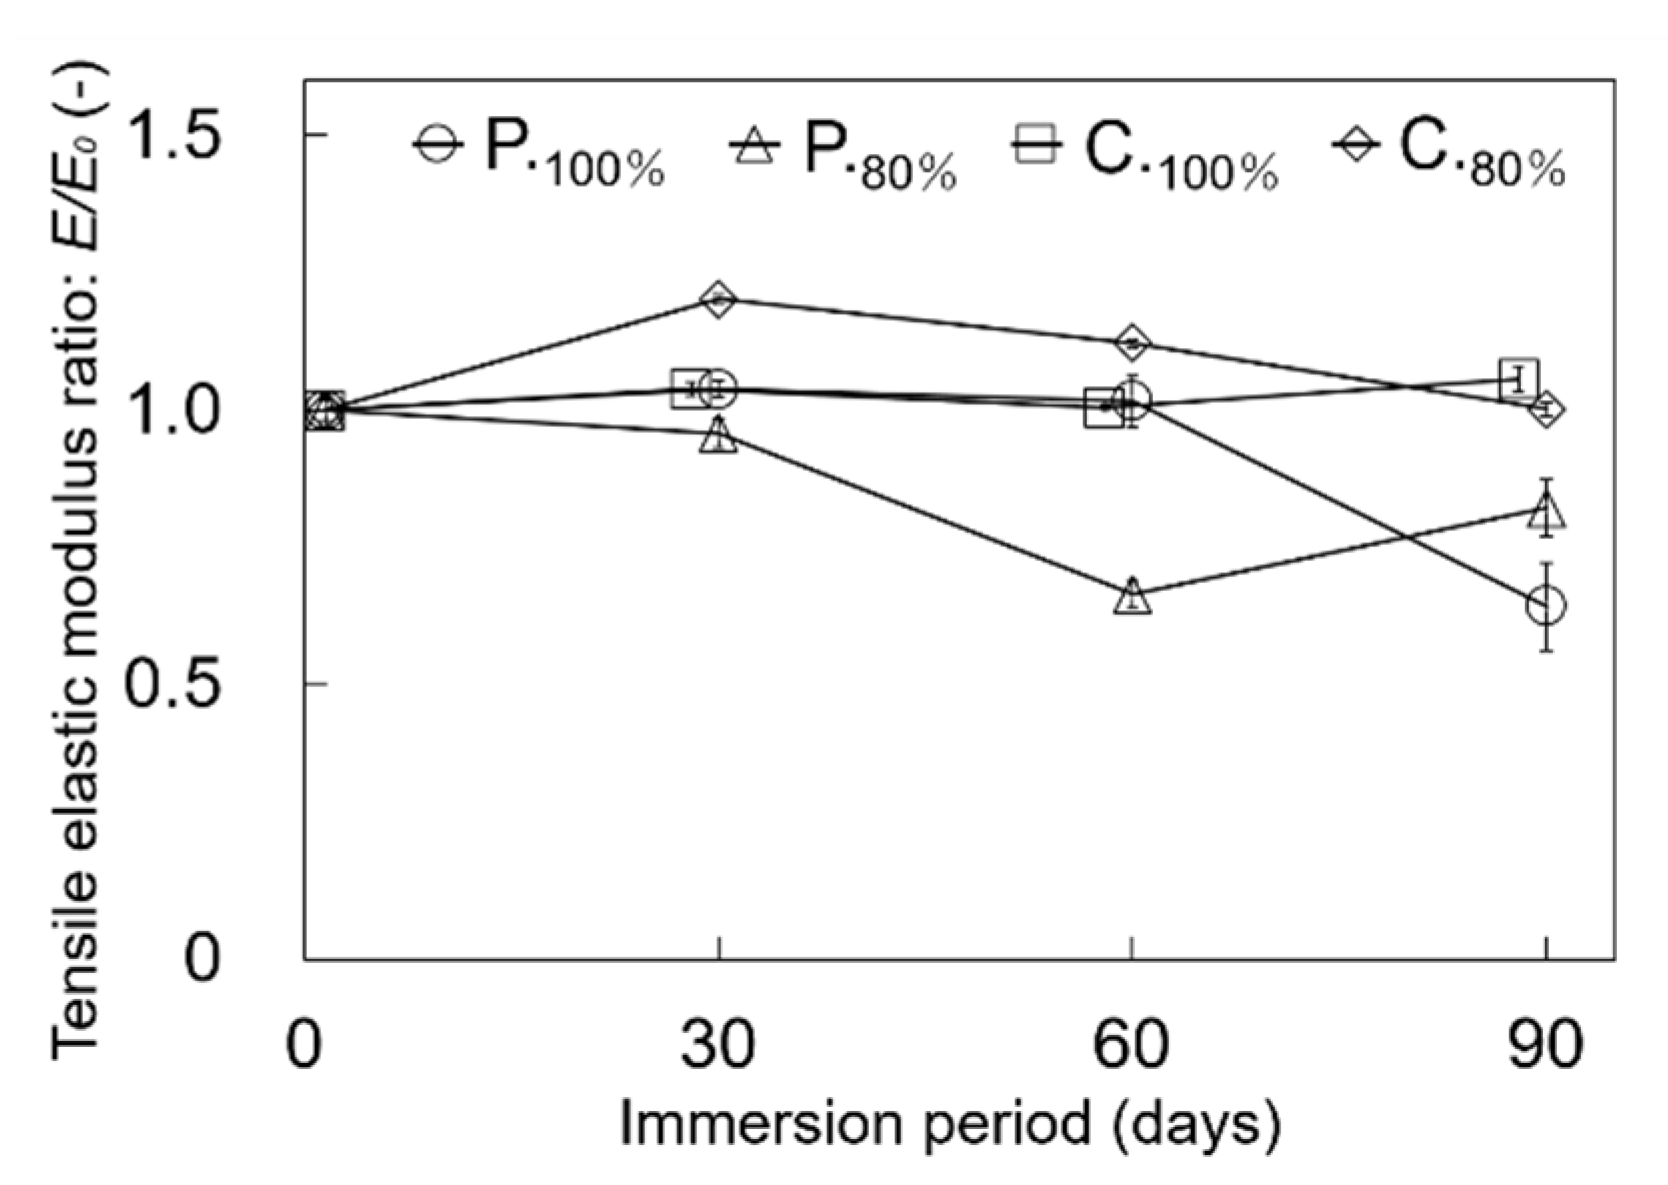
Figure 12 compares the changes of the average tensile elastic moduli of the four test piece types after immersion for sequentially increased periods. After 30 days of immersion, the changes of the elastic moduli were P.100%, +3.77%; P.80%, −4.27%; C.100%, −3.77%; and C.80%, +20.2%. After 60 days, the changes were P.100%, +1.64%; P.80%, +33.6%; C.100%, +0.41%; and C.80% +12.2%. After 90 days, the changes were P.100%, −35.8%; P.80%, −17.8%; C.100%, +5.58%; and C.80%, +0.13%. The elastic moduli of the P. test pieces decreased over the 90 days of immersion, while the moduli of the C. test pieces hardly changed. The tensile elastic modulus of the C.80% test piece temporally rose after 30 days of immersion.
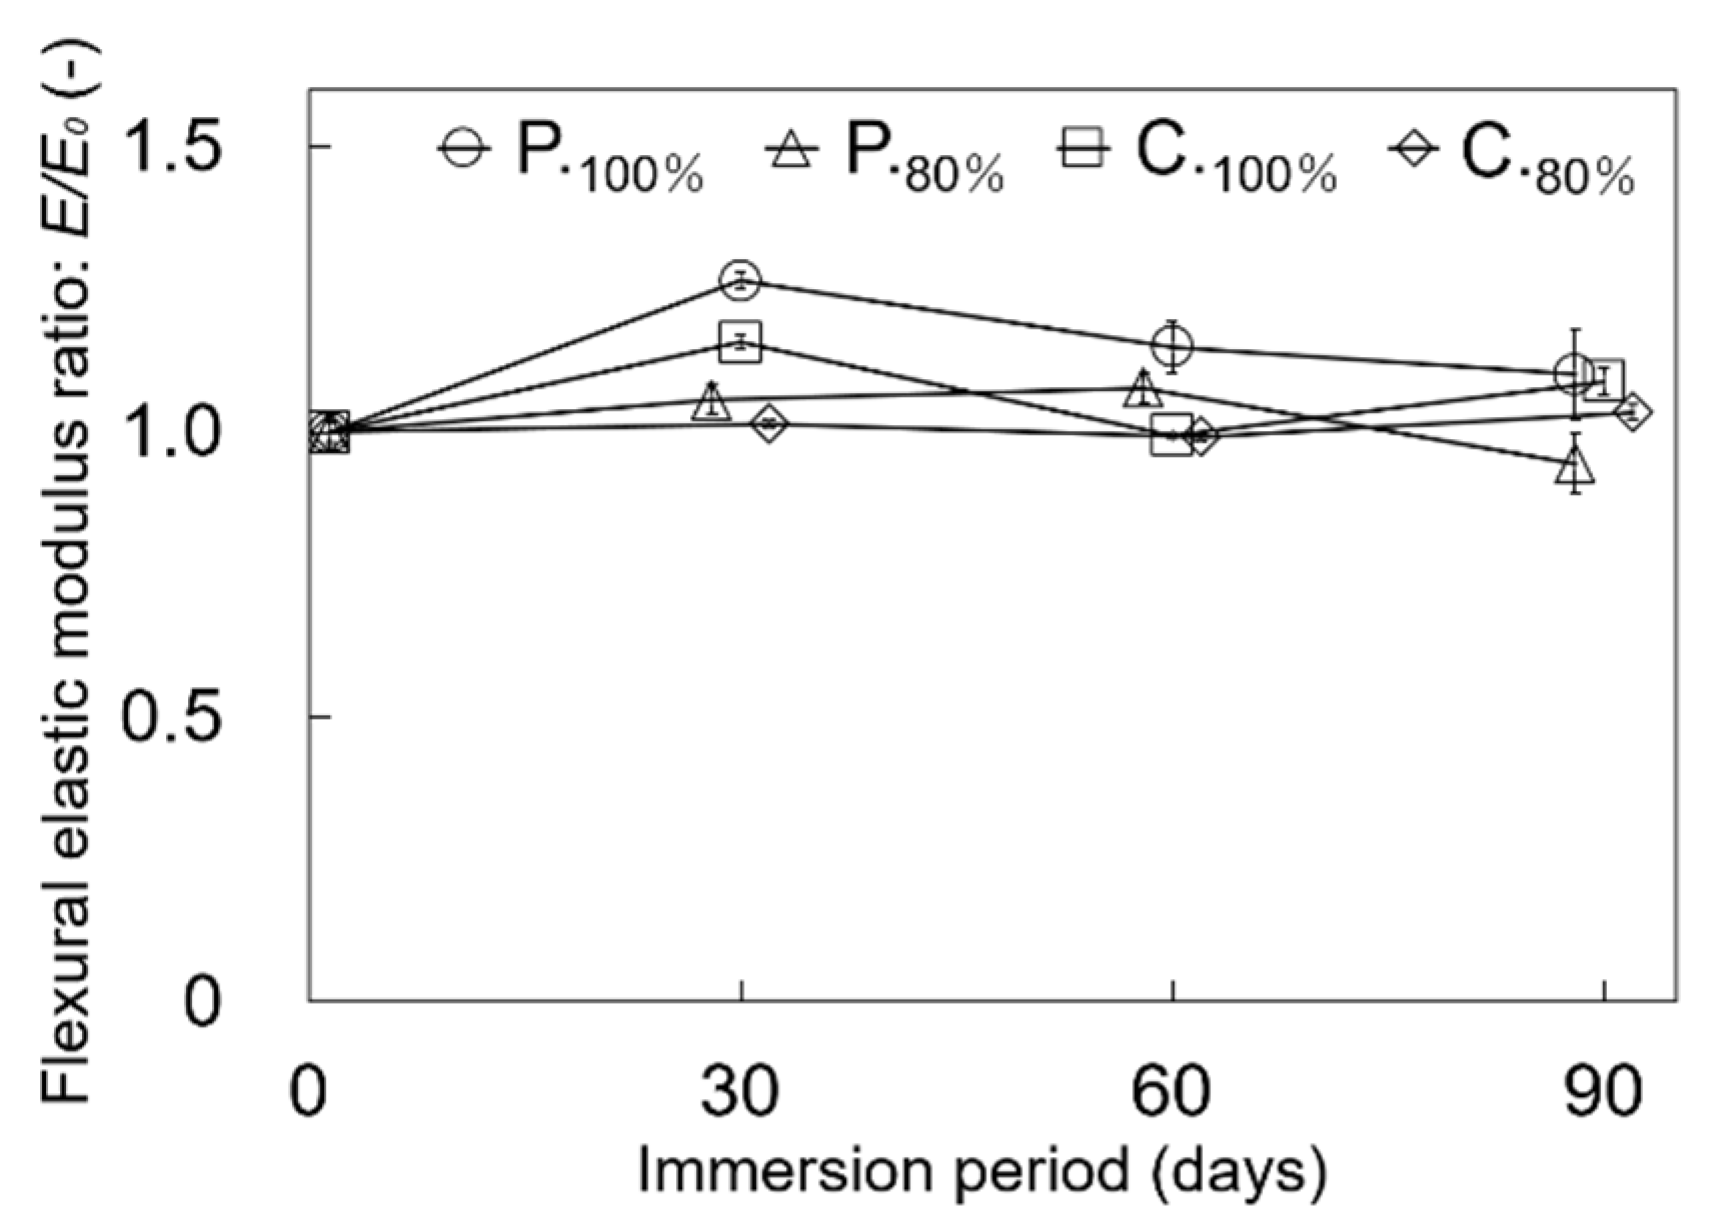
Figure 13 compares the changes of the average flexural elastic moduli of the four test piece types after immersion for sequentially increased periods. After 30 days of immersion, the changes of the elastic moduli were P.100%, +26.6%; P.80%, +5.67%; C.100%, +15.8%; and C.80% +1.40%. After 60 days, the changes were P.100%, +14.9%; P.80%, +7.71%; C.100%, −0.62%; and C.80%, −0.85%. After 90 days, the changes were P.100%, +10.1%; P.80%, −5.48%; C.100%, +8.93%; and C.80%, +3.43%. The flexural elastic moduli fluctuated within a range of about 27%.
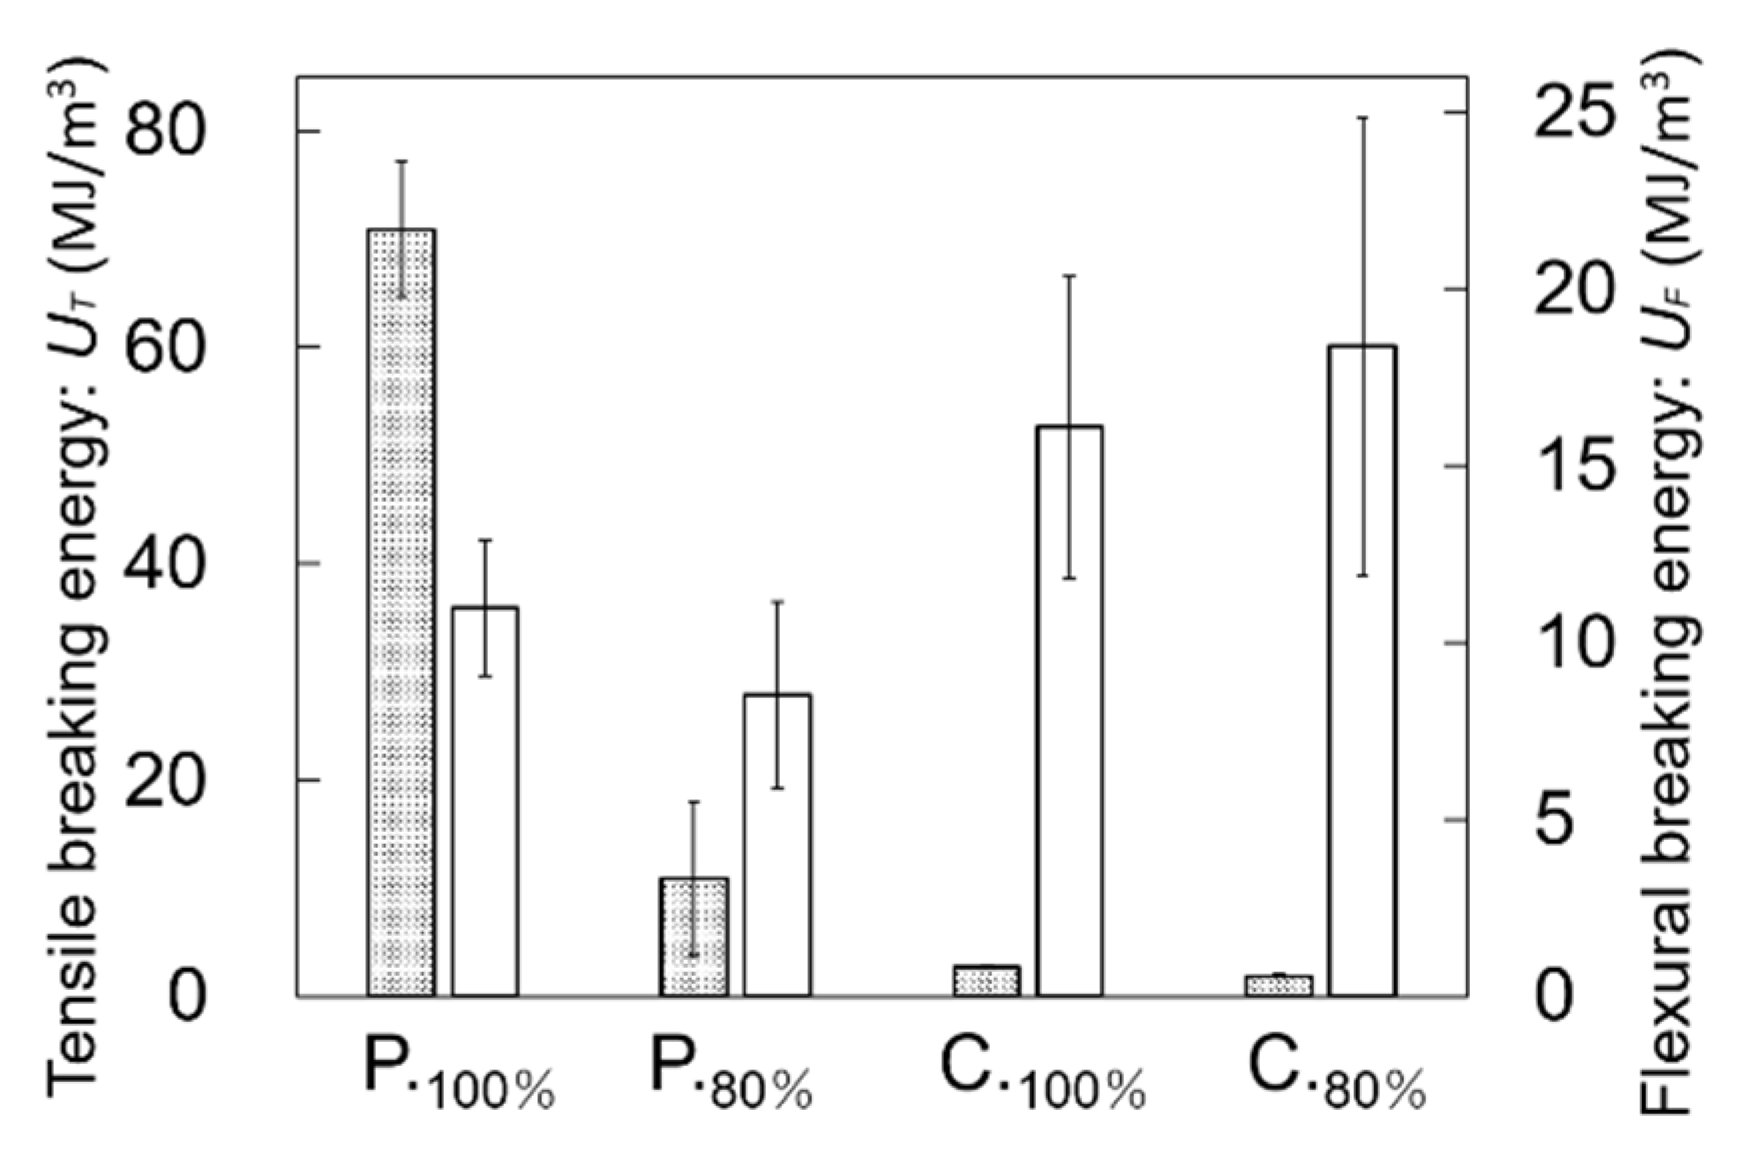
Figure 14 shows the average tensile breaking energies and flexural breaking energies of the non-immersed test pieces. The tensile breaking energies were P.100%, 70.90; P.80%, 10.84; C.100%, 2.72; and C.80%, 1.87 MJ/m3. The flexural breaking energies were P.100%, 10.99, P.80%, 8.53; C.100%, 16.10; and C.80%, 18.37 MJ/m3.
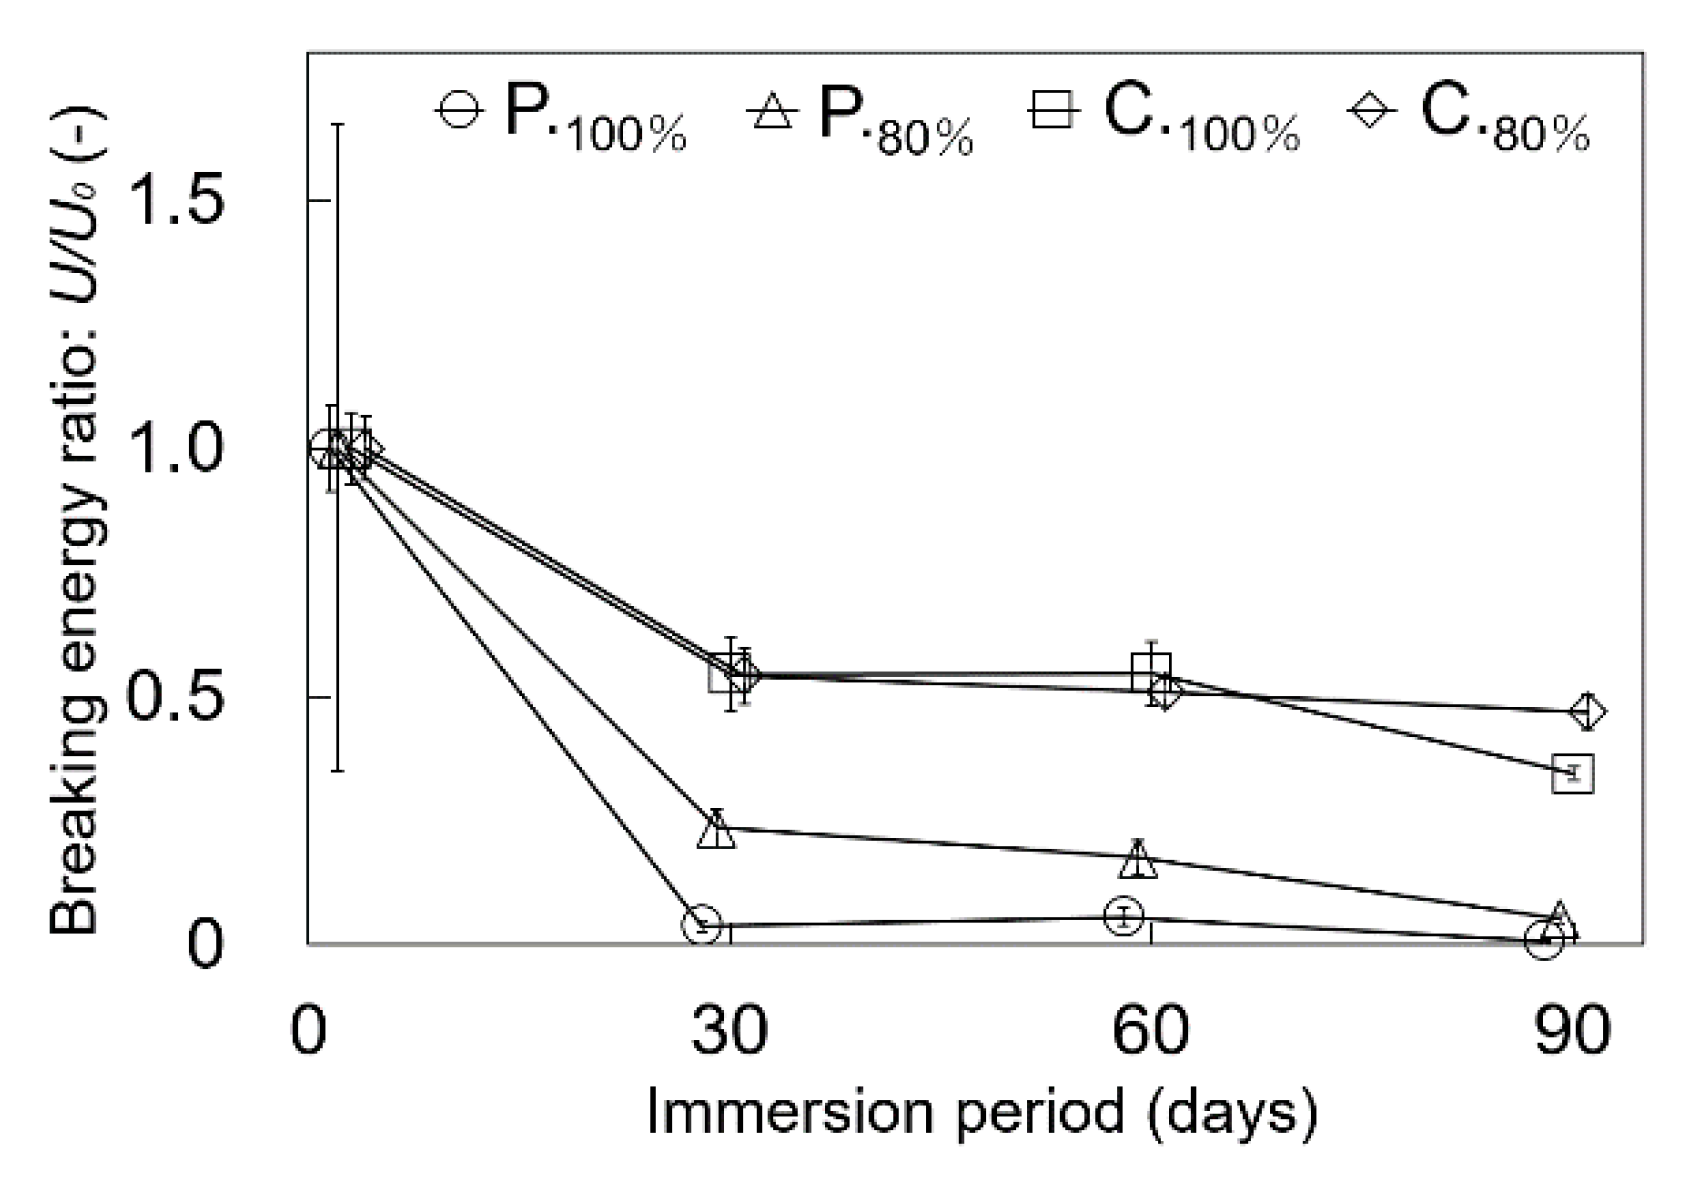
Figure 15 compares the changes of the tensile breaking energies of the four test piece types after immersion for sequentially increased periods. After 30 days of immersion, the changes of the breaking energies were P.100%, −96.3%; P.80%, −76.5%; C.100%, −45.6%; and C.80%, −45.8%. After 60 days, the changes were P.100%, −94.5%; P.80%, −82.5%; C.100%, −45.5%; and C.80%, −49.1%. After 90 days, the changes were P.100%, −99.3%; P.80%, −94.8%; C.100%, −65.6%; and C.80% −53.1%. The breaking energies of the P. test pieces showed more pronounced changes than the breaking energies of the C. test pieces.
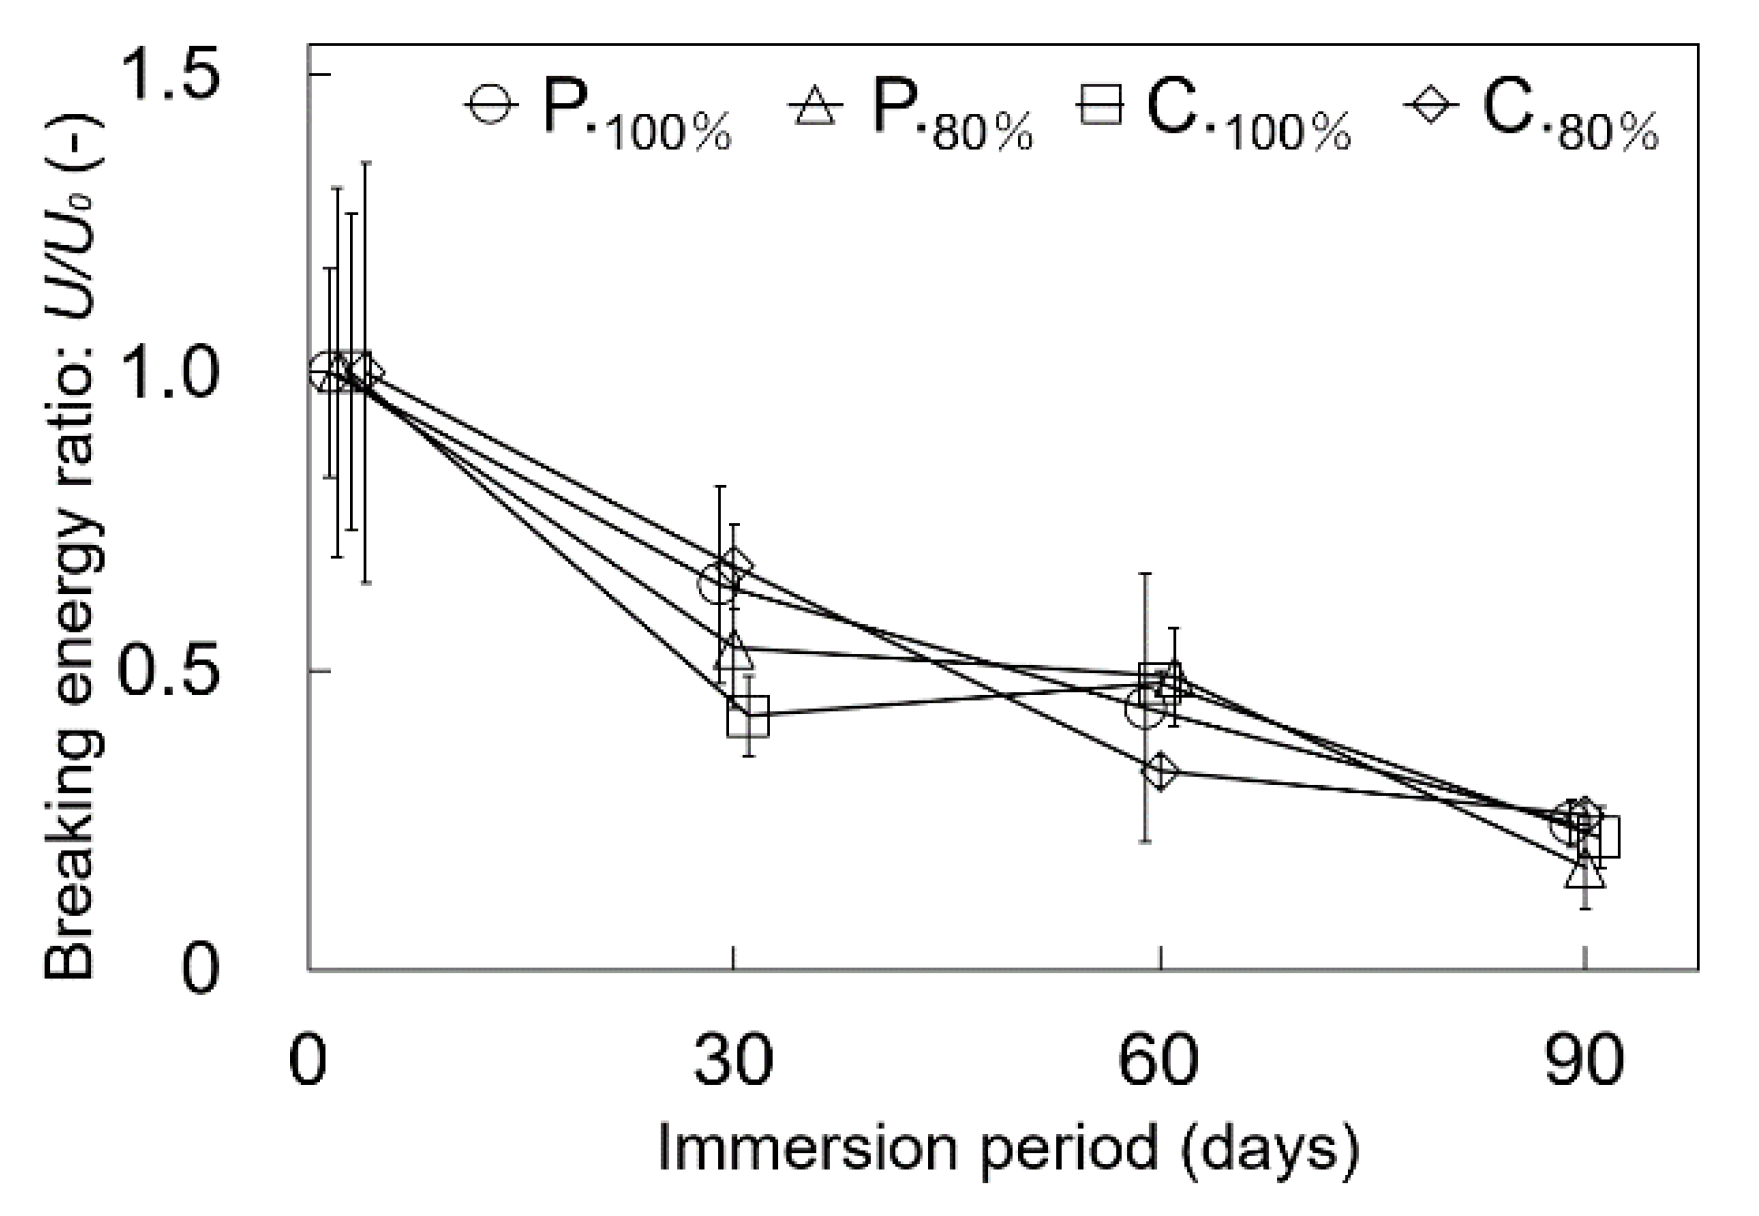
Figure 16 compares the changes of the flexural breaking energies of the four test piece types after immersion for sequentially increased periods. After 30 days of immersion, the changes of the breaking energies were P.100%, −35.5%; P.80%, −46.1%; C.100%, −57.5%; and C.80%, −32.4%. After 60 days, the changes were P.100%, −56.2%; P.80%, −50.9%; C.100% −52.1%; and C.80%, −66.7%. After 90 days, the changes were P.100%, −75.5%; P.80%, −82.8%; C.100%, −77.9%; and C.80%, −74.2%. The immersion reduced the breaking energies of all of the test piece types in the flexural stress test.
4. Discussion
In this research we analyzed how the mechanical properties of FFF-3D-printed PLA structures deteriorated by immersion in solution, and how the deterioration evaluated by tensile testing differed from that evaluated by flexural testing. We did so by printing comparable test pieces for evaluation by the two testing tests and treated them by identical methods. We then investigated how major fabrication parameters such as the nozzle scan pattern and IFP affected the differences found in the mechanical properties. To our knowledge, no earlier reports comparing the abovementioned conditions have been published. In this discussion we focus on the details of the data obtained from the two mechanical tests.
4.1. Analysis of Mechanical Properties by Tensile Testing and Flexural Testing
Tensile and flexural testing are basic test methods to assess mechanical properties such as maximum stress, elastic modulus, yield stress, breaking strain, and breaking energy. We know that flexural testing data form an unreliable basis for decisions on design parameters with polymeric materials, as the mechanical equations require distinct geometric assumptions that easily compromise accuracy. The flexural test, however, is an important step to determine the relative relation of the flexural parameter itself and the relation between the flexural parameter and parameter obtained by the tensile test. In this research we printed two types of test pieces with cross sections of the same size (3 × 3 mm), one for the tensile testing (Figure 1a; Figure 4, row(a)) and the other for the flexural testing (Figure 1b; Figure 4, row(b)), to keep the test conditions as similar as possible for better comparability.
4.2. Mechanical Properties of the Non-Immersed Test Pieces
The maximum tensile stress of the P.100% test piece shown in Figure 8 (56 MPa) agreed well with the maximum tensile stresses of the FFF-3D-printed test pieces [28,33] and IM test pieces [7,16,17]. The maximum flexural stress of the P.100% test pieces shown in Figure 9 (81 MPa) was within a proper range compared with the maximum flexural stresses of previously reported test pieces formed by IM [16].
The average maximum stress of the P.80% test piece was almost equal to that of P.100% in both tensile and flexural testing (Figure 8 and Figure 9). In contrast, the maximum stress of C.80% was clearly lower than that of C.100% in tensile testing and slightly lower than that of C.100% in flexural testing. On the other hand, the masses of the both the scan pattern P. and C. test pieces shown in Figure 5 decreased by at least 12.7%. From the masses of the test pieces shown in Figure 5, we can surmise that the actual IFPs almost matched the values set in the software, 100% and 80%. These findings indicate, for reasons that have yet to be explained, that we can obtain equal strength with 20% less material in structures printed by scan pattern P.
The average maximum tensile stress of C.80% was 32.7% lower than that of C.100% (Figure 8), while the average flexural strength of C.80% was 13.4% lower than that of C.100% (Figure 9). We can infer that the decreased IFP reduced the tensile strength more than it reduced the flexural strength in the C. test pieces.
From the stress–strain curves shown in Figure 6a–e, we see that the tensile breaking strain of P.100% (>200%) far exceeded the tensile breaking strains of the other test piece types. The large deformation was caused by the tensile force acting in parallel to the longitudinal direction of the filament constructed. No test piece breakage occurred when the styluses were displaced by 7 mm, a distance equivalent to a 50% deflection rate, in our four-point flexural test. This finding was explained by a movement limitation in the structure of the jigs (Section 2.3 and Figure 7).
The tensile elastic modulus obtained in this work (P.100% and P.80%) was considerably lower (1.2 GPa) than that reported in a previous paper (3.4 GPa) [33]. The flexural elastic modulus of P.100% almost agreed with a previously reported value (2.4 GPa) using IM test pieces [14], though we can only surmise that the value was obtained from a four-point flexural test (no description of the flexural test was offered). On the contrary, our scores were considerably lower than those reported in previous studies [16] using three-point flexural tests using IM test pieces.
4.3. Mechanical Properties after Immersion in Saline
The maximum stresses of the P. test pieces dropped remarkably over 90 days of immersion in saline (Figure 10 and Figure 11). The strength reduction rates of the P.80% test piece were the largest, reaching 58.5% in the tensile test and 60.8% in the flexural test. The deterioration rates were larger in the P. test pieces than in the C. test pieces in both types of testing. From these results, we can infer that the differences in the deterioration rates stemmed from the internal structures fabricated by the nozzle scan patterns. The chief difference between the two internal structures was the shape of the gaps between the filaments. While the P. structure was formed with straight gaps between the extruded lines of the material, resulting in a capillary-like structure, the C. structure was formed with zigzag-shaped gaps. In comparing the 100% and 80% IFPs in this research, we found that the structure formed by the IFP of 80% had larger gaps between the extruded lines. These larger gaps may have accelerated the water uptake into the structure. We can surmise from the different deterioration rates observed that water was more readily taken up by the P. test pieces than by the C. test pieces at both the 100% and 80% IFPs.
We can also find distinctive changes. The tensile stress and flexural stress of C.80% increased temporarily after 30 days of immersion, as can be seen in Figure 10 and Figure 11 (described in 4.4). The tensile elastic modulus ratio ranged between −35.8% and +20.2% (Figure 12). The flexural elastic modulus ratio ranged between −5.48% and +26.6% (Figure 13). The 90 days of immersion decreased the tensile elastic modulus of the P. test pieces (Figure 12). The tensile elastic modulus of P.80%, however, rose from 60 days to 90 days, for reasons that remain unclear.
The tensile breaking energies of the non-immersed test pieces varied largely between the test pieces types, and the breaking energies of the P. test pieces were remarkably larger than those of the C. test pieces (Figure 14). On the contrary, the flexural breaking energies of the non-immersed C. test pieces were larger than those of the non-immersed P. test pieces.
The first 30 days of immersion greatly reduced the breaking energies of both test piece types (Figure 15 and Figure 16). In particular, the tensile breaking energies of the P.100% test pieces declined by more than 90% versus the extremely large breaking energies of the non-immersed test pieces. From the comparisons of the changes observed between the tensile tests and flexural tests (see Figure 10, Figure 11, Figure 12 and Figure 13), we can report that the breaking energies of the test pieces declined in the first 30 days of immersion, while the maximum tensile and flexural stresses showed no notable changes in the same period.
We evaluated the deformation in the flexural tests by calculating the steepness of the deflection induced by loading and defining it as a deflection rate (Equation (7)). We estimated a flexural breaking energy from the range of structurally stable deformation based on the Drucker stability postulates [44,45]. This range corresponded to the area below the stress-deformation rate curve between zero to the deformation rate at the maximum stress.
4.4. Temporary Strength Increase Brought about by Immersion
The maximum strengths of the C.80% test pieces were temporarily increased by 30- and 60-day immersion in the tensile tests (Figure 10) and by 30 days of immersion in the flexural tests (Figure 11). These temporary increases were observed only in the C.80% structures. Meanwhile, the tensile elastic moduli of the C.80% structures were temporarily increased by 30 days of immersion, and gradually decreased thereafter (Figure 12). The flexural elastic moduli of all the test piece types increased over the first 30 days of immersion. We can infer that the permeation of water into the material induced a transient hardening, as PLA has a slow degradation rate [9,12,13,15,46]. We can also report that the permeation rate was larger than the deterioration rate of the material. The deterioration may have reached a notable level after 30 days of immersion, resulting in the subsequent strength decline.
We have not seen many reports on the transient hardening of PLA. PLA and PLA/wood composites prepared by injection molding and 3D printing have been evaluated for their mechanical properties [47]. Studies have also been done to determine how the water absorption characteristics of polymer materials affect the base resins of dentures [48,49]. In flexural testing, six months of water immersion significantly increased the elastic moduli of resins treated by various methods [48].
4.5. Test Methods
Our test pieces (Figure 1 and Figure 4) were smaller than those usually applied for evaluations of the tensile [28] and flexural properties of polymer materials. The smaller size allowed us to immerse each test piece in the solution separately from the other test pieces, and thus to maintain the same immersion condition for all of the pieces immersed. A uniform immersion is preferable, considering the self-catalysis effect of the water-soluble oligomers [42]. We would have had difficulty collecting data from a large number of test pieces if the test pieces had been larger in size, as fewer of them would have fit inside the incubator used for the immersion. Square sections of the same size (3 × 3 mm) were designed for both test piece types to ensure that the immersion solution permeated into and diffused within the material and structures under similar conditions. For the purposes above mentioned, we chose to adopt an ASTM standard, with some modifications.
We adopted a four-point flexural test instead of a three-point flexural test in this research. While the four-point flexural test can give uniform bending moment to the test piece between the inner loading styluses, the structure reaches the point of breakage under conditions similar to those in practical use.
As mentioned earlier, the tensile elastic modulus taken from this work was considerably lower than that reported in a previous paper. This difference may have stemmed from the difference in the method used to deliver the strain. We derived the strain in our tensile tests from the moving distance of the test piece head, as the test piece was too small to accept the insertion of a strain gauge with high precision [28].
We decided to select saline as the immersion solution for this work instead of phosphate buffer saline (PBS) or distilled water (DW), two other solutions that might have served the same purpose [28,40,41]. PBS would have more reliably maintained the pH value of the solution, a factor that influences the deterioration rate of PLA. According to another group, sodium chloride buffer proved to be the optimal degradation medium in an investigation of the influence of the degradation medium on the changes of mechanical behavior [29].
We continued the immersion test for up to 90 days in this work, and the maximum stress dropped by approximately 60% (Figure 10 and Figure 11). Our 90-day test period brought about the degree of deterioration we were seeking to use for the design data.
The test pieces were printed using a white translucent PLA filament containing no dye, as dye is reported to decrease the maximum tensile strength of PLA by accelerating the crystallinity [50].
4.6. Future Prospects
We found a peculiarity in the deterioration of the PLA structures fabricated by the FFF 3D printer. The structures had inner gaps between neighboring lines that varied according to the scan pattern and IFP settings in the control software. The true surface area of an FFF-3D-printed structure is generally larger than that of an IM structure with the same outer volume, as the curved surfaces of the filament composing the former have a larger surface area than the plane surface of the latter. The different interaction between the inner surface of the gap and solution can be expected to result in different deterioration profiles of the structure. Structures printed with other scan patterns in combination with different IFPs should be evaluated in the future.
5. Conclusions
PLA test pieces prepared with an FFF 3D printer were immersed in saline and evaluated by tensile and flexural tests to characterize the deterioration of their mechanical properties. The maximum strengths, elastic moduli, and breaking energies of four test piece types printed using different nozzle scan patterns and IFPs were examined by two test methods and compared. The immersion in saline substantially changed the mechanical properties of the FFF-3D-printed structures. The patterns and degrees of change were influenced by the fabrication parameters used to print the structures. In comparing between the tensile and flexural tests, the immersion was found to bring about different effects on the mechanical properties of the structure. The strengths of the test pieces tended to decrease over the 90 days of immersion, though some of the test pieces fabricated under specific conditions exhibited temporary increases in strength after 30 days of immersion. Some of the test piece types exhibited comparable levels of strength with smaller quantities of material. We expect the knowledge obtained in this research to be applied to the design of FFF-3D-printed structures.
Author Contributions
A.Y. (Akira Yamada) conceived and designed the experiments; A.Y. (Asahi Yonezawa) performed the experiments and curated the data; A.Y. (Asahi Yonezawa) wrote the draft; A.Y. (Akira Yamada) wrote and finished the paper. All authors have read and agreed to the published version of the manuscript.
Funding
Part of this work was supported by JSPS KAKENHI (JP18K04183). This study was also partly supported by an AIT (Aichi Institute of Technology) Special Grant for Education and Research (Research B).
Acknowledgments
The authors would like to thank Hisaaki Tobushi and Kohei Takeda for their available suggestions on this paper. The authors are grateful to Miho Suzuki, Yuki Yoshimi, and Keiya Tsukahara for their kind technical support. We are also grateful for the technical support we received in preparing the test apparatus for the experiments and for the practical training performed by our Department of Mechanical Engineering.
Conflicts of Interest
The authors declare no conflict of interest.
Appendix A
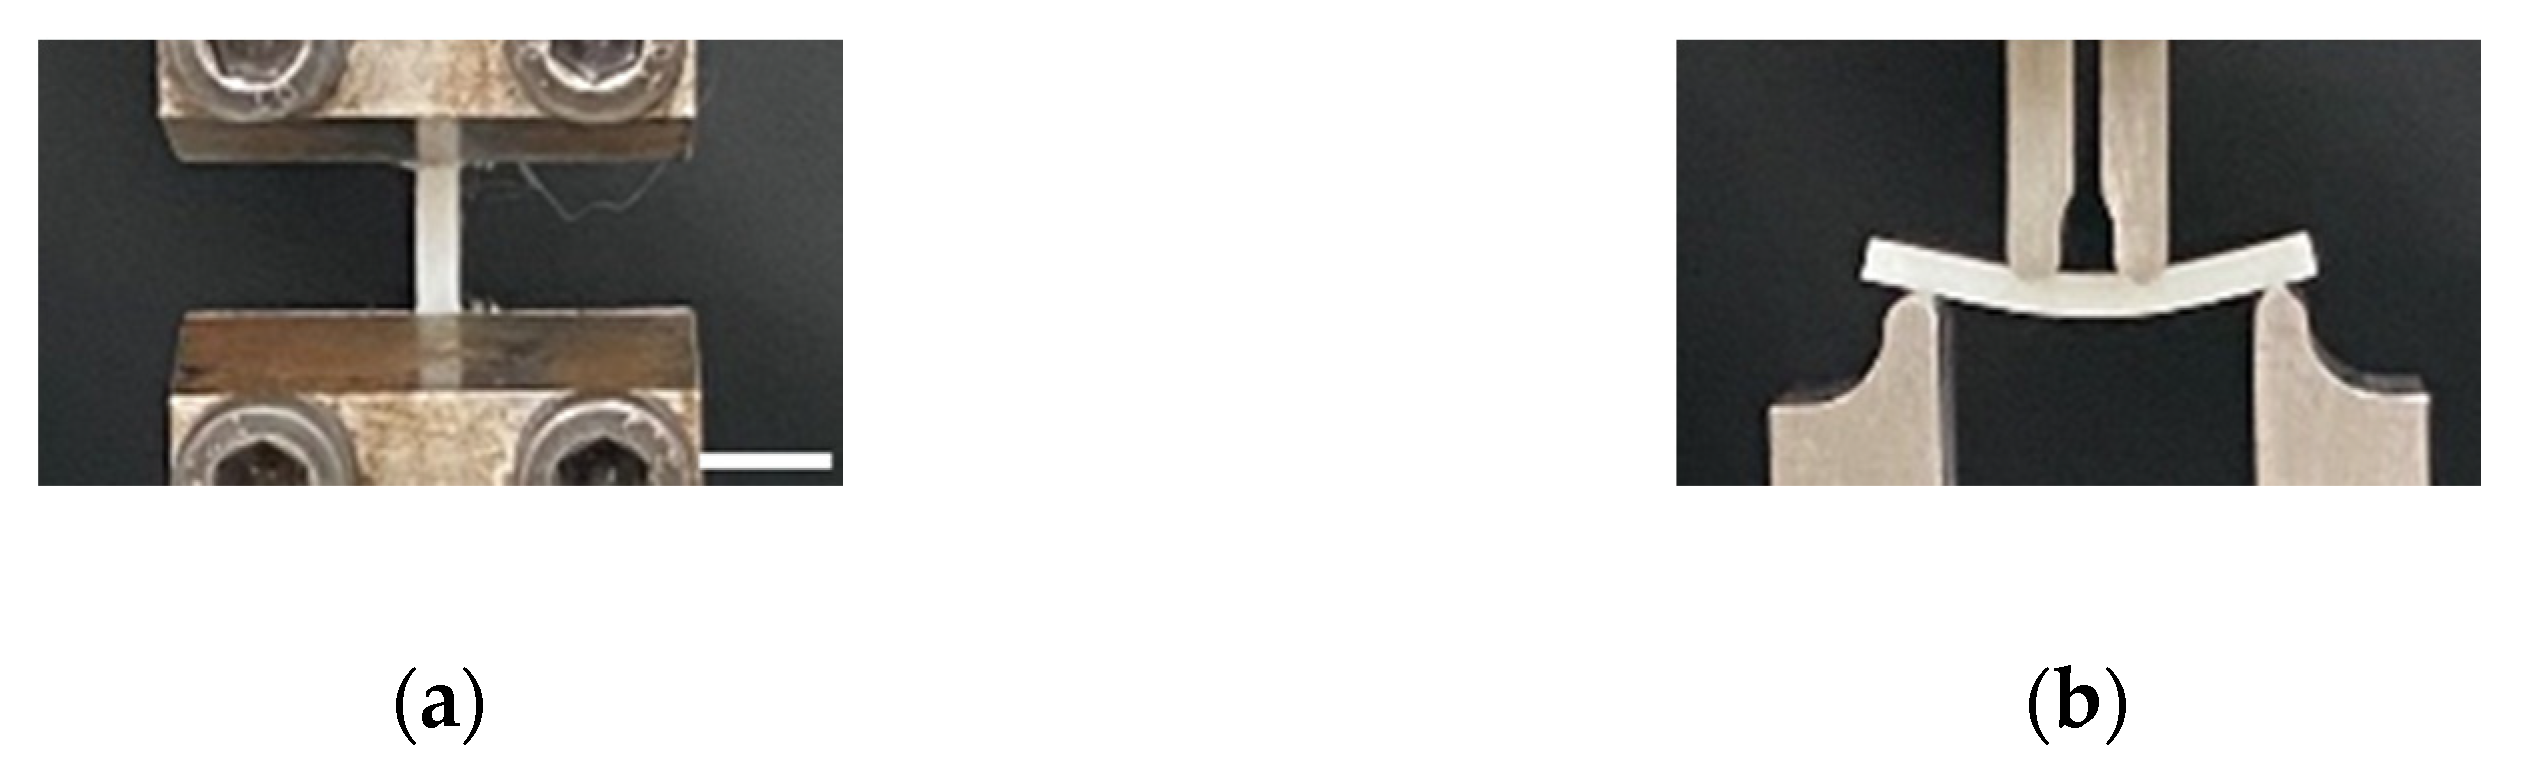
The photographs in Figure A1 show the test pieces in their jigs (partially shown) while being tested.
Figure A1.
Photographs of the P.100% test pieces in their jigs during loading for the (a) uniaxial tensile test (εT = 0.05) and (b) four-point flexural test (εF = 0.2). Bar: 10 mm.
Figure A1.
Photographs of the P.100% test pieces in their jigs during loading for the (a) uniaxial tensile test (εT = 0.05) and (b) four-point flexural test (εF = 0.2). Bar: 10 mm.

References
- Lunt, J. Large-scale production, properties and commercial applications of polylactic acid polymers. Polym. Degrad. Stabil. 1998, 59, 145–152. [Google Scholar] [CrossRef]
- Garlotta, D. A literature review of poly(lactic acid). J. Polym. Environ. 2001, 9, 63–84. [Google Scholar] [CrossRef]
- Hamad, K.; Kaseem, M.; Yang, H.W.; Deri, F.; Ko, Y.G. Properties and medical applications of polylactic acid: A review. eXPRESS Polym. Lett. 2015, 9, 435–455. [Google Scholar] [CrossRef]
- Casalini, T.; Rossi, F.; Castrovinci, A.; Perale, G. A Perspective on Polylactic Acid-Based Polymers Use for Nanoparticles Synthesis and Applications. Front. Bioeng. Biotechnol. 2019, 7, 259. [Google Scholar] [CrossRef] [PubMed]
- Shetty, S.D.; Shetty, N. Investigation of mechanical properties and applications of polylactic acids—A review. Mater. Res. Express 2019, 6, 112002. [Google Scholar] [CrossRef]
- Jem, K.J.; Tan, B. The development and challenges of poly (lactic acid) and poly (glycolic acid). Adv. Ind. Eng. Polymer Res. 2020, 3, 60–70. [Google Scholar] [CrossRef]
- Vert, M.; Christel, P.; Garreau, H.; Audion, M.; Chanavaz, M.; Chabot, F. Totally bioresorbable composites systems for internal fixation of bone fractures in polymers. In Polymers in Medicine II: Biomedical and Pharmaceutical Application; Chiellini, E., Ed.; Springer: Boston, MA, USA, 1986; pp. 263–275. [Google Scholar]
- Kulkarni, R.K.; Pani, K.C.; Neuman, C.; Leonard, F. Polylactic acid for surgical implants. Arch. Surg. 1966, 93, 839–843. [Google Scholar] [CrossRef]
- Kulkarni, R.K.; Moore, E.G.; Hegyeli, A.F.; Leonard, F. Biodegradable poly(lactic acid) polymers. J. Biomed. Mater. Res. 1971, 5, 169–181. [Google Scholar] [CrossRef] [PubMed]
- Tunc, D.C.; Rohovsky, M.W.; Jadhav, B.; Lehman, W.B.; Strongwater, A.; Kummer, F. Body absorbable osteosynthesis devices. In Advances in Biomedical Polymers; Gebelein, C.G., Ed.; Plenum Press: New York, NY, USA, 1987; pp. 87–99. [Google Scholar]
- Bos, R.M.; Boering, G.; Rozema, F.R.; Leenslag, J.W. Resorbable poly(l-lactide) plates and screws for the fixation of zygomatic fractures. J. Oral. Maxillofac. Surg. 1987, 45, 751–753. [Google Scholar] [CrossRef]
- Leenslag, J.W.; Pennings, A.J.; Bos, R.R.; Rozema, F.R.; Boering, G. Resorbable materials of poly(l-lactide). VII. In vivo and in vitro degradation. Biomaterials 1987, 8, 311–314. [Google Scholar] [CrossRef]
- Vert, M.; Christel, P.; Chabot, F.; Leray, J. Bioresorbable plastic materials for bone surgery. In Macromolecular Biomaterials; Hastings, G.W., Ed.; CRC Press: Boca Raton, FL, USA, 1984; pp. 119–142. [Google Scholar]
- Alexander, H.; Langrana, N.; Massengill, J.B.; Weiss, A.B. Development of new methods for phalangeal fracture fixation. J. Biomech. 1981, 14, 377–383, 385–387. [Google Scholar] [CrossRef]
- Sha, L.; Chen, Z.; Chen, Z.; Zhang, A.; Yang, Z. Polylactic Acid Based Nanocomposites: Promising Safe and Biodegradable Materials in Biomedical Field. Int. J. Polymer Sci. 2016, 2016, 6869154. [Google Scholar] [CrossRef] [Green Version]
- Daniels, A.U.; Chang, M.K.O.; Andriano, K.P.; Heller, J. Mechanical properties of biodegradable polymers and composites proposed for internal fixation of bone. J. Appl. Biomater. 1990, 1, 57–78. [Google Scholar] [CrossRef] [PubMed]
- Christel, P.; Charbot, F.; Leray, J.L.; Mortin, C.; Vert, M. Biodegradable Composites for Internal Fixation; Advances in Biomaterials, 3, Biomaterials 1980; Winter, D.G., Gibbons, D.F., Plench, J., Jr., Eds.; John Wiley & Sons: New York, NY, USA, 1982; pp. 271–280. [Google Scholar]
- Feng, X.D.; Voong, S.T.; Song, C.X.; Chen, W.Y. Synthesis and evaluation of biodegradable block copolymers of ε-caprolactone and l-lactide. J. Polym. Sci. 1983, 21, 593–600. [Google Scholar]
- Wurm, M.C.; Möst, T.; Bergauer, B.; Rietzel, D.; Neukam, F.W.; Cifuentes, S.C.; von Wilmowsky, C. In-vitro evaluation of Polylactic acid (PLA) manufactured by fused deposition modeling. J. Biol. Eng. 2017, 11, 29. [Google Scholar] [CrossRef] [PubMed] [Green Version]
- Gkartzou, E.; Koumoulos, E.P.; Charitidis, C.A. Production and 3D printing processing of bio-based thermoplastic filament. Manuf. Rev. 2017, 4, 1. [Google Scholar] [CrossRef]
- Coppola, B.; Cappetti, N.; Maio, L.D.; Scarfato, P.; Incarnato, L. 3D Printing of PLA/clay Nanocomposites: Influence of Printing Temperature on Printed Samples Properties. Materials 2018, 11, 1947. [Google Scholar] [CrossRef] [Green Version]
- Harris, M.; Potgieter, J.; Archer, R.; Arif, K.M. Effect of Material and Process Specific Factors on the Strength of Printed Parts in Fused Filament Fabrication: A Review of Recent Developments. Materials 2019, 12, 1664. [Google Scholar] [CrossRef] [Green Version]
- Baran, E.H.; Erbil, H.Y. Surface Modification of 3D Printed PLA Objects by Fused Deposition Modeling: A Review. Colloids Interfaces 2019, 3, 43. [Google Scholar] [CrossRef] [Green Version]
- Karabay, U.; Husemoglu, R.B.; Egrilmez, M.Y.; Havitcioglu, H. 3D Printed Polylactic Acid Scaffold for Dermal Tissue Engineering Application: The Fibroblast Proliferation in Vitro. J. Med Innov. Technol. 2019, 1, 51–56. [Google Scholar]
- Novak, J.I.; Loy, J. A critical review of initial 3D printed products responding to COVID-19 health and supply chain challenges [version 1; peer review: 3 approved]. Emerald. Open Res. 2020, 2, 24. [Google Scholar] [CrossRef]
- Msallem, B.; Sharma, N.; Cao, S.; Halbeisen, F.S.; Zeilhofer, H.-F.; Thieringer, F.M. Evaluation of the Dimensional Accuracy of 3D-Printed Anatomical Mandibular Models Using FFF, SLA, SLS, MJ, and BJ Printing Technology. J. Clin. Med. 2020, 9, 817. [Google Scholar] [CrossRef] [PubMed] [Green Version]
- Sanatgar, R.H.; Campagne, C.; Nierstrasz, V. Investigation of the adhesion properties of direct 3D printing of polymers and nanocomposites on textiles: Effect of FDM printing process parameters. Appl. Surf. Sci. 2017, 403, 551–563. [Google Scholar] [CrossRef]
- Suzuki, M.; Yonezawa, A.; Takeda, K.; Yamada, A. Evaluation of the Deterioration of the Mechanical Properties of Poly(lactic acid) Structures Fabricated by a Fused Filament Fabrication 3D Printer. Inventions 2019, 4, 21. [Google Scholar] [CrossRef] [Green Version]
- Andrzejewska, A. One Year Evaluation of Material Properties Changes of Polylactide Parts in Various Hydrolytic Degradation Conditions. Polymers 2019, 11, 1496. [Google Scholar] [CrossRef] [Green Version]
- Ngo, T.D.; Kashani, A.; Imbalzano, G.; Nguyen, K.T.Q.; Hui, D. Additive manufacturing (3D printing): A review of materials, methods, applications and challenges. Compos. B Eng. 2018, 143, 172–196. [Google Scholar] [CrossRef]
- Chiulan, I.; Frone, A.N.; Brandabur, C.; Panaitescu, D.M. Recent advances in 3D printing of aliphatic polyesters. Bioengineering 2018, 5, 2. [Google Scholar] [CrossRef] [Green Version]
- Song, Y.; Li, Y.; Song, W.; Yee, K.; Lee, K.-Y.; Tagarielli, V.L. Measurements of the mechanical response of unidirectional 3D-printed PLA. Mater. Design. 2017, 123, 154–164. [Google Scholar] [CrossRef]
- Tymraka, B.M.; Kreigerb, M.; Pearce, J.M. Mechanical properties of components fabricated with open-source 3-D printers under realistic environmental conditions. Mater. Design 2014, 58, 242–246. [Google Scholar] [CrossRef]
- Chacóna, J.M.; Caminerob, M.A.; García-Plazab, E.; Núñez, P.J. Additive manufacturing of PLA structures using fused deposition modelling: Effect of process parameters on mechanical properties and their optimal selection. Mater. Design 2017, 124, 143–157. [Google Scholar] [CrossRef]
- Yamada, A.; Niikura, F.; Ikuta, K. A three-dimensional microfabrication system for biodegradable polymers with high-resolution and biocompatibility. J. Micromech. Microeng. 2008, 18, 025035. [Google Scholar] [CrossRef]
- Tanikella, N.G.; Wittbrodt, B.; Pearce, J.M. Tensile Strength of Commercial Polymer Materials for Fused Filament Fabrication 3D Printing. Addit. Manuf. 2017, 15, 40–47. [Google Scholar] [CrossRef] [Green Version]
- Kuznetsov, V.E.; Solonin, A.N.; Urzhumtsev, O.D.; Schilling, R.; Tavitov, A.G. Strength of PLA Components Fabricated with Fused Deposition Technology Using a Desktop 3D Printer as a Function of Geometrical Parameters of the Process. Polymers 2018, 10, 313. [Google Scholar] [CrossRef] [PubMed] [Green Version]
- Cohn, D.; Younes, H. Biodegradable PEO/PLA block copolymers. J. Biomed. Mater. Res. 1988, 22, 993–1009. [Google Scholar] [CrossRef]
- Tunc, D.C.; Rohovsky, M.W.; Jadhav, B.; Lehman, W.B.; Strongwater, A.; Kummer, F. Evaluation of body absorbable bond fixation devices. Polym. Mater. Sci. Eng. 1985, 53, 502–504. [Google Scholar]
- Li, S.M.; Garreau, H.; Vert, M. Structure-property relationships in the case of the degradation of massive aliphatic poly-(α-hydroxy acids) in aqueous media, Part 1: Poly(l-lactic acid). J. Mater. Sci. Mater. Med. 1990, 1, 123–130. [Google Scholar] [CrossRef]
- Li, S.M.; Garreau, H.; Vert, M. Structure-property relationships in the case of the degradation of massive aliphatic poly-(α-hydroxy acids) in aqueous media, Part 3: Influence of the morphology of poly(l-lactic acid). J. Mater. Sci. Mater. Med. 1990, 1, 198–206. [Google Scholar] [CrossRef]
- Göpferich, A. Polymer degradation and erosion: Mechanisms and applications. Eur. J. Pharma Biopharm. 1996, 42, 1–11. [Google Scholar]
- Shigley, J.M. Mechanical Engineering Design: Metric Edition; McGraw-Hill: New York, NY, USA, 1985; Chapter 2. [Google Scholar]
- Hill, R. A general theory of uniqueness and stability in elastic-plastic solids. J. Mech. Phys. Solids 1958, 6, 236–249. [Google Scholar] [CrossRef]
- Drucker, D.C. A definition of a stable inelastic material. J. Appl. Mech. 1959, 26, 101–106. [Google Scholar]
- Avgoustakis, K. Polylactic-co-glycolic acid (PLGA). In Encyclopedia of Biomaterials and Biomedical Engineering; CRC Press: Boca Raton, FL, USA, 2005; pp. 1–11. [Google Scholar]
- Ecker, J.V.; Haider, A.; Burzic, I.; Huber, A.; Eder, G.; Hild, S. Mechanical properties and water absorption behaviour of PLA and PLA/wood composites prepared by 3D printing and injection moulding. Rapid Prototyp. J. 2019, 25, 672–678. [Google Scholar] [CrossRef]
- Takahashi, Y.; Hamanaka, I.; Shimizu, H. Flexural properties of denture base resins subjected to long-term water immersion. Acta Odontol. Scand. 2013, 71, 716–720. [Google Scholar] [CrossRef] [PubMed]
- Sasaki, H.; Hamanaka, I.; Takahashi, Y.; Kawaguchi, T. Effect of long-term water immersion or thermal shock on mechanical properties of high-impact acrylic denture base resins. Dent. Mater. J. 2016, 35, 204–209. [Google Scholar] [CrossRef] [PubMed] [Green Version]
- Wittbrodt, B.; Pearce, J.M. The effects of PLA color on material properties of 3-D printed components. Addit. Manuf. 2015, 8, 110–116. [Google Scholar] [CrossRef] [Green Version]
Figure 1.
Shapes and dimensions of (a) the tensile test piece [28] and (b) the flexural test piece.
Figure 1.
Shapes and dimensions of (a) the tensile test piece [28] and (b) the flexural test piece.

Figure 2.
Nozzle scan patterns for the test pieces fabricated with the FFF 3D printer. (a) Parallel, P.; (b) Cross-hatched at opposing diagonal angles, C.
Figure 2.
Nozzle scan patterns for the test pieces fabricated with the FFF 3D printer. (a) Parallel, P.; (b) Cross-hatched at opposing diagonal angles, C.

Figure 3.
Schematics of the jigs for the (a) uniaxial tensile test and (b) four-point flexural test.
Figure 3.
Schematics of the jigs for the (a) uniaxial tensile test and (b) four-point flexural test.

Figure 4.
Photographs of the exteriors of the test pieces fabricated with the 3D printer. (a) Tensile test piece and (b) Flexural test piece. (i) P.100%, (ii) P.80%, (iii) C.100%, and (iv) C.80%. Bar: 5 mm.
Figure 4.
Photographs of the exteriors of the test pieces fabricated with the 3D printer. (a) Tensile test piece and (b) Flexural test piece. (i) P.100%, (ii) P.80%, (iii) C.100%, and (iv) C.80%. Bar: 5 mm.

Figure 5.
Comparison of the masses of the non-immersed test pieces. Average ± S.D., N = 5.

Figure 6.
Representative changes of the stress–strain curves of the tensile test pieces after immersion for certain periods. (a) P.100%, (b) P.80%, (c) C.100%, and (d) C.80%. (e) Full curves of P.100% and P.80%.
Figure 6.
Representative changes of the stress–strain curves of the tensile test pieces after immersion for certain periods. (a) P.100%, (b) P.80%, (c) C.100%, and (d) C.80%. (e) Full curves of P.100% and P.80%.

Figure 7.
Representative changes of the stress–deflection rate curves of the flexural test pieces after immersion for certain periods. (a) P.100%, (b) P.80%, (c) C.100%, and (d) C.80%. The arrow indicates that the test piece has not reached breakage.
Figure 7.
Representative changes of the stress–deflection rate curves of the flexural test pieces after immersion for certain periods. (a) P.100%, (b) P.80%, (c) C.100%, and (d) C.80%. The arrow indicates that the test piece has not reached breakage.

Figure 8.
Maximum tensile stresses and tensile elastic moduli of the non-immersed test pieces. Average ± S.D., N = 5.
Figure 8.
Maximum tensile stresses and tensile elastic moduli of the non-immersed test pieces. Average ± S.D., N = 5.

Figure 9.
Maximum flexural stresses and flexural elastic moduli of the non-immersed test pieces. Average ± S.D., N = 5.
Figure 9.
Maximum flexural stresses and flexural elastic moduli of the non-immersed test pieces. Average ± S.D., N = 5.

Figure 10.
Comparison of the changes in the maximum tensile stresses of the four test piece types brought about by the immersion. Each value was divided by the average value of the non-immersed test pieces (0 days). The plot points were straggled to avoid overlapping. Average ± S.D., N = 5.
Figure 10.
Comparison of the changes in the maximum tensile stresses of the four test piece types brought about by the immersion. Each value was divided by the average value of the non-immersed test pieces (0 days). The plot points were straggled to avoid overlapping. Average ± S.D., N = 5.

Figure 11.
Comparison of the changes of the maximum flexural stresses of the four test piece types brought about by the immersion. Average ± S.D., N = 5.
Figure 11.
Comparison of the changes of the maximum flexural stresses of the four test piece types brought about by the immersion. Average ± S.D., N = 5.

Figure 12.
Comparison of the changes of the tensile elastic moduli of the four test piece types brought about by the immersion. Average ± S.D., N = 5.
Figure 12.
Comparison of the changes of the tensile elastic moduli of the four test piece types brought about by the immersion. Average ± S.D., N = 5.

Figure 13.
Comparison of the changes of the flexural elastic moduli of the four test piece types brought about by the immersion. Average ± S.D., N = 5.
Figure 13.
Comparison of the changes of the flexural elastic moduli of the four test piece types brought about by the immersion. Average ± S.D., N = 5.

Figure 14.
Tensile and flexural breaking energies of the non-immersed test pieces. Average ± S.D., N = 5.
Figure 14.
Tensile and flexural breaking energies of the non-immersed test pieces. Average ± S.D., N = 5.

Figure 15.
Comparison of the changes of the tensile breaking energies of the four test piece types brought about by the immersion. Average ± S.D., N = 5.
Figure 15.
Comparison of the changes of the tensile breaking energies of the four test piece types brought about by the immersion. Average ± S.D., N = 5.

Figure 16.
Comparison of the changes of the flexural breaking energies of the four test piece types brought about by the immersion. Average ± S.D., N = 5.
Figure 16.
Comparison of the changes of the flexural breaking energies of the four test piece types brought about by the immersion. Average ± S.D., N = 5.

Publisher’s Note: MDPI stays neutral with regard to jurisdictional claims in published maps and institutional affiliations. |
© 2020 by the authors. Licensee MDPI, Basel, Switzerland. This article is an open access article distributed under the terms and conditions of the Creative Commons Attribution (CC BY) license (http://creativecommons.org/licenses/by/4.0/).
Share and Cite
MDPI and ACS Style
Yonezawa, A.; Yamada, A. Deterioration of the Mechanical Properties of FFF 3D-Printed PLA Structures. Inventions 2021, 6, 1. https://0-doi-org.brum.beds.ac.uk/10.3390/inventions6010001
AMA Style
Yonezawa A, Yamada A. Deterioration of the Mechanical Properties of FFF 3D-Printed PLA Structures. Inventions. 2021; 6(1):1. https://0-doi-org.brum.beds.ac.uk/10.3390/inventions6010001
Chicago/Turabian StyleYonezawa, Asahi, and Akira Yamada. 2021. "Deterioration of the Mechanical Properties of FFF 3D-Printed PLA Structures" Inventions 6, no. 1: 1. https://0-doi-org.brum.beds.ac.uk/10.3390/inventions6010001