Article

Energy Efficiency for Social Buildings in Morocco, Comparative (2E) Study: Active VS. Passive Solutions Via TRNsys

1
Ecole Supérieure de Technologie de Fes, Université Sidi Mohamed Ben Abdellah, Route d’Imouzzer, Fes BP 2427, Morocco
2
Laboratoire des Sciences de l’Ingénieur Appliquées à la Mécanique et au Génie Electrique (SIAME), Université de Pau et des Pays de l’Adour/E2S UPPA, EA4581, 64000 Pau, France
3
Laboratoire de Mathématiques, Modélisation en Physique Appliquée, Ecole Normale Supérieure de Fès, U.S.M.B.A, Route Bensouda, Fes BP 5206, Morocco
*
Author to whom correspondence should be addressed.
Submission received: 22 October 2020 / Revised: 22 December 2020 / Accepted: 23 December 2020 / Published: 28 December 2020
(This article belongs to the Special Issue Emerging Technologies for the Energy Systems of the Future)

Abstract

:
This paper aims to highlight the potential of solar water heater installations in Morocco. The project involves the comparison of active and passive solutions for energy efficiency in buildings. To this end, a numerical simulation model of solar water heater installations is created under TRNsys. Three hot water demand scenarios (Low, Standard, and High) were taken into account for the six climatic zones defined in the Moroccan thermal regulation of constructions. The same software (TRNsys) is used to model a pilot building consisting of 16 flats. Energy efficiency actions have been applied to the building envelope (insulation and glazing) and simulations are made for the six areas. The simulation results comparing energy and financial savings show the influence of subsidized gas prices on solar water heaters’ relevance despite significant energy savings. This work proves that solar water heaters will be a primary obligation for Morocco, taking into account changes in butane gas prices.

1. Introduction

The Moroccan energy situation assessment has revealed that the country imports about 95% of its energy needs, 60% of which is oil, equivalent to 9 million TOE (tons of oil equivalents) [1]. This national energy bill weighs heavily where 20% of total imports and 50% of the trade deficit represent only oil. Despite this situation, Morocco supports gas users, industry, and households where domestic gas price support subsidies are close to 10% of investment expenditure in the general state budget [2].
In the same directive of this evaluation, and focusing on the residential sector that represents the purpose of this work, it is essential to discuss the country’s electric consumption. Electrical energy consumption increased from 487.38 kWh/person in 2000 to 911.64 kWh/person in 2014. Meanwhile, projections of energy needs for the 2020s expect a growth of 5% to 6% for electricity consumption (which has recorded much more values especially for households due to COVID-19 quarantines and curfews), which should be around 1000 kWh per inhabitant annually [3]. Household consumption surveys from 1985 to 2001, despite limited human development, have shown that spending on electricity and butane increased by 9.1% per year [4]. Besides, the average consumption of ONE’s residential customers is close to 75 kWh per month, less than 1 kWh/m2 covered [5]. At the same time, the need for air conditioning (heating and cooling) is not negligible in many of the Kingdom’s major cities.
Therefore, this country’s energy dependence, its policy, and the energy bill imposed by the residential sector present real constraints that weigh on the current chances of the country’s sustainable development. To cope with this situation, Morocco is committed to an energy efficiency policy, expecting to achieve a primary energy saving of 15% by 2030 by establishing an energy efficiency plan in all sectors (residential, tertiary, industry and agriculture) [6]. Among these sectors, the building is the second largest consumer of energy with a 25% share of the country’s total energy consumption, of which 18% is reserved for residential and the rest for the tertiary sector [7]. This consumption is distributed on all of the building needs, of which domestic hot water represents a very important part, and one of the most exciting applications of solar energy in various configurations, the individual solar water heaters (SWH) and collective solar installations (CSI) of residential and tertiary demand characterized by large and regular hot water needs throughout the year. In Morocco, currently most of these needs are satisfied using electric and gas water heaters, despite the high petroleum product tariffs introduced in February 2006 and the current electric kWh prices which make the SWH an appreciated solution than all conventional sources, except for zero-rated or subsidized fuel (butane) scenarios [8,9].
This paper involves comparing active and passive energy efficiency solutions for building. The results presented come from the application of first the insulation, double glazing, and finally, all conditions required by Moroccan thermal regulation of building construction as passive solutions. Solar water heaters for the production of domestic hot water are an active solution. The numerical simulation via TRNsys makes it possible to compare different scenarios of the studied solutions, developing a complete comparison. In the literature, several studies have taken the same direction, but a limited number have treated the comparison and the combination of the two action types; they have developed each solution separately. The global aim is to enhance building energy efficiency. Cabeza et al. [10] have tested the active and passive system on an experimental building prototype located in Puigverd de Lleida, Spain. His study aims to evaluate the energy savings resulting from testing, first different technologies of active solutions such as solar thermal, free cooling, geothermal, etc. Secondly, testing sustainable materials and phase change materials as passive solutions to designing the green building envelope. Gou et al. [11] combined the two design strategies (active and passive) to develop the first zero energy building in Southeast Asia. This work is based on an existing building and under tropical climate conditions, presenting a cost-effectiveness comparison of passive and active strategies. The results show that passive solutions must be applied on a large scale to have significant economies because of its long payback period compared to the active ones. Another work presented by Buonomano et al. [12] converges in the same direction. The passive and active effects on the photovoltaic and thermal system’s integration were analyzed by evaluating performance, energy demands, and electrical production. The numerical model was validated and compared to an experimental model integrated into an office building simulated in several European climates; the results achieved a 56.8% to 104.4% energy consumption reduction. All works take this direction intending to improve energy efficiency [13] in different building types and models, the newest and the existing [14] even for the historical ones [15], under several conditions of climate, occupation, construction, and system integration to achieve optimal thermal comfort.
The renewable energy solutions integrated into the building are massively present in the literature. Yan Wang et al. [16] developed a new energy performance index by studying the integration of renewable energy on school buildings for Germany’s heating needs. The numerical model was developed and simulated; a new performance indicator was developed to evaluate the active solution proposed; the borehole outlet temperature effects and heat recovery efficiency. The results show that the distribution enhanced can achieve a proper thermal comfort level for the case studied, reduce electricity costs, and reduce CO2 emissions by 5.3 kg per typical winter.
Bougiatioti et al. [17] studied the integration of active solar systems on an existing building in traditional settlements to develop several possibilities of a smart architectural integration in Cyprus and Greece, where the construction conditions make this action advantageous. This work aims to evaluate gains and difficulties highlighting the need to exploit these benefits under the economic crisis.
In the same directive of highlighting the active solutions role in both energy performance and the indoor built environment, Amilios et al. [18] studied the active solar systems integration on southern Europe building envelopes. The studies have been carried out under the inhabitants’ comforts requirements, making an energy and environment assessment. This action gives a remarkable reduction of cooling and heating loads in the proposed comprehensive environmental approach. In the present paper, the active solution proposed is the solar water heater (SWH) under two configurations; the individual and the collective. There are numerous studies in the literature focused on the performance and design optimization of residential water heaters, independent of passive solutions, as a performing solution [19,20]
Building efficiency studies using passive solutions are pronounced in the literature. Whether the optimization is the key of several works, Chen et al. [21] optimized a typical passive residential building design in China. The optimal model was carried out under the influence of five weather conditions investigating a sensitivity analysis related to ventilation, outdoor thermal, and solar radiation, studying the proposed model’s applicability. The passive model was studied in several cases in several locations and climate conditions such as hot and humid climates [22].
In the present work, there are three types of passive solutions proposed. The first solution is improving the building envelope by the insulation, where several works introduced many innovative insulation materials for optimal building efficiency [23]. Kaushik Biswas et al. [24] integrate composite insulation boards containing foam-encapsulated vacuum insulation panels. The material’s thermal characterization was done developing a new process manufacturing technology called modified atmosphere insulation to release a significant cost reduction keeping a high performance. Others incorporate the anchors into the insulation in order to strengthen the insulation [25]. The dynamic material was also present as an insulation proposition [26], and many other innovative materials were proposed as an excellent cheap alternative such as bio insulation [27] and wood waste [28].
The insulation studies focused on materials [29] and other parameters such as thickness [30], which was analyzed by Cemek et al. [31]; they develop a parametric study based on insulation thickness, taking into account several indicators such as energy savings, payback period, and CO2 emission reductions under the climate conditions of different Turkish cities.
The second passive solution proposed is glazing, which was studied broadly. In the literature, several works detail this solution, focusing on different materials and developed glazing types such as aerogel glazing, PDLC (Polymer Dispersed Liquid Crystal) switchable glazing, and simple and double types [32,33,34,35,36].
The present comparison presented was projected on a social building, taking into account different solutions for each type. The study integrated the technological side of active solutions, presenting a comparison between flat plate collectors and the evacuated tube one under two configurations; the individual and the collective, comparing the solar solution with the conventional ones presented in the market, and studying all existing combinations, in order to prove the importance of investing in those solutions compared to passive propositions. This work will defend a suitable solution between a passive and active one for the Moroccan context by taking into account all dimensions such as economic, energetic and the payback period, with the best solution needing to combine all those parameters for an optimal result.

2. Methodology and Case Study

The building studied was modeled with the TRNsys Studio 16 software and TRNBUILD module. The final model makes the energy demand profile evaluation possible, taking into account critical building parameters such as wall composition, facade orientation, zone volume, occupation, and set point temperature. We studied the envelope improvement by using the separate passive solutions of insulation and glazing, integrating complete Moroccan thermal regulations, and applying the active system (solar water heaters), to compare all propositions.
In this section, the building model is presented under its architecture, with the composition of walls and construction materials of the first proposition which will be improved. All simulation hypotheses and parameters will be exhibited (occupancy, ventilation, zoning and masks). Then the solutions studied will be described under inputs and characteristics and the simulation model developed for each proposition (building envelope improvement, individual SWH, and collective SWH).
All simulations were carried out under Moroccan climatic conditions. The Moroccan territory has been subdivided into six climatic zones that are homogenous and circumscribed: Zone 1, Zone 2, Zone 3, Zone 4, Zone 5, and Zone 6. This climatic zoning was adopted for the thermal regulation of buildings in Morocco, and the simulations were done for the six climatic Moroccan zones presented in Table 1.

2.1. The Building Models

2.1.1. Building Architecture

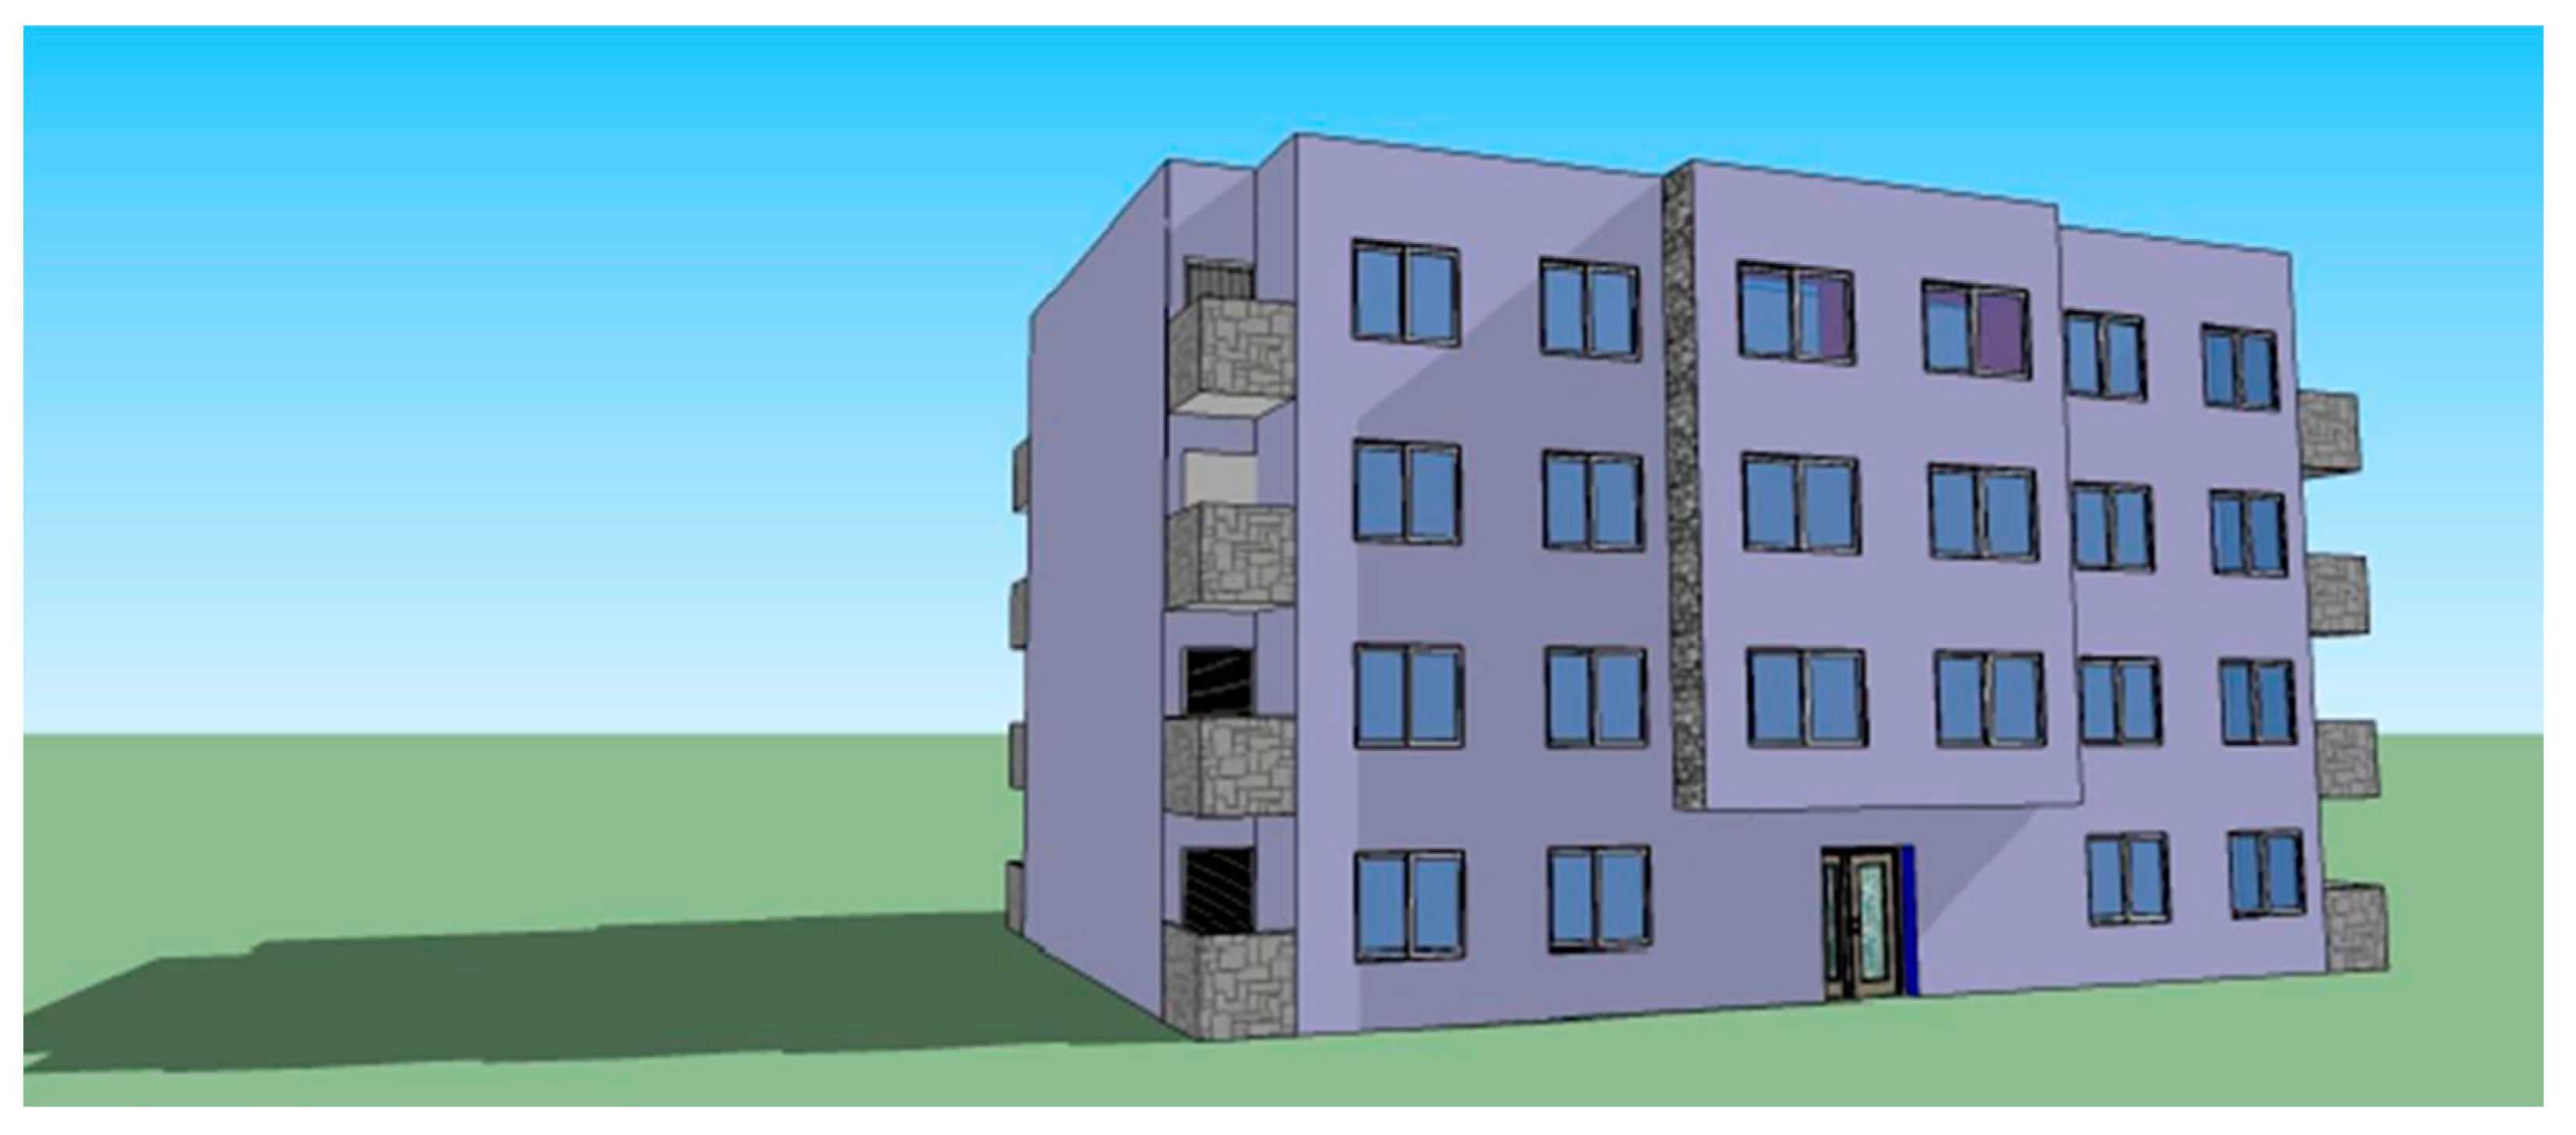
The building studied in this project is social housing with 300 m2; it consists of four levels: a ground floor and three floors. The accommodation is composed of 16 apartments, and the main facade faces west. Figure 1 shows the global modeling of the building with the Google Sketch UP software.
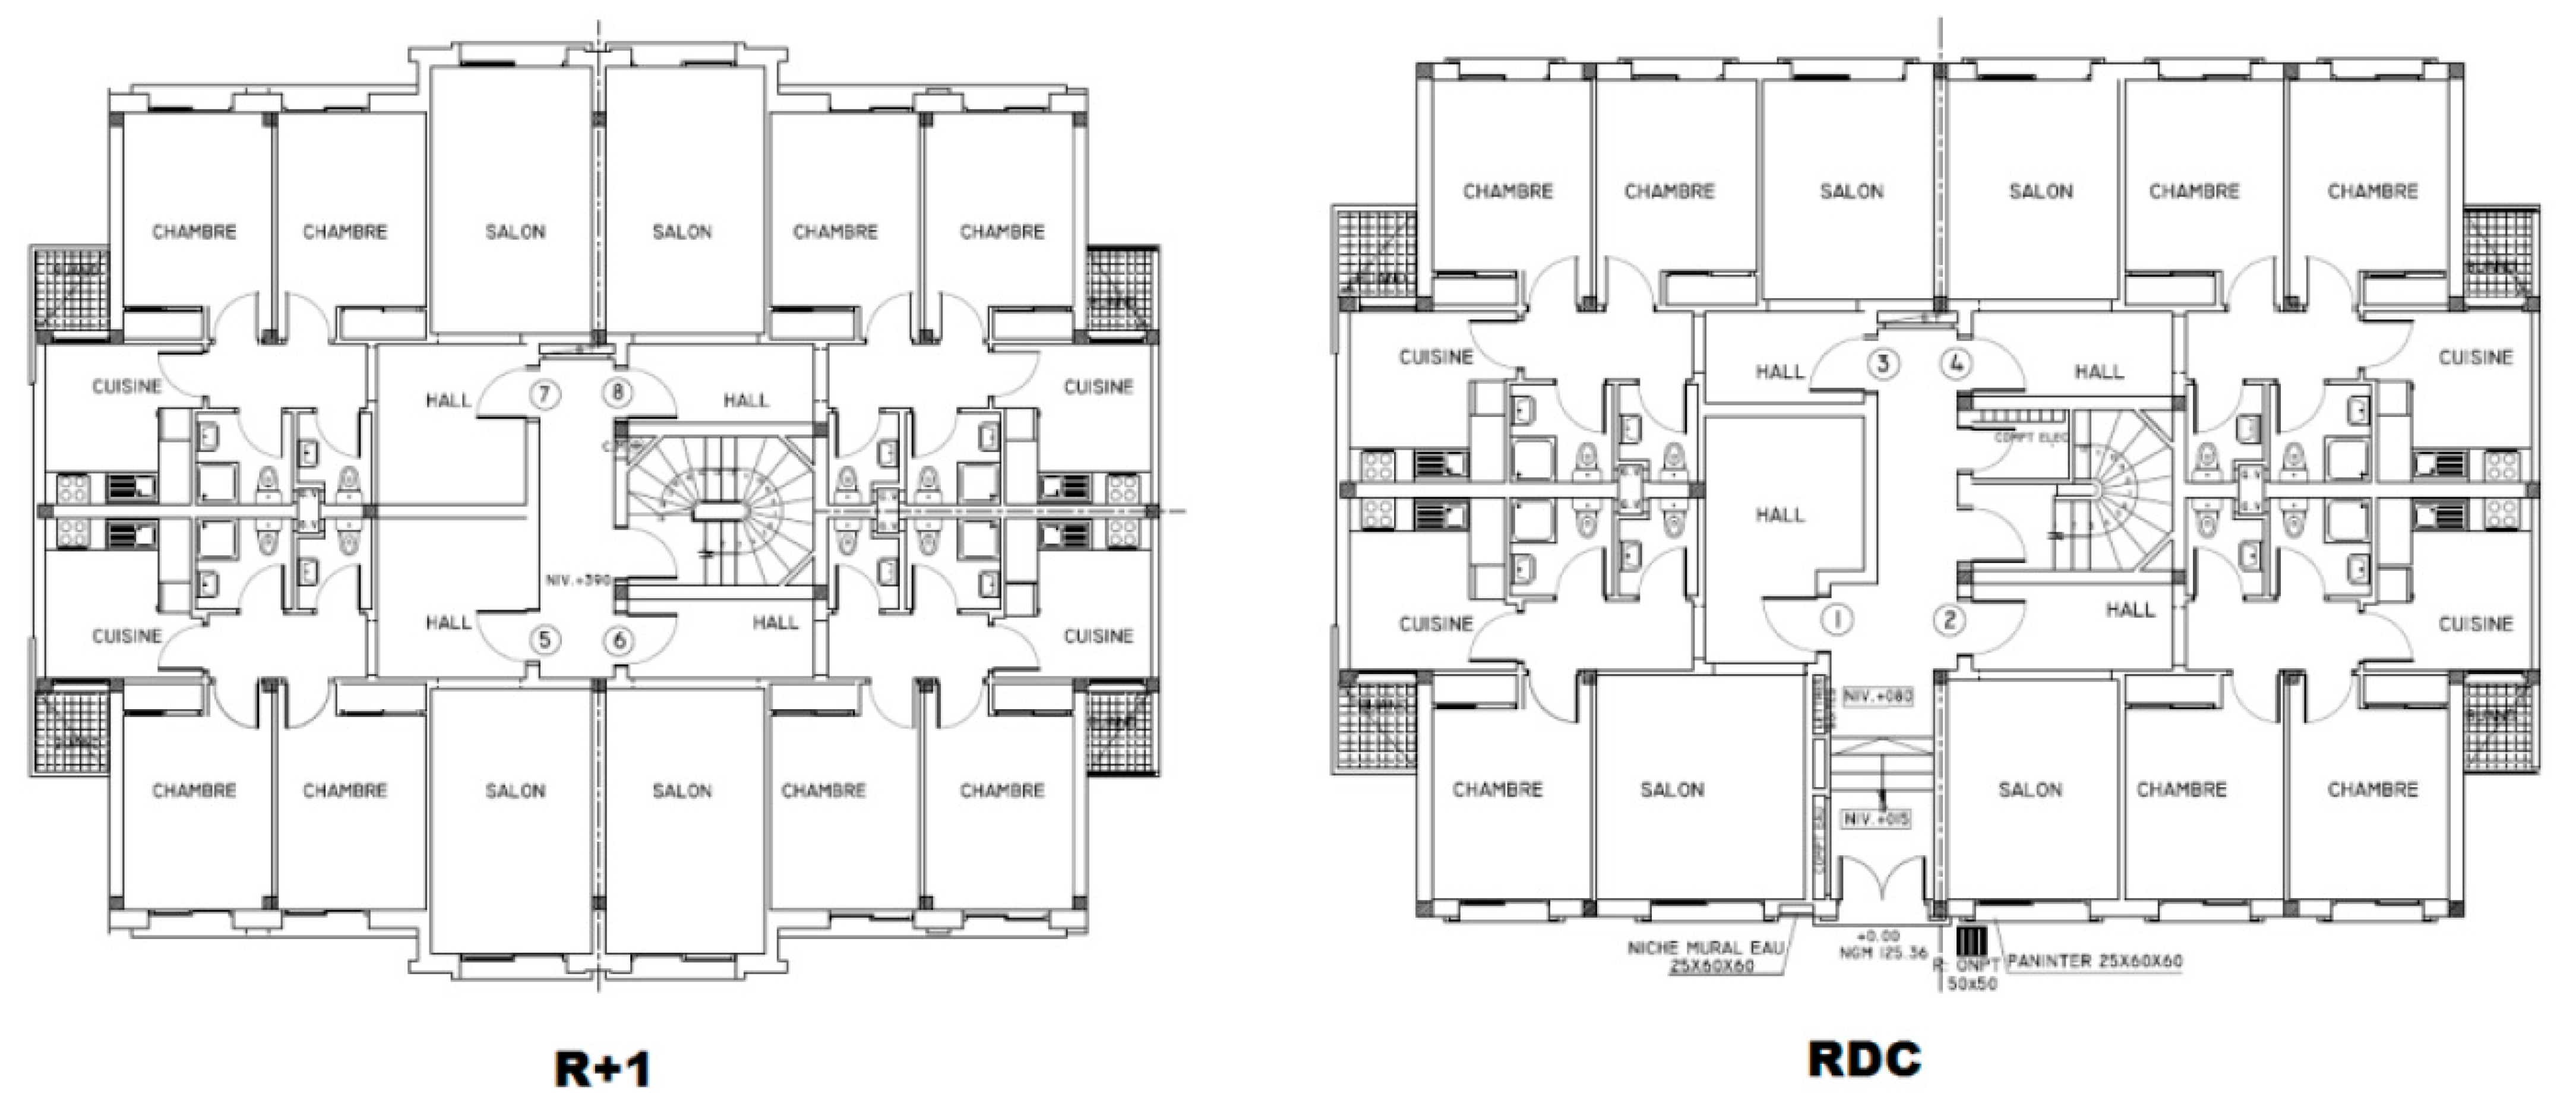
Each floor of the building has four standard apartments of 70 m2, except the apartments on the ground floor, which are 60 m2 in size. Figure 2 shows the architectural plan of the ground floor and a representative floor.

2.1.2. Building Envelope (Construction Materials)

The composition and construction materials of the building are shown in Table 2.

2.1.3. Simulation Building Model and Hypothesis

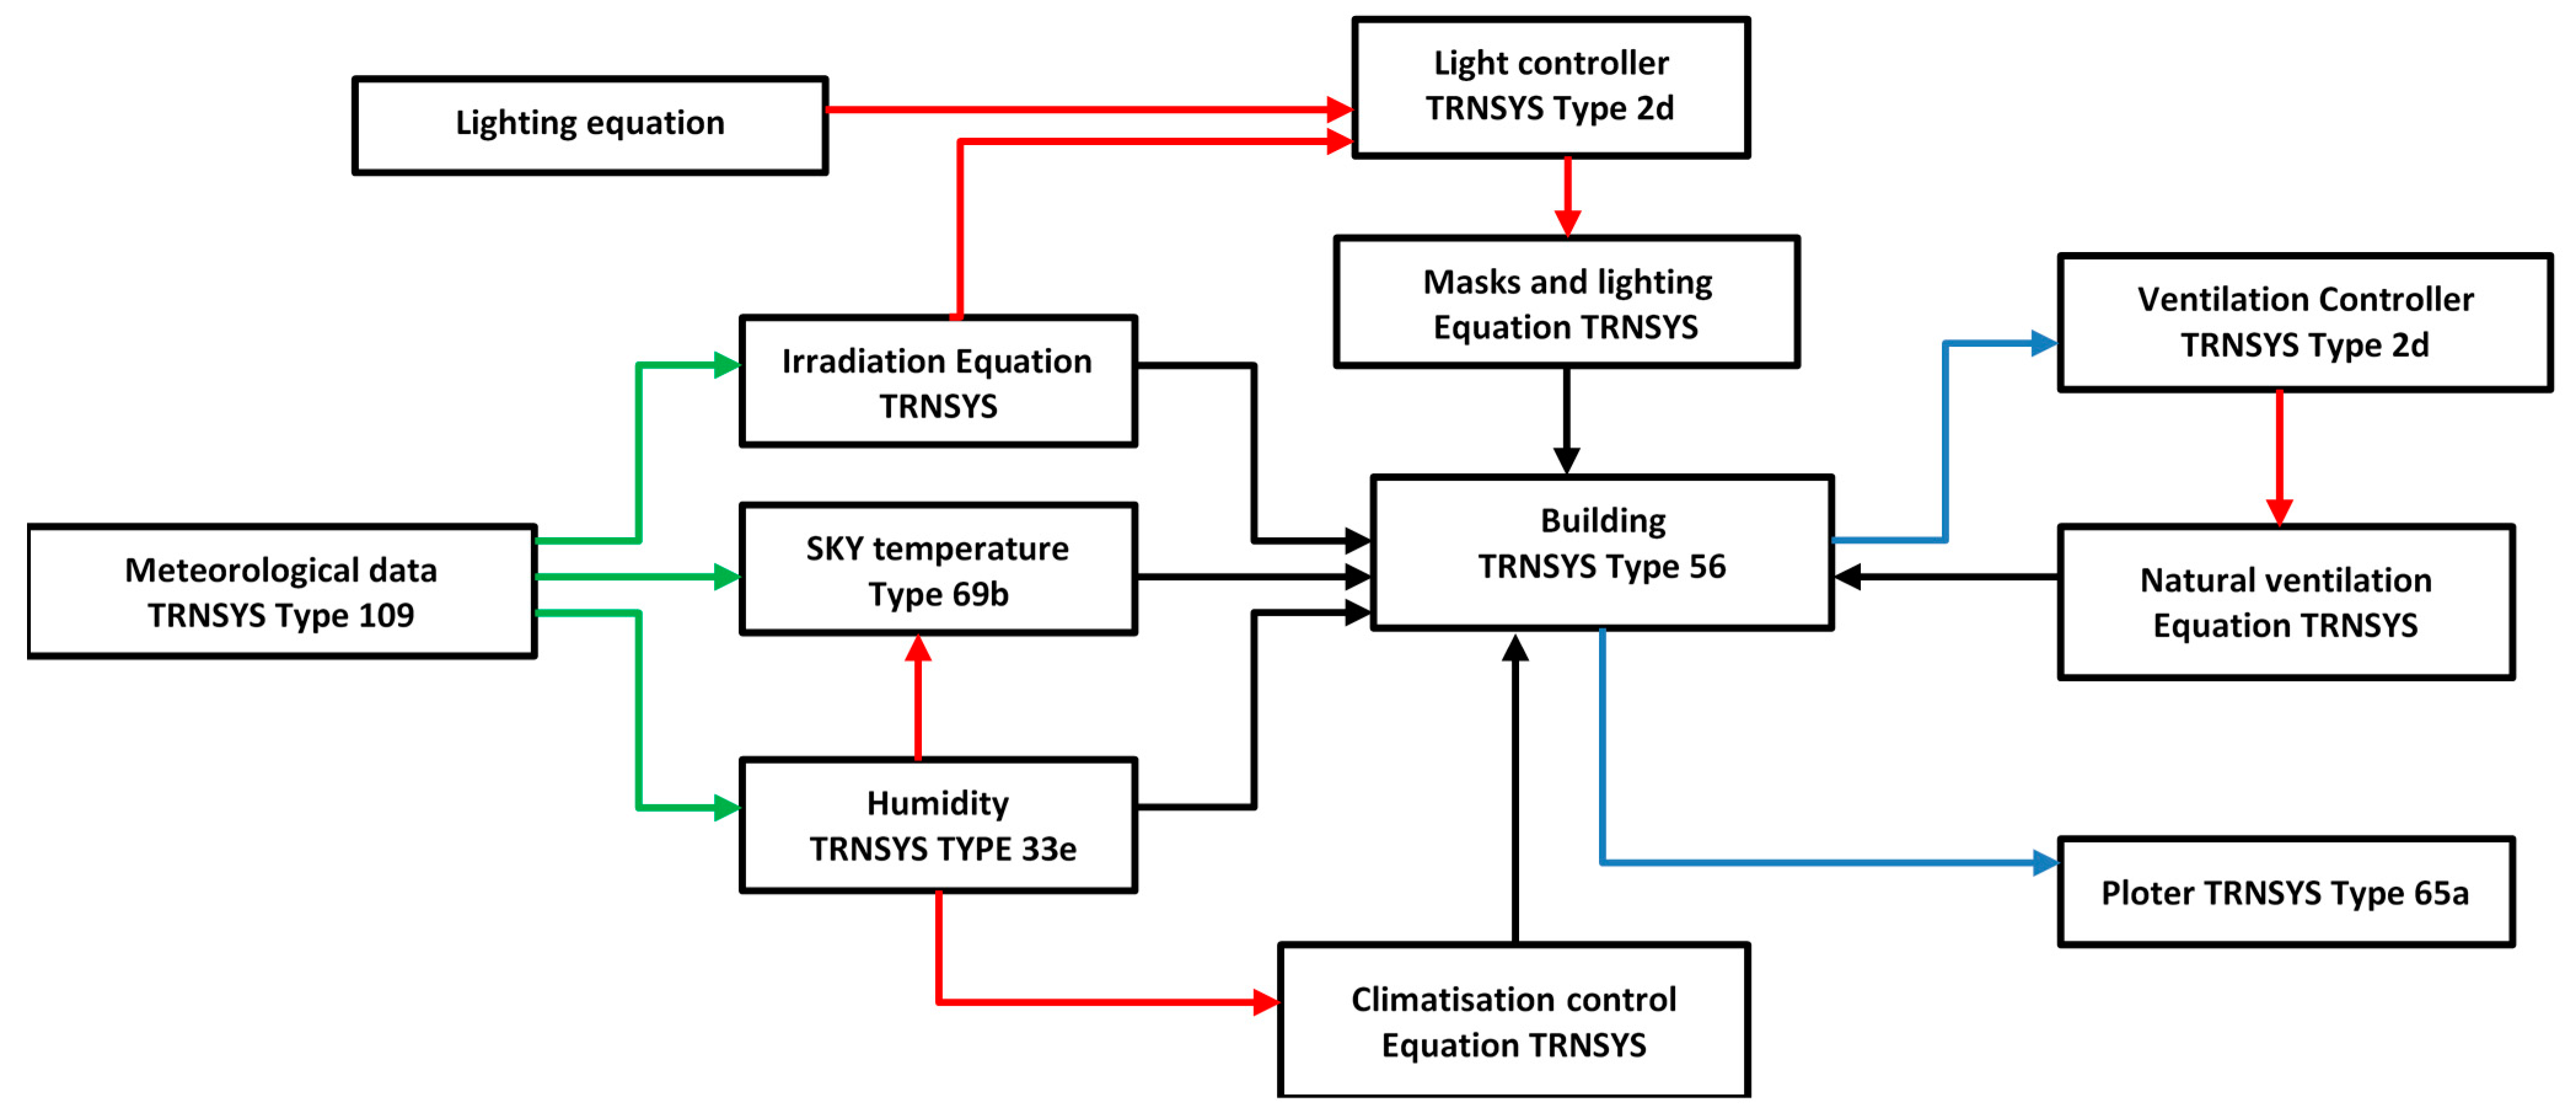
Figure 3 shows the simulation model flowchart on TRNsys studio software. The building model was created using TRNBUILD connected to TRNsys by the construction model (type 56). It is a non-geometric scale model with one air node per zone, representing the air volume’s zone heat capacity and the capacities that are closely related to the air node (furniture, for example). Thus, the node’s capacity is a separate entry in addition to the volume of the zone.
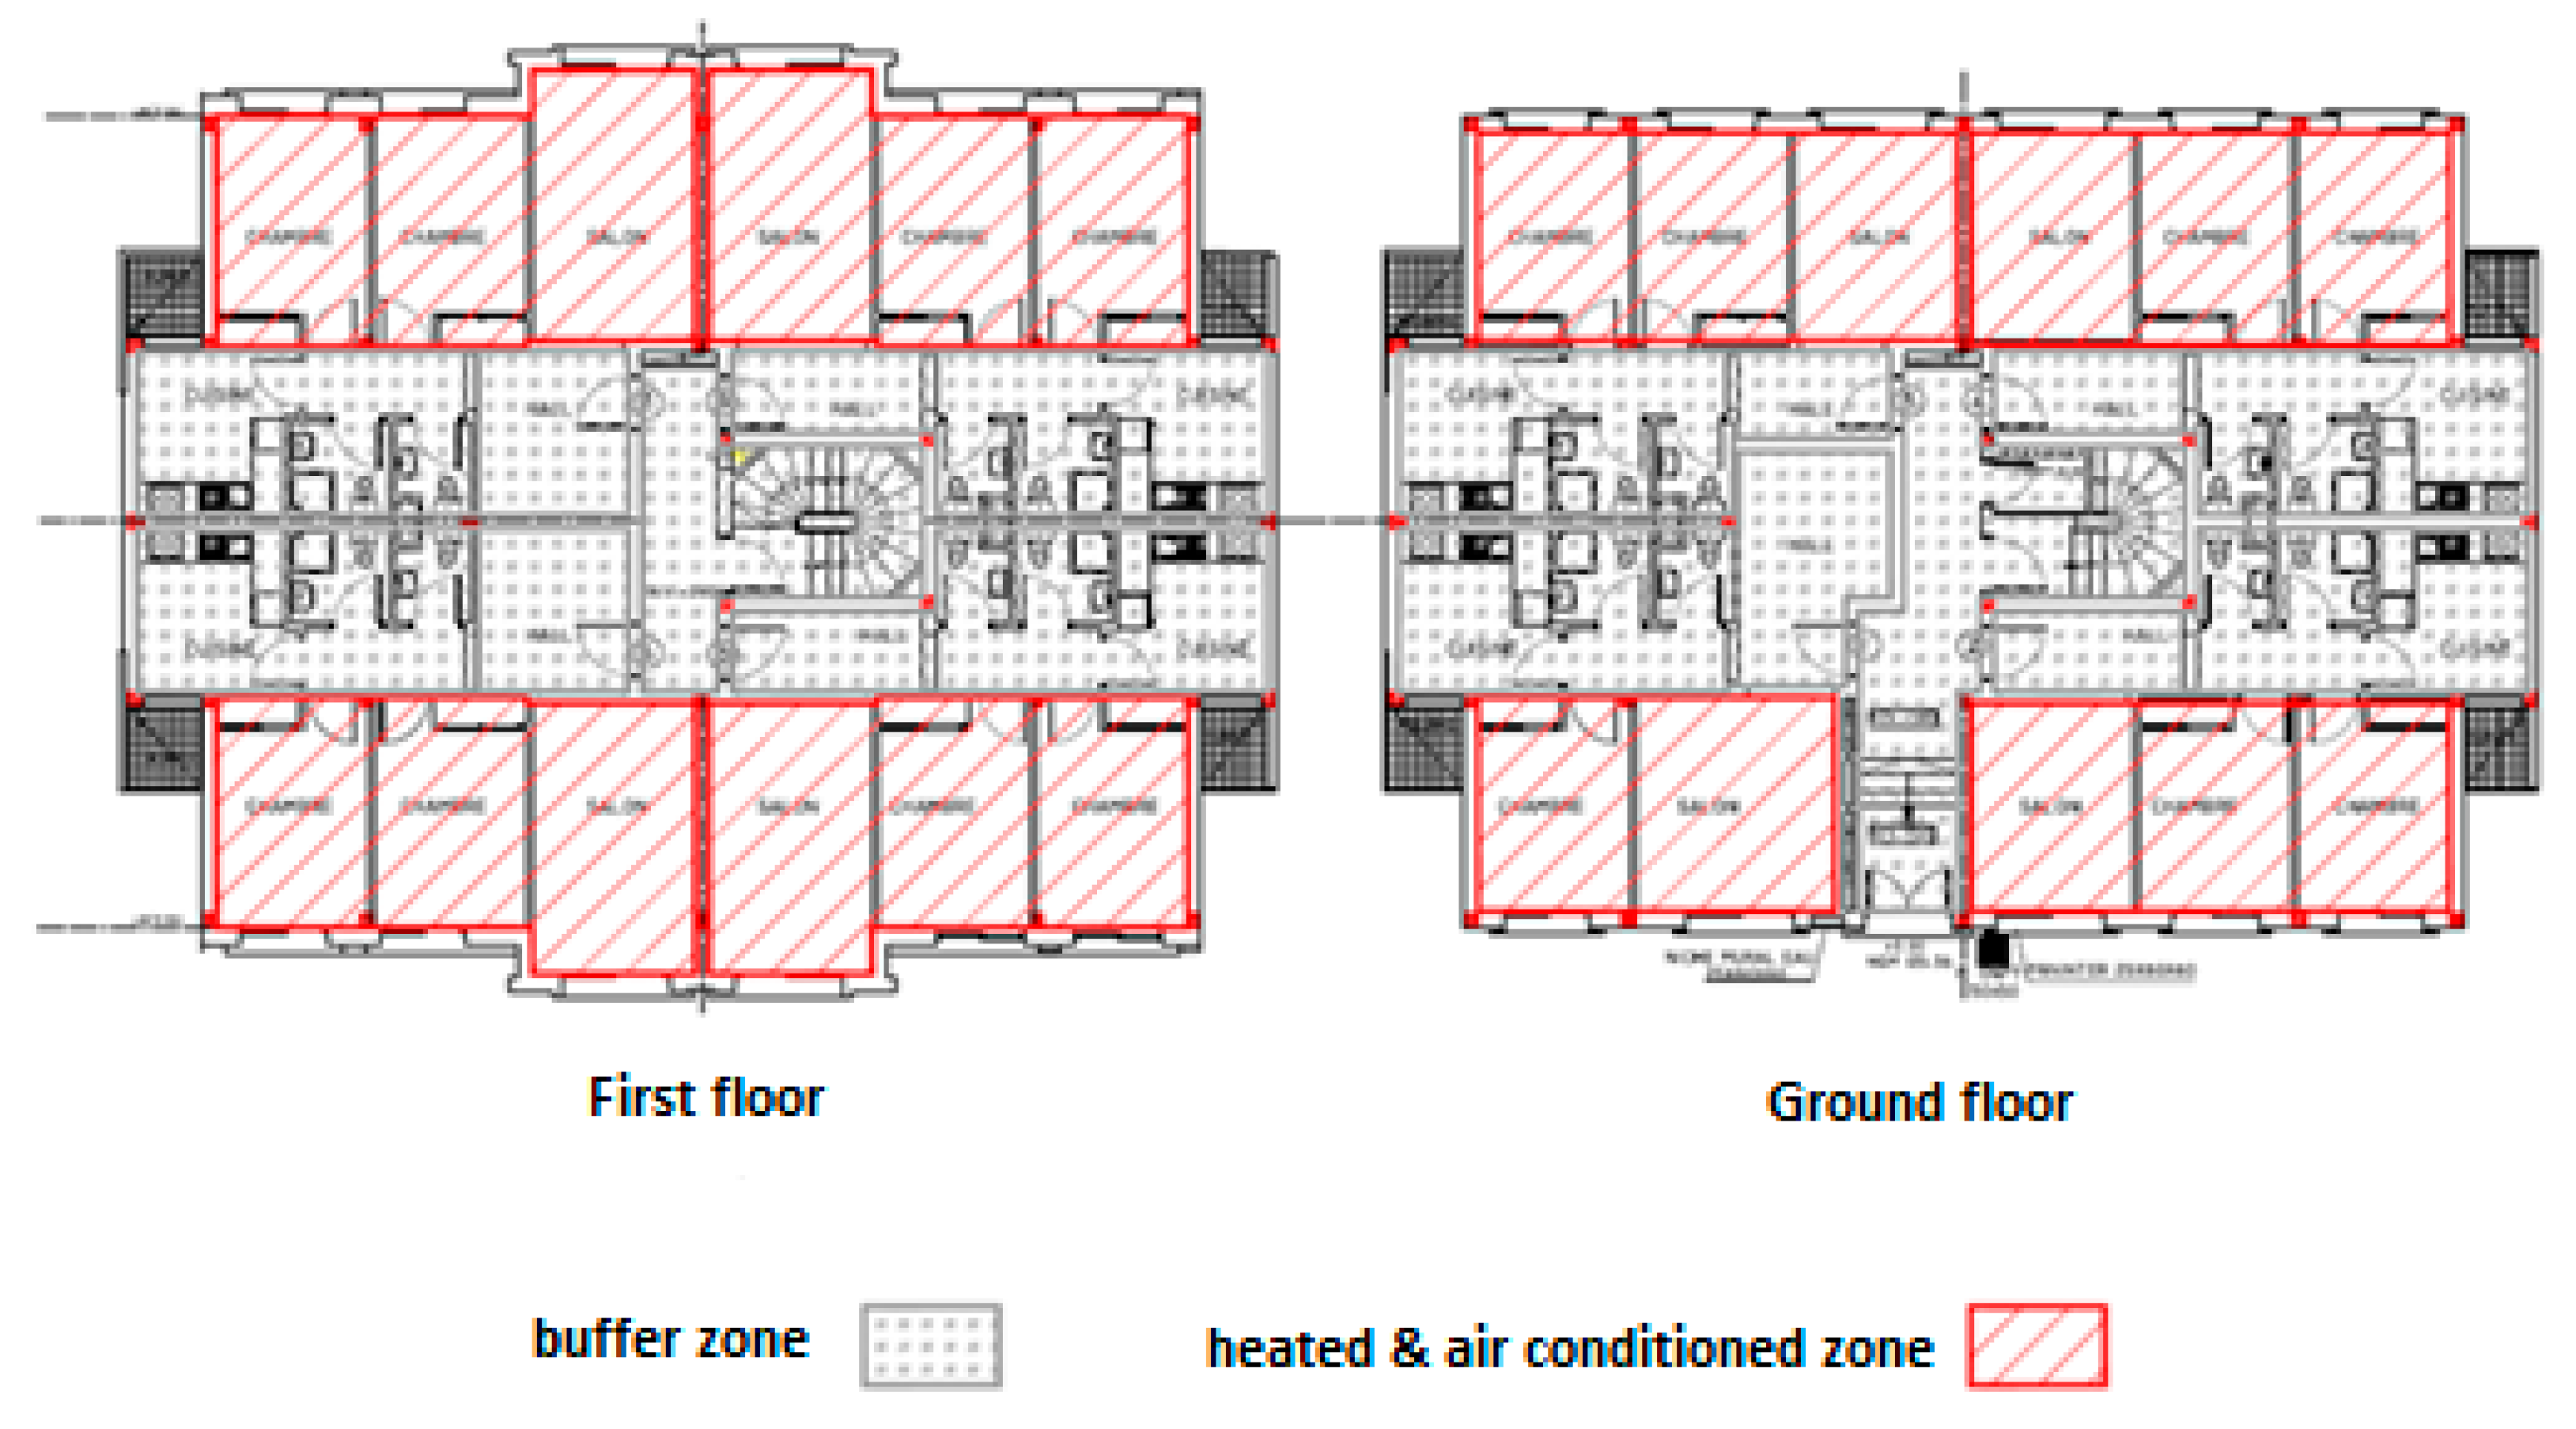
The thermal zones: the selected model was considered with 36 thermal zones, 16 heated and air-conditioned thermal zones. Each zone includes the living rooms and rooms of each apartment and 20 thermal buffer zones, which are the bathrooms, kitchens, and halls of all the apartments. Figure 4 represents the thermal zones considered. Two other hypotheses would have been possible: to model each room by a thermal zone and model each floor as a single zone.

2.1.4. Simulation Hypotheses

It is impossible to reproduce an entire building numerically, and the choice of modeling assumptions is essential. The main assumptions that have been made for the modeling of the building in question are:
Masks: the balconies and the progress of the roof were considered. Thermal solar evacuated tube collectors are composed of vacuum tubes allowing part of the radiation to penetrate, and flat plate thermal solar collectors create shading. However, it was assumed that this shading was minimal and was not considered. No close mask was considered (trees, buildings).
Internal inputs: TRNsys offers the possibility to specify the people’s thermal load according to ISO 7730 and VDI 2078. The VDI 2078 is a German standard. That is why we used the international standard ISO 7730. This standard specifies people’s heat according to their activity types. Each apartment is supposed to be occupied by four seated people releasing 100 watts according to the ISO 7730 standard. The lighting heat input is about 10 W/m2. Besides, the heat of electrical appliances constitutes additional inputs.
Ventilation: The imposed ventilation rates depend on many aspects and differ according to the regulations. Table 3 groups the values imposed by the RT2012 standard. Since the building in question is a social building, the ventilation mode chosen during the simulation is natural. In heated and air-conditioned areas, the air exchange rate is equal to 0.6 volume/hour. For areas not treated by air conditioning and heating-kitchen, bathroom, and shower, the rate of air renewal chosen is equal to 2.6 volume/hour.
Heating and air conditioning: For heating and cooling, the heating set temperature is equal to 20 °C, and that of the air conditioning is equal to 26 °C. The systems are active at all times under a constant schedule profile and the value of the control is 1.

2.1.5. The Passive Solutions

Four dynamic thermal simulation scenarios were made to evaluate heating and cooling demands. The first conventional scenario concerns the case without any energy efficiency action on the building envelope; it is the study reference case previously presented. The three others are carried out using insulation and double glazing separately, then all requirements of the Moroccan building thermal regulations. The simulation hypotheses (internal inputs, masks, thermal zoning, heating setpoint, air conditioning, etc.) are the same for the four scenarios.

2.1.6. Insulation

The purpose of insulation during this scenario is to respect the thermal transfer coefficient’s values specified by the thermal regulation of Moroccan buildings. The insulation type and thickness are not discussed in this work. The building wall thermal characteristics and floors in different Moroccan thermal zones are shown in Table 4. The windows are single glazing types with a heat transfer coefficient of U = 5.8 W/m2·K.

2.1.7. Glazing

In this scenario, the only action to be taken on the building envelope is to respect the heat transfer coefficient values set by the Moroccan thermal regulation of construction (MTRC) for glazing. The building will not be isolated in the six zones’ first simulation scenario, using the single glazing. Table 5 lists the thermal characteristics of the building envelope for the second scenario.

2.1.8. Moroccan Thermal Regulation of Construction (MTRC)

In this scenario, the MTRC requirements are met for all zones. Table 6 illustrates the thermal characteristics of the envelope adopted for the simulations.

2.1.9. The Active Solutions

The load profile is adopted for the scenarios studied (individual and collective) as the building schedule need for domestic hot water (Figure 5), where the hourly coefficient represents the hot water demand at 50 °C in 10 min.
Taking into account the habits of Moroccan consumers of the average social class, the daily need per person for domestic hot water is set at 25 L/day/person for low demand. 37.5 L/day/person for average demand. and 50 L/day/person for a high demand, also by estimating an occupancy of 4 people per apartment.

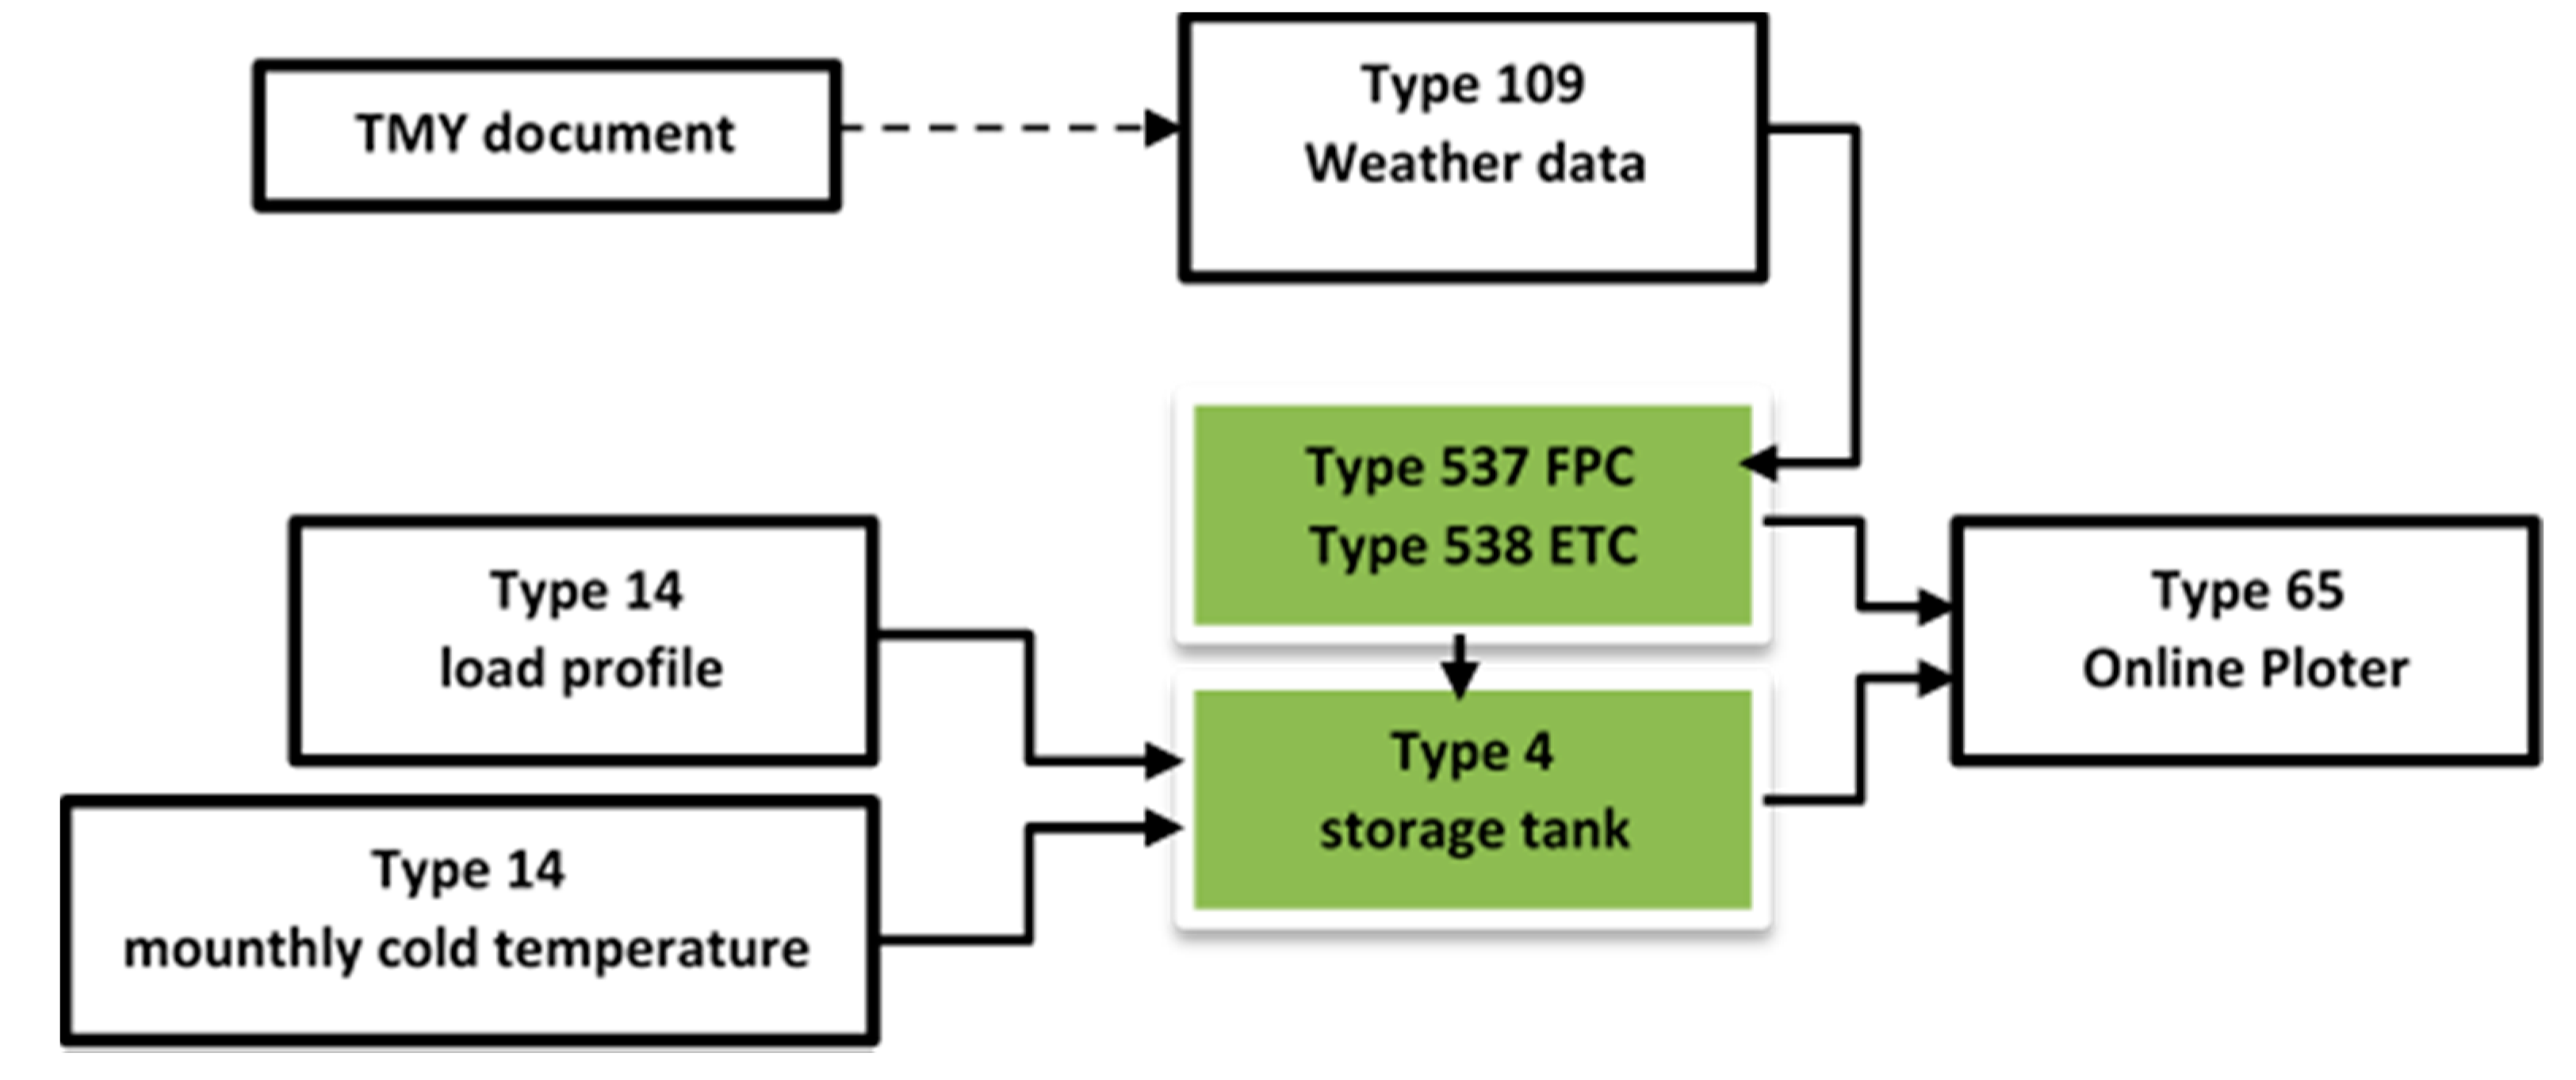
2.1.10. Individual SWH System

For the individual simulation of solar system (Figure 6), two types of solar water heaters were considered: the glazed flat plate collector and the evacuated tube collector. Both models of the individual solar system are realized under TRNsys. These used the existing library models: a glazed flat plate collector (FPC) and evacuated tube collector (ETC), the load profile model, a storage tank model, and cold-water temperature variation model. Table 7 shows the technical characteristics of the collectors and tanks used in this study scenario.

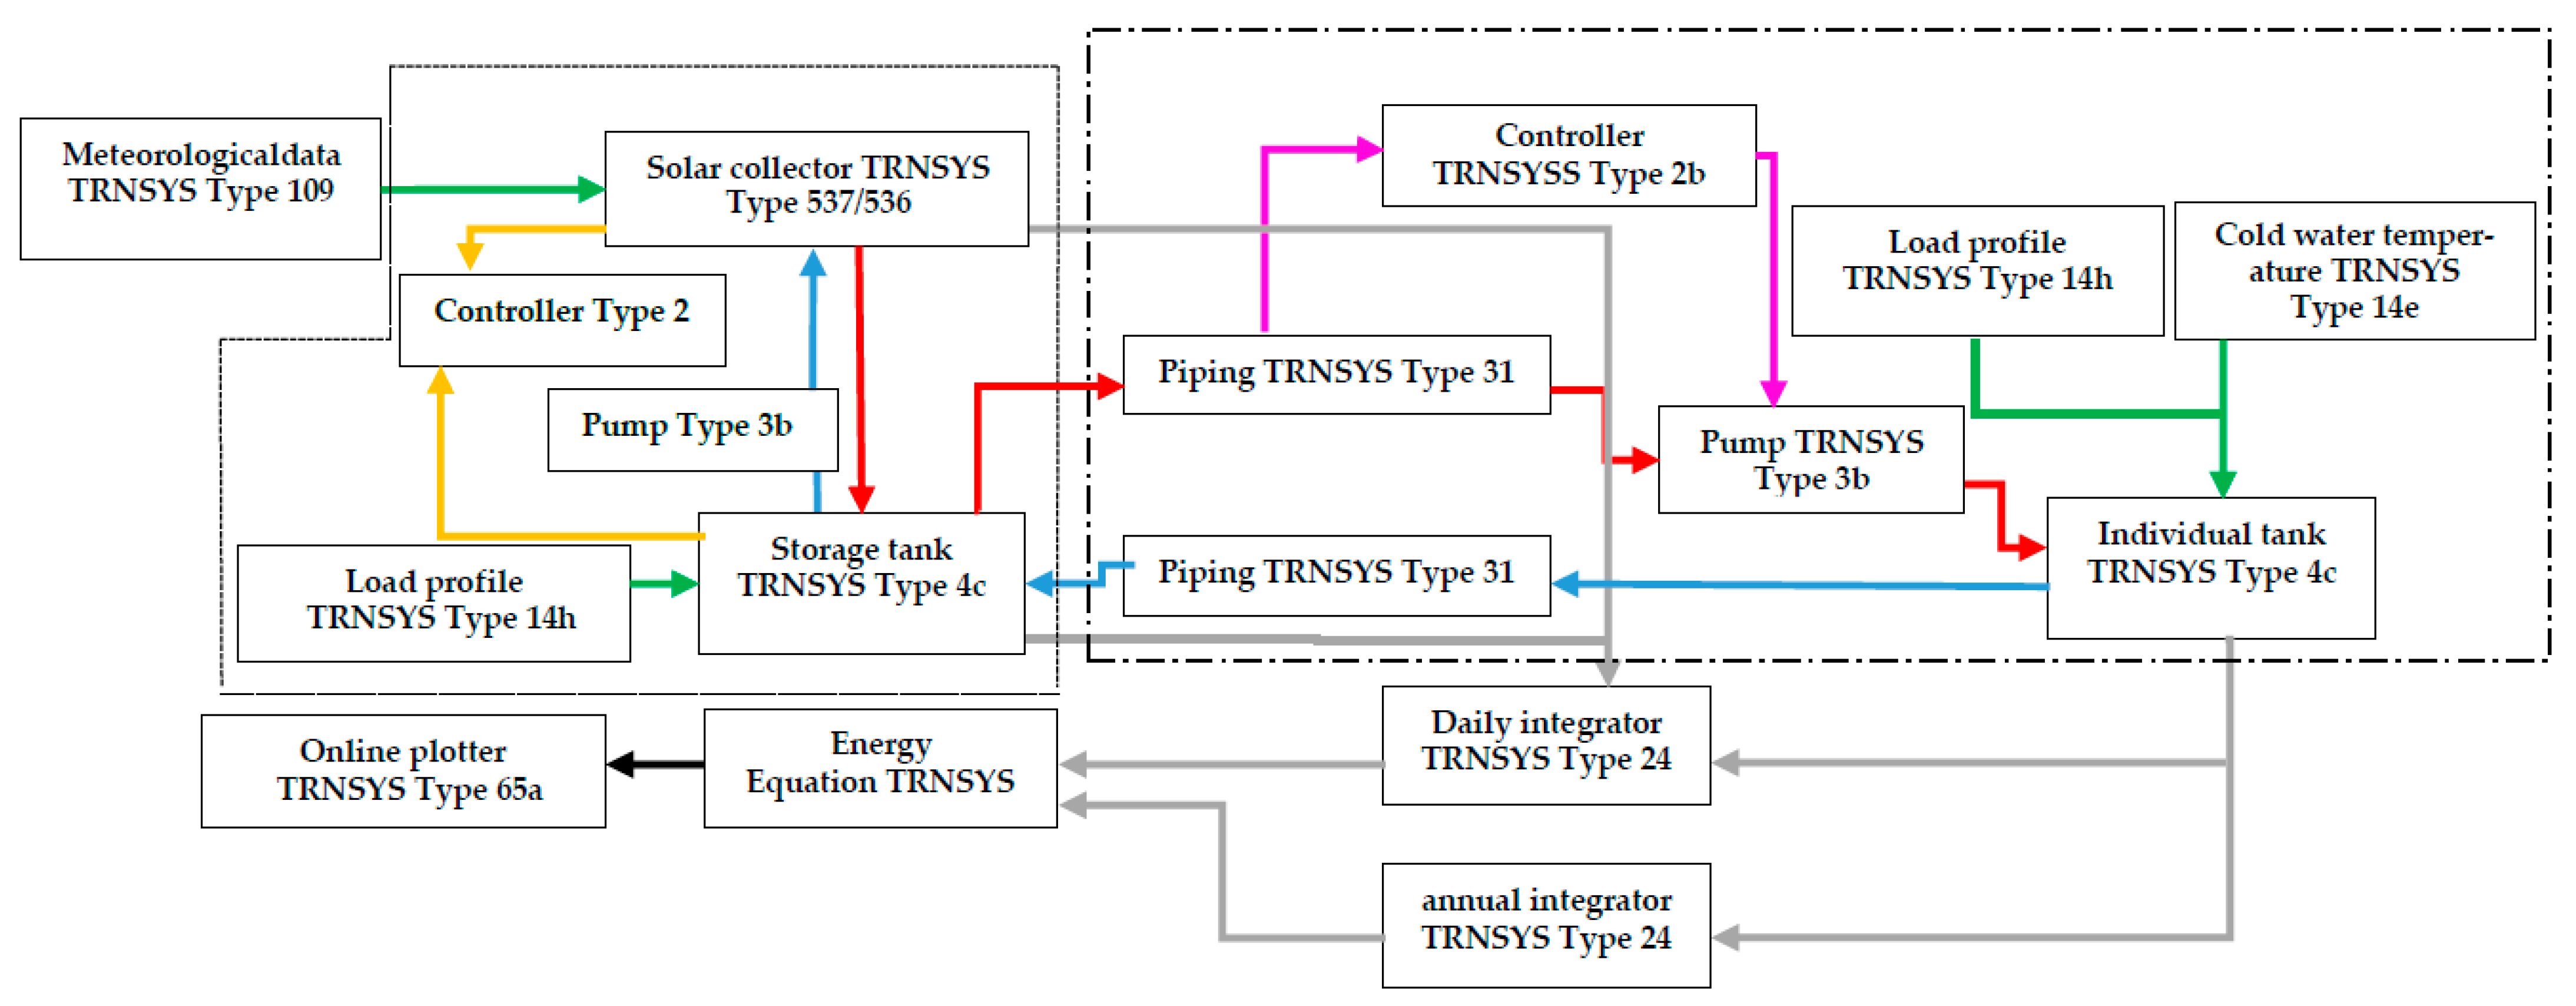
2.1.11. Collective SWH System

The apartment layout is symmetrical. Eight apartments on each side of the building have a common technical shaft. The collective solar system has been treated in two parts, with eight apartments per part that make the entire building (16 apartments). The results obtained will be identical. The configuration of the simulation’s solar system model is the collective solar water heater with collective storage and individualized back-up, which is divided into two circuits: the primary circuit or the solar circuit, which includes the field of collectors, and the solar tank with a capacity that covers the eight apartments’ needs; this circuit is located in the roof relating to the solar collectors and the principal tank. The second circuit contains the individualized tanks with an integrated back-up; it relates to the principal tank and the individual tanks for each apartment, a circulation pump, and controllers which manage the pump activation/deactivation referring to set up temperatures. Figure 7 illustrates the connection between the primary and secondary circuits of the collective solar water heater system. Table 8 shows the technical characteristics of the solar tank used in this scenario. For collectors, the same technology types used on the individual case are adopted.

3. Results and Discussion

3.1. Energy and Efficiencies

Passive Solutions

Table 9 shows the values obtained following simulation of the building modeled in TRNBUILD, for one year with a time step of one hour. The conventional building’s thermal simulation results without any energy efficiency actions clearly show the significant energy demand for heating and cooling, especially for zones 6 and 4 which exceed 200 kWh/m2/year. A decrease between 23% and 39% of total annual needs is achieved with insulation compared to the conventional case. This ratio remains higher than that set by the MTRC. The ratio decrease is vital for the heating demand reaching a 44% decline for zone 5 (Marrakech), against the annual requirement ratio in air conditioning that does not significantly decline. The decline is zero for zone 1 represented by Casablanca city; the maximum recorded is a 27% decrease for zone 6 (Errachidia).
The conformity of the glazing’s thermal characteristics with the (MTRC) makes it possible to reach a maximum decrease of 25% on the total annual ratio compared to the conventional case. This value is recorded in zone 5 (Marrakech). The ratio of air conditioning needs is not significantly reduced. This drop does not exceed 8% for zone 6 (Errachidia).
After having carried out the building dynamic thermal simulations for different thermal zones, and under the fourth scenario condition (MTRC) the insulation and glazing, the sum of the heating and cooling power ratios for each zone is greater than the one set by the MTRC; this is justified by the fact that the building is misdirected, which increases solar gain.
On the other hand, we compared this to the results obtained by the simulations of the conventional, insulated, and glazed scenarios. In zone 4 represented by Ifrane, a maximum saving of 62% is achieved between the conventional case and the MTRC scenario. This remark is made for the other three scenarios where maximum savings are achieved in zone 4.
It is concluded that the application of a double-glazing solution in buildings, without the application of insulation, does not lead to significant savings in comparison with the cost of investment—a comparative economic study will be presented afterwards. On the other hand, insulation alone makes it possible to reach a savings threshold that is considered reasonable.
From this, the application of the MTRC allows significant energy consumption savings of buildings even if, in this case study, the results were higher than the values set by the MTRC. This difference is explained by the orientation of the building, which is oriented towards the west. We can also add that the simulation does not recreate the reality without error, given the large number of assumptions made in this study.

3.2. Active Solutions (SWH)

3.2.1. Individual Solar Water Heater

Figure 8a,b, Figure 9a,b, and Figure 10a,b show the monthly variation of useful energy extracted from the tank, the extra energy and solar fraction for the three different demands (low, standard, and high), for the two technology types. The collected energy varies according to demand; this is due to catchment surface variation. The collected energy varied between 214 kWh and 146 kWh in August and February, respectively, for the low demand case (150 L) and between 311 kWh and 214 kWh for the standard demand case (200 L). For high demand (300 L), energy varied between 400 kWh in August and 274 kWh in February.
The energy extracted from the solar storage tank varied according to the load profile. The solar fraction varies in the same way for the three cases. It varied between 70% in February and 98% in August.
The energy collected by the solar thermal collectors (evacuated tube collectors (ETC), and flat plate collectors (FPC)) varies in function of the loads’ profiles; this is due to the load profile influence on the collector’s area. The surface increases with the increase in the amount of water exhausted.
The energy extracted from the tank, which means the energy required to heat the sanitary water, varies during the year, depending on the cold-water temperatures. This energy is higher than the useful energy produced during the year’s cold period, and the auxiliary system compensates for this difference. Note that the backup system is requested in the summer. This can be explained by the demand for hot water during the night and the morning’s first hours.
The solar fraction varies at the same rate for the three types of use. This fraction reaches a maximum value in the summer by the order of 99%.
The two solar water heater technologies comparison, based on the results presented in this section, makes it possible to conclude that the evacuated tube collectors perform better than the glazed flat plate collectors in the third zone. To analyze the performance of the two technologies in the Moroccan context and draw comparative conclusions, simulations of solar water heaters are made for all thermal zones of Morocco. The analysis of the simulation results shows that evacuated tube solar water heaters are better than glazed flat plate collectors, during cold seasons of the year, in areas with a Mediterranean climate in the North and Oceanic in the West. On the other hand, the two technologies are identical for the warm seasons. For the fourth zone, we note that the vacuum tubes are more efficient from March. In areas that have a continental climate zone 5 and a Saharan climate zone 6, the vacuum tube collectors have a better performance than flat glass collectors throughout the year.

3.2.2. Collective Solar Water Heater

Simulations of solar systems for domestic hot water production make it possible to evaluate collectors and production systems’ performance. Figure 11a and Figure 12a summarize the simulation results for flat plate and vacuum tube collectors. It can be seen that the useful energy produced by the vacuum tube collectors is higher than that resulting from the use of glazing flat plate collectors during the cold months. This is explained by the round shape of the tubes, which enables them to collect different radiation types (direct, reflected, etc.) even on cloudy days, unlike plans that have a lower yield.
Along the day, thermal losses produced in pipes and storage tanks are almost identical throughout the year, causing the auxiliary heater’s operation (backup system) all year, with a decrease during hot months.
The efficiency of the domestic hot water production system based on the simulations carried out shows that the vacuum tube system’s performances are higher than the flat plate collector. During the cold months, the efficiency of the vacuum tube system reaches 80% in February. However, the efficiency of both systems is identical during the summer months. The vacuum tube collectors’ field efficiency is always greater than that of the FPC, as shown in Figure 11b and Figure 12b.
The results of collective solar system simulations related to domestic hot water production show that the solar water heaters with ETC are more efficient than FPC, whatever the demand (low, standard, or high) under the same load profile.
An analysis of the solar fractions and energies provided concludes that the evacuated tubes are more efficient than the glazed flat plate technology on all of Morocco’s cold zones (zones 4, 5, and 6). For zones 1 and 2, characterized by their moderate climates, we note that the two technologies are identical the year except for the winter months, where ETC systems deliver more energy than the FPC collectors.

3.3. Economies

3.3.1. Hot Water

The hot water production is ensured in the Moroccan context in general by instantaneous gas water heaters in the first place, or by instantaneous electric water heaters. There are also storage water heaters. Table 10 summarizes the overall yields of the various domestic hot water systems considered in this study.
The energy comparison focused only on the individual SWH systems. The comparison of the collective case requires a study of the conventional collective systems of hot water production.
The power required to produce domestic hot water varies according to the climate zone which system thermal loss variation and specific cold-water temperature for each location (variation of cold-water temperature during the year). Figure 13, Figure 14 and Figure 15 represent the annual energy demand variation for domestic hot water production for the various conventional systems in the different Moroccan thermal zones according to the demand for domestic hot water.
It was found that the gas storage water heater is the most energy-consuming of all systems, followed by the gas instantaneous water heater. The instantaneous electric water heater is the most economical technology. The required annual energy thresholds vary according to the thermal zones; this is due to the variation of each zone’s cold-water temperatures.
This part concerned the savings evaluation of domestic hot water energy production and consumption by conventional systems and solar production systems. We can see a maximum energy saving of 97% by replacing a gas water heater in zone 5 (Marrakech) by a solar water heater ETC system with an electric auxiliary heater. The minimum savings obtained was about 58%, replacing an instantaneous electric water heater in zone 4 (Ifrane) by a solar water heater with FPC technology with gas back-up.

3.3.2. Passive Solutions

The total energy demand for the building is represented per m2 heated per year. Dynamic thermal simulations have evaluated three solutions:
-
Building with insulation respecting the MTRC requirements.
-
The glass building respecting the MTRC requirements.
-
Building respecting all MTRC requirements.
The three solutions are compared with the conventional case. Figure 16 shows the ratios obtained for each thermal zone.
The MRTC allows a significant reduction of demand for heating required by the conventional case (reference case). It is found that the glazing solution (double glazing for most areas) does not give a significant saving compared to the insulation solution. It is shown on Table 11.
This work aims to compare the savings generated by active and passive energy efficiency actions. Table 12 groups the energy-saving quantities using the solar water heater system compared to the conventional water system.
Table 11 and Table 12 show that the solar water heater solution saves up to 7649 kWh/year, and in the worst case, it is possible to reach 1227 kWh/year, which is higher than 44% of the savings generated by passive solutions. Financial analysis is presented to complete this energy analysis, considering the savings and investments for different actions.

3.4. Financial Analysis

It is not enough to determine the electricity bill based on the difference between the conventional case energy demand and after applying energy efficiency actions to evaluate the savings achieved. The incremental billing system influences the results.
The electricity bill savings require evaluating the conventional case bill and the new one after applying the energy efficiency actions.
Table 13 summarizes the annual energy bill for conventional domestic hot water systems, as presented previously in this paper.
Table 14 shows the annual energy bill for the auxiliary system consumptions of the solar water heaters, based on the simulation results.
Table 15 summarizes the maximum and minimum savings achieved after replacing the conventional system (gas water heater) by the solar one. The next step in this comparative study is calculating the annual savings achieved by passive energy efficiency solutions. It is assumed that the heating and cooling systems are electric, so it is necessary to initially calculate the energy bills of the various scenarios presented previously, which were devoted to the building’s simulations. It is to deduce the maximum and minimum values of the savings generated, comparing it with the solar water heater savings results. The saving was calculated by taking into account two scenarios based on Moroccan government gas subsidies.
The financial amounts presented in this part are represented in MAD (Moroccan dirham) which is equivalent on 14 December 2020 to 0.11 USD.
In Morocco, the state subsidies varied following the fall in the price of butane gas, with its average unit subsidy increasing from 4840 MAD/Ton in 2018, or 58 DH per 12 kg cylinder and 14.5 MAD per 3 kg cylinder, to 3652 MAD/Ton in 2019 (January–September period), corresponding to 44 MAD per 12 kg cylinder and 11 MAD per 3 kg cylinder. In the present work, the economic study was carried out referring to 2019 prices.

3.5. Building

Table 16 and Table 17 show the heating and cooling energy bill—the same energy reductions generated by energy efficiency actions reflected the energy bills. Glazing does not realize significant gains. However, insulation or both solutions combined are more significant. The glazing solution does not exceed 18% of savings compared to the insulation. On the other hand, the insulation reaches 44%, the combination of the two solutions, which represent the MTRC, reaches a reduction of 66% compared to the conventional case.
The generated savings comparison of the solar water heaters production and the passive energy efficiency actions result in the maximum solar water heaters savings being more significant than passive actions. The most unfortunate cases of solar water heaters savings are close to those reached by passive actions, sometimes even lower.

3.6. Economies Comparative Ratios; Active vs. Passive

In this part, the rate represented by the economy reached by each solution proposed during this work is defined. Given the large number of possibilities of conventional domestic hot water systems and the replacing action by solar water heaters, the following cases are treated:

3.6.1. Passive Configurations

Configuration 1: electric heating and cooling, electric SWH.
Configuration 2: electric heating and cooling, gas SWH.

3.6.2. Active Configurations

A: Instantaneous electric water heater.
B: Instantaneous gas water heater without pilot light.
1: SWH-ETC with electric auxiliary heater.
2: SWH-ETC with gas auxiliary heater.
3: SWH-FPC with electric auxiliary heater.
4: SWH-FPC with gas auxiliary heater.
All results are for a standard domestic hot water application (volume of 200 L).
According to Table 18 and Table 19, the solar water heater for configuration 1, where the domestic hot water production system is electric, achieves savings rates on the building energy bill higher than that achieved by applying passive actions in all Moroccan thermal zones.
Under the second configuration conditions, the active solution is more interesting for all thermal zones than insulation and glazing actions. However, the MTRC saves more than the solar water heaters in the second configurations in the hottest areas.
The solar water heater solution with FPC in the case of configuration 1, where the domestic hot water production system is electric, allows saving rates on the building energy bill, almost identical to the second configuration in case of subsidies. In contrast, the SWH-ETC, compared to the conventional solution, generates considerable savings without subsidies.
In both configurations, it can be seen that solar water heater solutions deliver significant savings on buildings’ energy bills compared to passive energy efficiency solutions.

3.7. Payback Time

Another critical factor in helping to make investment decisions in energy efficiency actions is the time to return on investment. The actions investments and the time of return on investment are evaluated.

3.7.1. Active System

The study treats two cases; individual and collective. The amounts given in results, including the prices of the various installation components and accessories, the maintenance costs, and the defective parts’ replacement estimates, are not considered.
It can be seen in Table 20 that the payback time for a solar water heater project in the current case of subsidized butane gas prices is not attractive; the payback time in this case is more than 18 years which makes the project excessively uninteresting. On the other hand, for electric systems and unsubsidized butane gas, the payback times are almost identical depending on the demand; with more demand the return on investment (ROI) is lower, and the project becomes interesting.
ROI’s collective installations are calculated according to ETC and FPC systems and under the conditions of a standard demand for domestic hot water. In a collective building, the demand for hot water is not identical. Investments for this case were calculated without including maintenance charge prices and replacement estimates for defective parts. The assessment system consists of:
  • 12 solar collectors,
  • 2 solar tanks of 1600 L,
  • 16 tanks of 200 L
  • 400 m of piping,
  • 16 electronic controllers,
  • 16 circulation pumps,
  • 2 copper tube collectors.
Following the same methodology of the individual part, the time of return on investment was calculated under two scenarios:
  • Replace a conventional electric system with the solar water heater.
  • Replace a conventional gas system with the solar water heater.
A is the electric solar water heater, E1: Gas is an instantaneous water heater without a pilot light and with subsidies. E2 is a gas instantaneous water heater without a pilot without subsidies.
Table 21 shows that the payback time for subsidized butane gas prices is relatively high, making collective solar projects unattractive in the current economic context. On the other hand, in the case of an electric system or unsubsidized butane gas, the return on investment does not exceed 8 years in most Moroccan zones. Moreover, in the zone of Fes, the time of return on investment on a collective solar project using FPC technology does not exceed 7.5 years.

3.7.2. Passive Actions

In the technical study, the insulation type was not very important because its purpose is to compare the savings of energy efficiency actions and not insulation specific technical studies. For this, the economic study data prices represent the average of the current prices on the market. Table 21 summarizes the insulation prices and the calculated return on investment time. It is noted that the time of return on investment is relatively short for insulation projects, and not more than a year except for zone 5, where it reaches two years. Furthermore, the double-glazing solution for zones 2 and 3 is not attractive, as the investment payback time exceeds 25 years. On the other hand, in zones 4 and 6 the double-glazing solution is fascinating; the ROI varies between 4 and 5 years, which is considered reasonable. This solution’s payback time in zones 3 and 5 is 8 years, which makes this solution moderately interesting.
The application of the MTRC consists of combining the two previous solutions (insulation and glazing improvements).
The high payback time of the glazing improvement projects shown in Table 22 is reduced by the combination of various building improvements according to the MTRC. It is found that the ROI for zones 1 and 2, which was 25 years for glazing and one year for insulation, is reduced to 5 years for zone 1 and 3 years for zone 2 after applying the MTRC. Investment in the MTRC scenario is considered attractive, given the reduced ROI observed for all Moroccan climatic zones. The results obtained show that, despite the energy savings achieved with collective solar hot water production systems, low butane gas costs in Morocco and initial installation costs are detrimental to the project’s profitability.
Passive energy efficiency solutions deliver significant savings in zones with a cold winter and a hot summer season.
In summary, it is difficult to make a clear and definitive judgment on comparing the savings made by solar solutions to produce domestic hot water and the actions on the enveloped building, but the active solutions are still more attractive than the passive ones.

4. Conclusions

Four building simulation scenarios under TRNsys were adopted (conventional, insulated, glazing improvements, and applying the Moroccan standard requirements). The glazing solution does not exceed 6% in savings on total energy demand (including the electrical demand for domestic hot water), while insulation reaches 17% in savings in zone 4. MTRC is the best solution. This solution allows for saving 27% of energy consumption.
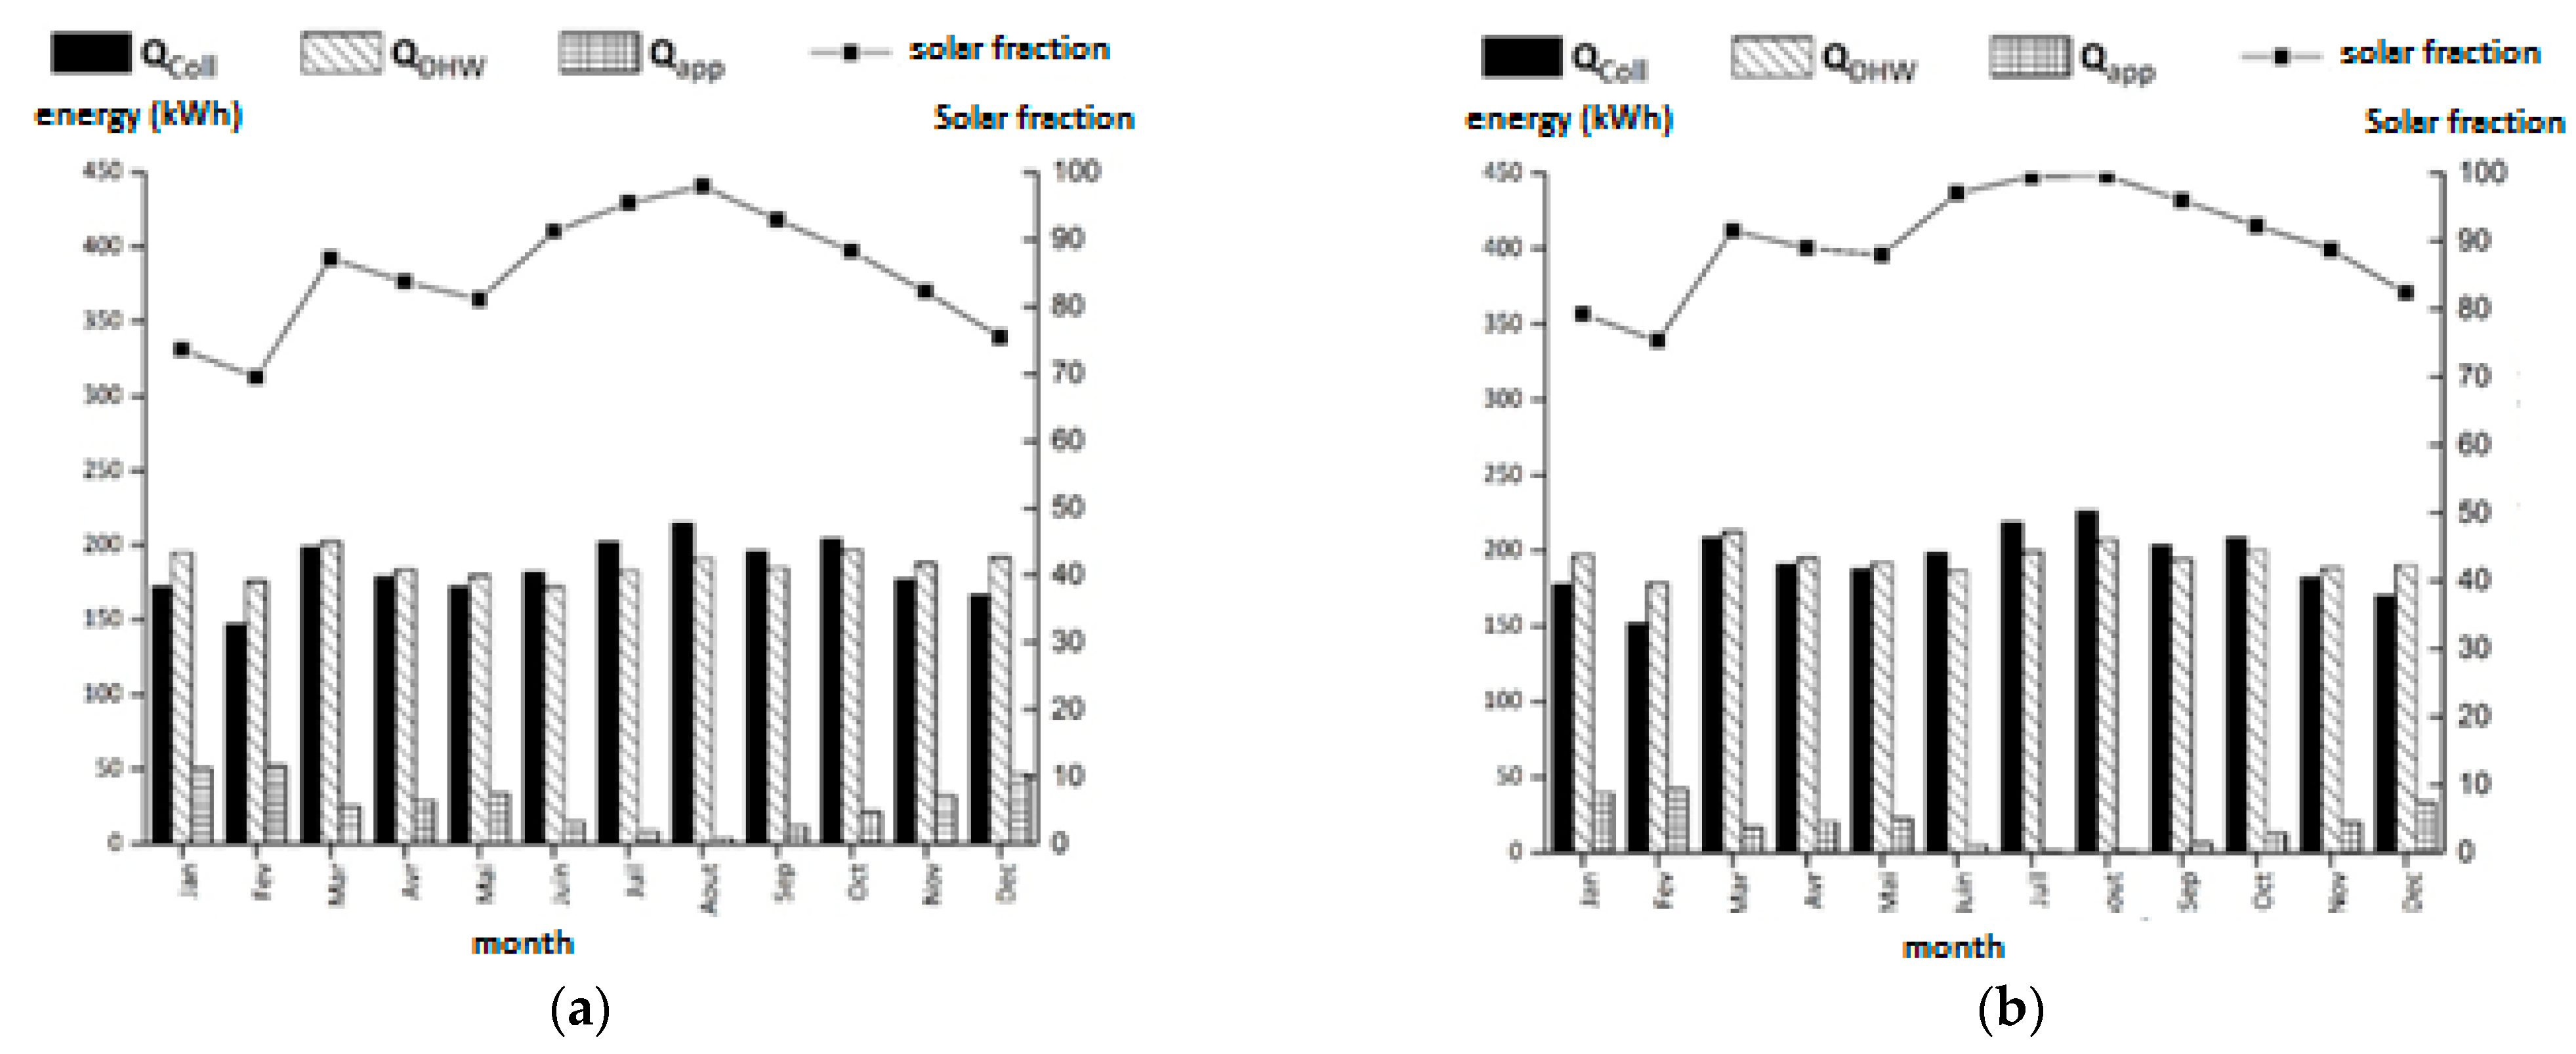
The study’s active solutions were under various domestic hot water production scenarios using solar systems, introducing different types of solar collectors, and the variables of the backup systems.
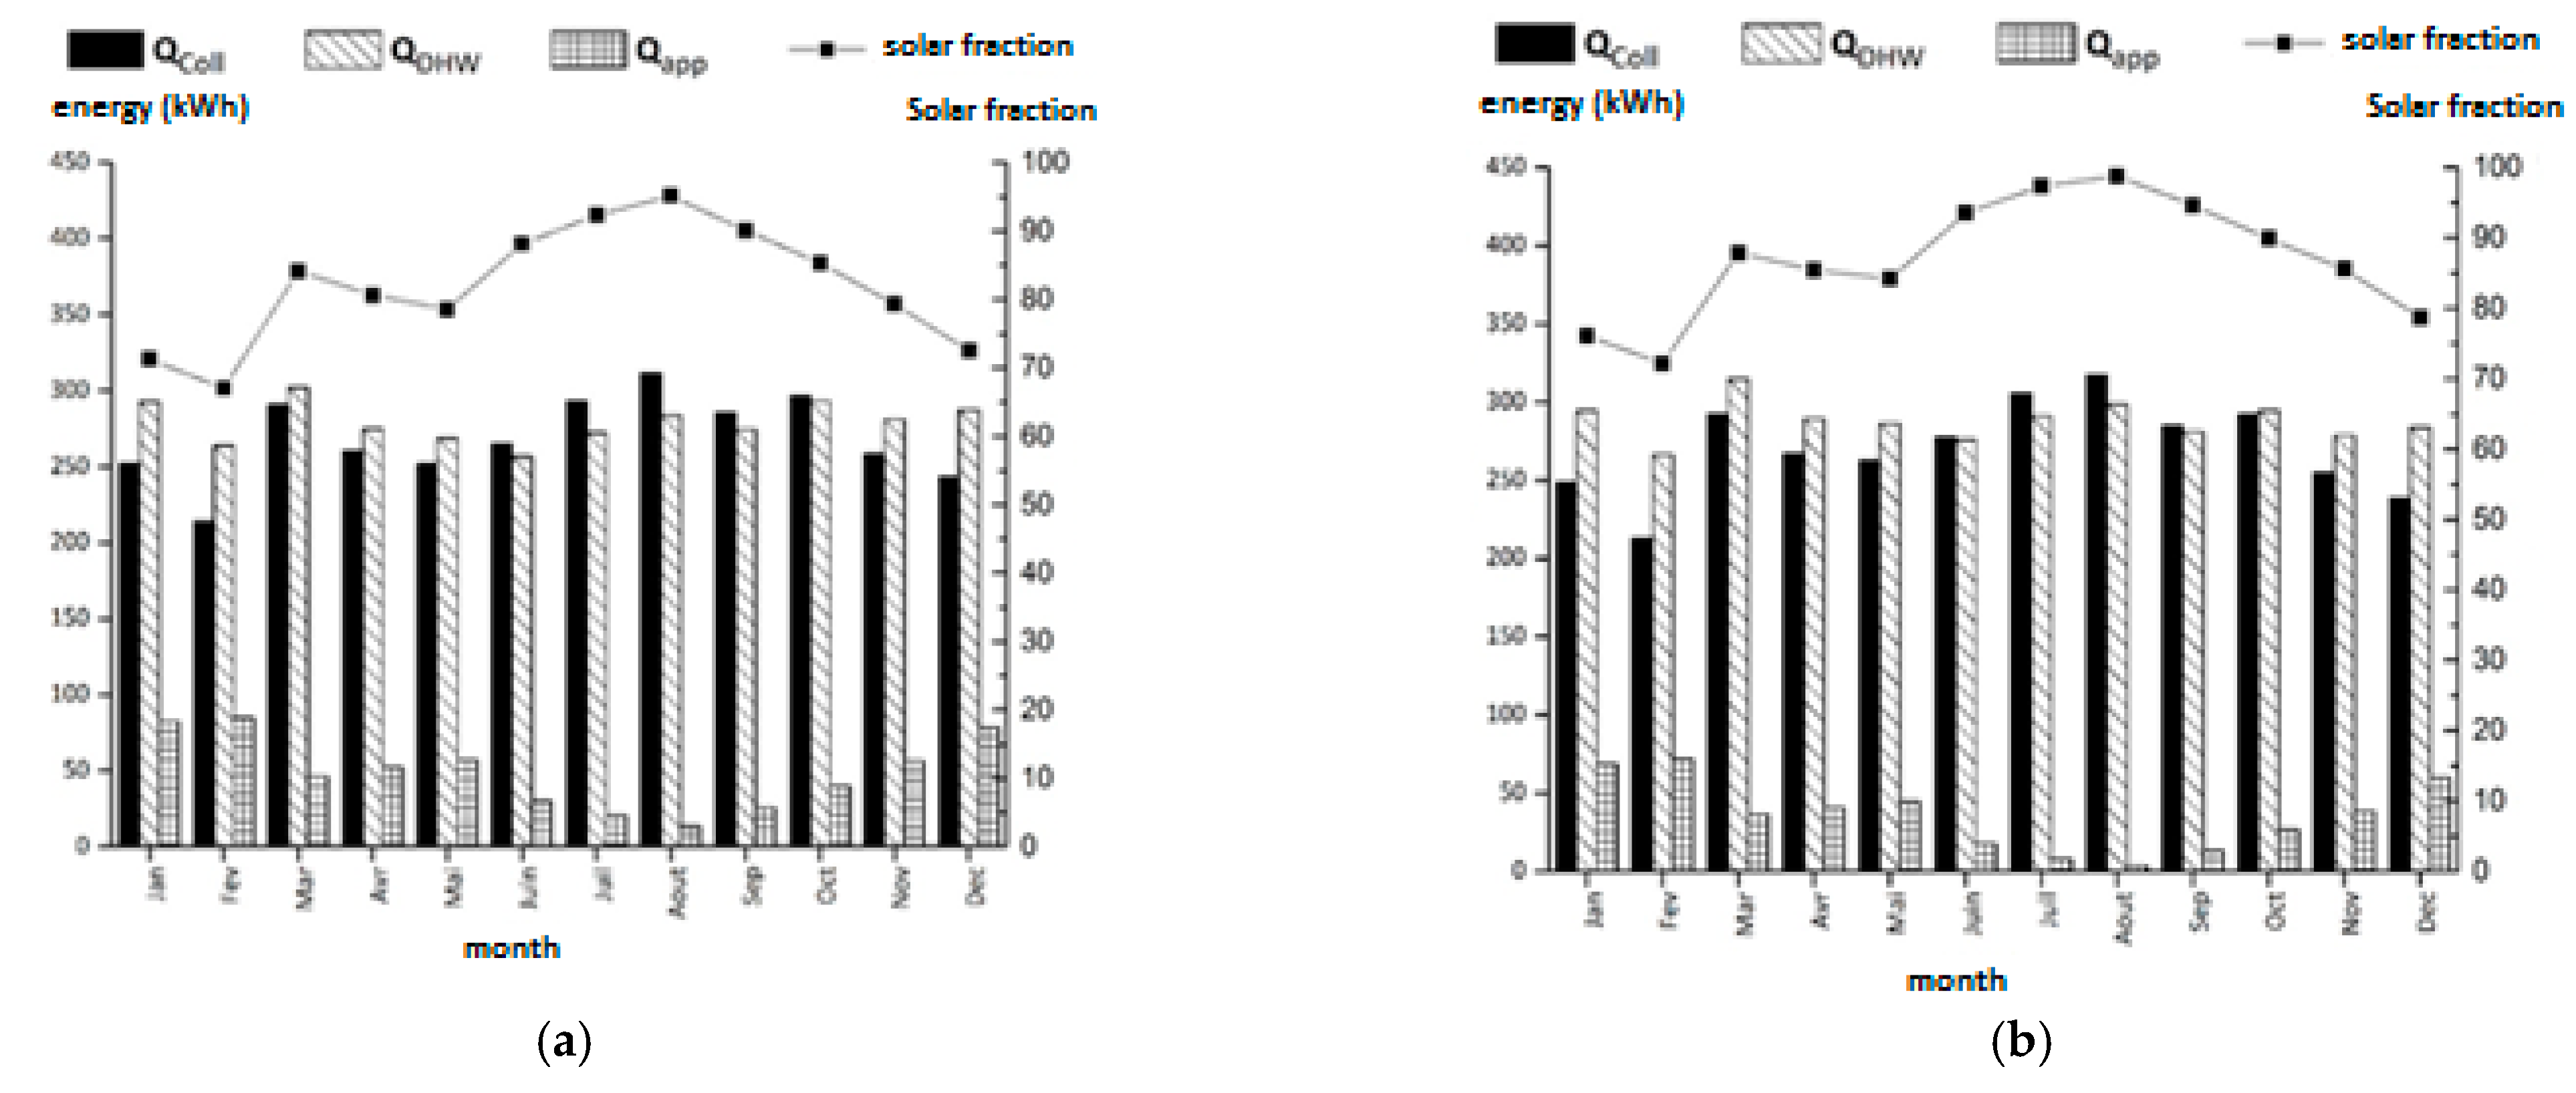
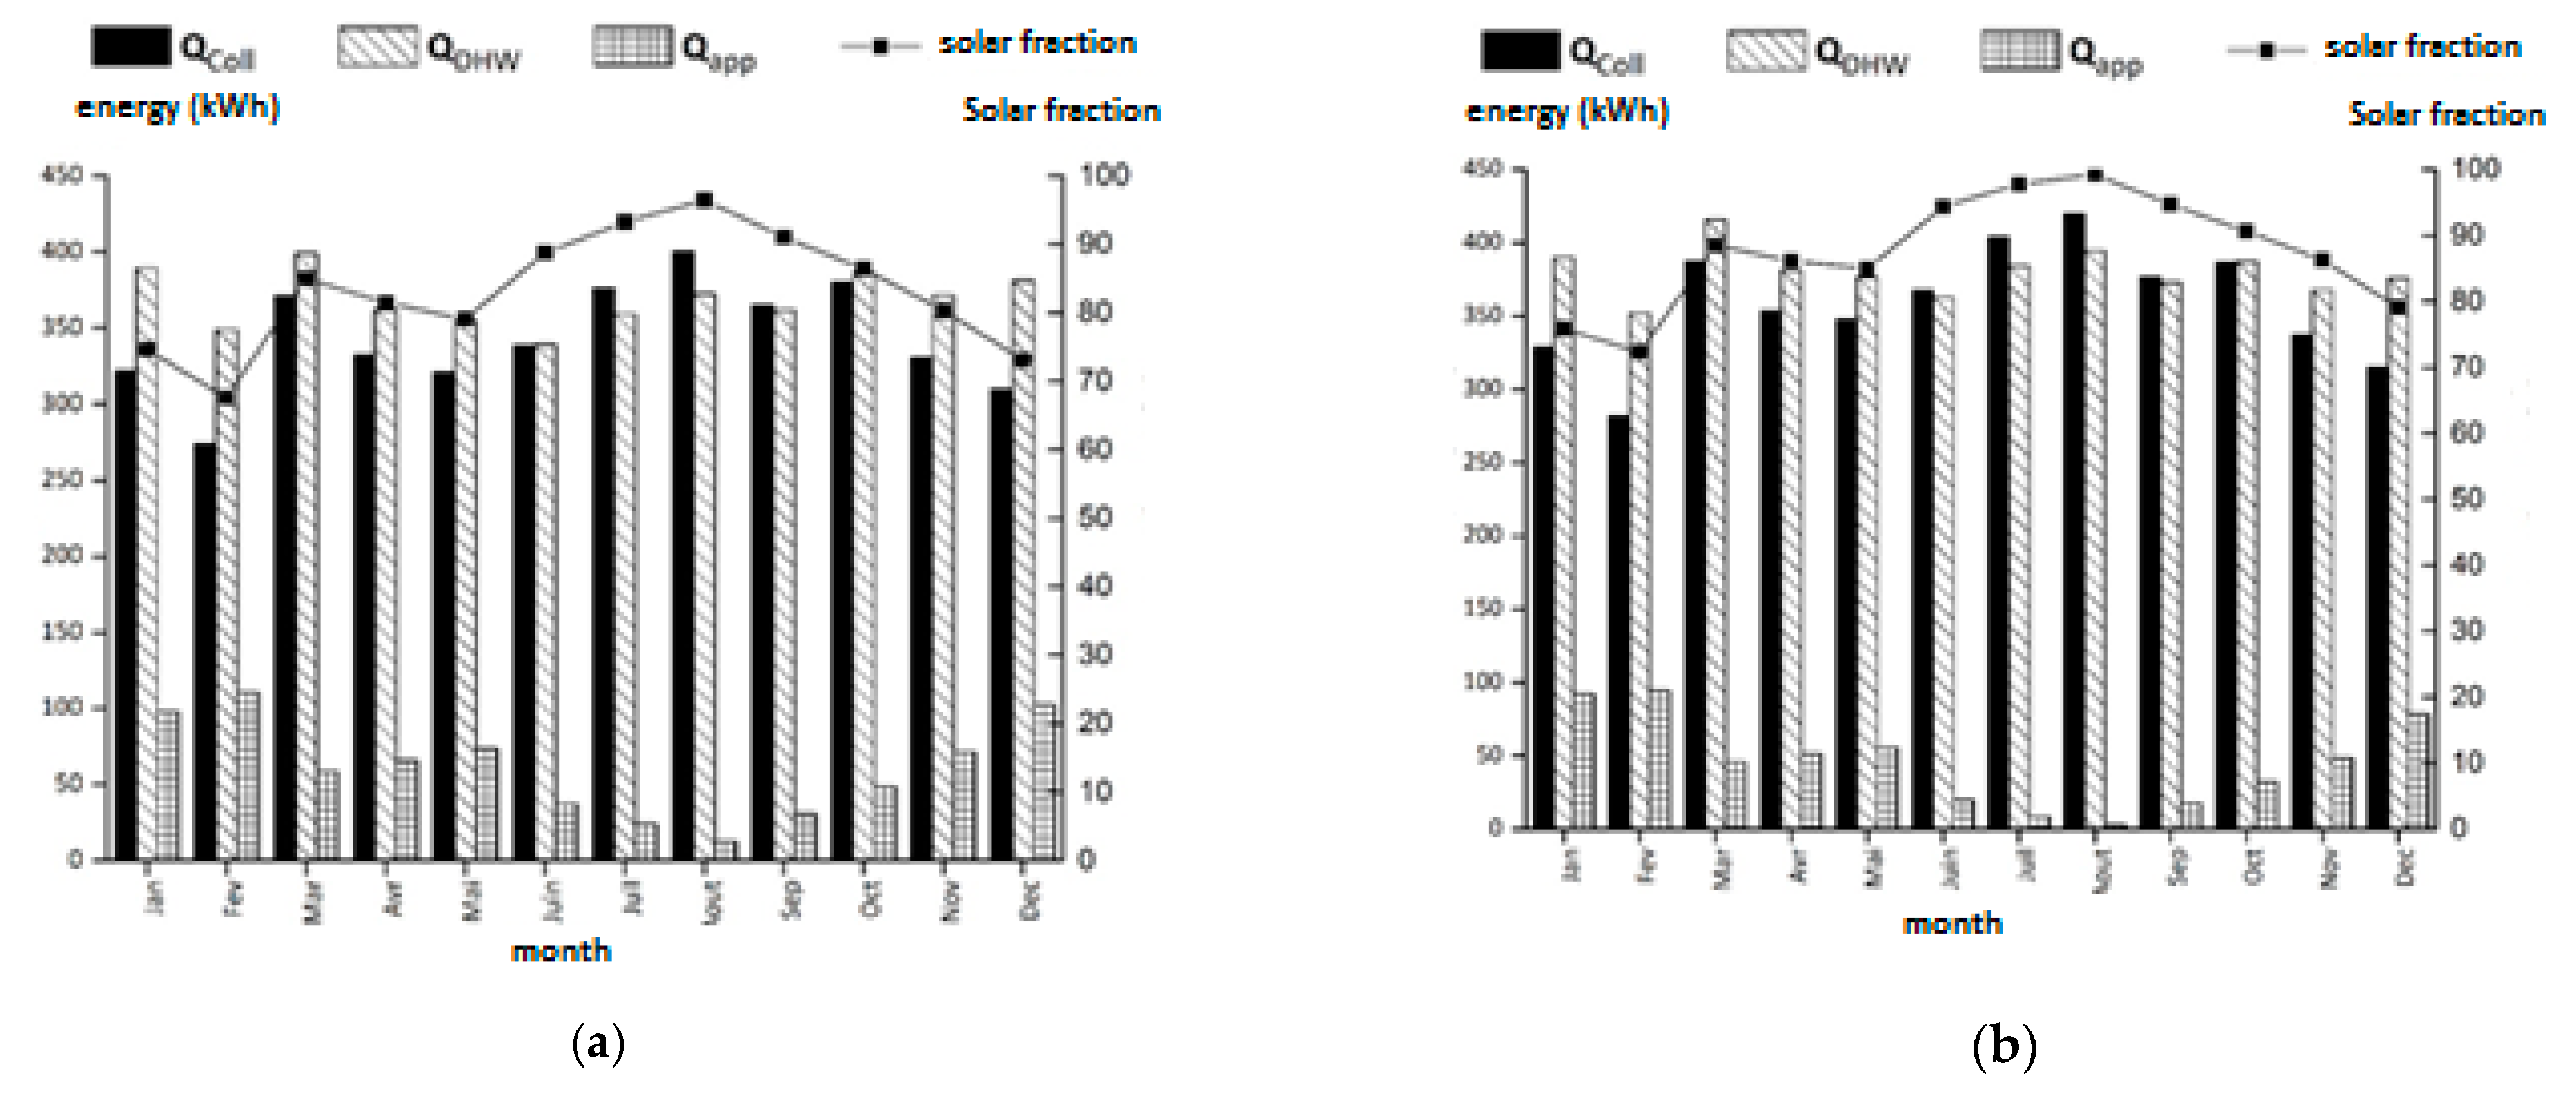
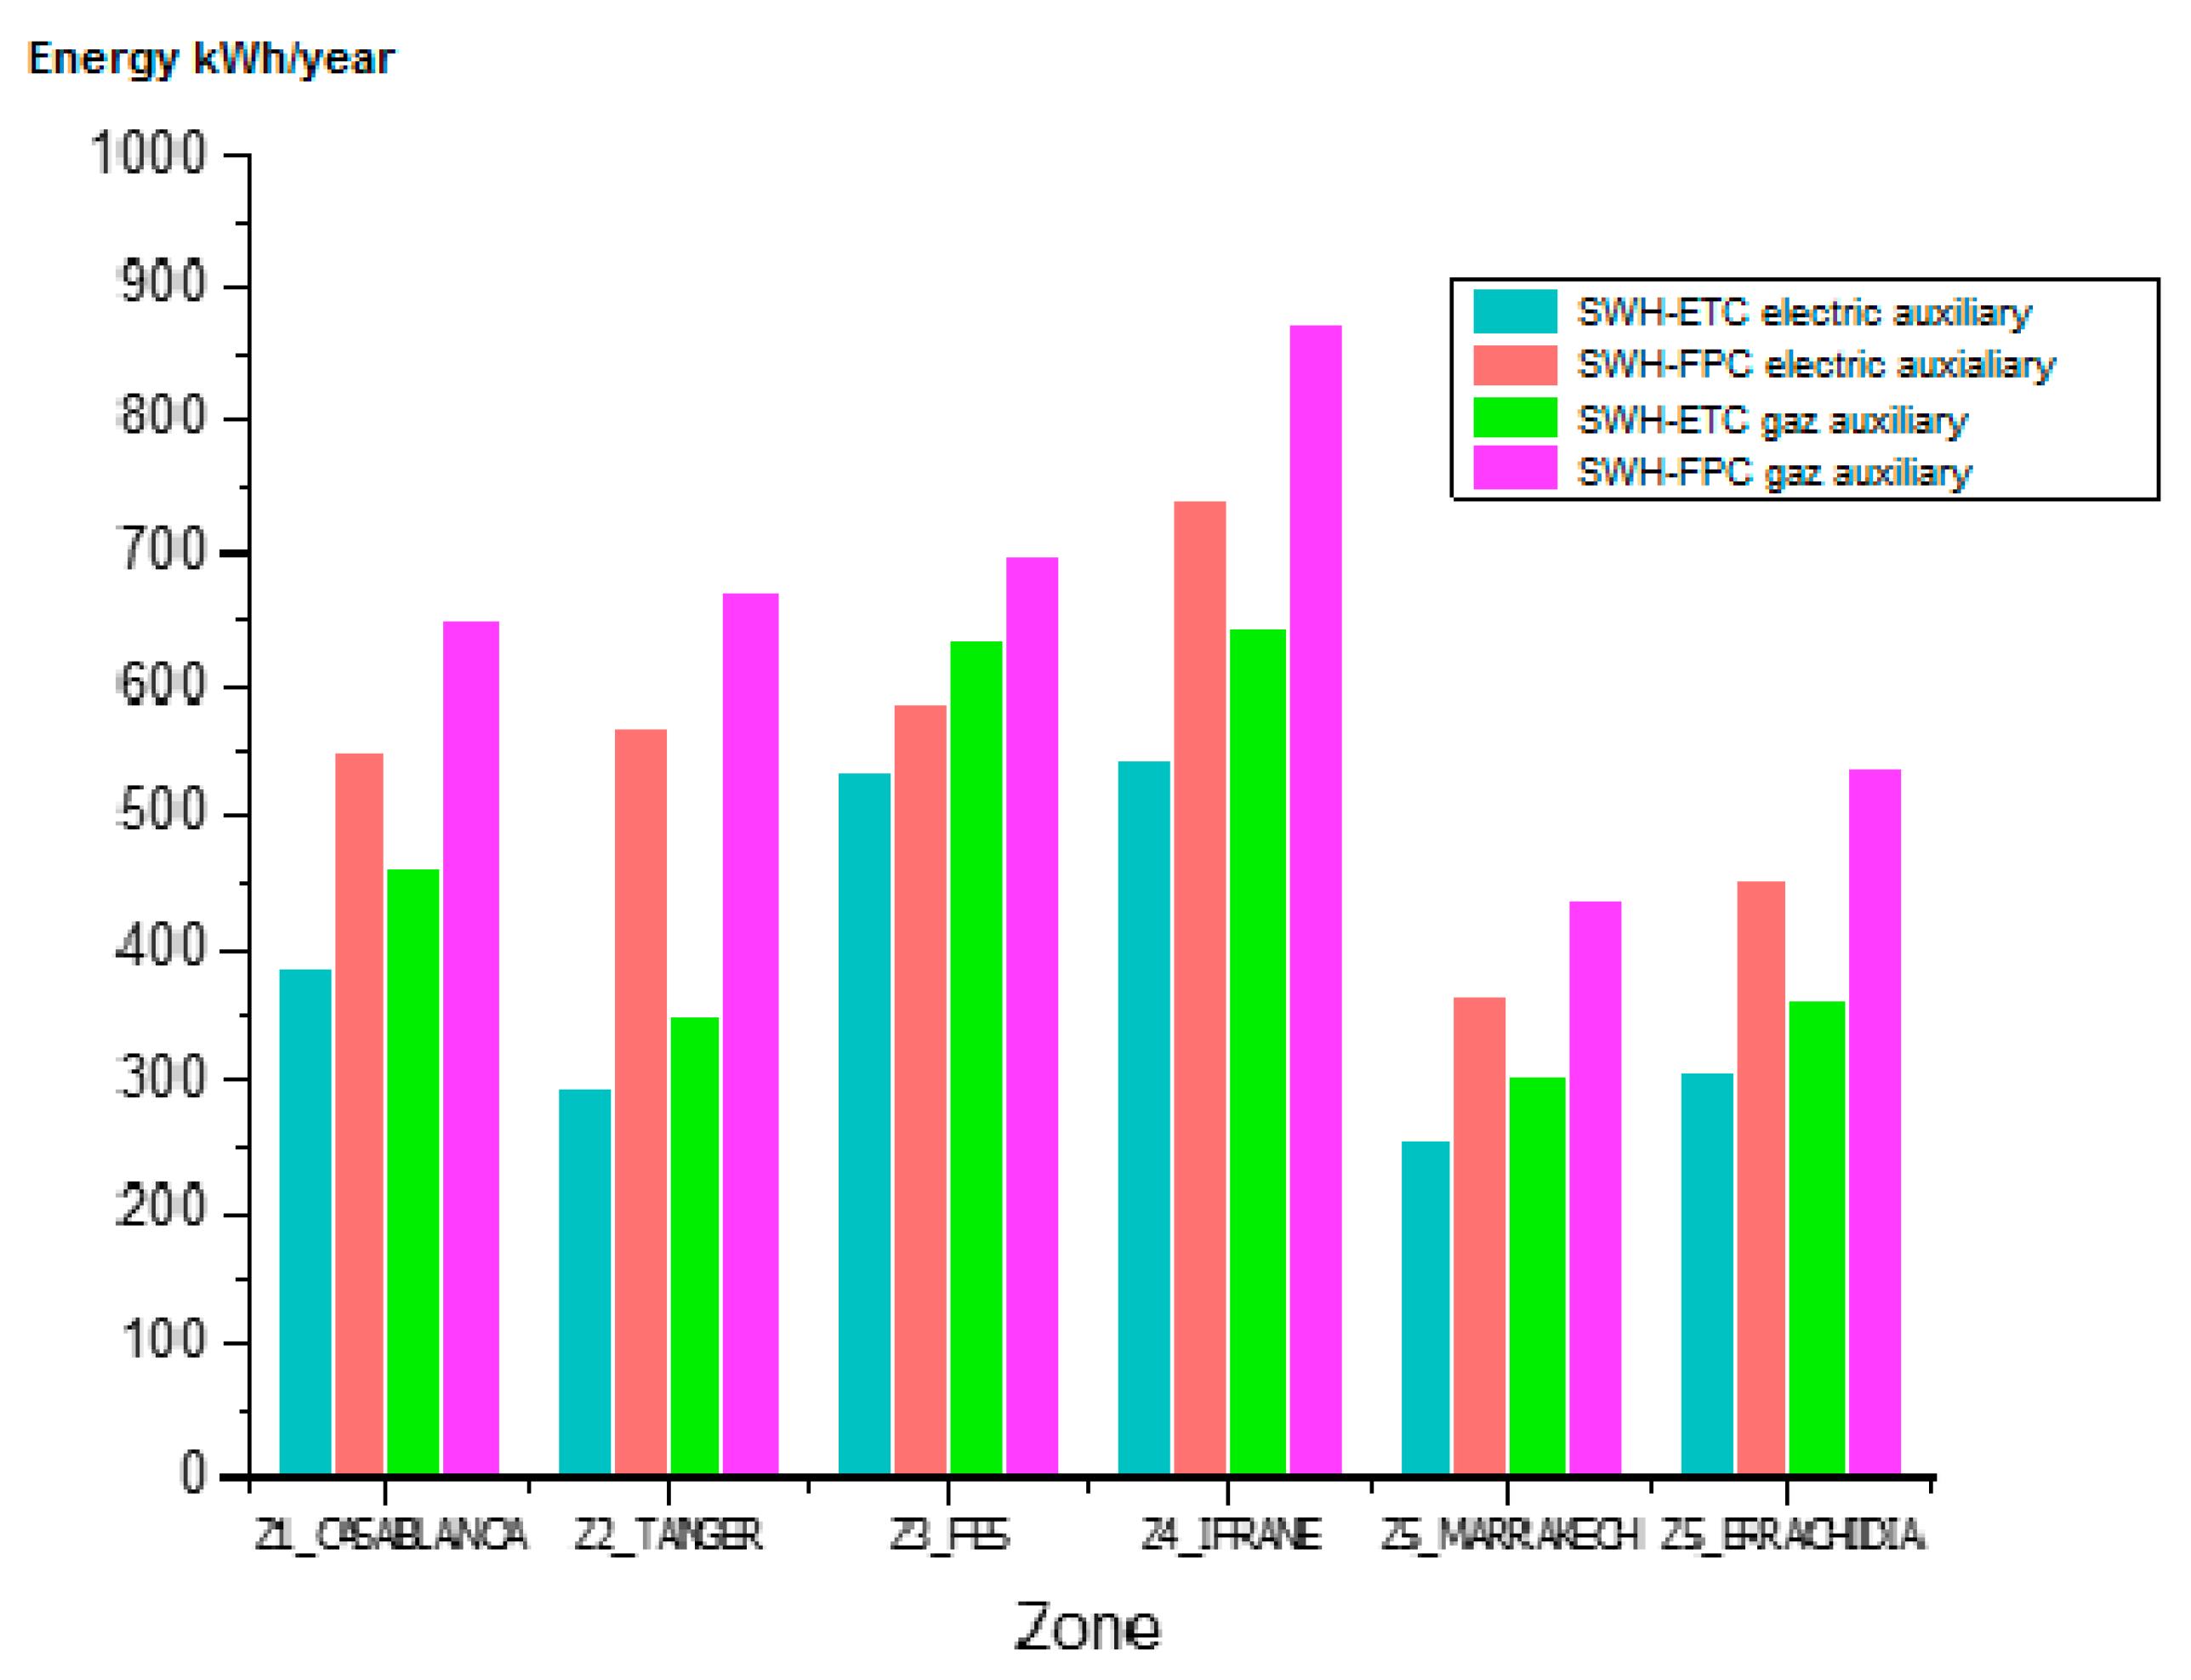
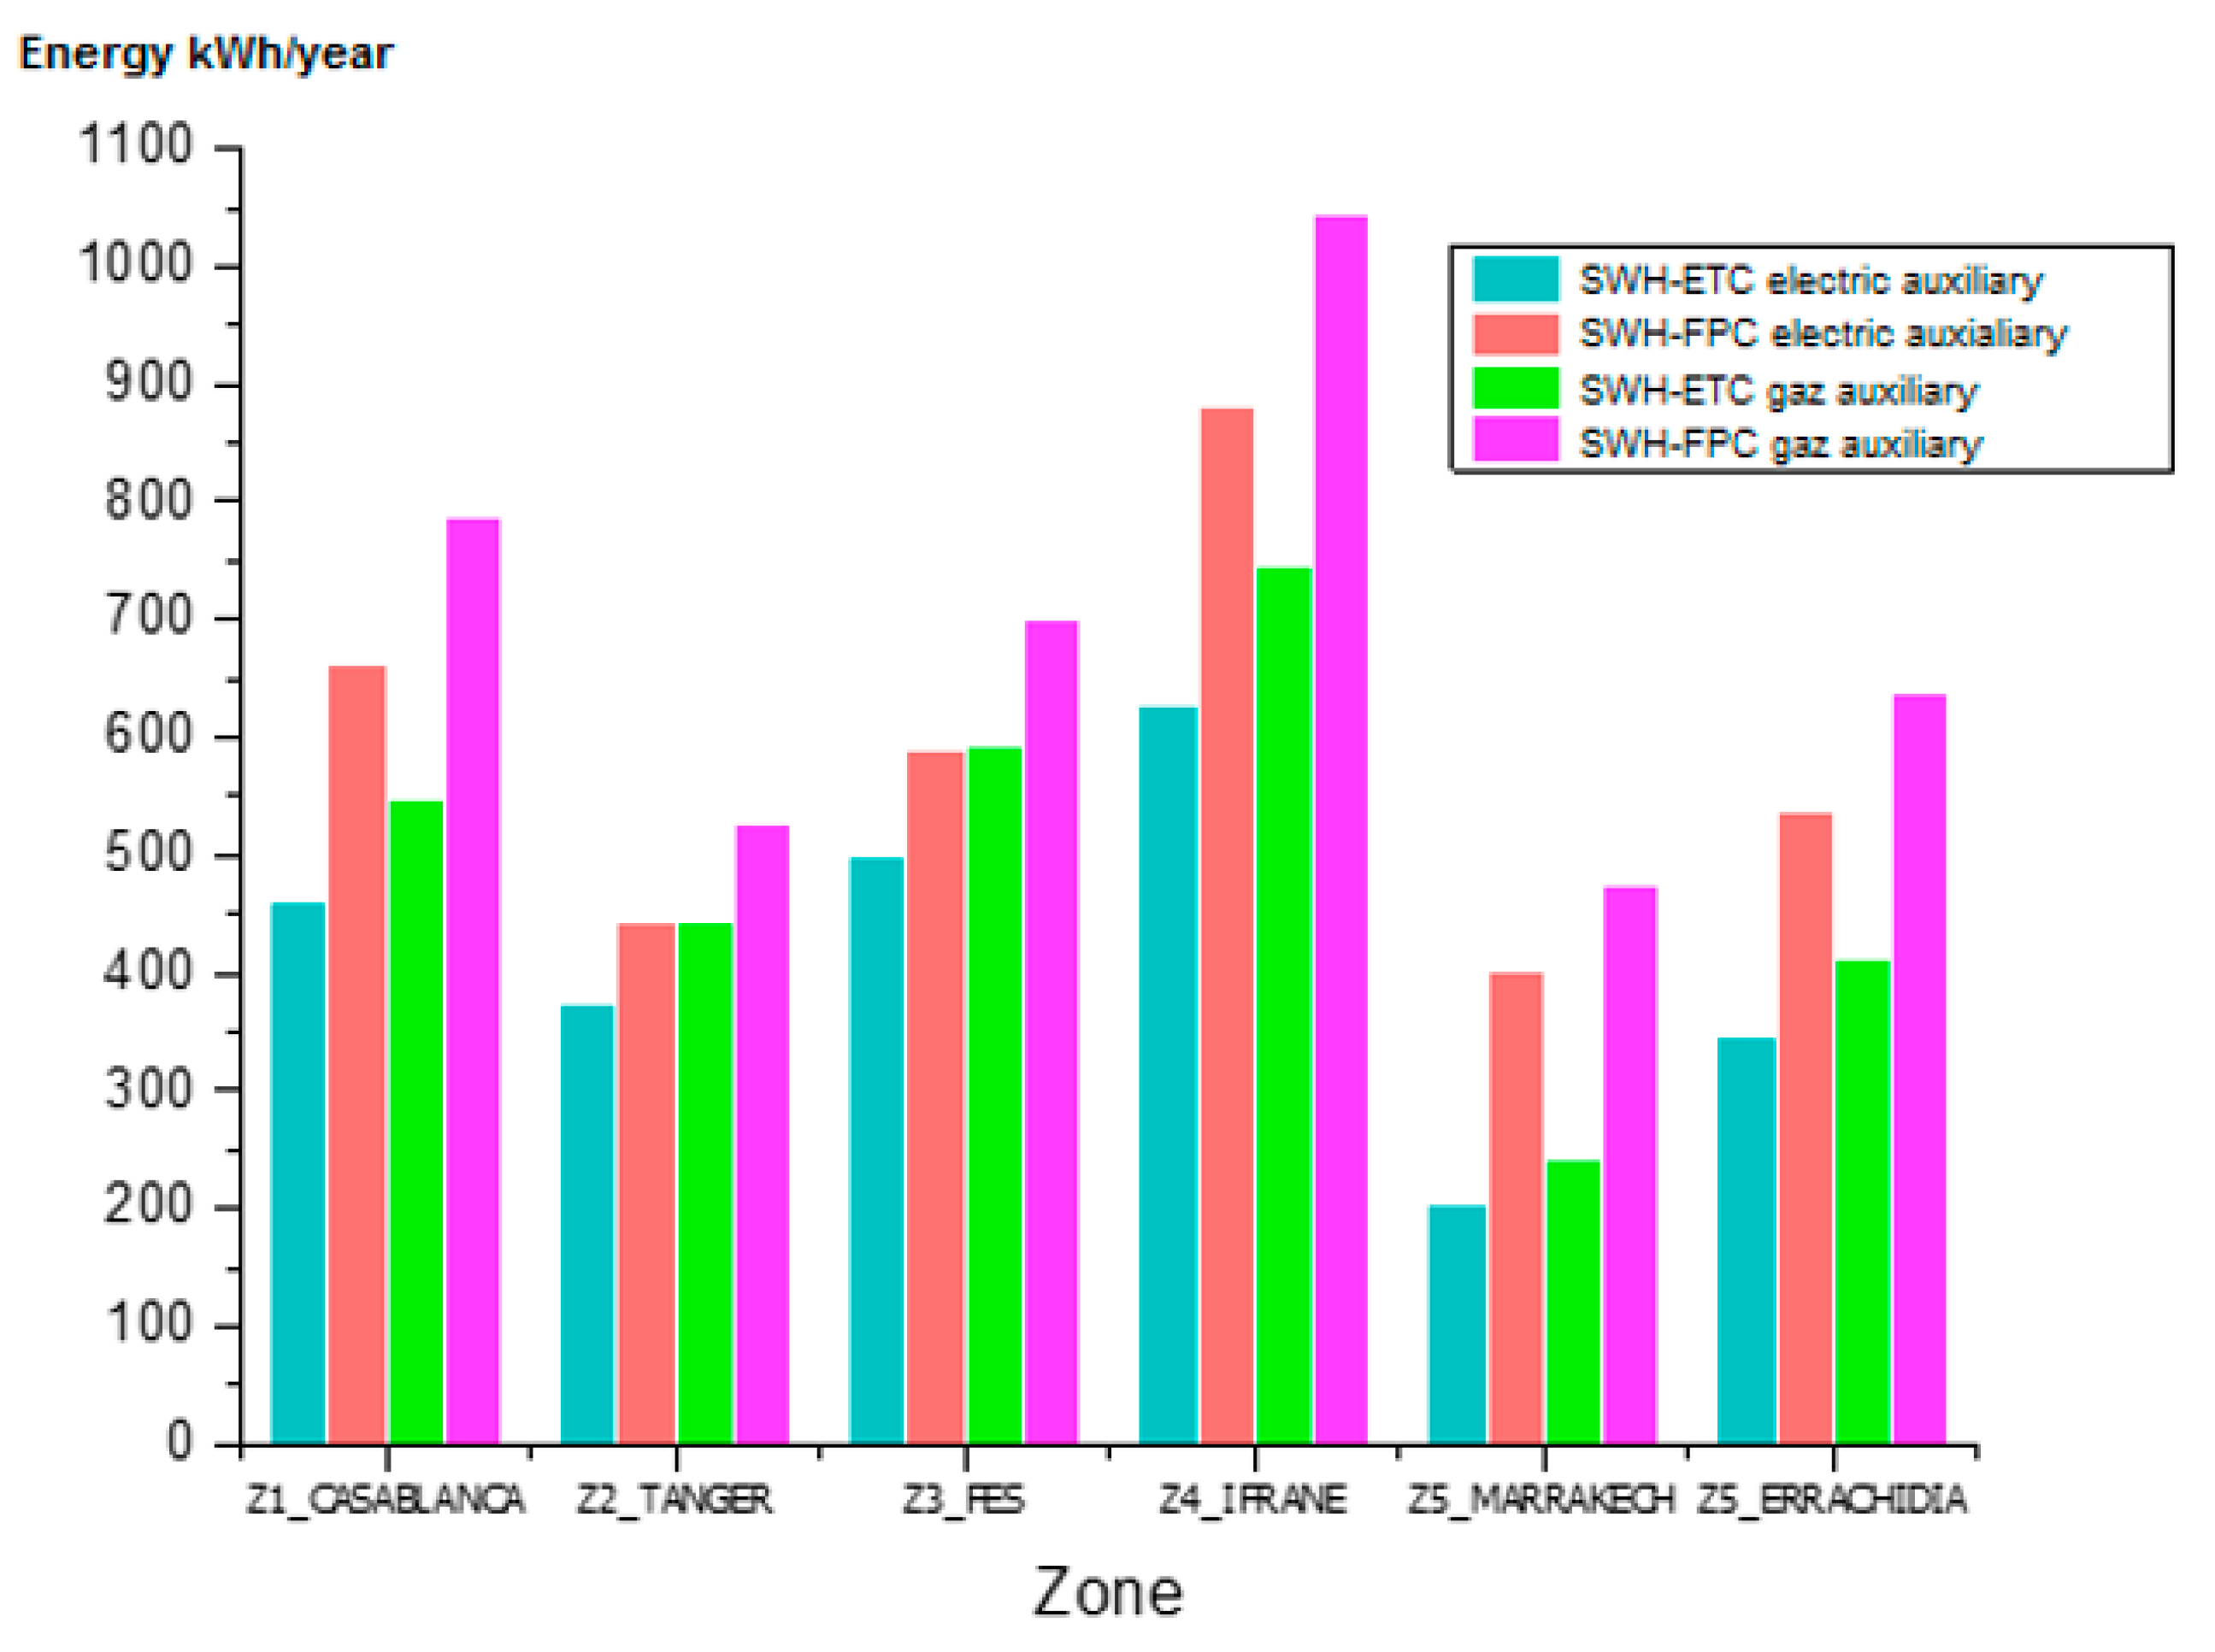
The energy demand comparison of the different conventional domestic hot water production systems and the new actions showed that solar solutions are remarkably efficient. In the same context, ETC and FPC comparisons show that vacuum tube collectors perform better in all Moroccan thermal zones during the winter. During the summer season, both technologies have solar fraction thresholds close to 90%.
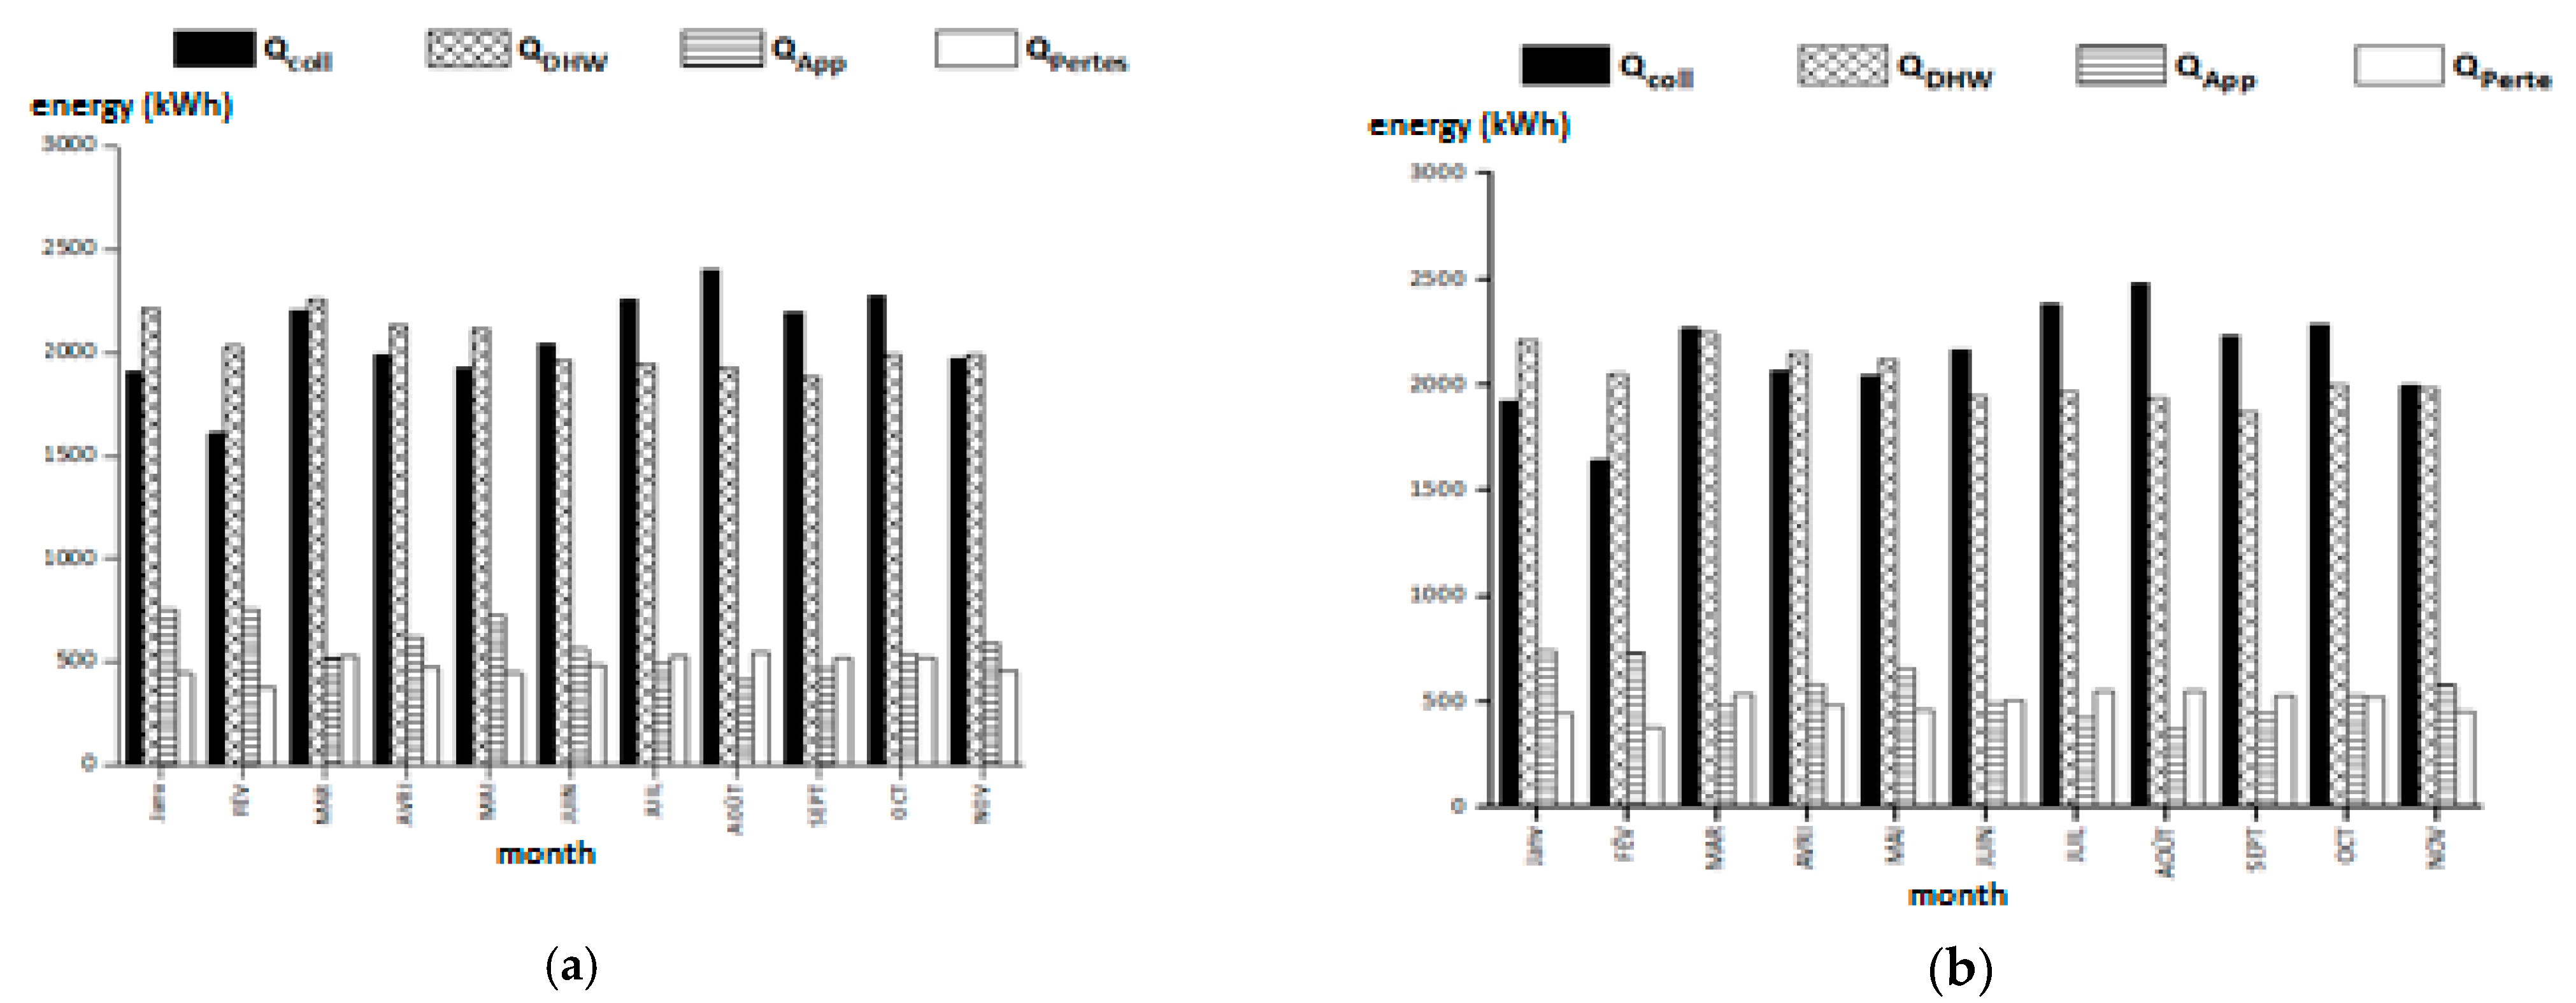
The study of the collective solar water heating system on TRNsys reinforces the findings made in individual scenarios: the vacuum tube sensor is significantly efficient.
The savings made by applying the various solutions was two-part: energy and financial. A comparison of energy savings shows that solar water heater solutions are superior to those achieved by building envelope actions. The financial analysis of the savings on the calculated bills shows that solar water heater solutions are attractive in non-subsidized butane gas prices.
This comparative study opens the possibilities of integrating collective solar water heaters in buildings, considering the possible savings. From another point of view of this study’s results, we push to seek the financing solutions of the collective solar projects possible, by green funds proposed by some non-governmental organizations or state organizations.

Author Contributions

Conceptualization, F.Z.G. and A.A.; Methodology, F.Z.G. and A.A.; Software, F.Z.G. and A.A.; Supervision, T.K., A.J. and A.B.; Visualization, H.E.-H.; Writing—original draft, F.Z.G. and A.A. All authors have read and agreed to the published version of the manuscript.

Funding

This research received funding from IRESEN (Institut de Recherche en Energie Solaire et energies Nouvelles).

Institutional Review Board Statement

Not applicable.

Informed Consent Statement

Not applicable.

Data Availability Statement

Data available in a publicly accessible repository.

Acknowledgments

The authors are grateful for the funding support provided by the Institut de Recherche en Energie Solaire et Energies Nouvelles (IRESEN) under the project SOL’R SHEMSY.

Conflicts of Interest

The authors declare no conflict of interest.

References

  1. International Energy Agency (IEA). Energy Policies Beyond IEA Countries: Morocco 2019 Review; IEA: Paris, France, 2019.
  2. Dadush, R.B.U. Has Morocco Benefited from the Free Trade Agreement with the European Union? Policy Center For The New South: Rabat, Morocco, 2020. [Google Scholar]
  3. Bennouna, A.; El Hebil, C. Energy needs for Morocco 2030, as obtained from GDP-energy and GDP-energy intensity correlations. Energy Policy 2016, 88, 45–55. [Google Scholar] [CrossRef]
  4. Kingdom of Morocco High Comission for Planning. Growth and Human Development in Morocco Statistical Benchmarks 1998–2008; Kingdom of Morocco High Comission for Planning: Casablanca, Moroco, 2006.
  5. L’environnement, M. Secteur De L’énergie Chiffres Clés; 2017. [Google Scholar]
  6. Ghezloun, A.; Saidane, A.; Oucher, N. Energy policy in the context of sustainable development: Case of Morocco and Algeria. Energy Procedia 2014, 50, 536–543. [Google Scholar] [CrossRef] [Green Version]
  7. Hamdaoui, S.; Mahdaoui, M.; Allouhi, A.; El Alaiji, R.; Kousksou, T.; El Bouardi, A. Energy demand and environmental impact of various construction scenarios of an office building in Morocco. J. Clean. Prod. 2018, 188, 113–124. [Google Scholar] [CrossRef]
  8. International Energy Agency (IEA). Energy Prices 2020; High-Quality Data on End-Use Energy Prices; IEA: Paris, France, 2020.
  9. Reboredo, J.C.; Ugolini, A. The impact of energy prices on clean energy stock prices. A multivariate quantile dependence approach. Energy Econ. 2018, 76, 136–152. [Google Scholar] [CrossRef]
  10. De Gracia, A.; Navarro, L.; Coma, J.; Serrano, S.; Romaní, J.; Pérez, G.; Cabeza, L.F. Experimental set-up for testing active and passive systems for energy savings in buildings–lessons learnt. Renew. Sustain. Energy Rev. 2018, 82, 1014–1026. [Google Scholar] [CrossRef] [Green Version]
  11. Sun, X.; Gou, Z.; Lau, S.S.-Y. Cost-effectiveness of active and passive design strategies for existing building retrofits in tropical climate: Case study of a zero energy building. J. Clean. Prod. 2018, 183, 35–45. [Google Scholar] [CrossRef]
  12. Athienitis, A.K.; Barone, G.; Buonomano, A.; Palombo, A. Assessing active and passive effects of façade building integrated photovoltaics/thermal systems: Dynamic modelling and simulation. Appl. Energy 2018, 209, 355–382. [Google Scholar] [CrossRef]
  13. Addy, M.N.; Adinyira, E.; Ayarkwa, J. Identifying and weighting indicators of building energy efficiency assessment in Ghana. Energy Procedia 2017, 134, 161–170. [Google Scholar] [CrossRef]
  14. Mahmoud, S.; Zayed, T.; Fahmy, M. Development of sustainability assessment tool for existing buildings. Sustain. Cities Soc. 2019, 44, 99–119. [Google Scholar] [CrossRef]
  15. Lidelöw, S.; Örn, T.; Luciani, A.; Rizzo, A. Energy-efficiency measures for heritage buildings: A literature review. Sustain. Cities Soc. 2019, 45, 231–242. [Google Scholar] [CrossRef]
  16. Wang, Y.; Kuckelkorn, J.; Li, D.; Du, J. Evaluation on distributed renewable energy system integrated with a Passive House building using a new energy performance index. Energy 2018, 161, 81–89. [Google Scholar] [CrossRef]
  17. Bougiatioti, F.; Michael, A. The architectural integration of active solar systems. Building applications in the Eastern Mediterranean region. Renew. Sustain. Energy Rev. 2015, 47, 966–982. [Google Scholar] [CrossRef]
  18. Vassiliades, C.; Michael, A.; Savvides, A.; Kalogirou, S. Improvement of passive behaviour of existing buildings through the integration of active solar energy systems. Energy 2018, 163, 1178–1192. [Google Scholar] [CrossRef]
  19. Vieira, A.S.; Stewart, R.A.; Lamberts, R.; Beal, C.D. Residential solar water heaters in Brisbane, Australia: Key performance parameters and indicators. Renew. Energy 2018, 116, 120–132. [Google Scholar] [CrossRef] [Green Version]
  20. Garnier, C.; Muneer, T.; Currie, J. Numerical and empirical evaluation of a novel building integrated collector storage solar water heater. Renew. Energy 2018, 126, 281–295. [Google Scholar] [CrossRef] [Green Version]
  21. Chen, X.; Yang, H. Integrated energy performance optimization of a passively designed high-rise residential building in different climatic zones of China. Appl. Energy 2018, 215, 145–158. [Google Scholar] [CrossRef]
  22. Chen, X.; Yang, H.; Zhang, W. Simulation-based approach to optimize passively designed buildings: A case study on a typical architectural form in hot and humid climates. Renew. Sustain. Energy Rev. 2018, 82, 1712–1725. [Google Scholar] [CrossRef]
  23. Simona, P.L.; Spiru, P.; Ion, I.V. Increasing the energy efficiency of buildings by thermal insulation. Energy Procedia 2017, 128, 393–399. [Google Scholar] [CrossRef]
  24. Biswas, K.; Desjarlais, A.; Smith, D.; Letts, J.; Yao, J.; Jiang, T. Development and thermal performance verification of composite insulation boards containing foam-encapsulated vacuum insulation panels. Appl. Energy 2018, 228, 1159–1172. [Google Scholar] [CrossRef]
  25. Ji, R.; Zhang, Z.; He, Y.; Liu, J.; Qu, S. Simulating the effects of anchors on the thermal performance of building insulation systems. Energy Build. 2017, 140, 501–507. [Google Scholar] [CrossRef]
  26. Shekar, V.; Krarti, M. Control strategies for dynamic insulation materials applied to commercial buildings. Energy Build. 2017, 154, 305–320. [Google Scholar] [CrossRef]
  27. Nguyen, D.M.; Grillet, A.-C.; Bui, Q.-B.; Diep, T.M.H.; Woloszyn, M. Building bio-insulation materials based on bamboo powder and bio-binders. Constr. Build. Mater. 2018, 186, 686–698. [Google Scholar] [CrossRef]
  28. Cetiner, I.; Shea, A.D. Wood waste as an alternative thermal insulation for buildings. Energy Build. 2018, 168, 374–384. [Google Scholar] [CrossRef]
  29. Aditya, L.; Mahlia, T.; Rismanchi, B.; Ng, H.; Hasan, M.; Metselaar, H.; Muraza, O.; Aditiya, H. A review on insulation materials for energy conservation in buildings. Renew. Sustain. Energy Rev. 2017, 73, 1352–1365. [Google Scholar] [CrossRef]
  30. Wang, Y.; Jobli, M.I.; Zheng, C.; Yang, X.; Li, K. Thickness of building external insulation in Chongqing based on intermittent heating supply. Procedia Eng. 2017, 205, 2755–2761. [Google Scholar] [CrossRef]
  31. Küçüktopcu, E.; Cemek, B. A study on environmental impact of insulation thickness of poultry building walls. Energy 2018, 150, 583–590. [Google Scholar] [CrossRef]
  32. Gao, T.; Ihara, T.; Grynning, S.; Jelle, B.P.; Lien, A.G. Perspective of aerogel glazings in energy efficient buildings. Build. Environ. 2016, 95, 405–413. [Google Scholar] [CrossRef]
  33. Ghosh, A.; Mallick, T. Evaluation of optical properties and protection factors of a PDLC switchable glazing for low energy building integration. Sol. Energy Mater. Sol. Cells 2018, 176, 391–396. [Google Scholar] [CrossRef]
  34. Ghosh, A.; Mallick, T. Evaluation of colour properties due to switching behaviour of a PDLC glazing for adaptive building integration. Renew. Energy 2018, 120, 126–133. [Google Scholar] [CrossRef]
  35. Lu, S.; Li, Z.; Zhao, Q.; Jiang, F. Modified calculation of solar heat gain coefficient in glazing façade buildings. Energy Procedia 2017, 122, 151–156. [Google Scholar] [CrossRef]
  36. Gao, T.; Jelle, B.P.; Gustavsen, A. Building Integration of Aerogel Glazings; Elsevier: Amsterdam, The Netherlands, 2016. [Google Scholar]
Figure 1. The building model with the Google Sketch UP software.
Inventions 06 00004 g001
Figure 2. The architectural plan of the ground floor and a representative floor.
Inventions 06 00004 g002
Figure 3. TRNsys information diagram for multi-zone building.
Inventions 06 00004 g003
Figure 4. The building zoning.
Inventions 06 00004 g004
Figure 5. The daily profile of domestic hot water use.
Inventions 06 00004 g005
Figure 6. The flowchart of individual solar water heater (SWH) system.
Inventions 06 00004 g006
Figure 7. Simulation information flow diagram of the collective solar system.
Inventions 06 00004 g007
Figure 8. (a) Flat plate collector, (b) evacuated tube collector (low demand).
Inventions 06 00004 g008
Figure 9. (a) Flat plate collector, (b) evacuated tube collector (standard demand).
Inventions 06 00004 g009
Figure 10. (a) Flat plate collector, (b) evacuated tube collector (high demand).
Inventions 06 00004 g010
Figure 11. (a) Flat plate collector, (b) evacuated tube collector.
Inventions 06 00004 g011
Figure 12. (a) Flat plate collector, (b) evacuated tube collector (efficiencies).
Inventions 06 00004 g012
Figure 13. SWH production energy for low demand.
Inventions 06 00004 g013
Figure 14. Annual energy of the backup system for standard demand of hot water.
Inventions 06 00004 g014
Figure 15. Annual energy of the backup system for high demand of hot water.
Inventions 06 00004 g015
Figure 16. Air conditioning and heating consumption ratios.
Inventions 06 00004 g016
Table 1. Meteorological data.
Climatic ZoneClimateTemperature °C
Zone 1Subtropical-semiarid14.3–23.2
Zone 2Mediterraneanhot12.6–24.2
Zone 3Mediterranean/continental9.6–26
Zone 4Humidtemperateclimate6.2–25.4
Zone 5Semiarid12.4–28
Zone 6Hot desert9.1–33.2
Table 2. The conventional building envelope.
WallsLayersThickness (mm)U (W/m2·K)
External wallExternal plaster200.847
Brick200
Plasterboard30
Internal wallPlasterboard251.183
Brick50
Plasterboard25
Low floorHeavy concrete2002.949
Mortar50
Floor tile10
High floorPlasterboard132.683
Slab120
Lightweight concrete200
Mortar50
Floor tile10
GlazingSimple glazing-5.8
Table 3. Regulatory ventilation flow rates.
Number
of Principal Rooms Per
Housing
Extracted Flow Rate (m3/h)
KitchenPrincipal Bathroom Secondary BathroomsWash Room
UniqueMultiple
120/7515151515
230/9015151515
345/10530151515
445/12030153015
5 and more45/13530153015
Table 4. Thermal characteristics of insulated building walls and floors according to the Moroccan standards.
Thermal ZonesU (W/m2·K)
External WallsInternal WallsLow FloorHigh Floor
Zone 10.8471.8132.9490.750
Zone 20.8471.8132.9490.636
Zone 30.8471.8132.9490.657
Zone 40.601.8132.9490.552
Zone 50.601.8132.9490.636
Zone 60.601.8132.9490.636
Table 5. Building envelope action on the glazing.
WallsLayersThickness (mm)U (W/m2·K)
External wallExterior plaster200.847
Brick200
Plaster panel30
Internal wallPlaster panel 251.183
Brick50
Plaster panel25
FloorHeavy concrete2002.949
Mortar50
Tile10
RoofPlaster panel132.683
Slab120
Light concrete200
Mortar50
Tile10
GlazingDouble glazing-2.83
Table 6. Thermal characteristics of the building envelope under Moroccan thermal regulation of construction (MTRC) requirements.
EnvelopeU (W/m2·K)
Zone 1Zone 2Zone 3Zone 4Zone 5Zone 6
External wall0.8470.8470.8470.600.600.60
Internal wall1.813
Floor2.949
Roof0.7500.6360.6360.5520.6360.636
Glazing2.83
Table 7. Technical characteristic of collectors and tanks (individual SWH).
Collectors
Technical Characteristics FPCETC
Area (m2)1.8–3.31.5–3
Tested flow rate kg/hr·m26060
Optical coefficient (%)0.70.7
Thermal loss coefficient a1 (kJ/hr·m2 K)3.131.894
Thermal loss coefficient a2 (kJ/hr·m2 K2)0.0160.0039
Mass flow rate (min; max) (kg/hr)0.900.90
Optimal inclination (°)4545
Tank
Volume (L)150–200–300
Specific heat of the fluid (kJ/kg·K)4.19
Fluid density (kg/m2)1000
Thermal loss coefficient (kJ/hr·m2·K)1.4
Height (m)1
Nodes number3
Auxiliary heater power (kW)1–1.5–3
Maximum auxiliary heater temperature (°C)60
Table 8. Technical characteristic of collectors and tanks (collective SWH).
Tank
CommonIndividual Auxiliary Tank
Volume (L)1600200
Specific heat of the fluid (kJ/kg·k)4.19
Fluid density (kg/m2)1000
Thermal loss coefficient (kJ/hr·m2·K)1.4
Height (m)1.81
Nodes number63
Auxiliary heater power (kW)01.5
Maximum auxiliary heater temperature (°C)60
Table 9. Heating and cooling annual demand.
ZoneZone 1Zone 2Zone 3Zone 4Zone 5Zone 6
CIGTRCIGTRCIGTRCIGTRCIGTRCIGTR
Heating annual demand (kWh/m2/year)41253515563248149555812916092128474827381381466523
Cooling annual demand (kWh/m2/year)30293127403743345844563940303930937187611329612166
Total annual demand(kWh/m2/year)7154664296699148153991376820012216777141981257421314218689
C: the conventional building (reference case without improvement actions); I: the conventional building with insulation integration; G: the conventional building applying the glazing action; TR: the building adapted to the Moroccan thermal regulation of construction (MTRC).
Table 10. Efficiency of hot water production systems.
SystemGlobal Efficiency
Electrical water heaterNight accumulation0.7
Instantaneous0.95
Gas accumulation water heater0.5
Instantaneous gas water heaterWith pilot light0.6
Without pilot light0.8
Table 11. Savings of passive solutions in kWh/year.
ZonesInsulationGlazingMTRC
Zone 16802001160
Zone 210802001920
Zone 321606403400
Zone 4312013204920
Zone 517206402680
Zone 6284010804960
Table 12. Energy savings achieved for the different scenarios of SWH production.
Energy Savings Achieved for Different Scenarios of DHW Production (kWh/year)
A→1A→2A→3A→4B→1B→2B→3B→4C→1C→2C→3C→4D→1D→2D→3D→4E→1E→2E→3E→4
Z123282204228221341650152616041456335932343312316427582633271125632006188219591812
Z223192193227121221642151615951445334732213300315027472621270025501997187119501800
Z326392578258825161873181218231750380337423752368031243063307330012275221422252152
Z424982116243119781747136516801227363932573572311929732591290624532141175920741621
Z522842168225421161641152416101472326231463232309426922575266125231978186219481810
Z625732461253724041845173318081675368135683644351130352923299828652227211521912058
Z134773316340432132460229923872196502348624950475941213960404938572994283329212730
Z235613292350631862546227724912171510448345049472942043935414938293079281030242704
Z338303776373036652681262725812517557655225476541145584503445743933284323031843120
Z437373542363634042611241625102278544952545348511644514256434941173203300831012869
Z534123299336432302447233423992265487947664831469740233910397538412954284029062771
Z638453699378836142753260626952521550653605449527545374391448043063326318032693095
Z146904489460343643334313332473008675165506665642555495348546252234046384539593720
Z247694699469946163415334633453263682667566756667356265556555654734126405640563973
Z353215229522851183790369836963587764975577556744662916199619860884594450245004391
Z450764825495846603575332334573158735971077241694260275776590956114363411242453946
Z546854489464644143398320233593127664164456602637055005304546152294073387840353803
Z651894998512448973733354136683441740472137339711261125921604758204497430644334205
A: electric DWH night storage, B: Instant electric DWH, C: Gas water heater, D: Instant gas water heater with pilot light, E: Instant gas water heater without pilot light; 1: Evacuated tube SW with electric auxiliary heater, 2: Flat plate SWH with electric auxiliary heater, 3: Evacuated tube SW with gas auxiliary heater, 4: Flat plate SWH with electric auxiliary heater. Low hot water demand. Standard hot water demand. Hight hot water demand.
Table 13. Annual invoice for hot water conventional systems production.
SWHZonesAmount MAD/Year
ABC1C2D1D2E1E2
LOW HOT WATER DEMANDZ125531818949296679124725931854
Z225471814947296078924675921850
Z3293920821072335089327926702094
Z4287320371051328487527376572053
Z524081714900281575023455631759
Z6277319691019318684926556371992
STANDARD HOT WATER DEMANDZ14087286714234449118637088902781
Z24077286014204440118437008882775
Z347733297160750251339418710053140
Z44655322315764926131341059853079
Z53840269913514222112535188442639
Z64479311415294780127439839562987
HIGHT HOT WATER DEMANDZ158623998189859321581494311863708
Z258483989189459201578493311843700
Z367984668214367001786558313394187
Z466364551210165681751547413134105
Z554993760180156291501469111253518
Z663914379203963731699531112743983
Table 14. Energy bill of auxiliary systems.
SWHZonesAmount MAD/Year
ETC_AFPC_AETC_E1FPC_E1ETC_E2FPC_E2
LOW HOT WATER DEMANDZ122433678116243364
Z222834179118247370
Z324429985104264324
Z4320664111230347720
Z51452505087157271
Z61752766196190300
STANDARD HOT WATER DEMANDZ1349495121172379536
Z226650992177289552
Z3482531167184522575
Z4488664169230529720
Z523033280115249360
Z627640896142299442
HIGHT HOT WATER DEMANDZ1417600145208452649
Z2337399117138365433
Z3449532156185487577
Z4566803197275615860
Z518536164125200391
Z6312484108168338525
Table 15. Amount saved by installing a solar water heater for an individual building.
SWHZonesAmont MAD/Year
With SubsidiesWithout Subsidies
MaxMinMaxMin
LOW HOT WATER DEMANDZ128882292475257
Z228812222468251
Z332653462854371
Z431731552762211
Z527652922358313
Z631253372712361
STANDARD HOT WATER DEMANDZ143283543966395
Z243483363985379
Z348584304606474
Z447572654486321
Z541424843760512
Z646845144383548
HIGHT HOT WATER DEMANDZ157875375717586
Z258037515731785
Z366427626642807
Z464394536439510
Z555657345435764
Z662837496283790
Table 16. Annual energy bill for heating and cooling.
ZonesEnergetic Bills MAD
ConventionalInsulationGlazingMTCR
Z1808575737445
Z211317561030552
Z3187011181640735
Z4238813421952821
Z5164010791440799
Z62824175324391088
Table 17. Savings rate achieved.
ZonesPercentage of Savings
InsulationGlazingMTCR
Z129%9%45%
Z233%9%51%
Z340%12%61%
Z444%18%66%
Z534%12%51%
Z638%14%61%
Table 18. Savings using the active system SWH.
Savings Ratio
Configuration 1
Savings Ratio
Configuration 2
Subsidies
YesNoYesNoYesNoYesNoYesNoYesNoYesNoYesNo
A→1A→2A→3A→4B→1B→2B→3B→4
Z169%69%75%68%65%65%65%65%32%68%45%67%23%64%42%63%
Z265%65%69%64%59%59%59%59%31%64%39%64%19%58%35%57%
Z354%54%61%54%54%54%54%54%18%53%29%52%16%52%29%51%
Z449%49%54%48%46%46%46%46%15%47%24%47%10%44%22%43%
Z557%57%60%56%55%55%55%55%25%56%31%56%21%54%29%53%
Z648%48%51%47%46%46%46%46%18%47%23%46%14%44%22%44%
Table 19. Savings using the passive system SWH (on total energy building).
Savings Ratio
ZonesInsulationGlazingMTRC
Config 1Config 2Config 1Config 2Config 1Config 2
Z16.34%13.72%1.93%4.18%9.88%21.38%
Z29.40%18.57%2.53%5.00%14.51%28.68%
Z314.55%26.16%4.45%8.00%21.97%39.48%
Z418.64%31.01%7.77%12.93%27.93%46.46%
Z512.93%22.58%4.61%8.05%19.38%33.86%
Z618.04%28.33%6.48%10.19%29.24%45.93%
Table 20. Return on investment (ROI) time of individual solar water heaters.
SWHZonesROI (Year)
ETCFPC
AE1E2AE1E2
Low demandZ18.637.38.46.939.96.8
Z28.737.88.57.040.86.8
Z37.532.37.45.727.65.7
Z48.040.87.97.536.47.4
Z58.832.98.57.032.76.8
Z67.729.87.66.128.46.0
Standard demandZ16.329.16.55.432.35.6
Z26.125.36.35.433.65.6
Z35.630.15.94.626.94.9
Z45.831.76.15.039.75.3
Z56.425.76.55.424.95.5
Z65.523.25.84.723.34.9
High demandZ14.822.45.24.224.34.6
Z24.720.45.14.018.24.3
Z34.119.44.63.417.73.9
Z44.323.14.93.827.94.3
Z54.818.45.24.218.74.5
Z64.217.94.73.718.04.1
Table 21. Return on investment time of collective solar water heaters.
ZonesROI (Year)
ETCFPC
AE1E2AE1E2
Z18.740.49.08.651.68.9
Z28.435.28.78.753.89.0
Z37.841.88.27.443.07.8
Z48.044.08.48.063.58.4
Z58.935.69.18.639.88.8
Z67.732.28.17.537.27.9
Table 22. Payback time of passive actions.
ZonesInvestment MADPayback Time (year)
InsulationGlazingMTRCInsulationGlazingMTRC
Z113,20981,00094,2091.225.35.1
Z217,85081,00098,850125.33.2
Z323,20581,000104,2050.77.91.9
Z453,36081,000134,3601.13.81.7
Z548,00581,000129,0051.77.93
Z648,00581,000129,0051.14.71.6
Publisher’s Note: MDPI stays neutral with regard to jurisdictional claims in published maps and institutional affiliations.

