1. Introduction
Currently, most of the operations in the technological processes in the production of printed circuit boards (PCB) are chemical, which increases their impact on the reliability of the manufactured product [
1]. The control of these operations is difficult due to many parameters, the analysis of which can only be performed under laboratory conditions. According to a previously drawn up schedule, maintenance of such processes mainly adheres to a preventive approach, consisting of timely replacement of chemical solutions. This approach has several disadvantages:
The probability of emergencies remains, requiring an urgent response of a large number of people—from the chief technologist to a team of repairmen;
The equipment’s work history is not collected, and it is not analyzed;
Possible incomplete use of materials, which entails increased costs for materials and their disposal.
Additionally, in some cases, it is simply impossible to carry out preventive maintenance of technological processes, for example, in enterprises whose task is to design and develop electronic devices. Preventive maintenance is not effective in this case because the production capacity of such enterprises is aimed at making prototypes in small quantities, and the production line does not work in streaming mode. In this case, preventive maintenance of the system takes up working time, which may not pay off due to the absence of the need for the production of printed circuit boards at this point.
The introduction of modern digital technologies can change the current situation and provide control methods directly built into the technological process. Therefore, it will allow more efficient management of the process and improve its quality, affecting the manufactured product’s price and reliability. Among the most promising digital technologies for the digitalization of chemical processes, machine learning, internet of things (IoT), and big data should be noted [
2].
The conversation about automation and digitalization of chemical processes in PCB production is a conversation about the parameters of these processes [
3]. If these parameters are monitored and controlled, the digitalization problem becomes solvable and comes down to identifying the best methods for monitoring and controlling the parameters of the process. The primary goal of this article is to try to combine the fundamental technologies of chemical processes to manufacture PCB with digital production. To achieve this goal:
Considered modern digital methods of control of chemical processes;
Based on the considered methods, a digital section was designed and manufactured to serve the chemical etching process of printed circuit boards;
An analysis of the site’s performance was carried out based on several experiments, during which some dependencies between the parameters of the etching process were revealed.
2. Methods
Digital technologies can simplify many tasks in various production processes [
4,
5]. For example, they make it possible to optimize and control the parameters of metallization of PCB at the stage of designing a plating bath, preparing an electrolyte solution, and in the process itself, for example, using computer modeling methods. The state of the solutions and other metallization parameters, in turn, can be controlled by applying the prognosis and health management (PHM) paradigm. The existing methods and their application in the management and control of the electrochemical process are described below.
2.1. Copper Electrodeposition Modeling
Modeling and simulation are relatively cheap methods of research, optimization, and control of the electrodeposition process [
6]. The simulation shows the distribution of current over the electrodes’ surface and the thickness and characteristics of the deposited metal layer. In addition, it can estimate the influence of parameters on which metallization quality depends and find optimal values before assembling the baths and preparing the electrolyte. These parameters include the geometry of the bath, composition of the solution, diffusion reactions on the electrodes, values of current and voltage, and temperature. With information about these parameters, it is possible to optimize the operating conditions of the electroplating baths, the placement and design of the masks, and ensure the high quality of precipitation with the minimum consumption of materials and energy.
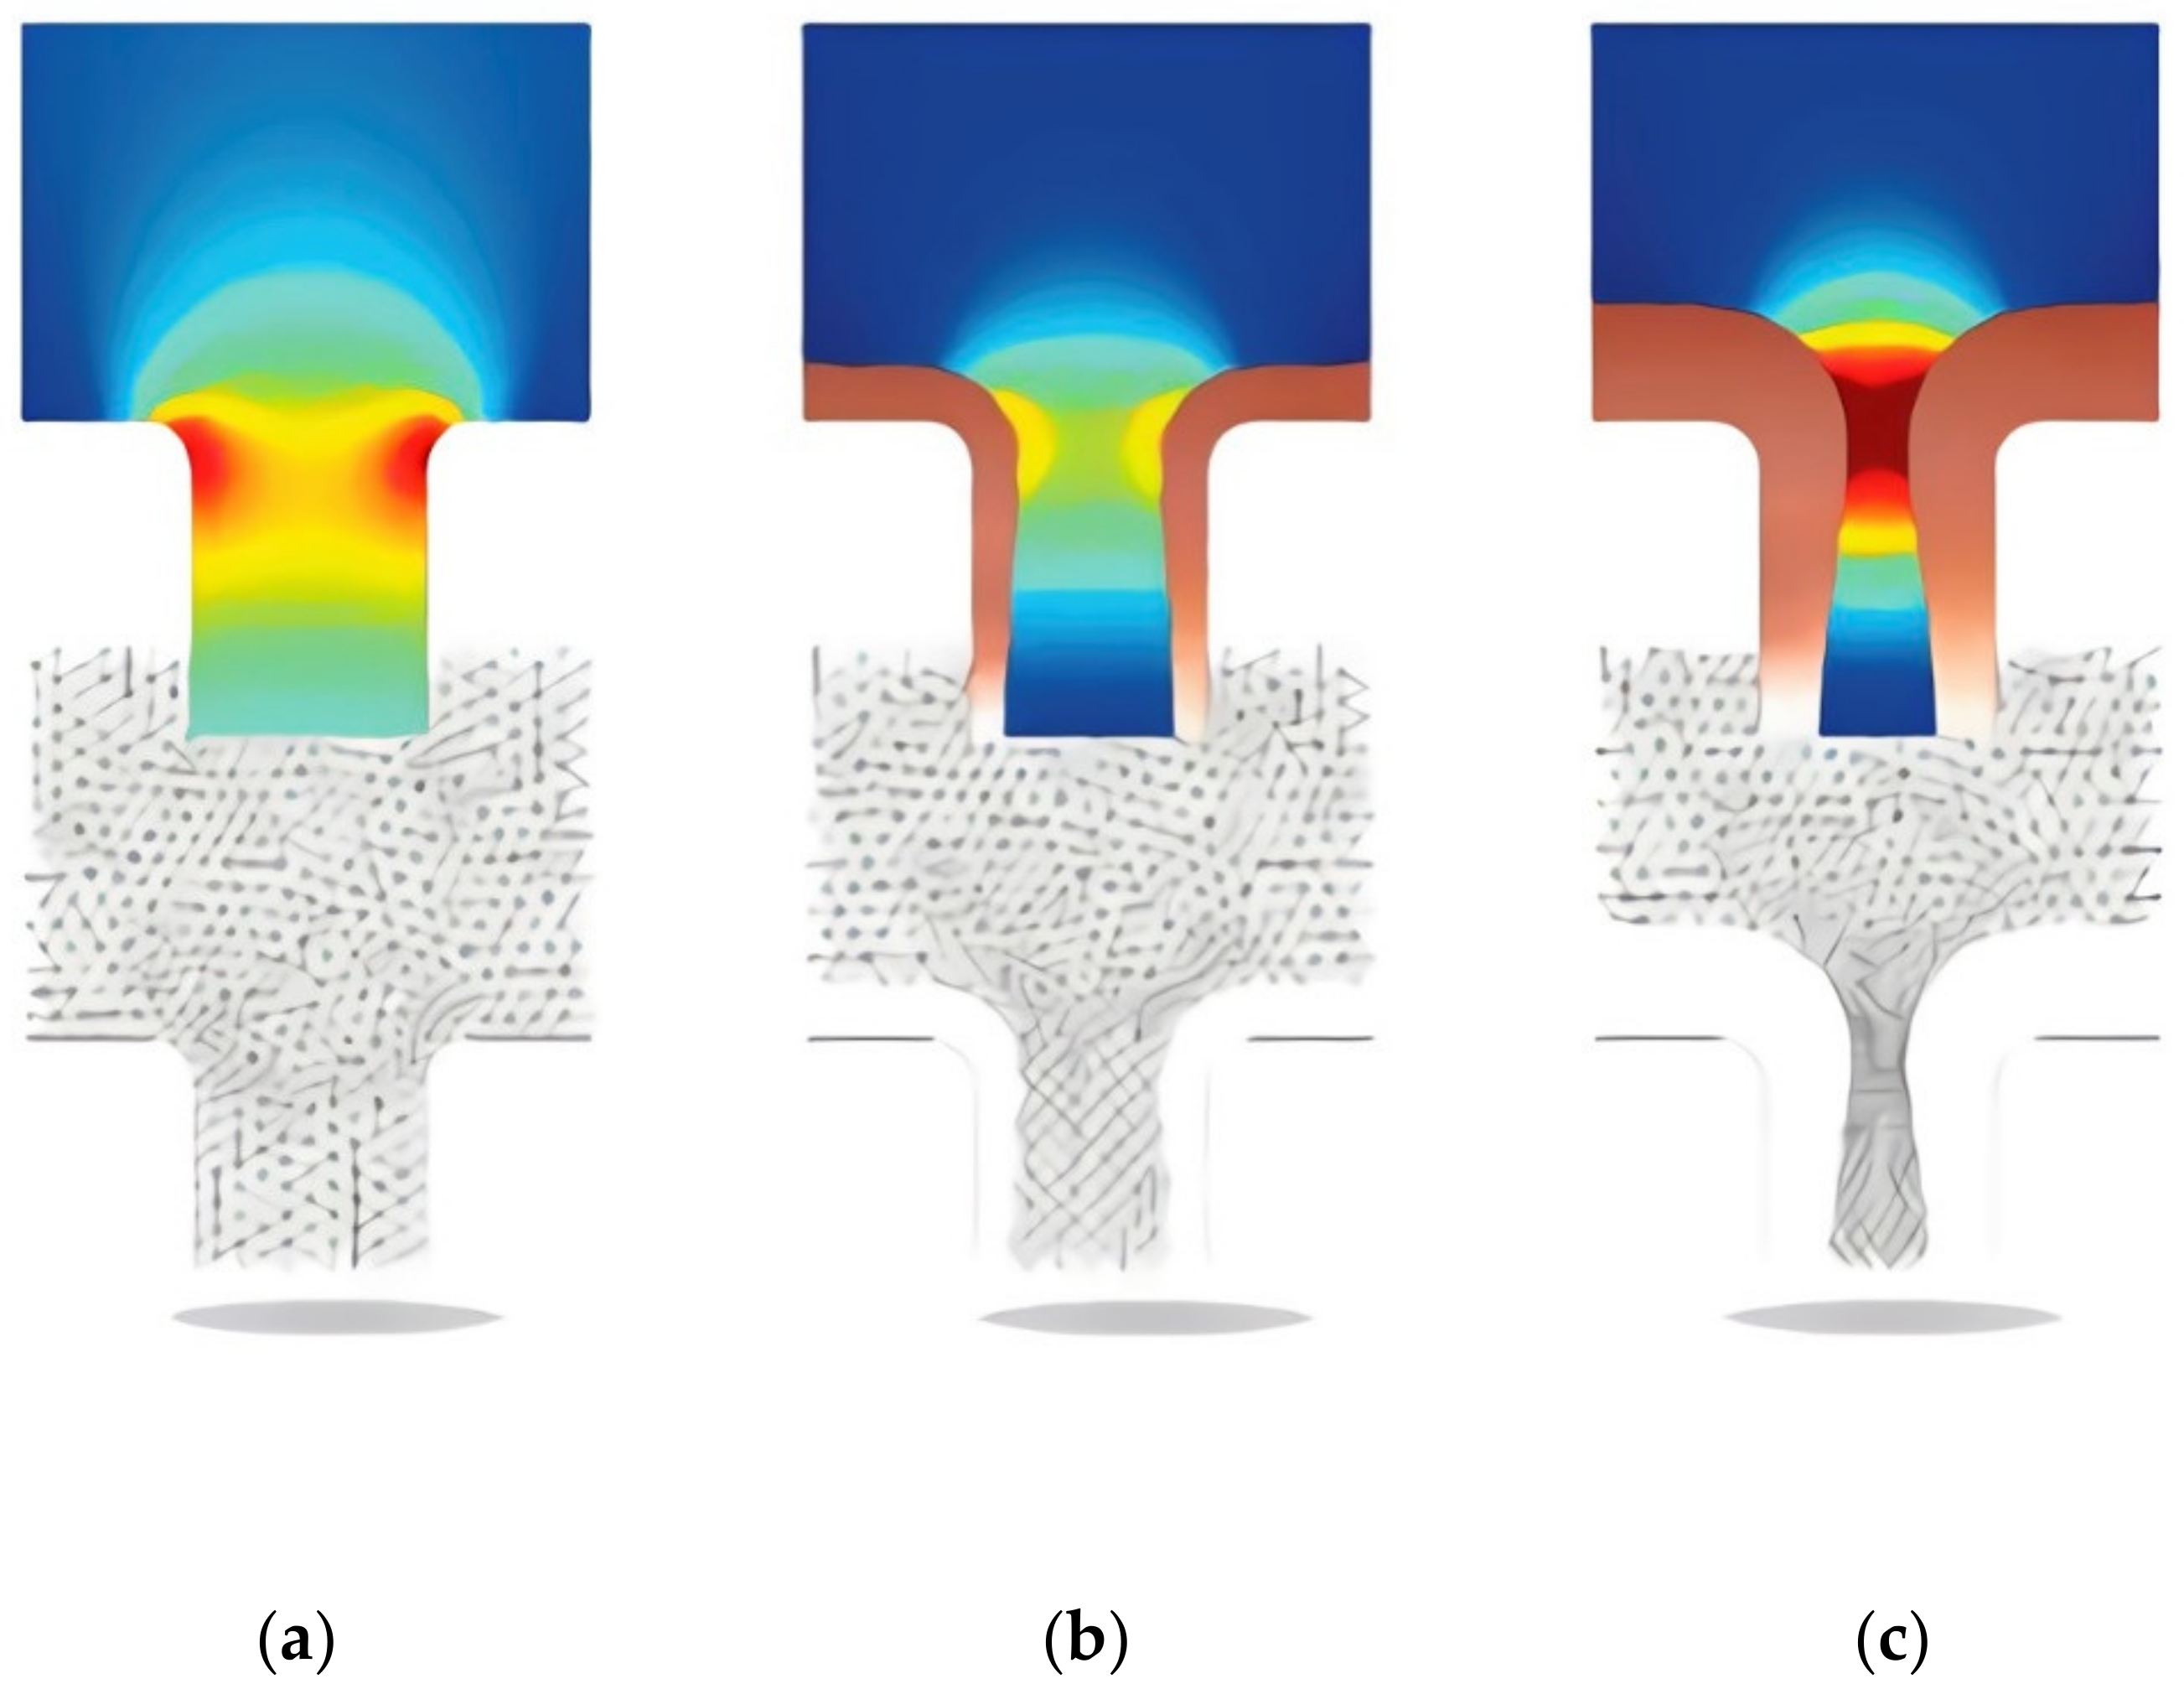
So, for example, the process of electroplating copper in microvias of PCB can be easily simulated using modern computer-aided design tools in a problem using deformable model geometry. With modelling it is possible to analyze the growth of the cathode boundary (the boundary of the deposited metal). The process is inherently time-dependent as the cathode boundary moves as the deposition process takes place. The model is determined by the material balance of the active ions (copper, Cu2+, and sulfate, SO42−) and the condition of electroneutrality.
The dependent variables were the concentration of copper ions, the concentration of sulfate ions, and ionic potentials. Additional variables tracked the deformation of the simulation mesh. The simulation results are shown in
Figure 1, where we can observe the change in the problem geometry and the change in the mesh and simulation results.
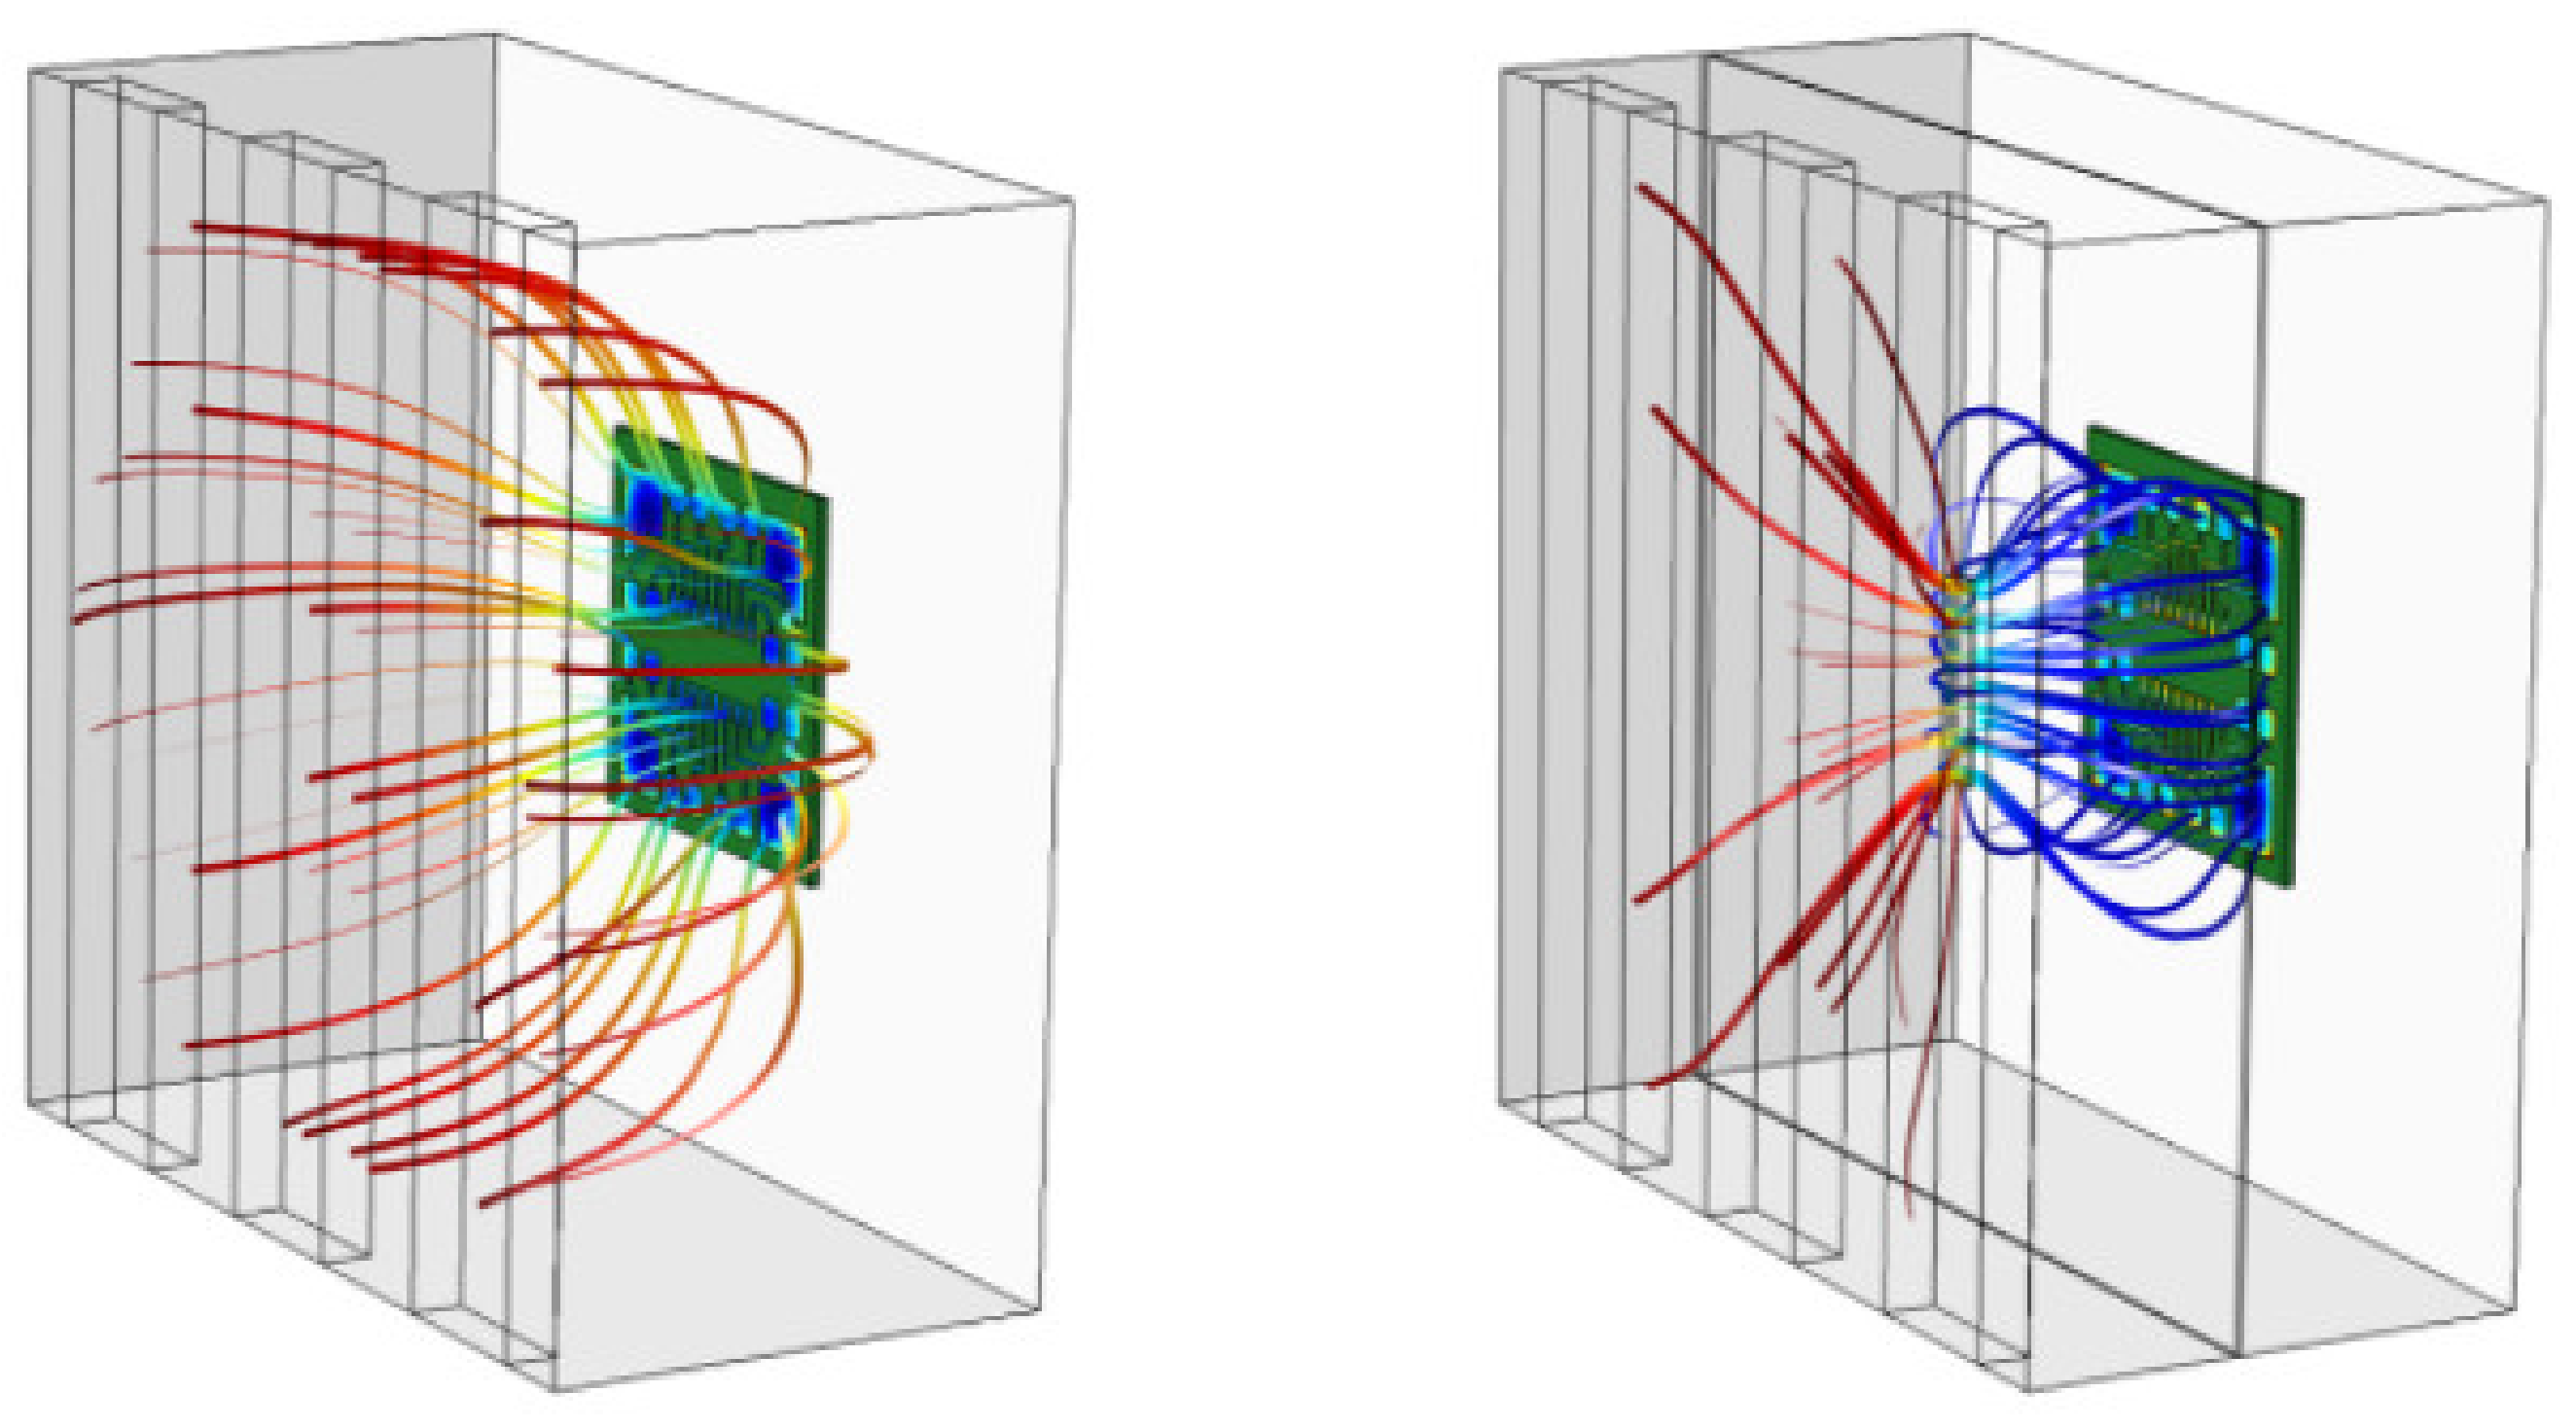
An additional solution to increase the uniformity of the deposited copper is related to the design of the electroplating bath. Current squeezing can be reduced by adding a dielectric screen with holes inside the bath structure, located between the anode and the metalized part. It is known that to reduce the effect of current compression, the dimensions of the holes should be smaller than the dimensions of the metalized part. However, apart from this rule, there are no recommendations for the location and optimal dimensions of the aperture.
This problem can also be solved through simulation.
Figure 2 shows the results of modeling of the influence of the aperture of various configurations on the uniformity of the distributed electric field in the galvanic bath. Thus, optimization problems in PCB production can be solved even at the design stage, using computer simulation tools.
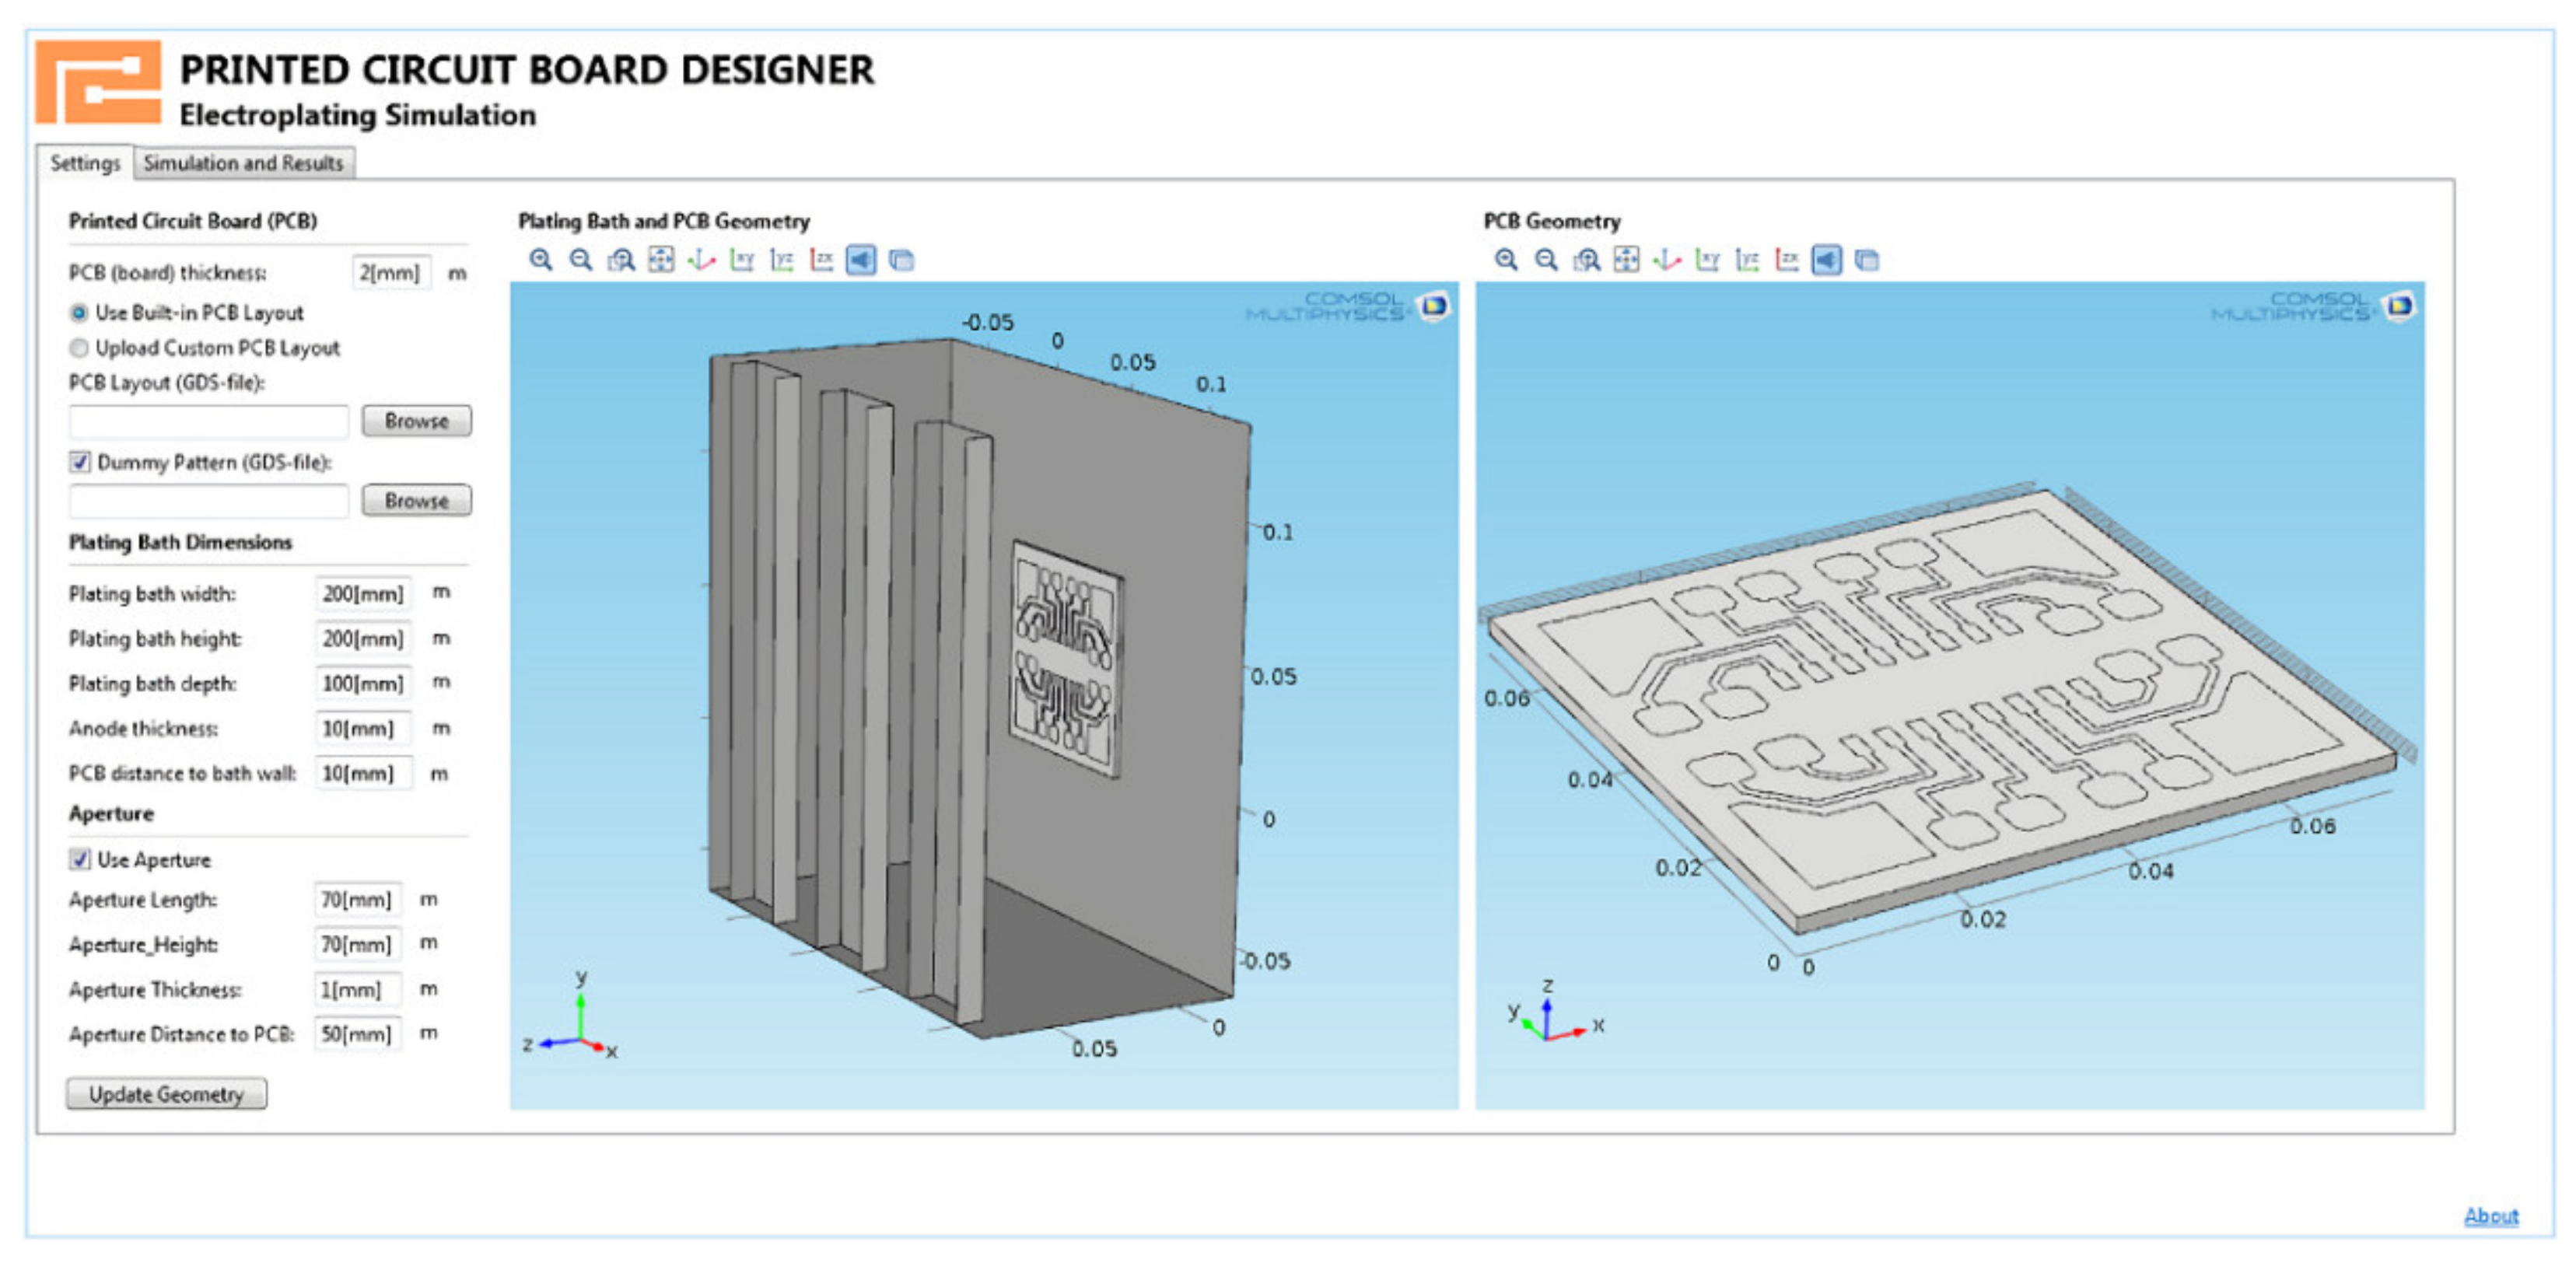
Moreover, some computer-aided design systems contain tools for conveniently creating independent applications to meet the needs of a particular production. Thus, complex modeling aspects can be eliminated after the application’s design, and the end user will only have to set specific parameters and start the simulation with one click.
Figure 3 shows an example of an application that visualizes the predicted copper thickness of a projected PCB.
Thus, we can say for sure that the use of computer simulation of copper electrodeposition processes is a serious design tool in the production of printed circuit boards. Furthermore, optimization of the parameters of the designed parts can facilitate further control of the metallization process and avoid design errors, as well as coating defects at the very early stages.
2.2. Copper Electrodeposition Modeling
Finally, digitalization of PCB production is impossible without the control and management of chemical production processes. The stage of electroplating copper deposition stands out among the rest in terms of the time spent in the stage and the complexity of optimizing the process to obtain parts without defects.
Although the technology of electroplating copper coatings is now widely studied, the primary research aims to obtain the optimal initial electrolyte composition and process parameters that guarantee the best properties of the deposited copper. Nevertheless, recently, attempts have been made to better understand the essence of the loss of properties of an electrolyte solution. Models of solution aging are investigated because the quality of the deposited coating depends on it [
7]. To create a model of aging of a copper plating electrolyte solution, it is necessary to constantly monitor the galvanic coating application to detect deviations in its parameters, determine their causes, and predict a change in the quality of a solution and make appropriate decisions. Model of solution aging can be defined by implementing prognostic and health management (PHM) approaches. PHM aims to develop tools, methods, and algorithms to provide system health monitoring, fault detection, fault diagnosis, fault prediction, and decision support.
PHM methods can be divided into three main approaches: model-driven, data-driven, and hybrid. The model-based approach requires a thorough physical understanding of the system (or process) to obtain analytical models that accurately describe its dynamic behavior. The data-driven approach uses monitoring data provided by sensors to extract relevant functions and build health indicators, which are then used to track the system’s health status and predict the expected life of the chemical solution. Finally, the hybrid approach combines the two previous approaches, combining their advantages. However, the model-driven approach gives more accurate results than the data-driven approach.
Recently, PHM-based models have already found application in the study of chemical processes in the production of printed circuit boards [
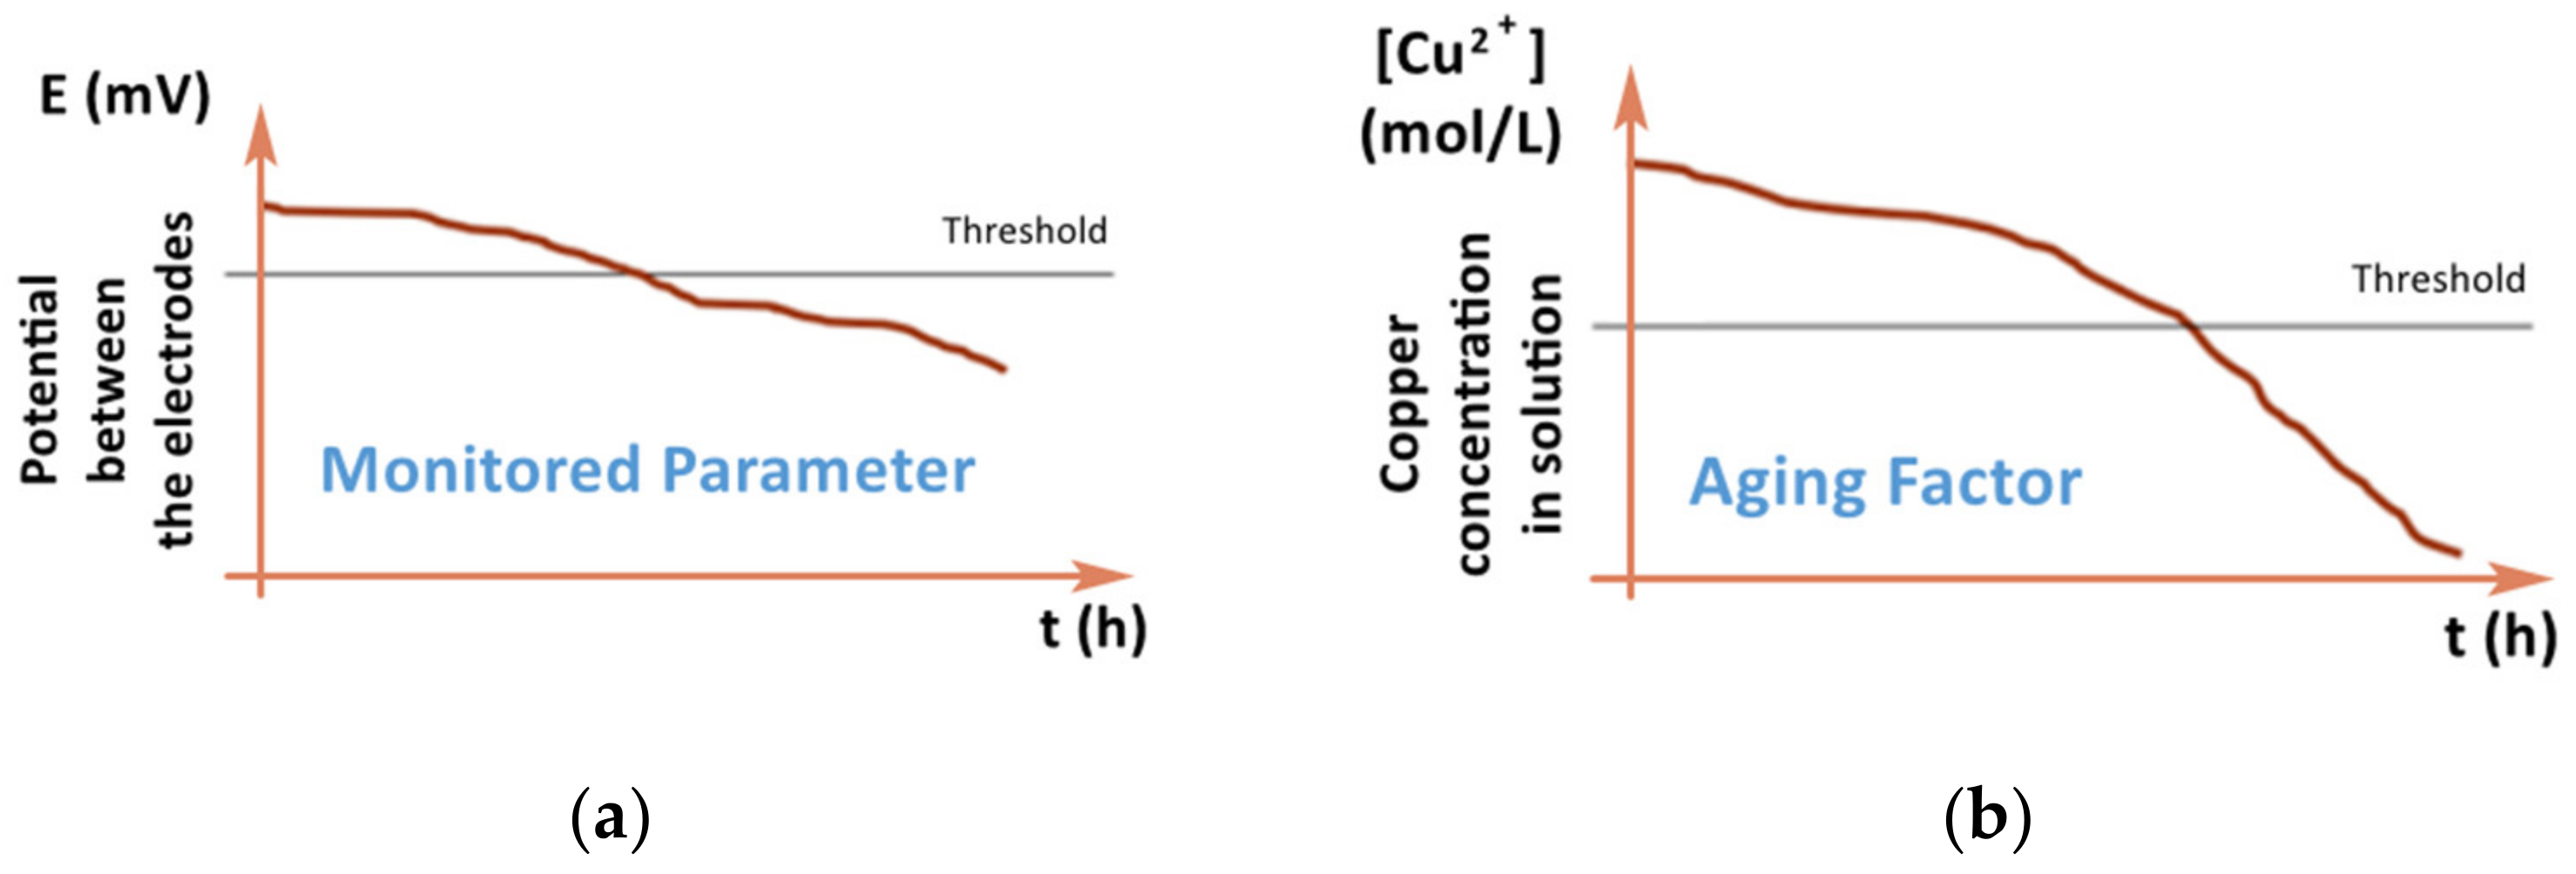
8]. The method described in this work for creating a model of the aging of a solution based on the correlation data of the parameter that determines the aging of the solution (the concentration of copper in the solution) and another parameter, for example, the potential between the anode and the cathode. While the concentration of copper in the solution is measured with great difficulty, the potential is easily measurable, and as it also depends on the concentration of copper in the solution, a correlation can be found between these two parameters. Thus, it is possible to calculate the concentration of copper in the solution and control its aging by an easily traceable parameter.
Figure 4 shows the influence of the investigated parameter (aging factor or copper concentration in the solution, respectively) on the monitored parameter (potential between the electrodes) [
8].
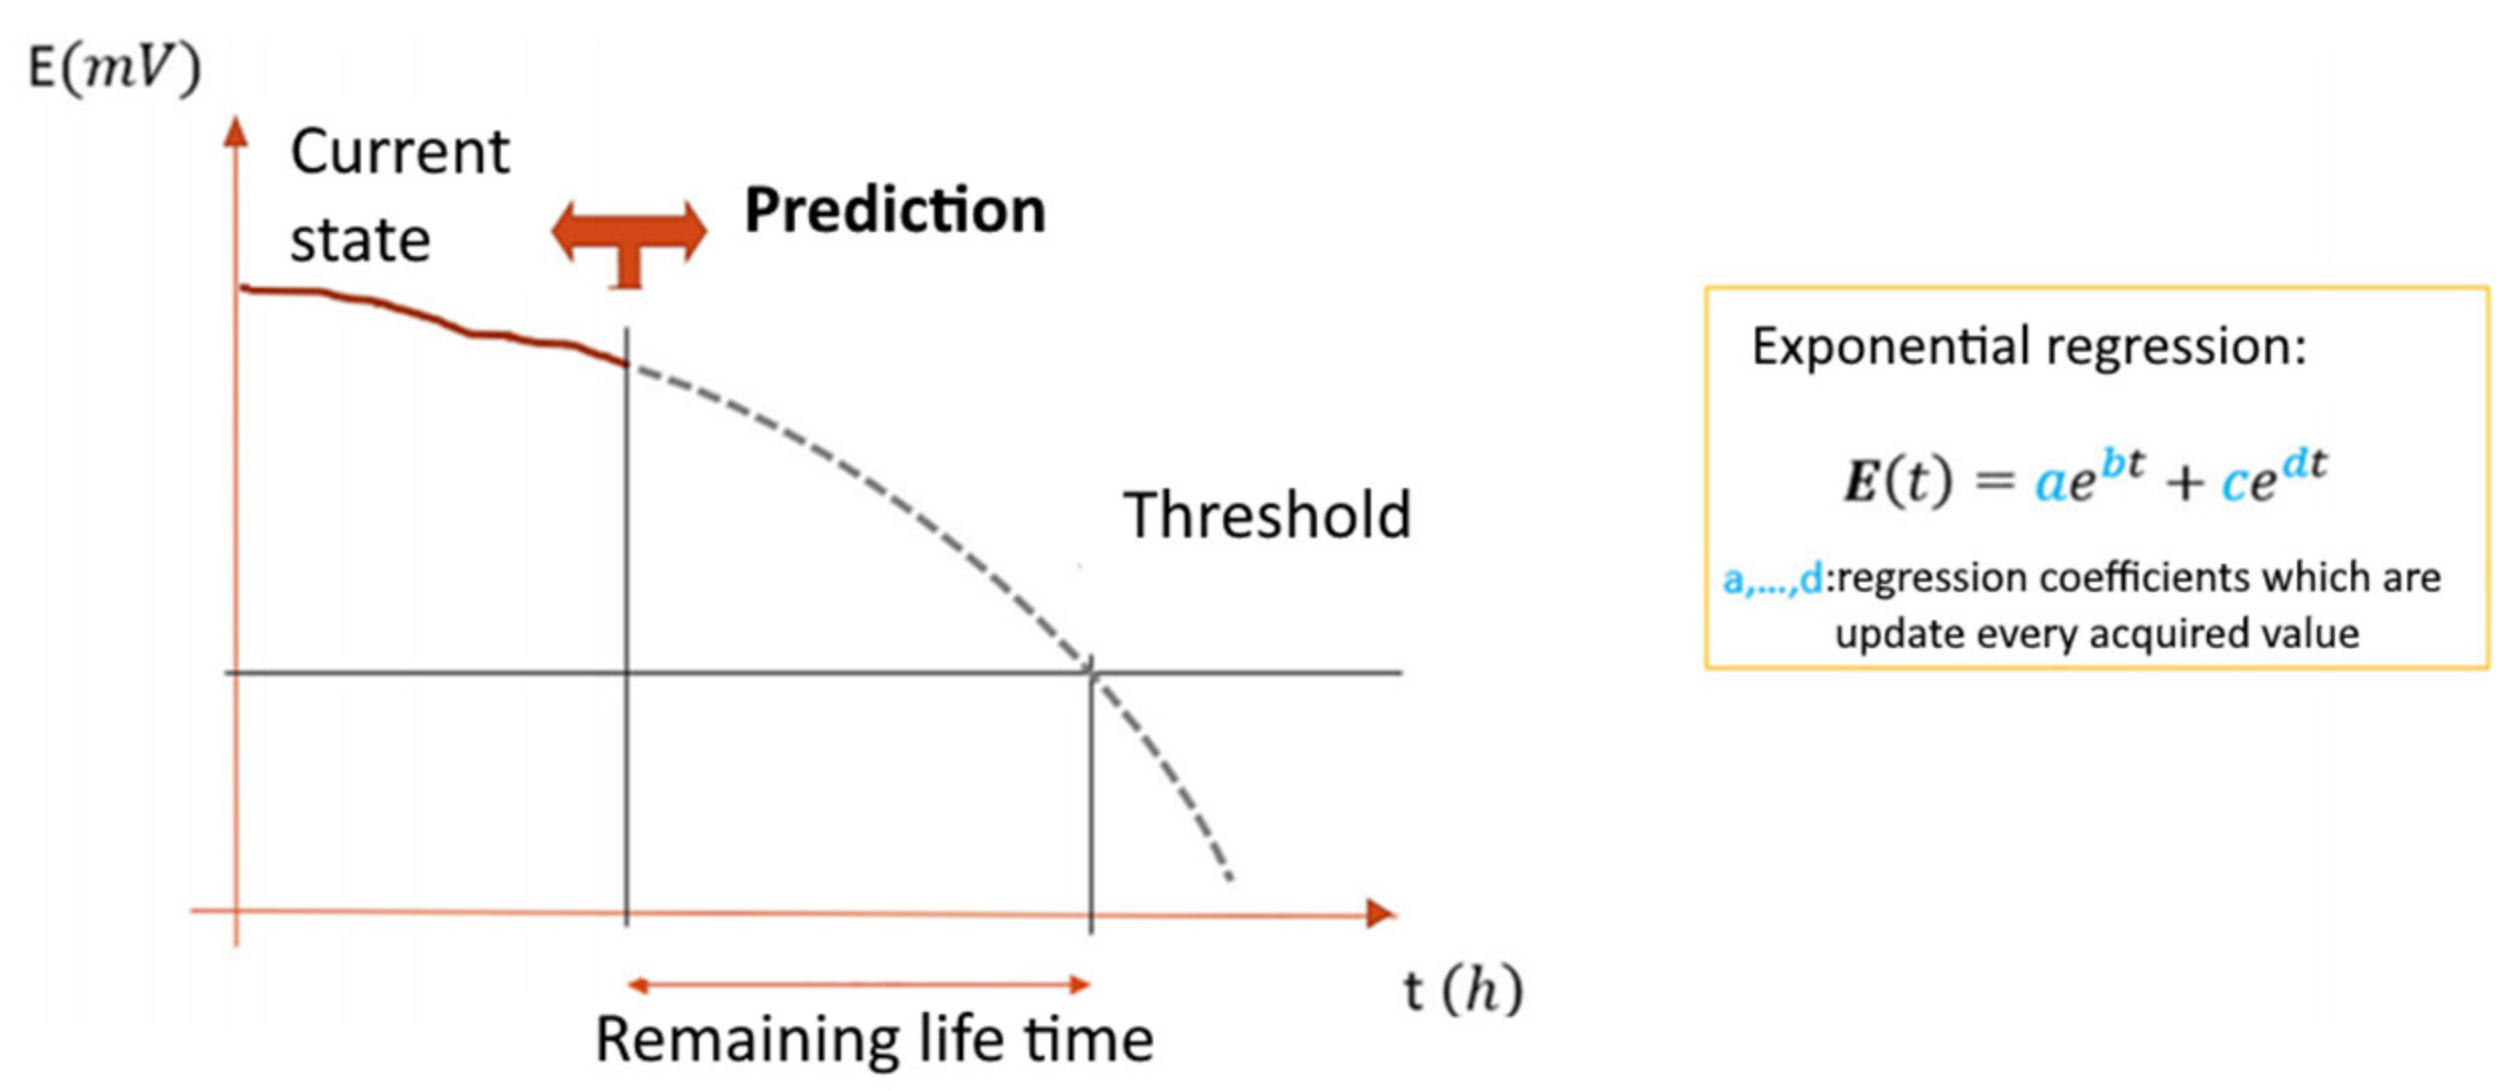
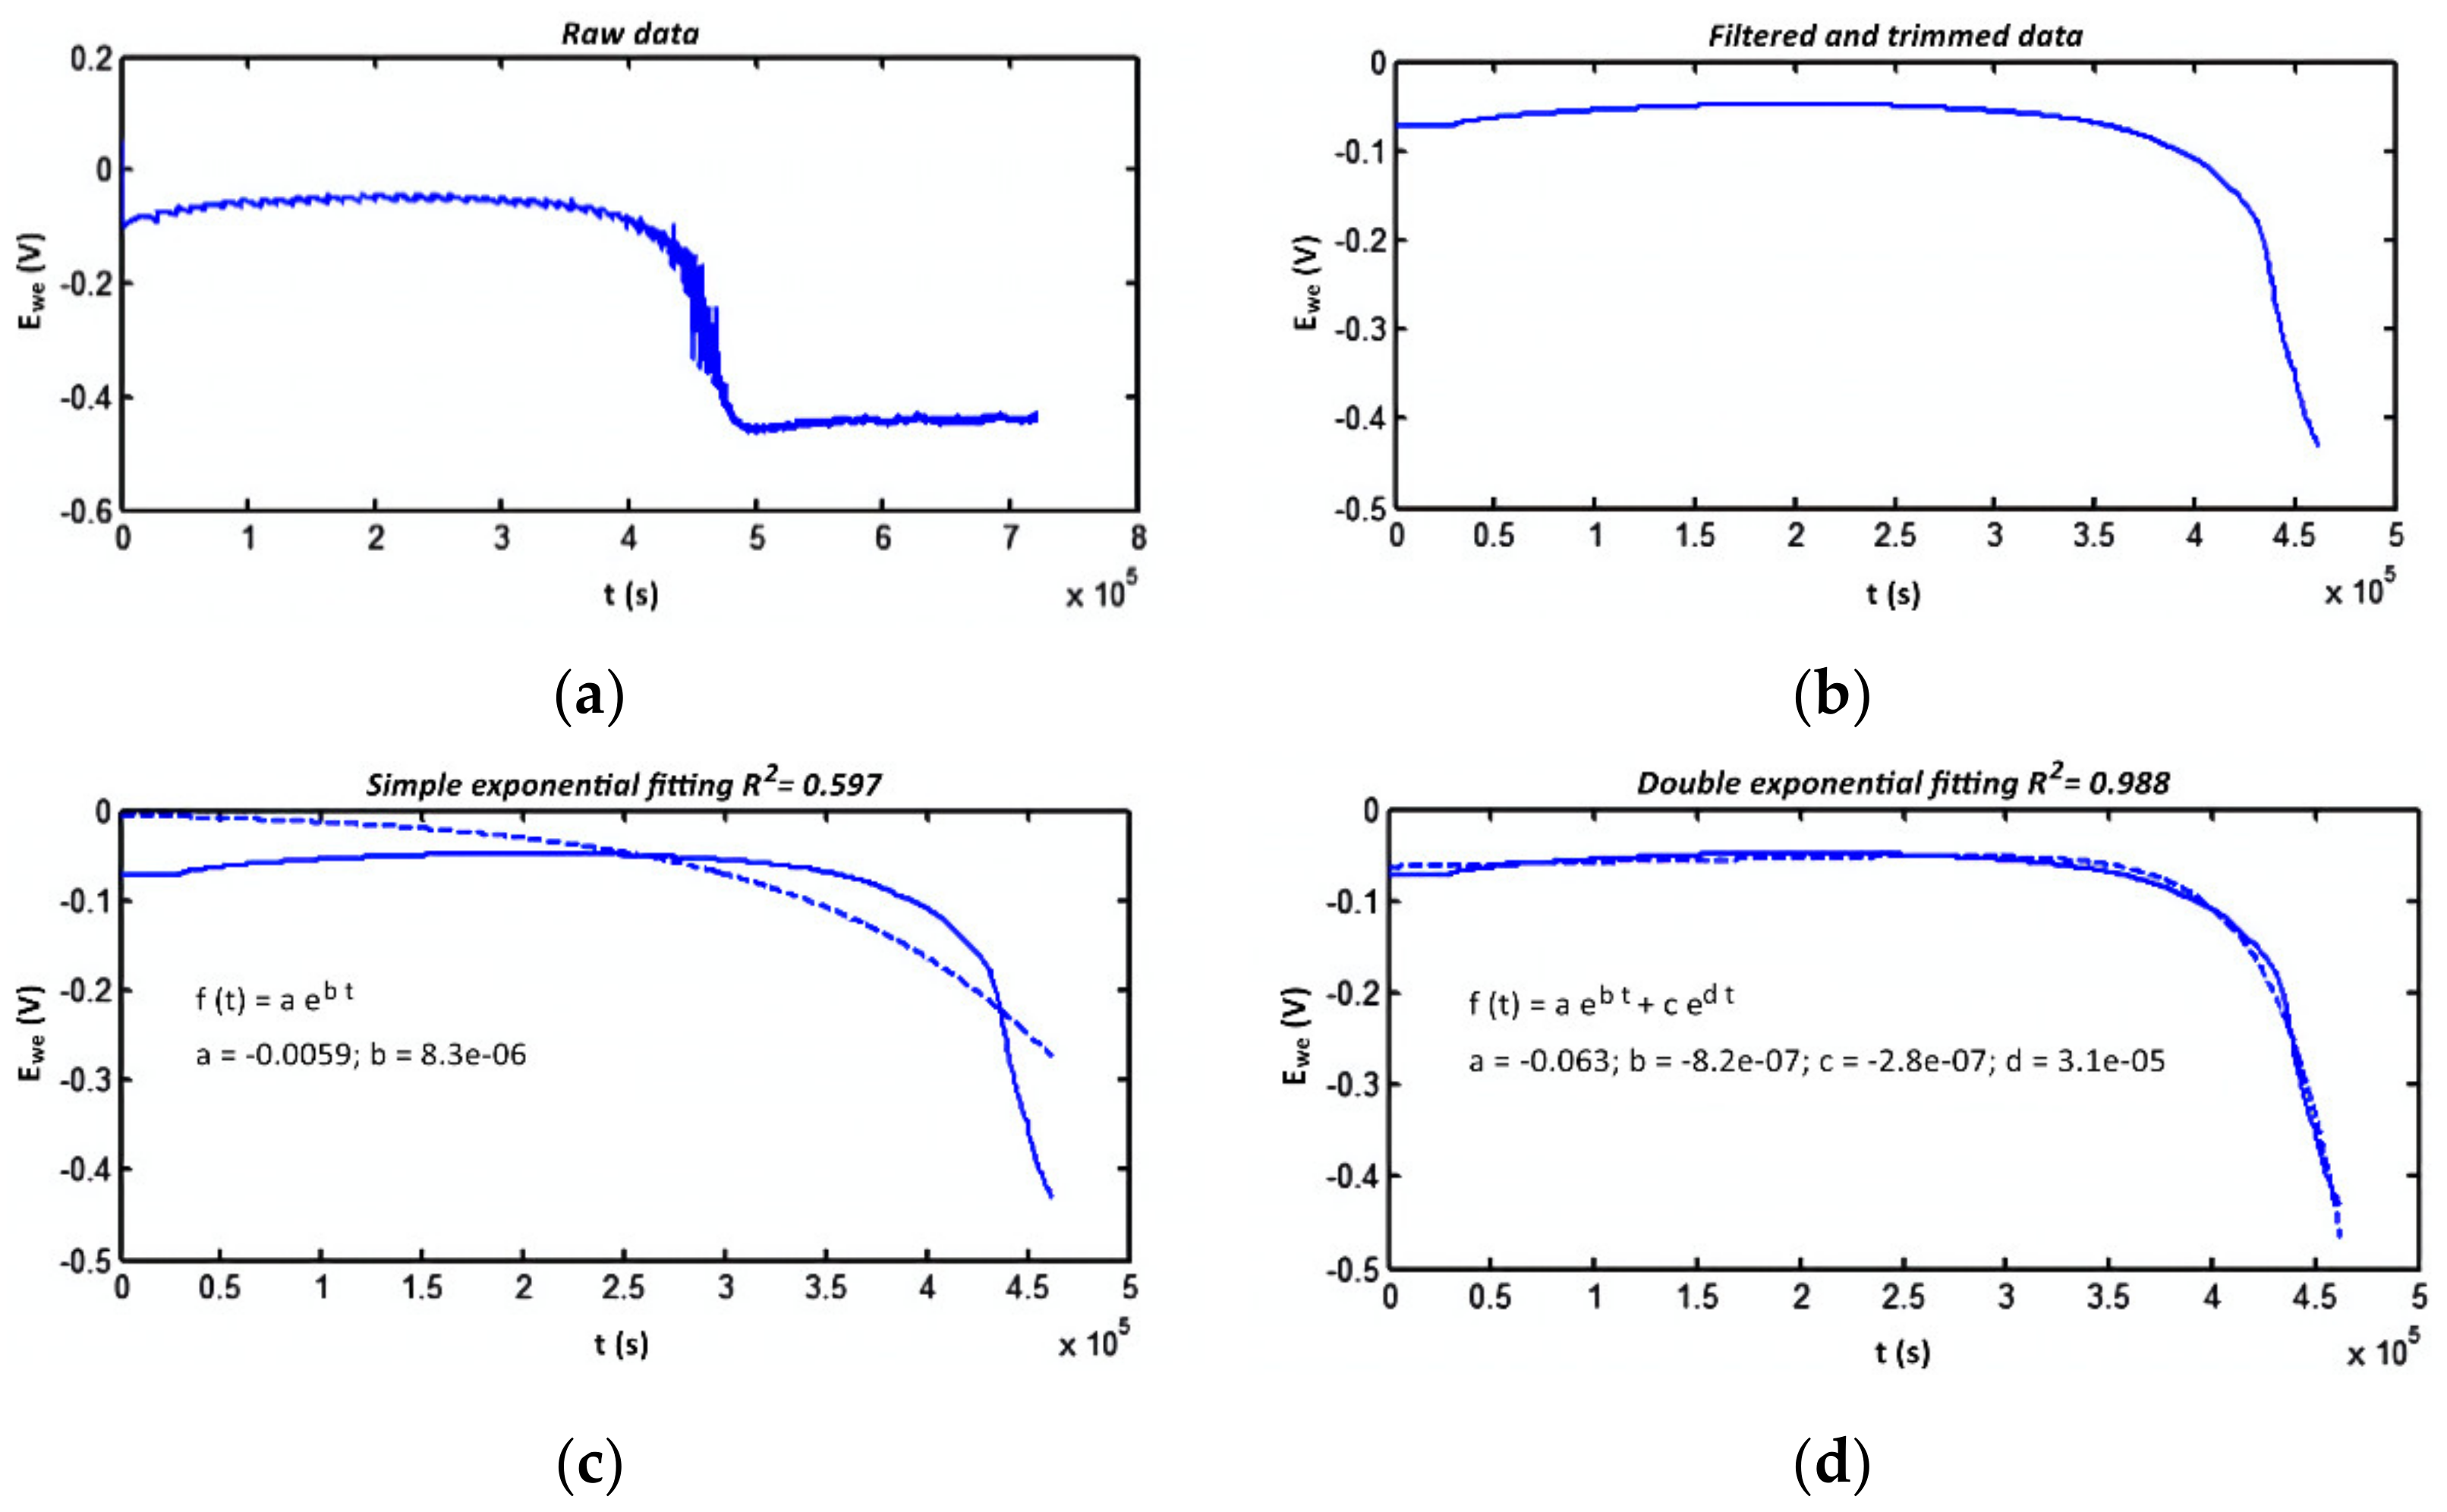
The resulting dependence is used to construct an exponential regression, and the coefficients were calculated so that the model most closely matched the obtained data. Once such a model was obtained, the characteristic of the remaining electrolyte life was calculated. Finally, coefficients of the dependence were defined using the MATLAB matching function (
Figure 5). The correspondence of the model built using this method to sensor data is shown in
Figure 6 [
8]. The figure illustrates how a mathematical model is formed from the obtained raw data, which can be used to control the aging of a solution.
Nevertheless, not only the concentration of copper in the solution can be monitored in this way. Other parameters of metallization: current, temperature, coating thickness can also be predicted compared with another parameter that can be measured and controlled. This method can be used in the digitalization of galvanic deposition of copper coatings to control the automatic control of the process and to timely respond to the aging of the electrolyte solution
Thus, applying the above methods and approaches in the chemical processes of PCB production can significantly increase the quality of products and reduce the number of defects at their stages. However, all the listed methods are currently not included in the production process. The following is an attempt to use the described approaches to create a digital production site.
3. Results
Based on the presented analysis, we chose the PHM approach to create the digital production site. We made this choice because PHM makes it possible to analyze the state of the process in real-time, obtain information about the process, and select the best operating mode for the equipment.
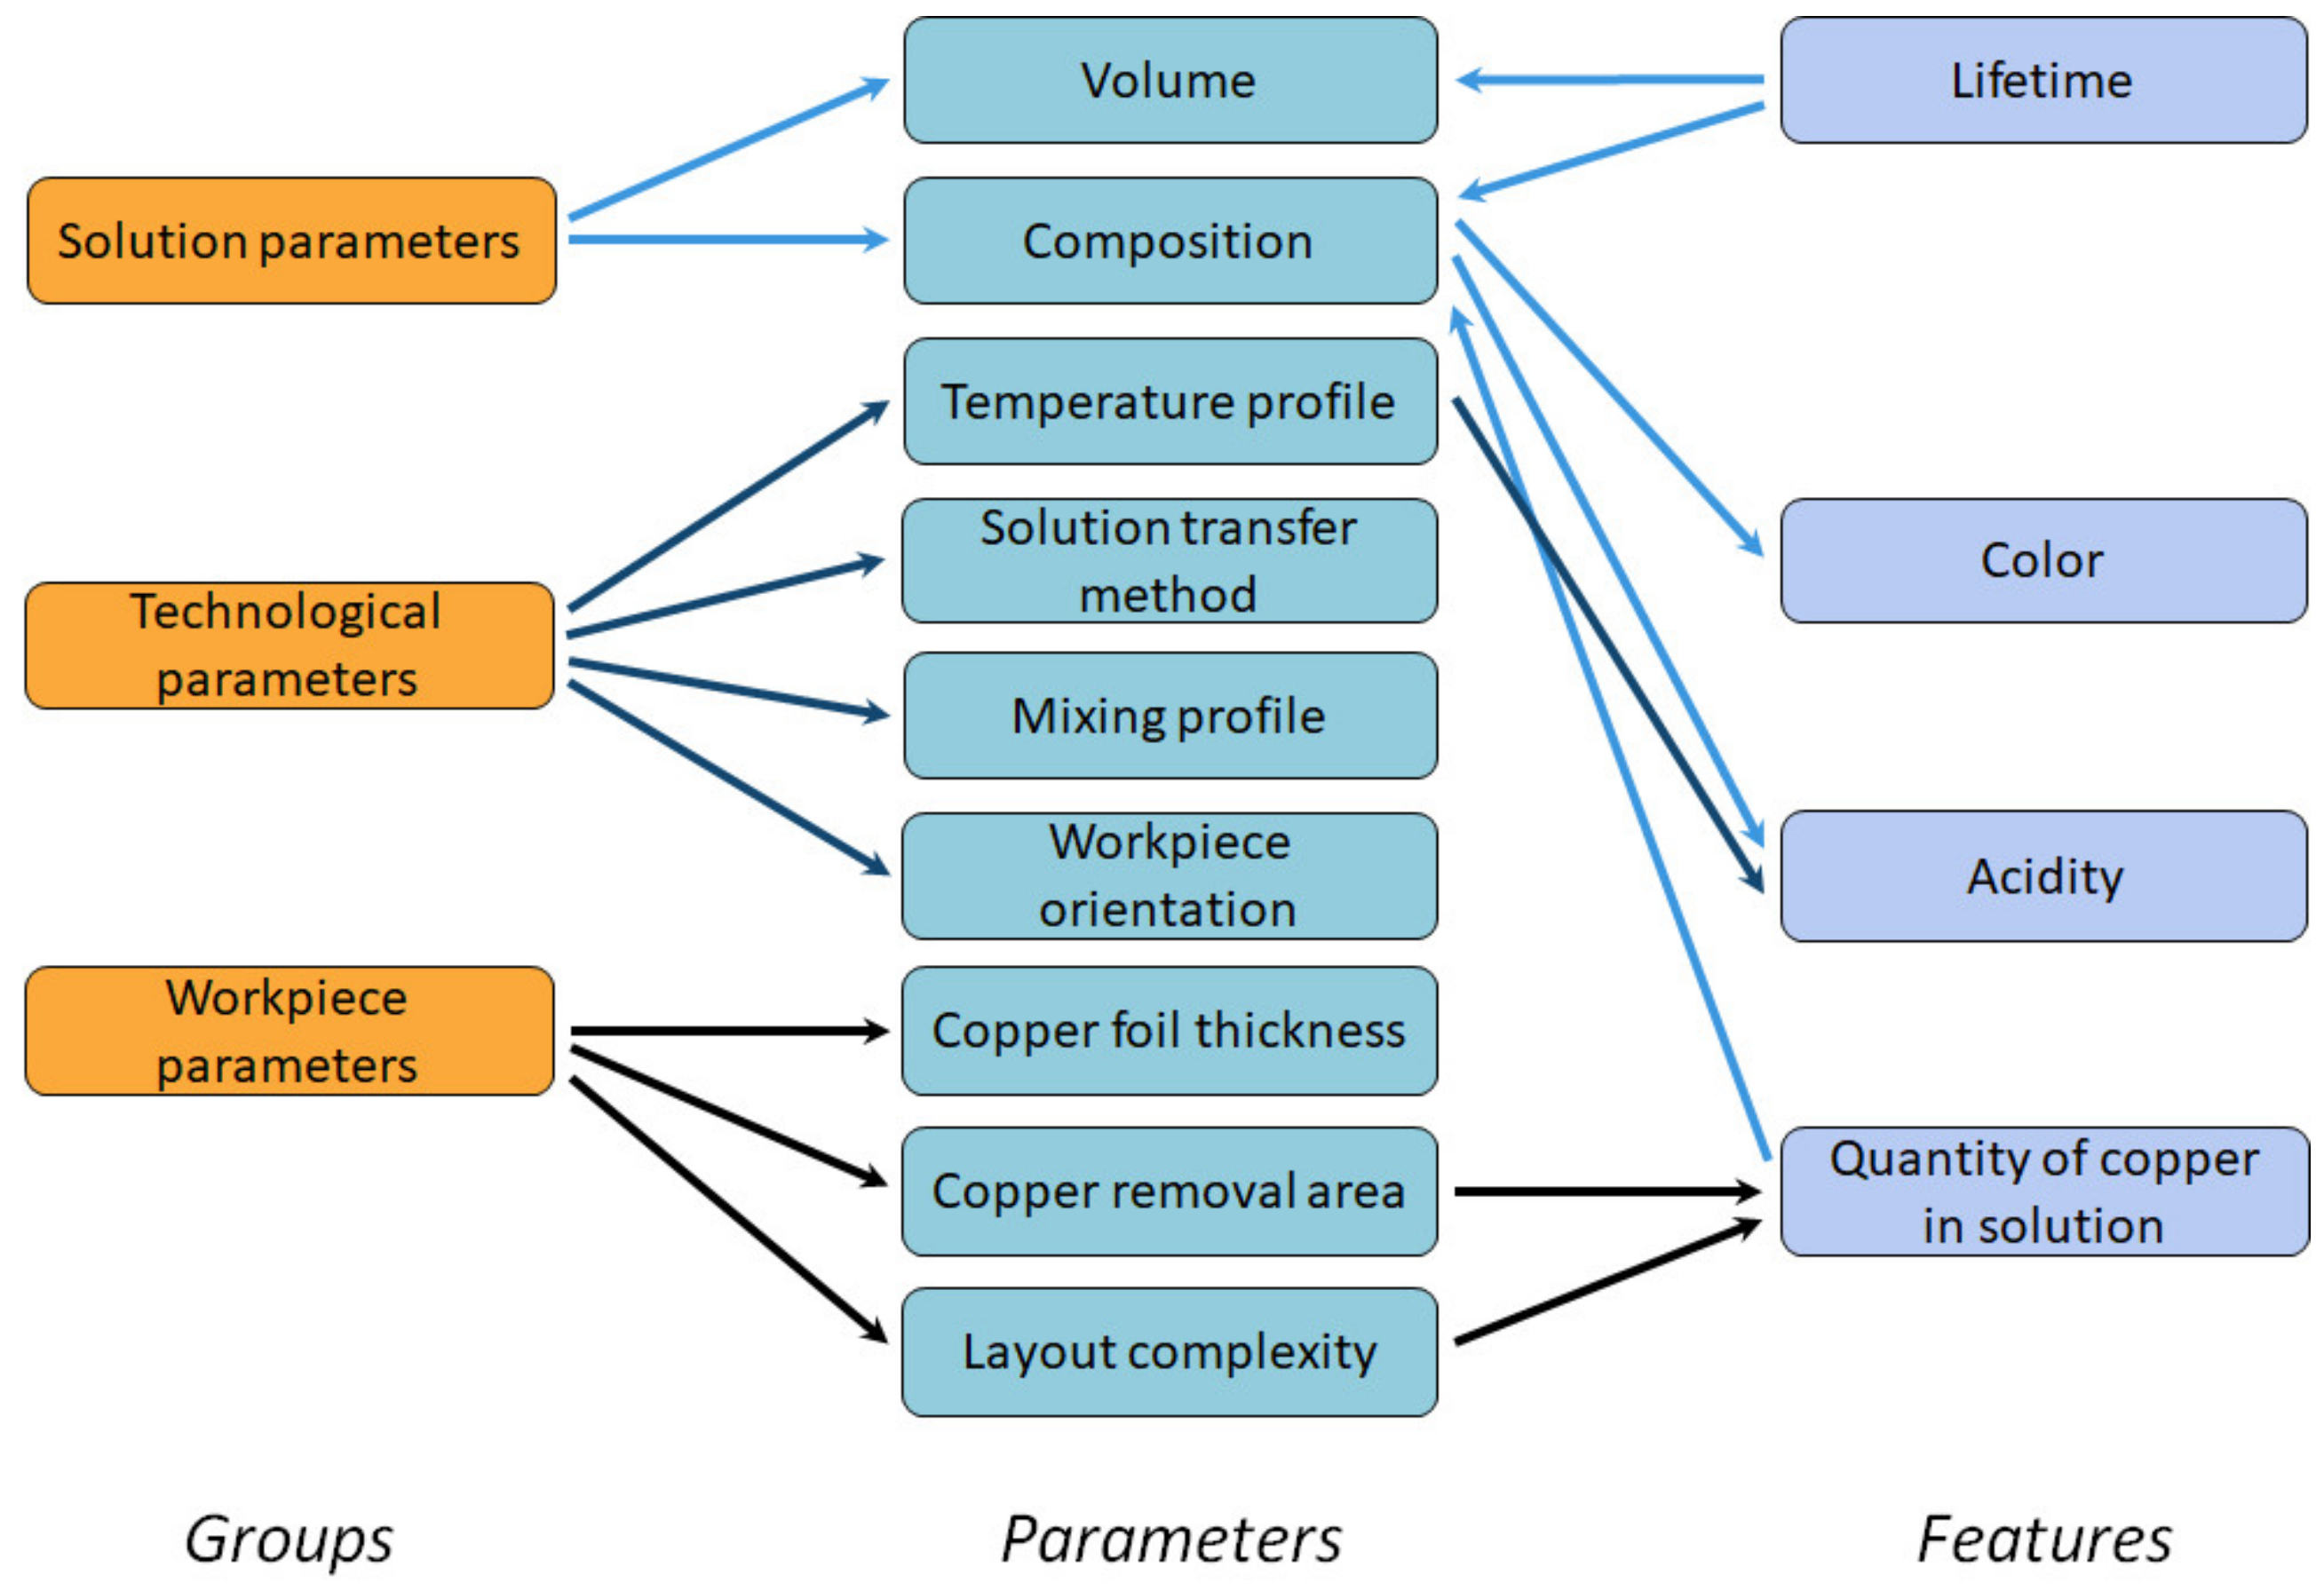
To study the possibility of creating a digital production site, we will focus on the etching operation in the future as fewer parameters affect the process. Unfortunately, a direct relationship that uniquely relates the etching time to the technological process parameters has not yet been determined. Therefore, an analysis of etching process described in [
9] we carried out, during which the parameters affecting the etching time were identified (
Figure 7).
We defined three groups of parameters that determine the etching time defined:
Parameters of the etching solution, which are mostly determined by its composition and volume;
Technological parameters [
10], such as the workpiece orientation in the etching bath, temperature of the solution, ambient temperature, method of transferring the solution to the workpiece, mixing profile of the solution;
Workpiece parameters, such as layout complexity and the quantity of copper to be etched, i.e., the thickness of the copper foil and the area of the copper to be etched.
As some parameters are difficult to control, for example, the composition of the solution, some features can be used to determine the primary parameters. Therefore, the following features were selected to control the etching process: quantity of copper in solution, acidity, color, and lifetime of the solution, i.e., the elapsed time since the preparation of the solution.
3.1. The Architecture of the Production Site as an Element of Digital Production
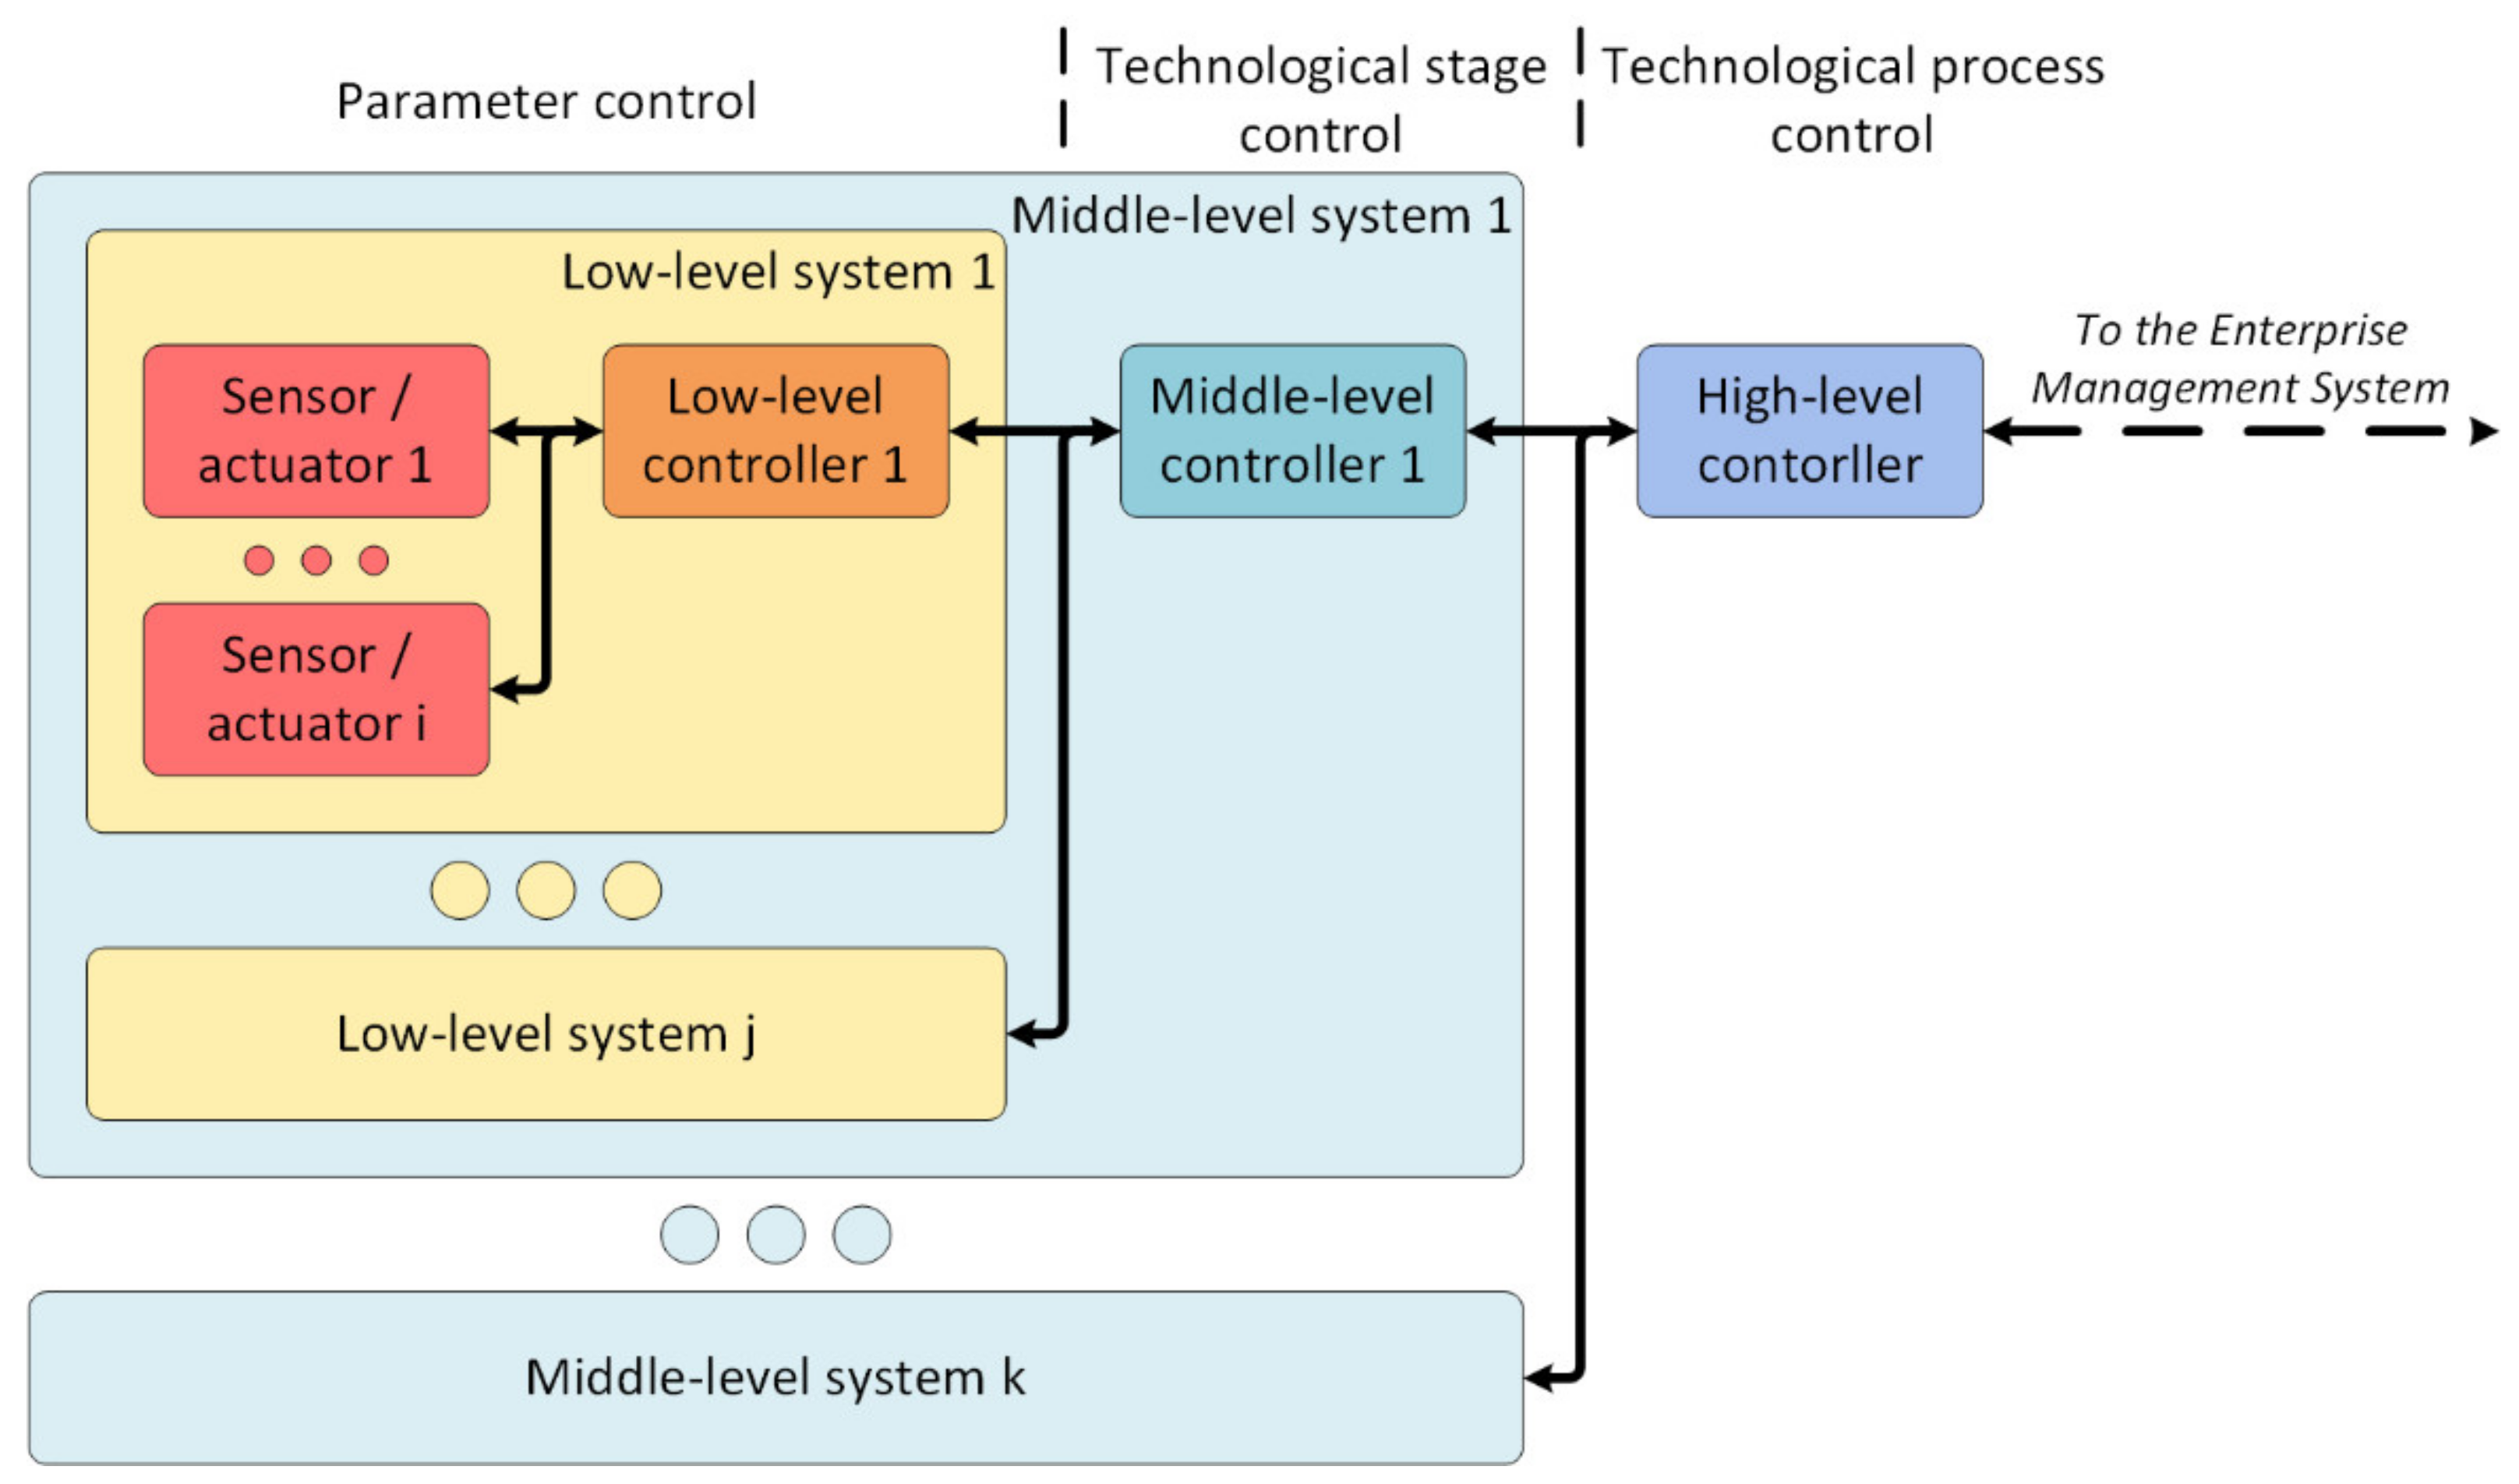
As a starting point for further development, the following architecture of the digital site as an element of digital production was designed (
Figure 8) based on a hierarchical principle.
Interaction with the surrounding world is carried out by sensors and actuators managed by a low-level controller. Its tasks are: processing data from sensors, transmitting effects to actuators, forming and sending packets, and monitoring the state of sensors and the actuator.
The low-level controllers transmit the generated packets to the middle-level controller. Its purpose is to manage and control one technological stage. It has the following functions: storing information about the technological stage, managing the stage, controlling and supervision of its state, and forming data packets for the high-level controller.
The high-level controller performs complete process management, storage of process data, exchange of information (for example, data for calculating the cost of production, the number of products manufactured, and the number of materials consumed) with enterprise management systems, such as the manufacturing execution system (MES).
The proposed architecture is similar to dividing responsibilities into edge, fog, and cloud computing [
11]. A critical event can be processed already on the low-level controllers with minimal delays as there is no need to forward data to a higher level to make a decision. Each lower-level element offloads the higher-level system, thereby reducing the requirements for the latter. Moreover, this architecture perfectly fits the range of hardware needed to build the system. Microcontrollers and programmable logic controllers are supposed to be used as low-level controllers. Single-board and industrial computers are supposed to be used as middle-level controllers, and server computers are supposed to be used for high-level controllers.
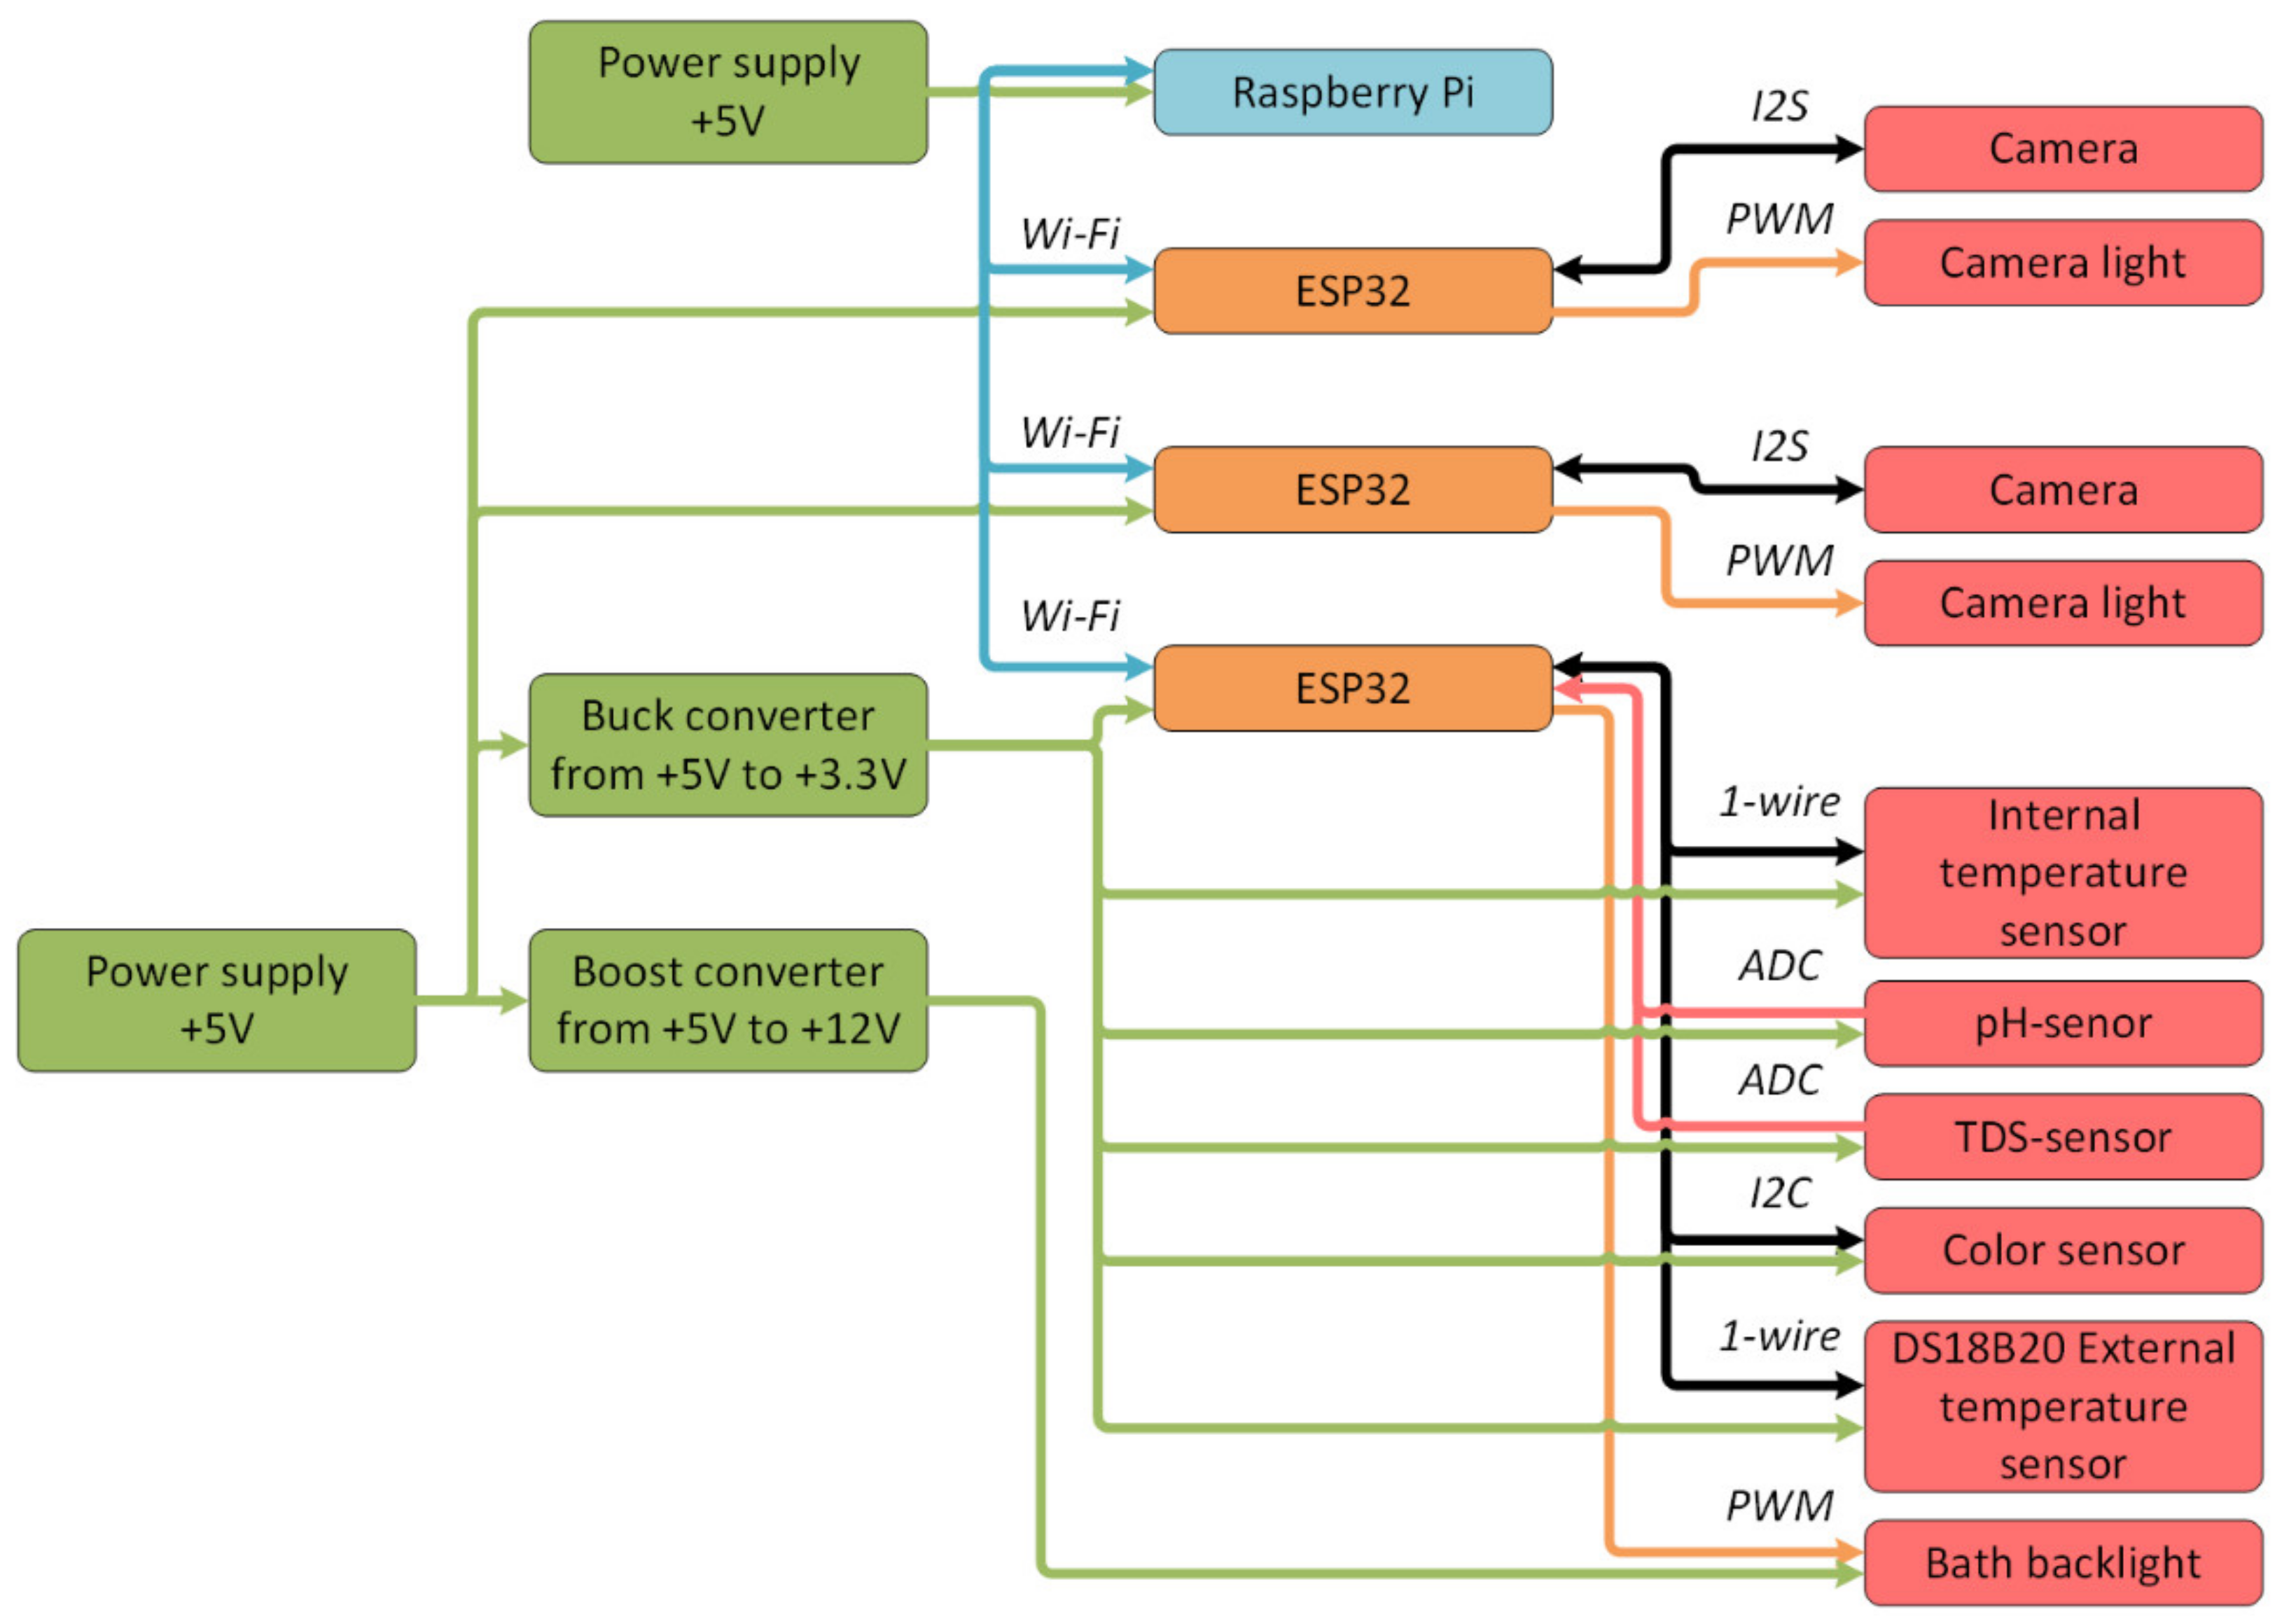
3.2. Hardware Structure of the Digital Production Site
Based on the proposed architecture (
Figure 8), the following hardware structure of the digital production site was developed (
Figure 9).
The digital site consisted of:
A single-board Raspberry Pi 4 computer (with 1 GB RAM) as a middle-level controller;
System-on-a-chip microcontrollers ESP32 as low-level controllers for processing information from sensors and cameras;
DS18B20 temperature sensors that recorded the temperature inside and outside the bath;
Acidity sensor;
TDS-sensor, which determined the number of solid particles in the solution and could presumably be used to obtain information about the copper quantity in the solution;
Color sensor based on the circuit AMS TCS34725;
A power distribution system that contained two power supplies with an output voltage of 5 V, a step-up converter from 5 V to 12 V, and a step-down converter from 5 V to 3.3 V;
Two OV2640 cameras with LED to provide visual control of the etching process;
Bath backlight to provide stable illumination of the solution regardless of external conditions.
We also defined some limitations: the immersion method was used to transfer the solution; there was no mixing of the solution. Thus, the steadiness of these parameters eliminated their influence on the etching time during experiments. Otherwise, their control would be difficult due to the large number of influencing factors, for example, the pressure of the etching solution flow when using the jet method of transferring or the volume of air passed through the solution during air mixing.
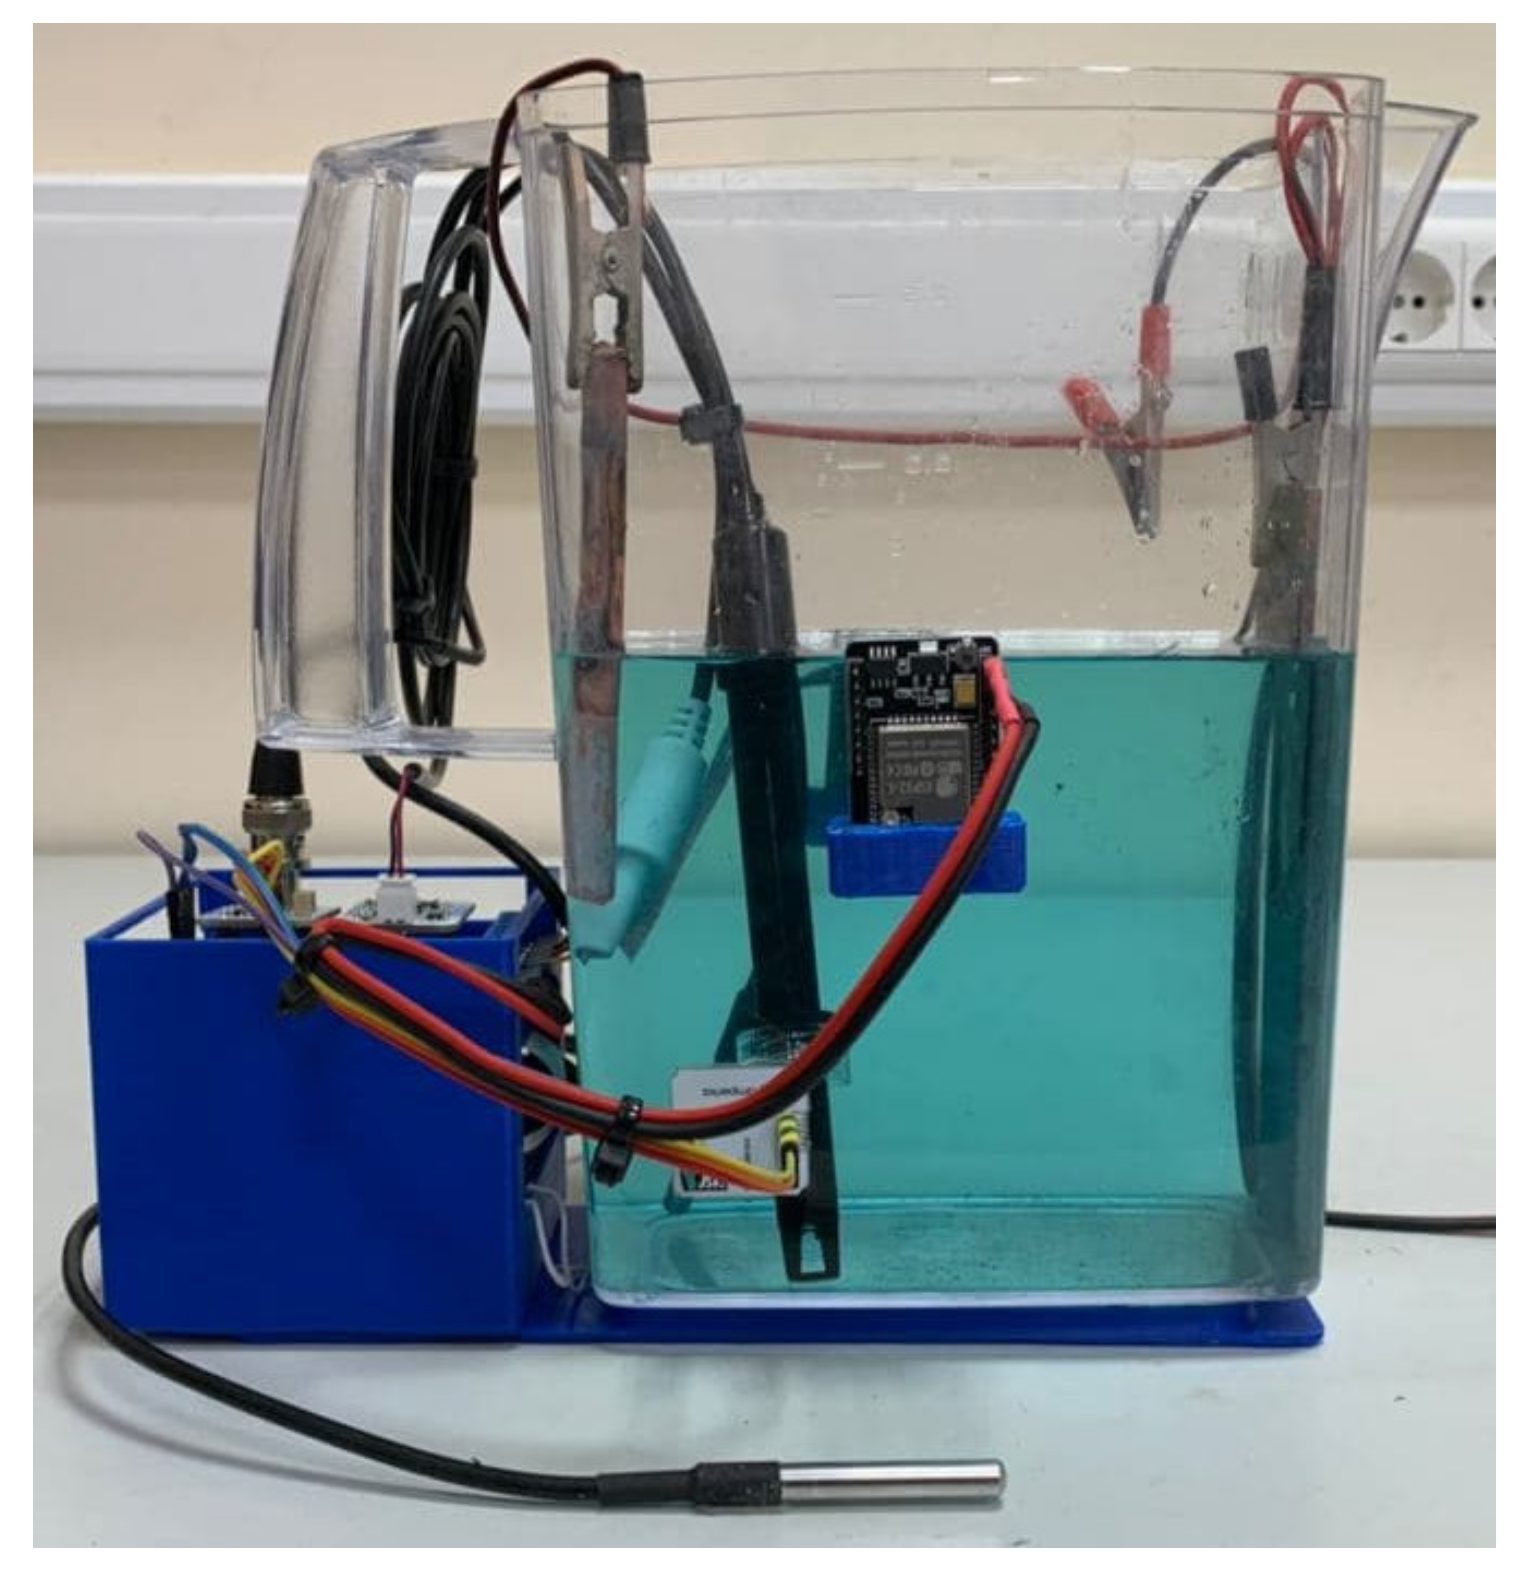
In accordance with the hardware structure (
Figure 9), a device was developed that includes two PCBs. On the first PCB, the ESP32 controller and parts of the power distribution system were mounted. On the second PCB, the connectors and modules for processing information from sensors were placed. In addition, 3D models of the bath base, controller housing, and camera holders were also developed and printed on a 3D printer with the fused deposition modeling (FDM) technology. The appearance of the system and the location of the modules are shown in
Figure 10 and
Figure 11, respectively.
3.3. Software Structure of the Digital Production Site
The software structure of the digital production site (
Figure 12) was also developed to ensure the correct functioning of the system. The main component of the system was a middle-level controller, on which the Raspbian operating system was installed, in which Docker containers with the necessary services were deployed:
Mosquitto—service for providing data exchange between a low-level controller and the sensors by Message queuing telemetry transport (MQTT) protocol;
Node-Red—visual programming system implementing interaction with databases, user interface (Node-Red UI), and the logical part of the middle-level controller;
InfluxDB—a time-series database management system designed to store data from sensors;
Postgres—relational database management system used to store service information about the site;
Grafana—web application for site information analysis, process status monitoring, and identification of primary dependencies between process parameters.
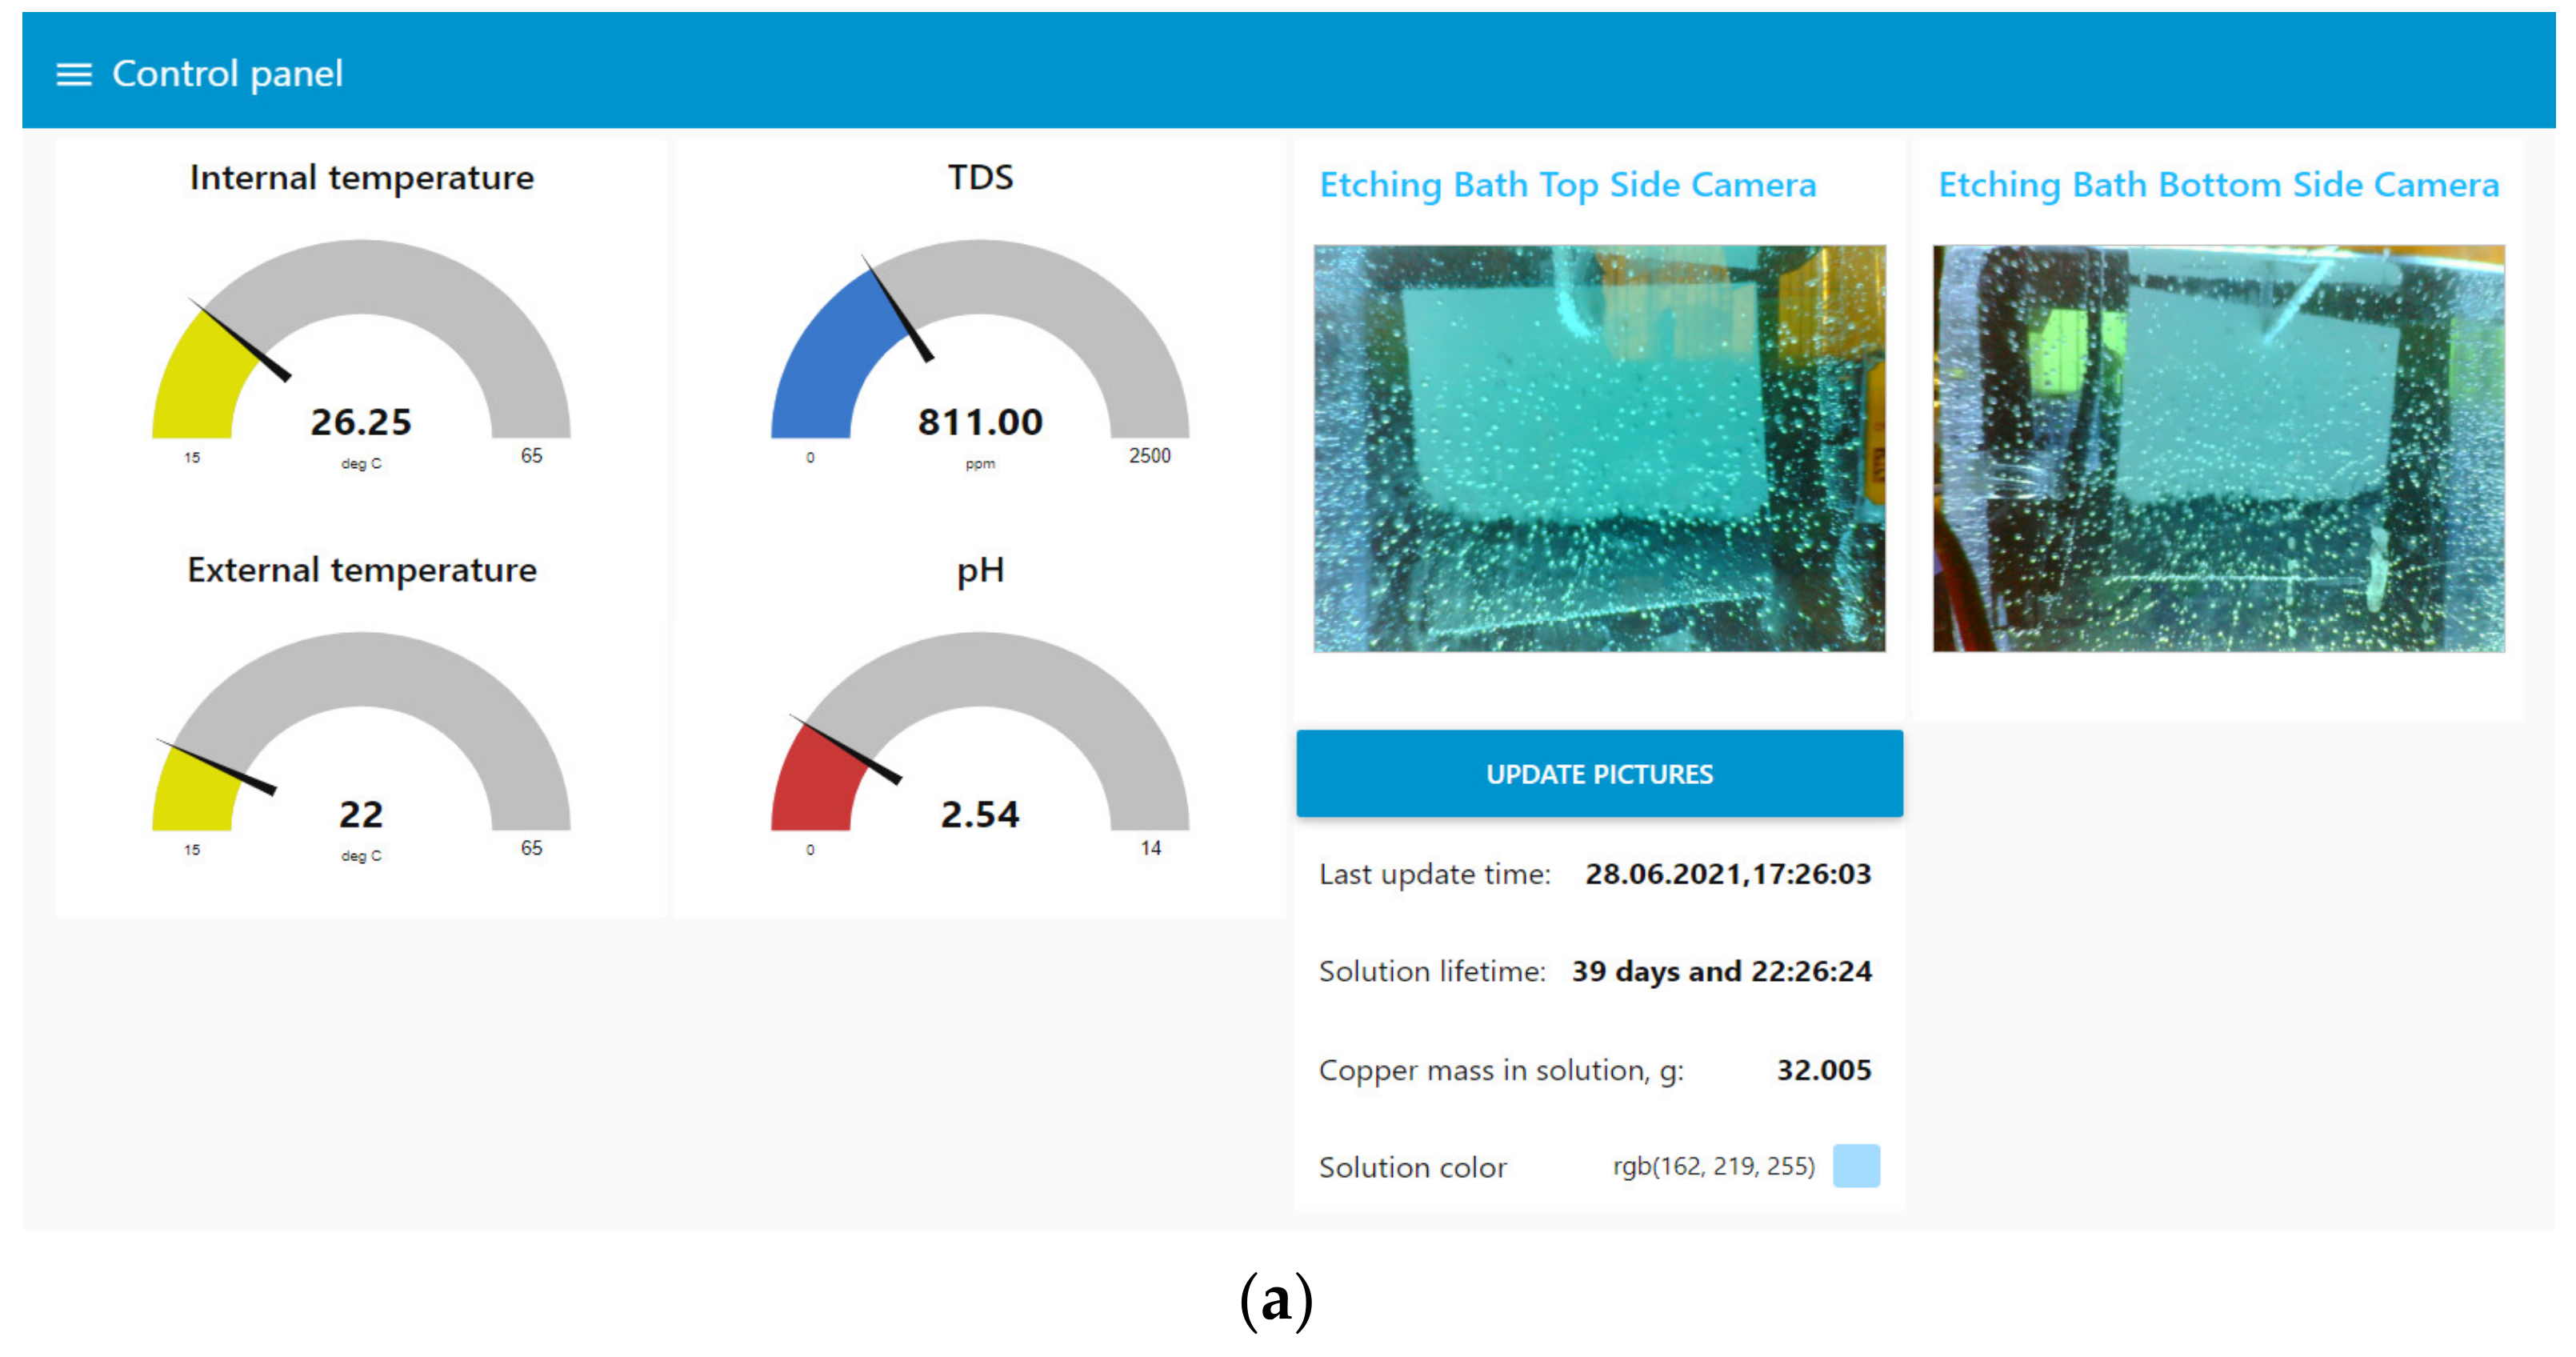
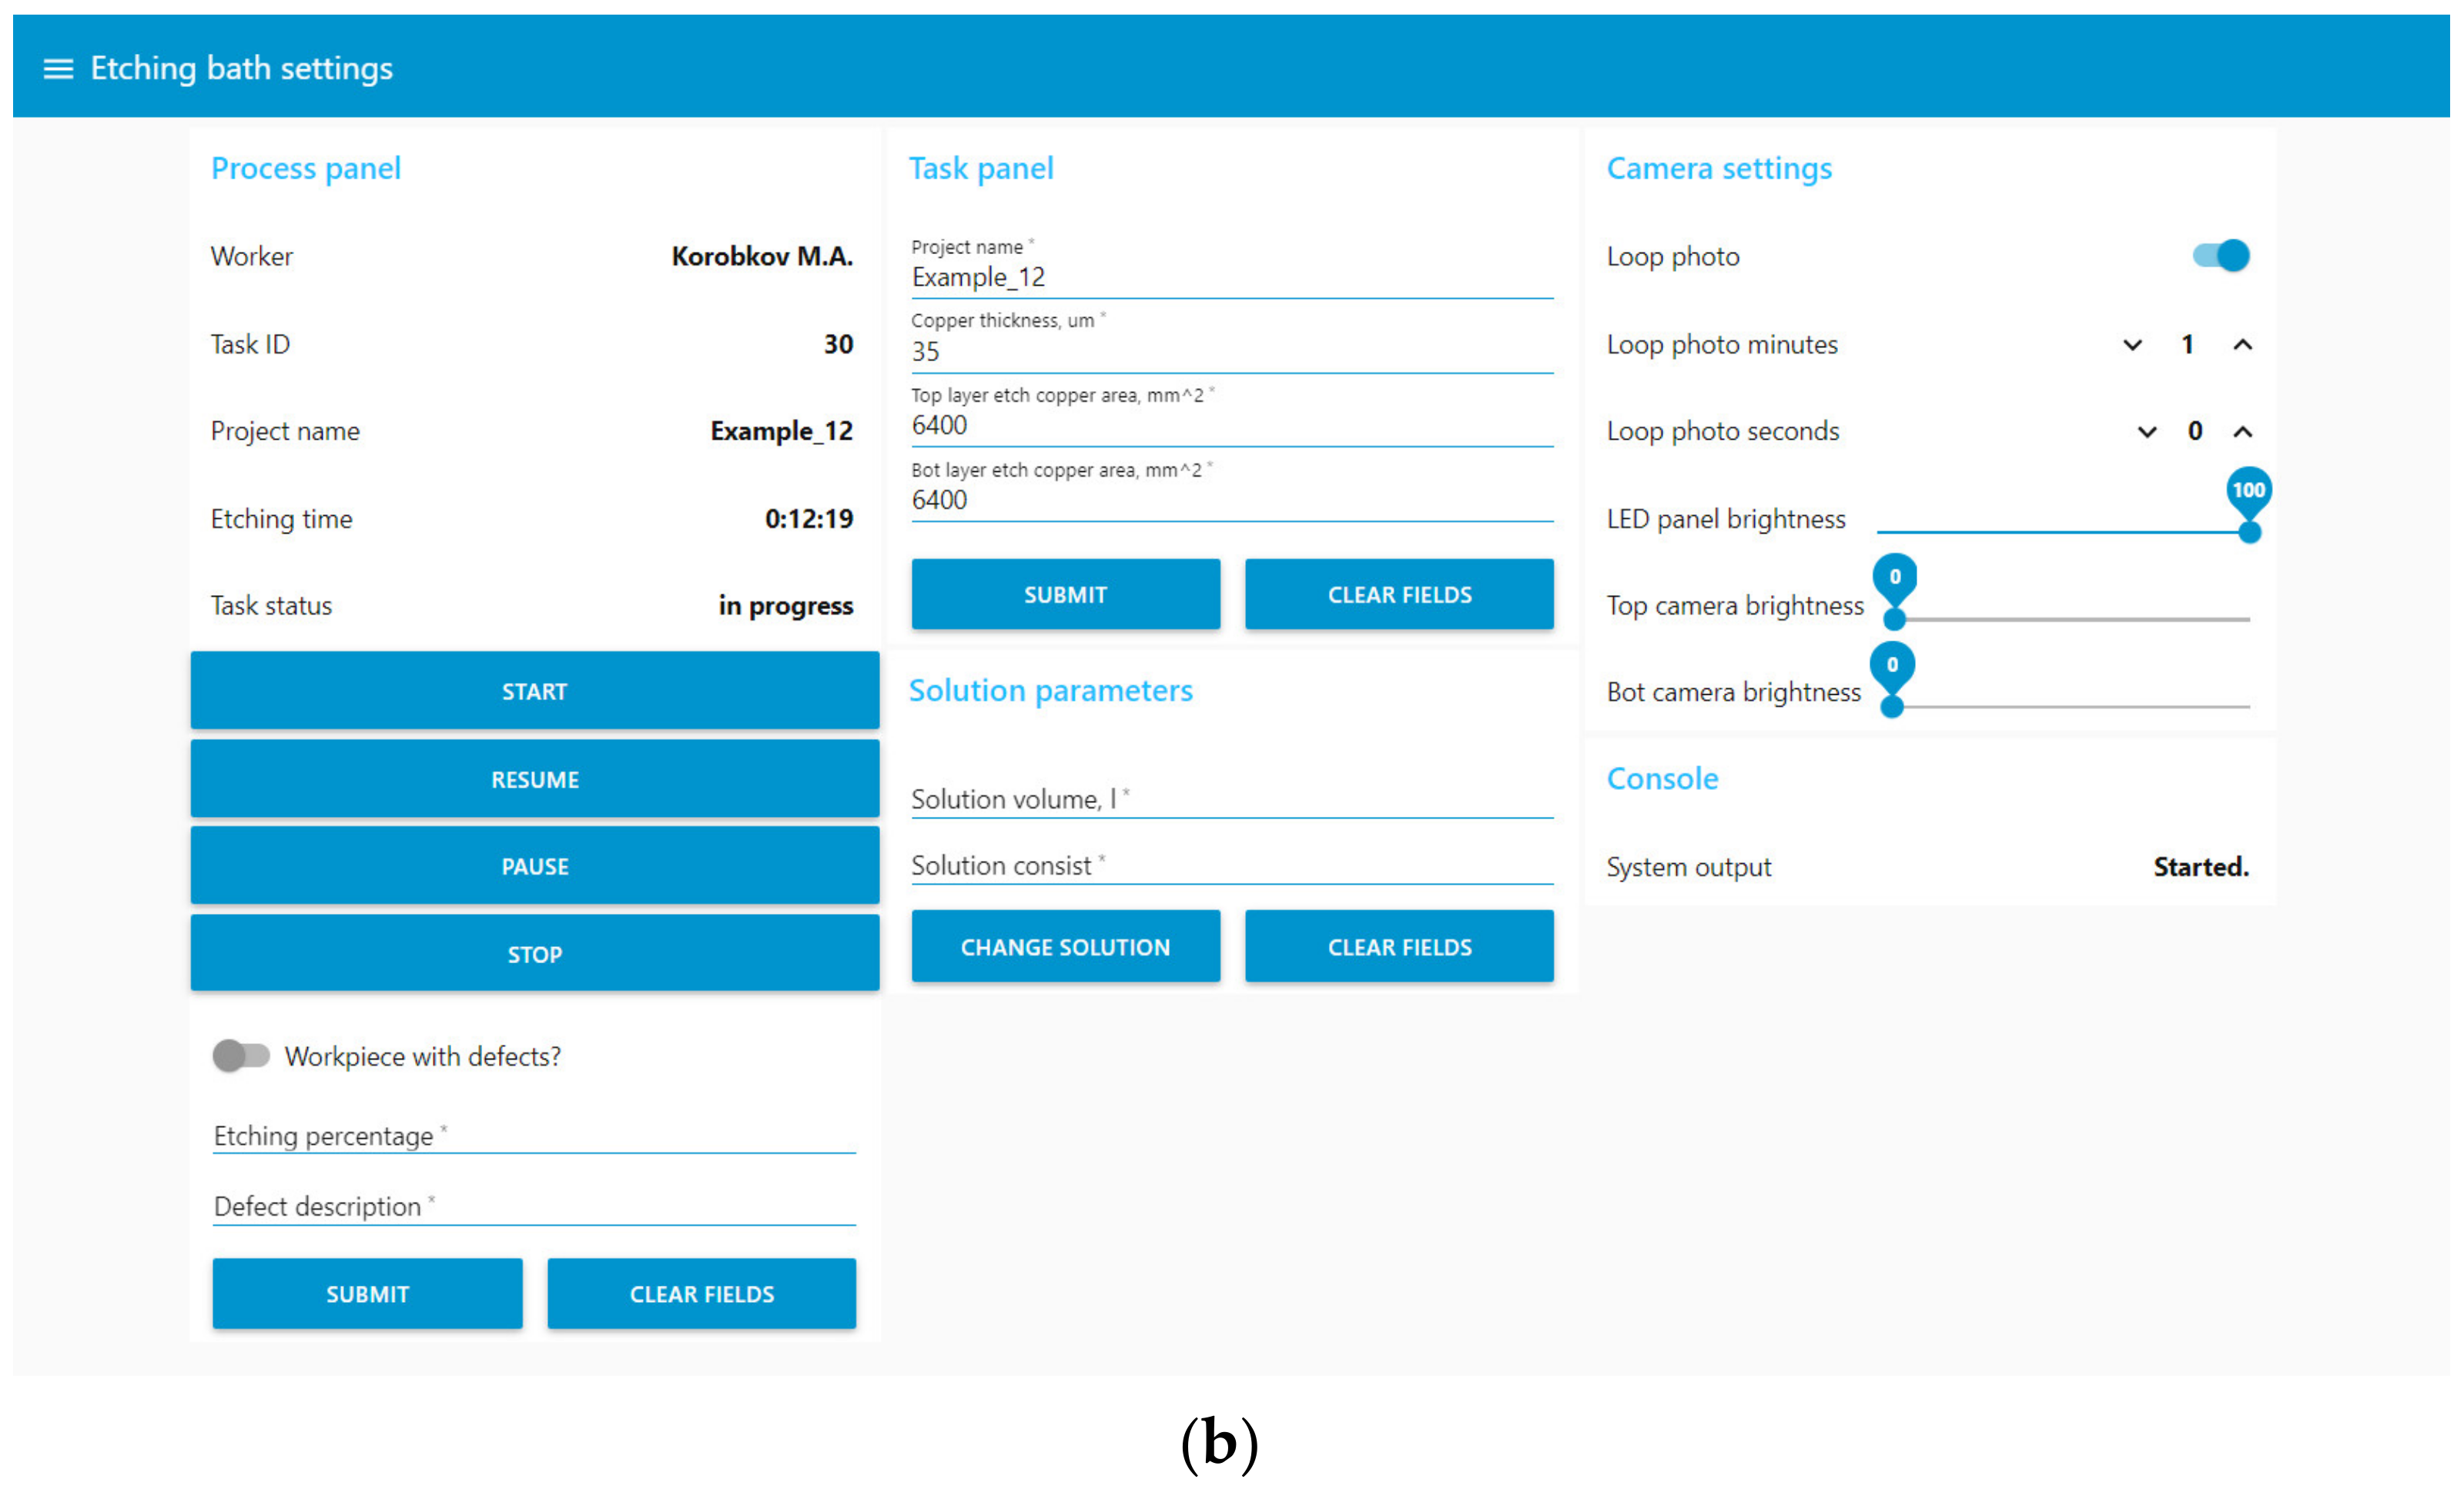
User interaction was mainly carried out through the web interface Node-Red UI (
Figure 13), which implemented the following functions:
Display current process data: values from sensors, camera images, and information about the solution;
Control of the etching process, including bath maintenance;
Inspection after the etching stage;
Loading information about the printed circuit board being manufactured;
Control of additional parameters: the brightness of the bath and camera lights, the time interval between automatic updates of information from the cameras.
The Grafana service was deployed to provide the ability to monitor the process status. This service display of process data was configured (
Figure 14).
The developed software structure is thus the necessary minimum to ensure the operation of the digital section and implements both interactions with sensors and interaction with the user. It is also worth noting that the service architecture of the middle-level controller and the use of Docker as a deployment automation tool significantly speeded up the process of installing the system on another server.
4. Analysis
Several experiments were carried out to investigate the site’s operability and assess the possibility of applying the PHM approach:
An experiment to determine the mutual influence of physical quantities in the process;
An experiment to determine the aging of the solution;
An experiment to determine the copper mass concentration of the solution.
In all further experiments, a solution was used that included 1.5 L of distilled water, 150 mL of ammonium persulfate, and 35 mL of salt.
4.1. Investigation of the Mutual Influence of Physical Quantities in the Process
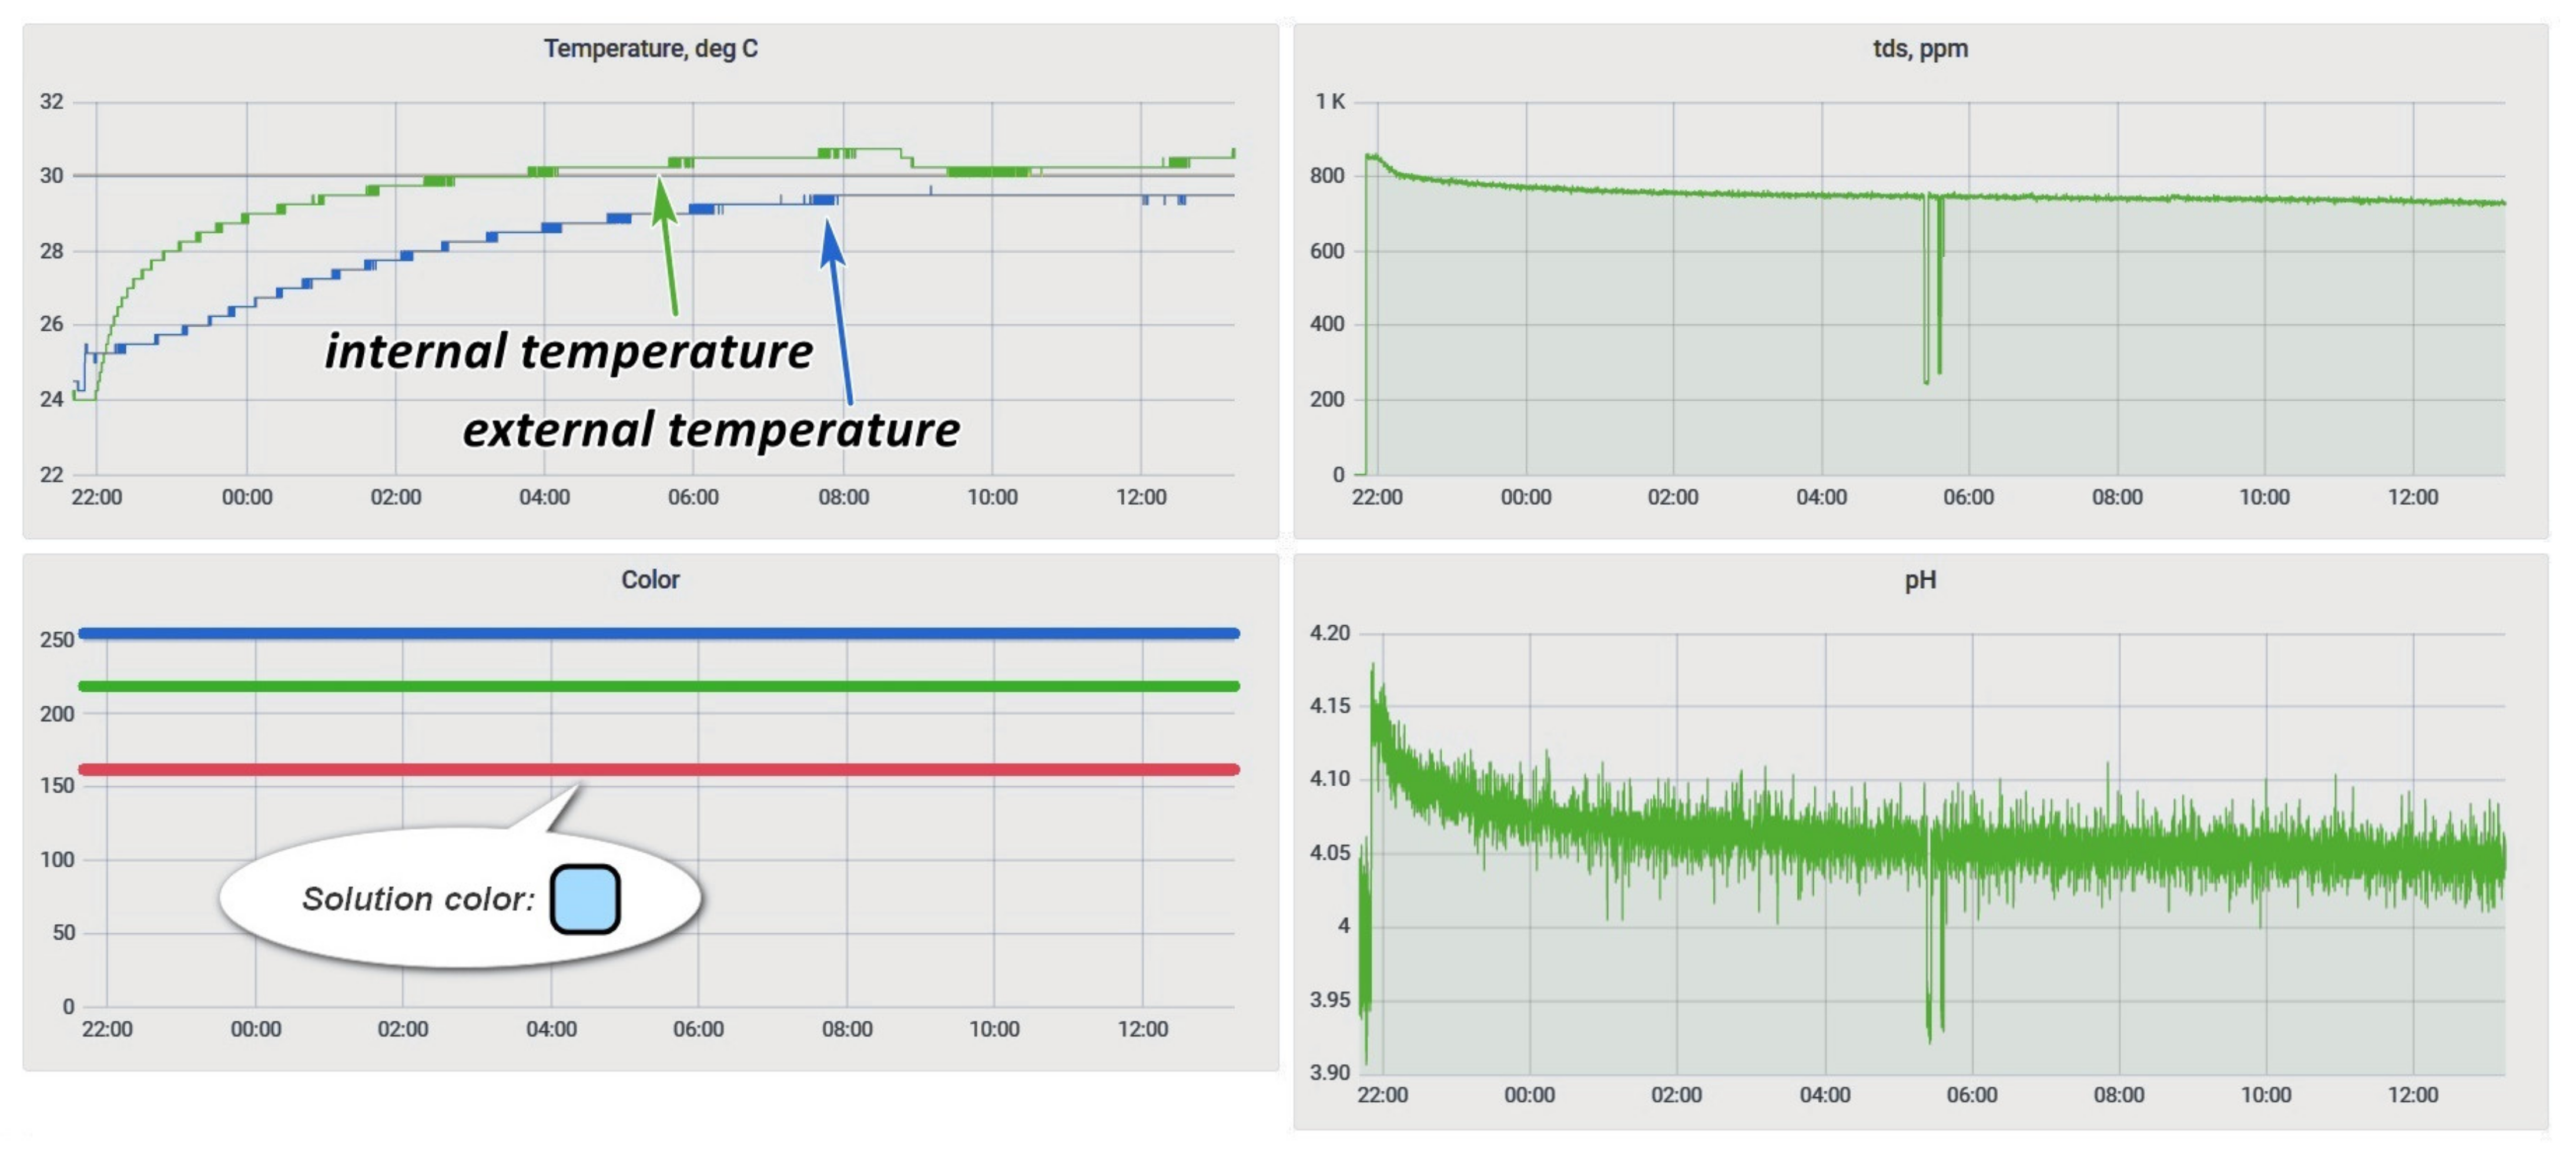
The objective of determining the mutual influence of physical quantities was to assess the possibility of joint use of the selected set of sensors to control the process. During the experiment, a pair of sensors from those intended for immersion (a temperature sensor inside the bath, an acidity sensor, and a salt concentration sensor) was immersed for 30 min in a freshly prepared solution, and then the results were analyzed. The results of this experiment are in
Figure 15.
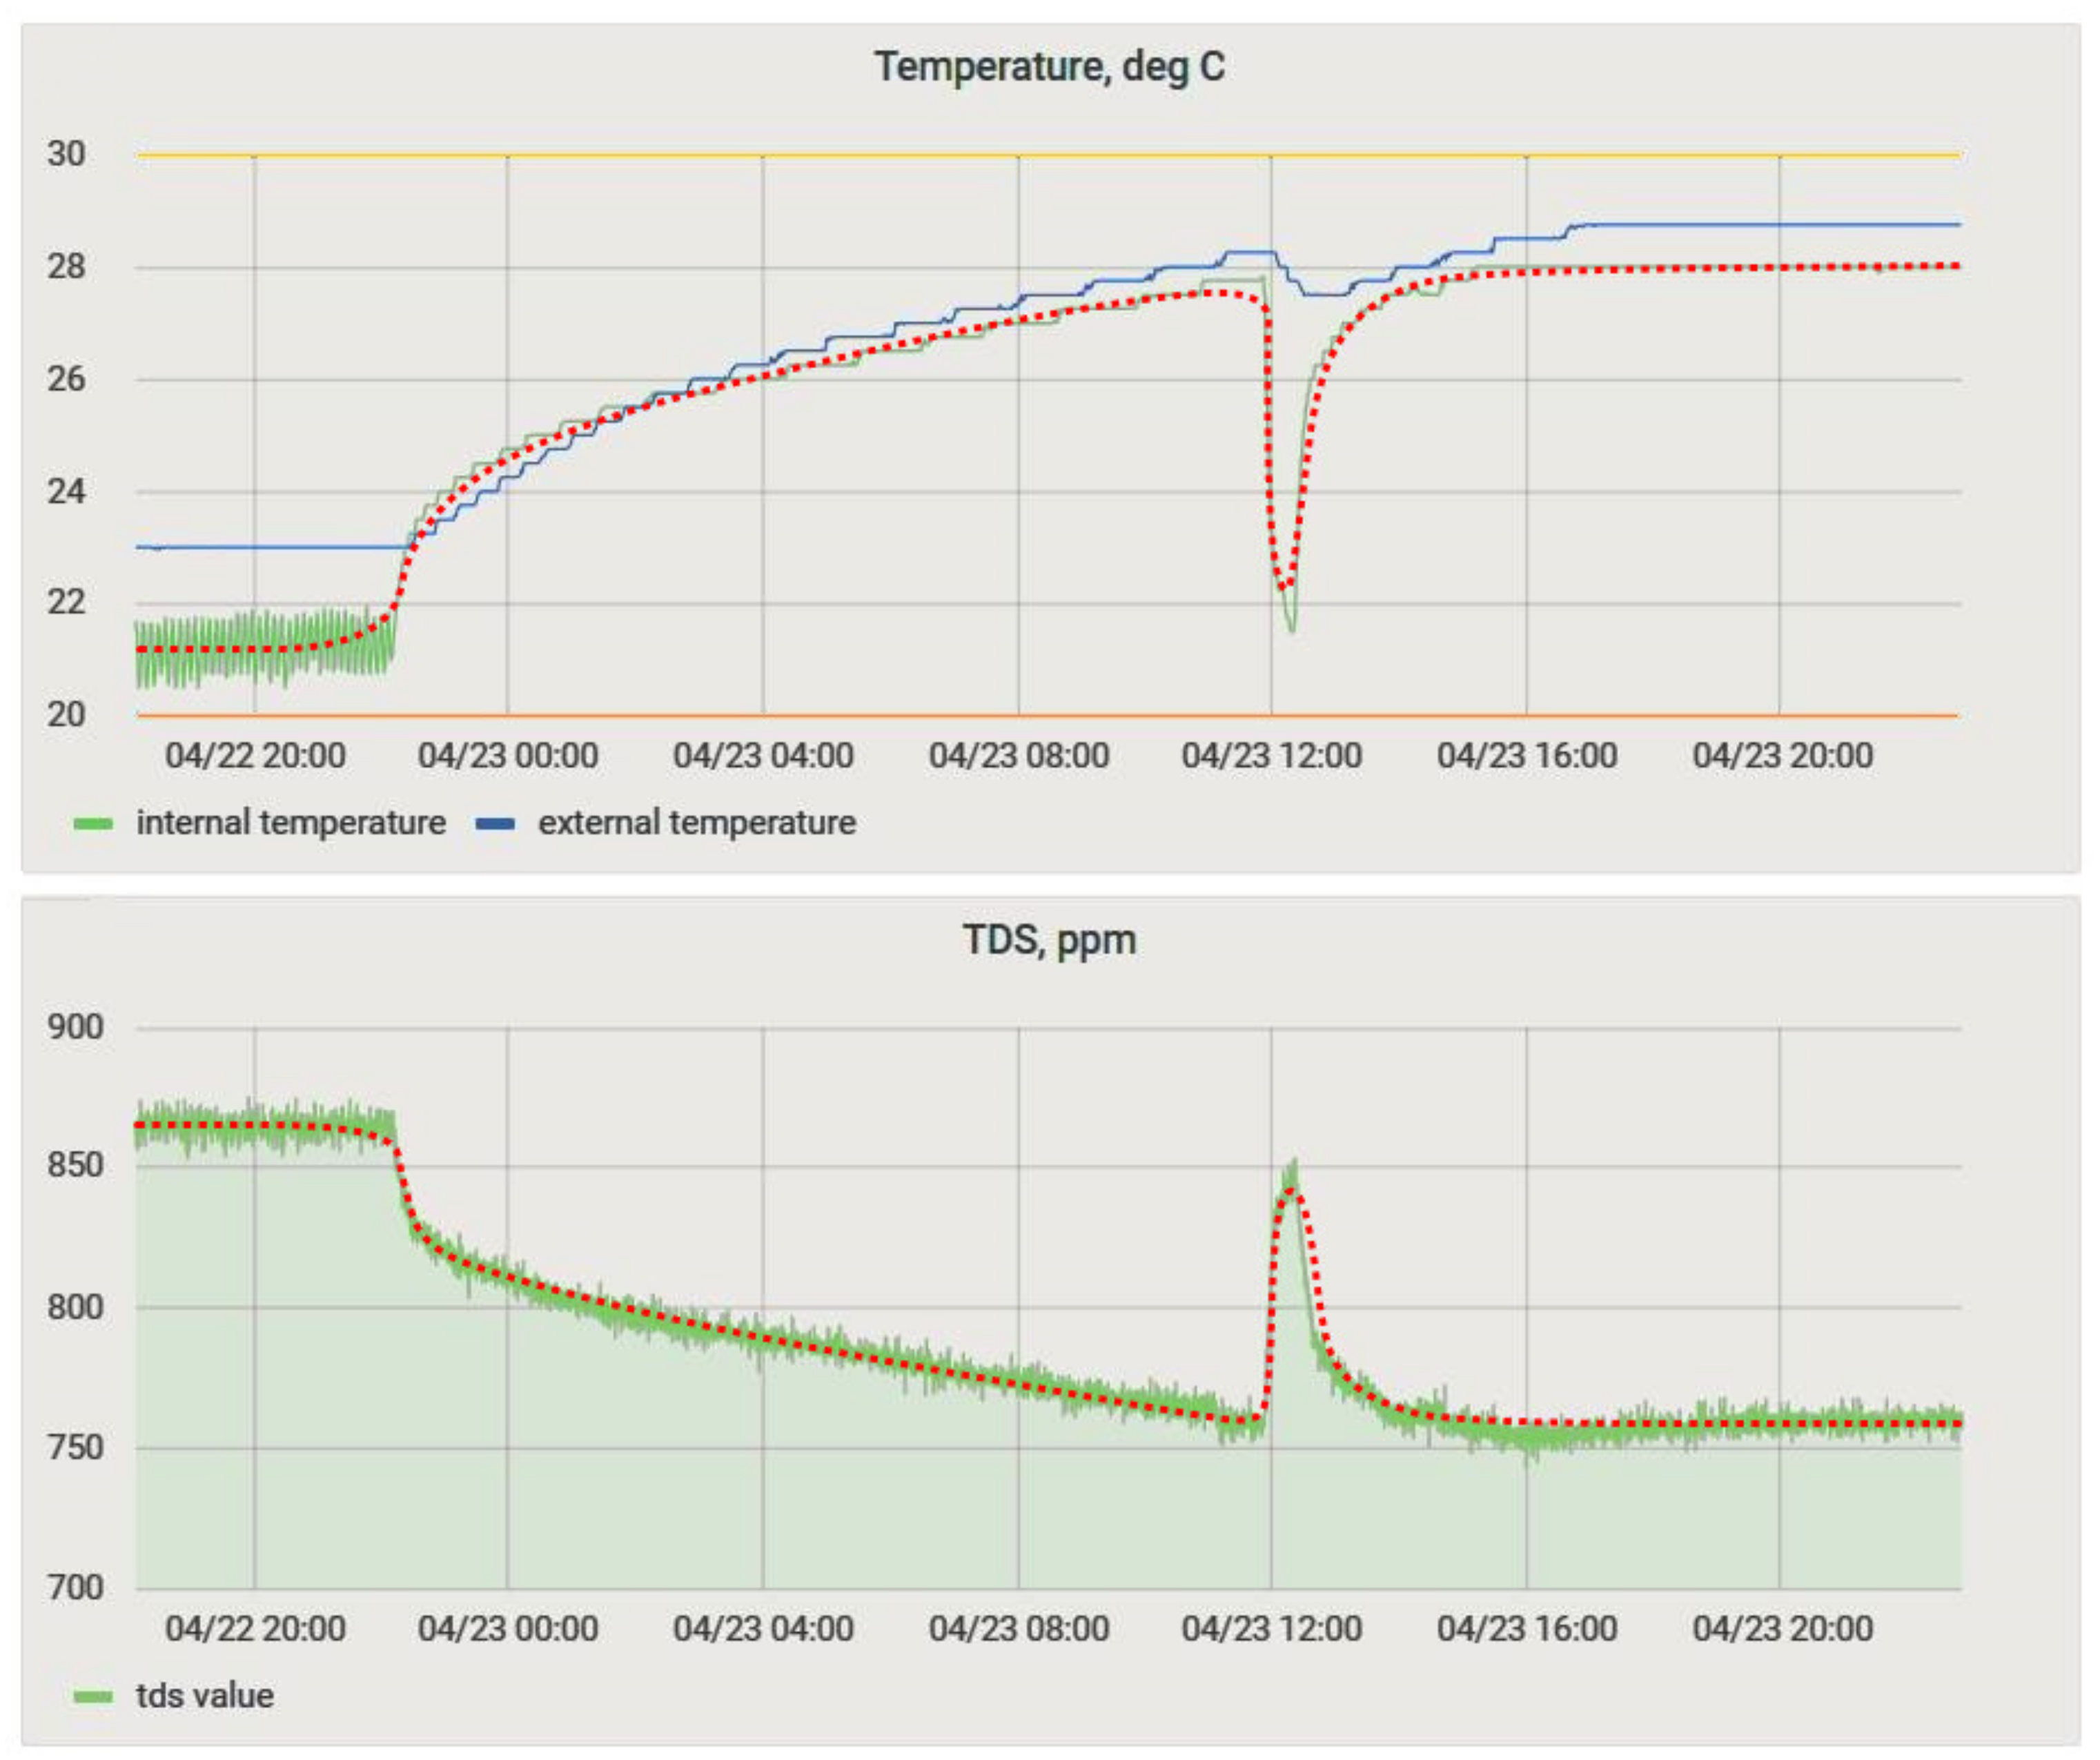
The particle concentration sensor had a clearly defined temperature dependence (
Figure 15;
Figure 16a), which must be compensated for when taking measurements. We increased the experiment duration to 24 h to obtain a more comprehensive data set (
Figure 16b). Equation (1) obtained by the method of least squares made it possible to refine the conversion function of the particulate matter concentration sensor on the lower-level controller, considering the obtained dependence. The coefficient of determination of Equation (1) dependence, R
2, was 0.91.
M—solid particles content, ppm;
T—temperature of the solution, °C.
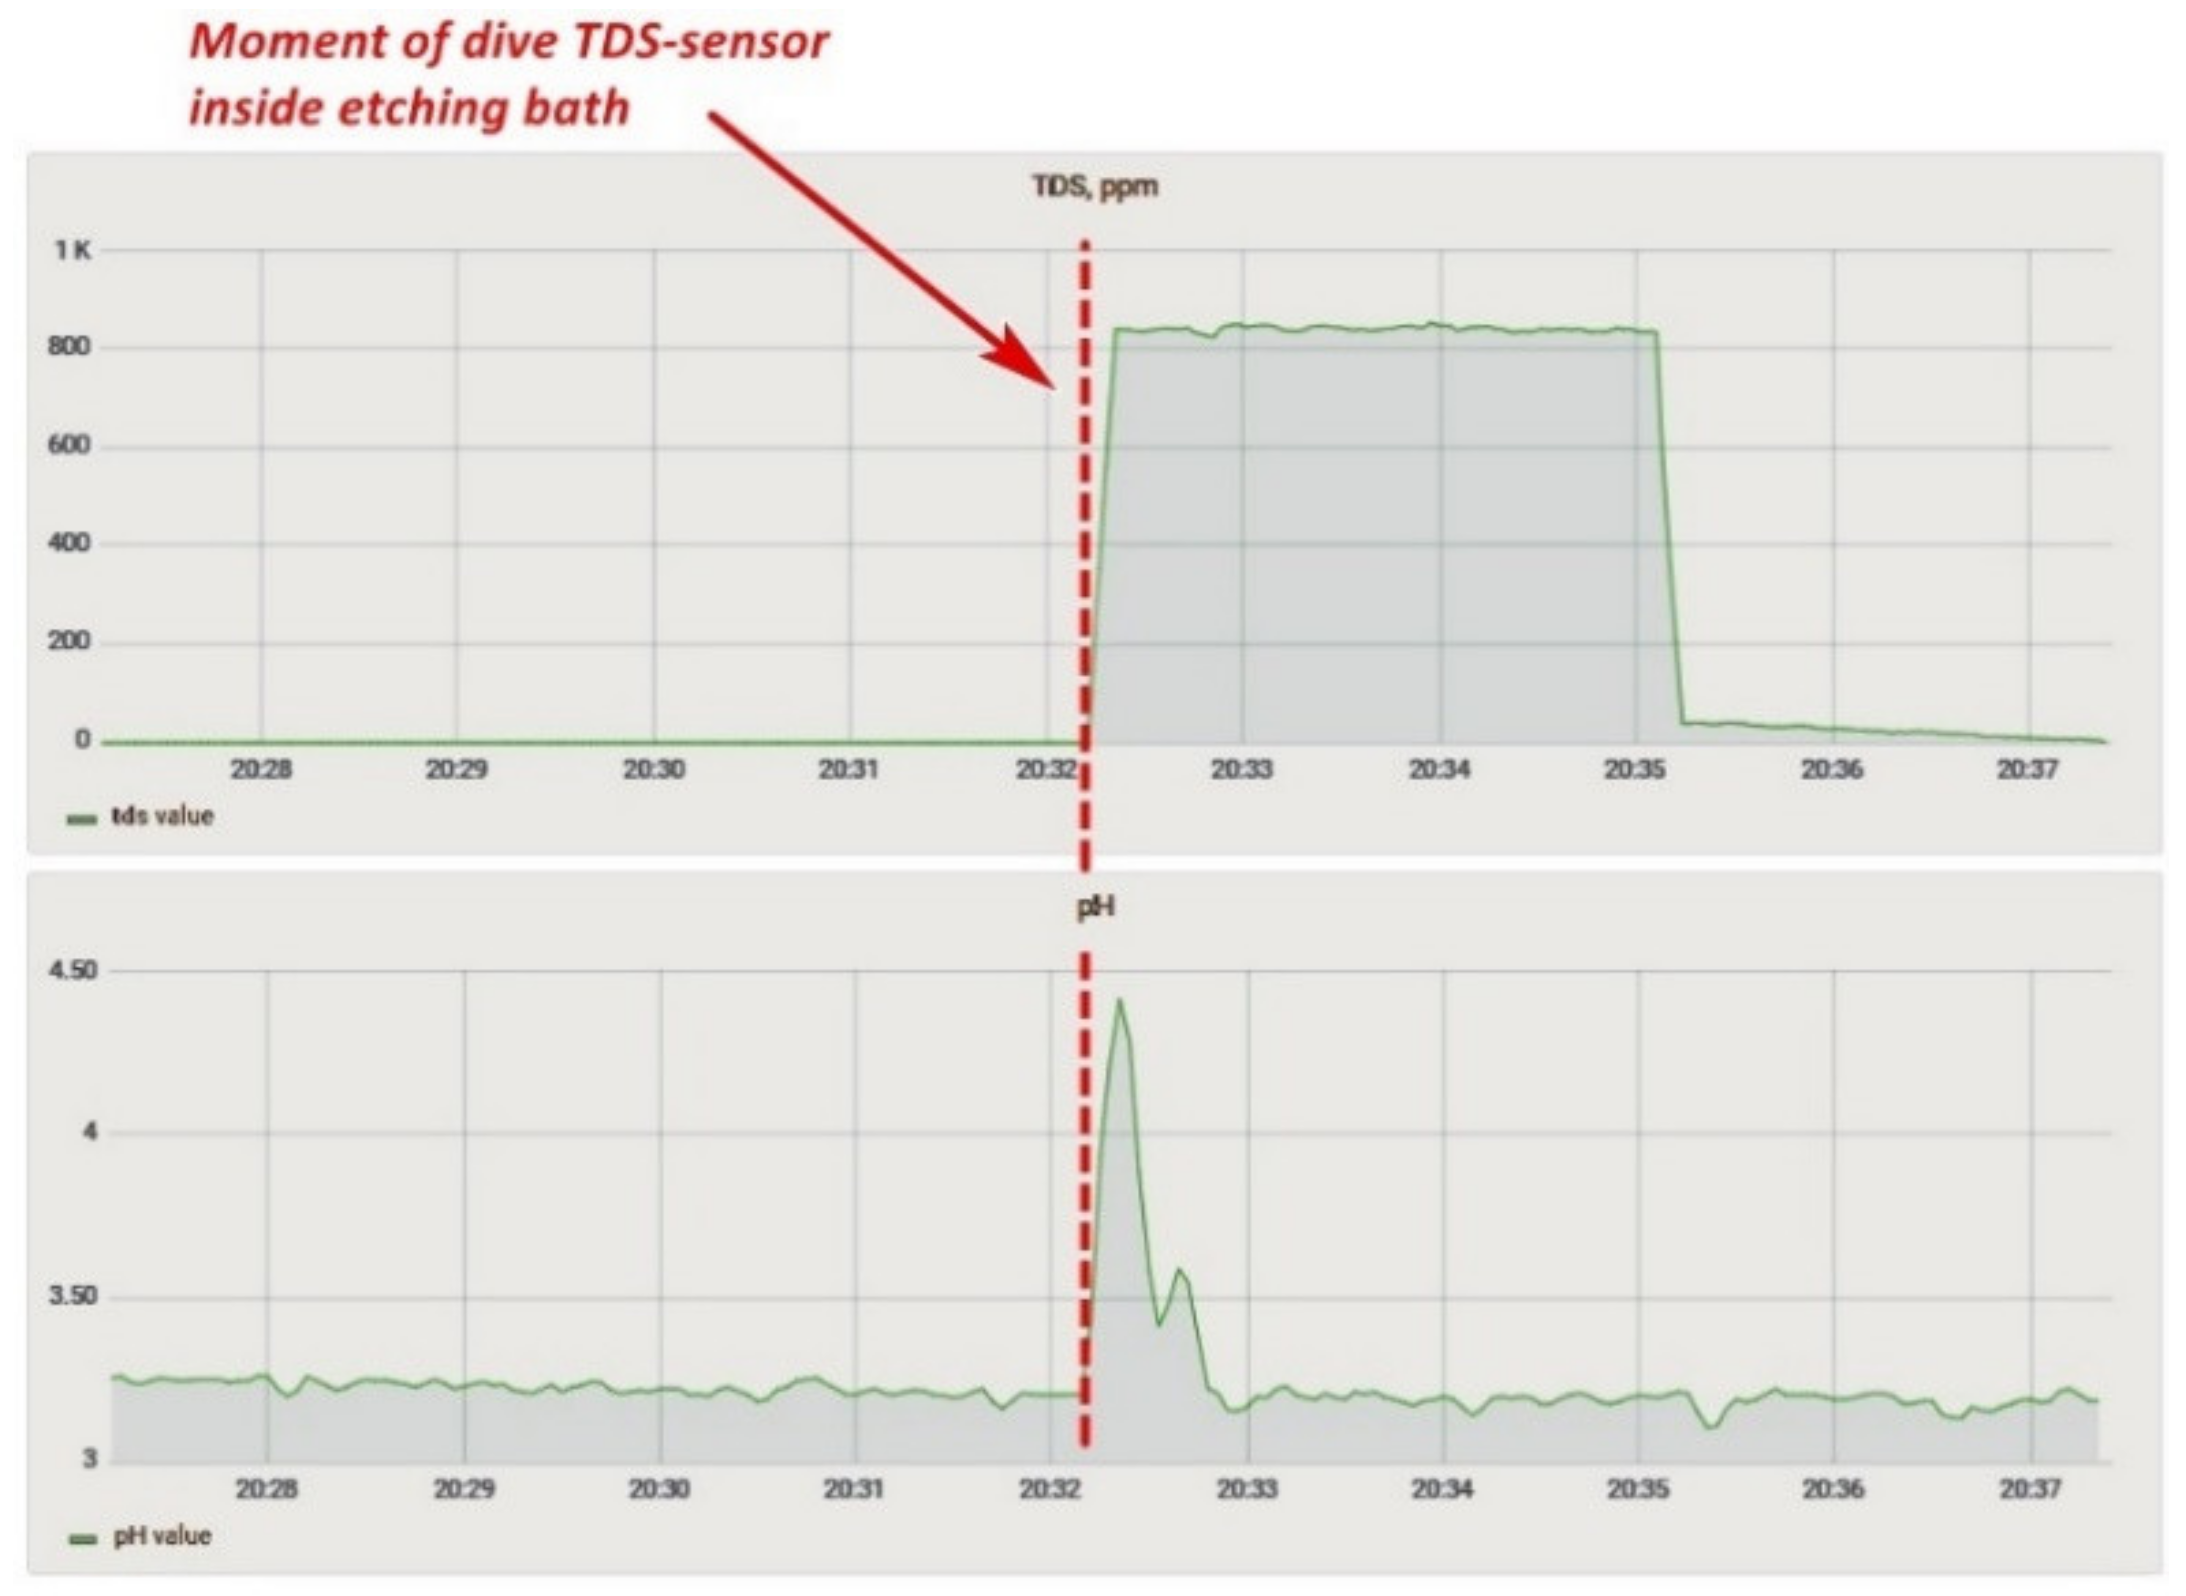
The solid particle concentration sensor affected the correctness of the reading from the acidity sensor. For example, when both sensors were placed in the pickling bath, the acidity sensor started to generate incorrect values (
Figure 17), showing that at the time of immersion of the TDS-sensor, the readings of the acidity sensor began to change. The acidity value of the solution was then checked with a calibrated pH meter, and the values of the sensor installed in the system coincided. Two more features should be noted: a similar problem was not identified on the laboratory bench, and both sensors worked on measuring the conductivity of a solution. Based on the above facts, it can be assumed that one of the sensors did not work correctly due to prolonged exposure to the acidic solution, or there was an additional connection between the sensors in the lower-level controller circuit. Therefore, based on the experiment carried out, we decided to temporarily abandon measurements with a TDS-meter and conducted a long-term experiment to determine the effect of the etching solution on the sensors.
4.2. Investigation of the Aging Process of the Solution
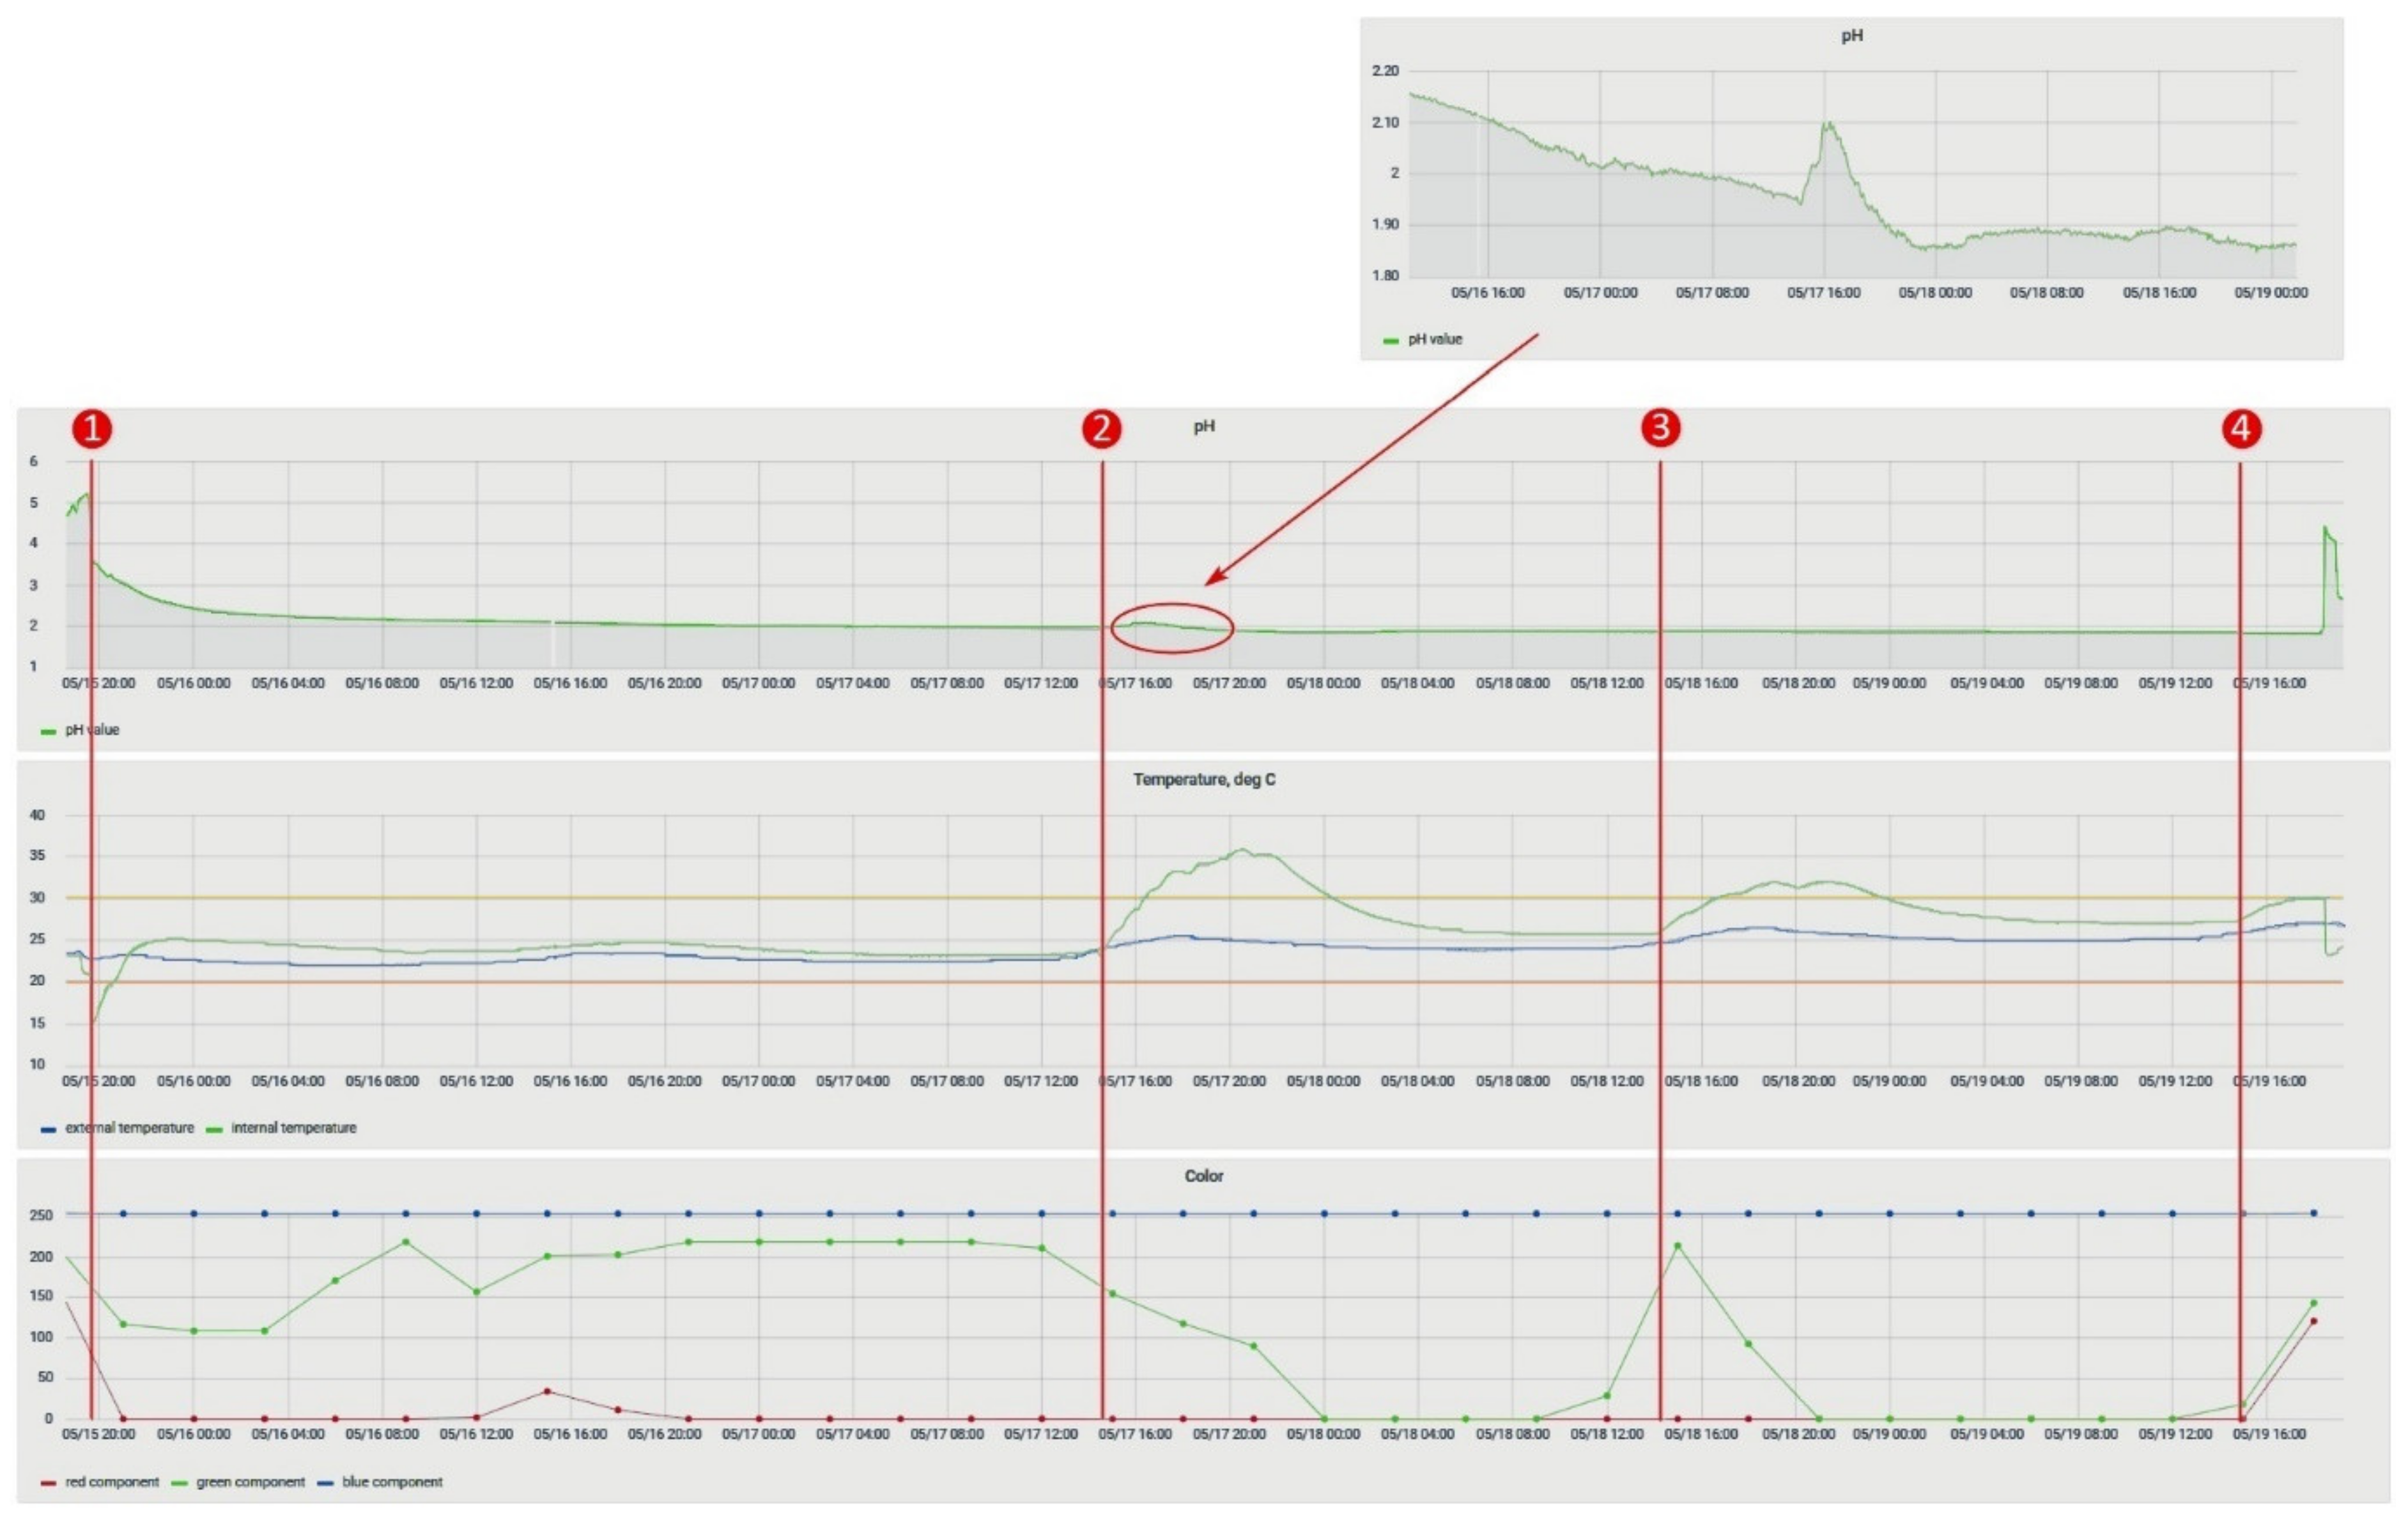
This experiment analyzed the change in the parameters of the solution in the process of its degradation. It was essential because the solution of ammonium persulfate is volatile, so it rapidly decomposes. The experiment consisted in placing temperature and acidity sensors in a freshly prepared solution and taking readings from them. The course of the pH change during the experiment is shown in
Figure 18.
On the 3rd day, the color of the solution changed to saturated green, which indicated a chemical reaction that took place because the solution of ammonium persulfate should remain colorless. The cause of the reaction was the DS18B20 temperature sensor sleeve, made of stainless steel, which dissolved during the experiment, but this did not affect the sensor’s performance.
During the experiment, a successive decrease in the pH value could be observed, and, possibly, by measuring the pH value of a solution, its state could be determined. Based on the data obtained, Equation (2) was plotted, which determines the dependence between the solution’s lifetime
t in minutes and its acidity.
In the Equation (2):
4.3. Study of the Content of the Copper Solution
The objectives of determination of the copper content of the solution were to study the change in the solution’s parameters during the etching process, to experimentally determinate the copper content of the solution, and to check the operability of the digital section in the solution.
Workpieces made of double-sided foil fiberglass, laminated, 80 × 80 mm, with a base thickness of 0.5 mm and a foil thickness of 35 μm, were immersed in a freshly prepared cycle until the etching of the billets stopped.
Of the 15 workpieces, 2 were etched on the 1st day, 8 on the 3rd, 4 on the 4th, and 1 on the 5th day. Based on the data obtained, the dependence of the etching time of the workpiece on its etching order was plotted (
Figure 19).
From this experiment, the following conclusions could be drawn:
Based on these experiments, we can concluded the following:
The working capacity of the developed digital site was confirmed;
Dependences were obtained between acidity and solution lifetime (2), and concentration of solid particles and temperature (1), and they will help to improve the quality of the etching process and optimize the operation of the site;
Prospects for improving the digital site were identified, and they include introducing a service for processing images from cameras and studying the possibility of combining an acidity sensor and a TDS-sensor.
5. Discussion
Of course, the developed site has many limitations, such as using the submersible etching method without stirring the solution, which provides the worst conditions for the process and a low etching factor. However, the main task of this work was to build a foundation for future studies of the parameters of chemical processes, not limiting us only to studying the etching process.
The proposed hardware and software structures make it possible to use a wide range of possibilities for studying chemical processes; the Docker containers in development make rapid deployment of information systems possible.
The developed digital production site is a starting point for research and development of new methods of management and control of chemical processes and the digitalization of enterprises in this industry. Based on the previously obtained results, developing an algorithm for creating a digital production using a digital section as a base unit is possible.
6. Conclusions
The general analysis of approaches to the organization of digital processes of electrochemical deposition of metals on dielectric surfaces makes it possible to assert the possibility and necessity of their technical implementation, including at existing production facilities.
The possibilities of digital production control are shown and confirmed by the example of complex, in terms of constructing, deterministic models of chemical processes for the production of printed circuit boards.
General structures for the organization of digital production sites have been developed. Their effectiveness was confirmed using the example of an etching section for printed circuit boards, and primary relationships between the process parameters were obtained, which made it possible to obtain an assessment of the quality of the solution and the process as a whole in real time.
Author Contributions
Conceptualization, methodology, validation, A.M.M. and F.V.V.; software, M.A.K.; formal analysis, A.M.M.; investigation, F.V.V.; data curation, F.A.B. and M.A.K.; writing—original draft preparation, A.M.M. and M.A.K.; writing—review and editing, F.V.V.; visualization, M.A.K.; supervision, project administration, F.V.V.; funding acquisition, A.M.M. and F.V.V. All authors have read and agreed to the published version of the manuscript.
Funding
The work was performed within the framework of the state assignment of the Ministry of Education and Science (Russia), topic № FSFF-2020-0015.
Institutional Review Board Statement
Not applicable.
Informed Consent Statement
Not applicable.
Data Availability Statement
Not applicable.
Conflicts of Interest
The authors declare no conflict of interest.
References
- Vasilyev, F.; Isaev, V.; Korobkov, M. The influence of the PCB design and the process of their manufacturing on the possibility of a defect-free production. Prz. Elektrotechniczny 2021, 97, 91–96. [Google Scholar]
- Okoh, C.; Roy, R.; Mehnen, J. Predictive Maintenance Modelling for Through-Life Engineering Services. Procedia CIRP 2017, 59, 196–201. [Google Scholar] [CrossRef]
- Wan, C.C. A review of the technology development of direct metallization. Proc. Nat. Sci. Counc. 1999, 23, 365–368. [Google Scholar]
- Khairnasov, K. Modeling and determination of frequency characteristics of robotic structures made of composite materials. Text. Ind. Technol. 2019, 5, 65–69. [Google Scholar]
- Khayrnasov, K. Methodology for modeling and determining the frequency response trace of robotic composite structures. Prz. Elektrotechniczny 2020, 96, 39–42. [Google Scholar] [CrossRef]
- Fredenberg, M. Electroplating Simulations for Printed Circuit Board Designers, COMSOL Blog, December 17, 2014. Available online: https://www.comsol.com/blogs/electroplating-simulations-for-printed-circuit-board-designers (accessed on 10 March 2021).
- Gabrielli, C.; Moçotéguy, P.; Perrot, H.; Nieto-Sanz, D.; Zdunek, A. An investigation of copper interconnect deposition bath ageing by electrochemical impedance spectroscopy. J. Appl. Electrochem. 2008, 38, 457–468. [Google Scholar] [CrossRef]
- Granados, G.E.; Lacroix, L.; Medjaher, K. Condition monitoring and prediction of solution quality during a copper electroplating process. J. Int. Manuf. 2020, 31, 285–300. [Google Scholar] [CrossRef] [Green Version]
- Il’in, V. PCB Manufacturing Technology; Mechanical Engineering: Leningrad, Russian, 1984. [Google Scholar]
- Smertina, T. High-precision etching. From theory to practice. Technol. Electrochem. Ind. 2008, 3, 12–19. [Google Scholar]
- Francis, T. A Comparison of Cloud Execution Mechanisms Fog, Edge, and Clone Cloud Computing. IJECE 2018, 8, 4646–4653. [Google Scholar] [CrossRef] [Green Version]
Figure 1.
Results of modeling copper electrodeposition process in microjunction of PCB. There is a change in the model’s geometry and in the picture of the field strength. The picture of the current density is shown in color. The variation of the simulation grid is shown below in the pictures of the current distribution. Figure show the changing of modeling geometry during process, (a) beginning, (b) 4.5 s after beginning, (c) 9 s after beginning.
Figure 2.
Distribution pattern of electric force fields in a galvanic bath with an aperture of various configurations. The colors of the lines are showing the level of field strength. The shape of the lines is illustrating the distribution of field in a galvanic bath.
Figure 2.
Distribution pattern of electric force fields in a galvanic bath with an aperture of various configurations. The colors of the lines are showing the level of field strength. The shape of the lines is illustrating the distribution of field in a galvanic bath.
Figure 3.
Example of an application that implements the visualization of the predicted thickness of the copper coating of the designed PCB.
Figure 3.
Example of an application that implements the visualization of the predicted thickness of the copper coating of the designed PCB.
Figure 4.
Comparison of the monitored parameter and the investigated parameter [
8], (
a) change of potential between the electrodes (monitored parameter) in time, (
b) change of copper concentration in the solution (aging factor) in time.
Figure 4.
Comparison of the monitored parameter and the investigated parameter [
8], (
a) change of potential between the electrodes (monitored parameter) in time, (
b) change of copper concentration in the solution (aging factor) in time.
Figure 5.
Estimation of the remaining mortar life using a controlled parameter.
Figure 5.
Estimation of the remaining mortar life using a controlled parameter.
Figure 6.
Comparison of experimental data with the model (R2 is the coefficient of determination): (a) raw data; (b) data after processing; (c) primary exponential approximation; (d) double exponential approximation.
Figure 6.
Comparison of experimental data with the model (R2 is the coefficient of determination): (a) raw data; (b) data after processing; (c) primary exponential approximation; (d) double exponential approximation.
Figure 7.
Process parameters that affect the etching time.
Figure 7.
Process parameters that affect the etching time.
Figure 8.
The architecture of the digital production site.
Figure 8.
The architecture of the digital production site.
Figure 9.
Block diagram of the digital production site.
Figure 9.
Block diagram of the digital production site.
Figure 10.
Photo of the developed system.
Figure 10.
Photo of the developed system.
Figure 11.
Module location in the developed system.
Figure 11.
Module location in the developed system.
Figure 12.
The software structure of the digital production site.
Figure 12.
The software structure of the digital production site.
Figure 13.
The user interface of the digital production site in Node-Red UI. (a) Window for displaying data from the digital site; (b) window with settings of the digital site.
Figure 13.
The user interface of the digital production site in Node-Red UI. (a) Window for displaying data from the digital site; (b) window with settings of the digital site.
Figure 14.
Grafana etching process monitoring window.
Figure 14.
Grafana etching process monitoring window.
Figure 15.
Sensor readings in the monitoring system.
Figure 15.
Sensor readings in the monitoring system.
Figure 16.
Temperature dependence of the readings of the solids content sensor. The blue dots indicate the experimental data; the orange line is the linearized dependence. The duration of the experiment in (a) was 30 min and in (b), it was 24 h.
Figure 16.
Temperature dependence of the readings of the solids content sensor. The blue dots indicate the experimental data; the orange line is the linearized dependence. The duration of the experiment in (a) was 30 min and in (b), it was 24 h.
Figure 17.
Influence of the TDS-sensor in the bath on the pH values.
Figure 17.
Influence of the TDS-sensor in the bath on the pH values.
Figure 18.
pH change during the experiment to determine the aging of the solution. The red line is an exponential trend line that can describe the process.
Figure 18.
pH change during the experiment to determine the aging of the solution. The red line is an exponential trend line that can describe the process.
Figure 19.
Dependence of the etching time of the workpiece on its etching order.
Figure 19.
Dependence of the etching time of the workpiece on its etching order.
Figure 20.
The experiment to determine content of copper; numbers 1–4 indicate the moments when etching began.
Figure 20.
The experiment to determine content of copper; numbers 1–4 indicate the moments when etching began.
Figure 21.
Comparison of the experimental data obtained from the acidity sensor (blue curve) with the mathematical dependence (2) (orange curve).
Figure 21.
Comparison of the experimental data obtained from the acidity sensor (blue curve) with the mathematical dependence (2) (orange curve).
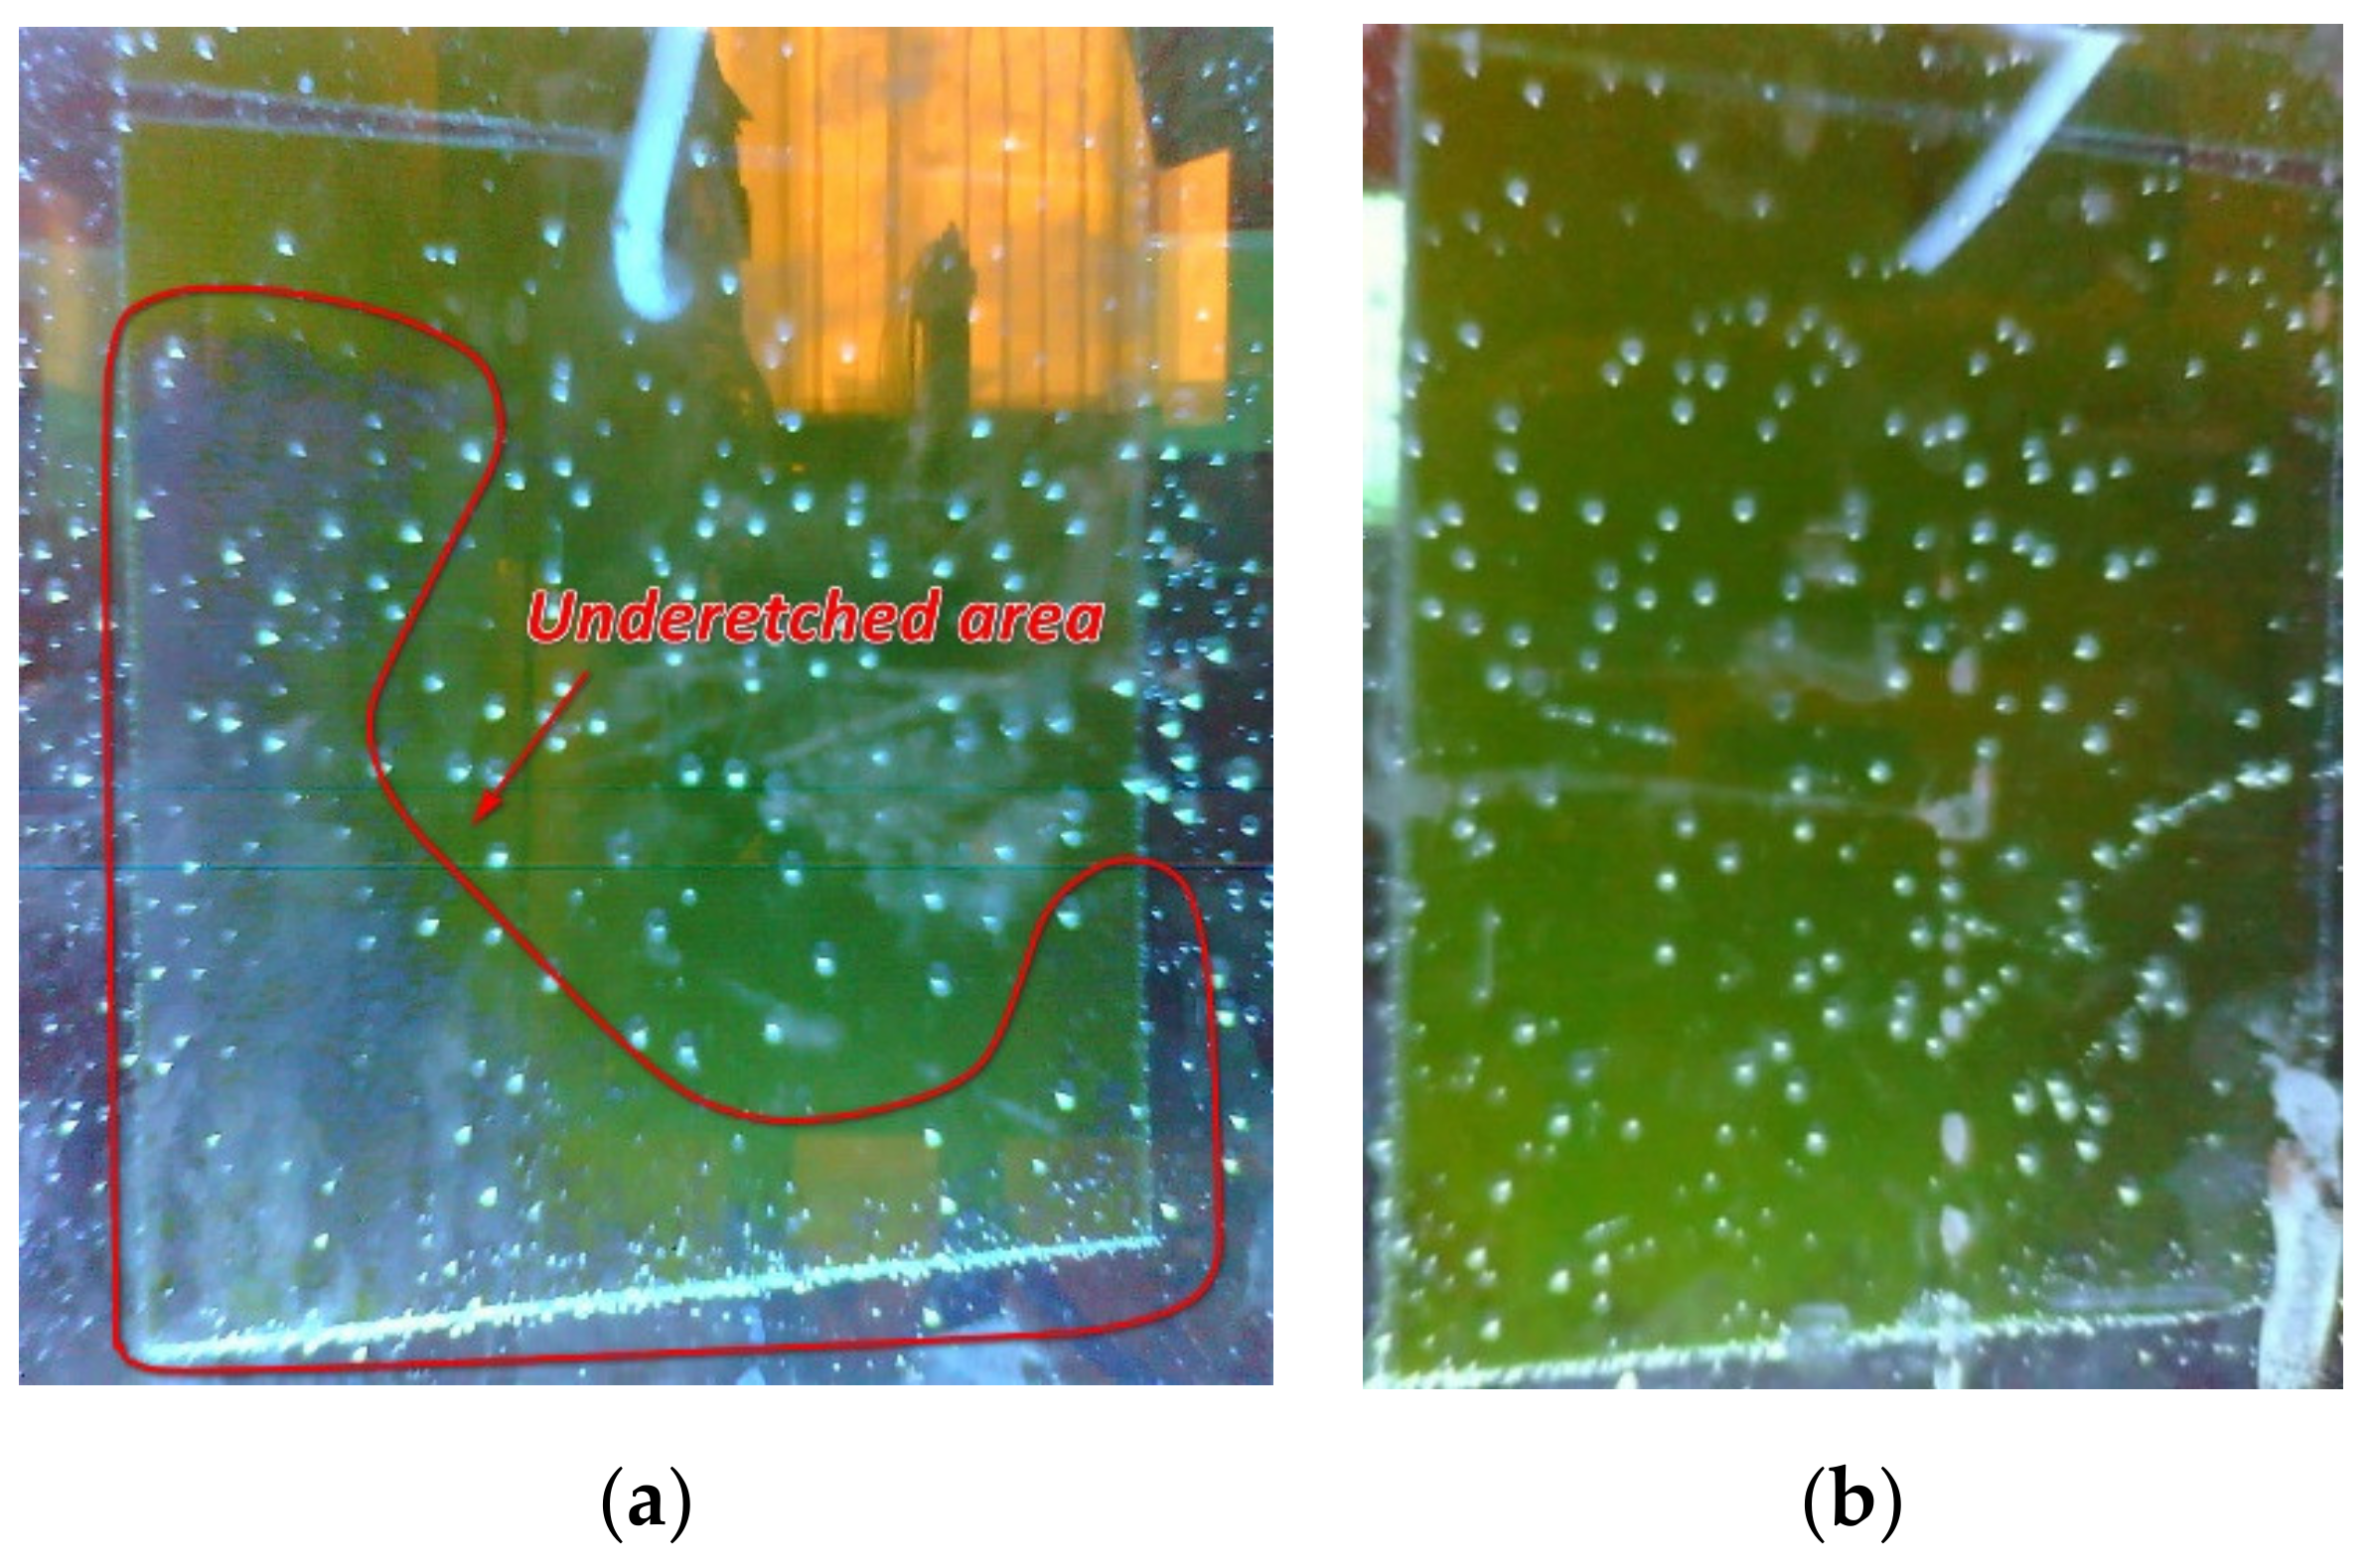
Figure 22.
Result of etching of the last workpiece, (a) top side of the workpiece, (b) bottom side of the workpiece.
Figure 22.
Result of etching of the last workpiece, (a) top side of the workpiece, (b) bottom side of the workpiece.
| Publisher’s Note: MDPI stays neutral with regard to jurisdictional claims in published maps and institutional affiliations. |
© 2021 by the authors. Licensee MDPI, Basel, Switzerland. This article is an open access article distributed under the terms and conditions of the Creative Commons Attribution (CC BY) license (https://creativecommons.org/licenses/by/4.0/).


