
Development of a Novel Sensor Based on Polypyrrole Doped with Potassium Hexacyanoferrate (II) for Detection of L-Tryptophan in Pharmaceutics


Abstract
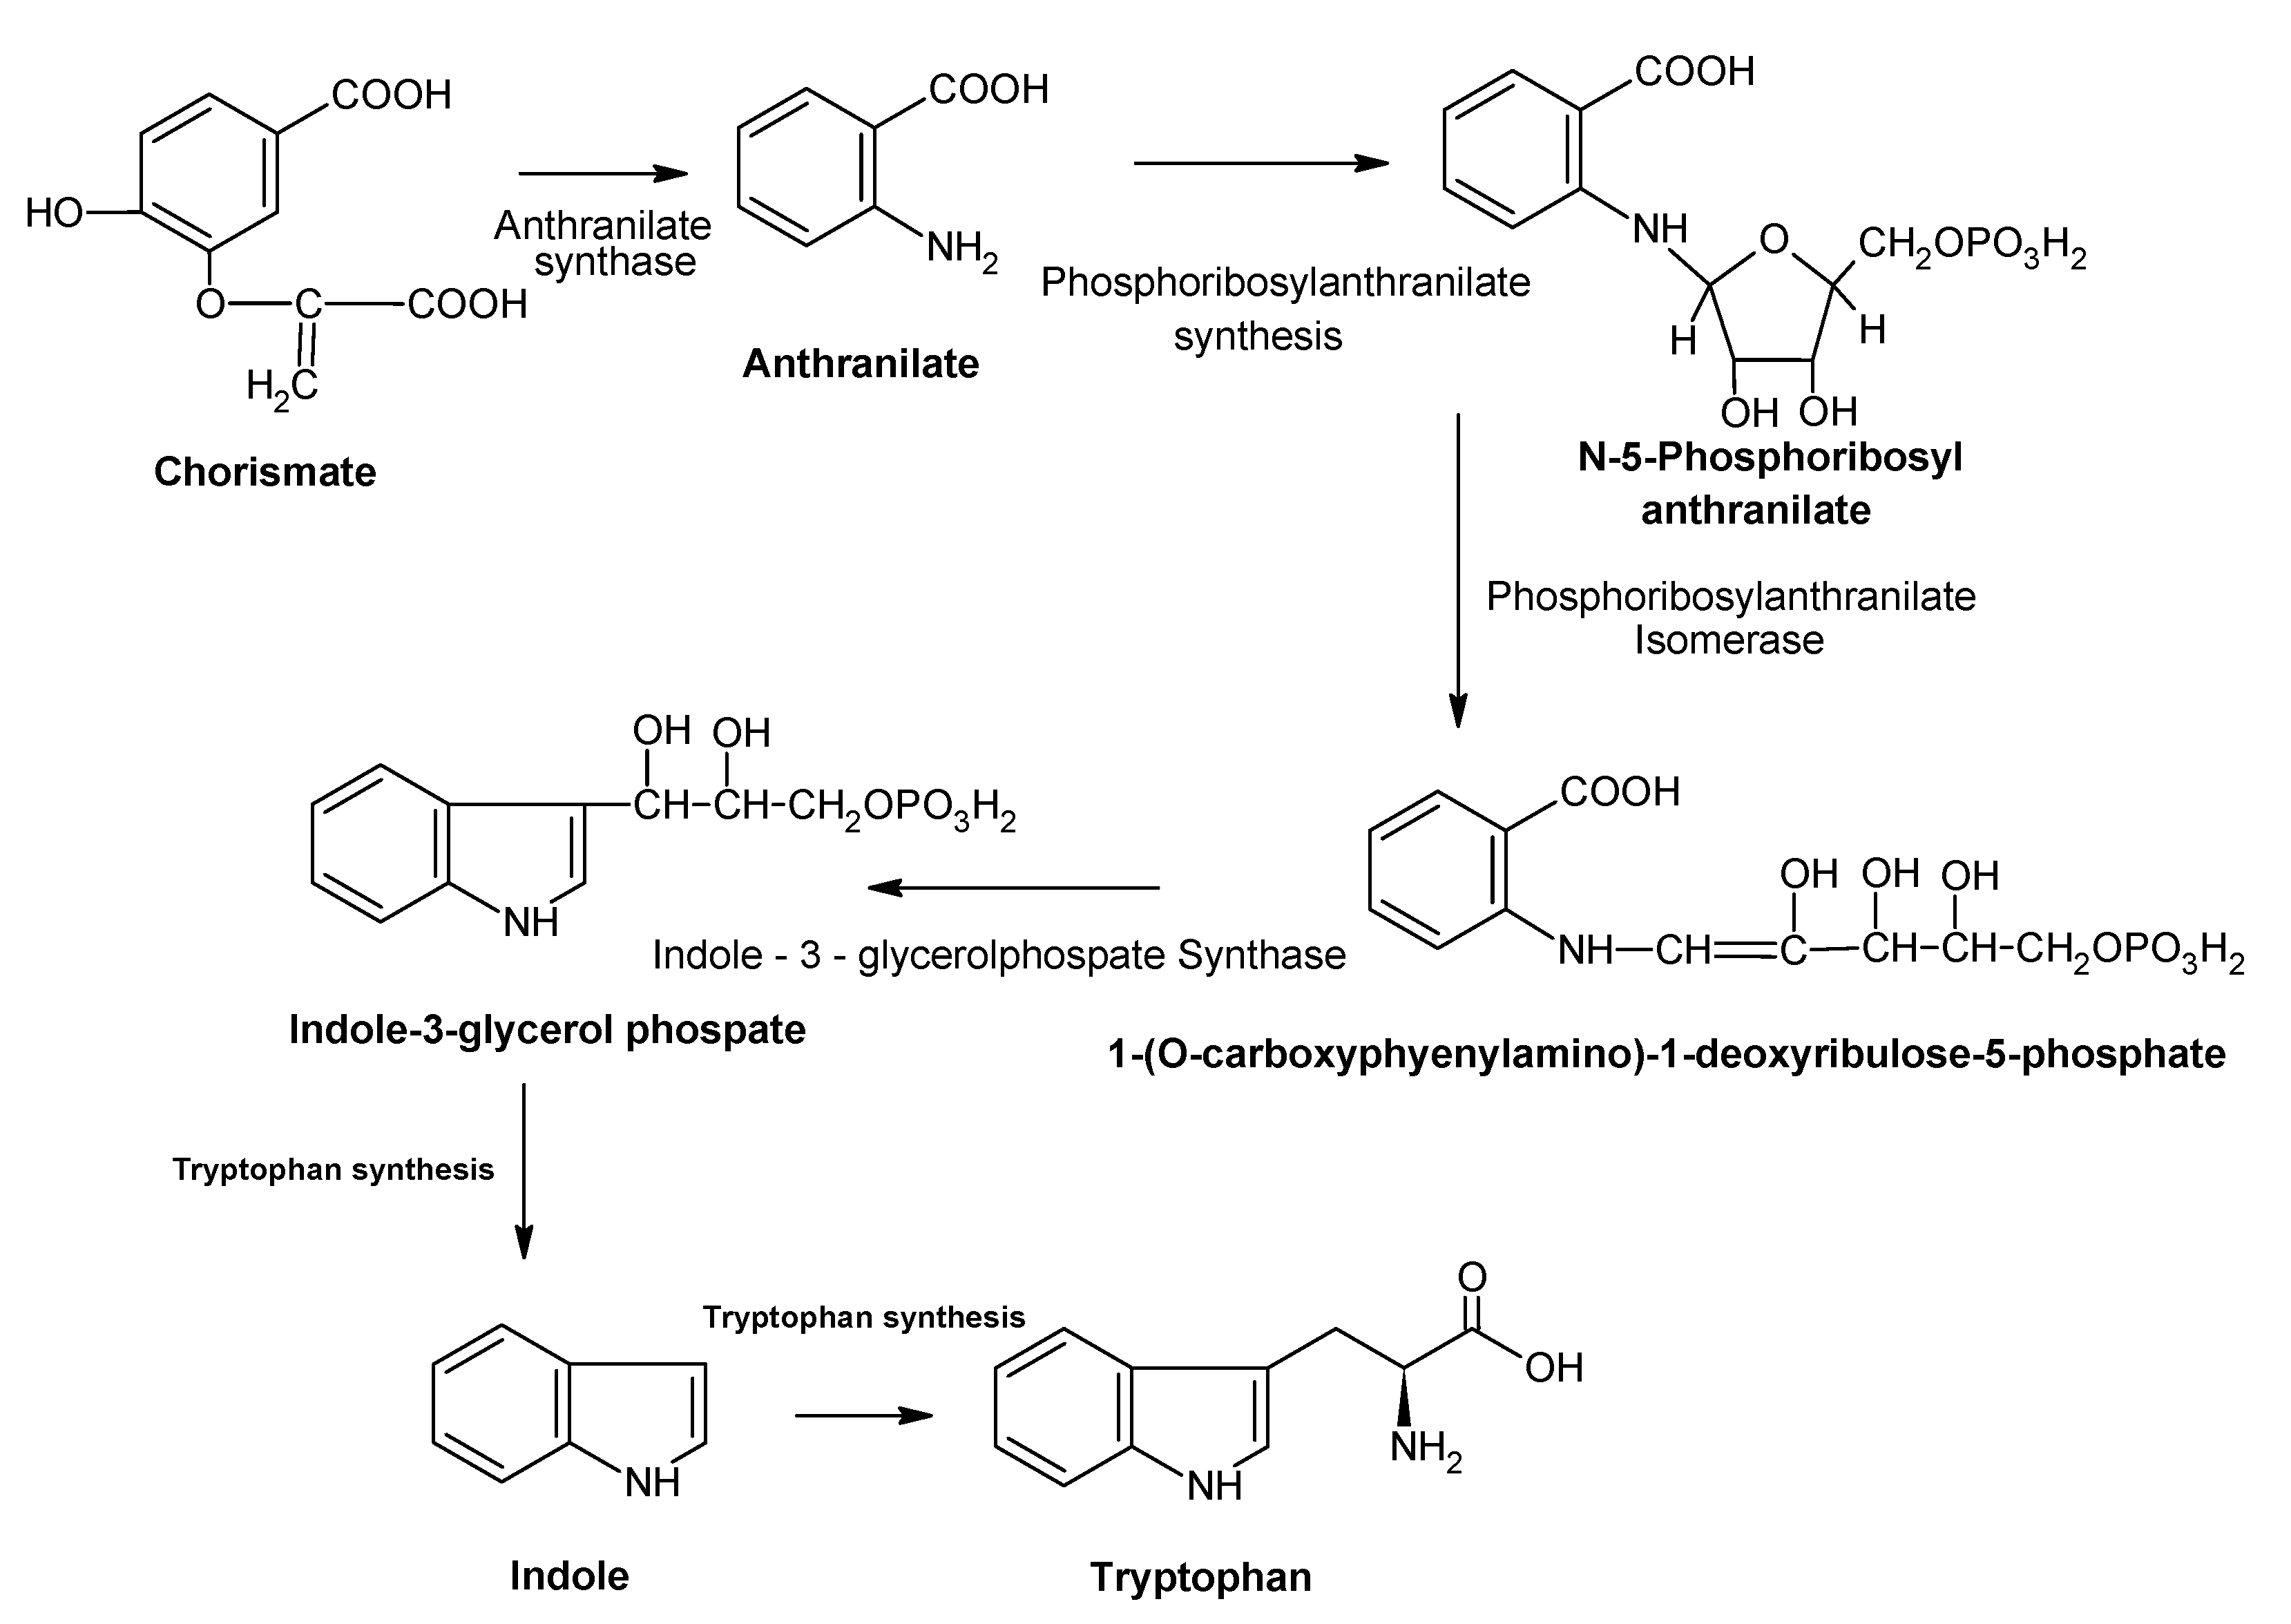
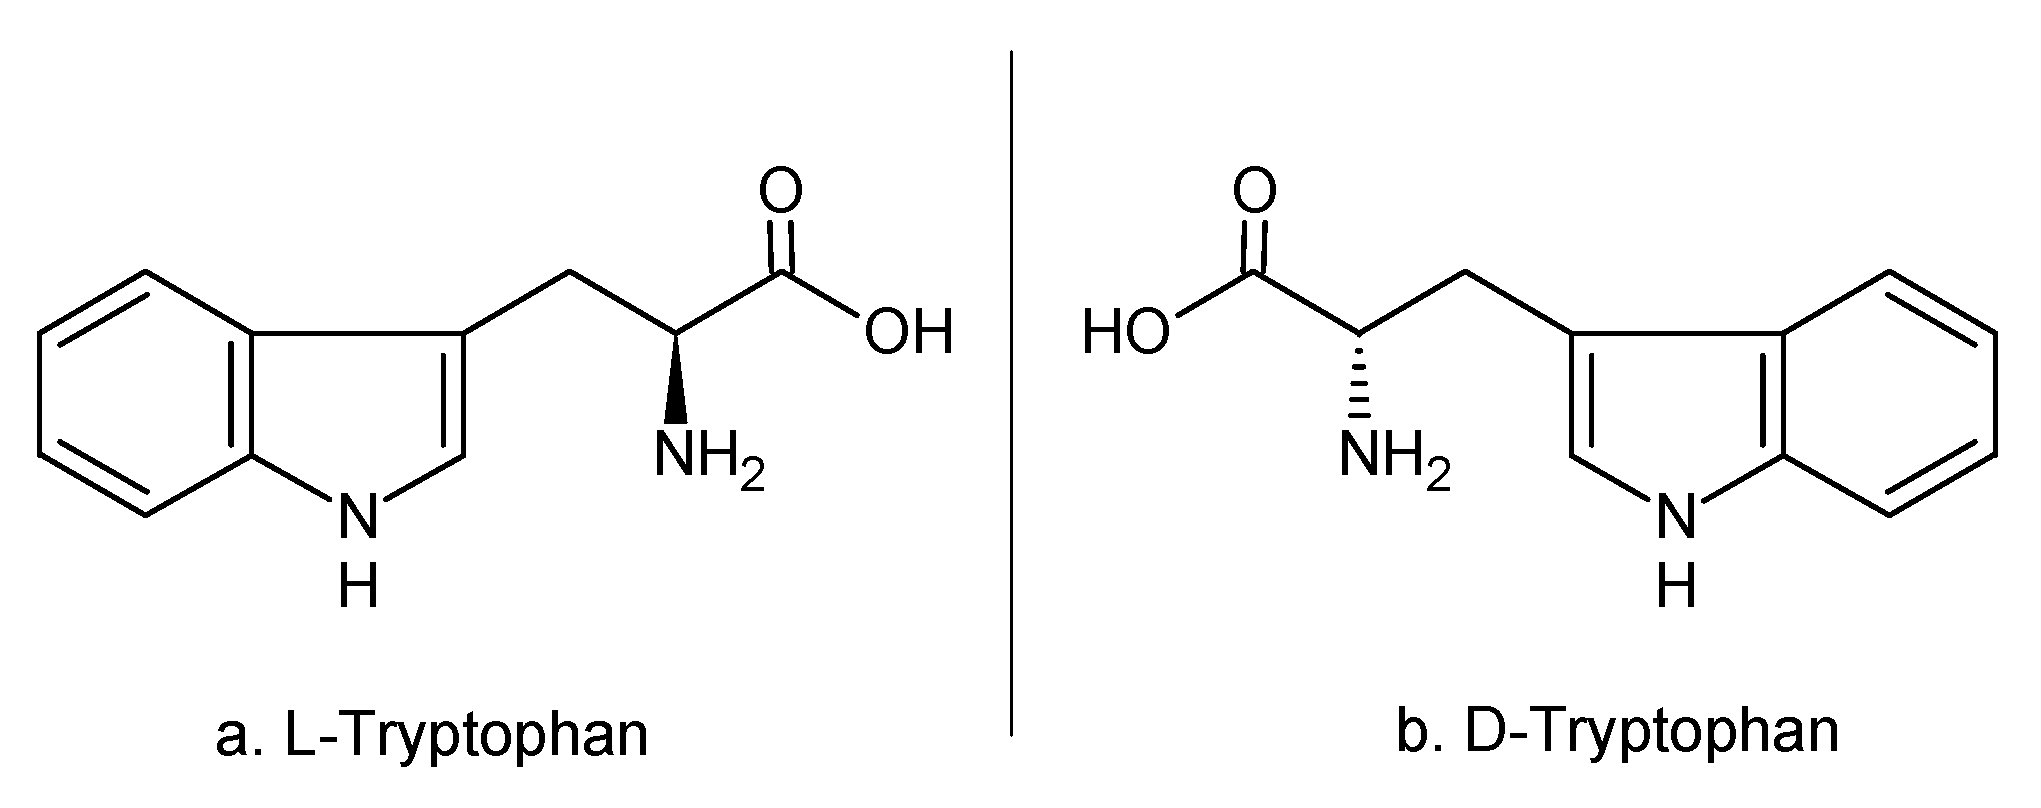
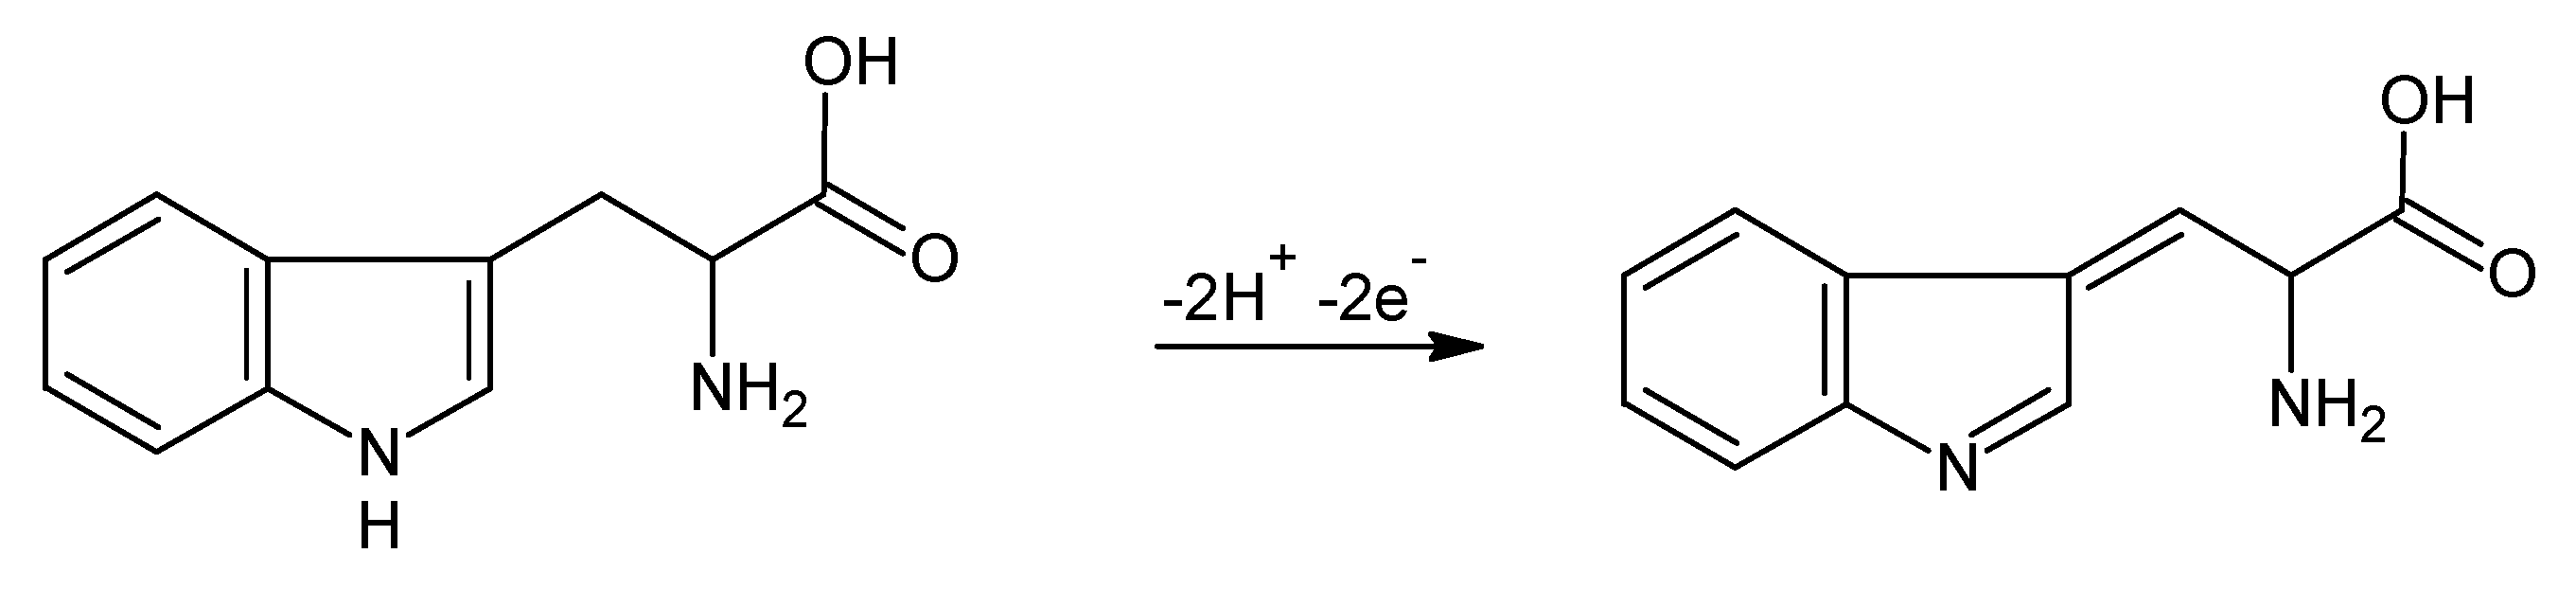
:1. Introduction
2. Materials and Methods
2.1. Reagents and Solutions
2.2. Instrumentation
2.3. Preparation of PPy/FeCN/SPCE
2.4. Samples Tested
3. Results and Discussions
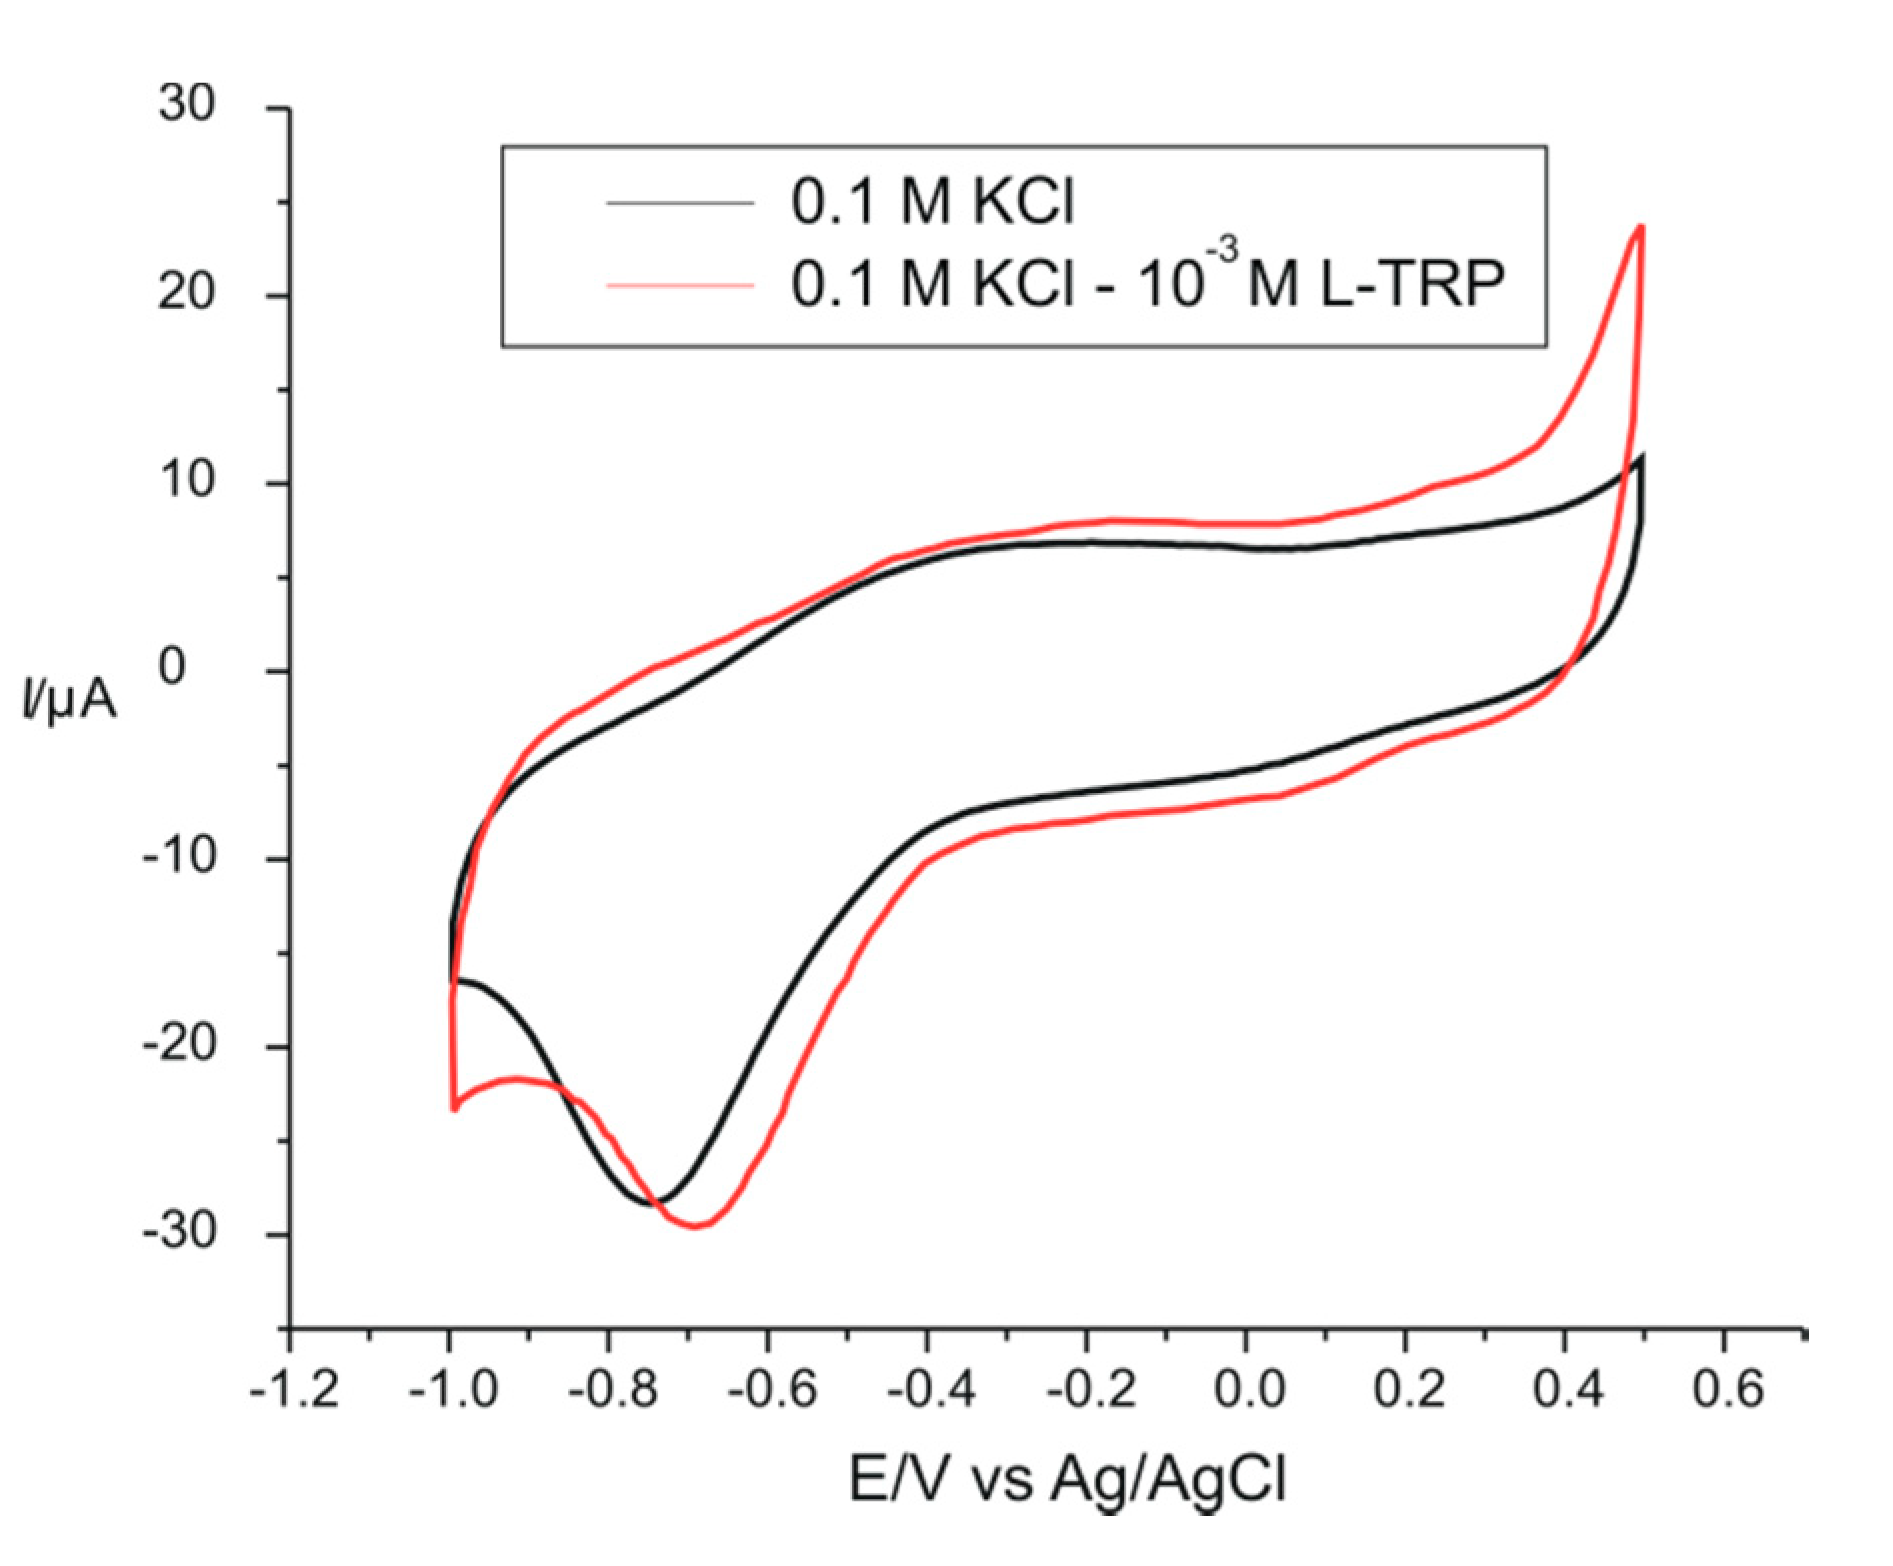
3.1. The Electrochemical Behavior of the Unmodified DRP-110 Electrode in 0.1 M KCl–10−3 M L-TRP Solution
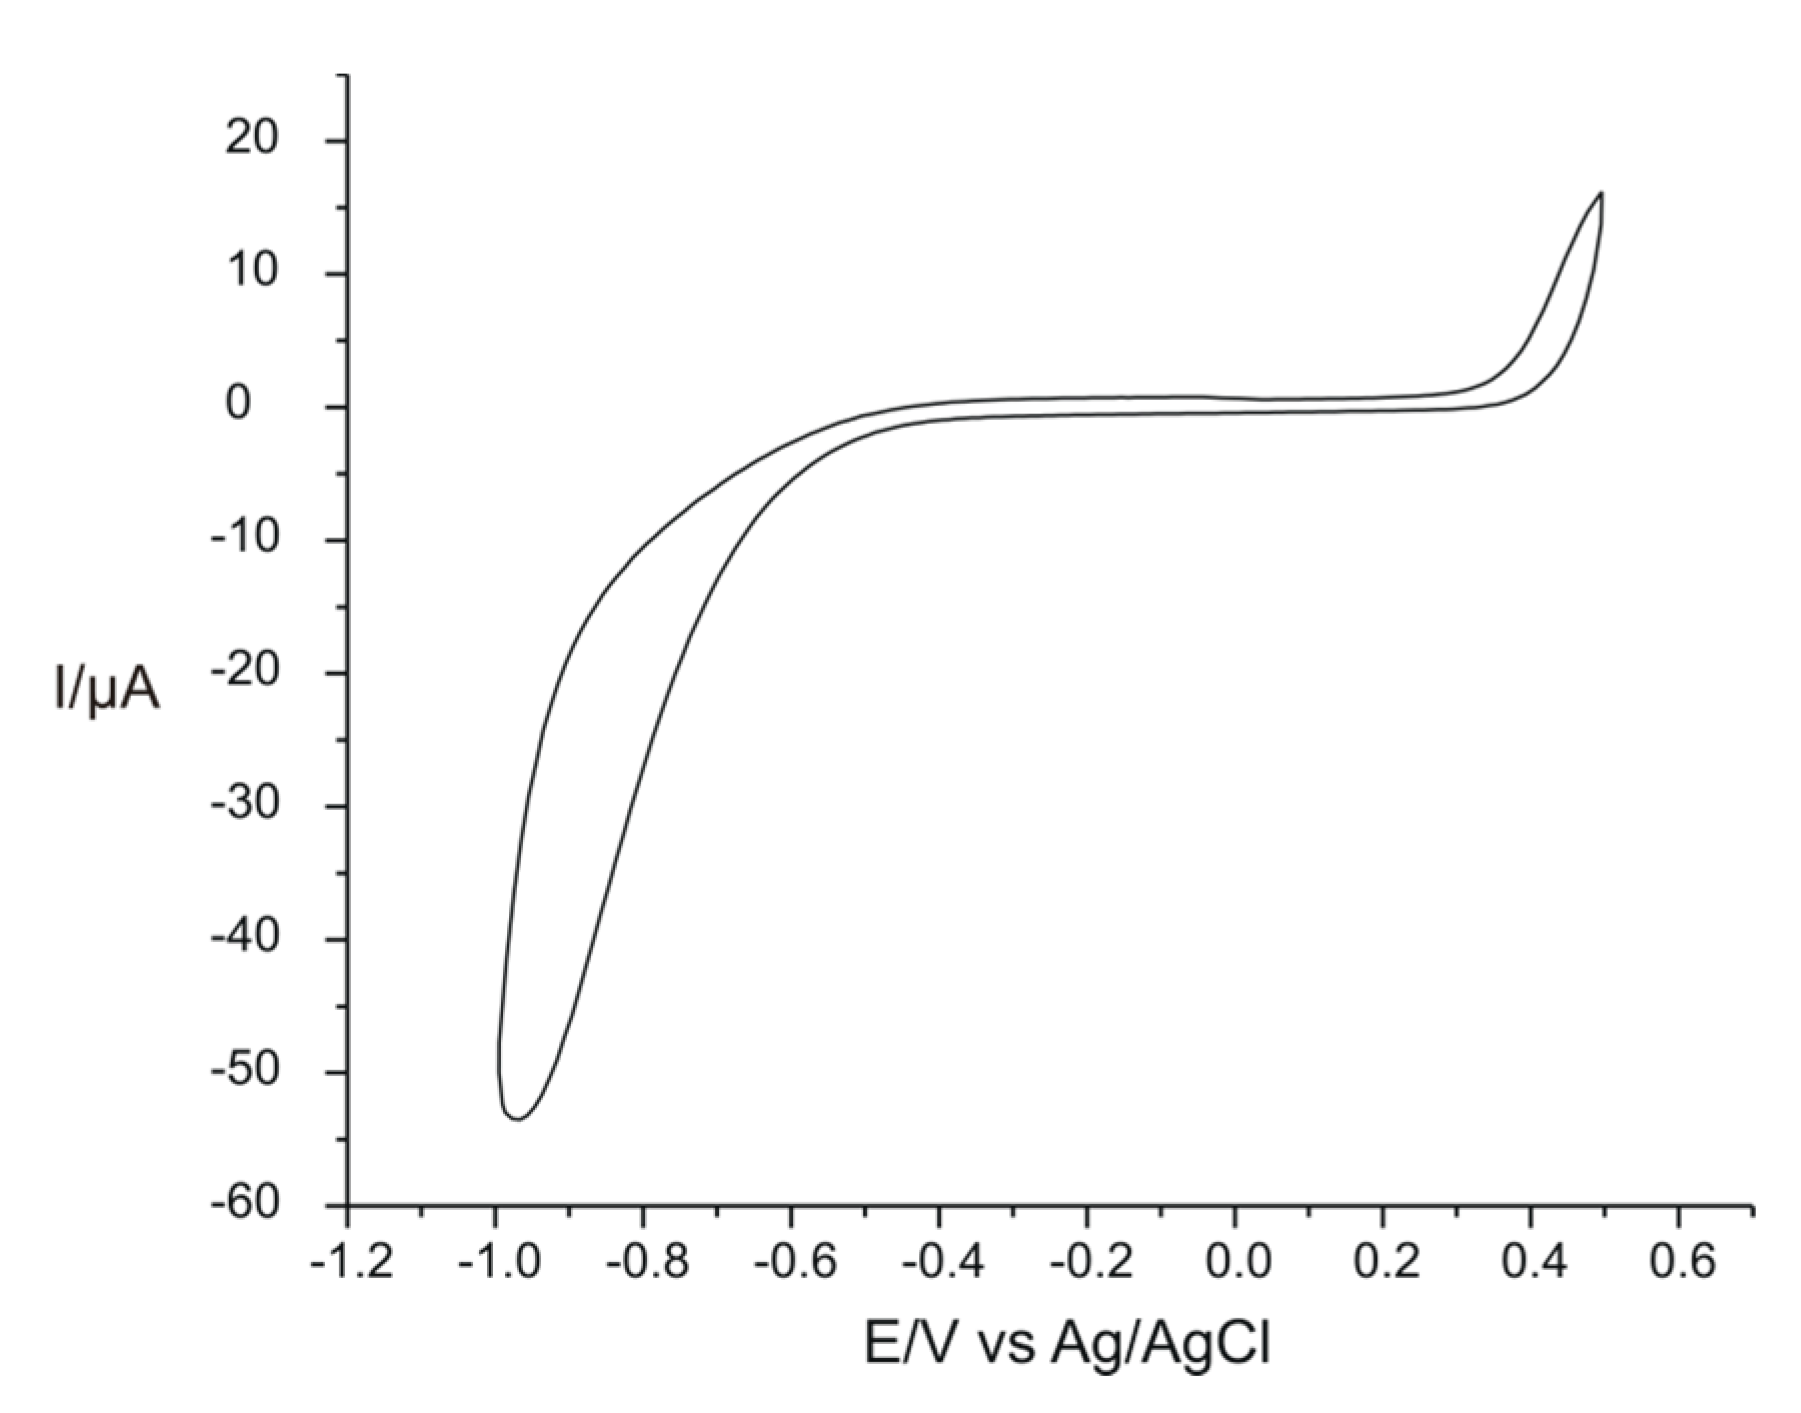
3.2. The Electrochemical Response of the Modified Electrode with PPy/FeCN in a 0.1 M KCl Solution and in a 0.1 M KCl–10−3 M L-TRP Double Solution
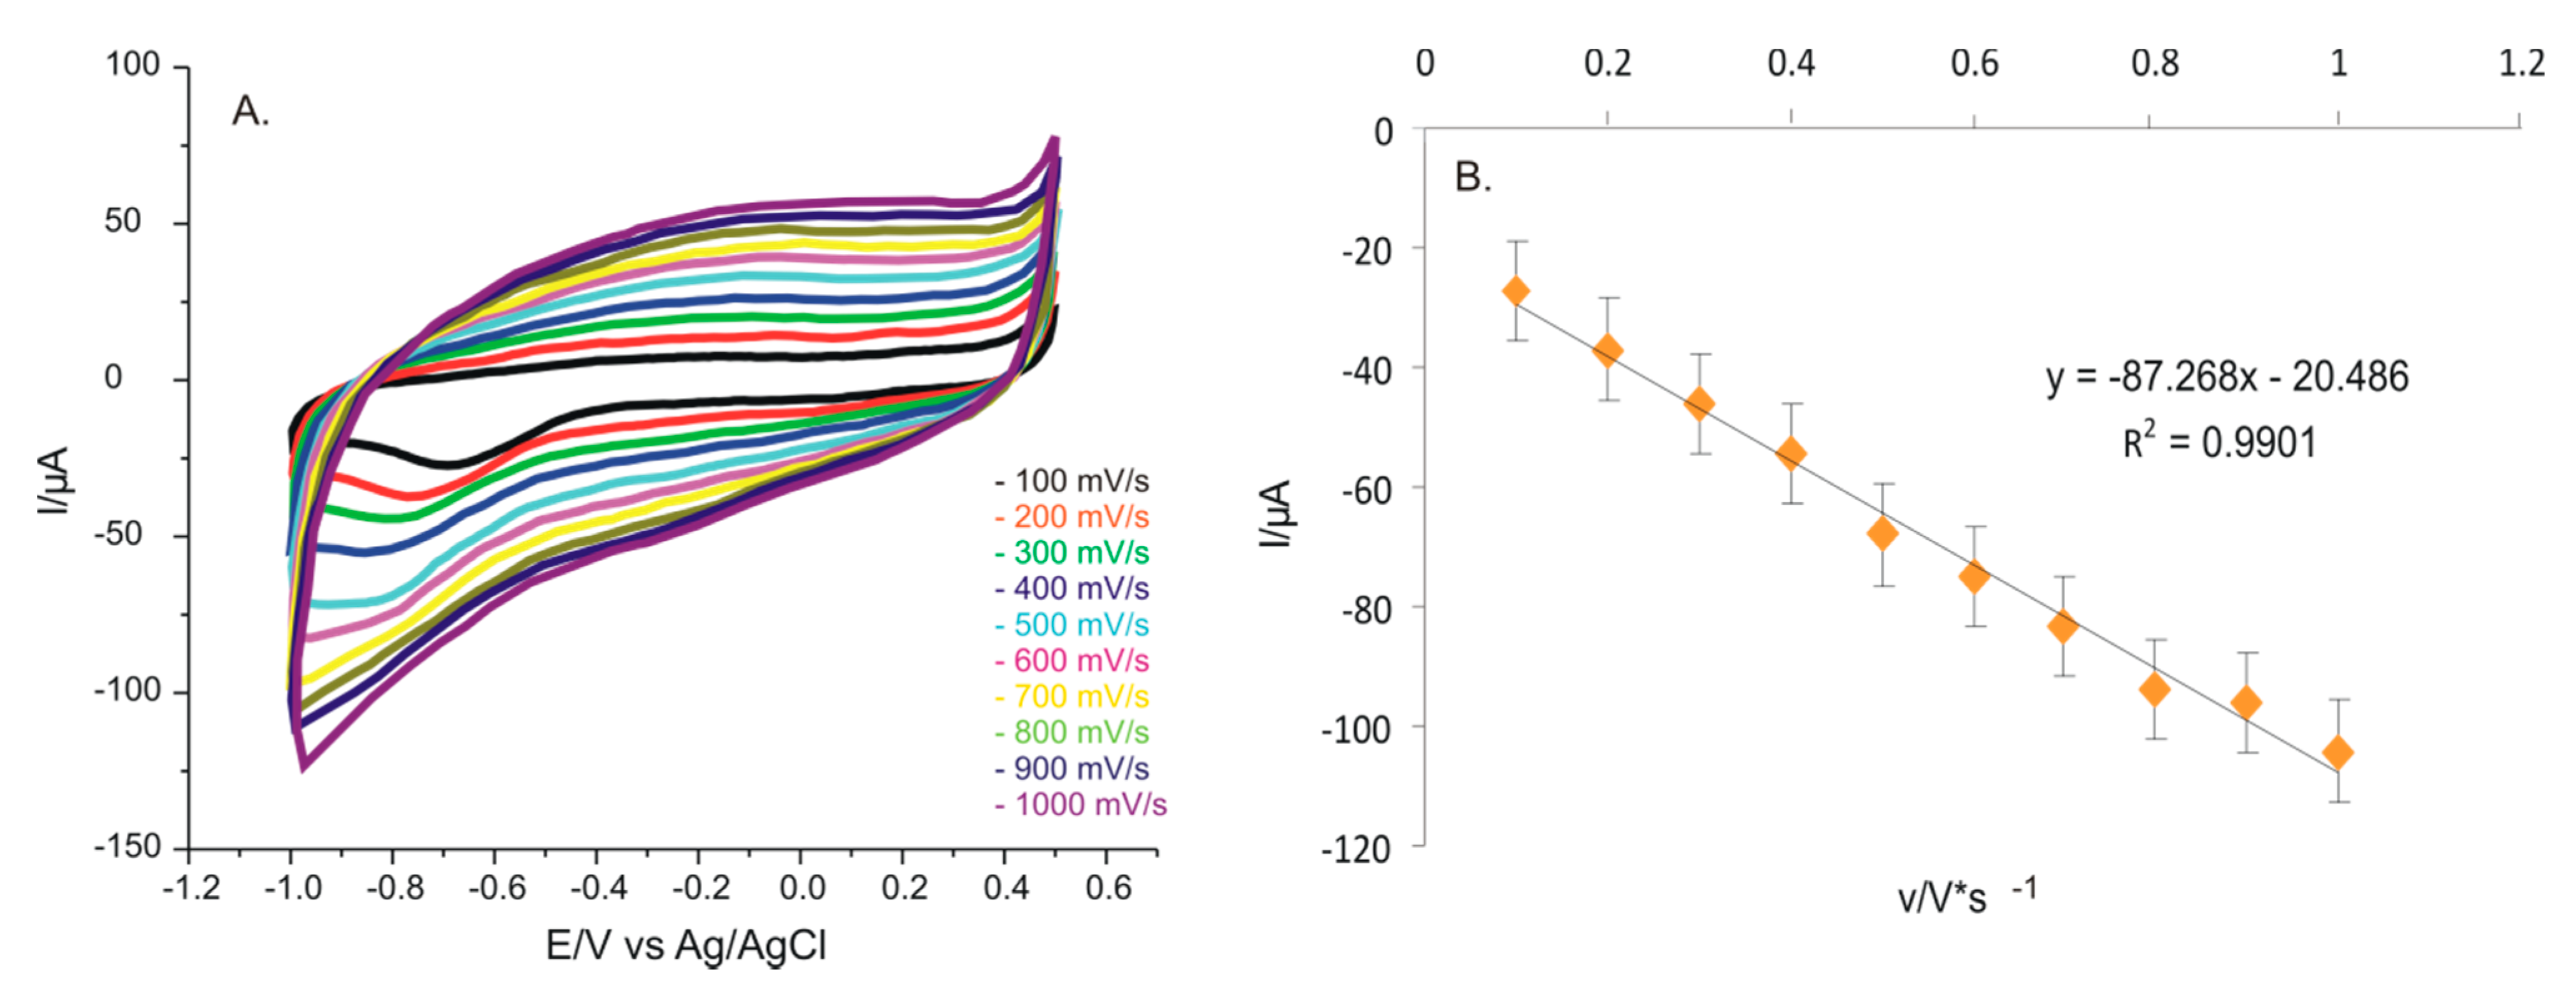
3.3. The Influence of the Scan Rate on the Sensor Responses Immersed in a 0.1 M KCl and 10−3 M L-TRP Solution
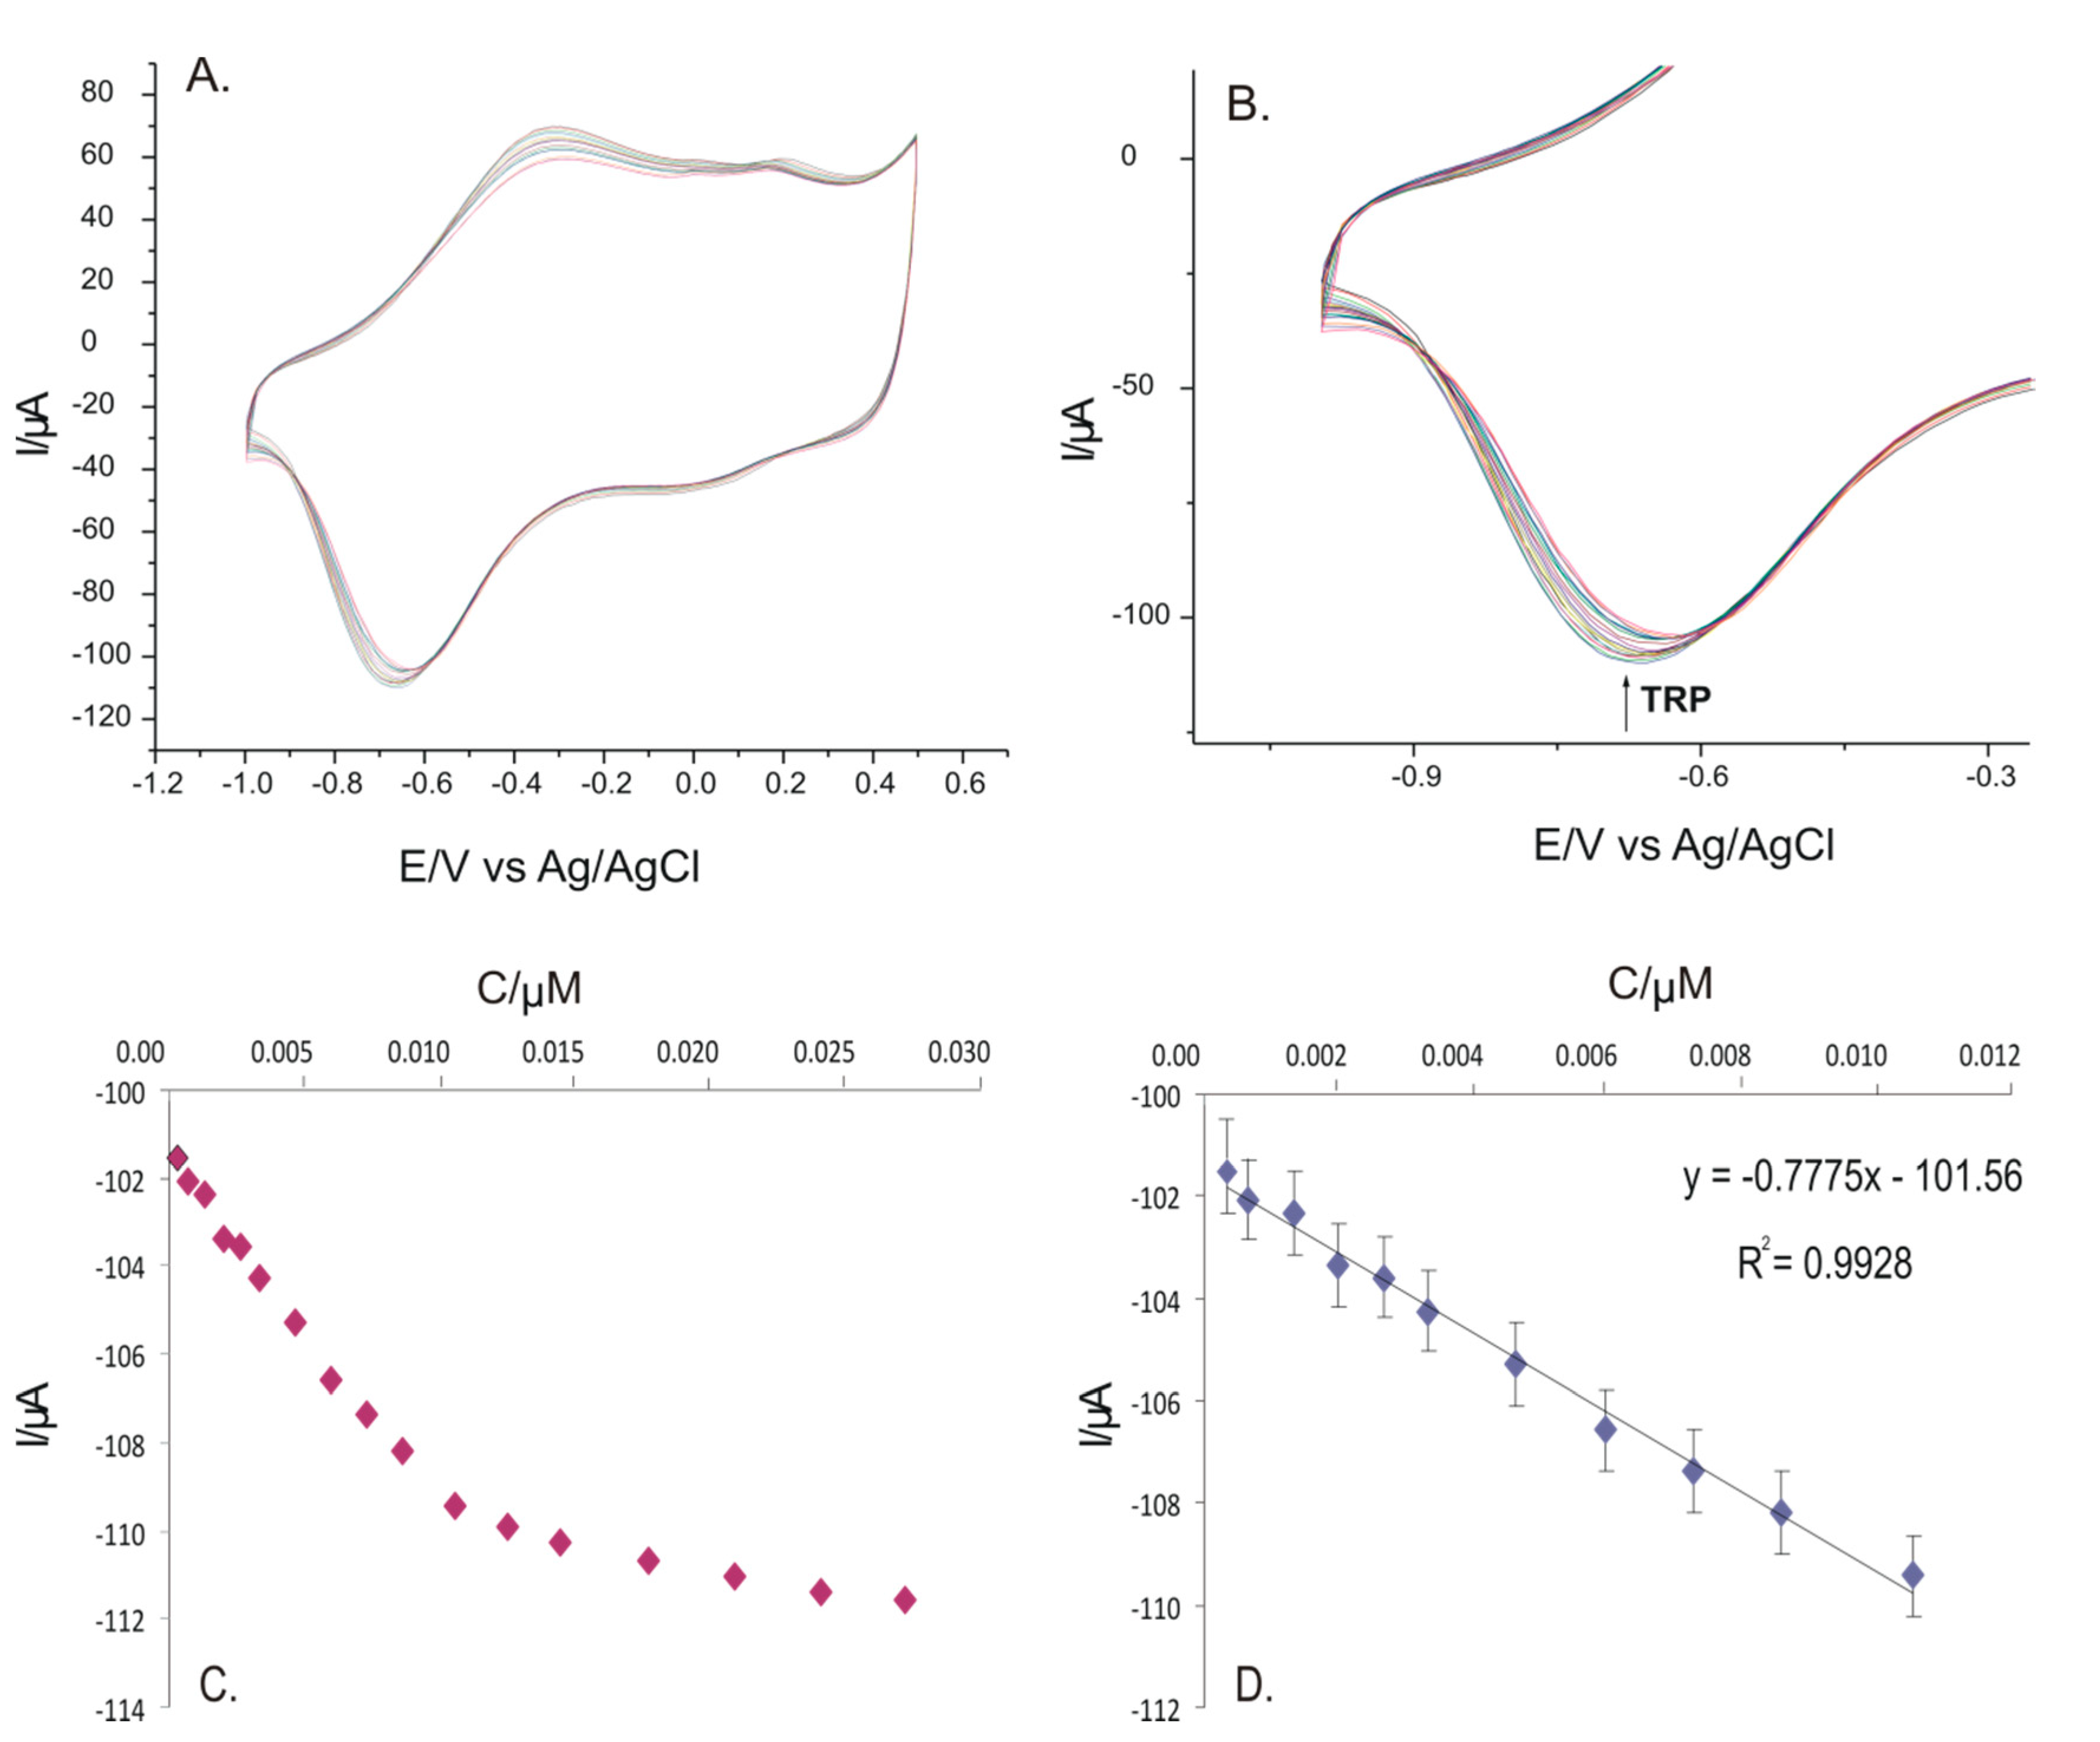
3.4. Influence of the Concentration on Responses of the Sensor Immersed in a 0.1 M KCl and 10−3 M L-TRP Solution: Calibration Curve
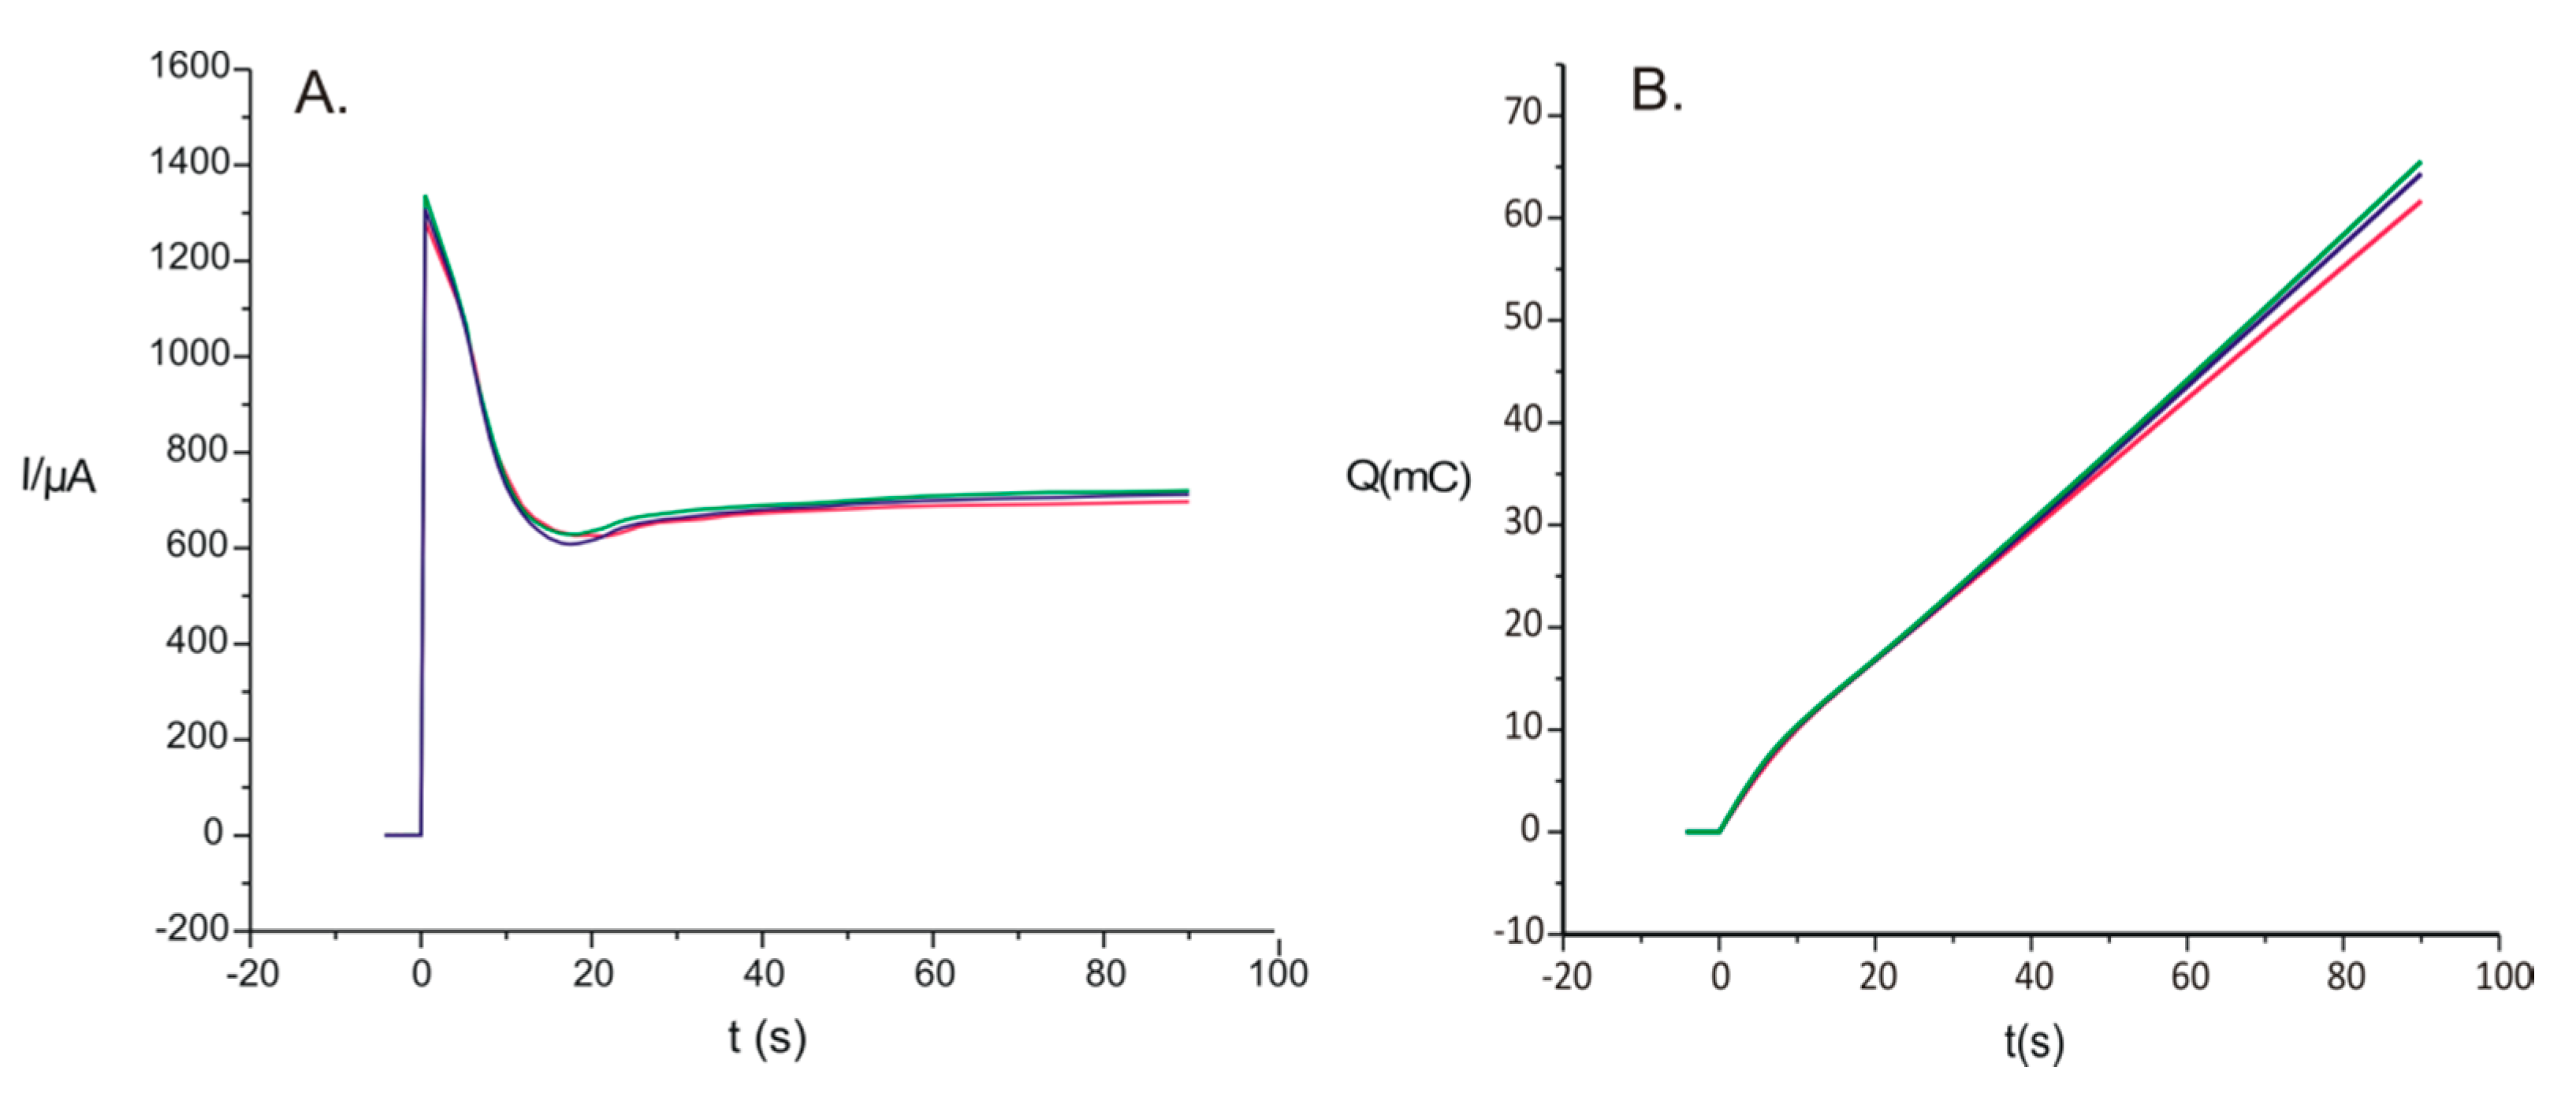
3.5. Method Precision, Stability and Reproducibility
3.6. Validation of the Modified Sensor by Quantitative Determination of L-TRP in Pharmaceutical Samples
4. Conclusions
Author Contributions
Funding
Institutional Review Board Statement
Informed Consent Statement
Data Availability Statement
Acknowledgments
Conflicts of Interest
References
- Sadok, I.; Tyszczuk-Rotko, K.; Mroczka, R.; Staniszewska, M. Simultaneous voltammetric analysis of tryptophan and kynurenine in culture medium from human cancer cells. Talanta 2020, 209, 120574. [Google Scholar] [CrossRef]
- Liu, X.; Luo, L.; Ding, Y.; Ye, D. Poly-glutamic acid modified carbon nanotube-doped carbon paste electrode for sensitive detection of L-tryptophan. Bioelectrochemistry 2011, 82, 38–45. [Google Scholar] [CrossRef] [PubMed]
- Kagan, J.; Sharon, I.; Béjà, O.; Kuhn, J.C. The tryptophan pathway genes of the Sargasso Sea metagenome: New operon structures and the prevalence of non-operon organization. Genome Biol. 2008, 9, R20. [Google Scholar] [CrossRef] [PubMed] [Green Version]
- Dinu, A.; Apetrei, C. A Review on Electrochemical Sensors and Biosensors Used in Phenylalanine Electroanalysis. Sensors 2020, 20, 2496. [Google Scholar] [CrossRef] [PubMed]
- Yu, L.-Y.; Liu, Q.; Wu, X.-W.; Jiang, X.-Y.; Yu, J.-G.; Chen, X.-Q. Chiral electrochemical recognition of tryptophan enantiomers at a multi-walled carbon nanotube–chitosan composite modified glassy carbon electrode. RSC Adv. 2015, 5, 98020–98025. [Google Scholar] [CrossRef]
- Colombo, S.; Coluccini, C.; Caricato, M.; Gargiulli, C.; Gattuso, G.; Pasini, D. Shape selectivity in the synthesis of chiral macrocyclic amides. Tetrahedron 2010, 66, 4206–4211. [Google Scholar] [CrossRef]
- Caricato, M.; Olmo, A.; Gargiulli, C.; Gattuso, G.; Pasini, D. A ‘clicked’ macrocyclic probe incorporating Binol as the signalling unit for the chiroptical sensing of anions. Tetrahedron 2012, 68, 7861–7866. [Google Scholar] [CrossRef]
- Kałużna-Czaplińska, J.; Gątarek, P.; Chirumbolo, S.; Chartrand, M.S.; Bjørklund, G. How important is tryptophan in human health? Crit. Rev. Food Sci. Nutr. 2019, 59, 72–88. [Google Scholar] [CrossRef] [PubMed]
- He, Q.; Tian, Y.; Wu, Y.; Liu, J.; Li, G.; Deng, P.; Chen, D. Electrochemical Sensor for Rapid and Sensitive Detection of Tryptophan by a Cu2O Nanoparticles-Coated Reduced Graphene Oxide Nanocomposite. Biomolecules 2019, 9, 176. [Google Scholar] [CrossRef] [Green Version]
- Heine, W.; Radke, M.; Wutzke, K.-D. The significance of tryptophan in human nutrition. Amino Acids 1995, 9, 91–205. [Google Scholar] [CrossRef]
- Eroğlu, I.; Eroğlu, B.Ç.; Güven, G.S. Altered tryptophan absorption and metabolism could underlie long-term symptoms in survivors of coronavirus disease 2019 (COVID-19). Nutrition 2021, 90, 111308. [Google Scholar] [CrossRef]
- Shaw, K.A.; Turner, J.; Del Mar, C. Tryptophan and 5-Hydroxytryptophan for depression. Cochrane Database Syst. Rev. 2002. [Google Scholar] [CrossRef] [Green Version]
- Hudson, C.; Hudson, S.; MacKenzie, J. Protein-source tryptophan as an efficacious treatment for social anxiety disorder: A pilot studyThis article is one of a selection of papers published in this special issue (part 1 of 2) on the Safety and Efficacy of Natural Health Products. Can. J. Physiol. Pharmacol. 2007, 85, 928–932. [Google Scholar] [CrossRef] [PubMed]
- Schneider-Helmert, D.; Spinweber, C.L. Evaluation of l-Tryptophan for Treatment of Insomnia: A Review. Psychopharmacology 1986, 89. [Google Scholar] [CrossRef] [PubMed]
- Mette, C.; Zimmermann, M.; Grabemann, M.; Abdel-Hamid, M.; Uekermann, J.; Biskup, C.S.; Wiltfang, J.; Zepf, F.D.; Kis, B. The impact of acute tryptophan depletion on attentional performance in adult patients with ADHD. Acta Psychiatr. Scand. 2013, 128, 124–132. [Google Scholar] [CrossRef]
- Menkes, D.B.; Coates, D.C.; Fawcett, J.P. Acute tryptophan depletion aggravates premenstrual syndrome. J. Affect. Disord. 1994, 32, 37–44. [Google Scholar] [CrossRef]
- Lovelace, M.D.; Varney, B.; Sundaram, G.; Franco, N.F.; Ng, M.L.; Pai, S.; Lim, C.K.; Guillemin, G.J.; Brew, B.J. Current Evidence for a Role of the Kynurenine Pathway of Tryptophan Metabolism in Multiple Sclerosis. Front. Immunol. 2016, 7, 246. [Google Scholar] [CrossRef] [Green Version]
- Liu, Y.; Tian, A.; Wang, X.; Qi, J.; Wang, F.; Ma, Y.; Ito, Y.; Wei, Y. Fabrication of chiral amino acid ionic liquid modified magnetic multifunctional nanospheres for centrifugal chiral chromatography separation of racemates. J. Chromatogr. A 2015, 1400, 40–46. [Google Scholar] [CrossRef] [PubMed] [Green Version]
- Boulet, L.; Faure, P.; Flore, P.; Montérémal, J.; Ducros, V. Simultaneous determination of tryptophan and 8 metabolites in human plasma by liquid chromatography/tandem mass spectrometry. J. Chromatogr. B 2017, 1054, 36–43. [Google Scholar] [CrossRef]
- Yıldız, C.; Bayraktepe, D.E.; Yazan, Z. Electrochemical low-level detection of l-tryptophan in human urine samples: Use of pencil graphite leads as electrodes for a fast and cost-effective voltammetric method. Mon. Chem. 2020, 151, 871–879. [Google Scholar] [CrossRef]
- Whiley, L.; Nye, L.C.; Grant, I.; Andreas, N.J.; Chappell, K.E.; Sarafian, M.H.; Misra, R.; Plumb, R.S.; Lewis, M.R.; Nicholson, J.K.; et al. Ultrahigh-Performance Liquid Chromatography Tandem Mass Spectrometry with Electrospray Ionization Quantification of Tryptophan Metabolites and Markers of Gut Health in Serum and Plasma—Application to Clinical and Epidemiology Cohorts. Anal. Chem. 2019, 91, 5207–5216. [Google Scholar] [CrossRef] [Green Version]
- Hawkins, G.; Zipkin, I.; Marshall, L. Determination of Uric Acid, Tyrosine, Tryptophan, and Protein in whole Human Parotid Saliva by Ultraviolet Absorption Spectrophotometry. J. Dent. Res. 1963, 42, 1015–1022. [Google Scholar] [CrossRef]
- Fan, Y.; Liu, J.-H.; Lu, H.-T.; Zhang, Q. Electrochemistry and voltammetric determination of L-tryptophan and L-tyrosine using a glassy carbon electrode modified with a Nafion/TiO2-graphene composite film. Microchim. Acta 2011, 173, 241–247. [Google Scholar] [CrossRef]
- Zhao, J. Simultaneous determination of plasma creatinine, uric acid, kynurenine and tryptophan by high-performance liquid chromatography: Method validation and in application to the assessment of renal function: Simultaneous Determination of Cr, UA, KYN and TRP by HPLC. Biomed. Chromatogr. 2015, 29, 410–415. [Google Scholar] [CrossRef] [PubMed]
- Ritota, M.; Manzi, P. Rapid Determination of Total Tryptophan in Yoghurt by Ultra High Performance Liquid Chromatography with Fluorescence Detection. Molecules 2020, 25, 5025. [Google Scholar] [CrossRef] [PubMed]
- Zhao, M.; Zhou, M.-F.; Feng, H.; Cong, X.-X.; Wang, X.-L. Determination of Tryptophan, Glutathione, and Uric Acid in Human Whole Blood Extract by Capillary Electrophoresis with a One-Step Electrochemically Reduced Graphene Oxide Modified Microelectrode. Chromatographia 2016, 79, 911–918. [Google Scholar] [CrossRef]
- Li, S.; Xing, M.; Wang, H.; Zhang, L.; Zhong, Y.; Chen, L. Determination of tryptophan and tyrosine by chemiluminescence based on a luminol–N-bromosuccinimide–ZnS quantum dots system. RSC Adv. 2015, 5, 59286–59291. [Google Scholar] [CrossRef]
- Moscetti, I.; Cannistraro, S.; Bizzarri, A.R. Probing direct interaction of oncomiR-21-3p with the tumor suppressor p53 by fluorescence, FRET and atomic force spectroscopy. Arch. Biochem. Biophys. 2019, 671, 35–41. [Google Scholar] [CrossRef] [PubMed]
- Viter, R.; Iatsunskyi, I. Metal Oxide Nanostructures in Sensing. In Nanomaterials Design for Sensing Applications; Elsevier: Amsterdam, The Netherlands, 2019; pp. 41–91. ISBN 978-0-12-814505-0. [Google Scholar]
- Tığ, G.A. Development of electrochemical sensor for detection of ascorbic acid, dopamine, uric acid and l-tryptophan based on Ag nanoparticles and poly(l-arginine)-graphene oxide composite. J. Electroanal. Chem. 2017, 807, 19–28. [Google Scholar] [CrossRef]
- Hashkavayi, A.B.; Raoof, J.B.; Park, K.S. Sensitive Electrochemical Detection of Tryptophan Using a Hemin/G-Quadruplex Aptasensor. Chemosensors 2020, 8, 100. [Google Scholar] [CrossRef]
- Ensafi, A.A.; Hajian, R. Determination of tryptophan and histidine by adsorptive cathodic stripping voltammetry using H-point standard addition method. Anal. Chim. Acta 2006, 580, 236–243. [Google Scholar] [CrossRef]
- Xia, Y.; Zhao, F.; Zeng, B. A molecularly imprinted copolymer based electrochemical sensor for the highly sensitive detection of L-Tryptophan. Talanta 2020, 206, 120245. [Google Scholar] [CrossRef]
- He, Q.; Liu, J.; Feng, J.; Wu, Y.; Tian, Y.; Li, G.; Chen, D. Sensitive Voltammetric Sensor for Tryptophan Detection by Using Polyvinylpyrrolidone Functionalized Graphene/GCE. Nanomaterials 2020, 10, 125. [Google Scholar] [CrossRef] [PubMed] [Green Version]
- Duan, S.; Wang, W.; Yu, C.; Liu, M.; Yu, L. Development of Electrochemical Sensor for Detection of L-Tryptophan Based on Exfoliated Graphene/PEDOT:PSS. Nano 2019, 14, 1950058. [Google Scholar] [CrossRef]
- Tat’yana, V.V.; Efimov, O.N. Polypyrrole: A Conducting Polymer; Its Synthesis, Properties and Applications. Russ. Chem. Rev. 1997, 66, 443. [Google Scholar]
- Gniadek, M.; Wichowska, A.; Antos-Bielska, M.; Orlowski, P.; Krzyzowska, M.; Donten, M. Synthesis and characterization of polypyrrole and its composites coatings on flexible surface and its antibacterial properties. Synth. Met. 2020, 266, 116430. [Google Scholar] [CrossRef]
- Dinu, A.; Apetrei, C. Development of Polypyrrole Modified Screen-Printed Carbon Electrode Based Sensors for Determination of L-Tyrosine in Pharmaceutical Products. IJMS 2021, 22, 7528. [Google Scholar] [CrossRef]
- Bieńkowski, K.; Strawski, M.; Szklarczyk, M. The determination of the thickness of electrodeposited polymeric films by AFM and electrochemical techniques. J. Electroanal. Chem. 2011, 662, 196–203. [Google Scholar] [CrossRef]
- Apetrei, C. Novel method based on polypyrrole-modified sensors and emulsions for the evaluation of bitterness in extra virgin olive oils. Food Res. Int. 2012, 48, 673–680. [Google Scholar] [CrossRef]
- Ghoreishi, S.M.; Behpour, M.; Ghoreishi, F.S.; Mousavi, S. Voltammetric determination of tryptophan in the presence of uric acid and dopamine using carbon paste electrode modified with multi-walled carbon nanotubes. Arab. J. Chem. 2017, 10, S1546–S1552. [Google Scholar] [CrossRef] [Green Version]
- Dinu, A.; Apetrei, C. Voltammetric Determination of Phenylalanine Using Chemically Modified Screen-Printed Based Sensors. Chemosensors 2020, 8, 113. [Google Scholar] [CrossRef]
- Zhang, J.; Wang, D.; Li, Y. Ratiometric Electrochemical Sensors Associated with Self-Cleaning Electrodes for Simultaneous Detection of Adrenaline, Serotonin, and Tryptophan. ACS Appl. Mater. Interfaces 2019, 11, 13557–13563. [Google Scholar] [CrossRef] [PubMed]


| The Detection Method | Reference |
|---|---|
| Chromatography | [18] |
| Spectroscopy | [19,20,21,22] |
| Colorimetry | [23] |
| High-performance liquid chromatography (HPLC) | [19,21,24,25] |
| Capillary electrophoresis | [26] |
| Chemiluminescence | [27] |
| Atomic force spectroscopy | [28] |
| Electrode Materials | The Detection Technique | The Detection Limit | The Linear Range | Reference |
|---|---|---|---|---|
| Cu2O-ERGO/GCE (nanocomposite of cuprous oxide and electrochemically reduced graphene oxide) | CV 1, SWV 2 | 0.01 × 10⁻⁶ M | 0.02–20 × 10−6 M | [9] |
| Nafion-MIP-MWCNTs@IL/GCE (molecularly imprinted copolymer of dual functional monomers and ionic liquid (1-butyl-3-methylimidazolium hexafluorophosphate) functionalized multi-walled carbon nanotubes) | LSV 3, DPV 4 | 6 × 10⁻⁹ M | 8 × 10⁻⁹–26 × 10−6 M | [33] |
| PVP-GR/GCE (glassy carbon electrode modified with polyvinylpyrrolidonefunctionalized graphene/glassy carbon electrode) | CV | 0.01 × 10⁻⁶ M | 0.06–10.0 × 10⁻⁶ M and 10.0–100.0 × 10⁻⁶ M | [34] |
| GR/PEDOT:PSS/GCE (glassy carbon electrode modifed with exfoliated graphene and poly (3,4-ethylenedioxythiophene): poly (styrene sulfonate) | CV | 0.015 × 10⁻⁶ M | 0.1–100 × 10−6 M and 100–1000 × 10−6 M | [35] |
| PPy/FeCN/SPCE | CV, CA 5 | 1.05 × 10⁻⁷ M | 3.3 × 10⁻⁷ M–1.06 × 10⁻⁵ M | This work |
| Sensor | Solution | Electrochemical Parameters | ||||||
|---|---|---|---|---|---|---|---|---|
| Epa 1 (V) | Epc 2 (V) | ΔE 3 (V) | Ipa 4 (µA) | Ipc 5 (μA) | Ipc/Ipa | |||
| PPy/FeCN/SPCE | 0.1 M KCl | Redox system I | −0.27 | −0.74 | −1.01 | 6.76 | −28.33 | 4.19 |
| Redox system II | 0.16 | 0.03 | 0.13 | 7.07 | −4.94 | 0.69 | ||
| PPy/FeCN/SPCE | 0.1 M KCl– 10−3 M L-TRP | Redox system I | −0.31 | −0.78 | 0.47 | 6.81 | −31.24 | 4.58 |
| Redox system II | 0.22 | 0.06 | 0.16 | 9.33 | −7.70 | 0.82 | ||
| Sensor | LOD 1 (M) | LOQ 2 (M) |
|---|---|---|
| PPy/FeCN-SPCE | 1.05 × 10⁻⁷ | 3.51 × 10⁻⁷ |
| Pharmaceutical Product | L-TRP Concentration Reported by Producer (mg) | Concentration of L-TRP | |
|---|---|---|---|
| Method CV (1/mg) | Method FT-IR (2/mg) | ||
| Cebrium EVER NEURO PHARMA | 1.02 mg | 1.04 ± 0.05 | 1.06 ± 0.06 |
| Sleep Optimizer SOLARAY | 150 mg | 150 ± 3 | 150 ± 4 |
Publisher’s Note: MDPI stays neutral with regard to jurisdictional claims in published maps and institutional affiliations. |
© 2021 by the authors. Licensee MDPI, Basel, Switzerland. This article is an open access article distributed under the terms and conditions of the Creative Commons Attribution (CC BY) license (https://creativecommons.org/licenses/by/4.0/).
Share and Cite
Dinu, A.; Apetrei, C. Development of a Novel Sensor Based on Polypyrrole Doped with Potassium Hexacyanoferrate (II) for Detection of L-Tryptophan in Pharmaceutics. Inventions 2021, 6, 56. https://0-doi-org.brum.beds.ac.uk/10.3390/inventions6030056
Dinu A, Apetrei C. Development of a Novel Sensor Based on Polypyrrole Doped with Potassium Hexacyanoferrate (II) for Detection of L-Tryptophan in Pharmaceutics. Inventions. 2021; 6(3):56. https://0-doi-org.brum.beds.ac.uk/10.3390/inventions6030056
Chicago/Turabian StyleDinu, Ancuța, and Constantin Apetrei. 2021. "Development of a Novel Sensor Based on Polypyrrole Doped with Potassium Hexacyanoferrate (II) for Detection of L-Tryptophan in Pharmaceutics" Inventions 6, no. 3: 56. https://0-doi-org.brum.beds.ac.uk/10.3390/inventions6030056