
Drop Jumping on Sand Is Characterized by Lower Power, Higher Rate of Force Development and Larger Knee Joint Range of Motion


Abstract
:1. Introduction
2. Materials and Methods
2.1. Participants
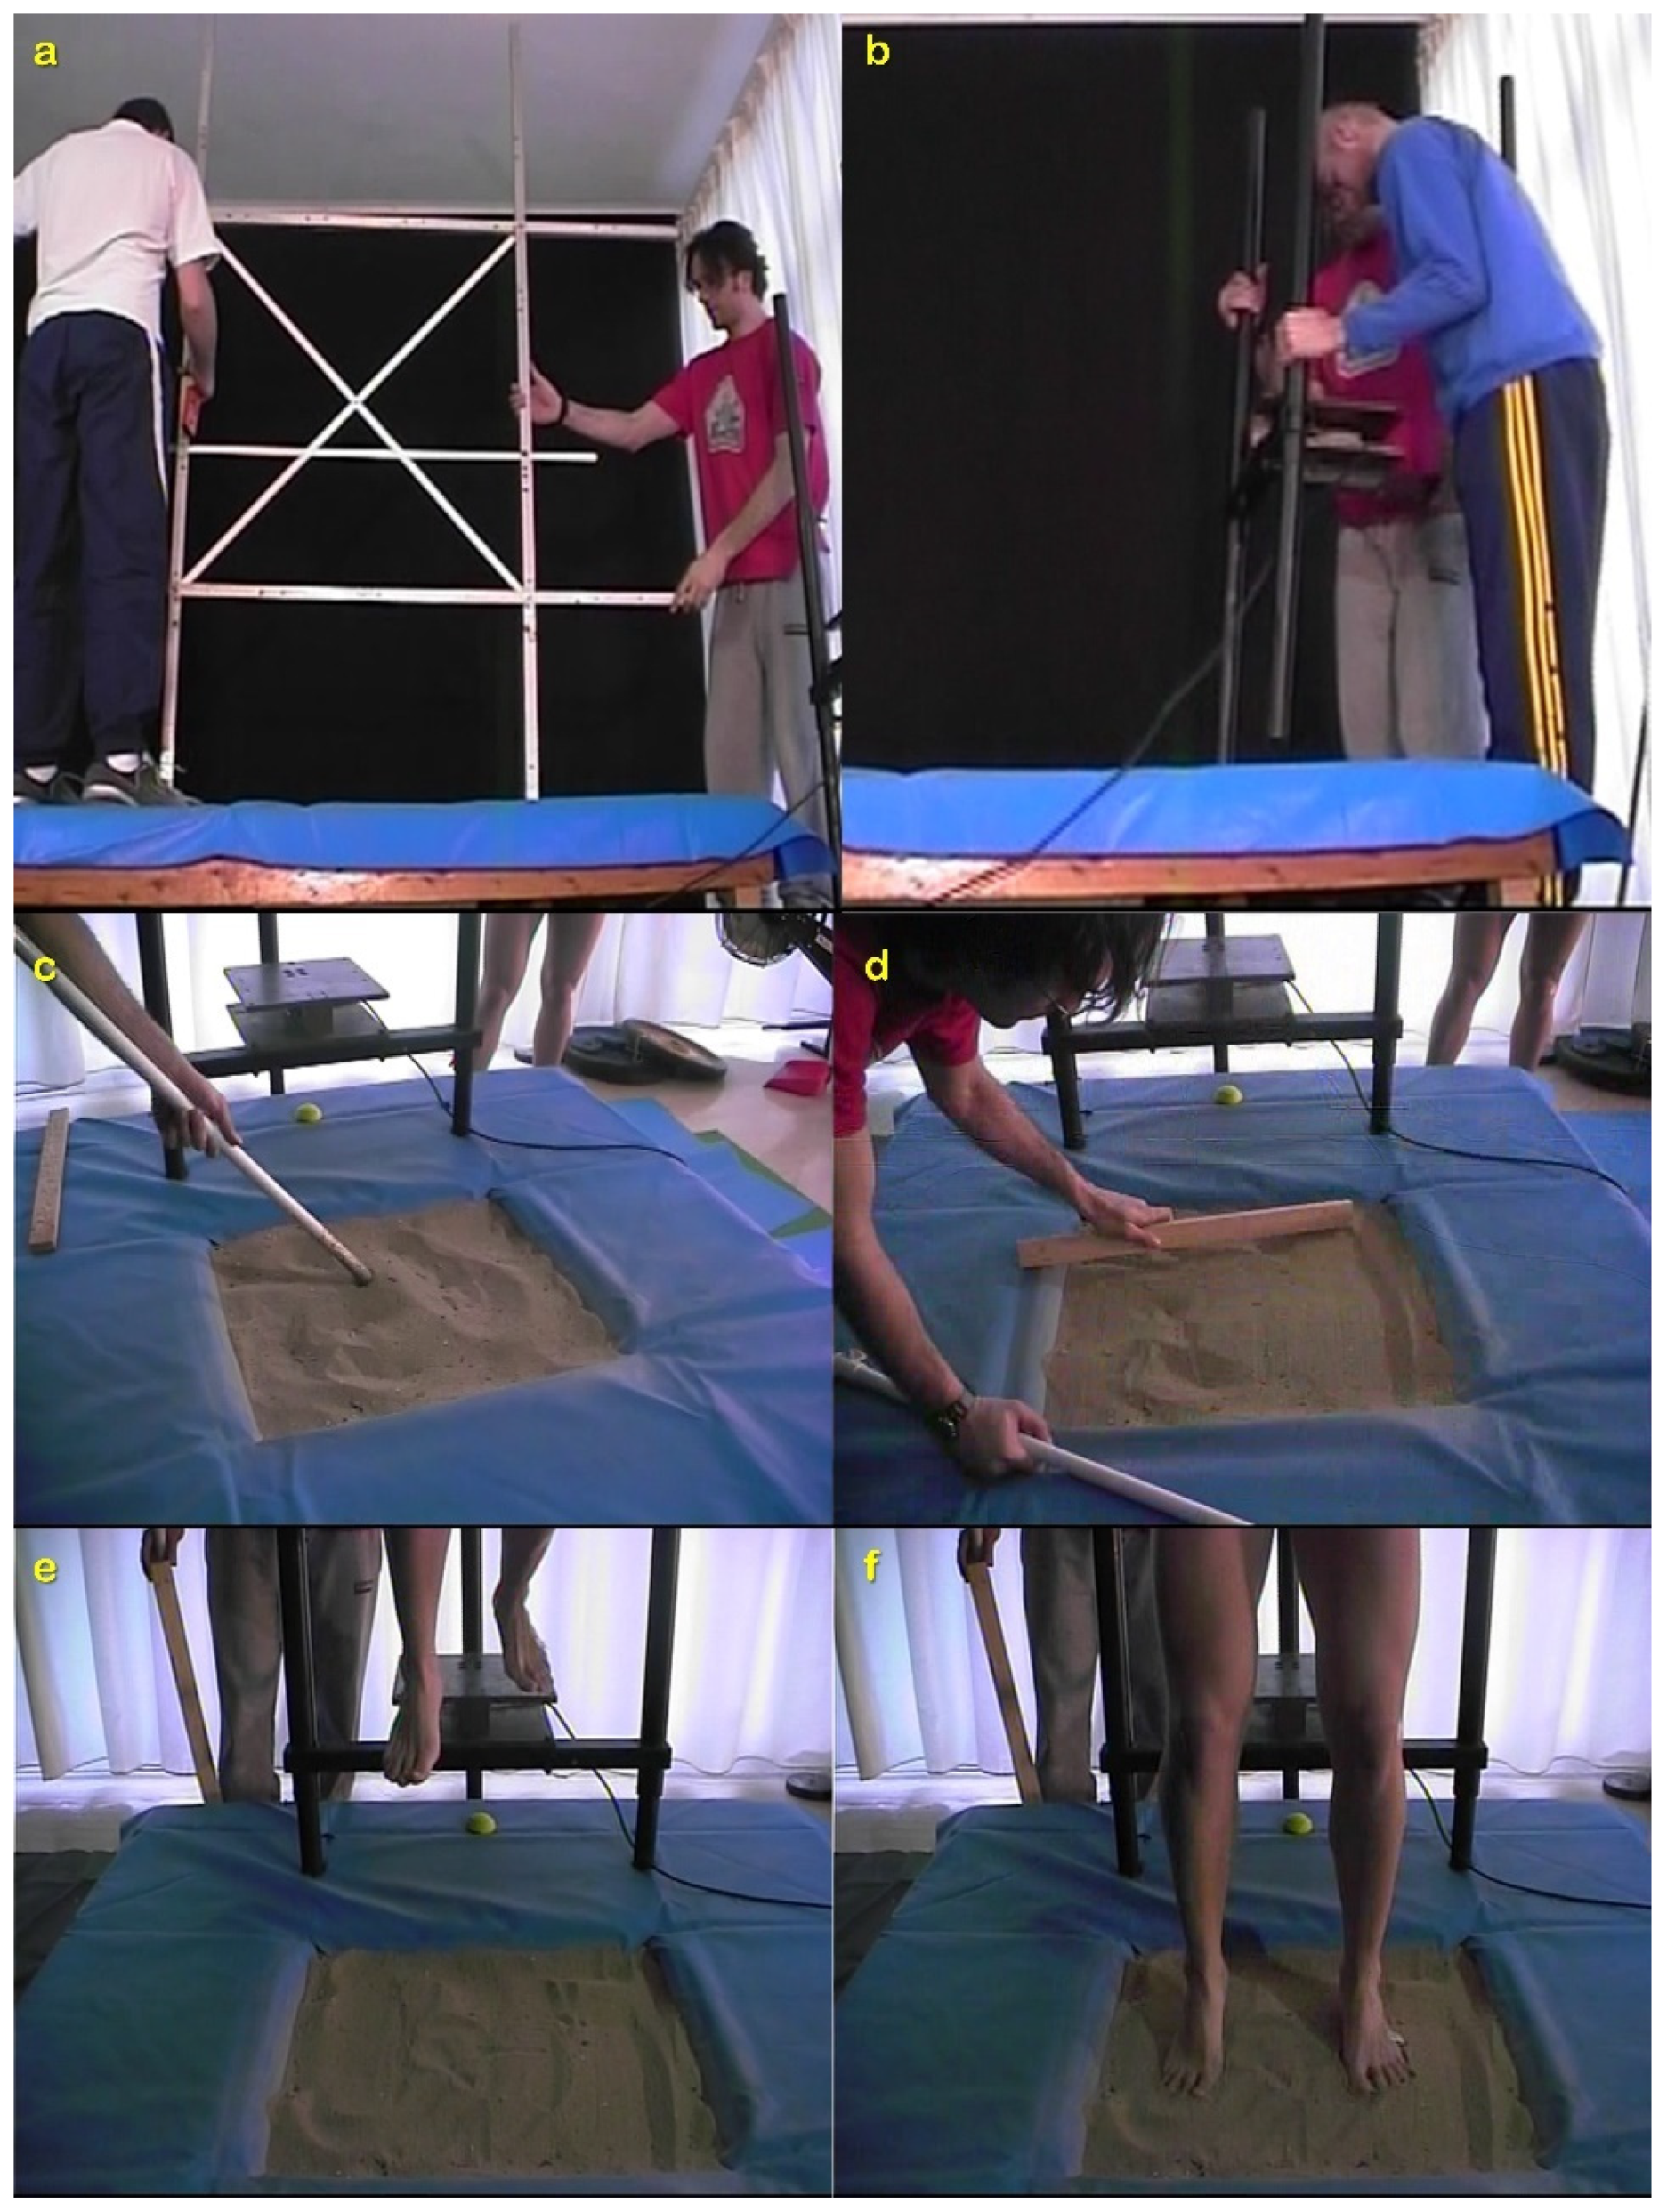
2.2. Procedure
2.3. Data Acquisition and Analysis
- Temporal parameters: total ground contact time (Tc); downward phase duration; time to achieve maximum vertical Ground Reaction Force (tvGRF); time to achieve peak power during the upward phase (tP).
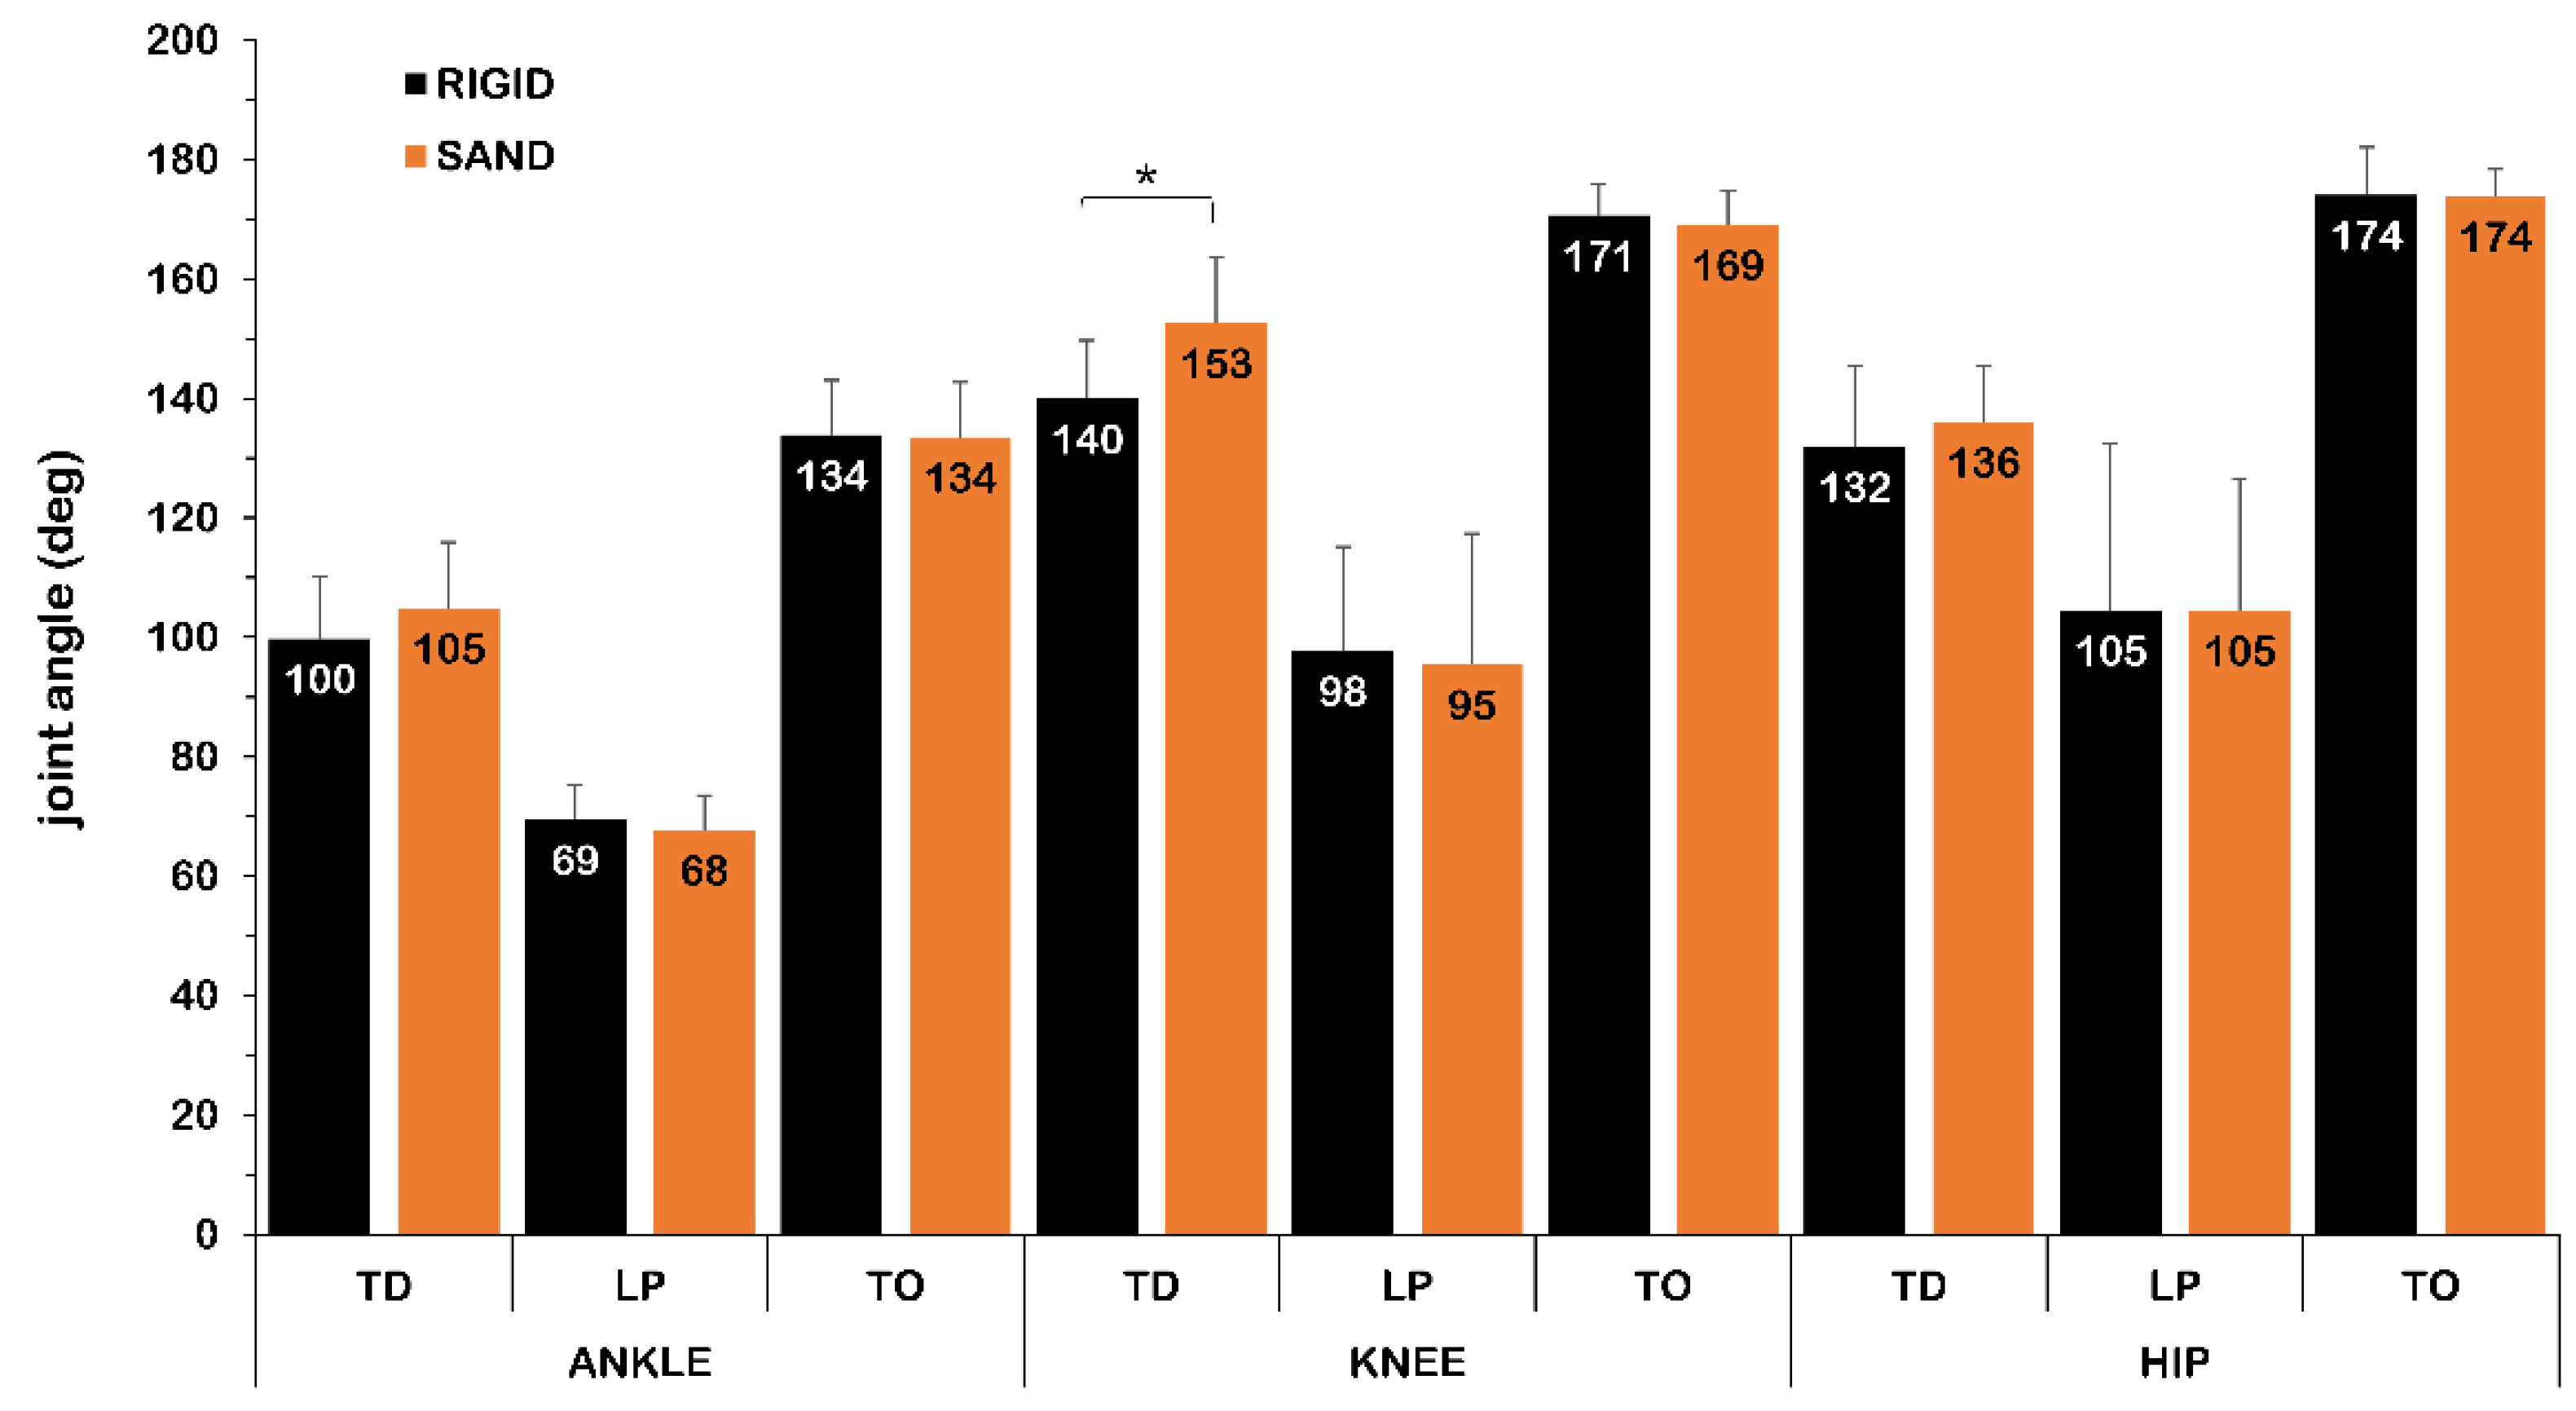
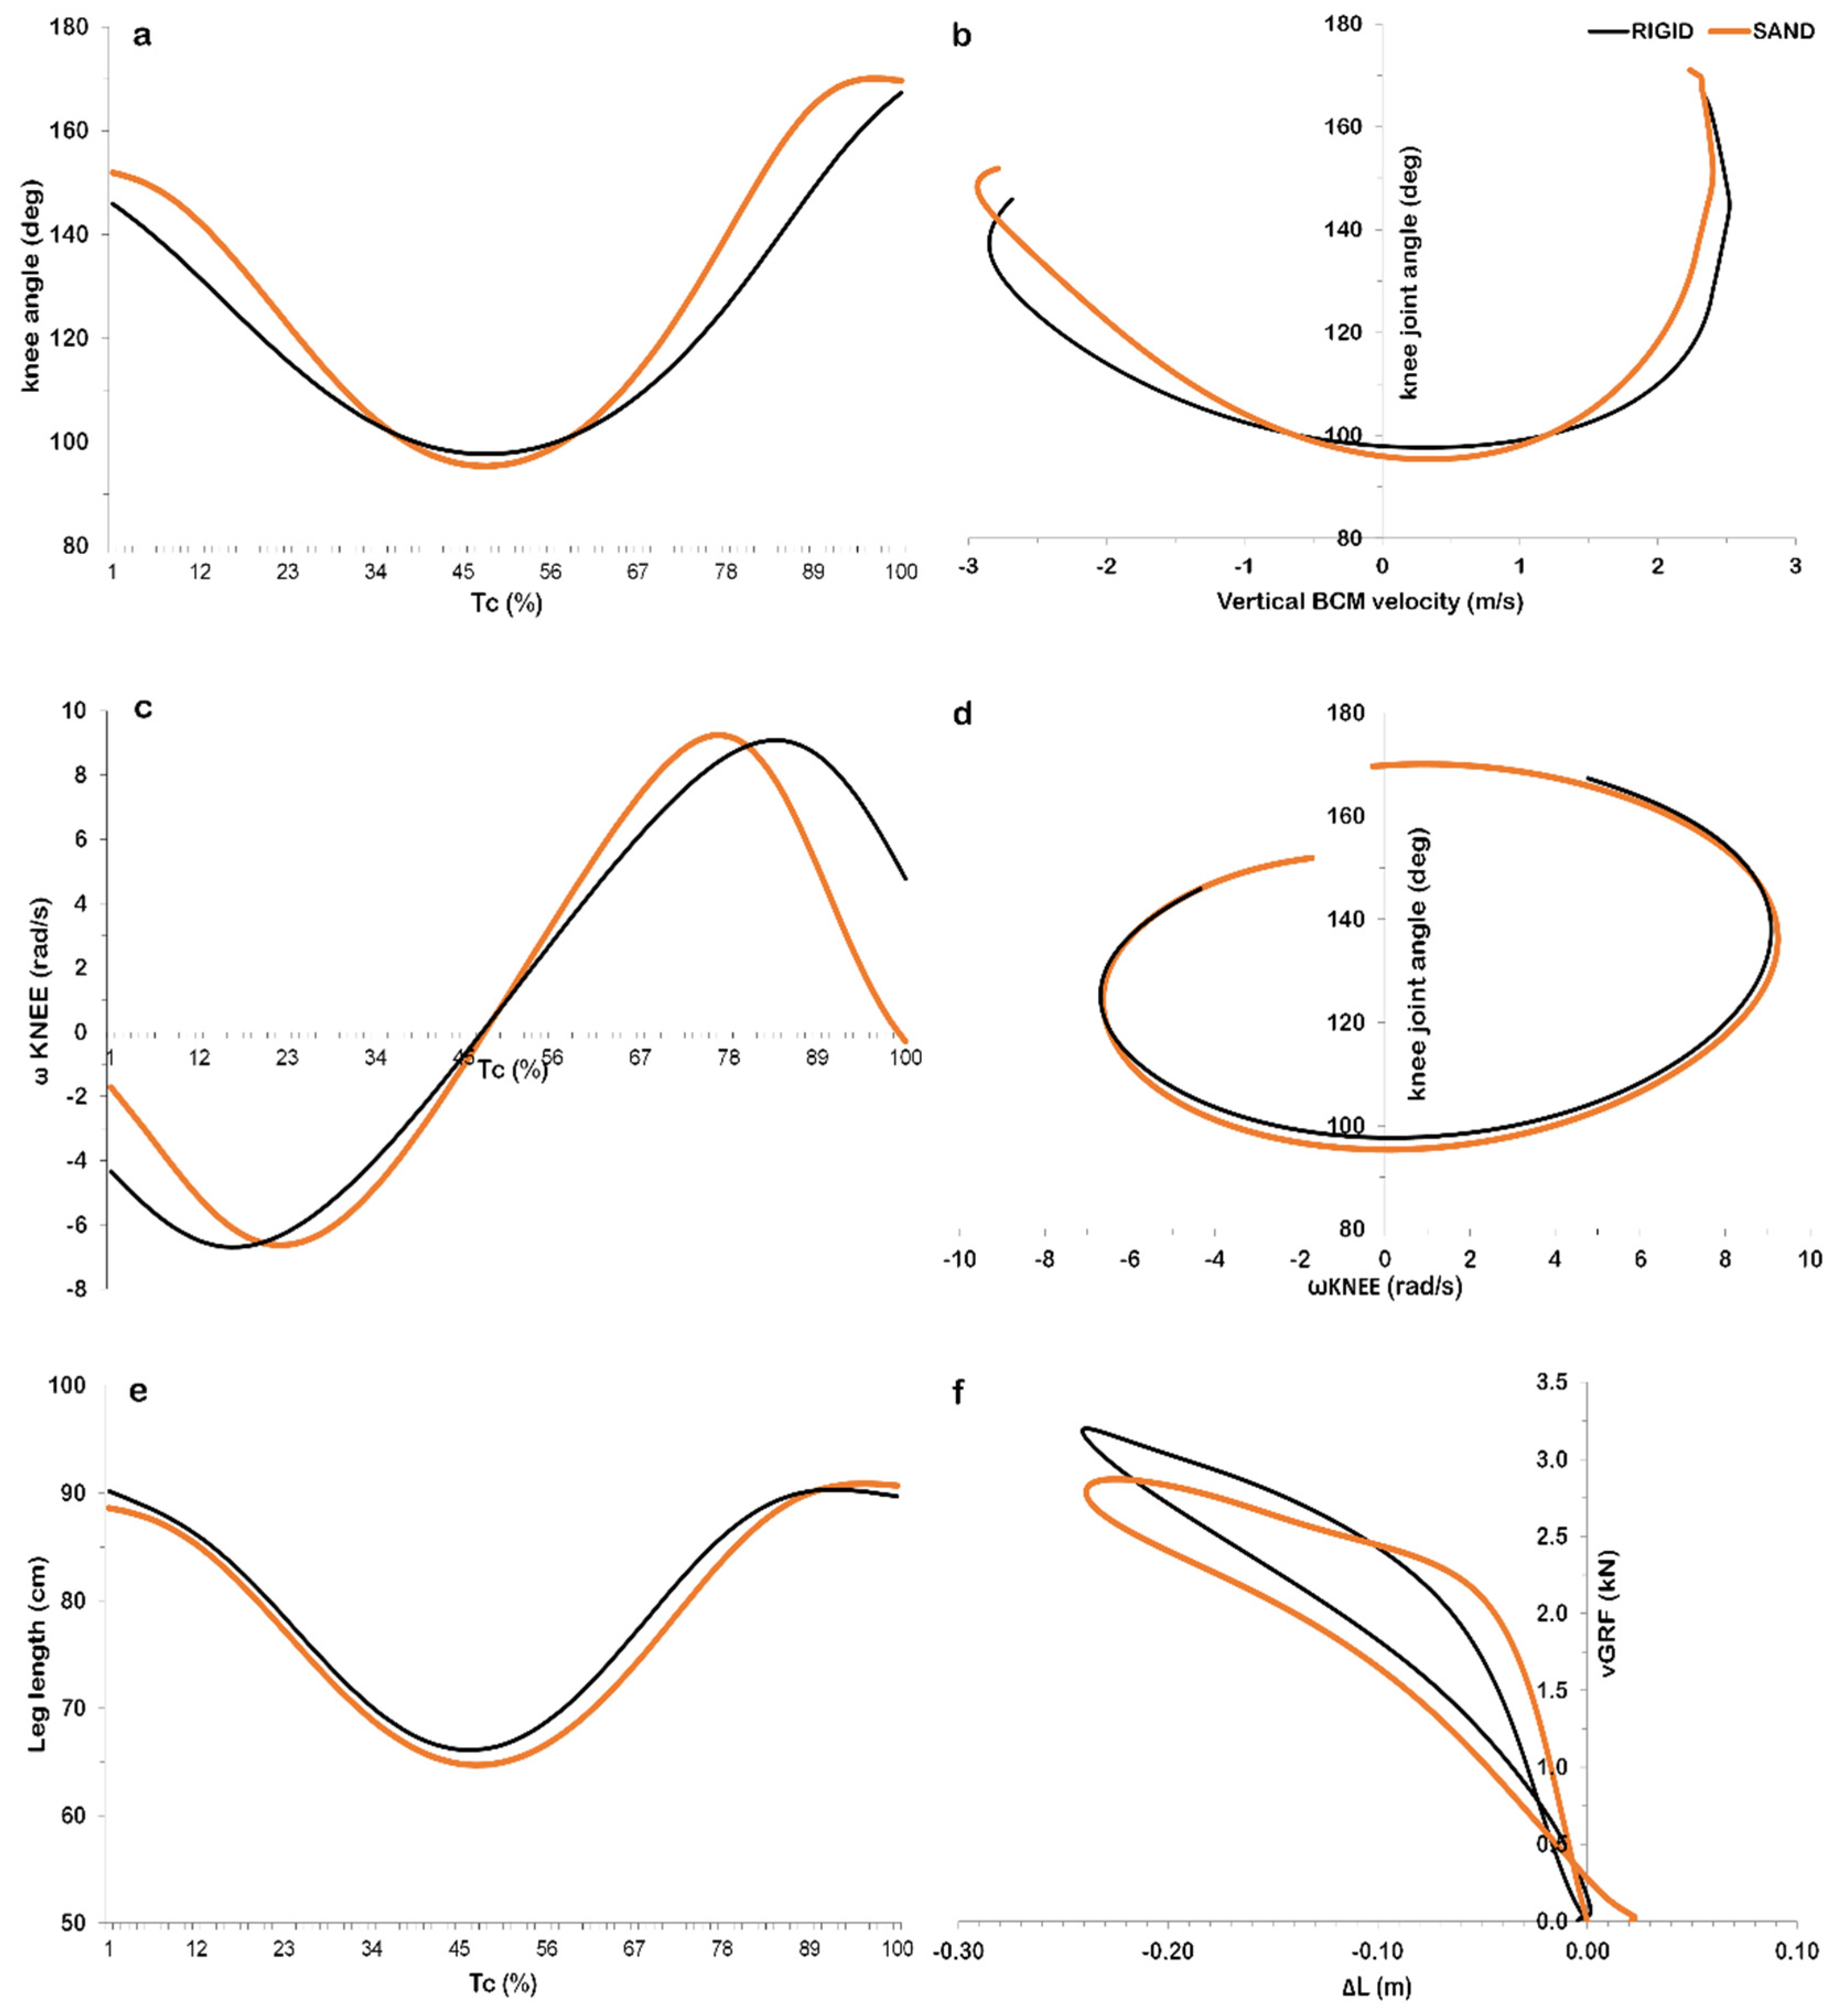
- Spatial/kinematic parameters: hJUMP; body center of mass (BCM) vertical displacement during the downward and upward phases; BCM vertical velocity.
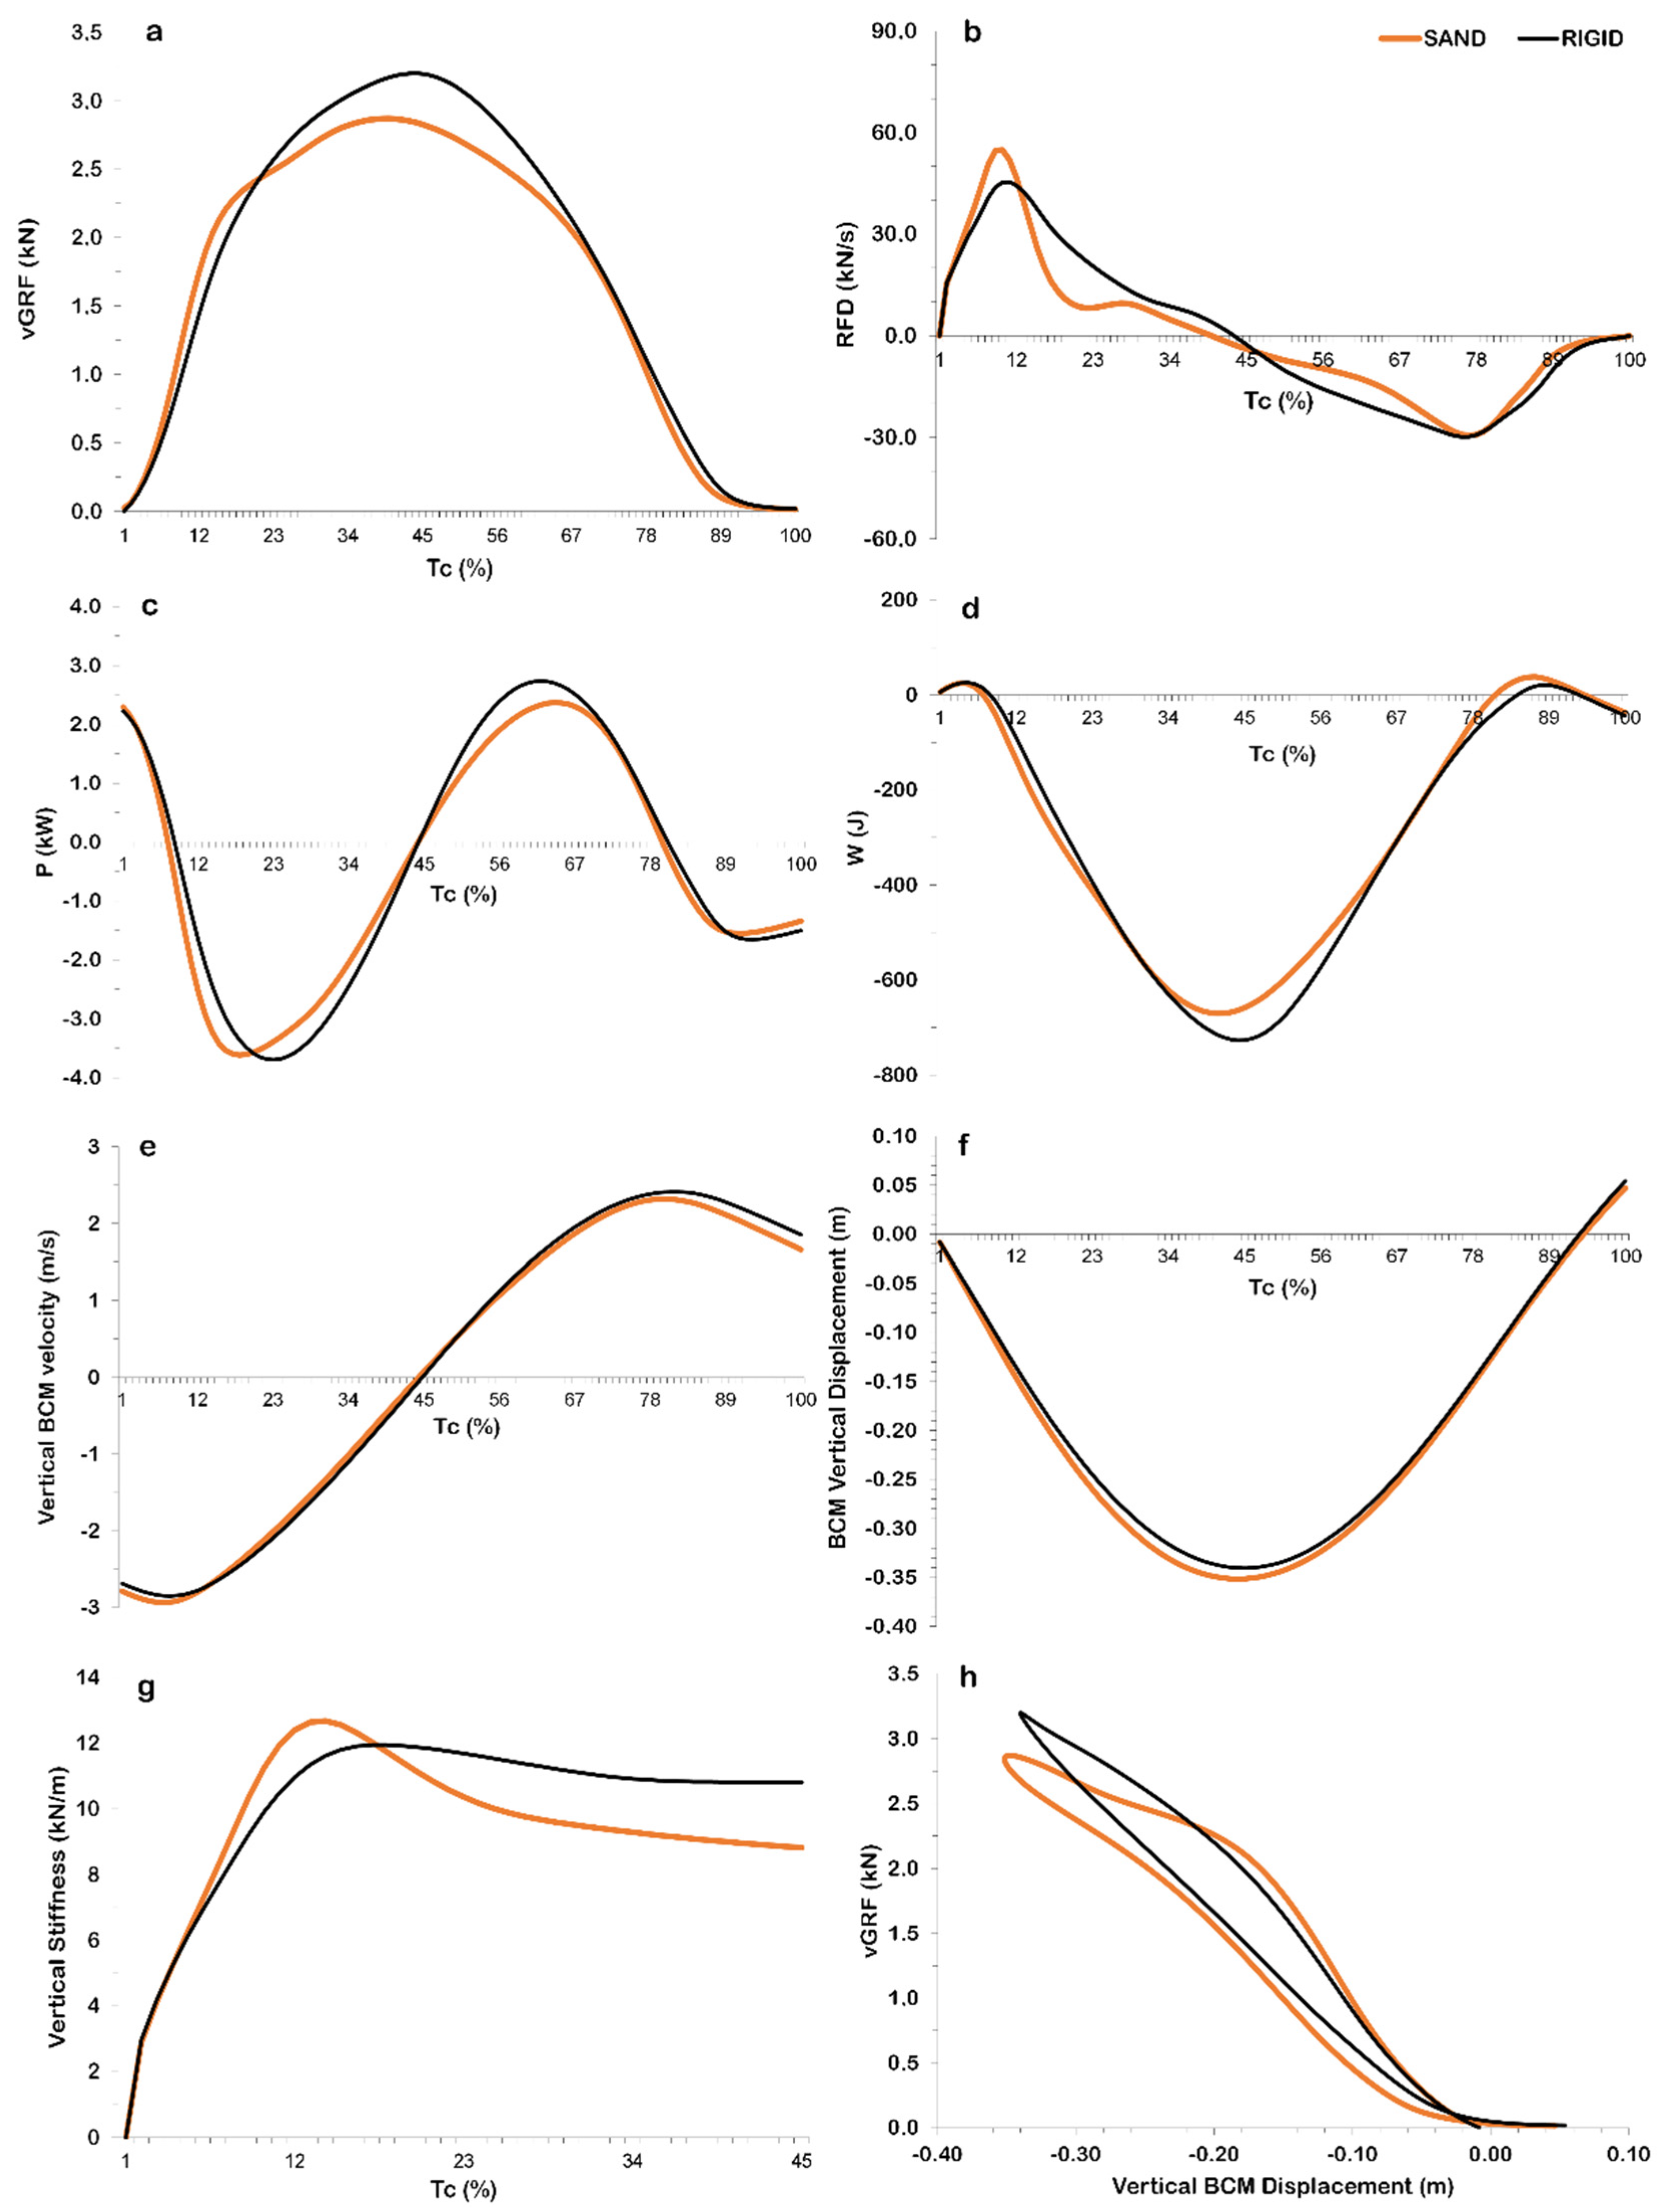
- Kinetic parameters: GRF vertical, medio-lateral and anterio-posterior component; rate of force development (RFD); work (W); power (P).
2.4. Statistical Analyses
3. Results
4. Discussion
5. Conclusions
Author Contributions
Funding
Institutional Review Board Statement
Informed Consent Statement
Data Availability Statement
Acknowledgments
Conflicts of Interest
References
- Gaudino, P.; Gaudino, C.; Alberti, G.; Minetti, A.E. Biomechanics and predicted energetics of sprinting on sand: Hints for soccer training. J. Sci. Med. Sport 2013, 16, 271–275. [Google Scholar] [CrossRef]
- Lejeune, T.M.; Willems, P.A.; Heglund, N.C. Mechanics and energetics of human locomotion on sand. J. Exp. Biol. 1998, 201, 2071–2080. [Google Scholar] [CrossRef]
- Pinnington, H.C.; Dawson, B. The energy cost of running on grass compared to soft dry beach sand. J. Sci. Med. Sport 2001, 4, 416–430. [Google Scholar] [CrossRef]
- Pinnington, H.C.; Dawson, B. Running economy of elite surf iron men and male runners, on soft dry beach sand and grass. Eur. J. Appl. Physiol. 2001, 86, 62–70. [Google Scholar] [CrossRef]
- Zamparo, P.; Perini, R.; Orizio, C.; Sacher, M.; Ferretti, G. The energy cost of walking or running on sand. Eur. J. Appl. Physiol. Occup. Physiol. 1992, 65, 183–187. [Google Scholar] [CrossRef]
- Panebianco, G.P.; Bisi, M.C.; Mangia, A.L.; Fantozzi, S.; Stagni, R. Quantitative characterization of walking on sand inecological conditions: Speed, temporal segmentation, and variability. Gait Posture 2021, 86, 211–216. [Google Scholar] [CrossRef] [PubMed]
- Yun, S.H.; Cho, M.J.; Kwon, J.W. Comparison of forward versus backward walking on spatiotemporal and kinematic parameters on sand: A preliminary study. J. Biomech. 2021, 130, 110876. [Google Scholar] [CrossRef] [PubMed]
- Alcaraz, P.E.; Palao, J.M.; Elvira, J.L.L.; Linthorne, N.P. Effects of a sand running surface on the kinematics of sprinting at maximum velocity. Biol. Sport 2011, 28, 95–100. [Google Scholar] [CrossRef]
- Sanchez-Sanchez, J.; Martinez-Rodriguez, A.; Felipe, J.L.; Hernandez-Martin, A.; Ubago-Guisado, E.; Bangsbo, J.; Gallardo, L.; Garcia-Unanue, J. Effect of natural turf, artificial turf, and sand surfaces on sprint performance. A systematic review and meta-analysis. Int. J. Environ. Res. Public Health 2020, 17, 9478. [Google Scholar] [CrossRef]
- Impellizzeri, F.M.; Rampinini, E.; Castagna, C.; Martino, F.; Fiorini, S.; Wisloff, U. Effect of plyometric training on sand versus grass on muscle soreness and jumping and sprinting ability in soccer players. Br. J. Sports Med. 2008, 42, 42–46. [Google Scholar] [CrossRef]
- Muramatsu, S.; Fukudome, A.; Miyama, M.; Arimoto, M.; Kijima, A. Energy expenditure in maximal jumps on sand. J. Physiol. Anthropol. 2006, 25, 59–61. [Google Scholar] [CrossRef] [Green Version]
- Smith, R. Movement in the sand: Training implications for beach volleyball. Strength Cond. J. 2006, 28, 19–21. [Google Scholar] [CrossRef]
- Binnie, M.J.; Dawson, B.; Pinnington, H.; Landers, G.; Peeling, P. Sand training: A review of current research and practical applications. J. Sports Sci. 2014, 32, 8–15. [Google Scholar] [CrossRef] [PubMed]
- Ahmadi, M.; Nobari, H.; Ramirez-Campillo, R.; Pérez-Gómez, J.; Ribeiro, A.L.d.A.; Martínez-Rodríguez, A. Effects of plyometric jump training in sand or rigid surface on jump-related biomechanical variables and physical fitness in female volleyball players. Int. J. Environ. Res. Public Health 2021, 18, 13093. [Google Scholar] [CrossRef]
- Balasas, D.G.; Christoulas, K.; Stefanidis, P.; Vamvakoudis, E.; Bampouras, T. The effect of beach volleyball training on muscle performance of indoor volleyball players. J. Sports Med. Phys. Fitness 2018, 58, 1240–1246. [Google Scholar] [CrossRef]
- Gortsila, E.; Theos, A.; Nesic, G.; Maridaki, M. Effect of training surface on agility and passing skills of prepubescent female volleyball players. J. Sports Med. Doping Stud. 2013, 3, 1000128. [Google Scholar] [CrossRef] [Green Version]
- Sebastia-Amat, S.; Ardigò, L.P.; Jimenez-Olmedo, J.M.; Pueo, B.; Penichet-Tomas, A. The effect of balance and sand training on postural control in elite beach volleyball players. Int. J. Environ. Res. Public Health 2020, 17, 8981. [Google Scholar] [CrossRef] [PubMed]
- Suresh, T.N.; Jayalakshmi, T.; Begu, R.; Meeran, N.; Sivakumar, V.P.R. Effect of plyometric exercise training on vertical jump height between ground and sand surface in male volleyball players. Int. J. Pharma. Biol. Sci. 2017, 8, 163–169. [Google Scholar]
- Trajkovic, N.; Sporis, G.; Kristicevic, T. Does training on sand during off-season improves physical performance in indoor volleyball players? Acta Kinesiol. 2016, 10, 107–111. [Google Scholar]
- Mirzaei, B.; Asghar Norasteh, A.; Saez de Villarreal, E.; Asadi, A. Effects of six weeks of depth jump vs. countermovement jump training on sand on muscle soreness and performance. Kinesiology 2014, 46, 97–108. [Google Scholar]
- Mirzaei, B.; Norasteh, A.A.; Asadi, A. Neuromuscular adaptations to plyometric training: Depth jump vs. countermovement jump on sand. Sport Sci. Health 2013, 9, 145–149. [Google Scholar] [CrossRef]
- Bobbert, M.F. Drop jumping as a training method for jumping ability. Sports Med. 1990, 9, 7–22. [Google Scholar] [CrossRef] [PubMed]
- Ziv, G.; Lidor, R. Vertical jump in female and male volleyball players: A review of observational and experimental studies. Scand. J. Med. Sci. Sports 2010, 20, 556–567. [Google Scholar] [CrossRef]
- LaStayo, P.C.; Woolf, J.M.; Lewek, M.D.; Snyder-Macler, L.; Reich, T.E.; Lindstedt, S.L. Eccentric muscle contractions: Their contribution to injury, prevention, rehabilitation, and sport. J. Orthop. Sports Phys. Ther. 2003, 33, 557–571. [Google Scholar] [CrossRef] [Green Version]
- Pearson, S.J.; McMahon, J. Lower limb mechanical properties: Determining factors and implications for performance. Sports Med. 2012, 42, 929–940. [Google Scholar] [CrossRef] [PubMed]
- Walshe, A.D.; Wilson, G.J.; Ettema, G.J. Stretch-shorten cycle compared with isometric preload: Contributions to enhanced muscular performance. J. Appl. Physiol. 1998, 84, 97–106. [Google Scholar] [CrossRef] [Green Version]
- Arampatzis, A.; Schade, F.; Walsh, M.; Bruggemann, G.P. Influence of leg stiffness and its effect on myodynamic jumping performance. J. Electromyogr. Kinesiol. 2001, 11, 355–364. [Google Scholar] [CrossRef]
- Bojsen-Mοller, J.; Magnusson, S.P.; Rasmussen, L.R.; Kjaer, M.; Aagaard, P. Muscle performance during maximal isometric and dynamic contractions is influenced by the stiffness of the tendinous structures. J. Appl. Physiol. 2005, 99, 986–994. [Google Scholar] [CrossRef] [Green Version]
- Bishop, D.A. Comparison between land and sand-based tests for beach volleyball assessment. J. Sports Med. Phys. Fitness 2003, 43, 418–423. [Google Scholar]
- Giatsis, G.; Pérez-Turpin, J.A.; Hatzimanouil, D. Analysis of time characteristics, jump patters and technical-tactical skills of beach volley men’s final in Rio Olympics 2016. J. Hum. Sport Exerc. 2020, 15, S1013–S1019. [Google Scholar] [CrossRef]
- Ricarte Batista, G.; Freire De Araujo, R.; Oliveira Guerra, R. Comparison between vertical jumps of high performance athletes on the Brazilian men’s beach volleyball team. J. Sports Med. Phys. Fitness 2008, 48, 172–176. [Google Scholar]
- Schmidt, M.; Meyer, E.; Jaitner, T. Quantifying jump-specific loads in beach volleyball by an inertial measurement device. Int. J. Sports Sci. Coach. 2021, 16, 391–397. [Google Scholar] [CrossRef]
- Bisciotti, G.N.; Ruby, A.; Jaquemod, C. Biomechanics of jumps in the volleyball and in the beach-volley. Riv. Cult. Sport. 2001, 20, 29–34. [Google Scholar]
- Miyama, M.; Nosaka, K. Influence of surface on muscle damage and soreness induced by consecutive drop jumps. J. Strength Cond. Res. 2004, 18, 206–211. [Google Scholar] [CrossRef]
- Giatsis, G.; Kollias, I.; Panoutsakopoulos, V.; Papaiakovou, G. Biomechanical differences in elite beach-volleyball players in vertical squat jump on rigid and sand surface. Sports Biomech. 2004, 3, 145–158. [Google Scholar] [CrossRef] [PubMed]
- Giatsis, G.; Panoutsakopoulos, V.; Kollias, I.A. Biomechanical differences of arm swing countermovement jumps on sand and rigid surface performed by elite beach volleyball players. J. Sports Sci. 2018, 36, 997–1008. [Google Scholar] [CrossRef] [PubMed]
- Faul, F.; Erdfelder, E.; Lang, A.G.; Buchner, A. G* Power 3: A flexible statistical power analysis program for the social, behavioral, and biomedical sciences. Behav. Res. Methods 2007, 39, 175–191. [Google Scholar] [CrossRef]
- Bobbert, M.F.; Huijing, P.A.; van Ingen Schenau, G.J. Drop jumping. II. The influence of dropping height on the biomechanics of drop jumping. Med. Sci. Sports Exerc. 1987, 19, 339–346. [Google Scholar] [CrossRef]
- McKinley, P.; Pedotti, A. Motor strategies in landing from a jump: The role of skill in task execution. Exp. Brain Res. 1992, 90, 427–440. [Google Scholar] [CrossRef]
- Kollias, I.; Panoutsakopoulos, V.; Papaiakovou, G. Comparing jumping ability among athletes of various sports: Vertical drop jumping from 60 centimeters. J. Strength Cond. Res. 2004, 18, 546–550. [Google Scholar] [CrossRef]
- Baca, A. A comparison of methods for analyzing drop jump performance. Med. Sci. Sports Exerc. 1999, 31, 437–442. [Google Scholar] [CrossRef] [PubMed]
- Brughelli, M.; Cronin, J. A review of research on the mechanical stiffness in running and jumping: Methodology and implications. Scand. J. Med. Sci. Sports 2008, 18, 417–426. [Google Scholar] [CrossRef]
- Cohen, J. Statistical Power Analysis for the Behavioral Sciences, 2nd ed.; Lawrence Erlbaum Associates Publishers: Hillsdale, NJ, USA, 1988. [Google Scholar]
- Struzik, A.; Zawadzki, J. Application of force-length curve for determination of leg stiffness during a vertical jump. Acta Bioeng. Biomech. 2016, 18, 163–170. [Google Scholar] [CrossRef] [PubMed]
- Arianasab, H.; Mohammadipour, F.; Amiri-Khorasani, M. Comparison of knee joint kinematics during a countermovement jump among different sports surfaces in male soccer players. Sci. Med. Footb. 2017, 1, 74–79. [Google Scholar] [CrossRef]
- Buscà, B.; Alique, D.; Salas, C.; Hileno, R.; Pena, J.; Morales, J.; Bantulà, J. Relationship between agility and jump ability in amateur beach volleyball male players. Int. J. Perform. Anal. Sport 2015, 15, 1102–1113. [Google Scholar] [CrossRef]
- Laffaye, G.; Bardy, B.; Taiar, R. Upper-limb motion and drop jump: Effect of expertise. J. Sports Med. Phys. Fitness 2006, 46, 536–543. [Google Scholar]
- Laffaye, G.; Choukou, M.A. Gender bias in the effect of dropping height on jumping performance in volleyball players. J. Strength Cond. Res. 2010, 24, 2143–2148. [Google Scholar] [CrossRef]
- Ferreira, L.C.; Weiss, L.W.; Hammond, K.G.; Schilling, B.K. Structural and functional predictors of drop vertical jump. J. Strength Cond. Res. 2010, 24, 2456–2467. [Google Scholar] [CrossRef]
- Pietraszewski, B.; Rutkowska-Kucharska, A. Relative power of lower limbs in drop jump. Acta Bioeng. Biomech. 2011, 13, 13–18. [Google Scholar]
- Viitasalo, J.T.; Salo, A.; Lahtinen, J. Neuromuscular functioning of athletes and non-athletes in the drop jump. Eur. J. Appl. Physiol. Occup. Physiol. 1998, 78, 432–440. [Google Scholar] [CrossRef]
- Walsh, M.; Arampatzis, A.; Schade, F.; Brüggemann, G.P. The effect of drop jump starting height and contact time on power, work performed, and moment of force. J. Strength Cond. Res. 2004, 18, 561–566. [Google Scholar] [CrossRef] [PubMed]
- Young, W.B.; Wilson, C.J.; Byrne, C. A comparison of drop jump training methods: Effects on leg extensor strength qualities and jumping performance. Int. J. Sports Med. 1999, 20, 295–303. [Google Scholar] [CrossRef] [PubMed]
- Dal Bello, F.; Aedo Muñoz, E.; Gomes Moreira, D.; Brito, C.J.; Miarka, B.; Navarro Cabello, E. Beach and indoor volleyball athletes present similar muscular activation of lower limbs during the countermovement jump. Hum. Mov. 2019, 21, 43–50. [Google Scholar] [CrossRef]
- Binnie, M.J.; Dawson, B.; Pinnington, H.; Landers, G.; Peeling, P. Part 2: Effect of training surface on acute physiological responses after sport-specific training. J. Strength Cond. Res. 2013, 27, 1057–1066. [Google Scholar] [CrossRef] [PubMed]
- De Sire, A.; Marotta, N.; Demeco, A.; Moggio, L.; Paola, P.; Marotta, M.; Iona, T.; Invernizzi, M.; Leigheb, M.; Ammendolia, A. Electromyographic assessment of anterior cruciate ligament injury risk in male tennis players: Which role for visual input? A proof-of-concept study. Diagnostics 2021, 11, 997. [Google Scholar] [CrossRef]
- Horita, T.; Komi, P.; Nicol, C.; Kyrolainen, H. Interaction between pre-landing activities and stiffness regulation of the knee joint musculoskeletal system in the drop jump: Implications to performance. Eur. J. Appl. Physiol. 2002, 88, 76–84. [Google Scholar] [CrossRef]
- Rojano Ortega, D.; Berral-Aguilar, A.J.; Berral de la Rosa, F.J. Kinetics and vertical stiffness of female volleyball players: Effect of low-intensity plyometric training. Res. Q. Exerc. Sport 2021. (accepted and published on-line). [Google Scholar] [CrossRef]
- Arampatzis, A.; Stafilidis, S.; Morey-Klapsing, G.; Brüggemann, G.P. Interaction of the human body and surfaces of different stiffness during drop jumps. Med. Sci. Sports Exerc. 2004, 36, 451–459. [Google Scholar] [CrossRef]
- Arampatzis, A.; Bruggemann, G.P.; Morey-Klapsing, G.M. Leg stiffness and mechanical energetic processes during jumping on a sprung surface. Med. Sci. Sports Exerc. 2001, 33, 923–931. [Google Scholar] [CrossRef]
- Butler, R.J.; Crowell III, H.P.; Davis, I.M. Lower extremity stiffness: Implications for performance and injury. Clin. Biomech. 2003, 18, 511–517. [Google Scholar] [CrossRef]
- Hewett, T.E.; Lindenfeld, T.N.; Riccobene, J.V.; Noyes, F.R. The effect of neuromuscular training on the incidence of knee injury in female athletes. Am. J. Sports Med. 1999, 27, 699–706. [Google Scholar] [CrossRef]
- Walshe, A.D.; Wilson, G.J. The influence of musculotendinous stiffness on drop jump performance. Can. J. Appl. Physiol. 1997, 22, 117–132. [Google Scholar] [CrossRef] [PubMed]
- Papaiakovou, G.; Katsikas, F.; Nikodelis, T.; Panoutsakopoulos, V.; Kollias, I. Influence of the ankle joint dorsiflexion on the execution of vertical jumps. In Proceedings of the XXIV International Symposium on Biomechanics in Sports, Salzburg, Austria, 14–18 July 2006; Schwameder, H., Strutzenberger, G., Fastenbauer, V., Lindinger, S., Muller, E., Eds.; University of Salzburg: Salzburg, Austria, 2006; Volume 1, pp. 448–451. [Google Scholar]
- Hollville, E.; Rabita, G.; Guilhem, G.; Lecompte, J.; Nordez, A. Effects of surface properties on gastrocnemius medialis and vastus lateralis fascicle mechanics during maximal countermovement jumping. Front. Physiol. 2020, 11, 917. [Google Scholar] [CrossRef]
- Bonavolontà, V.; Carvutto, R.; Di Gioia, A.; De Candia, M. Plyometric training on sand versus grass: Effects on sprinting, jumping, agility and balance in soccer players. J. Hum. Sport Exerc. 2021, 16, S1104–S1113. [Google Scholar] [CrossRef]
- Hammami, M.; Bragazzi, N.L.; Hermassi, S.; Gaamouri, N.; Aouadi, R.; Shephard, R.J.; Chelly, M.S. The effect of a sand surface on physical performance responses of junior male handball players to plyometric training. BMC Sports Sci. Med. Rehab. 2020, 12, 26. [Google Scholar] [CrossRef] [PubMed]
- Pereira, L.A.; Freitas, T.T.; Marín-Cascales, E.; Bishop, C.; McGuigan, M.R.; Loturco, I. Effects of training on sand or hard surfaces on sprint and jump performance of team-sport players: A systematic review with meta-analysis. Strength Cond. J. 2021, 43, 56–66. [Google Scholar] [CrossRef]
- Brown, H.; Dawson, B.; Binnie, M.J.; Pinnington, H.; Sim, M.; Clemons, T.D.; Peeling, P. Sand training: Exercise-induced muscle damage and inflammatory responses to matched-intensity exercise. Eur. J. Sport Sci. 2017, 17, 741–747. [Google Scholar] [CrossRef]
- Richardson, M.C.; Murphy, S.; Macpherson, T.; English, B.; Spears, I.; Chesterton, P. Effect of sand on knee load during a single-leg jump task: Implications for injury prevention and rehabilitation programs. J. Strength Cond. Res. 2020, 34, 3164–3172. [Google Scholar] [CrossRef] [Green Version]
- Binnie, M.J.; Dawson, B.; Arnot, M.A.; Pinnington, H.; Landers, G.; Peeling, P. Effect of sand versus grass training surfaces during an 8-week pre-season conditioning programme in team sport athletes. J. Sports Sci. 2014, 32, 1001–1012. [Google Scholar] [CrossRef]
- Binnie, M.J.; Dawson, B.; Pinnington, H.; Landers, G.; Peeling, P. Effect of surface-specific training on 20 m sprint performance on sand and grass surfaces. J. Strength Cond. Res. 2013, 27, 3515–3520. [Google Scholar] [CrossRef]


| Parameter | RIGID | SAND | MD | SE | t | p | d |
|---|---|---|---|---|---|---|---|
| Center of Mass displacement (cm) | |||||||
| Jump height (hJUMP) | 27.9 ± 4.2 | 24.4 ± 4.8 | 3.5 | 0.9 | 3.933 | 0.001 * | 0.78 |
| Downward phase | −33.8 ± 12.2 | −33.9 ± 8.8 | 0.1 | 2.0 | 0.031 | 0.976 | 0.01 |
| Upward phase | 39.3 ± 12.6 | 38.6 ± 12.6 | 0.6 | 0.2 | 0.319 | 0.754 | 0.06 |
| Temporal (ms) | |||||||
| Contact time | 408.4 ± 135.5 | 430.4 ± 121.3 | 22.0 | 15.8 | 1.396 | 0.183 | 0.17 |
| Downward time | 186.1 ± 72.8 | 192.0 ± 60.1 | 5.9 | 8.7 | 0.673 | 0.511 | 0.09 |
| tvGRF | 175.3 ± 82.4 | 155.3 ± 51.9 | 19.9 | 22.1 | 0.901 | 0.382 | 0.29 |
| tP | 280.9 ± 126.2 | 294.8 ± 110.5 | 13.9 | 14.2 | 0.977 | 0.344 | 0.12 |
| Parameter | RIGID | SAND | MD | SE | t | p | d |
|---|---|---|---|---|---|---|---|
| Peak Ground Reaction Force (kN) | |||||||
| Vertical (vGRF; net force) | 2.48 ± 0.84 | 2.14 ± 0.56 | 0.43 | 0.15 | 2.359 | 0.032 * | 0.48 |
| Anterior–Posterior (xGRF) | 0.36 ± 0.05 | 0.37 ± 0.08 | 0.01 | 0.03 | 0.205 | 0.841 | 0.15 |
| Mediolateral (yGRF) | 0.11 ± 0.04 | 0.11 ± 0.04 | 0.01 | 0.01 | 0.498 | 0.627 | 0.14 |
| Peak Rate of Force Development (kN/s) | |||||||
| Downward phase | −53.3 ± 14.0 | −71.6 ± 25.1 | 18.3 | 5.6 | 3.248 | 0.005 * | 0.90 |
| Upward phase | 44.0 ± 11.6 | 40.1 ± 6.7 | 3.8 | 2.6 | 1.471 | 0.161 | 0.41 |
| Peak Power (kW) | |||||||
| Downward phase | −4.2 ± 1.2 | −4.3 ± 1.2 | 0.1 | 0.2 | 0.776 | 0.289 | 0.08 |
| Upward phase | 3.1 ± 1.0 | 2.6 ± 0.6 | 0.5 | 0.2 | 2.245 | 0.040 * | 0.61 |
| Peak Work (J) | |||||||
| Downward phase | −738.4 ± 110.7 | −662.6 ±89.2 | 75.8 | 21.5 | 3.518 | 0.003 * | 1.36 |
| Upward phase | 778.1 ± 98.6 | 713.3 ± 86.3 | 64.8 | 26.6 | 2.535 | 0.023 * | 0.70 |
| Stiffness (kN/m) | |||||||
| Peak Vertical stiffness | 11.6 ± 4.0 | 12.6 ± 3.9 | 0.8 | 0.8 | 1.061 | 0.305 | 0.25 |
| Peak Leg stiffness | 8.6 ± 4.9 | 5.1 ± 3.8 | 3.5 | 1.5 | 2.367 | 0.032 * | 0.79 |
| Average Leg stiffness | 3.8 ± 2.9 | 4.0 ± 3.9 | 0.2 | 0.9 | 0.198 | 0.846 | 0.06 |
| Parameter | RIGID | SAND | MD | SE | t | p | d |
|---|---|---|---|---|---|---|---|
| Downward phase | |||||||
| ROMANKLE | 30.30 ± 10.69 | 37.16 ± 12.51 | 6.86 | 3.94 | 1.742 | 0.102 | 0.59 |
| ROMKNEE | 42.20 ± 16.84 | 57.21 ± 14.85 | 15.01 | 3.79 | 3.965 | 0.001 * | 0.95 |
| ROMHIP | 23.93 ± 26.37 | 31.52 ± 18.78 | 7.59 | 5.86 | 1.294 | 0.215 | 0.33 |
| ωANKLE | −6.12 ± 1.74 | −5.03 ± 1.76 | 1.09 | 0.50 | 2.168 | 0.047 * | 0.62 |
| ωKNEE | −7.38 ± 1.45 | −7.15 ± 0.88 | 0.23 | 0.39 | 0.582 | 0.569 | 0.19 |
| ωHIP | −4.05 ± 1.92 | −4.23 ± 1.51 | 0.19 | 0.37 | 0.499 | 0.625 | 0.10 |
| Upward phase | |||||||
| ROMANKLE | 64.40 ± 11.66 | 65.84 ± 11.27 | 1.44 | 2.02 | 0.713 | 0.487 | 0.13 |
| ROMKNEE | 72.93 ± 17.14 | 73.65 ± 14.96 | 0.72 | 2.90 | 0.248 | 0.807 | 0.05 |
| ROMHIP | 66.13 ± 25.18 | 69.33 ± 18.98 | 3.20 | 5.04 | 0.634 | 0.536 | 0.14 |
| ωANKLE | 10.24 ± 1.82 | 9.62 ± 1.21 | 0.63 | 0.36 | 1.735 | 0.103 | 0.40 |
| ωKNEE | 10.16 ± 1.29 | 10.27 ± 0.72 | 0.11 | 0.26 | 0.410 | 0.687 | 0.11 |
| ωHIP | 8.41 ± 1.13 | 8.14 ± 0.98 | 0.27 | 0.23 | 1.164 | 0.263 | 0.26 |
Publisher’s Note: MDPI stays neutral with regard to jurisdictional claims in published maps and institutional affiliations. |
© 2022 by the authors. Licensee MDPI, Basel, Switzerland. This article is an open access article distributed under the terms and conditions of the Creative Commons Attribution (CC BY) license (https://creativecommons.org/licenses/by/4.0/).
Share and Cite
Giatsis, G.; Panoutsakopoulos, V.; Kollias, I.A. Drop Jumping on Sand Is Characterized by Lower Power, Higher Rate of Force Development and Larger Knee Joint Range of Motion. J. Funct. Morphol. Kinesiol. 2022, 7, 17. https://0-doi-org.brum.beds.ac.uk/10.3390/jfmk7010017
Giatsis G, Panoutsakopoulos V, Kollias IA. Drop Jumping on Sand Is Characterized by Lower Power, Higher Rate of Force Development and Larger Knee Joint Range of Motion. Journal of Functional Morphology and Kinesiology. 2022; 7(1):17. https://0-doi-org.brum.beds.ac.uk/10.3390/jfmk7010017
Chicago/Turabian StyleGiatsis, George, Vassilios Panoutsakopoulos, and Iraklis A. Kollias. 2022. "Drop Jumping on Sand Is Characterized by Lower Power, Higher Rate of Force Development and Larger Knee Joint Range of Motion" Journal of Functional Morphology and Kinesiology 7, no. 1: 17. https://0-doi-org.brum.beds.ac.uk/10.3390/jfmk7010017