No Evidence of Reduced Contrast Sensitivity in Migraine-with-Aura for Large, Narrowband, Centrally Presented Noise-Masked Stimuli


Abstract
:1. Introduction
1.1. Background
1.2. Contrast Sensitivity
1.3. Noise
1.4. Relation between Neural Noise, Contrast Sensitivity and Aura
1.5. Spatial Frequency—Which Spatial Scales of Processing Are Affected?
1.6. The Current Study
2. Methods
2.1. Participants
2.2. Apparatus
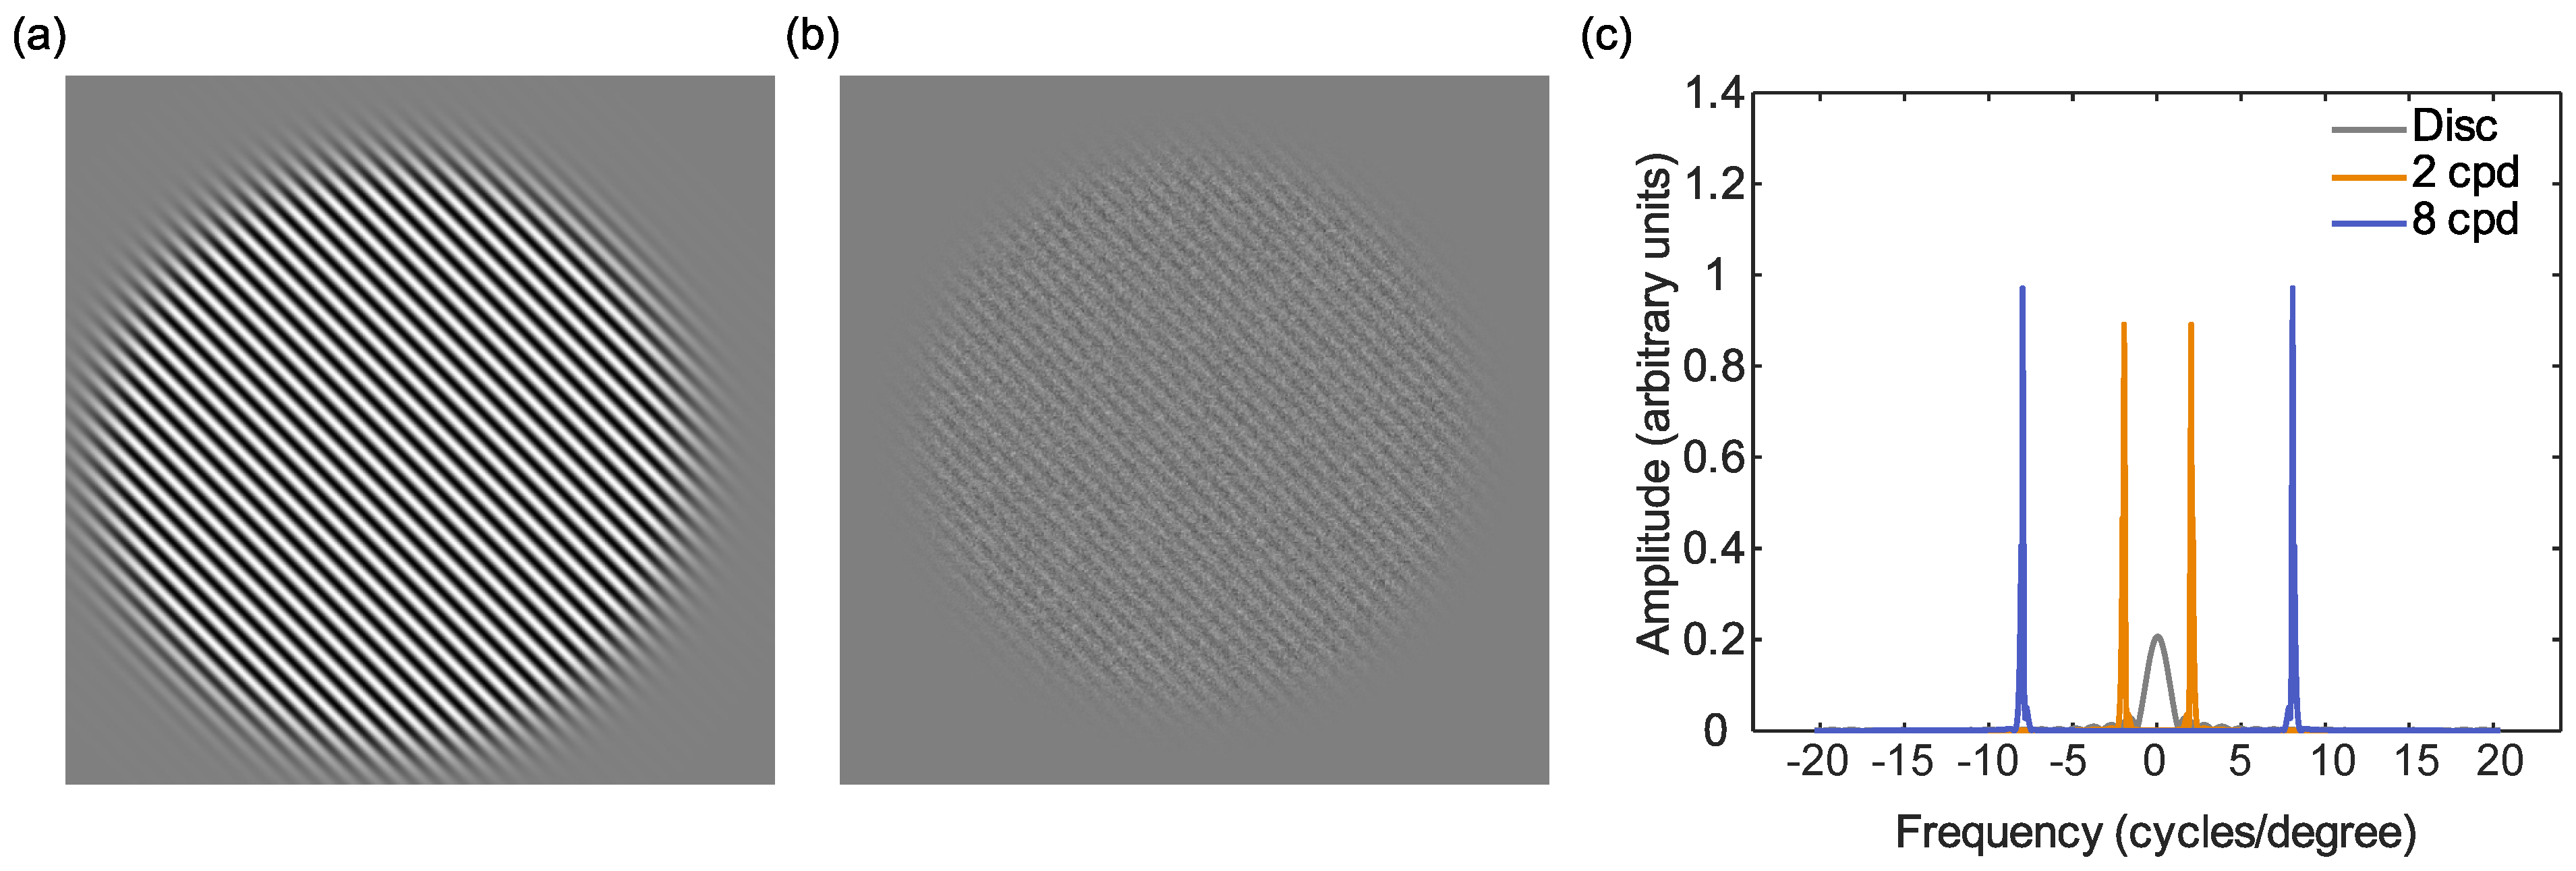
2.3. Stimuli
2.4. Procedure
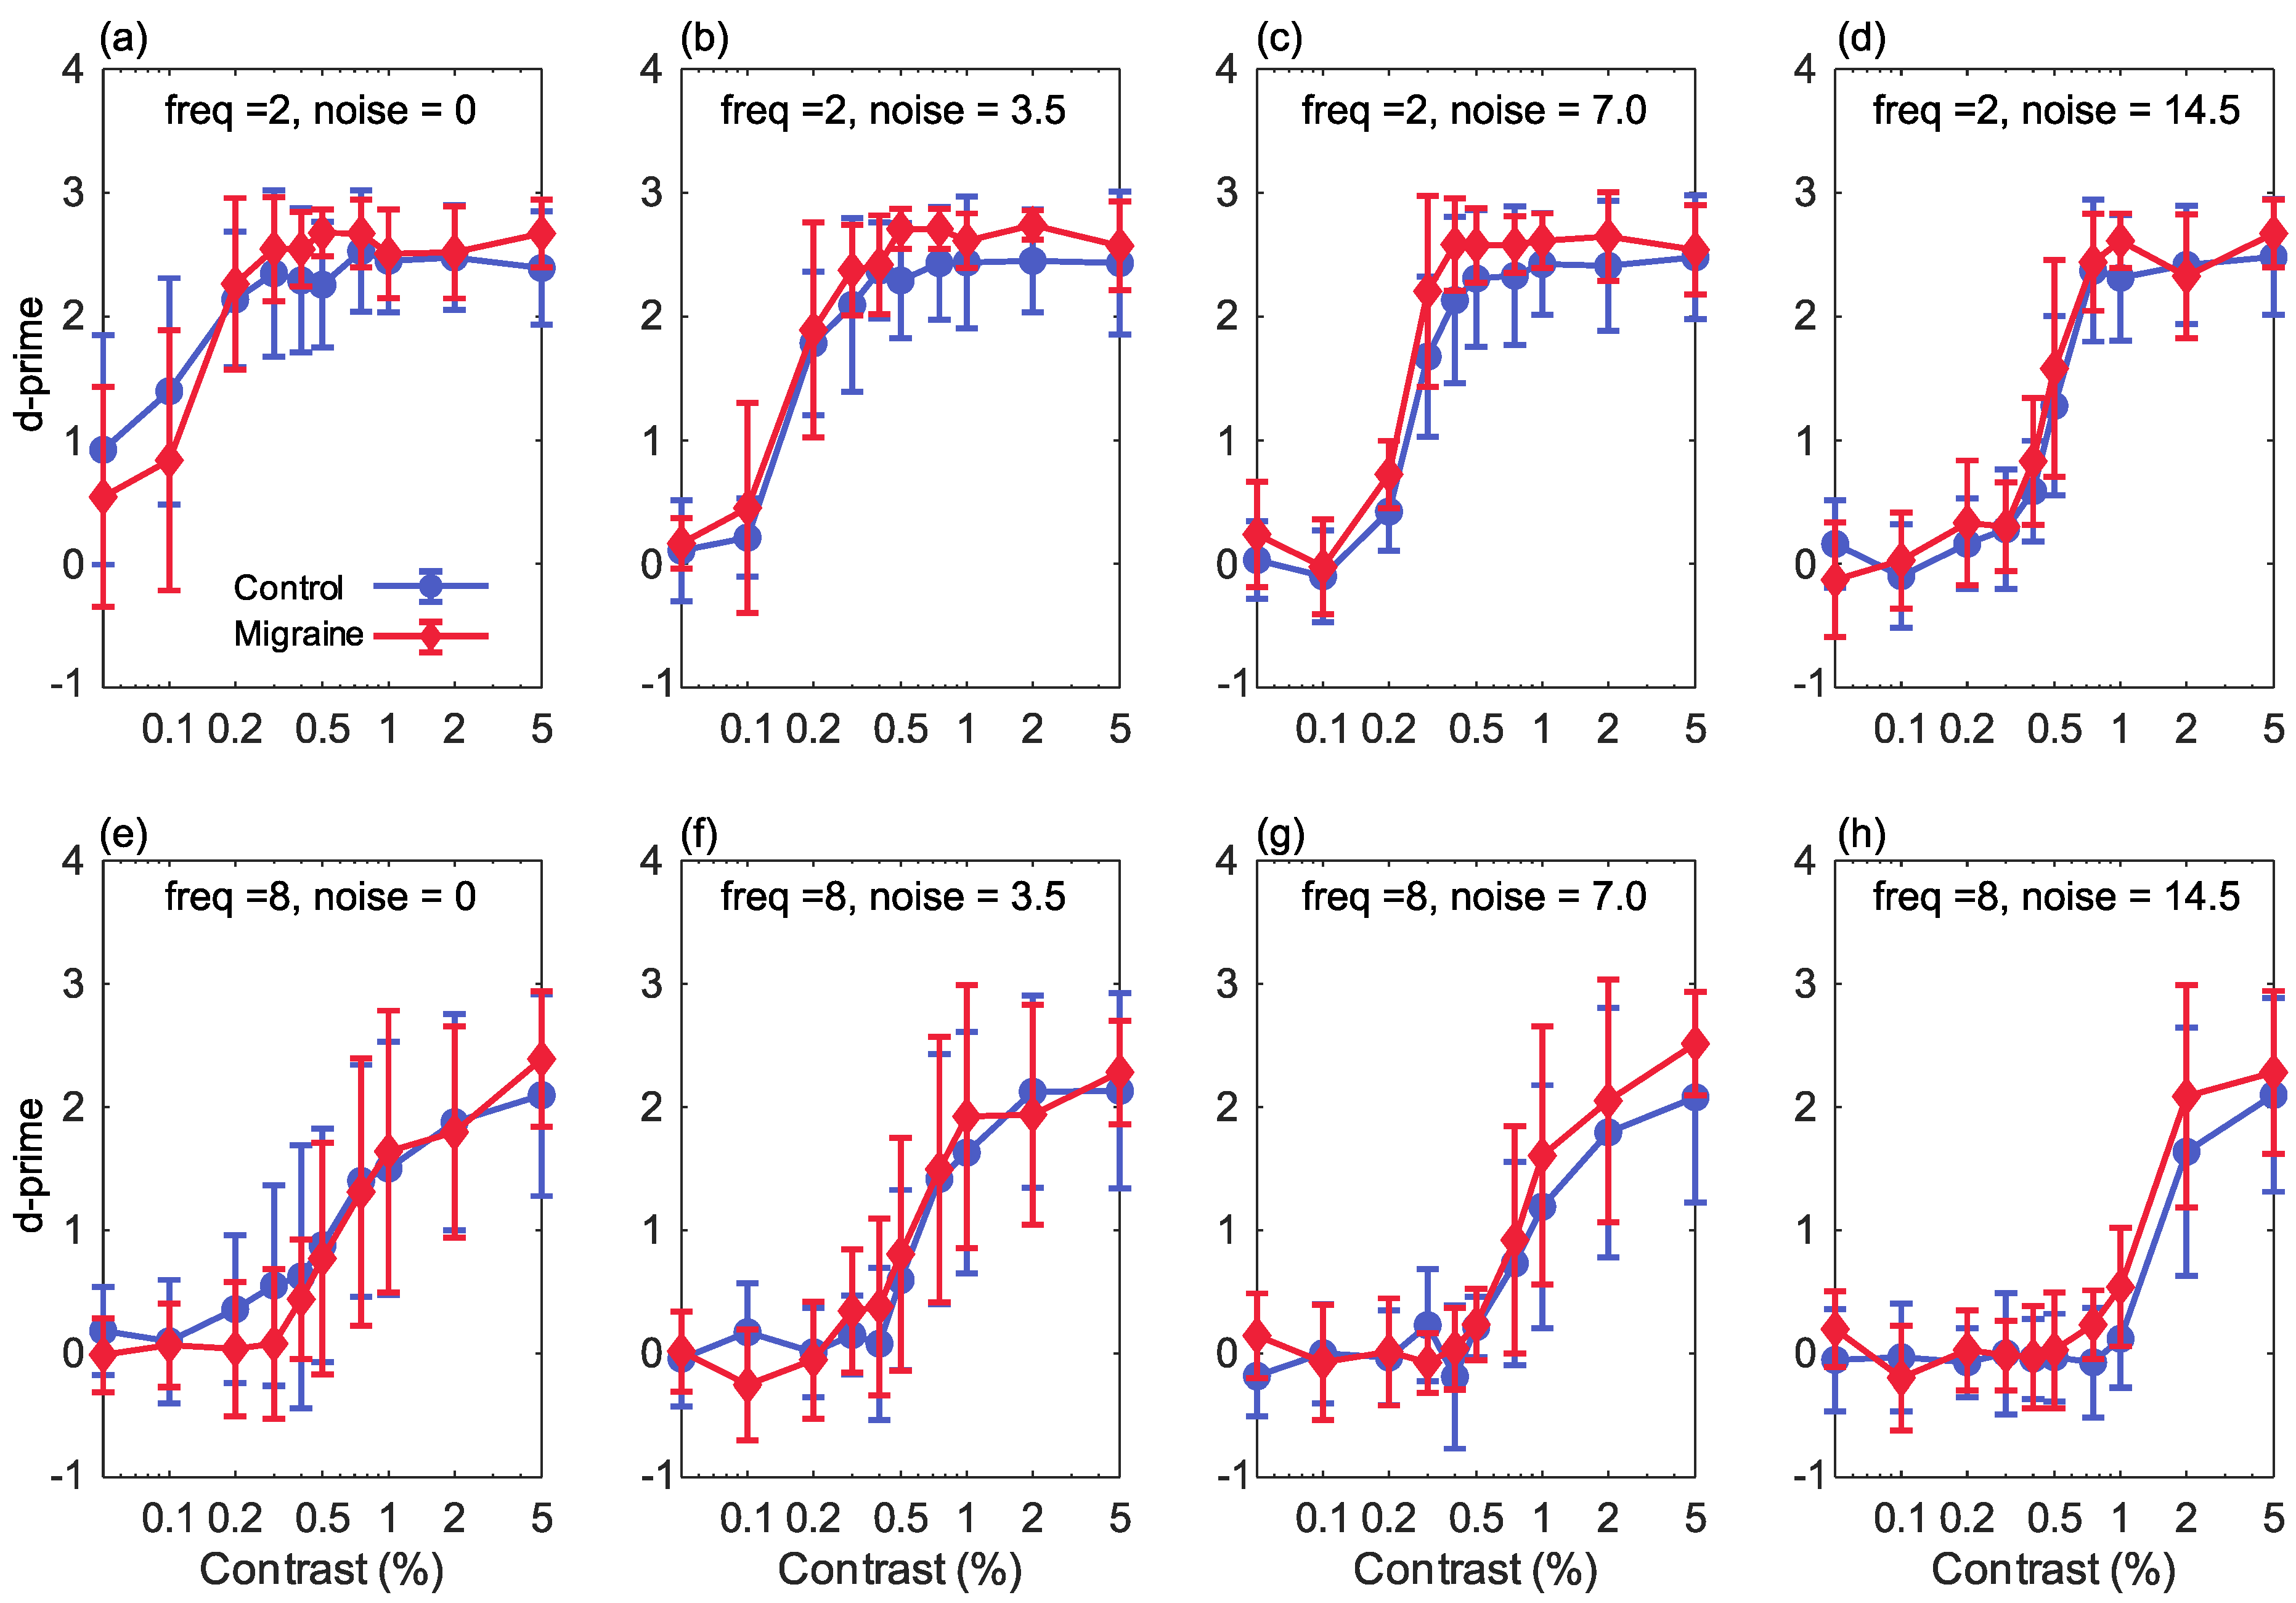
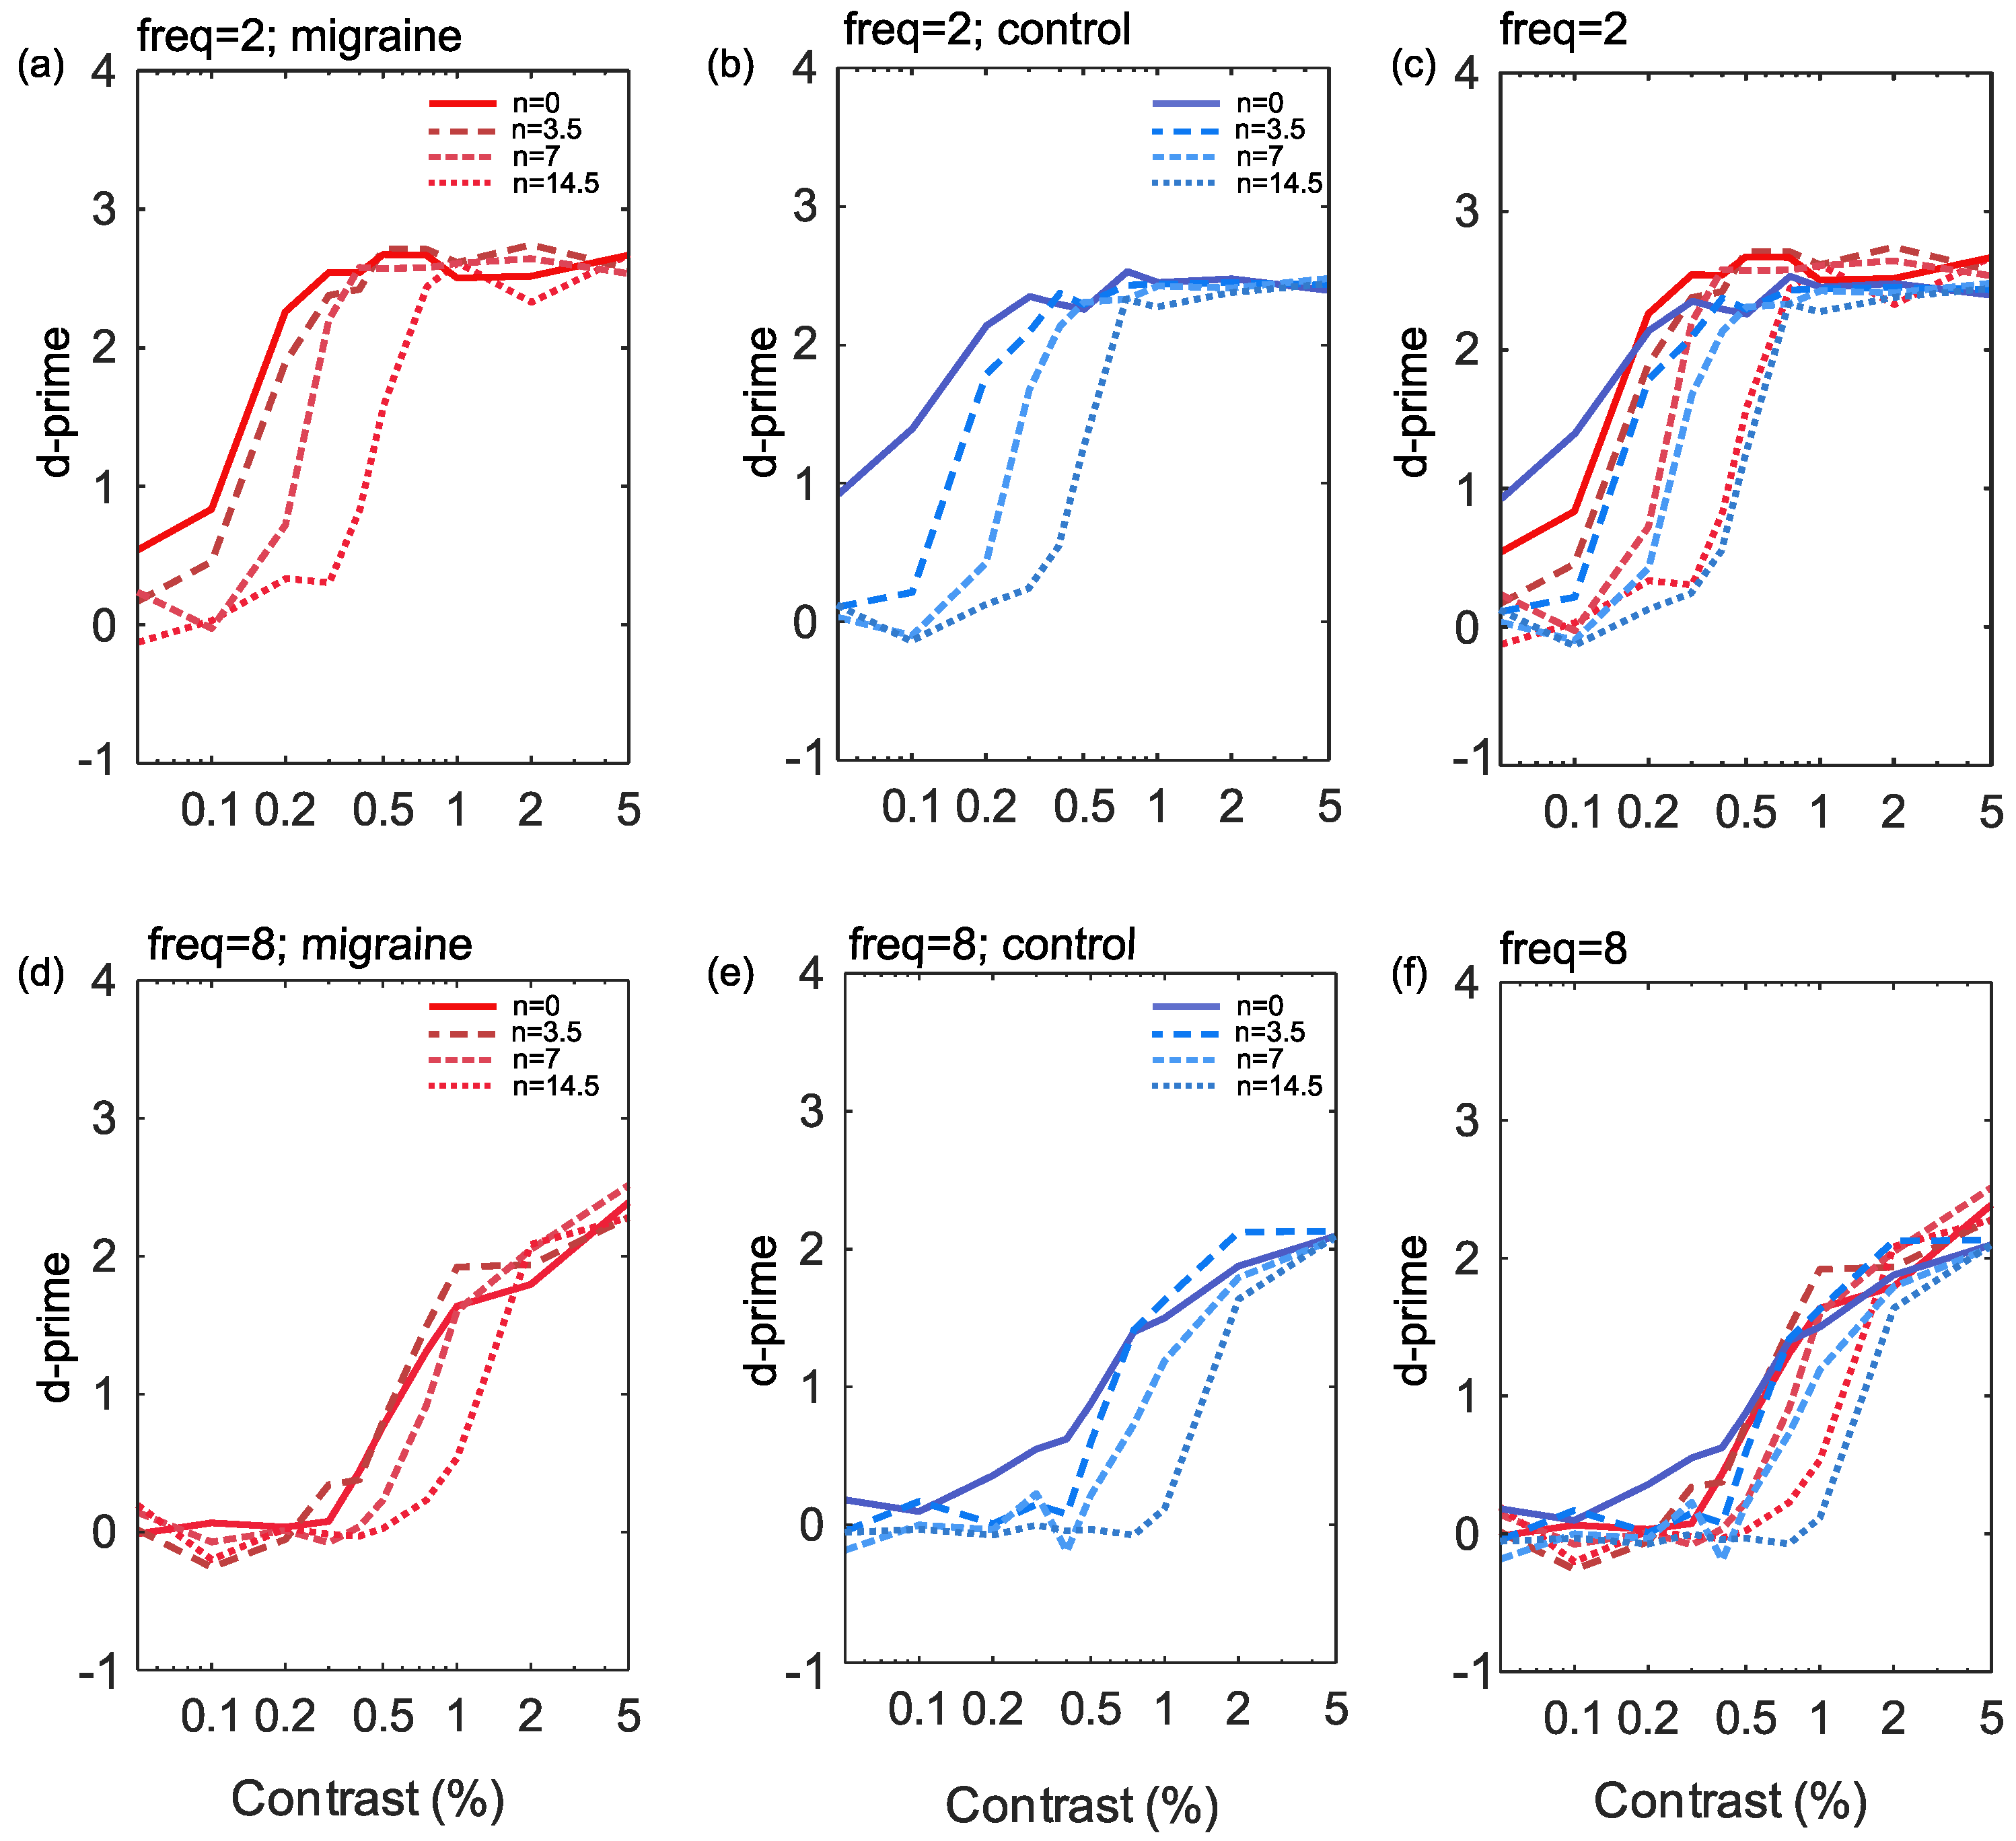
3. Results
4. Discussion
4.1. Interpreting the Contrast Response Functions
4.2. Effects of Increasing Noise Levels
4.3. Migraine Duration
4.4. Conclusions
Author Contributions
Funding
Institutional Review Board Statement
Informed Consent Statement
Data Availability Statement
Conflicts of Interest
Abbreviations
| cpd | cycles per degree |
| CRF | Contrast Response Function |
| EEG | Electroencephalogram |
| LAM | Linear Amplifier Model |
| VEP | Visual Evoked Potential |
References
- Olesen, J.; Bes, A.; Kunkel, R.; Lance, J.W.; Nappi, G.; Pfaffenrath, V.; Rose, F.C.; Schoenberg, B.S.; Soyka, D.; Tfelt-Hansen, P.; et al. The international classification of headache disorders, (beta version). Cephalalgia 2013, 33, 629–808. [Google Scholar]
- Aiba, S.; Tatsumoto, M.; Saisu, A.; Iwanami, H.; Chiba, K.; Senoo, T.; Hirata, K. Prevalence of typical migraine aura without headache in Japanese ophthalmology clinics. Cephalalgia 2010, 30, 962–967. [Google Scholar] [CrossRef]
- Goadsby, P.J.; Holland, P.R.; Martins-Oliveira, M.; Hoffmann, J.; Schankin, C.; Akerman, S. Pathophysiology of migraine: A disorder of sensory processing. Physiol. Rev. 2017, 97, 553–622. [Google Scholar] [CrossRef]
- Russell, M.; Rasmussen, B.; Thorvaldsen, P.; Olesen, J. Prevalence and sex-ratio of the subtypes of migraine. Int. J. Epidemiol. 1995, 24, 612–618. [Google Scholar] [CrossRef]
- Olesen, J. International classification of headache disorders. Lancet Neurol. 2018, 17, 396–397. [Google Scholar] [CrossRef] [Green Version]
- Queiroz, L.P.; Friedman, D.I.; Rapoport, A.M.; Purdy, R.A. Characteristics of migraine visual aura in Southern Brazil and Northern USA. Cephalalgia 2011, 31, 1652–1658. [Google Scholar] [CrossRef]
- Aurora, S.; Wilkinson, F. The brain is hyperexcitable in migraine. Cephalalgia 2007, 27, 1442–1453. [Google Scholar] [CrossRef]
- Khalil, N.M.; Legg, N.J.; Anderson, D.J. Long term decline of P100 amplitude in migraine with aura. J. Neurol. Neurosurg. Psychiatry 2000, 69, 507–511. [Google Scholar] [CrossRef] [Green Version]
- Oelkers, R.; Grosser, K.; Lang, E.; Geisslinger, G.; Kobal, G.; Brune, K.; Lötsch, J. Visual evoked potentials in migraine patients: Alterations depend on pattern spatial frequency. Brain 1999, 122, 1147–1155. [Google Scholar] [CrossRef] [Green Version]
- Shibata, K.; Yamane, K.; Nishimura, Y.; Kondo, H.; Otuka, K. Spatial frequency differentially affects habituation in migraineurs: A steady-state visual-evoked potential study. Doc. Ophthalmol. 2011, 123, 65. [Google Scholar] [CrossRef]
- Aurora, S.; Ahmad, B.; Welch, K.; Bhardhwaj, P.; Ramadan, N. Transcranial magnetic stimulation confirms hyperexcitability of occipital cortex in migraine. Neurology 1998, 50, 1111–1114. [Google Scholar] [CrossRef]
- Aurora, S.; Cao, Y.; Bowyer, S.; Welch, K. The occipital cortex is hyperexcitable in migraine: Experimental evidence. Headache J. Head Face Pain 1999, 39, 469–476. [Google Scholar] [CrossRef]
- Aurora, S.; Welch, K.; Al-Sayed, F. The threshold for phosphenes is lower in migraine. Cephalalgia 2003, 23, 258–263. [Google Scholar] [CrossRef] [PubMed]
- Mulleners, W.M.; Chronicle, E.P.; Palmer, J.E.; Koehler, P.J.; Vredeveld, J.W. Visual cortex excitability in migraine with and without aura. Headache J. Head Face Pain 2001, 41, 565–572. [Google Scholar] [CrossRef] [PubMed]
- McColl, S.; Wilkinson, F. Visual contrast gain control in migraine: Measures of visual cortical excitability and inhibition. Cephalalgia 2000, 20, 74–84. [Google Scholar] [CrossRef]
- Coppola, G.; Pierelli, F.; Schoenen, J. Is the cerebral cortex hyperexcitable or hyperresponsive in migraine? Cephalalgia 2007, 27, 1427–1439. [Google Scholar] [CrossRef]
- Brigo, F.; Storti, M.; Tezzon, F.; Manganotti, P.; Nardone, R. Primary visual cortex excitability in migraine: A systematic review with meta-analysis. Neurol. Sci. 2013, 34, 819–830. [Google Scholar] [CrossRef]
- Wagner, D.; Manahilov, V.; Loffler, G.; Gordon, G.E.; Dutton, G.N. Visual noise selectively degrades vision in migraine. Investig. Ophthalmol. Vis. Sci. 2010, 51, 2294–2299. [Google Scholar] [CrossRef] [Green Version]
- Wagner, D.; Manahilov, V.; Gordon, G.E.; Loffler, G. Global shape processing deficits are amplified by temporal masking in migraine. Investig. Ophthalmol. Vis. Sci. 2013, 54, 1160–1168. [Google Scholar] [CrossRef] [Green Version]
- Russell, M.B.; Ulrich, V.; Gervil, M.; Olesen, J. Migraine without aura and migraine with aura are distinct disorders. A population-based twin survey. Headache J. Head Face Pain 2002, 42, 332–336. [Google Scholar] [CrossRef]
- Ligthart, L.; Boomsma, D.I.; Martin, N.G.; Stubbe, J.H.; Nyholt, D.R. Migraine with aura and migraine without aura are not distinct entities: Further evidence from a large Dutch population study. Twin Res. Hum. Genet. 2006, 9, 54–63. [Google Scholar] [CrossRef] [PubMed]
- O’Hare, L.; Hibbard, P.B. Visual processing in migraine. Cephalalgia 2016, 36, 1057–1076. [Google Scholar] [CrossRef] [PubMed] [Green Version]
- Tibber, M.S.; Kelly, M.G.; Jansari, A.; Dakin, S.C.; Shepherd, A.J. An inability to exclude visual noise in migraine. Investig. Ophthalmol. Vis. Sci. 2014, 55, 2539–2546. [Google Scholar] [CrossRef] [PubMed] [Green Version]
- Palmer, J.; Chronicle, E.; Rolan, P.; Mulleners, W. Cortical hyperexcitability is cortical under-inhibition: Evidence from a novel functional test of migraine patients. Cephalalgia 2000, 20, 525–532. [Google Scholar] [CrossRef]
- Shepherd, A. Visual contrast processing in migraine. Cephalalgia 2000, 20, 865–880. [Google Scholar] [CrossRef] [PubMed]
- Shepherd, A.J.; Beaumont, H.M.; Hine, T.J. Motion processing deficits in migraine are related to contrast sensitivity. Cephalalgia 2012, 32, 554–570. [Google Scholar] [CrossRef] [PubMed] [Green Version]
- Shepherd, A.J.; Hine, T.J.; Beaumont, H.M. Color and spatial frequency are related to visual pattern sensitivity in migraine. Headache J. Head Face Pain 2013, 53, 1087–1103. [Google Scholar] [CrossRef] [Green Version]
- Khalil, N.M.; Nicotra, A.; Wilkins, A.J. Asymmetry of visual function in migraine with aura: Correlation with lateralisation of headache and aura. Cephalalgia 2011, 31, 213–221. [Google Scholar] [CrossRef]
- Coleston, D.; Chronicle, E.; Ruddock, K.; Kennard, C. Precortical dysfunction of spatial and temporal visual processing in migraine. J. Neurol. Neurosurg. Psychiatry 1994, 57, 1208–1211. [Google Scholar] [CrossRef] [Green Version]
- Benedek, K.; Tajti, J.; Janáky, M.; Vécsei, L.; Benedek, G. Spatial contrast sensitivity of migraine patients without aura. Cephalalgia 2002, 22, 142–145. [Google Scholar] [CrossRef]
- Yenice, Ö.; Onal, S.; Incili, B.; Temel, A.; Afşar, N.; Tanrıdaǧ, T. Assessment of spatial–contrast function and short-wavelength sensitivity deficits in patients with migraine. Eye 2007, 21, 218–223. [Google Scholar] [CrossRef] [Green Version]
- Tibber, M.S.; Guedes, A.; Shepherd, A.J. Orientation discrimination and contrast detection thresholds in migraine for cardinal and oblique angles. Investig. Ophthalmol. Vis. Sci. 2006, 47, 5599–5604. [Google Scholar] [CrossRef]
- Asher, J.M.; O’Hare, L.; Romei, V.; Hibbard, P.B. Typical lateral interactions, but increased contrast sensitivity, in migraine with aura. Vision 2018, 2, 7. [Google Scholar] [CrossRef] [Green Version]
- Aldrich, A.; Hibbard, P.; Wilkins, A. Vision and hyper-responsiveness in migraine. Vision 2019, 3, 62. [Google Scholar] [CrossRef] [Green Version]
- McKendrick, A.M.; Vingrys, A.J.; Badcock, D.R.; Heywood, J.T. Visual field losses in subjects with migraine headaches. Investig. Ophthalmol. Vis. Sci. 2000, 41, 1239–1247. [Google Scholar]
- McKendrick, A.; Badcock, D. Motion processing deficits in migraine. Cephalalgia 2004, 24, 363–372. [Google Scholar] [CrossRef]
- McKendrick, A.; Sampson, G. Low spatial frequency contrast sensitivity deficits in migraine are not visual pathway selective. Cephalalgia 2009, 29, 539–549. [Google Scholar] [CrossRef]
- Wagner, D.; Manahilov, V.; Gordon, G.E.; Storch, P. Long-range inhibitory mechanisms in the visual system are impaired in migraine sufferers. Cephalalgia 2012, 32, 1071–1075. [Google Scholar] [CrossRef]
- Webster, K.E.; Dickinson, J.E.; Battista, J.; McKendrick, A.M.; Badcock, D.R. Evidence for increased internal noise in migraineurs for contrast and shape processing. Cephalalgia 2012, 32, 125–139. [Google Scholar] [CrossRef]
- Smith, J.M.; Bradley, D.P.; James, M.F.; Huang, C.L.H. Physiological studies of cortical spreading depression. Biol. Rev. 2006, 81, 457–481. [Google Scholar] [CrossRef]
- Dahlem, M.; Chronicle, E. A computational perspective on migraine aura. Prog. Neurobiol. 2004, 74, 351–361. [Google Scholar] [CrossRef]
- O’Hare, L.; Asher, J.M.; Hibbard, P.B. Migraine visual aura and cortical spreading depression - linking mathematical models to empirical evidence. Vision 2021, 5, 30. [Google Scholar] [CrossRef]
- Livingstone, M.; Hubel, D. Segregation of form, color, movement, and depth: Anatomy, physiology, and perception. Science 1988, 240, 740–749. [Google Scholar] [CrossRef] [Green Version]
- Skottun, B.C. The magnocellular deficit theory of dyslexia: The evidence from contrast sensitivity. Vis. Res. 2000, 40, 111–127. [Google Scholar] [CrossRef] [Green Version]
- Skottun, B.C. On the use of spatial frequency to isolate contributions from the magnocellular and parvocellular systems and the dorsal and ventral cortical streams. Neurosci. Biobehav. Rev. 2015, 56, 266–275. [Google Scholar] [CrossRef]
- Plainis, S.; Murray, I.J. Magnocellular channel subserves the human contrast-sensitivity function. Perception 2005, 34, 933–940. [Google Scholar] [CrossRef]
- Green, M.F.; Butler, P.D.; Chen, Y.; Geyer, M.A.; Silverstein, S.; Wynn, J.K.; Yoon, J.H.; Zemon, V. Perception measurement in clinical trials of schizophrenia: Promising paradigms from CNTRICS. Schizophr. Bull. 2009, 35, 163–181. [Google Scholar] [CrossRef] [Green Version]
- Kaplan, E.; Shapley, R.M. The primate retina contains two types of ganglion cells, with high and low contrast sensitivity. Proc. Natl. Acad. Sci. USA 1986, 83, 2755–2757. [Google Scholar] [CrossRef] [Green Version]
- Merigan, W.; Katz, L.M.; Maunsell, J. The effects of parvocellular lateral geniculate lesions on the acuity and contrast sensitivity of macaque monkeys. J. Neurosci. 1991, 11, 994–1001. [Google Scholar] [CrossRef] [Green Version]
- Kilavik, B.; Silveira, L.; Kremers, J. Spatial receptive field properties of lateral geniculate cells in the owl monkey (Aotus azarae) at different contrasts: A comparative study. Eur. J. Neurosci. 2007, 26, 992–1006. [Google Scholar] [CrossRef]
- Benedek, G.; Benedek, K.; Kéri, S.; Janáky, M. The scotopic low-frequency spatial contrast sensitivity develops in children between the ages of 5 and 14 years. Neurosci. Lett. 2003, 345, 161–164. [Google Scholar] [CrossRef]
- Webster, K.E.; Edwin Dickinson, J.; Battista, J.; McKendrick, A.M.; Badcock, D.R. Increased internal noise cannot account for motion coherence processing deficits in migraine. Cephalalgia 2011, 31, 1199–1210. [Google Scholar] [CrossRef]
- Brainard, D.H. The psychophysics toolbox. Spat. Vis. 1997, 10, 433–436. [Google Scholar] [CrossRef] [Green Version]
- Kleiner, M.; Brainard, D.; Pelli, D.; Ingling, A.; Murray, R.; Broussard, C. What’s new in Psychtoolbox-3. Perception 2007, 36, 1. [Google Scholar]
- Pelli, D.G. The VideoToolbox software for visual psychophysics: Transforming numbers into movies. Spat. Vis. 1997, 10, 437–442. [Google Scholar] [CrossRef] [Green Version]
- Albrecht, D.G.; Hamilton, D.B. Striate cortex of monkey and cat: Contrast response function. J. Neurophysiol. 1982, 48, 217–237. [Google Scholar] [CrossRef]
- Sclar, G.; Lennie, P.; DePriest, D.D. Contrast adaptation in striate cortex of macaque. Vis. Res. 1989, 29, 747–755. [Google Scholar] [CrossRef]
- Huang, L.; Dobkins, K.R. Attentional effects on contrast discrimination in humans: Evidence for both contrast gain and response gain. Vis. Res. 2005, 45, 1201–1212. [Google Scholar] [CrossRef] [PubMed] [Green Version]
- Ling, S.; Carrasco, M. Sustained and transient covert attention enhance the signal via different contrast response functions. Vis. Res. 2006, 46, 1210–1220. [Google Scholar] [CrossRef] [PubMed] [Green Version]
- Reynolds, J.H.; Pasternak, T.; Desimone, R. Attention increases sensitivity of V4 neurons. Neuron 2000, 26, 703–714. [Google Scholar] [CrossRef] [Green Version]
- Dosher, B.A.; Lu, Z.L. Perceptual learning reflects external noise filtering and internal noise reduction through channel reweighting. Proc. Natl. Acad. Sci. USA 1998, 95, 13988–13993. [Google Scholar] [CrossRef] [Green Version]
- Shepherd, A.J.; Wyatt, G.; Tibber, M.S. Visual metacontrast masking in migraine. Cephalalgia 2011, 31, 346–356. [Google Scholar] [CrossRef]
- Pope, D.R.; Edwards, M.; Schor, C.S. Extraction of depth from opposite-contrast stimuli: Transient system can, sustained system can’t. Vis. Res. 1999, 39, 4010–4017. [Google Scholar] [CrossRef] [Green Version]
- Skottun, B.C.; Skoyles, J.R. On identifying magnocellular and parvocellular responses on the basis of contrast-response functions. Schizophr. Bull. 2011, 37, 23–26. [Google Scholar] [CrossRef]
- Dakin, S.C.; Mareschal, I.; Bex, P.J. Local and global limitations on direction integration assessed using equivalent noise analysis. Vis. Res. 2005, 45, 3027–3049. [Google Scholar] [CrossRef] [PubMed] [Green Version]
- Baldwin, A.S.; Baker, D.H.; Hess, R.F. What do contrast threshold equivalent noise studies actually measure? Noise vs. nonlinearity in different masking paradigms. PLoS ONE 2016, 11, e0150942. [Google Scholar] [CrossRef] [PubMed]
- Baker, D.H.; Meese, T.S. Zero-dimensional noise: The best mask you never saw. J. Vis. 2012, 12, 20. [Google Scholar] [CrossRef] [PubMed]
- O’Hare, L.; Menchinelli, F.; Durrant, S.J. Resting-state alpha-band oscillations in migraine. Perception 2018, 47, 379–396. [Google Scholar] [CrossRef]
- Áfra, J.; Mascia, A.; Phy, P.G.; De Noordhout, A.M.; Schoenen, J. Interictal cortical excitability in migraine: A study using transcranial magnetic stimulation of motor and visual cortices. Ann. Neurol. Off. J. Am. Neurol. Assoc. Child Neurol. Soc. 1998, 44, 209–215. [Google Scholar] [CrossRef]
- Khalil, N.M. Investigations of Visual Function in Migraine by Visual Evoked Potentials and Visual Psychophysical Tests. Ph.D. Thesis, University of London, London, UK, 1991. [Google Scholar]
- Braunitzer, G.; Rokszin, A.; Kóbor, J.; Benedek, G. Is the development of visual contrast sensitivity impaired in children with migraine? An exploratory study. Cephalalgia 2010, 30, 991–995. [Google Scholar] [CrossRef]
- Mendes, L.C.; Galdino, M.K.C.; Vieira, J.G.; Simas, M.L.d.B.; Santos, N.A.d. Evaluation of contrast sensitivity among patients with migraine. Psicol. USP 2011, 22, 81–97. [Google Scholar] [CrossRef]
- McKendrick, A.M.; Vingrys, A.J.; Badcock, D.R.; Heywood, J.T. Visual dysfunction between migraine events. Investig. Ophthalmol. Vis. Sci. 2001, 42, 626–633. [Google Scholar]
- Braddick, O.; Atkinson, J.; Wattam-Bell, J. Normal and anomalous development of visual motion processing: Motion coherence and ‘dorsal-stream vulnerability’. Neuropsychologia 2003, 41, 1769–1784. [Google Scholar] [CrossRef]
- Goodbourn, P.T.; Bosten, J.M.; Hogg, R.E.; Bargary, G.; Lawrance-Owen, A.J.; Mollon, J. Do different ‘magnocellular tasks’ probe the same neural substrate? Proc. R. Soc. B Biol. Sci. 2012, 279, 4263–4271. [Google Scholar] [CrossRef] [Green Version]
- Movshon, J.A.; Newsome, W.T. Visual response properties of striate cortical neurons projecting to area MT in macaque monkeys. J. Neurosci. 1996, 16, 7733–7741. [Google Scholar] [CrossRef] [PubMed]
- McKendrick, A.M.; Chan, Y.M.; Vingrys, A.J.; Turpin, A.; Badcock, D.R. Daily vision testing can expose the prodromal phase of migraine. Cephalalgia 2018, 38, 1575–1584. [Google Scholar] [CrossRef] [PubMed]
- Shepherd, A.J. Tracking the migraine cycle using visual tasks. Vision 2020, 4, 23. [Google Scholar] [CrossRef]


| Observer | Sex | Age | Frequency (Per Month) | Duration (Years) | Prior Attack |
|---|---|---|---|---|---|
| OB4 | M | 22 | 1–3 | 7 | 8 days |
| OB7 | F | 20 | 1–3 | 12 | >3 days |
| OB8 | M | 29 | <1 | 6 | 3 weeks |
| OB10 | M | 20 | 1–3 | 5 | 1 week |
| OB14 | M | 20 | <1 | 2 | >3 days |
| OB18 | M | 24 | 1–3 | 6 | >3 days |
| OB20 | M | 62 | <1 | 3 | 2 months |
| OB21 | F | 40 | 1–3 | 15 | 1 month |
| OB22 | F | 50 | 3–10 | 37 | 10 days |
| OB26 | F | 19 | <1 | 9 | >3 days |
| OB35 | M | 22 | 1–3 | 8 | >3 days |
| OB40 | F | 31 | 1–3 | 21 | >3 days |
| OB41 | F | 59 | 3–10 | 44 | 4 days |
| OB42 | F | 26 | 1–3 | 16 | 1 month |
Publisher’s Note: MDPI stays neutral with regard to jurisdictional claims in published maps and institutional affiliations. |
© 2021 by the authors. Licensee MDPI, Basel, Switzerland. This article is an open access article distributed under the terms and conditions of the Creative Commons Attribution (CC BY) license (https://creativecommons.org/licenses/by/4.0/).
Share and Cite
Asher, J.M.; O’Hare, L.; Hibbard, P.B. No Evidence of Reduced Contrast Sensitivity in Migraine-with-Aura for Large, Narrowband, Centrally Presented Noise-Masked Stimuli. Vision 2021, 5, 32. https://0-doi-org.brum.beds.ac.uk/10.3390/vision5020032
Asher JM, O’Hare L, Hibbard PB. No Evidence of Reduced Contrast Sensitivity in Migraine-with-Aura for Large, Narrowband, Centrally Presented Noise-Masked Stimuli. Vision. 2021; 5(2):32. https://0-doi-org.brum.beds.ac.uk/10.3390/vision5020032
Chicago/Turabian StyleAsher, Jordi M., Louise O’Hare, and Paul B. Hibbard. 2021. "No Evidence of Reduced Contrast Sensitivity in Migraine-with-Aura for Large, Narrowband, Centrally Presented Noise-Masked Stimuli" Vision 5, no. 2: 32. https://0-doi-org.brum.beds.ac.uk/10.3390/vision5020032