
Optical Coherence Tomography Angiography to Estimate Early Retinal Blood Flow Changes after Uncomplicated Cataract Surgery

 ,
,  , , ,
, , ,
Abstract
:1. Introduction
2. Materials and Methods
2.1. Patients
2.2. Examinations
- Group 1: Patients affected by less severe cataracts (nuclear opalescence (NO), nuclear color (NC), cortical cataract (C) ≤ 3).
- Group 2: Patients affected by severe cataracts (nuclear opalescence (NO), nuclear color (NC), cortical cataract (C) > 3).
2.3. Image Acquisition
2.4. Surgical Technique
2.5. Statistical Analysis
3. Results
3.1. Demographics and Main Clinical Data
3.2. Microvasculature Parameters
3.3. Subgroup Analysis Related to Cataract Severity
3.4. Microvasculature Parameters Related to Cataract Severity
4. Discussion
Author Contributions
Funding
Institutional Review Board Statement
Informed Consent Statement
Data Availability Statement
Conflicts of Interest
References
- Liu, Y.C.; Wilkins, M.; Kim, T.; Malyugin, B.; Mehta, J.S. Cataracts. Lancet 2017, 390, 600–612. [Google Scholar] [CrossRef]
- Savastano, A.; Ripa, M.; Savastano, M.C.; Vico, U.; Caporossi, T.; Kilian, R.; Rizzo, S. Comparison of Novel Digital Microscope Using Integrated Intraoperative OCT with Ngenuity 3D Visualization System in Phacoemulsification. Can. J. Ophthalmol. 2021; in press. [Google Scholar] [CrossRef]
- Hilton, E.J.R.; Hosking, S.L.; Gherghel, D.; Embleton, S.; Cunliffe, I.A. Beneficial Effects of Small-Incision Cataract Surgery in Patients Demonstrating Reduced Ocular Blood Flow Characteristics. Eye 2005, 19, 670–675. [Google Scholar] [CrossRef] [PubMed]
- Zhao, Z.; Wen, W.; Jiang, C.; Lu, Y. Changes in Macular Vasculature after Uncomplicated Phacoemulsification Surgery: Optical Coherence Tomography Angiography Study. J. Cataract. Refract. Surg. 2018, 44, 453–458. [Google Scholar] [CrossRef] [PubMed]
- Benavente-Pérez, A.; Hosking, S.L.; Logan, N.S.; Broadway, D.C. Ocular Blood Flow Measurements in Healthy Human Myopic Eyes. Graefe’s Arch. Clin. Exp. Ophthalmol. 2010, 248, 1587–1594. [Google Scholar] [CrossRef] [PubMed]
- Sugahara, M.; Miyata, M.; Ishihara, K.; Gotoh, N.; Morooka, S.; Ogino, K.; Hasegawa, T.; Hirashima, T.; Yoshikawa, M.; Hata, M.; et al. Optical Coherence Tomography Angiography to Estimate Retinal Blood Flow in Eyes with Retinitis Pigmentosa. Sci. Rep. 2017, 7, 46396. [Google Scholar] [CrossRef] [PubMed]
- Chylack, L.T.; Leske, C.; Sperduto, R.; Khu, P.; McCarthy, D. Lens Opacities Classification System. Arch. Ophthalmol. 1988, 106, 330–334. [Google Scholar] [CrossRef] [PubMed]
- Harris, P.A.; Taylor, R.; Minor, B.L.; Elliott, V.; Fernandez, M.; O’Neal, L.; McLeod, L.; Delacqua, G.; Delacqua, F.; Kirby, J.; et al. The REDCap Consortium: Building an International Community of Software Platform Partners. J. Biomed. Inform. 2019, 95, 103208. [Google Scholar] [CrossRef] [PubMed]
- Fenner, B.J.; Tan, G.S.W.; Tan, A.C.S.; Yeo, I.Y.S.; Wong, T.Y.; Cheung, G.C.M. Identification of Imaging Features that Determine Quality and Repeatability of Retinal Capillary Plexus Density Measurements in OCT Angiography. Br. J. Ophthalmol. 2018, 102, 509–514. [Google Scholar] [CrossRef] [PubMed]
- Hwang, T.S.; Jia, Y.; Gao, S.S.; Bailey, S.T.; Lauer, A.K.; Flaxel, C.J.; Wilson, D.J.; Huang, D. Optical Coherence Tomography Angiography Features of Diabetic Retinopathy. Retina 2015, 35, 2371–2376. [Google Scholar] [CrossRef] [PubMed] [Green Version]
- Takase, N.; Nozaki, M.; Kato, A.; Ozeki, H.; Yoshida, M.; Ogura, Y. Enlargement of Foveal Avascular Zone in Diabetic Eyes Evaluated by En Face Optical Coherence Tomography Angiography. Retina 2015, 35, 2377–2383. [Google Scholar] [CrossRef] [PubMed]
- Carpineto, P.; Mastropasqua, R.; Marchini, G.; Toto, L.; di Nicola, M.; di Antonio, L. Reproducibility and Repeatability of Foveal Avascular Zone Measurements in Healthy Subjects by Optical Coherence Tomography Angiography. Br. J. Ophthalmol. 2016, 100, 671–676. [Google Scholar] [CrossRef] [PubMed]
- Chen, H.; Lin, H.; Chen, W.; Zhang, B.; Xiang, W.; Gao, Q.; Chen, W.; Liu, Y. Preoperative and Postoperative Measurements of Retinal Vessel Oxygen Saturation in Patients with Different Grades of Cataracts. Acta Ophthalmol. 2017, 95, e436–e442. [Google Scholar] [CrossRef] [PubMed]
- Yu, S.; Frueh, B.E.; Steinmair, D.; Ebneter, A.; Wolf, S.; Zinkernagel, M.S.; Munk, M.R. Cataract Significantly Influences Quantitative Measurements on Swept-Source Optical Coherence Tomography Angiography Imaging. PLoS ONE 2018, 13, e0204501. [Google Scholar] [CrossRef] [PubMed] [Green Version]
- Weigert, G.; Findl, O.; Luksch, A.; Rainer, G.; Kiss, B.; Vass, C.; Schmetterer, L. Effects of Moderate Changes in Intraocular Pressure on Ocular Hemodynamics in Patients with Primary Open-Angle Glaucoma and Healthy Controls. Ophthalmology 2005, 112, 1337–1342. [Google Scholar] [CrossRef] [PubMed]
- Xu, H.; Chen, M.; Forrester, J.V.; Lois, N. Cataract Surgery Induces Retinal Pro-Inflammatory Gene Expression and Protein Secretion. Investig. Ophthalmol. Vis. Sci. 2011, 52, 249–255. [Google Scholar] [CrossRef] [PubMed] [Green Version]


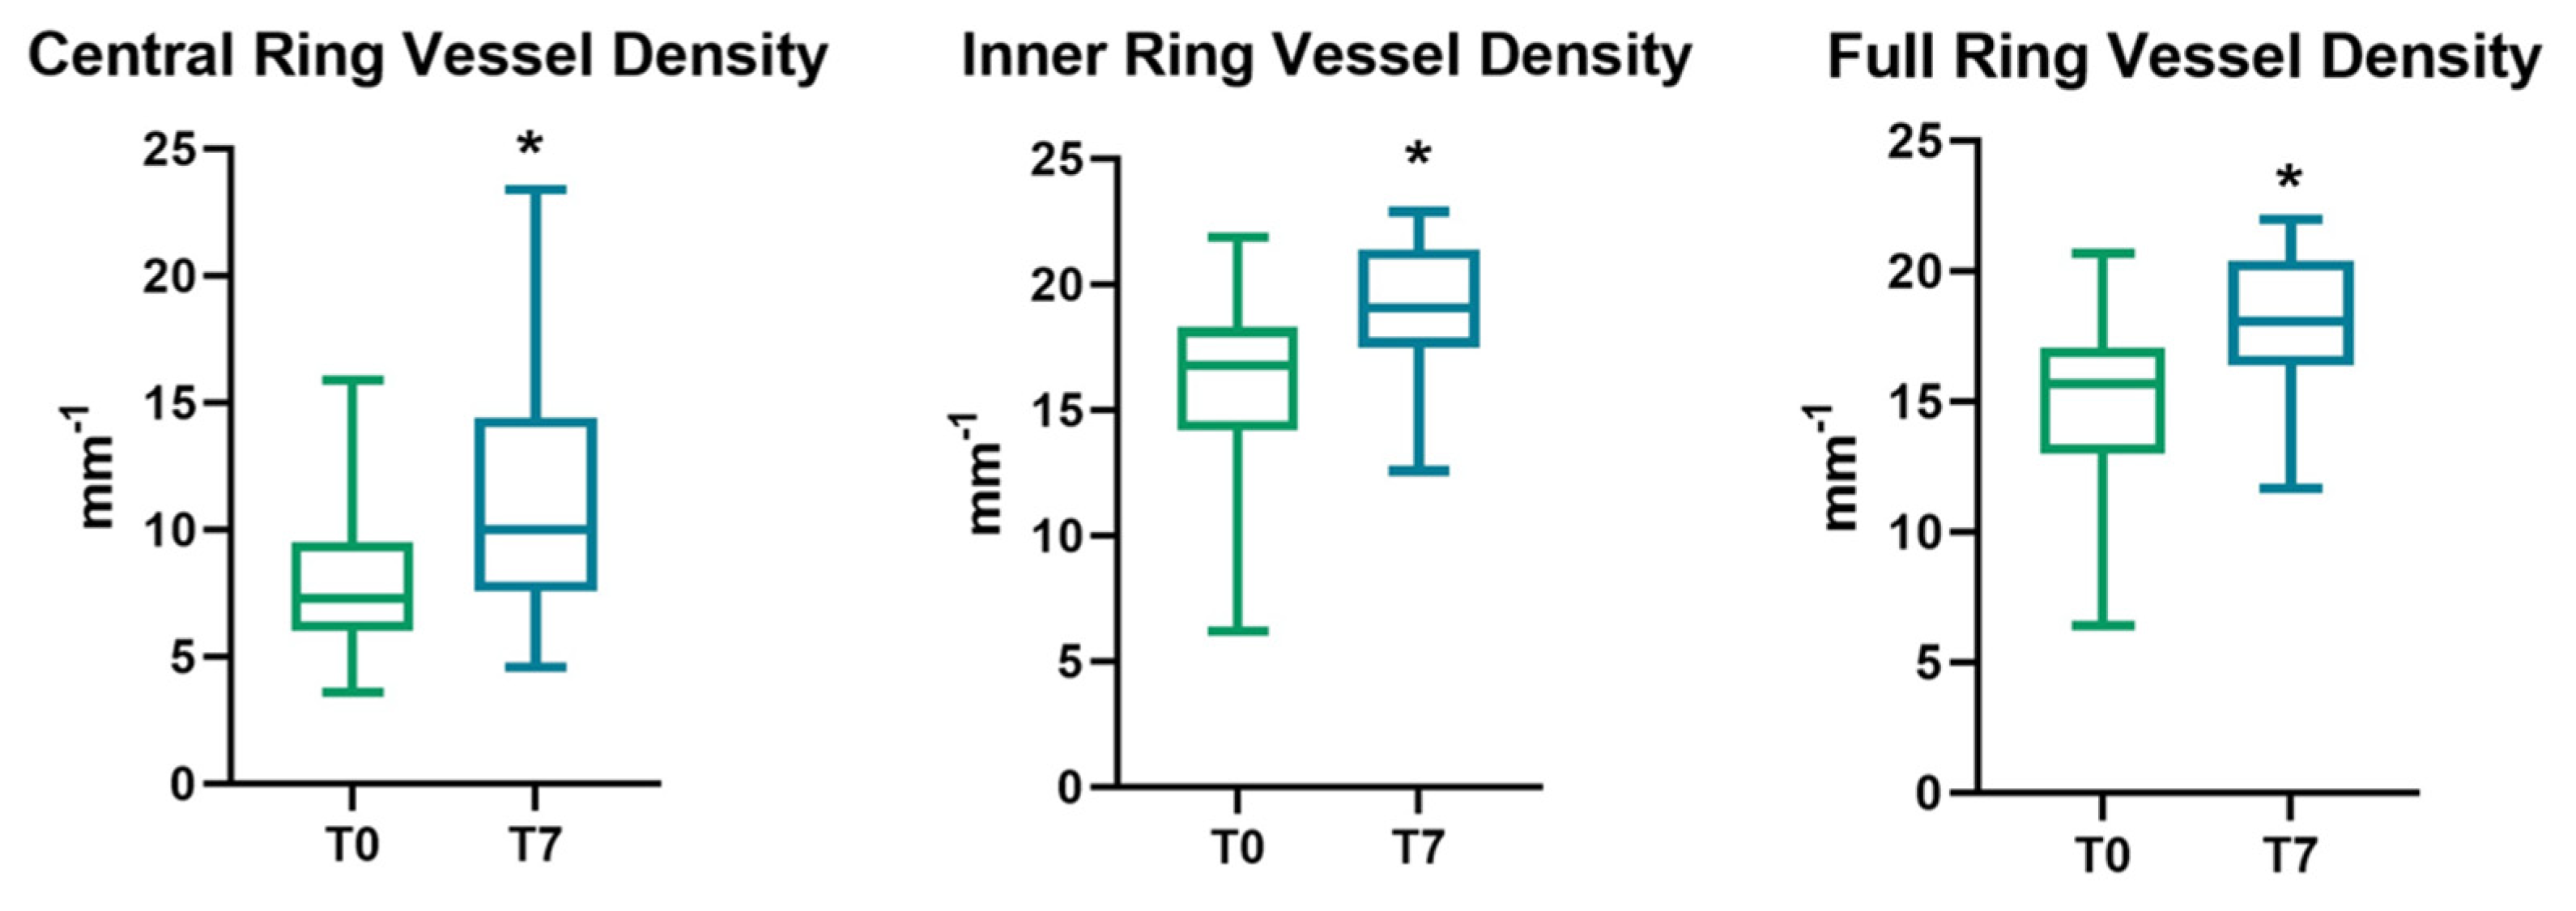
| Area | Vessel Density (mm−1) | ||
|---|---|---|---|
| T0 | T7 | p-Value | |
| Central | 8.20 ± 3.30 | 11.24 ± 4.84 | 0.001 * |
| Inner | 16.04 ± 3.62 | 19.02 ± 2.64 | <0.001 * |
| Full | 15.14 ± 3.41 | 19.02 ± 2.64 | <0.001 * |
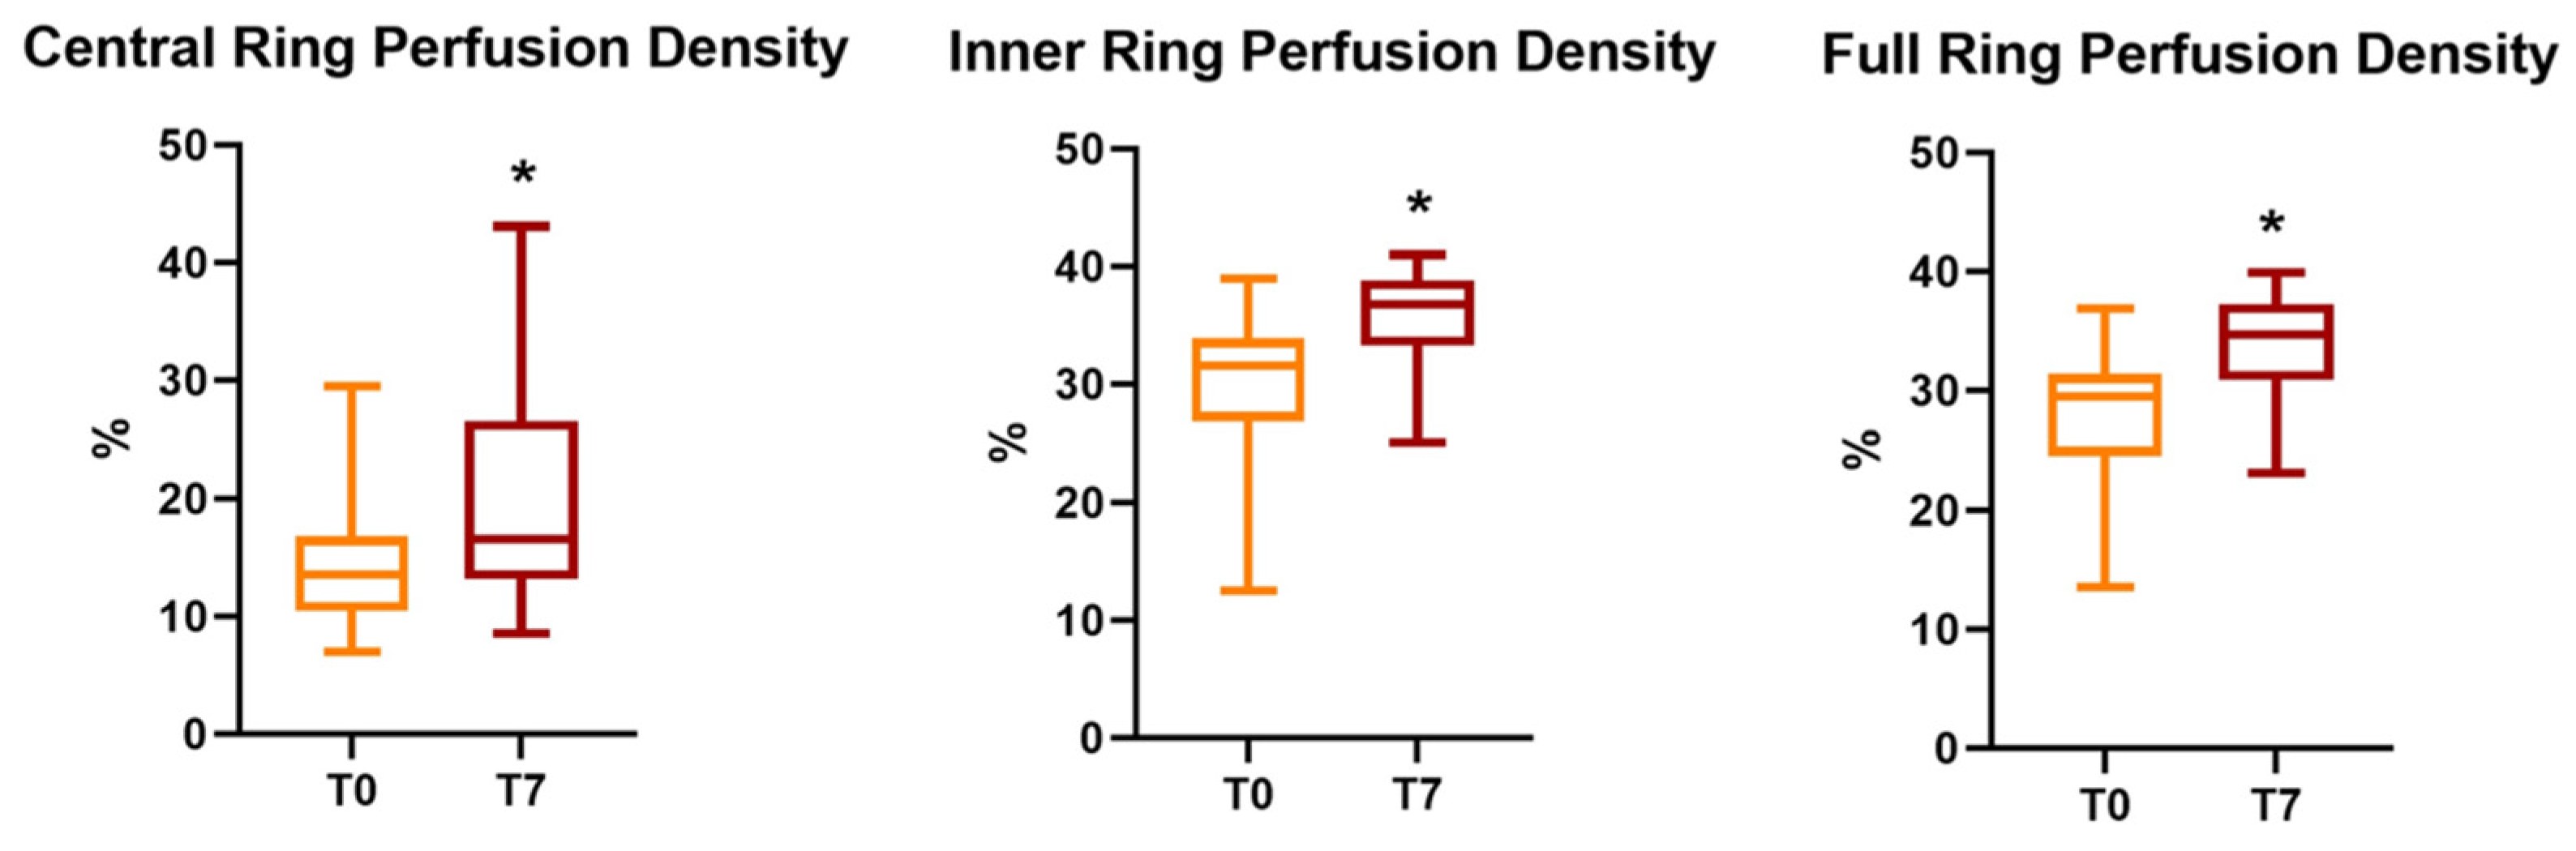
| Area | Perfusion Density (%) | ||
|---|---|---|---|
| T0 | T7 | p-Value | |
| Central | 14.95 ± 6.05 | 19.98 ± 8.93 | 0.003 * |
| Inner | 29.97 ± 6.18 | 35.59 ± 4.17 | 0.001 * |
| Full | 28.3 ± 5.73 | 33.74 ± 4.13 | <0.001 * |
| FAZ | T0 | T7 | p-Value |
|---|---|---|---|
| Area (mm2) | 0.27 ± 0.12 | 0.24 ± 0.11 | 0.008 * |
| Perimeter (mm) | 2.31 ± 0.54 | 2.17 ± 0.58 | 0.057 |
| Circularity Index | 0.59 ± 0.05 | 0.62 ± 0.09 | 0.49 |
| Group 1 (n = 14) | Group 2 (n = 9) | ||||||
|---|---|---|---|---|---|---|---|
| T0 | T7 | p-Value | T0 | T7 | p-Value | ||
| Vessel density (mm−1) | Central | 8.17 ± 3.34 | 10.27 ±3.94 | p = 0.016 * | 8.25 ± 3.25 | 12.74 ± 5.89 | p = 0.022 * |
| Inner | 16.68 ± 3.04 | 19.27 ± 2.68 | p = 0.001 * | 15.04 ± 4.37 | 18.63 ± 2.36 | p = 0.008 * | |
| Full | 15.70 ± 3.02 | 18.25 ± 2.93 | p = 0.01 * | 14.26 ± 3.96 | 17.97± 2.93 | p = 0.006 * | |
| Perfusion density (%) | Central | 14.87 ± 6.33 | 18.22 ±7.11 | p = 0.03 * | 15.06 ± 5.96 | 22.72 ± 11.11 | p = 0.039 * |
| Inner | 31.20 ± 4.98 | 35.89 ± 4.38 | p = 0.007 * | 28.06± 7.62 | 35.13 ± 4.04 | p = 0.006 * | |
| Full | 29.35 ± 5.01 | 33.75 ± 4.61 | p = 0.005 * | 26.66 ± 6.68 | 33.73 ± 3.52 | p = 0.005 * | |
| FAZ | Area (mm2) | 0.27 ± 0.12 | 0.25 ± 0.10 | p = 0.05 | 0.25 ± 0.14 | 0.22 ± 0.12 | p = 0.08 |
| Perimeter (mm) | 2.35 ± 0.49 | 2.23 ± 0.57 | p = 0.23 | 2.25 ± 0.63 | 2.06 ± 0.61 | p = 0.14 | |
| Circularity Index | 0.59 ± 0.06 | 0.62 ± 0.09 | p = 0.05 | 0.60 ± 0.03 | 0.60 ± 0.09 | p = 0.9 | |
| Preoperative (T0) | 1 Week Postoperatively (T7) | Δ (T7-T1) | ||||||||
|---|---|---|---|---|---|---|---|---|---|---|
| Group 1 (n = 14) | Group 2 (n = 9) | p-Value | Group 1 (n = 14) | Group 2 (n = 9) | p-Value | Group 1 (n = 14) | Group 2 (n = 9) | p-Value | ||
| Vessel density (mm−1) | Central | 8.17 ± 3.34 | 8.25 ± 3.25 | p = 0.95 | 10.27 ±3.94 | 12.74 ± 5.89 | p = 0.24 | 2.59 ± 3.33 | 3.58 ± 3.07 | p =0.14 |
| Inner | 16.68 ± 3.04 | 15.04 ± 4.37 | p = 0.22 | 19.27 ± 2.68 | 18.63 ± 2.36 | p = 0.58 | 2.63 ± 3.53 | 3.43 ± 2.83 | p = 0.48 | |
| Full | 15.70 ± 3.02 | 14.26 ± 3.96 | p = 0.98 | 18.25 ± 2.93 | 17.97± 2.93 | p = 0.80 | 2.55 ± 3.18 | 3.71 ± 3.02 | p = 0.39 | |
| Perfusion density (%) | Central | 14.87 ± 6.33 | 15.06 ± 5.96 | p = 0.52 | 18.22 ±7.11 | 22.72 ± 11.11 | p = 0.24 | 3.35 ± 5.27 | 7.65 ± 9.30 | p = 0.17 |
| Inner | 31.20 ± 4.98 | 28.06± 7.62 | p = 0.24 | 35.89 ± 4.38 | 35.13 ± 4.04 | p = 0.88 | 4.68± 5.37 | 7.06 ± 5.62 | p = 0.32 | |
| Full | 29.35 ± 5.01 | 26.66 ± 6.68 | p = 0.28 | 33.75 ± 4.61 | 33.73 ± 3.52 | p = 0.99 | 4.40 ± 5.18 | 7.06± 5.50 | p = 0.25 | |
| FAZ | Area (mm2) | 0.27 ± 0.12 | 0.25 ± 0.14 | p = 0.72 | 0.25 ± 0.10 | 0.22 ± 0.12 | p = 0.48 | −0.02 ± 0.04 | −0.03 ± 0.04 | p = 0.5 |
| Perimeter (mm) | 2.35 ± 0.49 | 2.25 ± 0.63 | p = 0.68 | 2.23 ± 0.57 | 2.06 ± 0.61 | p = 0.51 | −0.12 ± 0.36 | −0.19 ± 0.35 | p = 0.65 | |
| Circularity Index | 0.59 ± 0.06 | 0.60 ± 0.03 | p = 0.97 | 0.62 ± 0.09 | 0.60 ± 0.09 | p = 0.61 | 0.02 ± 0.13 | 0.03 ± 0.08 | p = 0.66 | |
Publisher’s Note: MDPI stays neutral with regard to jurisdictional claims in published maps and institutional affiliations. |
© 2022 by the authors. Licensee MDPI, Basel, Switzerland. This article is an open access article distributed under the terms and conditions of the Creative Commons Attribution (CC BY) license (https://creativecommons.org/licenses/by/4.0/).
Share and Cite
Baldascino, A.; Ripa, M.; Carlà, M.M.; Caporossi, T.; Grieco, G.; Gambini, G.; De Vico, U.; Raguso, G.; Kilian, R.; Rizzo, C.; et al. Optical Coherence Tomography Angiography to Estimate Early Retinal Blood Flow Changes after Uncomplicated Cataract Surgery. Vision 2022, 6, 38. https://0-doi-org.brum.beds.ac.uk/10.3390/vision6030038
Baldascino A, Ripa M, Carlà MM, Caporossi T, Grieco G, Gambini G, De Vico U, Raguso G, Kilian R, Rizzo C, et al. Optical Coherence Tomography Angiography to Estimate Early Retinal Blood Flow Changes after Uncomplicated Cataract Surgery. Vision. 2022; 6(3):38. https://0-doi-org.brum.beds.ac.uk/10.3390/vision6030038
Chicago/Turabian StyleBaldascino, Antonio, Matteo Ripa, Matteo Mario Carlà, Tomaso Caporossi, Giulia Grieco, Gloria Gambini, Umberto De Vico, Giuseppe Raguso, Raphael Kilian, Clara Rizzo, and et al. 2022. "Optical Coherence Tomography Angiography to Estimate Early Retinal Blood Flow Changes after Uncomplicated Cataract Surgery" Vision 6, no. 3: 38. https://0-doi-org.brum.beds.ac.uk/10.3390/vision6030038