1. Introduction
Today’s global market is unstable and intensively competitive, perhaps due to economic globalization and the liberalization of the trade market [
1]. In this competitive global market, in order to adapt and evolve with the challenging environment, organizations need to promote changes in structure and strategy [
2]. Advancements in technology, especially in information technology, have opened a new paradigm in business process optimization. For an organization to thrive and evolve, the strategic development plan needs to address complex customer requirements.
The idea of incorporating changes into organizations is a relatively new strategy that was pioneered in the 1990s. At the present pace of economic and technological development, the process of bringing changes into organizations has become more diverse and complex because of the unprecedented nature of the market. The term “process reengineering” in organizations, especially in the manufacturing industries, refers to bringing in changes in the business environment, and may include the reform of the business strategy from having a technological focus to a cultural one [
3]. The objective of process reengineering and optimization is designed to have a significant impact on the efficiency, profitability, and flexibility of the organization [
4]. A strategic development plan is essential so that the organization may thrive and evolve. Business process reengineering (BPR) is a strategy to increase efficiency in an organization in a precise and calculating manner. An organization may face different critical issues and problems that do not appear in the development plan. Such unforeseen and high-risk issues could lead to an organization failing to meet its goals [
5]. There are several issues that an organization needs to consider while implementing a development plan or concept. There are three critical reasons behind the failure of business process reengineering (BPR) efforts [
6].
Inadequate business cases with unjustifiable and unreasonable expectations.
Lack of robustness, technologies and methodologies in implementing BPR efforts.
Failure to implement the required cultural changes within the organization.
BPR has become a potential approach among business organizations in order to increase productivity and quality, reducing time and costs and aiming to maximize profit and customer satisfaction [
7]. In the modern global economy, BPR is utilized in a wide range of areas such as manufacturing, government, public sectors, information and communication technology, healthcare services, and education. Major firms and companies are adopting changes in management through BPR because of its promise in terms of significantly increasing productivity and profit [
8].
In the manufacturing industries, several strategies have been developed since organizations started adopting process reengineering (PR) for major changes in management and operations. Most of these approaches are traditional initiatives carried out by the conventional linear life cycle system of PR. These approaches have failed to serve the objective of PR, to some extent because of their static and linear nature. The traditional approaches are very much flawed by error and complexity, and are thus incompetent in the competitive operating environment [
9].
According to Hussein [
10], the BPR success factors include but are not limited to:
The incorporation of data in the manufacturing industries has created new opportunities to introduce effective changes in operations and management. Integrating data into process reengineering is possibly the solution to eliminating the uncertainty of success of implementing process reengineering to bring about changes to an organization [
11].
2. Literature Review
2.1. Business Process Reengineering (BPR)
In terms of organizational culture, the term “business process reengineering” refers to a specific management strategy that focuses on a ground-up procedure of an organization by radically restructuring the business process. Davenport termed BPR as encompassing some ‘‘tasks that are logically performed to achieve business goal’’ [
12]. He refers to reengineering processes as having ‘‘a holistic focus on the organizational objective emphasizing processes that are related to the optimization of sub processes for optimizing the productivity’’, whereas Champy and Hammer describe reengineering objective as ‘‘achieving dramatic improvements by redesigning the fundamental business process’’ [
13].
According to Hammer and Champy, process reengineering (PR) consists of three elements.
Input (data related to customer inquiries for service or materials for operations);
Process (a process related to data acquisition or materials); and
Output (expected outcomes).
PR can be termed as the rethinking and redesigning of these elements to support organizational objectives and a reduction of costs. PR considers the process as the main subject that needs to be reengineered in order to achieve reduced cycle time and inventory consumption. In terms of organizational culture, process reengineering refers to a specific management strategy that focuses on the ground-up procedure of an organization by radically restructuring their business procedures. According to Davenport [
14], BPR encompasses a series of tasks that are logically performed to achieve a business goal. He describes this reengineering process as a holistic focus on the organizational objective emphasizing processes that are related to the optimization of sub-processes for production optimization. On the other hand, Champy and Hammer describe the reengineering objective as achieving dramatic improvements by redesigning the fundamental business process [
15].
2.2. Hammer and Champy’s BPR Methodology
According to Hammer and Champy, BPR aims to change the culture of an organization as various pasts are linked together, and the majority of the changes are interdependent [
16]. They propose a business system diamond as a guide to the BPR methodology, set out in
Figure 1.
Hammer and Champy’s business system diamond,
Figure 1, shows that for the implementation of a BPR project, the key business process need to be identified first and then it can be redesigned. The redesigned process can be defined from the structure of the organization, including changes in management and jobs.
2.3. Davenport and Short’s Methodology
According to Davenport and Short, IT is the main enabler of BPR. They consider a recursive relationship between IT and BPR [
17]. The methodology emphasizes IT in terms of supporting new processes that would lead to improved information technology capabilities. They recognize the importance of IT to suggest changes in management through different management approaches like planning, visualizing, directing, communicating and decision-making. Davenport and Short define the redesign efforts of the organization in five major steps [
17].
Developing vision and process objectives;
Identifying the process for redesigning;
Understand and measure existing processes;
Identifying IT levels; and
Designing and building a process prototype.
It is important to understand the vision of a business or an organization before redesigning a process. This refers to a set of clear objectives and goals that a business organization wants to achieve. They could range from reduction of cost, time or improvement of output quality and quality of the working environment, all the way to the corporate culture. These objectives are prioritized as a target or vision. In most cases, redesign efforts do not aim to improve process performance, they emphasize the achievement of the objectives. In this context, Davenport and Short suggest eight IT capabilities and their organizational impact with regards to achieving the desired objectives. These capabilities are described in
Table 1.
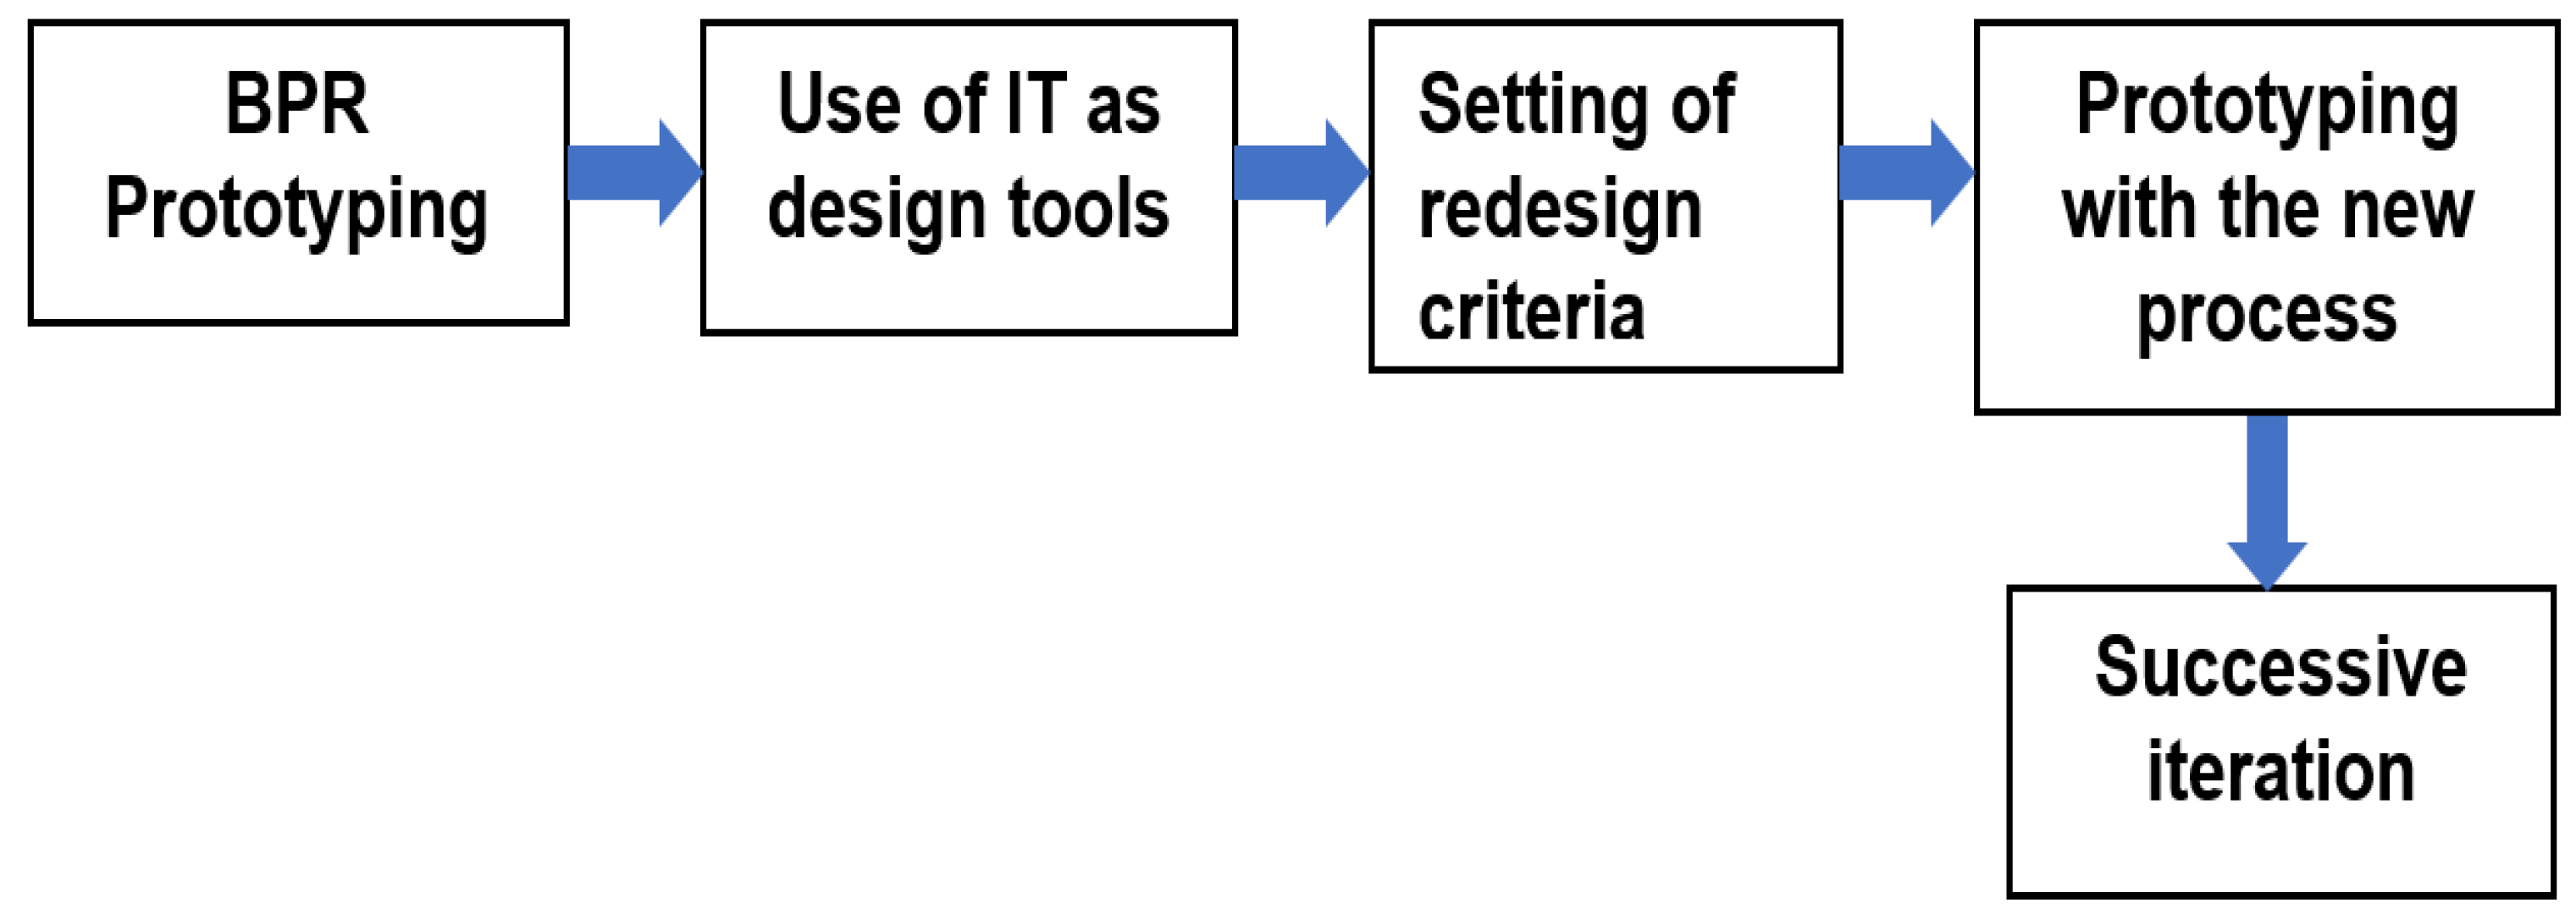
According to Davenport and Short’s methodology, the final step is the design of the new process as a prototype with an expectation of successive iterations. The key factors and tools for process redesigning and prototyping are described in
Figure 2.
2.4. Process Analysis and Design Method (PADM)
A new BPR methodology was introduced by the informatics process group (IPG) at Manchester University, called the process analysis and design method (PADM). According to the PADM framework, the BPR process analysis is as shown in
Figure 3.
Figure 3 shows the structure of the PADM framework and activity flow once the process is selected. From the process selection to the target process design, each stage reciprocally interacts with the others, but does not necessarily maintain a strict sequential order. Process definition defines the objectives and interfaces of the boundary of the selected process, while baseline identification identifies the change opportunities that facilitate the understanding and development of the current process. The evaluation process evaluates technical and social issues such as low job satisfaction and inefficient use of resources. The identification of key performance indicators is one of the main issues during process evaluation. In targeted process design, both social and technical aspects of the process are incorporated based on radical or incremental changes recommended from the evaluation stage.
2.5. Object-Oriented BPR Methodology
According to Jacobson’s object-oriented [
18] BPR methodology, business development and performing reengineering work is based on two mains steps.
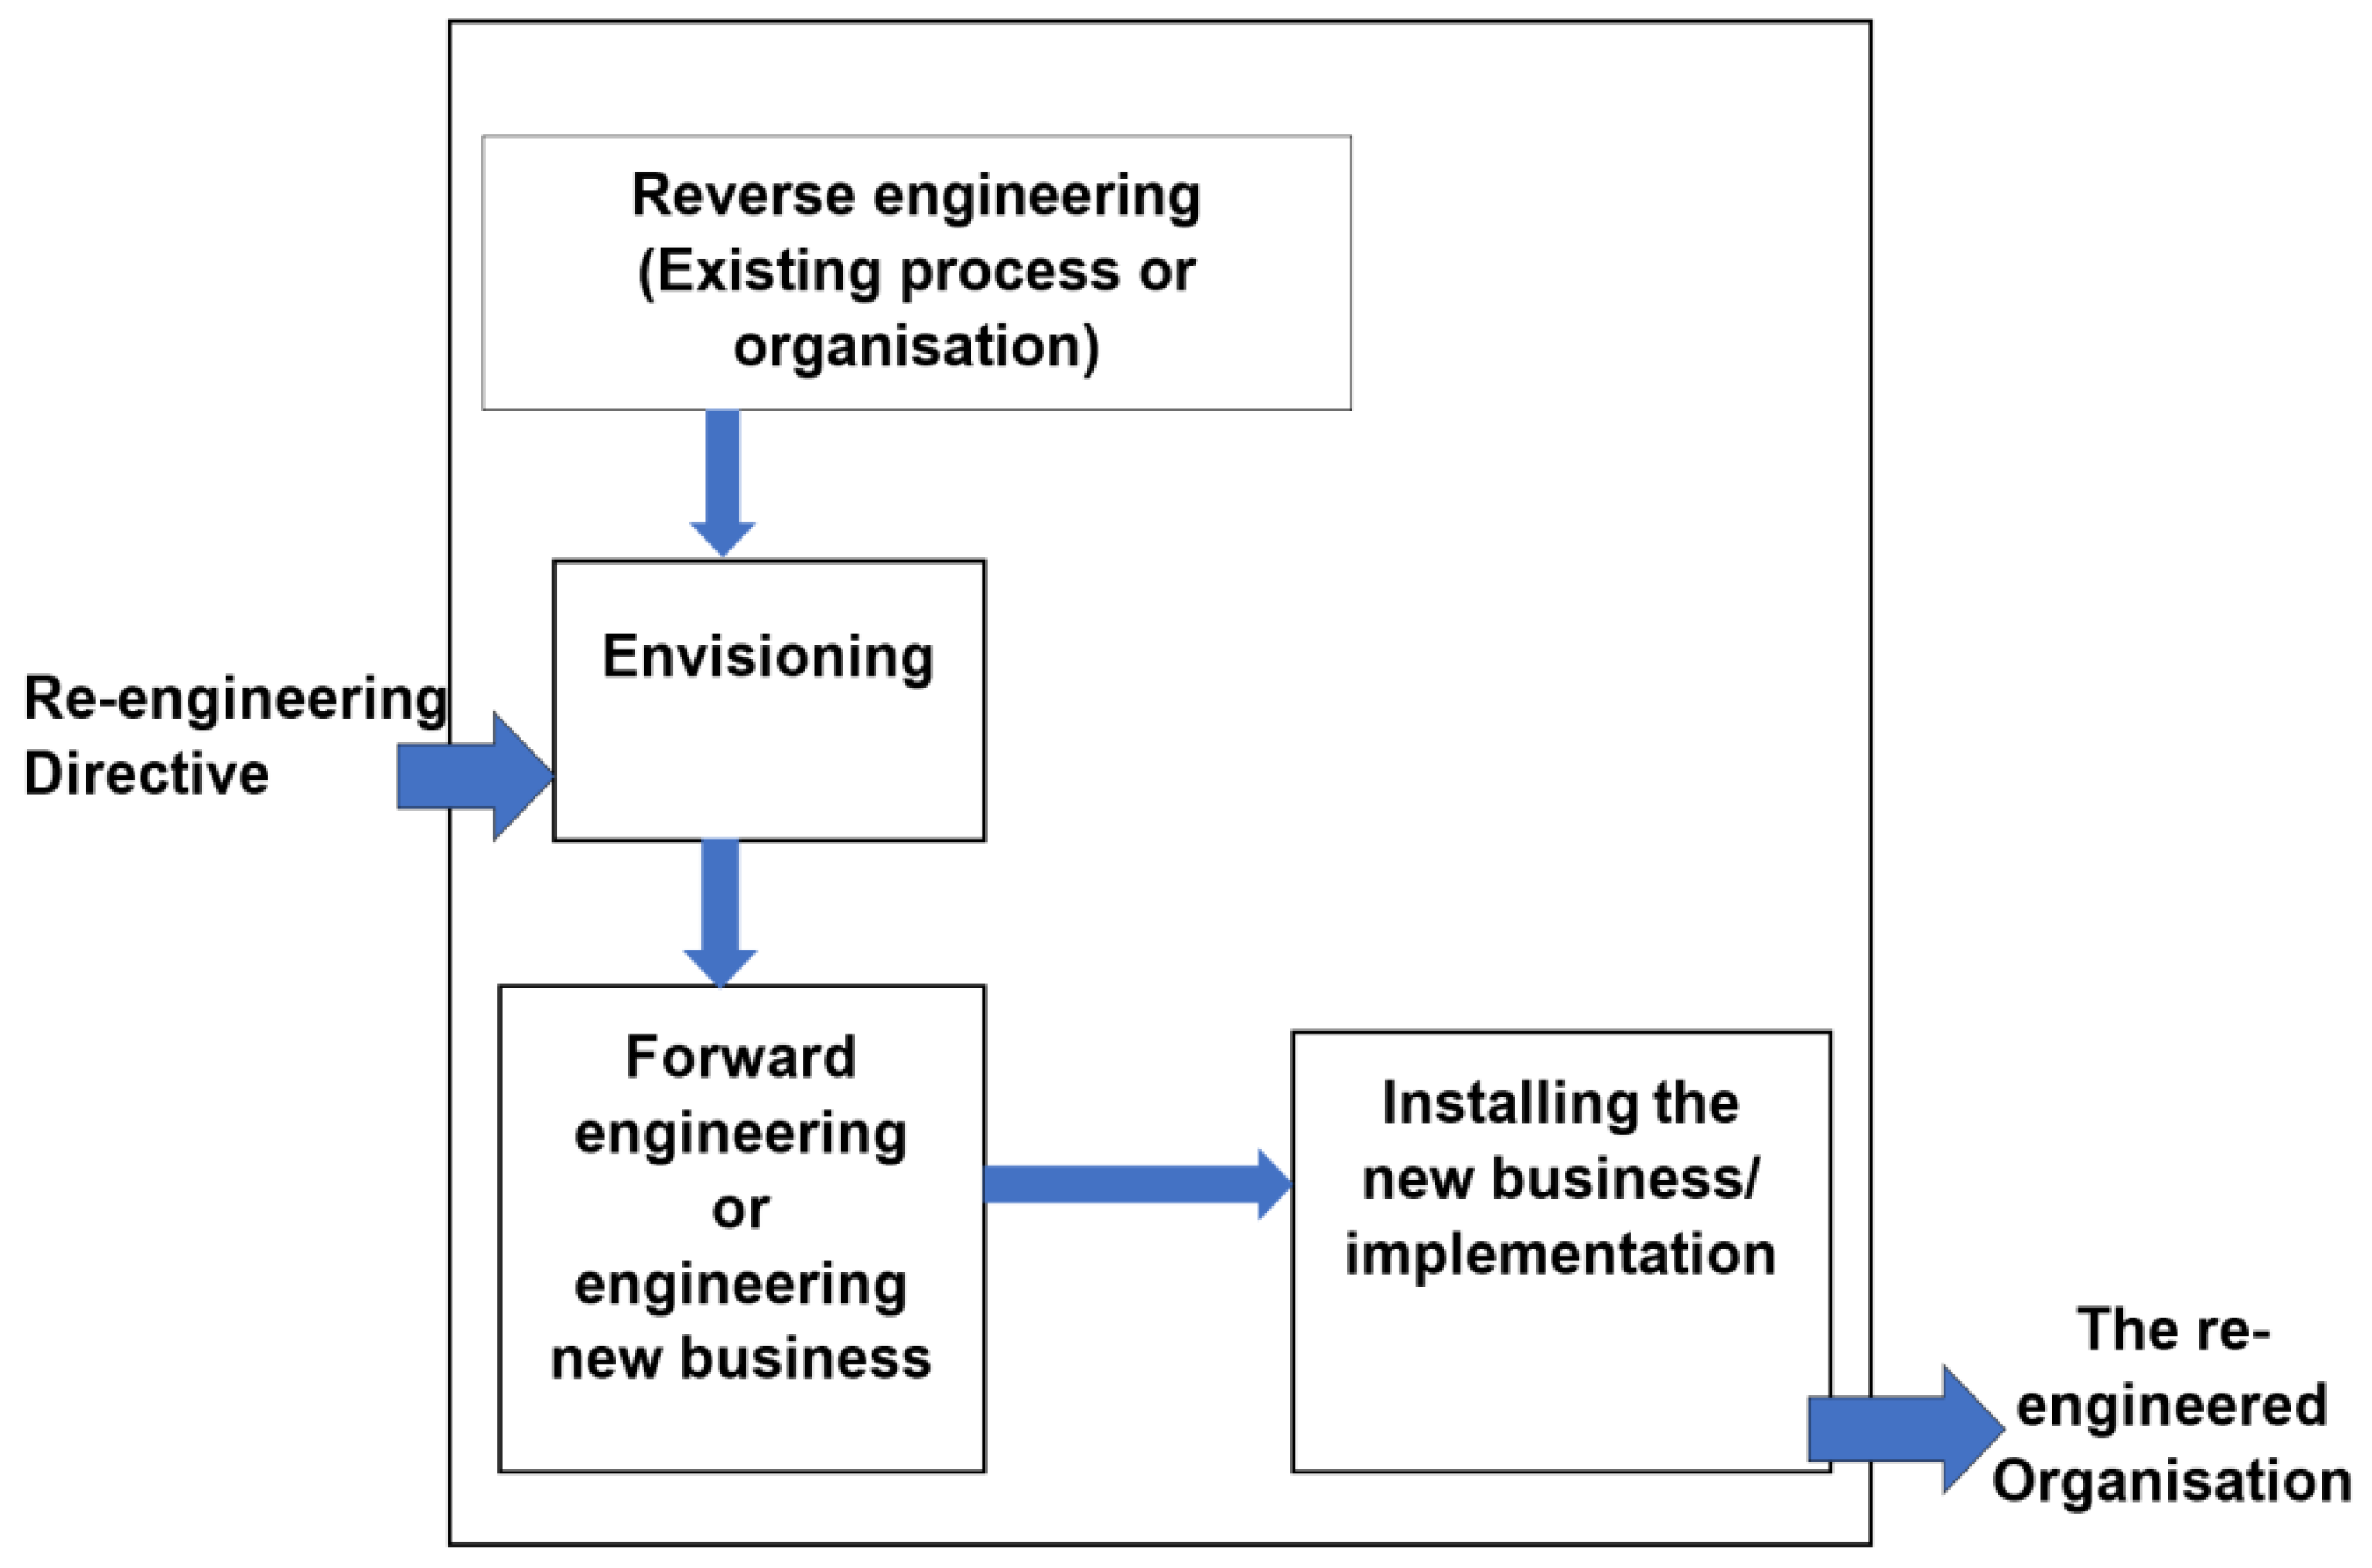
Jacobson’s approach to BPR can be defined as shown in
Figure 4.
According to this process, a BPR effort is a response to the reengineering directive that initiates an envisioning activity based on current problems, and the need for change required to accomplish business visions. To produce a vision, the organization’s existing business process and strategy should be understood. The reverse engineering phase reconstructs the existing model based on detailed and measurable data. The construction of the process shows two consistent organizational views:
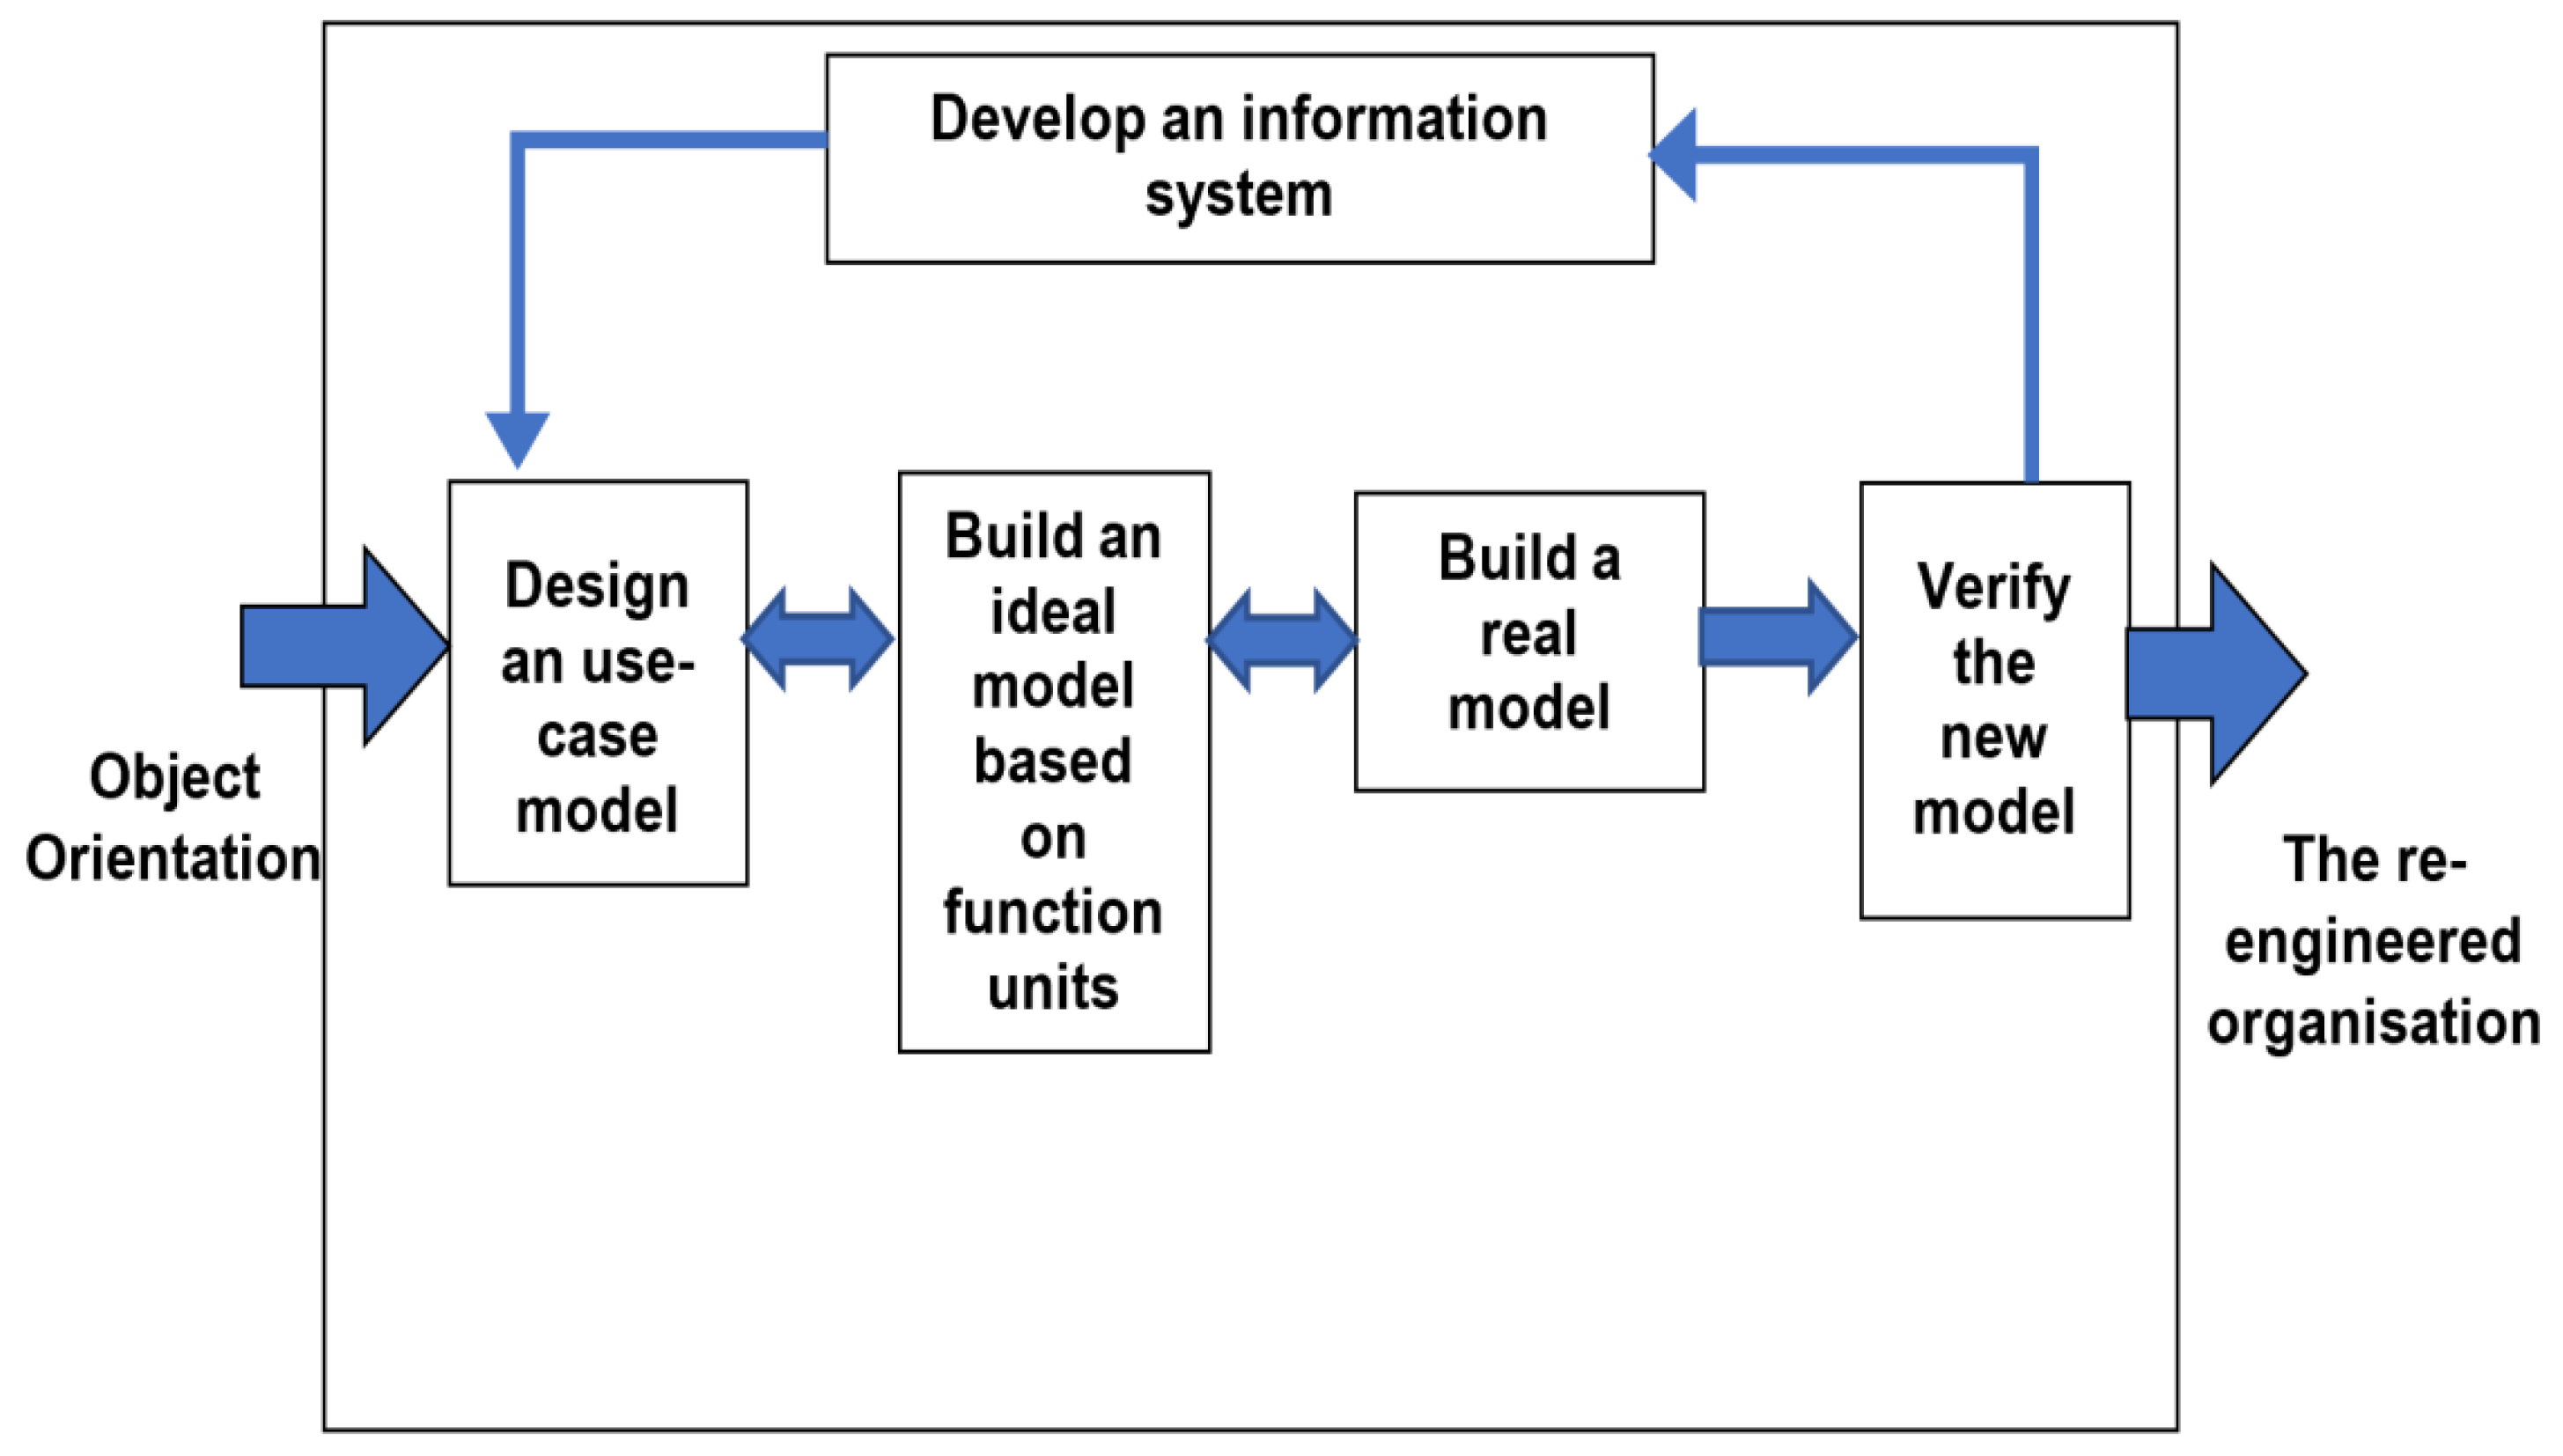
The use of case modelling and object modelling are correlated, as the reengineering effort starts with the use of a case model and evolves with object modelling to obtain a compatible, comprehensive and evaluated model of the current process by working iteratively between the cases and object modelling. The next phase of reengineering is forward engineering, described in
Figure 5, with a vision to produce a model for the new organization carrying out some parallel activities.
3. Analysis of the Literature Review
Most of the BPR methodologies and models have the limitation of dependency, because in a BPR effort each step and procedure has consequences and are dependent on each other. Changes in one step can have major impact on the next step and a lack of adaptation can lead to failure. Many of the BPR methodologies embody the change and improvement of one single process without measuring the effect on the others. Improvements made without considering the dependency issues of a single process could have a detrimental impact on the process. To avoid any dependency and rational impact on any process, the holistic approach of reengineering should be utilized [
19]. In a successful BPR effort, an overall understanding of the key processes of an organization is vital before reengineering any process [
20].The limitations of the existing BPR models are discussed in the next section.
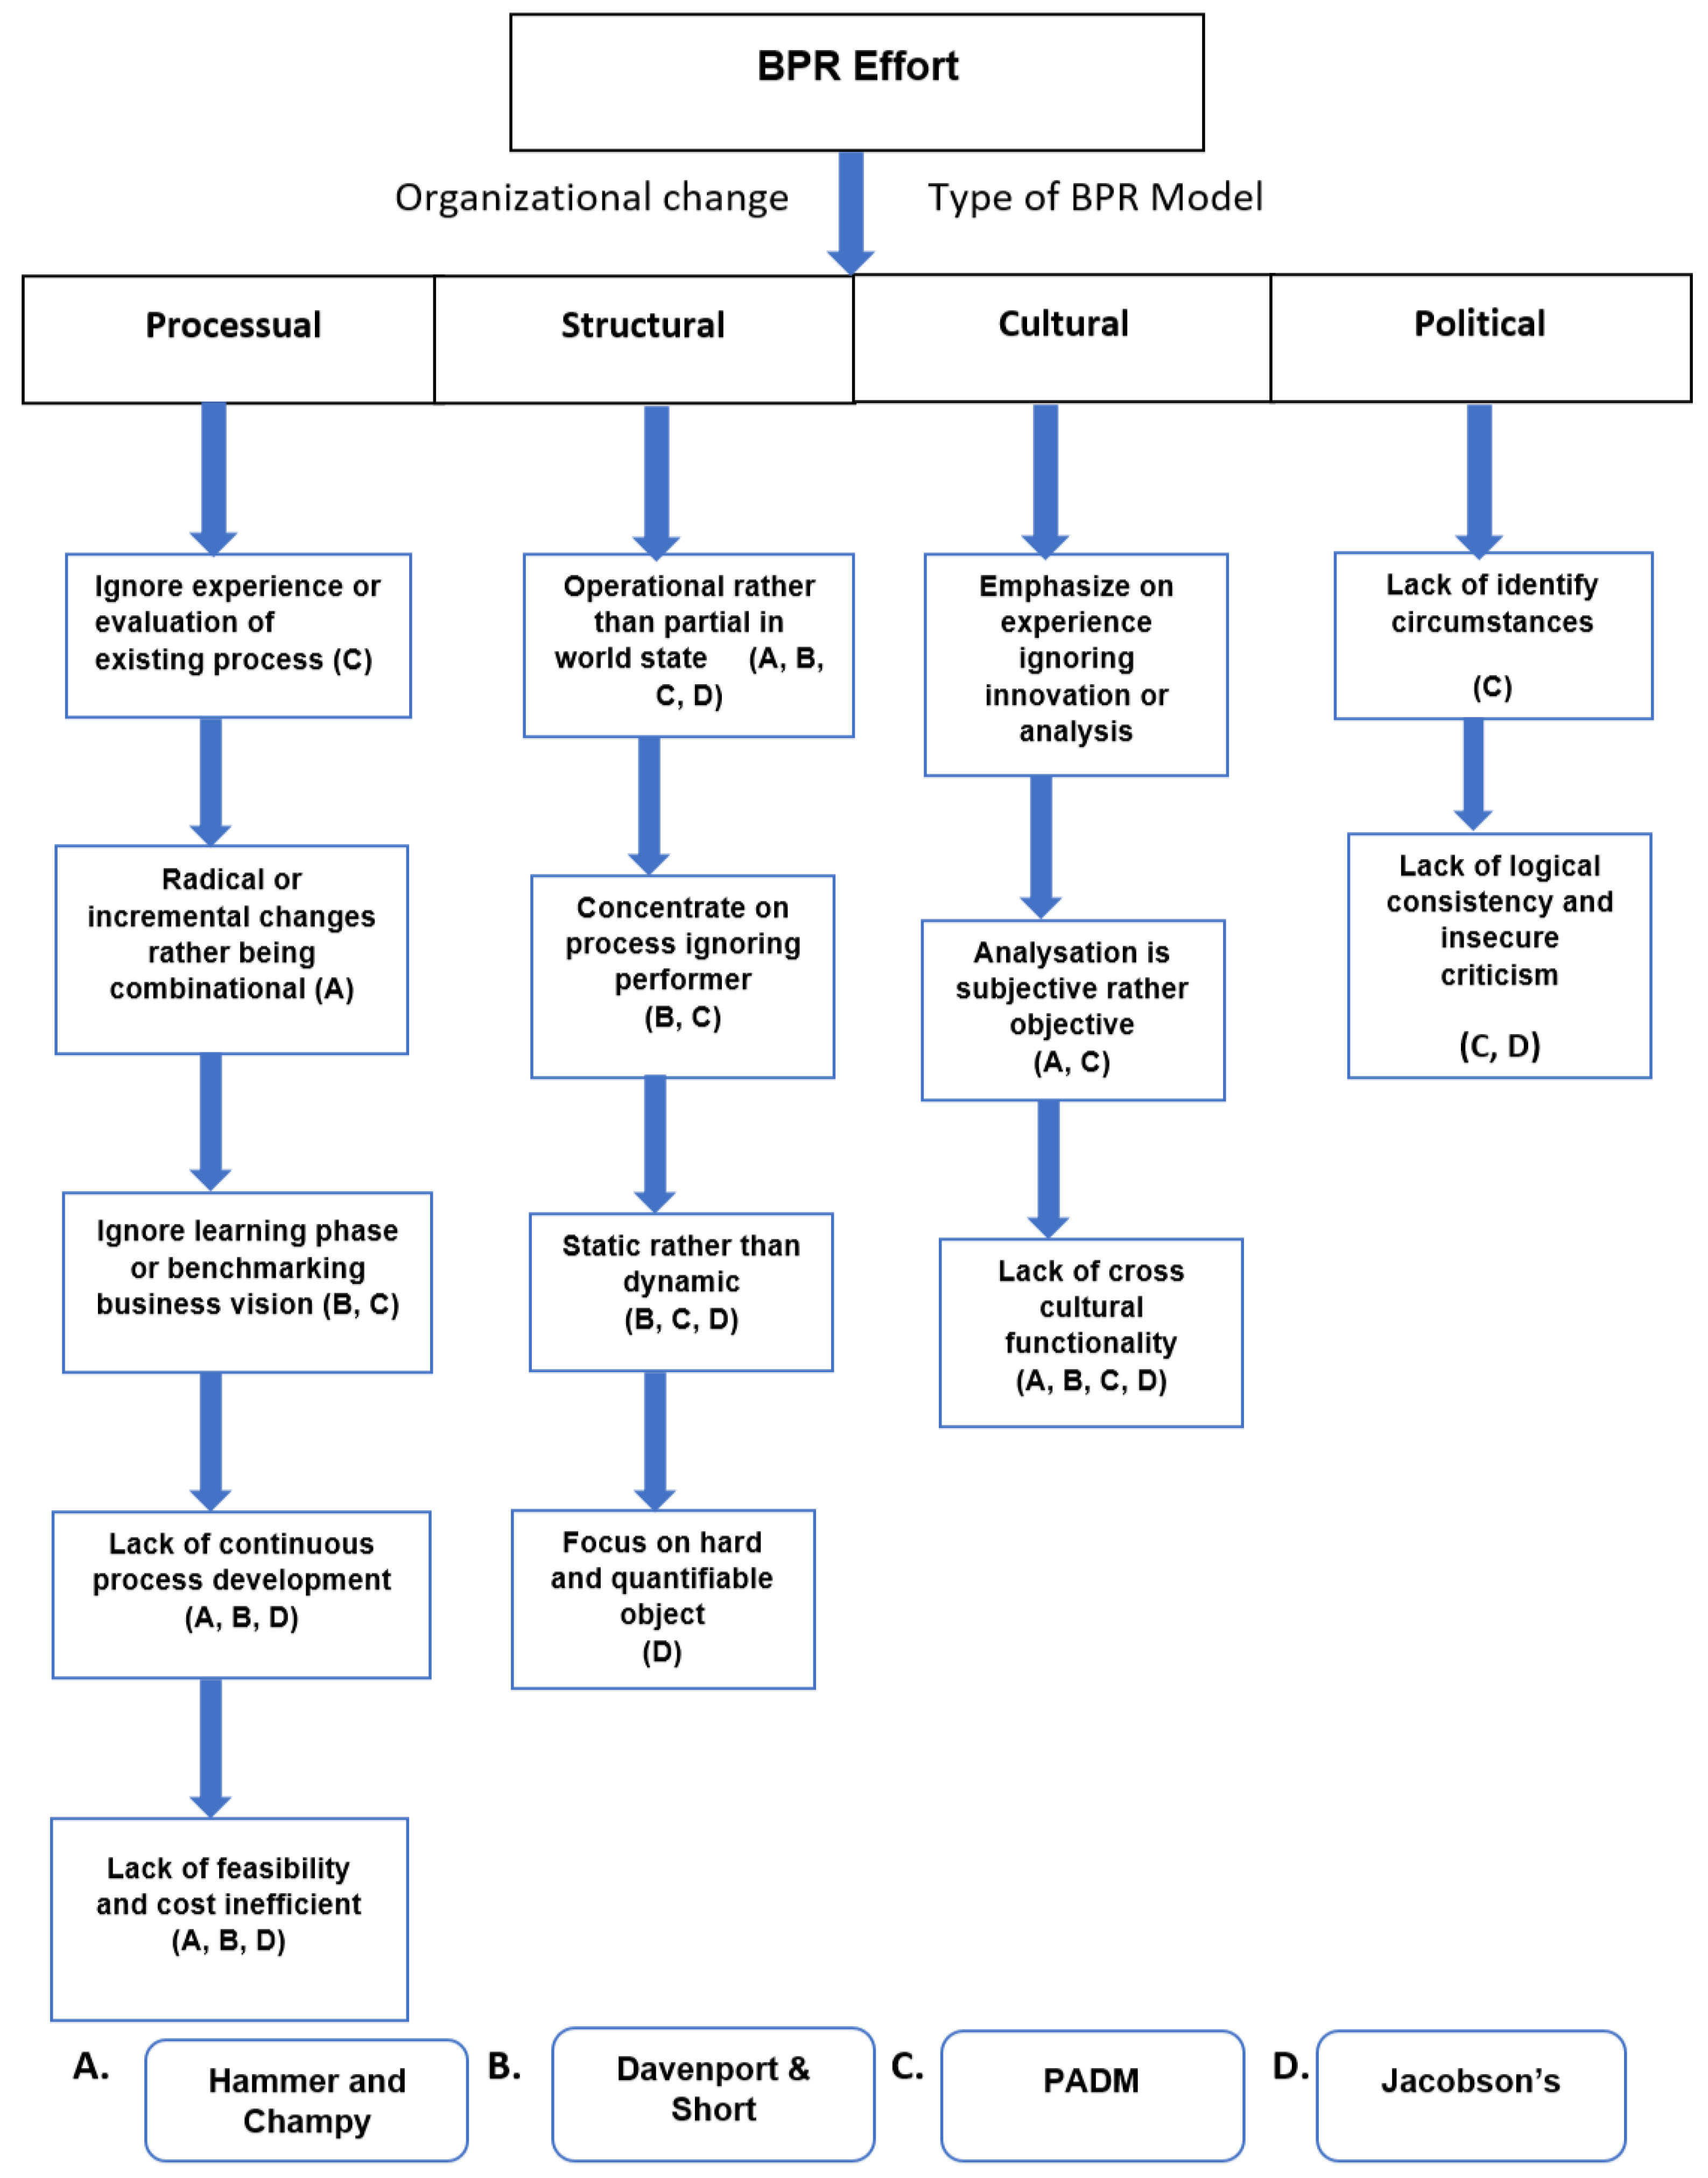
3.1. Limitations of the Existing Processes
The existing BPR methodologies and models are based on the changes and adaptations of an organization rather than practical experience from former implementation and evaluation of the current process [
21]. For example, the PADM framework does not incorporate process evaluation, but uses the strategic business context to design the re-engineered model.
In the existing BPR model, we can see the concentration of process improvement or innovation where key performance indicators have improved in an incremental manner but the integration of interdependency can result in a more sustainable and consistent output [
22]. The comparative analysis of different frameworks in
Figure 6 shows that most of the methodologies do not have a continuous process improvement phase except the PADM framework, which makes the other methodologies quite static. Without the proper evaluation and the initiatives of continuous improvement, it will be very difficult to provide consistent results [
23]. This inconsistency could have a long-term impact on achieving the business vision. Most of the BPR methodologies and models use software development tools that lack the integration of interdependency and can only visualize the conceptual business model [
22]
A major problem of existing BPR models is the cost of implementation. This is due to the costly tools and techniques that the methodologies are based on. Although IT is an important enabler of BPR, we should use IT as an efficiency enabler and not only as a method of automation. Most of the methodologies are well-defined, with deep-rooted theories, but lack feasibility due to cost inefficiency and potential information savings [
23]. The lack of gathered information from the non-participants (not vital to the process reengineering) is another vital issue with all the major BPR methodologies.
One of the most common limitations of the BPR methodologies and models is that they describe the process operation that produces new output with a specified input rather than a partial world state [
24]. Most of the existing BPR models concentrate only on the organizational process without considering management issues and poor geographical location [
22]. As a rule of thumb, most organizations follow up on some soft elements in their development phase and tend to focus more on quantifiable elements during implementation phase.
A very common theme for BPR methodologies is to follow the BPR practitioner’s experience without considering the organizational environment. Some methodologies follow up innovation or environmental analysis without any practical experience [
24]. Most of the BPR methodologies do not run business data analysis in an objective manner while initiating a BPR effort. BPR methodologies should not attempt to cover a wide range of activities for an organization, as the BPR recipe could vary based on business sector and circumstances [
25]. Most of the BPR models do not have a formal underpinning and use graphical notation when mapping or designing business models that lack the logical consistency of the model [
22].
3.2. Implementation Comparison of the BPR Methodologies
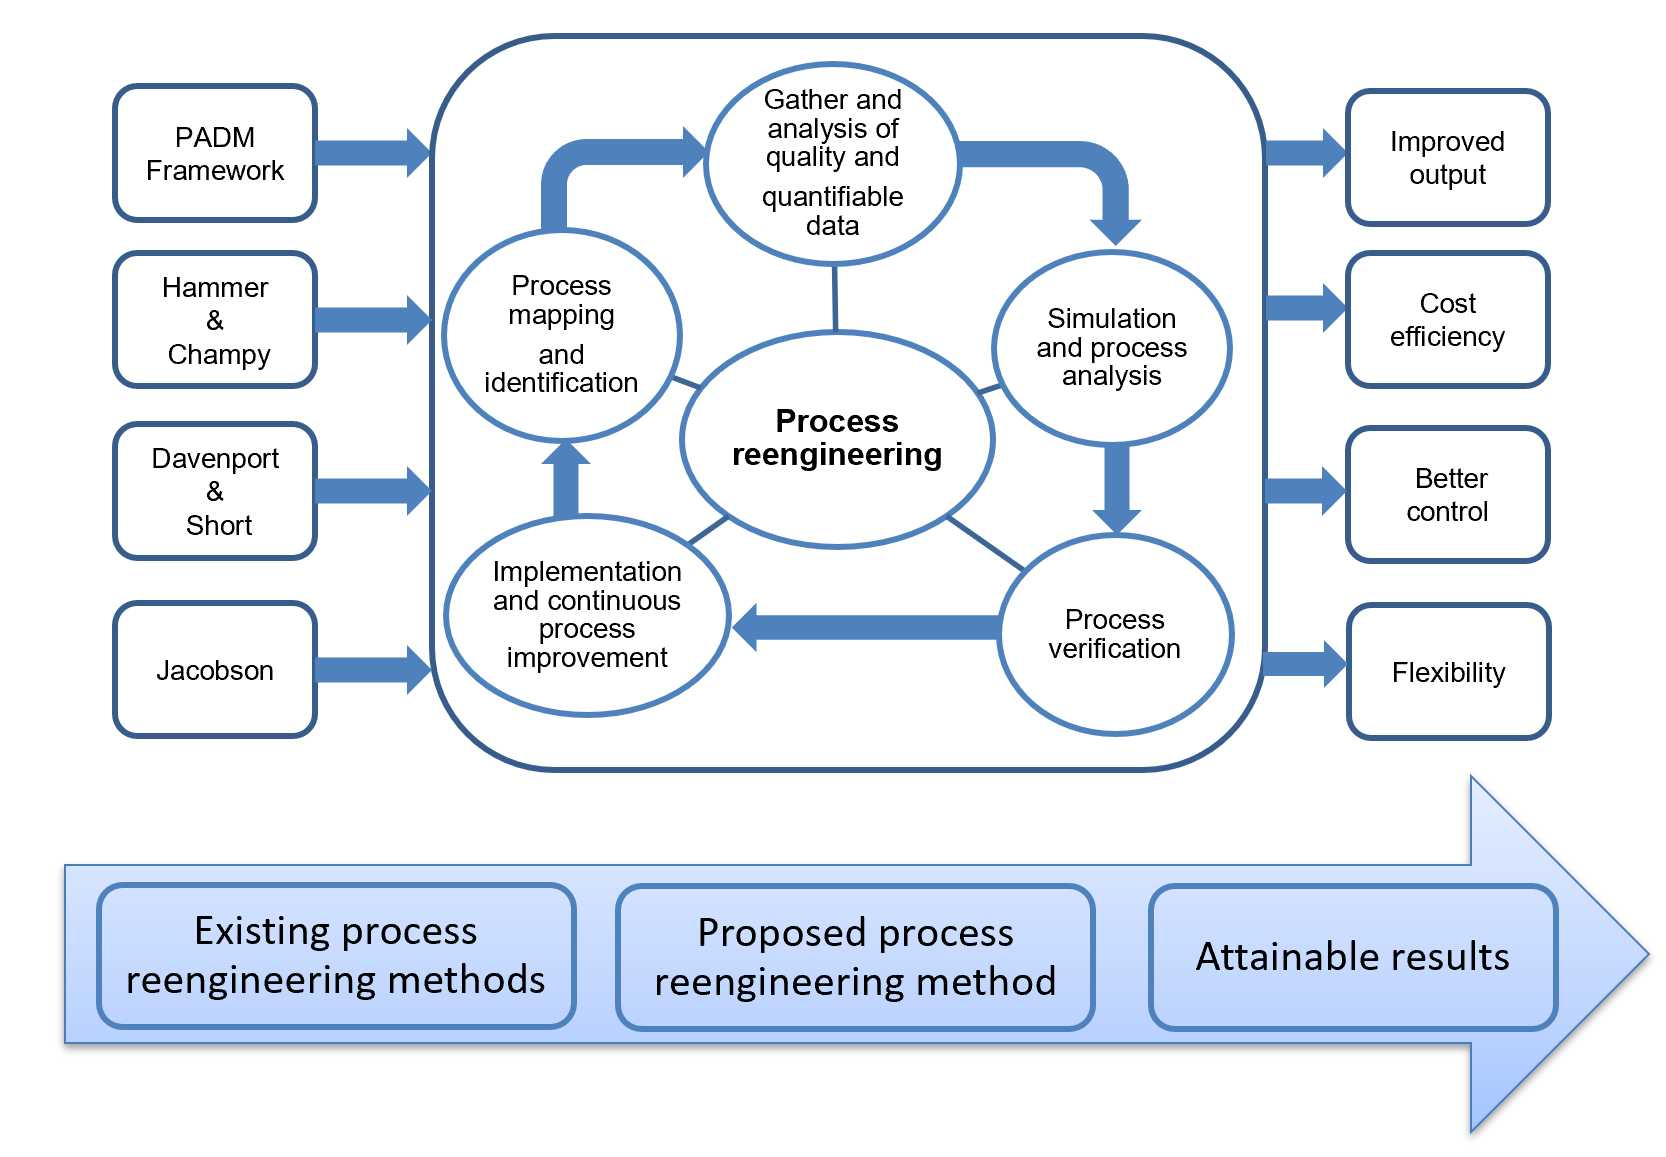
Based on these four methodologies (Hammer/Champy, Davenport/Short, PADM and Jacobson) and their reengineering approaches, a comparison framework was designed, presented in
Figure 7, that provides a clear view of the major BPR methodologies and their approaches.
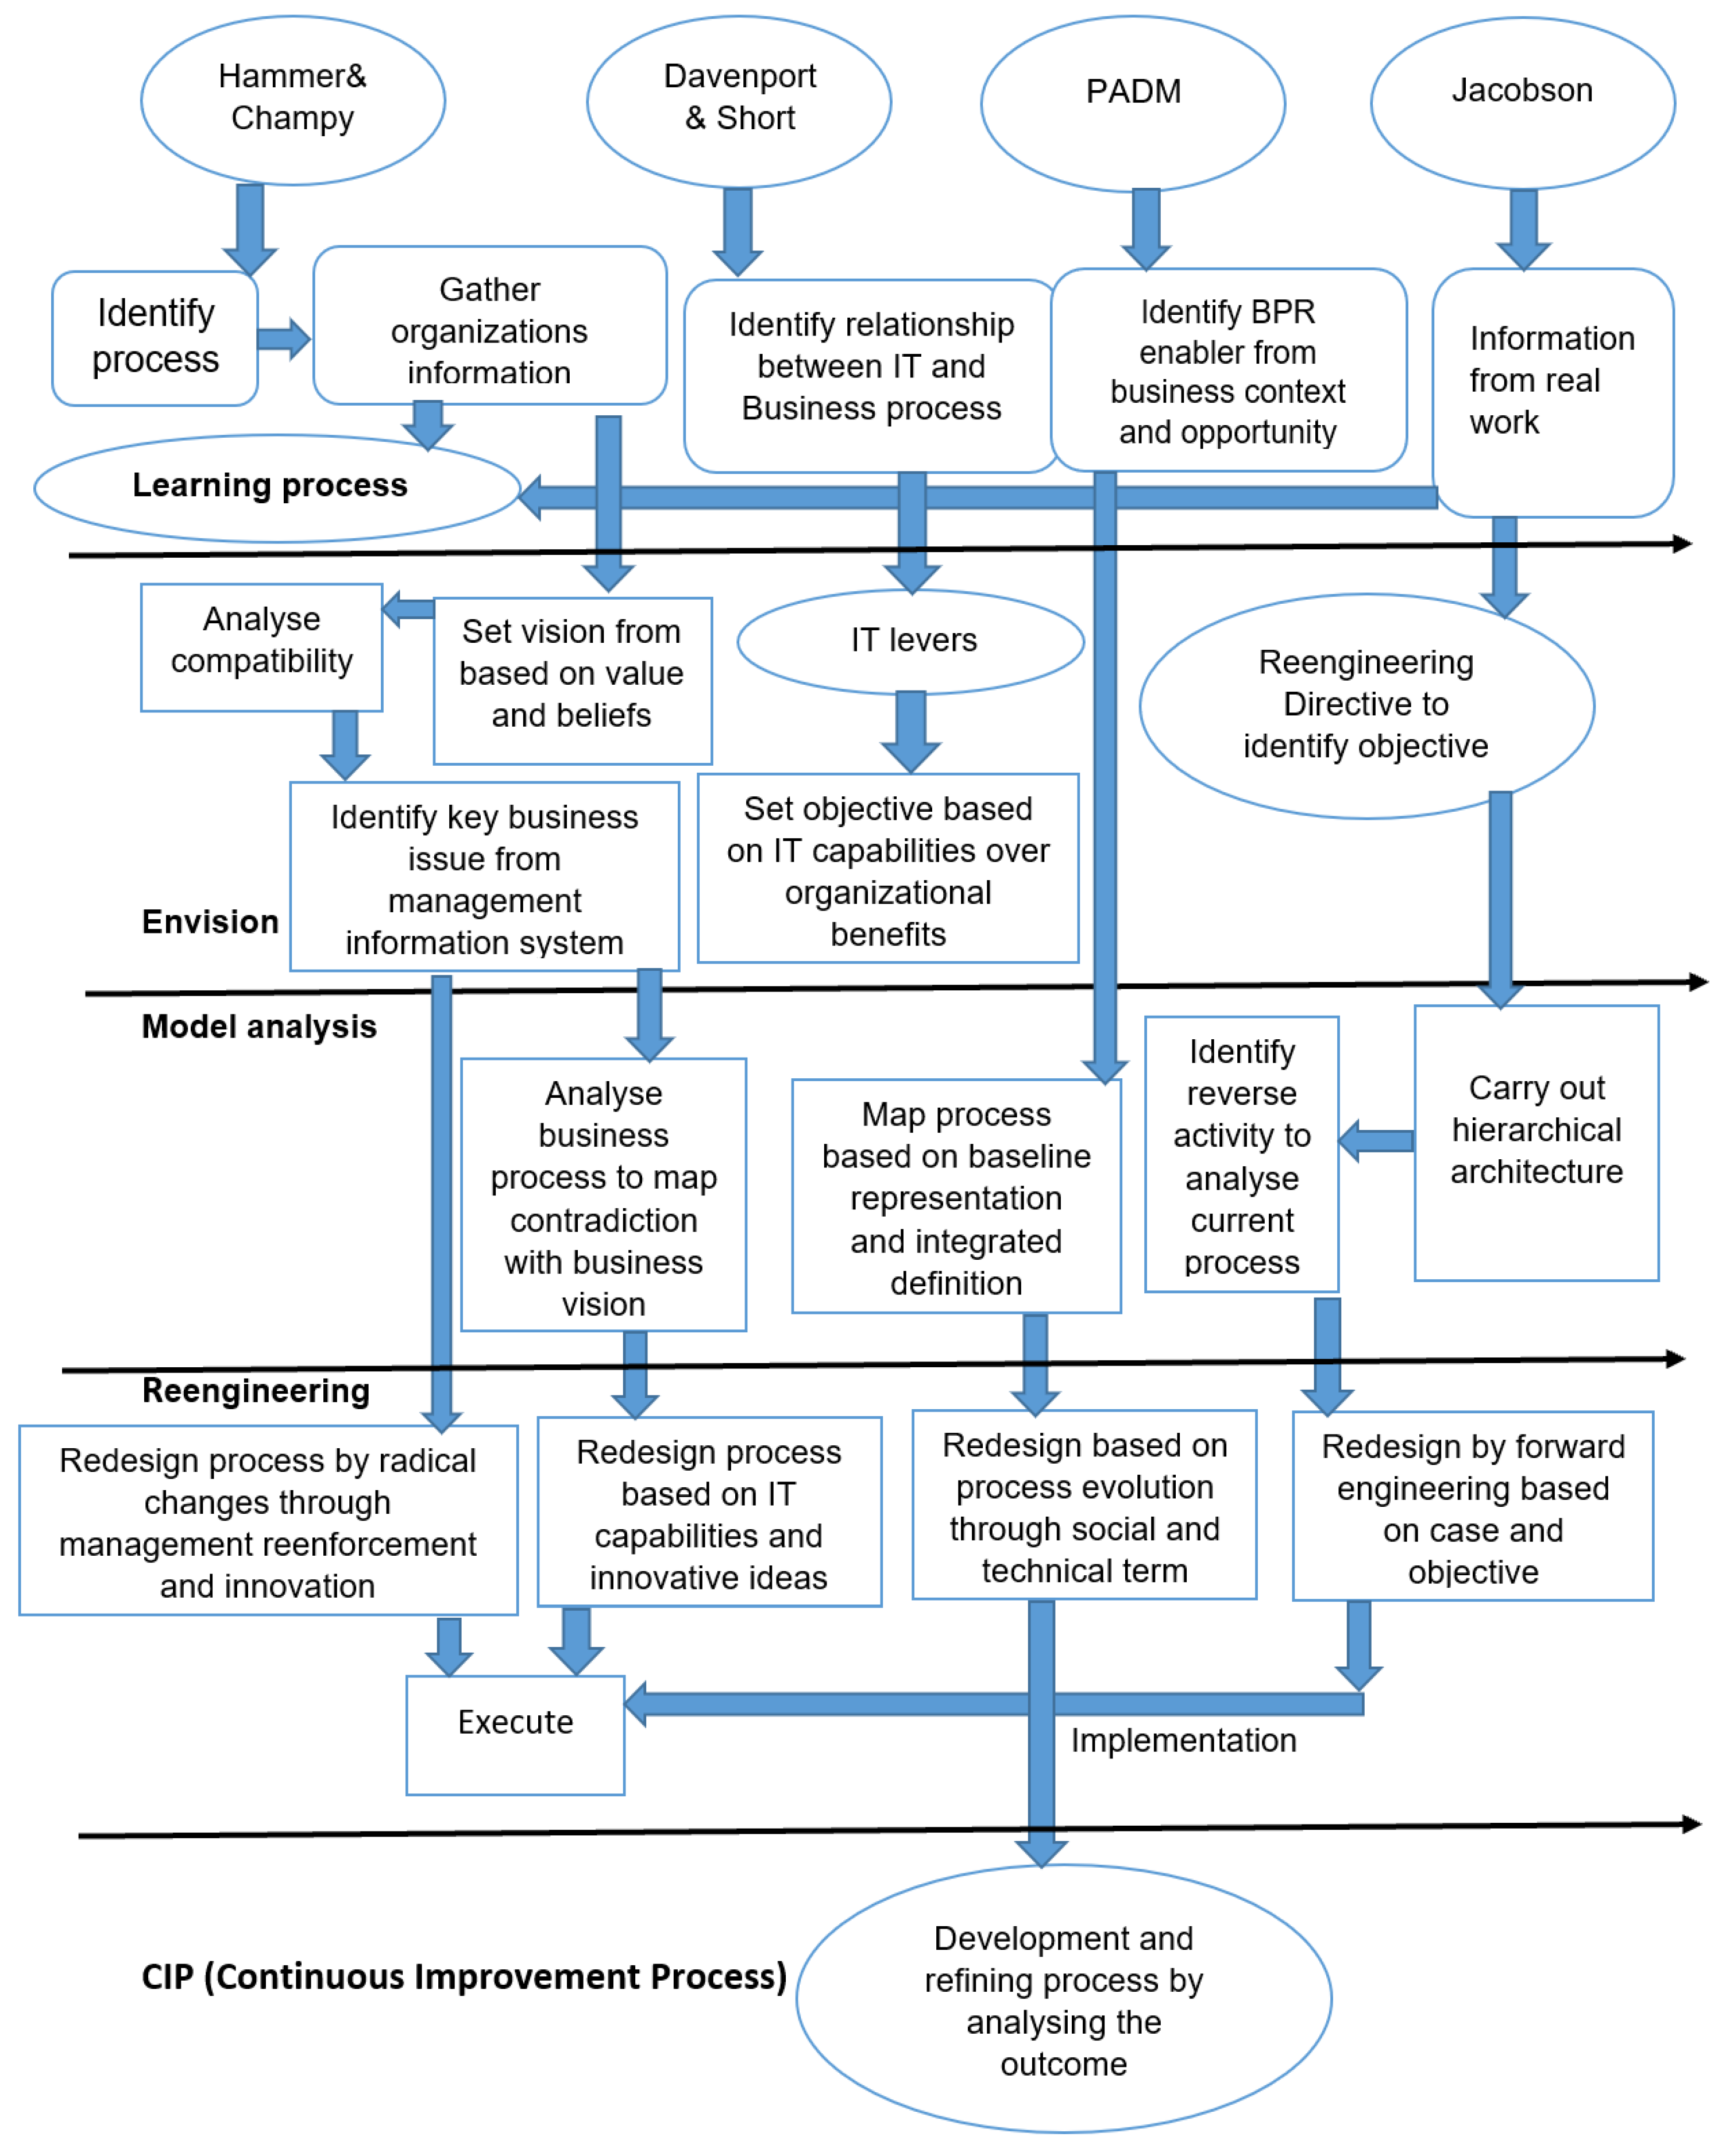
Based on the BPR methodologies mentioned above, we built a framework that provides five phases of BPR projects:
Learning the process;
Business vision;
Mapping and analyzing current phase (model analysis);
Re-engineering the existing processes; and
Continuous process improvement (CPI).
It is evident from
Figure 7 that none of the BPR methodologies have the continuous improvement (CPI) phase except the PADM framework, which does not investigate the learning and business vision phase, but emphasizes continuous improvement based on analyzing the current process and redesigned process. The other three methodologies are similar in the number of phases except Jacobson’s object-oriented methodology, which follows every phase except the continuous process improvement phase. The above-discussed methodologies are summarized in
Table 2 and their generic description is given in
Section 3.2.1,
Section 3.2.2,
Section 3.2.3,
Section 3.2.4 and
Section 3.2.5.
3.2.1. Learning Process Phase
Two of the above-mentioned methodologies (Hammer/Champy and Davenport/Short) include a process learning phase where the BPR team collects data on technological capabilities, customer requirements, competitors and successful organizational operation. This can be included in the BPR effort as a learning process, as it gives provides information about customer satisfaction and the position of the company in the current market and business strategy. For example, Hammer and Champy have emphasized the importance of training sessions for employees to enhance the learning process, as it can help in the development of possible solutions when there is a need to incorporate changes in an existing process [
13].
3.2.2. Create a Business Vision (Envisioning Phase)
Every organization should have a business vision that could be based on business ethics, organizational culture or simply just as a part of business development. Creating a business vision helps the organization to compare its growth with regard to its desired targets. It is an integral part of a BPR effort unless the BPR effort is about the evaluation of the current process. For example, the PADM framework incorporates process evaluation to redesign the new processes instead of simply focuses on existing processes.
3.2.3. Modelling and Analyzing or Mapping Current Processes
There are different aspects that have created some debate about the modelling and analysis of the current business processes, as some researchers believe and describe it as a modelling strategy, which is time consuming and hinders the implementation of innovative ideas, while others recognize it as a fundamental issue of a successful BPR effort [
18,
21]. However, the analysis of the current business processes identifies the problems and the opportunities for bringing change to improve the current processes. Hammer and Champy’s methodology incorporates understanding existing phases, while others incorporate the modelling strategy.
3.2.4. Modelling and Analyzing Processes or Re-engineering the Process
This phase is a requirement for any BPR effort and is supported by every BPR methodology. This is the visualization of the future state of a process that has one or more than one reengineering option (in most cases). This can be termed the ‘to-be process’, which is evaluated based on the strategic objectives against expected benefits. The outcome is the neglected problem of the process and analyzes it further to examine and simulate the best applicable processes.
3.2.5. Transition to a Continuous Process Improvement Effort (CPI)
Most of the BPR methodologies do not include this phase, with the exception of PADM. It strengthens the BPR effort and allows further investigation into implementing the reengineered process and works as a refiner of the organization′s processes that need to be implemented to achieve the best outcomes. However, in some scenarios the CPI is used as an everyday task that looks like a radical change of processes after a certain period.
3.3. Integration Possibilities of the Manufacturing Process and Process Reengineering
One of the major problems with process reengineering is the failure to implement the changes required to optimize a process. Changes in manufacturing process are more difficult to implement because of their complex and inter-dependent nature. However, a process reengineering technique that considers the data from the manufacturing process to identify problems and make changes by eliminating those issues could be a good solution to solve this problem. In a manufacturing process, simulation can be used to identify the possible outcomes by verifying the possible output. Existing software packages like WITNESS 21 Horizon that can simulate both the service and production line can be useful to identify and map the process and optimize it by analyzing the data.
3.4. Data in Manufacturing Industries
Manufacturing organizations are going through a transformation from traditional to highly optimized manufacturing processes [
26,
27,
28]. With the high pace of technological advancement, manufacturing processes require a reengineering approach that is flexible and has a high success rate. Manufacturing organizations are focusing on smart manufacturing facilities by creating manufacturing intelligence to provide real-time data that will help to create a decision support system to bring about changes in the process or organization [
29,
30]. The developments in digital electronics and cyber–physical systems, the internet of things (IOT) and computer integrated systems have delivered technologies that help create a better understanding of the process and its analysis [
31,
32,
33]. These massive amounts of data have created a new paradigm of integrating data in process reengineering approaches to optimize the manufacturing process.
4. Proposed Data-Driven Process Reengineering
BPR efforts need to have a clear objective and the right information on the business organization to be successfully implemented. From the comparison of the existing BPR methodologies described in
Table 2, it is very clear that most of the BPR methodologies follow similar procedures, except for some differences in the manner of collecting process information and the approach to designing a process. Among the methodologies, some of the processes have phases that are essential to understanding the organizational environment, while others overlook them, following different phases that are indeed essential, but due to absence of some strategic steps, the risk rises significantly that successful implementation will be hindered. A process reengineering (PR) effort should have an adoption and a contingency plan to face the challenges that may arise during the process implementation phase. Manufacturing organizations evaluate the value of the traditional process that is being achieved using long-term experience of the organizational structure. When a PR initiative is undertaken, the organization needs to keep in mind the dependency issues of the PR practice.
Figure 7 shows that in most cases the challenges that arise in BPR implementation are driven by the other issues that are implemented without realizing the impact that they can have on other steps.
The proposed BPR methodology incorporates data and simulations to identify and map the process. The methodology starts with the process mapping technique and maps the process in the WITNESS simulation software through the identification and collection of data. Once the process is mapped, it goes through a verification stage comparing the data between existing production line data and the simulation data. After the process is verified, the reengineering phase runs a simulation with the required changes based on the collected data and analyzes the outcome through a goodness-of-fit test. This methodology tends to eliminate the risk of failure to implement the changes by simulating the possible outcomes before implementation, which decreases the risk of failure.
4.1. Overview of the Proposed Approach
The aim of this research was to design a process reengineering technique using organizational data, and a simulation and verification process for optimization. The process started with the process reengineering methods described in the literature review, with an additional verification technique added to measure the efficiency of changing the process. This proposed methodology uses simulation and analyzes the output as a result of the changes made in every step before implementation. It is to be noted that the proposed methodology is designed as a technique of manufacturing process reengineering and optimization. The steps of the methodology are described in the following
Section 4.1.1,
Section 4.1.2,
Section 4.1.3,
Section 4.1.4 and
Section 4.1.5.
4.1.1. Process Mapping and Identification
Process identification refers to identifying working procedures of a process. The process will be mapped through process identification and data using WITNESS Horizon 21 simulation package (Lanner Group, Warwickshire, UK). The data will be collected from the process and the production line and once the process is identified it will be mapped in WITNESS.
4.1.2. Gathering Quantifiable and Quality Data
Process data (production line data) is the most important part of the proposed process reengineering technique. To map the process, the accuracy of the data is very crucial. Incorrect and unnecessary data will decrease the accuracy of the model [
34]. Incorrect data and inappropriate analysis can mislead the simulation output. In general, for large sets of data, statistical analyses are often used in simulations. They play a vital role in ensuring that an acceptable and realistic result is obtained through the use of simulation packages.
4.1.3. Process Reengineering
The proposed PR technique uses a simulation package (WITNESS Horizon 21) to examine the reengineering approaches. The changes that will be made as a re-engineered model will be implemented on the simulation model. As the model is designed based on the actual process and data, ideally it should also represent the changes. However, to ensure the accuracy of the results, a verification and validation process will be used.
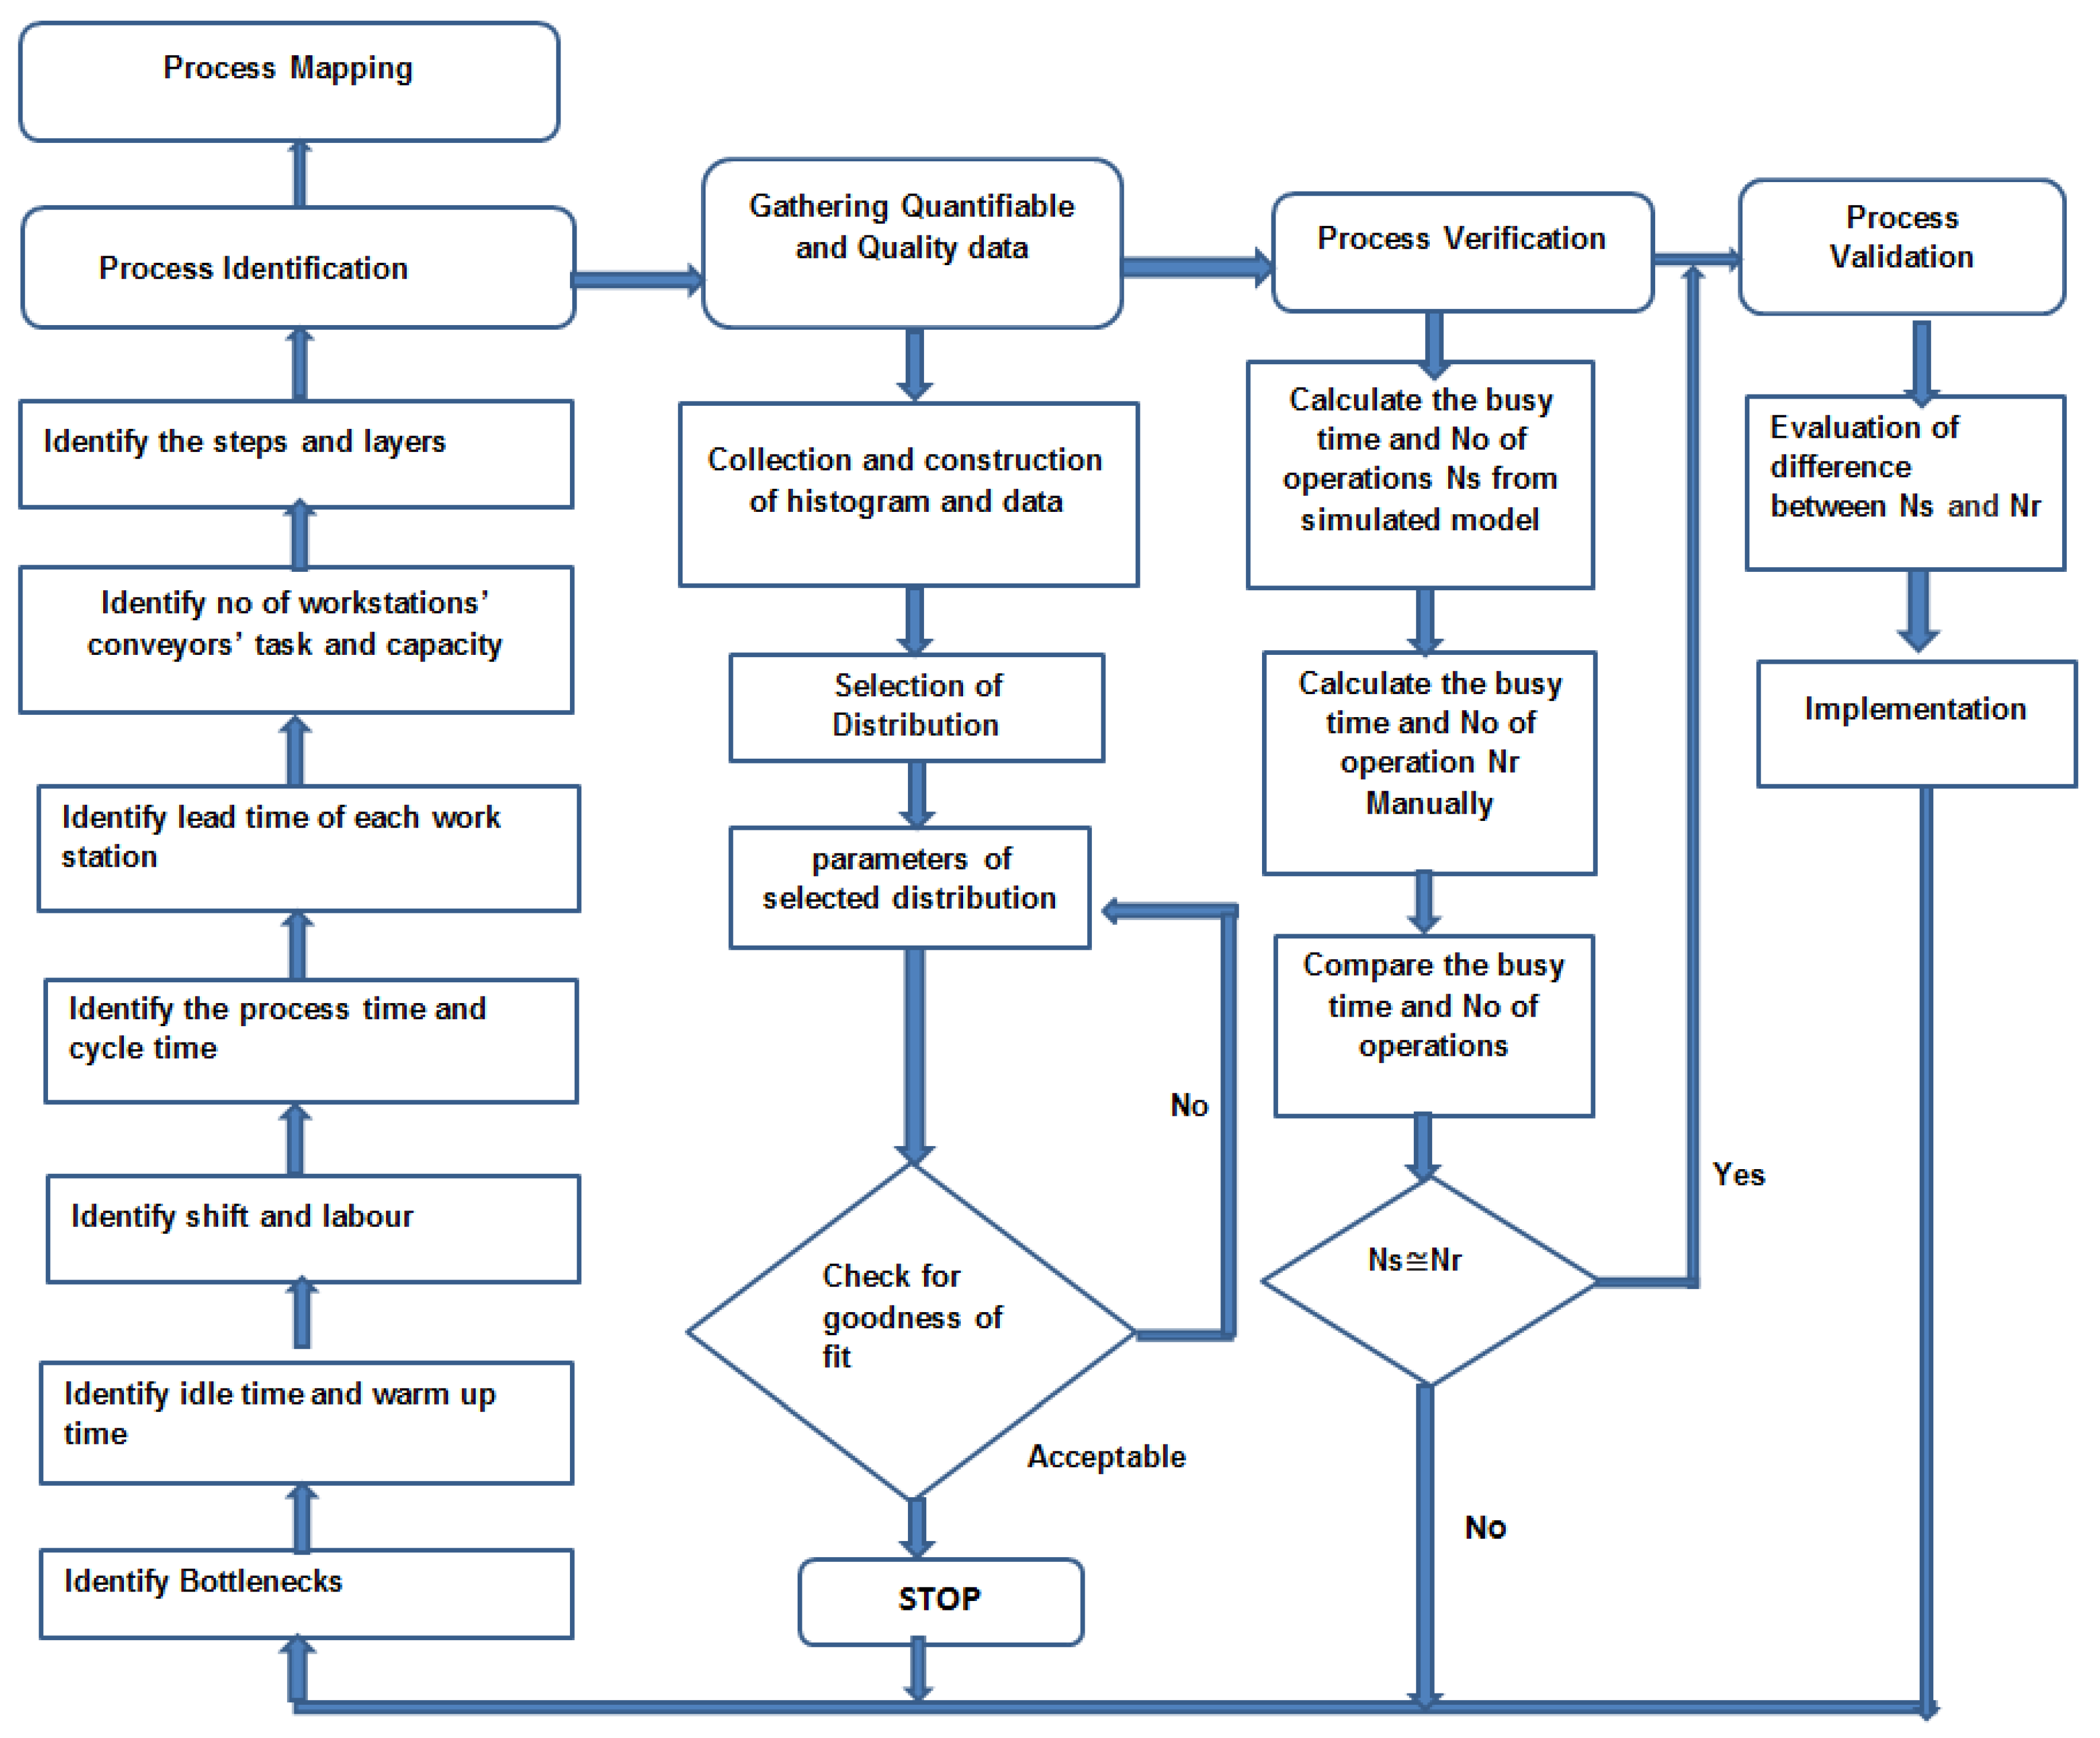
In
Figure 8, the data driven process reengineering technique is set out. This process incorporates gathering quantifiable data and analysis before the reengineering phase. Once the reengineering process is completed, process verification is performed to analyze the consistency of the changes made to optimize the process.
4.1.4. Model Verification Technique
As a verification technique, the output data of the model will be compared. Based on the busy time of machines, the number of operations will be computed and compared with the number of operations from the simulations according to the following equations.
Equations:
| Total number of operations (simulation) = Ns |
| Busy time of machines = n% (n = 0, 1, 2…. 100) |
| Mean of the distribution of the machine cycle time = t min |
| Working time = T min = {no. of shifts × no. of days of operation × (shift length × 60)} |
No. of operations Nr = (machine busy time × working time)/machine cycle time
= (n × T min/t min) units. |
If Nr ≅ Ns, the simulation samples will be verified.
4.1.5. Process Validation
The validation of the process mapping will run by evaluating the differences between manual production and the simulation output Nr ≅ Ns.
If the level of significance is
α and
P value (two-tailed)
β and
β >
α, the null hypothesis will not be rejected, thus the model will be validated as an accurate representation of the production line.
Section 5 will analyze the steps involved in the implementation of the proposed data-driven PR methodology.
5. Analysis of the Proposed Methodology Implementation Technique
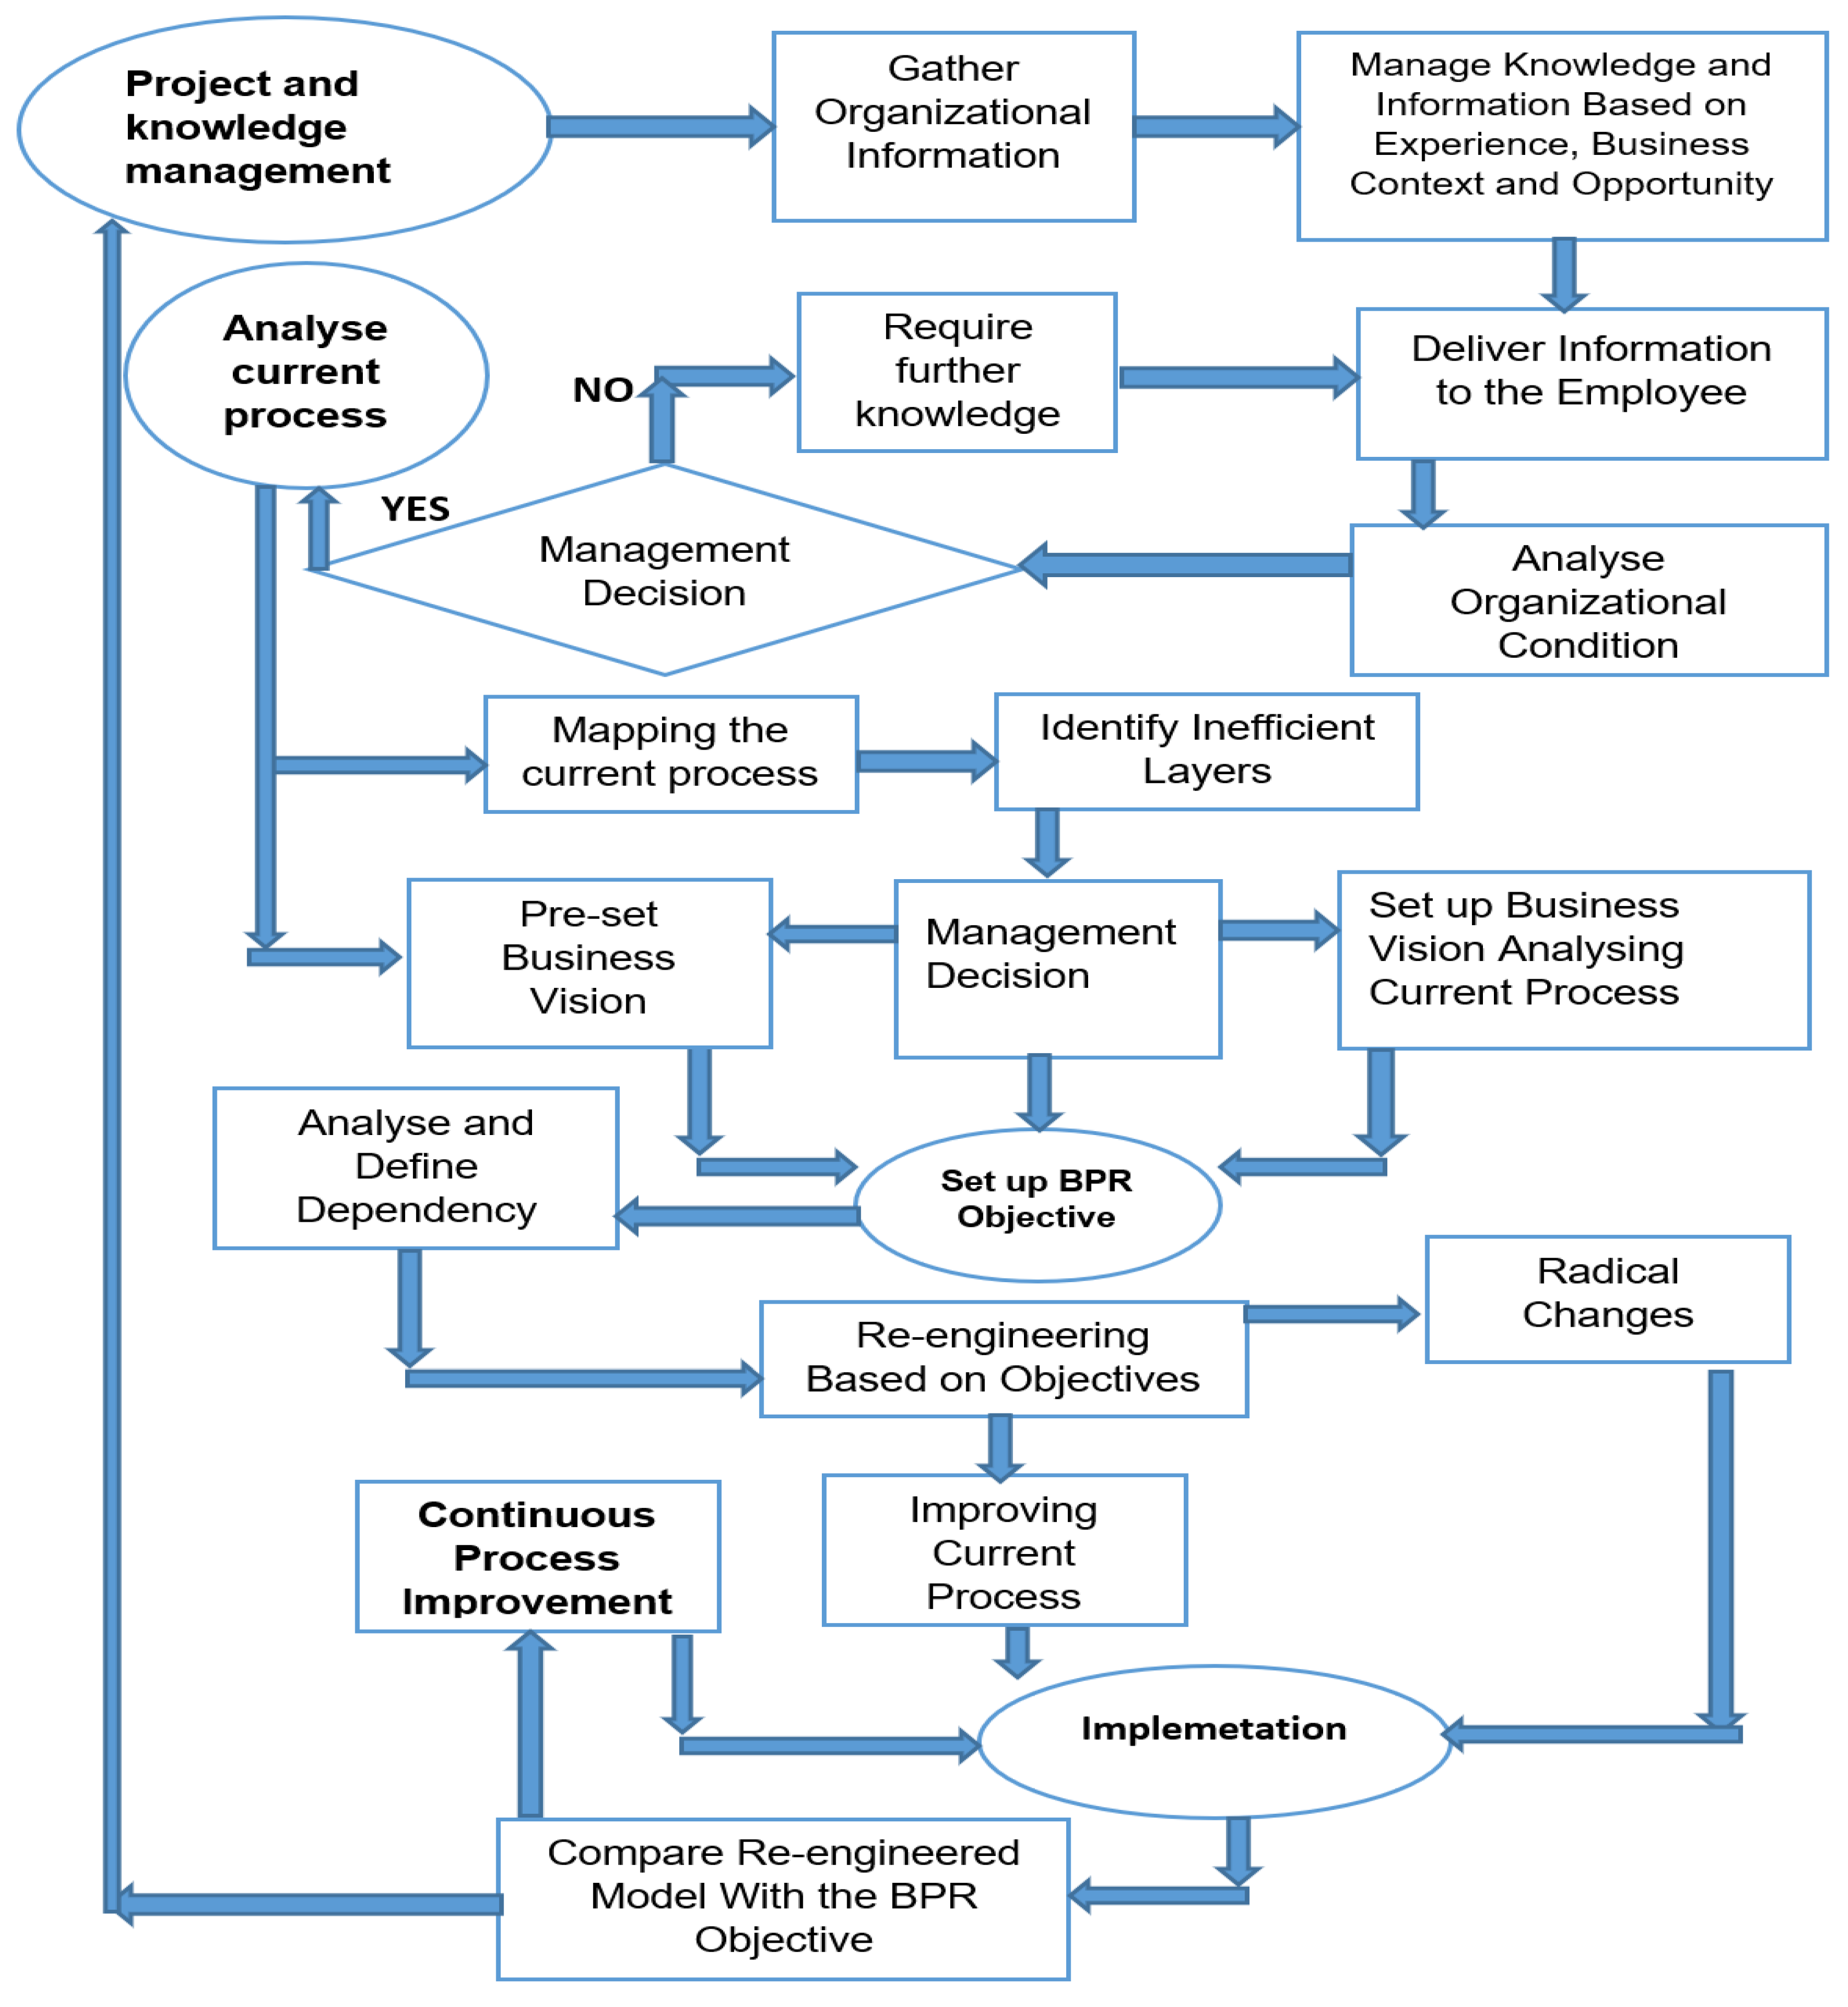
The proposed model is the integration of the four discussed BPR methodologies (Hammer/Champy, Davenport/Short, PADM and Jacobson). It utilizes the tools and techniques of the existing BPR methodologies to its advantage. It differs from the existing BPR methodologies due to its adaptability, more integrated approach that incorporates data analysis, and outcome measurement through simulation before implementation. The existing BPR methodologies have a fixed set of tools, techniques and approaches. The data-driven PR model determines its tools and techniques based on the requirements by analyzing each phase before and after implementation. An implementation framework of the proposed methodology is described in
Figure 9.
5.1. Project and Knowledge Management Contingency Plan
Due to increasing market demands, PR is becoming more complex. To cope with this complexity, PR efforts should be placed under a project management contingency plan. To understand the PR requirements, manufacturing organizations should have a contingency plan among the employees or PR teams. When management identifies the need for change in the process, the information should include the views of the employees and their reaction to management decisions. To deliver the change information, management can arrange some orientation sessions with the aim of managing knowledge about the organization’s present condition. It will create a better route to implementation if the organization mixes and matches the views of BPR specialists and organizational members who will perform the PR.
Modern project management techniques and approaches can design BPR efforts as individual projects to identify their requirements and manage risks by utilizing various risk assessment techniques. Once the organization has recorded the ideas of their employees and their knowledge level, further procedures can be initiated.
5.2. Analysing Organizational Process Inefficiency and Setting up New Business Visions
The existing BPR methodologies, except the PADM framework, embody the phase vision or the business vision. However, most of these do not fix a business vision based on the process analysis report. A business vision can be understood as a requirement of the PR implementation as an objective of the BPR effort. In such a context, setting up a vision without analyzing the current business process can be unrealistic, as in most cases management expectations tend to limit the possible outcomes as no consideration has been made to measure the achievability of the objectives in comparison to the available resources and effort.
In the proposed model, the business vision is fixed based on two states of the organizational situation. The first is the analysis of the current process, which will provide a framework for the organization’s hierarchical structure, and the second is comparing the existing structure and efficiency to the objective that an organization wants to achieve or develop as its business vision by eliminating the unproductive steps.
In most BPR efforts, organizations try to implement BPR projects as a part of business development by improving the current processes or implementing new ideas. The problem with the structured and fixed procedures of the existing BPR methodologies is the complexity of the identification of the BPR objective based on the present condition. The current condition of the organization is very important, as this will provide information about the BPR implementation, whether it needs to be developed from the current process or a whole new idea needs to be generated.
The opportunity presented by the process analysis will provide the scope and the objectives, which will be more accurate, realistic and achievable based on both innovative ideas and traditional experience depending on the organizational development.
Without knowledge of the current condition and efficiency of the organization, developing any objective and initiative can lead the PR efforts towards failure.
5.3. Setting BPR Objective Based on the Business Vision
Once the business vision is fixed by analyzing or mapping the current process, the changes within the process will be very clear. The analysis report of the existing process will provide the objectives of the BPR. The proposed methodology with the simulation model and output will automate a clear set of PR objective that is initiated from the existing process analysis, and hence will have less chance of picking up the wrong initiatives.
5.4. Re-engineering the Process Based on Organizational Knowledge or Innovative Ideas
This is phase is common to each of the existing BPR methodologies. However, most of the BPR methodologies do not allow a parallel development process. For example, Hammer and Champy’s model suggests reengineering by radical changes, while Davenport’s methodology suggests IT capabilities or innovation. The PADM framework recommends process evaluation through social and technical inefficiencies, and Jacobson’s objective-oriented methodology re-engineers the process based on the case and objective of the organization through forward engineering. The data-driven PR does not contradict existing methodologies. It incorporates data analysis and simulation as IT enablers, and verification and validation as a process of risk elimination.
5.5. Continuous Improvement Plan to Compare the Outcomes with the Business Vision
The existing BPR methodologies do not have any continuous process improvement plan except the PADM framework. The proposed model analyzes each phase by evaluating the data of the PR effort. As a continuous process improvement plan, the data-driven process reengineering model uses simulations to measure the effect of changes before and after the implementation of a phase. It allows further investigation based on the report of each phase that filters the mistakes and inefficiencies to run alongside the BPR objective.
6. Case Study
To investigate and examine the proposed PR methodology, a production line for valves was studied. The data and the production layout were extracted from the Lanner Group WITNESS Training Manual to examine using WITNESS simulation package. The WITNESS simulation package used here was WITNESS Horizon 21 (Service Edition). Manufacturing organizations face big challenges, as implementing changes as an experiment is expensive and the risks associated with this are very high. The data used were from the production line and no unstructured or semi-structured data were used. The generic PR steps were used with the addition of process verification and analysis. The PR methodology used for this case study is described in
Figure 10.
6.1. Process Identification
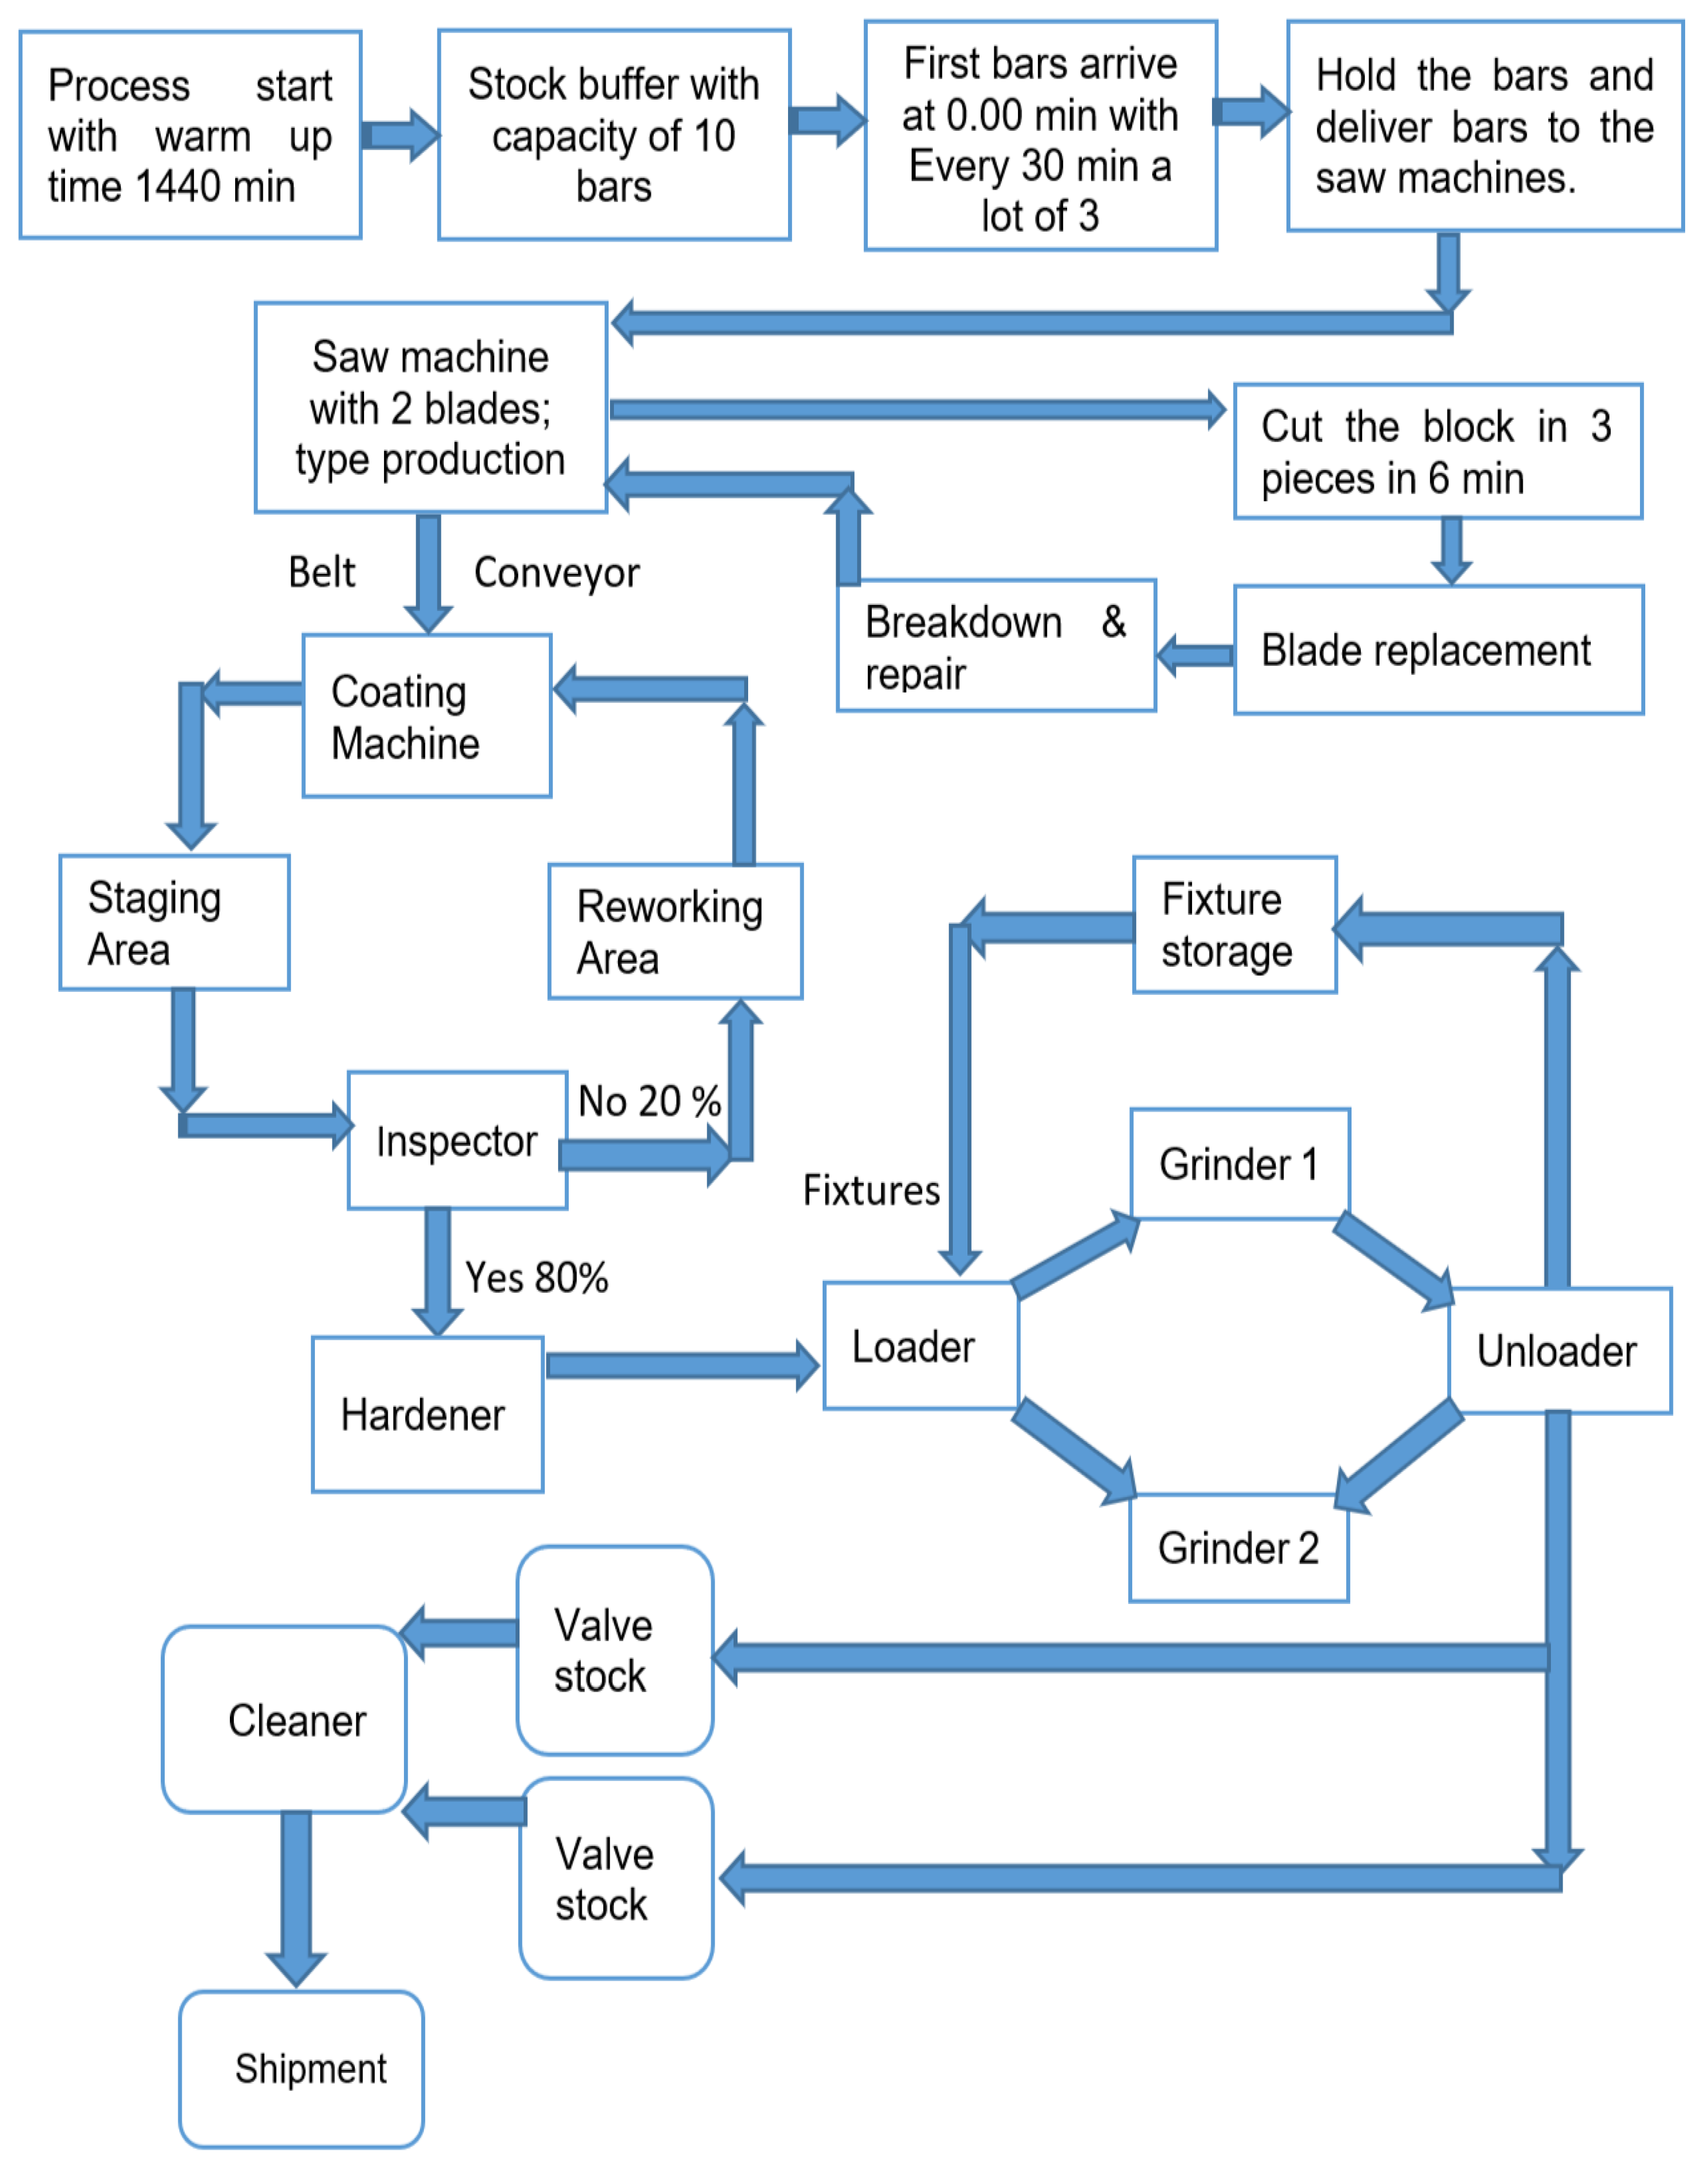
The valve manufacturing process has different stages from stock to shipment. The process was identified based on the data and the working procedure. From the stock to the shipment of the product, the entire process has six different steps or blocks. These are:
Based on the data and the working procedure a process was identified and is shown in
Figure 10.
6.2. Mapping the Process
The process mapping (PM) has six different steps similar to the process identification. The mapping process was completed using WITNESS Horizon 21 (Service Edition). This simulation package allowed us to experiment with both production and the service area. However, in this research only the production area was used due to a lack of data.
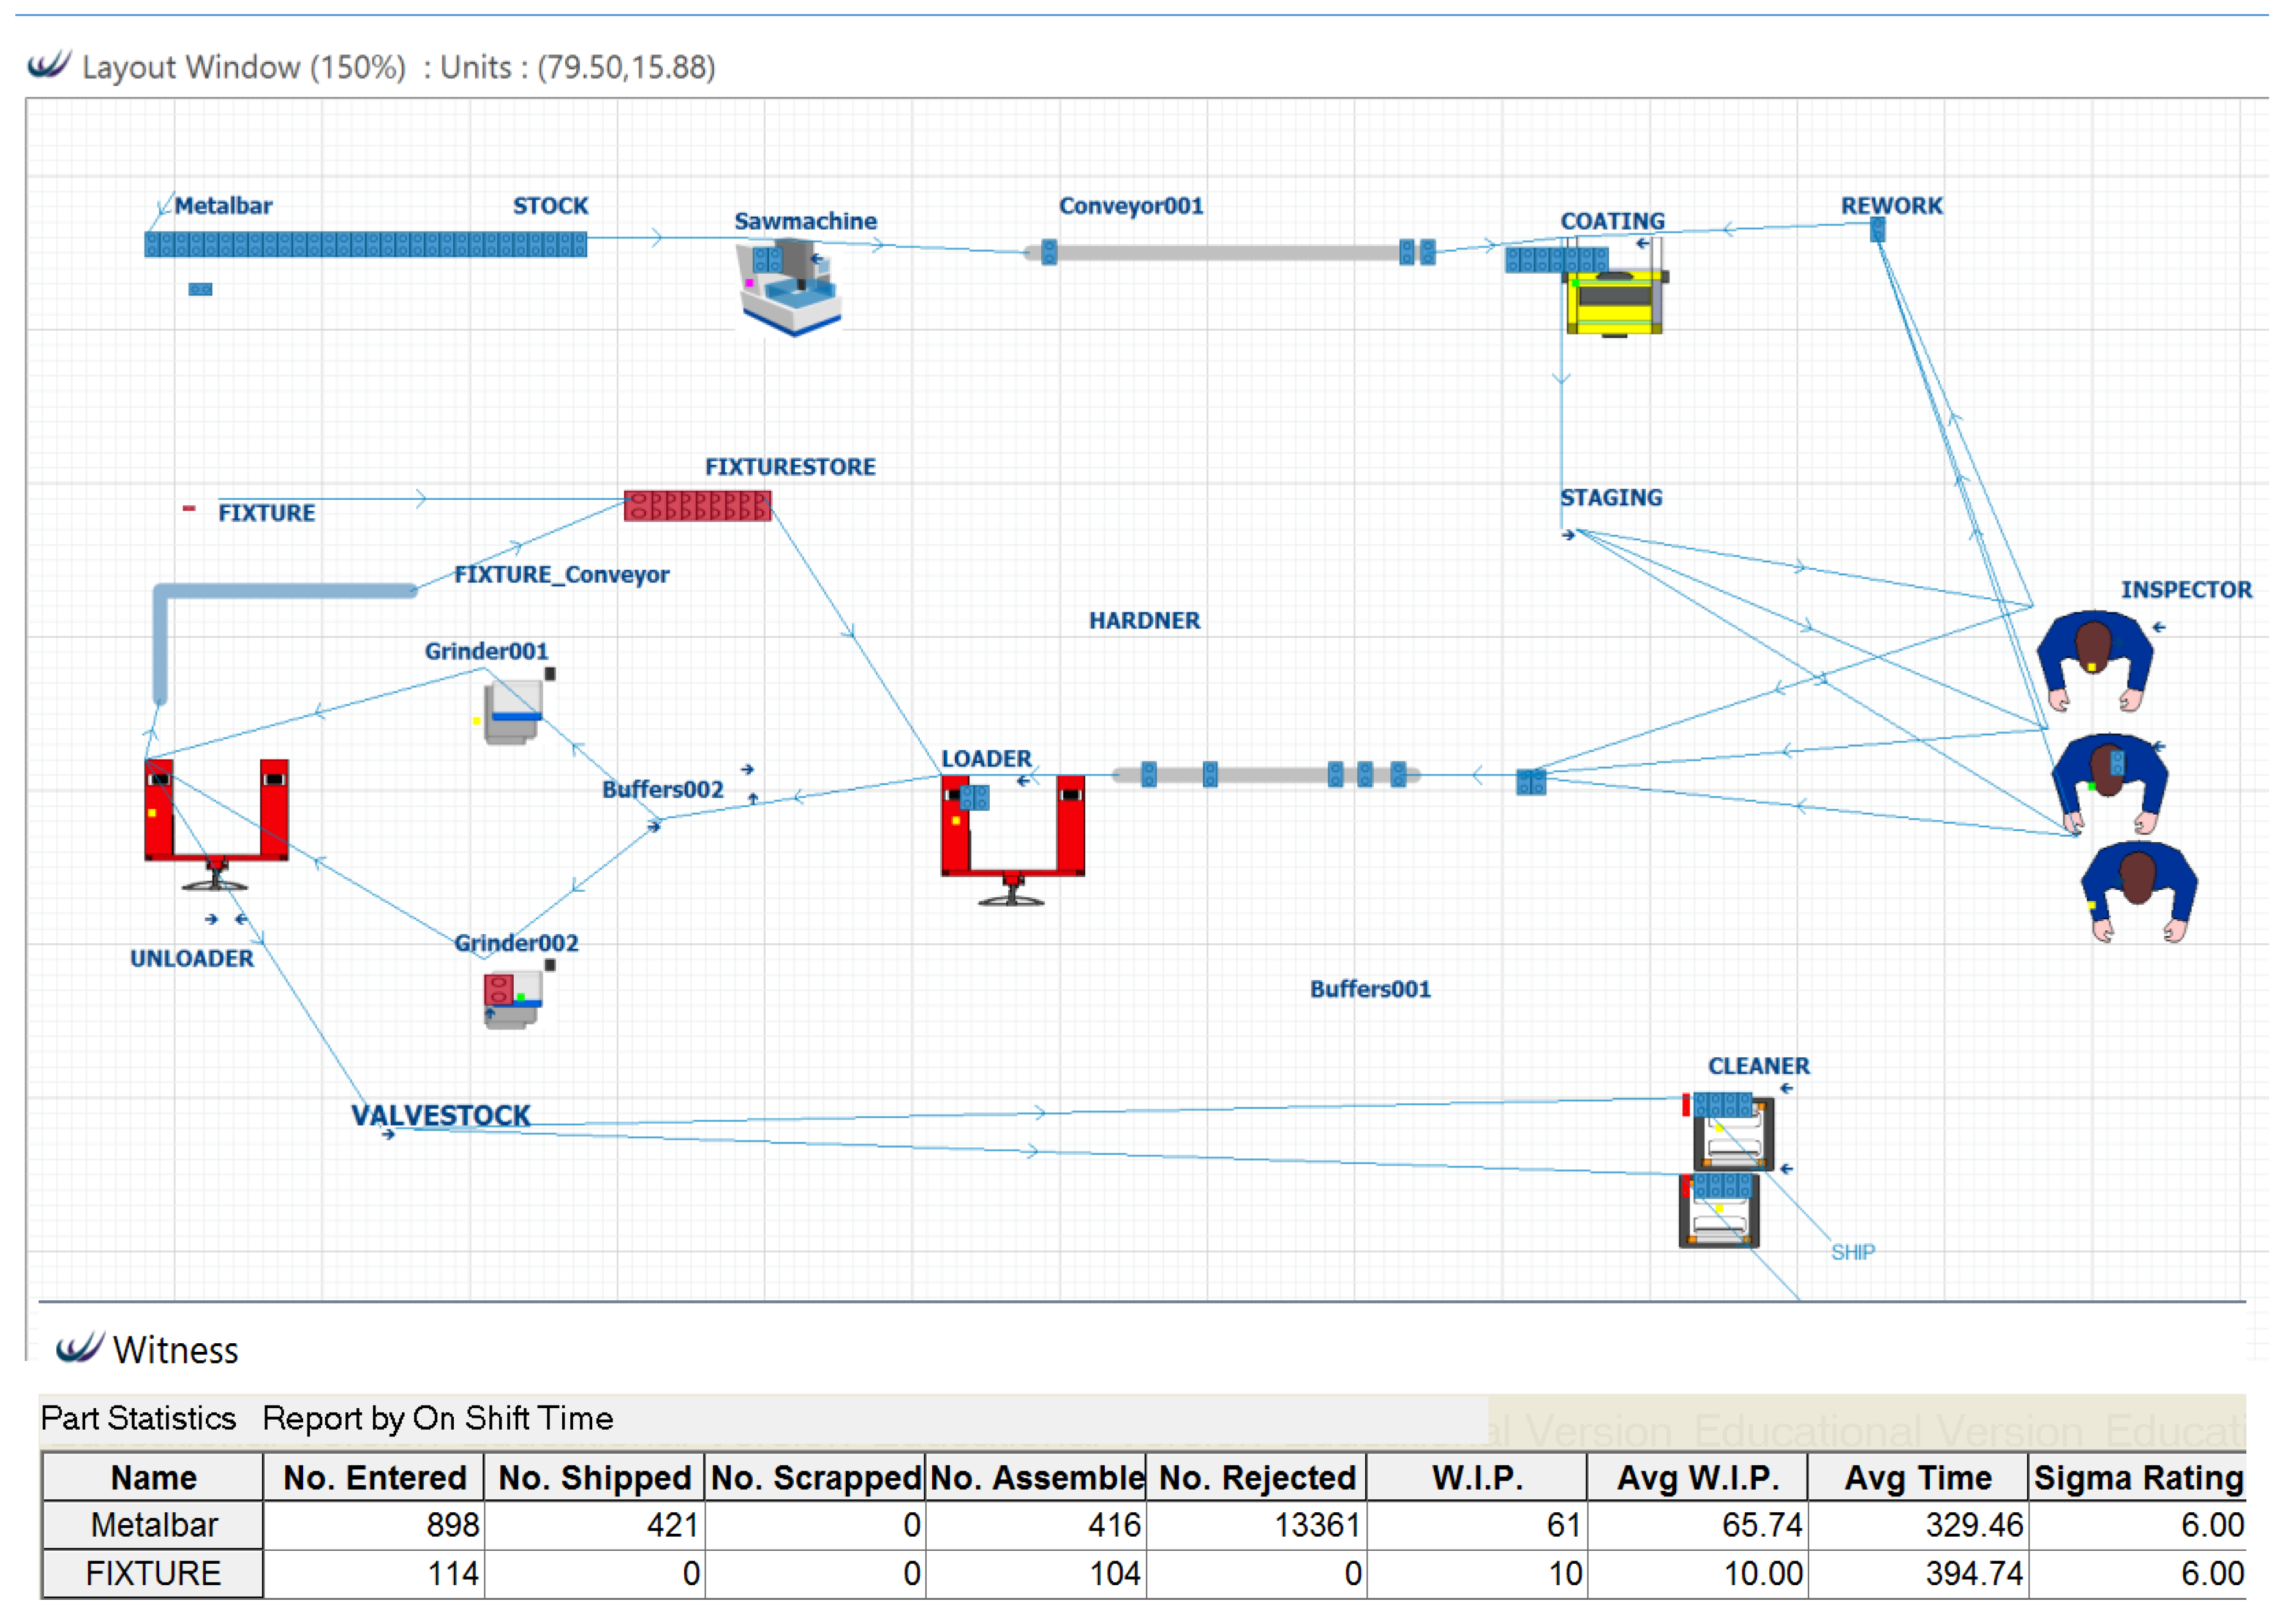
The valve manufacturing process has a warm up time of 1440 min with a 75 h (4500 min) working time. Thus, the runtime used was 5940 min in the simulation. The present production line produces 120–160 valves within the given time span. The mapped process based on the process identification and data are described below.
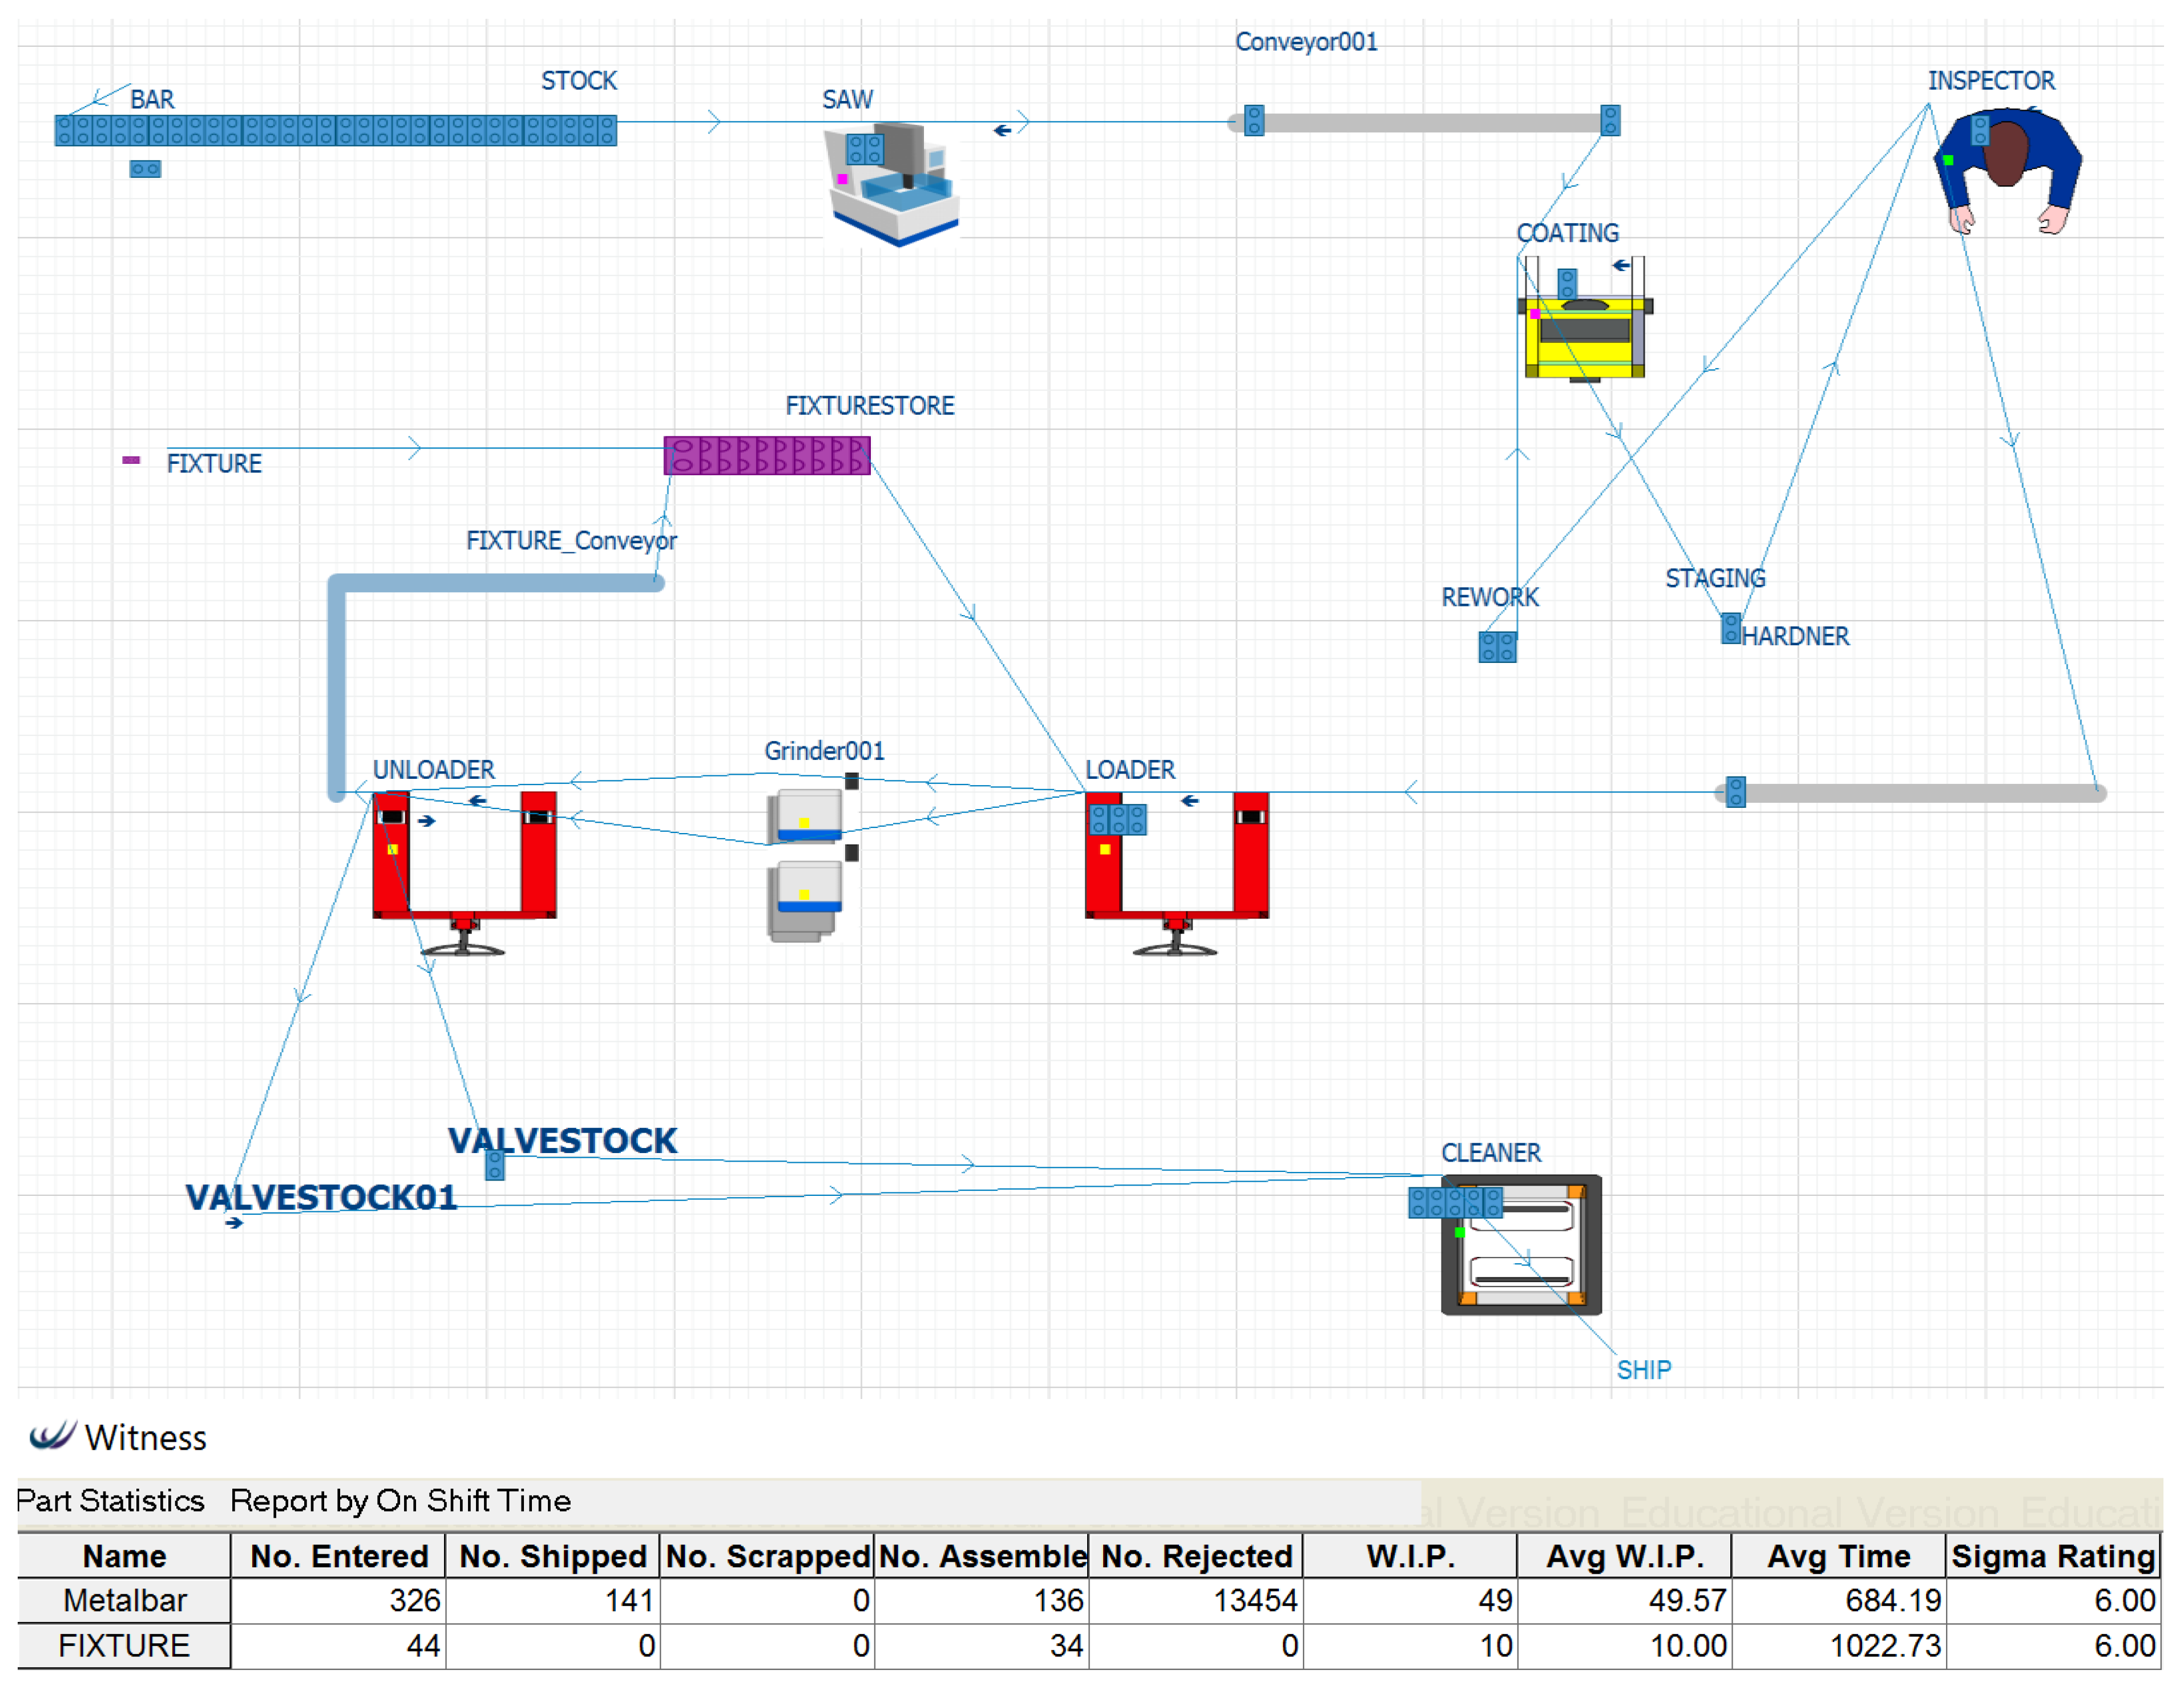
Figure 11 shows that the process starts with receiving metal bars that are readily available, which are then sent to the stock area. A saw machine pulls the bars from the stock and cuts them into three pieces and sends them to Conveyor001, which pulls them to the coating area for painting. Once painted, they are checked by an inspector and the bars are sent to the reworking or the hardening area with a ratio of 20:80. The next step is loading, where three bars are attached with a fixture and go through the grinder. The grinder grinds the bars to valves and the unloader sends them to the valve stock. The cleaner pulls the valves one by one and sends them to the shipment once cleaned and packed. The simulation model has a run time of 5940 min and the output is 141, which lies between 120 and 160.
6.3. Process Verification
The process can simply be verified by checking the output of the simulation (which was 141) with the actual physical output, which ranged between 120 and 160. The output will be the same for the simulation with fixed resources. The output can change based on several factors such as the run time, machine set-up time, shift time, etc. As we are not using a set of data that will require a mean value and statistical analysis to find a median, the simulated process is fully capable of representing the existing process.
The total output = 120 – 160, with a median value of 140.
The total output on simulation = 141 ≅ 140.
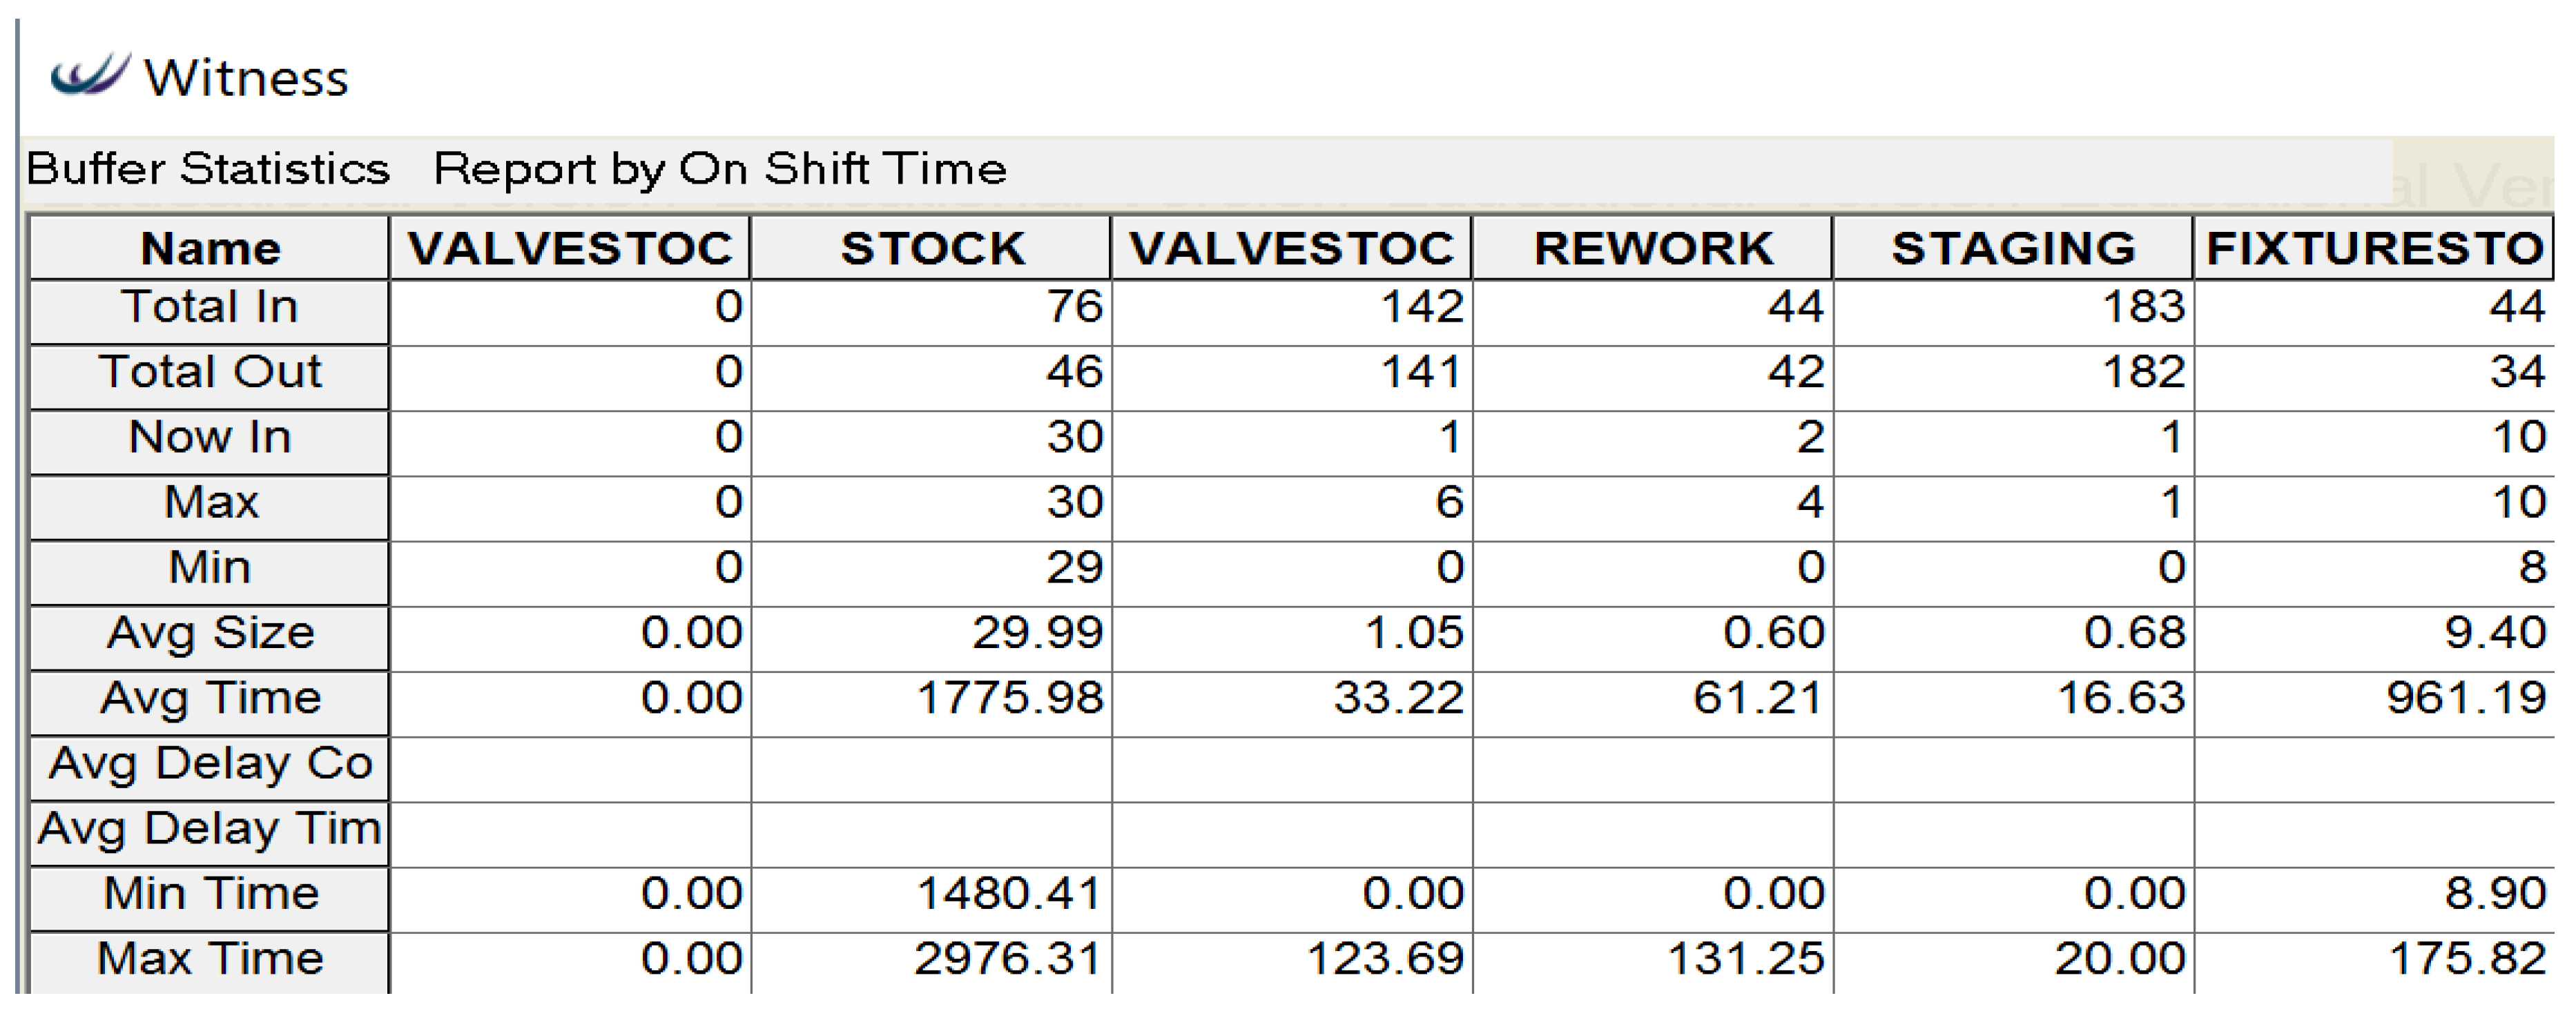
6.4. Process Analysis
Figure 12 shows that the busiest parts of the process are the inspection and cleaning area. The blockage time of the saw machine is 91.29% and coating area is 54.28%. The total process is divided into six major stages. All these steps are interdependent and passive.
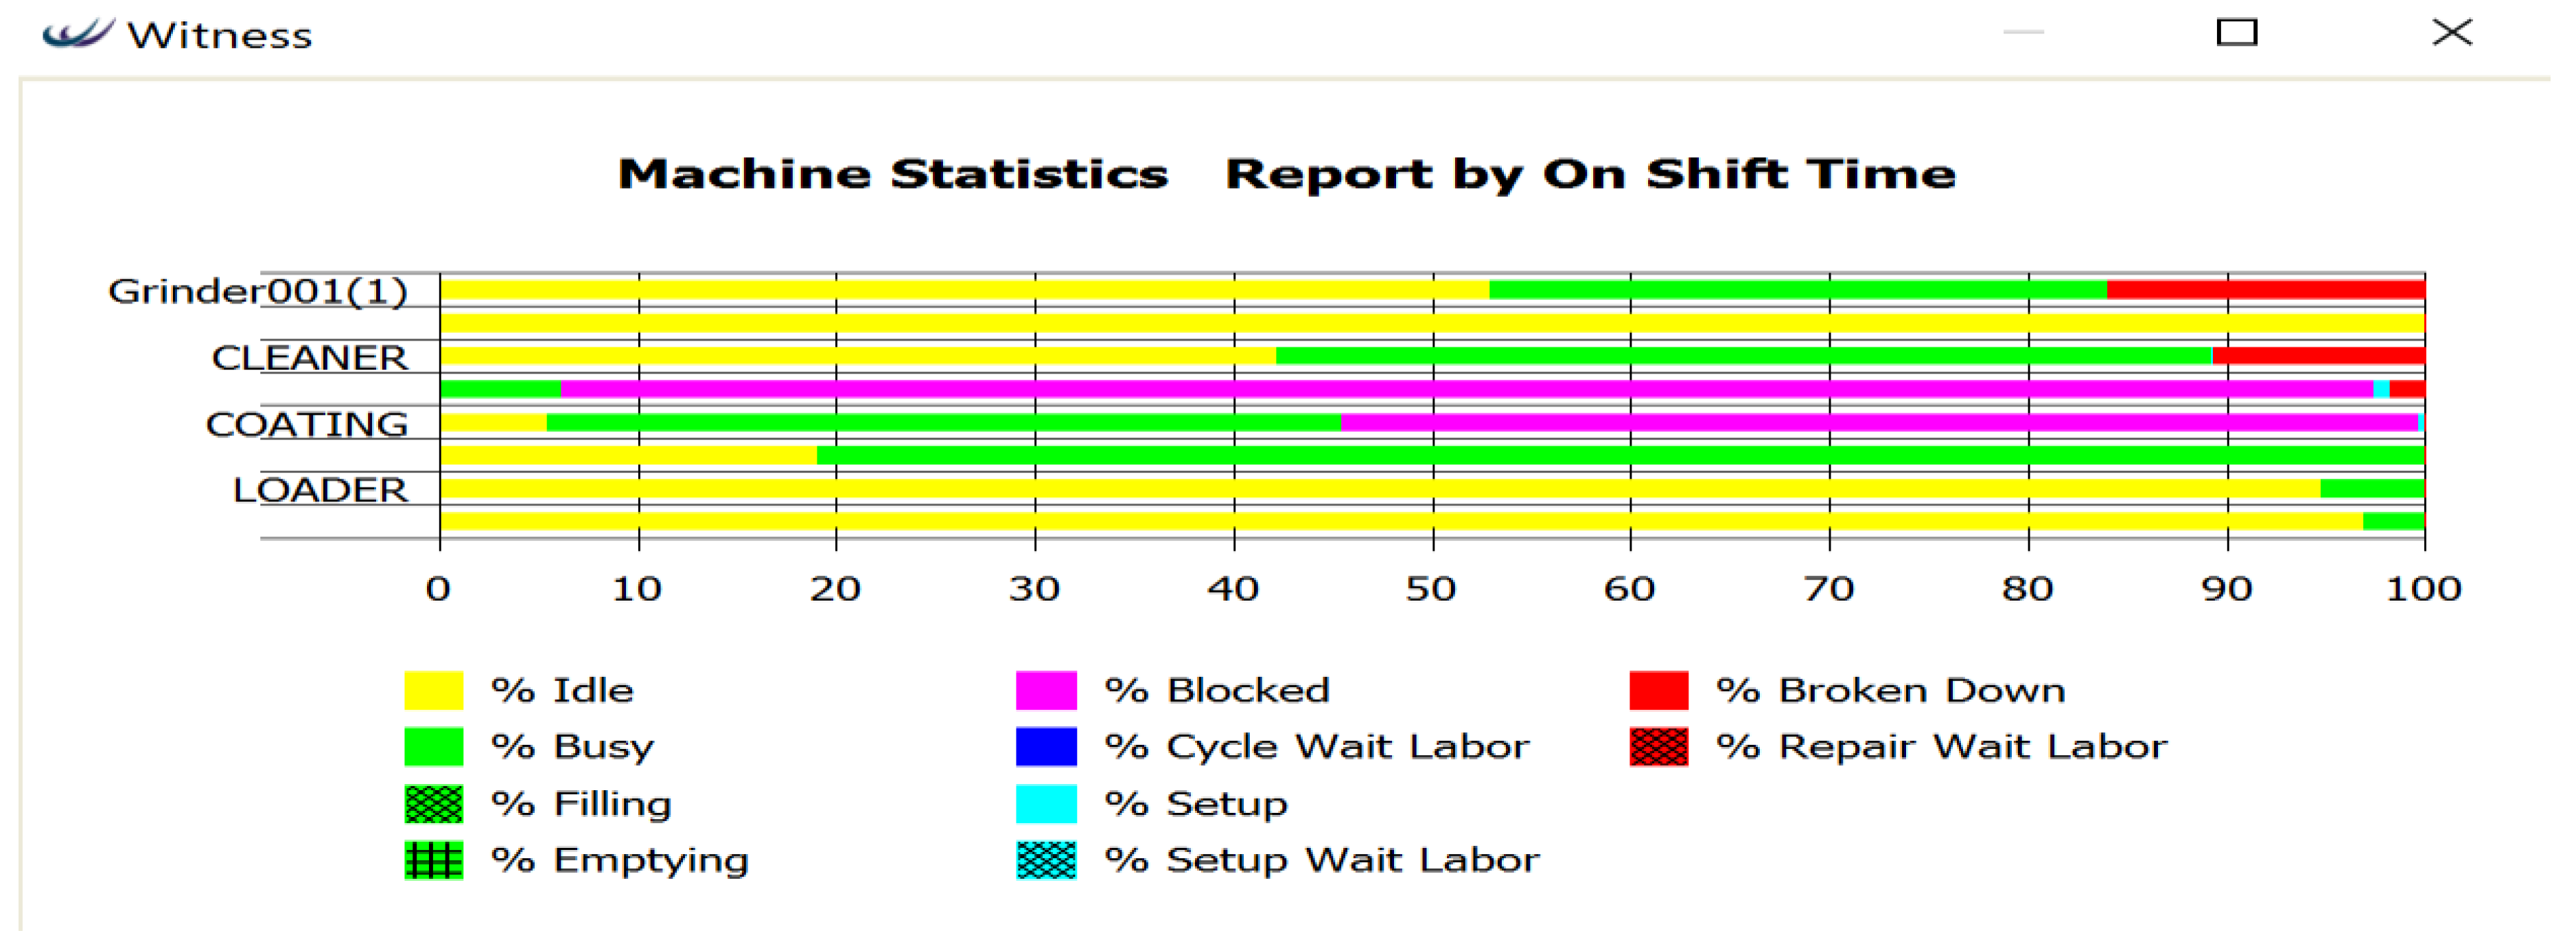
Figure 13 shows the machine statistics for blockage, setup, busy and break-down times.
For the given run time, the saw machine and the unloader were busy for the least amount of time.
6.5. Reengineering Phase
For the reengineering and optimization of the manufacturing process, we considered the identification of a bottleneck. The process identified the steps with the most bottleneck-related issues. As a reengineering approach, we can identify and minimize the bottlenecks where possible.
In this case study, several resources were used to make specific changes at different steps. As a general approach to optimization, we adopted a budget of £100,000. The idea was to use the budget with the maximum efficiency to bring changes into the process. Based on the existing parameters that resulted in 140 valves, several changes were made according to the budget to increase the output (see
Figure 14). A summary of those changes is shown in
Table 3.
The changes that we took into consideration were cycle time, busy time, batch size, number of operations completed and the increasing number of entities. The maximum products shipped after making the changes (outlined in
Table 3) from buffer stock to shipment were 421 units of valves (see
Figure 14).
6.6. Process Verification
The output was calculated by multiplying the busy time of a machine with the run time and dividing the obtained value by the cycle time. According to
Figure 15, the saw machine had a busy time of 18.53% and it produced three bars in one cycle of 6 min, which means that 2 min is the cycle time for one bar. The number of operations calculated (0.1853 × 4500)/2 = 417 units of valves, which is close to the output of 421 units of valves, meaning that the changes made were verified and acceptable.
6.7. Process Analysis
The coating machine was decreased from 60 min to 47.5 min, whereas the cycle time for the saw machine was kept the same. The result was a substantial increase in the output, showing the effect of the inter-dependency of different process parameters.
The following scenarios were considered for the saw machine with per cent of blockage, set up, break down and cycle time:
The coating machine is affected by the saw machine if it has a greater cycle time than the saw machine. In this case, the saw machine had a 6 min cycle time and the coating machine had a 47.5 min cycle time for the optimized model. However, a change should be made here, otherwise the coating machine will become clogged after a certain amount of run time. The reason is that the sawed bars must wait in the conveyor and the saw machine will be blocked until the coating machine finishes coating the same number of bars. Considering the bottleneck and the existing model, the simulation shows that the coating machine and the inspector have the highest number of bottlenecks. The resources were used to reduce bottlenecks and resulted in a substantial increase in output, showing the effectiveness of the proposed PR approach.
7. Conclusions
Over the last decade, several BPR methodologies have been developed to create better reengineering initiatives and approaches. The initial BPR methodologies were quite simple and at times proved to be ineffective when dealing with complex situations. To overcome these limitations and increase the success rate, a data-driven process reengineering approach was introduced in this paper. The objective of this data-driven PR methodology was to provide solutions for the challenges that today’s manufacturing organizations face on a daily basis. This will help organizations to adopt a PR methodology that will enhance the success rate rather than adding a new liability. PR should be implemented based on a multiple, holistic approach to identify the interaction of different changes.
In this research, an overview of the existing BPR models and methodologies was presented. To overcome the limitations of methodologies such as Hammer/Champy, Davenport/Short, PADM and Jacobson, a data driven PR methodology was designed that followed multiple approaches in order to avoid failure, by focusing on the success factors related to the PR objective. A case study of the production of valves was presented that was optimized based on the new PR methodology. The result was a substantial increase in output by analyzing the inter-dependency of various factors. PR is a subject of great interest in the present static business world. However, there are some interesting avenues that can be explored further, as described in the analysis, and further research can be done to identify more rational issues that can arise along with the process changes. Further research may add to the feasibility of the proposed methodology, which proved to be very useful in identifying inter-dependency issues and increasing the success rate of process reengineering in the manufacturing industries.
Author Contributions
Conceptualization: Md A.A.K.; Methodology:H.M, J.B and H.S.; Software: Md A.A.K. and M.N.A.; Investigation: Md A.A.K. and J.B.; Formal Analysis: Md A.A.K.; Writing: Md A.A.K.; Review and editing: J.B., Visualization: J.B. and Md A.A.K.; Supervision: H.M, J.B. and H.S.
Funding
This research received no external funding
Conflicts of Interest
The authors declare no conflict of interest.
References
- Lin, H.F.; Chang, K.L. Key success factors of international market development: An empirical study of the Taiwan bulk shipping industry. Marit. Bus. Rev. 2017, 2, 79–98. [Google Scholar] [CrossRef]
- Vergidis, K.; Tiwari, A.; Majeed, B. Business Process Analysis and Optimization: Beyond Reengineering. Syst. IEEE Trans. Syst. Man Cybern. Part C (Appl. Rev.) 2008, 38, 69–82. [Google Scholar] [CrossRef]
- Sungau, J.J.; Ndunguru, P.C. Business process re-engineering: a panacea for reducing operational cost in service organizations. Indep. J. Manag. Prod. 2015, 6, 141–168. [Google Scholar] [CrossRef]
- Al-Mashari, M.; Zahir, I.; Mohamed, Z. Business process reengineering: A survey of international experience. Bus. Process Manag. J. 2001, 7, 437–455. [Google Scholar] [CrossRef]
- Champy, J.; Lawrence, C. Reengineering Management; Harper Collins Publisher: New York, NY, USA, 1995. [Google Scholar]
- Elzinga, D.J.; Gulledge, T.R.; Lee, C.Y. Business Process Engineering: Advancing the State of Art, 1st ed.; Springer Science & Business Media: New York, NY, USA, 1999. [Google Scholar]
- Cao, G.; Clarke, S.; Lehaney, B. A critique of BPR from a holistic perspective. Bus. Process Manag. J. 2001, 7, 332–339. [Google Scholar] [CrossRef]
- Ramirez, R.; Melville, N.; Lawler, E. Information technology infrastructure, organizational process redesign, and business value: An empirical analysis. Decis. Support Syst. 2012, 49, 417–429. [Google Scholar] [CrossRef]
- Petorozzo, D.P.; Stepper, J.S. Successful Reengineering; Van Nostrand Reinhold: New York, NY, USA, 1994; pp. 144–157. [Google Scholar]
- Hussein, B.; Hammoud, M.; Bazzi, H.; Haj-Ali, A. PRISM-Process reengineering integrated spiral model: An agile approach to business process reengineering (BPR). Int. J. Bus. Manag. 2014, 9, 134. [Google Scholar] [CrossRef]
- Moyne, J. International Technology Roadmap for Semiconductors (ITRS) Factory Integration, 2015: Summary of Updates and Deep Dive Into Big Data Enhancements. In Proceedings of the APC Conference XXVII, Austin, TX, USA, 12–15 October 2015; pp. 12–14. [Google Scholar]
- Davenport, T.H.; Short, J.E. The new industrial engineering: Information technology and business process redesign. Solan Manag. Rev. 1990, 31, 11–27. [Google Scholar]
- Holliday, I.; Kwok, R.C. Governance in the information age: building e-government in Hong Kong. New Media Soc. 2004, 6, 549–570. [Google Scholar] [CrossRef]
- Davenport, T.H. Business process reengineering: where it’s been, where it’s going. Bus. Process Change Reeng. Concepts Methods Tech. 1995, 1–13. [Google Scholar]
- Michael, H.; James, C. Reengineering the Corporation: A Manifesto for Business Revolution; HarperCollins: New York, NY, USA, 1993. [Google Scholar]
- Hammer, M. Reengineering work: don’t automate, obliterate. Harvard Bus. Rev. 1990, 1990 68, 104–112. [Google Scholar]
- Davenport, T.H.; Stoddard, D.B. Reengineering: business change of mythic proportions? MIS Q. 1994, 18, 121–127. [Google Scholar] [CrossRef]
- Jacobson, I. The Object Advantage: Business Process Reengineering with Object Technology; Addison-Wesley: New York, NY, USA, 1995. [Google Scholar]
- Barber, K.D.; Dewhurst, F.W.; Burns, R.L.D.H.; Rogers, J.B.B. Business-process modelling and simulation for manufacturing management: A practical way forward. Bus. Process Manag. J. 2003, 9, 527–542. [Google Scholar] [CrossRef]
- Browne, J.; O′Sullivan, D. Reengineering the Enterprise: Proceedings of the IFIP TC5/WG5.7 Working Conference on Reengineering the Enterprise; Springer: London, UK, 2013. [Google Scholar]
- Rao, L.; Mansingh, G.; Osei-Bryson, K.M. Building ontology based knowledge maps to assist business process re-engineering. Decis. Support Syst. 2012, 52, 580–589. [Google Scholar] [CrossRef]
- Valiris, G.; Glykas, M. Critical review of existing BPR methodologies: The need for a holistic approach. Bus. Process Manag. J. 1999, 5, 65–86. [Google Scholar] [CrossRef]
- Vakola, M.; Rezgui, Y. Critique of existing business process re-engineering methodologies: The development and implementation of a new methodology. Bus. Process Manag. J. 2000, 6, 238–250. [Google Scholar] [CrossRef]
- Hussein, B. PRISM: Process Re-engineering Integrated Spiral Model; VDM Verlag Dr. Müller: Berlin, Germany, 2014. [Google Scholar]
- Eftekhari, N.; Akhavan, P. Developing a comprehensive methodology for BPR projects by employing IT tools. Bus. Process Manag. J. 2013, 19, 4–29. [Google Scholar] [CrossRef]
- O’Donovan, P.; Leahy, K.; Bruton, K.; O’Sullivan, D.T.J. Big data in manufacturing: A systematic mapping study. J. Big Data 2015, 2, 20. [Google Scholar] [CrossRef]
- Butt, J.; Mebrahtu, H.; Shirvani, H. A novel rapid prototyping process for the production of metal parts. In Proceedings of the Second International Conference on Advances in Civil, Structural and Mechanical Engineering-CSM, Birmingham, UK, 16–17 November 2014; pp. 26–29. [Google Scholar]
- Butt, J.; Mebrahtu, H.; Shirvani, H. Strength analysis of aluminium foil parts made by composite metal foil manufacturing. Prog. Addit. Manuf. 2016, 1, 93–103. [Google Scholar] [CrossRef] [Green Version]
- Butt, J.; Mebrahtu, H.; Shirvani, H. Peel and tensile test investigation of aluminium 1050 foil parts made with a new additive manufacturing process. Int. J. Rapid Manuf. 2015, 5, 95–115. [Google Scholar] [CrossRef]
- Butt, J.; Mebrahtu, H.; Shirvani, H. Thermo-mechanical analysis of dissimilar al/cu foil single lap joints made by composite metal foil manufacturing. World Acad. Sci. Eng. Technol. Int. J. Mech. Aerospa. Ind. Mech. Manuf. Eng. 2015, 10, 41–46. [Google Scholar]
- Lee, J.; Bagheri, B.; Kao, H.A. A cyber-physical systems architecture for industry 4.0-based manufacturing systems. Manuf. Lett. 2015, 3, 18–23. [Google Scholar] [CrossRef]
- Wang, S.; Wan, J.; Zhang, D.; Li, D.; Zhang, C. Towards smart factory for industry 4.0: A self-organized multi-agent system with big data based feedback and coordination. Comput. Netw. 2016, 101, 158–168. [Google Scholar] [CrossRef]
- Khan, M.A.A.; Mebrahtu, H.; Shirvani, H.; Butt, J. Manufacturing optimisation based on agile manufacturing and big data. In Advances in Manufacturing Technology XXXI; IOS press: London, UK, 2017; pp. 345–351. [Google Scholar]
- Kochhar, A.K. Computer simulation of manufacturing system; decades of progress. In Proceedings of the 3rd European Simulation Congress, Edinburgh, UK, 5–8 September 1989. [Google Scholar]
© 2018 by the authors. Licensee MDPI, Basel, Switzerland. This article is an open access article distributed under the terms and conditions of the Creative Commons Attribution (CC BY) license (http://creativecommons.org/licenses/by/4.0/).

 ,
, 


