Estimated View of Renewable Resources as a Sustainable Electrical Energy Source, Case Study


1
Institute of Chemical and Energy Engineering, University of Natural Resources and Life Sciences, Muthgasse 107, 1190 Vienna, Austria
2
Electrical Engineering Department, Islamic University of Gaza, Gaza Strip P.O. Box 108, Palestine
*
Author to whom correspondence should be addressed.
Designs 2020, 4(3), 32; https://0-doi-org.brum.beds.ac.uk/10.3390/designs4030032
Submission received: 8 August 2020
/
Revised: 2 September 2020
/
Accepted: 4 September 2020
/
Published: 8 September 2020
Abstract
:Renewable energy resources for energy generation in the Gaza Strip (GS) emerge as a complementary resource, not only to meet the need of society for energy in various forms, but also to find available, sustainably, and less costly resources for institutions as with individuals. These resources could provide safety in use, increase energy security, and address environmental concerns. This work aimed to assess the renewable energy potential in the GS, which has few natural resources and a real crisis in energy supply. Therefore, an integrated evaluation methodology is assumed for renewable energy potential; the methodology comprises mathematical as well as software programming to assess the renewable energy. The results reveal the assessment of the existing four renewable energy sources: solar, wind, wave, and biomass. The estimations exhibit that the solar and biomass resources are dominant. The methodology consists of mathematical models for calculating the energy outputs from different resources in the study area. ArcGIS 10.1 software used for calculating solar radiation, WindSim 9.0.0 software for estimating wind energy and OpenWEC software tool for evaluating the force stored in coastal waves. The potential of each energy and the integration of all are depicted in individual maps by ArcGIS. It was found that if anaerobic digestion technology is applied, 65.15 MW electric power could be produced from about one-and a third million tons/year of biomass. Depending on the available statistical data due to the specified annual time period and the household electric demand that is about 120 MW at the corresponding time, this means that the energy from biomass can cover more than half of the demand. In addition, solar energy potentials were estimated to reach 1195 GWh/year. Therefore, the existing power may be replaced by biomass and solar energy. It also demonstrates that the energy potential maps can be used as metrics for possible sustainability projects in the GS.
Keywords:
renewable energy sources; sustainability; biomass; wind; wave; solar; integrated assessment1. Introduction
Renewable Energy Sources (RESs) provide environmental and socioeconomic benefits [1] such as income generation, local employment [2], diversification of rural economic activities, use of endogenous resources [3], and creation of a healthier environment with clean energy technologies [4].
Renewable energy is necessary for Palestine, to improve economic, social, and environmental conditions. Increased renewable energy use could diminish reliance on the already deficient and in-shortage existing energy system, which actually in its best situation does not meet one third of the electrical sector demand [5]. Whereas, Gazans can be compelled to use candles and generators in unsafe conditions in their houses and shops as alternative methods to produces energy causing tragic events such as fire hazards to property in addition to injuries and death [5]. Palestine has stepped forward to invest its natural obtainable and sustainable resources despite many confrontations such as political, economic, ecological, and others, which prevent developmental progress. The lack of a Palestinian infrastructure and the scarcity of both conventional and renewable energies resources has created energy shortages and unrealistic economic controls [6]. Using the available RESs, such as solar, biomass, wave, and wind, could substitute more than 36% of the actual Palestinian electricity need and help to solve a future energy crisis [7].
The Palestinian Territories (PTs) involve two regions: the Gaza Strip (GS) and the West Bank including east Jerusalem. The GS depends on externalist imports to get electricity, which are from Egypt, Israel, and local electricity plants in the GS. However, most of the time shortage of electricity happened due to cut of these resources and has left dwellers living in darkness. This raises severe problems and stimulates thinking about other types of energy; exploitation of renewable energy can be an available solution and contribute to resolving the crisis. The GS energy demand ranges between 500 and 550 MW, but the current available energy is less than 30% [8]. This study aims to review the assessment and use of alternative sources of energy by exploring the available renewable and sustainable resources in the GS. The study commences on the statistical and meteorological data collection of familiar renewable resources, and then inserts these data as inputs to be processed by a mathematical or software tool, the results reveal the assessment of the energy yield, and the decision could be taken thereafter.
Conspicuous renewable energy resources in the GS are solar, biomass, wind, and wave energy. Solar is considered as most important and prominent renewable energy source. Daily irradiance on a horizontal surface is on average about 246 W/m2; further details are given in Section 2.3. A significant initiative of electrification through solar energy projects in different sectors and vital institutions has already been implemented and proved its efficacy by replacements for or complements to traditional sources of energy. On the other side, many individual researches have investigated the techniques and models of solar energy as a reliable standalone system, or as hybrids with other renewable energy sources [9]. A small-scale experiment has been conducted to get electricity from a 3 m/s average wave when coastal water velocity is 3 m/s [10,11]. Meanwhile, studying shows wind energy of wind speed ranges between 7 and 9 km/h and 9 and 14 km/h in summer and winter, respectively, as a secondary source of energy, and can be used in the generation of electricity by small turbines with no need of high wind speed [12].
Biomass could be an important source of energy for development in view of sustainability, environmental issues, and biofuel diversity [13]. Considerable amounts of biomass including waste of 70% organic factor, agricultural residues, and sewage sludge daily produced in the GS [8]. Production biogas from biomass in the most common techniques of conversion of biomass into energy would provide energy without burdens on the environment and public health. Biogas can be used for electrification, cooking, as well as fuel in vehicles with low initial investment cost and low sludge production [6,14].
Biomass characteristics are a crucial point to convert the raw materials into energy through different particularly known (bio, thermos, physio) chemical process techniques of conversion [14]. Biomass to energy should provide net sustainability impacts in economic benefits for the local population, such as employment generation, providing stability and reliability for communities [15,16,17]. Meanwhile, the first ecological benefit is waste disposal in energy production, and mitigation of the air greenhouse gases (GHGs) pollution by less dependence on fossil fuels.
Solar energy is a candidate choice for electric power generation, since the solar energy is converted directly into electrical energy by solar photovoltaic modules. The solar irradiance on the GS exceeds 200 W/m2, except in winter [15,18]. The use of solar energy sources considers the availability of fluctuating RESs in order to reduce the difference between energy production and demand [10]. Local authorities should encourage alternative solar energy usages such as water desalination, pumping, and crop drying, and set rules and policies concerning the use of solar renewable energy [15].
The potential for using wind energy in Gaza would be obtained depending on wind speed, availability of open land or setting up offshore wind farms, and the possibility of transport equipment and material into Gaza. Detailed knowledge of the wind characteristics is very important for the effective utilization of wind energy. The lowest price of wind energy technology is one advantages among renewable resources [16,17]. Combining wind energy with solar electricity to provide a steady and reliable supply of electricity could be effective and suited for a developed and developing country as in our case study. Good wind sites are often located in remote locations, but in this state an extra cost is required to connect remote wind farms to the supply network.
An analytical study of wind farms establishment in Palestine is necessary to reach the optimum electrical energy. Exploiting energy from wind economic payback that each square meter produces and payback period should be calculated for any project built in the GS [19,20].
The high energy density of the sea waves is the highest among RESs [20]. The first effort to harvest the potential wave energy in Gaza was at the Islamic University, where a major component of an energy conversion system (shoreline wave conversion device) was analyzed, designed, built, and tested in a workshop at the shoreline. According to the results and analysis, 12 devices are needed to light 5 km of roadway using 30 W lamps for five hours daily. Nowadays the project is applied in the coast of Gaza.
Based on this background, the goal of this study is closing the research gap represented by the lack of an integrated methodology for the measurement of renewable energy potential (REP). Specifically, this study has two main objectives. Firstly, it offers an integrated evaluation of the REP supported by Geographic Information Systems (GIS). Secondly, it estimates the integrated biomass potential in Gaza considering the anaerobic digestion technique and formulates recommendations for the exploitation of biomass and solar energy in the framework of RE-hybrid system, as they form a high potential percentage of RESs. The novelty of this study is concerning to the integration of four RESs (biomass, solar, wave, and wind) and the respective measurement of their total REP. Section 2 shows the methodology applied in this work, describes in detail the main aspects of the study area and explains meteorological observation data, while Section 2.3 focuses on analyzing the spatial and temporal distribution of solar, wind, wave, and bioenergy, along with the spatial disparities of RES availability. Results are shown in Section 3, describing the potential of variable RES in all governorates with an integrated map. Additionally, the ratio between residential energy demand and energy production from available renewable resources were mentioned at the relevant site. Finally, the Conclusions and Recommendations
2. Materials and Methods
To estimate the renewable energy potential of the study area, the architecture of methodology shown in Figure 1 is followed. The first step in the flowchart is investigation of the research area. Geographic location is pre-analysis required step. When the site coordinate denotes, the climate characteristics, insolation, and region specification will be obtained, as well as social activities and energy resources that the population depend on. Section 2.1 focused on key aspects of the study area required. Then, it reviews the available renewable resources literature and collects the statistical and meteorological data required of biomass, wind, solar, and wave for the work as described in Section 2.2. The third step is dedicated to data processing using a mathematical method to estimate the biogas generate from biomass and simulation software tools for other renewable resources. The solar energy potential was evaluated using GIS-based solar radiation tools, achieved through an estimation of local characteristics (PV-model technology, households’ numbers, and roof area). For wind energy potential calculation, WindSim 9.0.0 software was used, with local and technical limitations of the turbine site selections. For the harvesting of wave energy in the GS coastal Mediterranean Sea, openWEC was used as an open-source tool to simulate the hydrodynamic behavior and energy yield from single-body wave energy converters; the openWEC assumes potential flow and depends on the linear wave theory. After evaluating the energy yield from renewable resources, biomass potential is summarized in an integrated biomass energy output from three separately specified sources, which are agriculture, sewage sludge, and municipal waste.
The study has incorporated the potential of biomass, solar, wind, and wave energy maps. The subsequent step of setting the integrated maps is a comparison between the electrification demand of households and the electricity produced from renewable resources. Based on the results obtained and discussed in the preceding section, a decision is taken on the possibility of using renewable energy according to the specification introduced. Finally, there are recommendations and a conclusion.
The methodology in this study provides an approach for potential estimations at the local level. Furthermore, it can be applied in other regions. The energy potential calculation was carried out at a local level to consider sustainable use and the necessity of achieving decentralized energy generation and a higher level of local energy independence.
2.1. Study Area
Palestine is entirely dependent on importing fossil fuel resources from abroad, of which there are three main resources: Egypt, Israel, and a local electricity plant [20]. Most of the time there is an energy crisis developing in the GS due to the scarcity of conventional resources, high population density, and susceptible fuel prices. Currently hospitals, the Coastal Municipalities Water Utility (CMWU, Gaza, Palestine), and other vital institutions rely on emergency generators to maintain normal services [21,22,23]. This study aimed at providing an assessment of renewable potentials in the study area, the Gaza Strip in this case, and the methodology that follows depends on statistical and meteorological data acquisition; these actual data were fed to the mathematical model and software tool for processing, and finally results and recommendations are provided to help decision makers to reach the best solutions to alleviate the electricity problems in Gaza. Generally, a method to evaluate the best combination of energy sources based on local situations is developed that can be transferred to other regions.
The environmental issue, the main aspect of sustainability, is a concern of exploitation and utilization the renewable energy resources. Domestic solid waste, agricultural waste, and the sludge from current and projected wastewater treatment plants (WWTPs) all over the GS are disposed in landfills and coastal waters, without further destination creating environmental impacts and nuisance to the local community [22].
Solid waste management in GS focused on four main areas, minimizing waste, implementing the reuse and recycling process, encouraging proper disposal and treatment, and widening the service area for waste treatment. All areas have to be combined because they are interrelated [24]. The exploitation of biomass energy may lead to the development of convenient waste disposal and treatment areas. For waste management the GS uses sanitary landfill sites. Compared to others, these sites are distinguished by their high economic cost and the likelihood of consuming significant amounts of solid waste can be easily applied. This method is complementary to other modern methods (automatic combustion, thermal decomposition, and biodegradation) that produce treatable materials, resulting in the possibility of using methane generated at the landfill to generate electricity, and replanting the area with forest trees after the landfill closure. Such dumps, however, have disadvantages such as leachates and carbon emissions, groundwater contamination, volatilization of wastepaper and plastics, and anaerobic degradation of unpleasant and heavy odors [25].
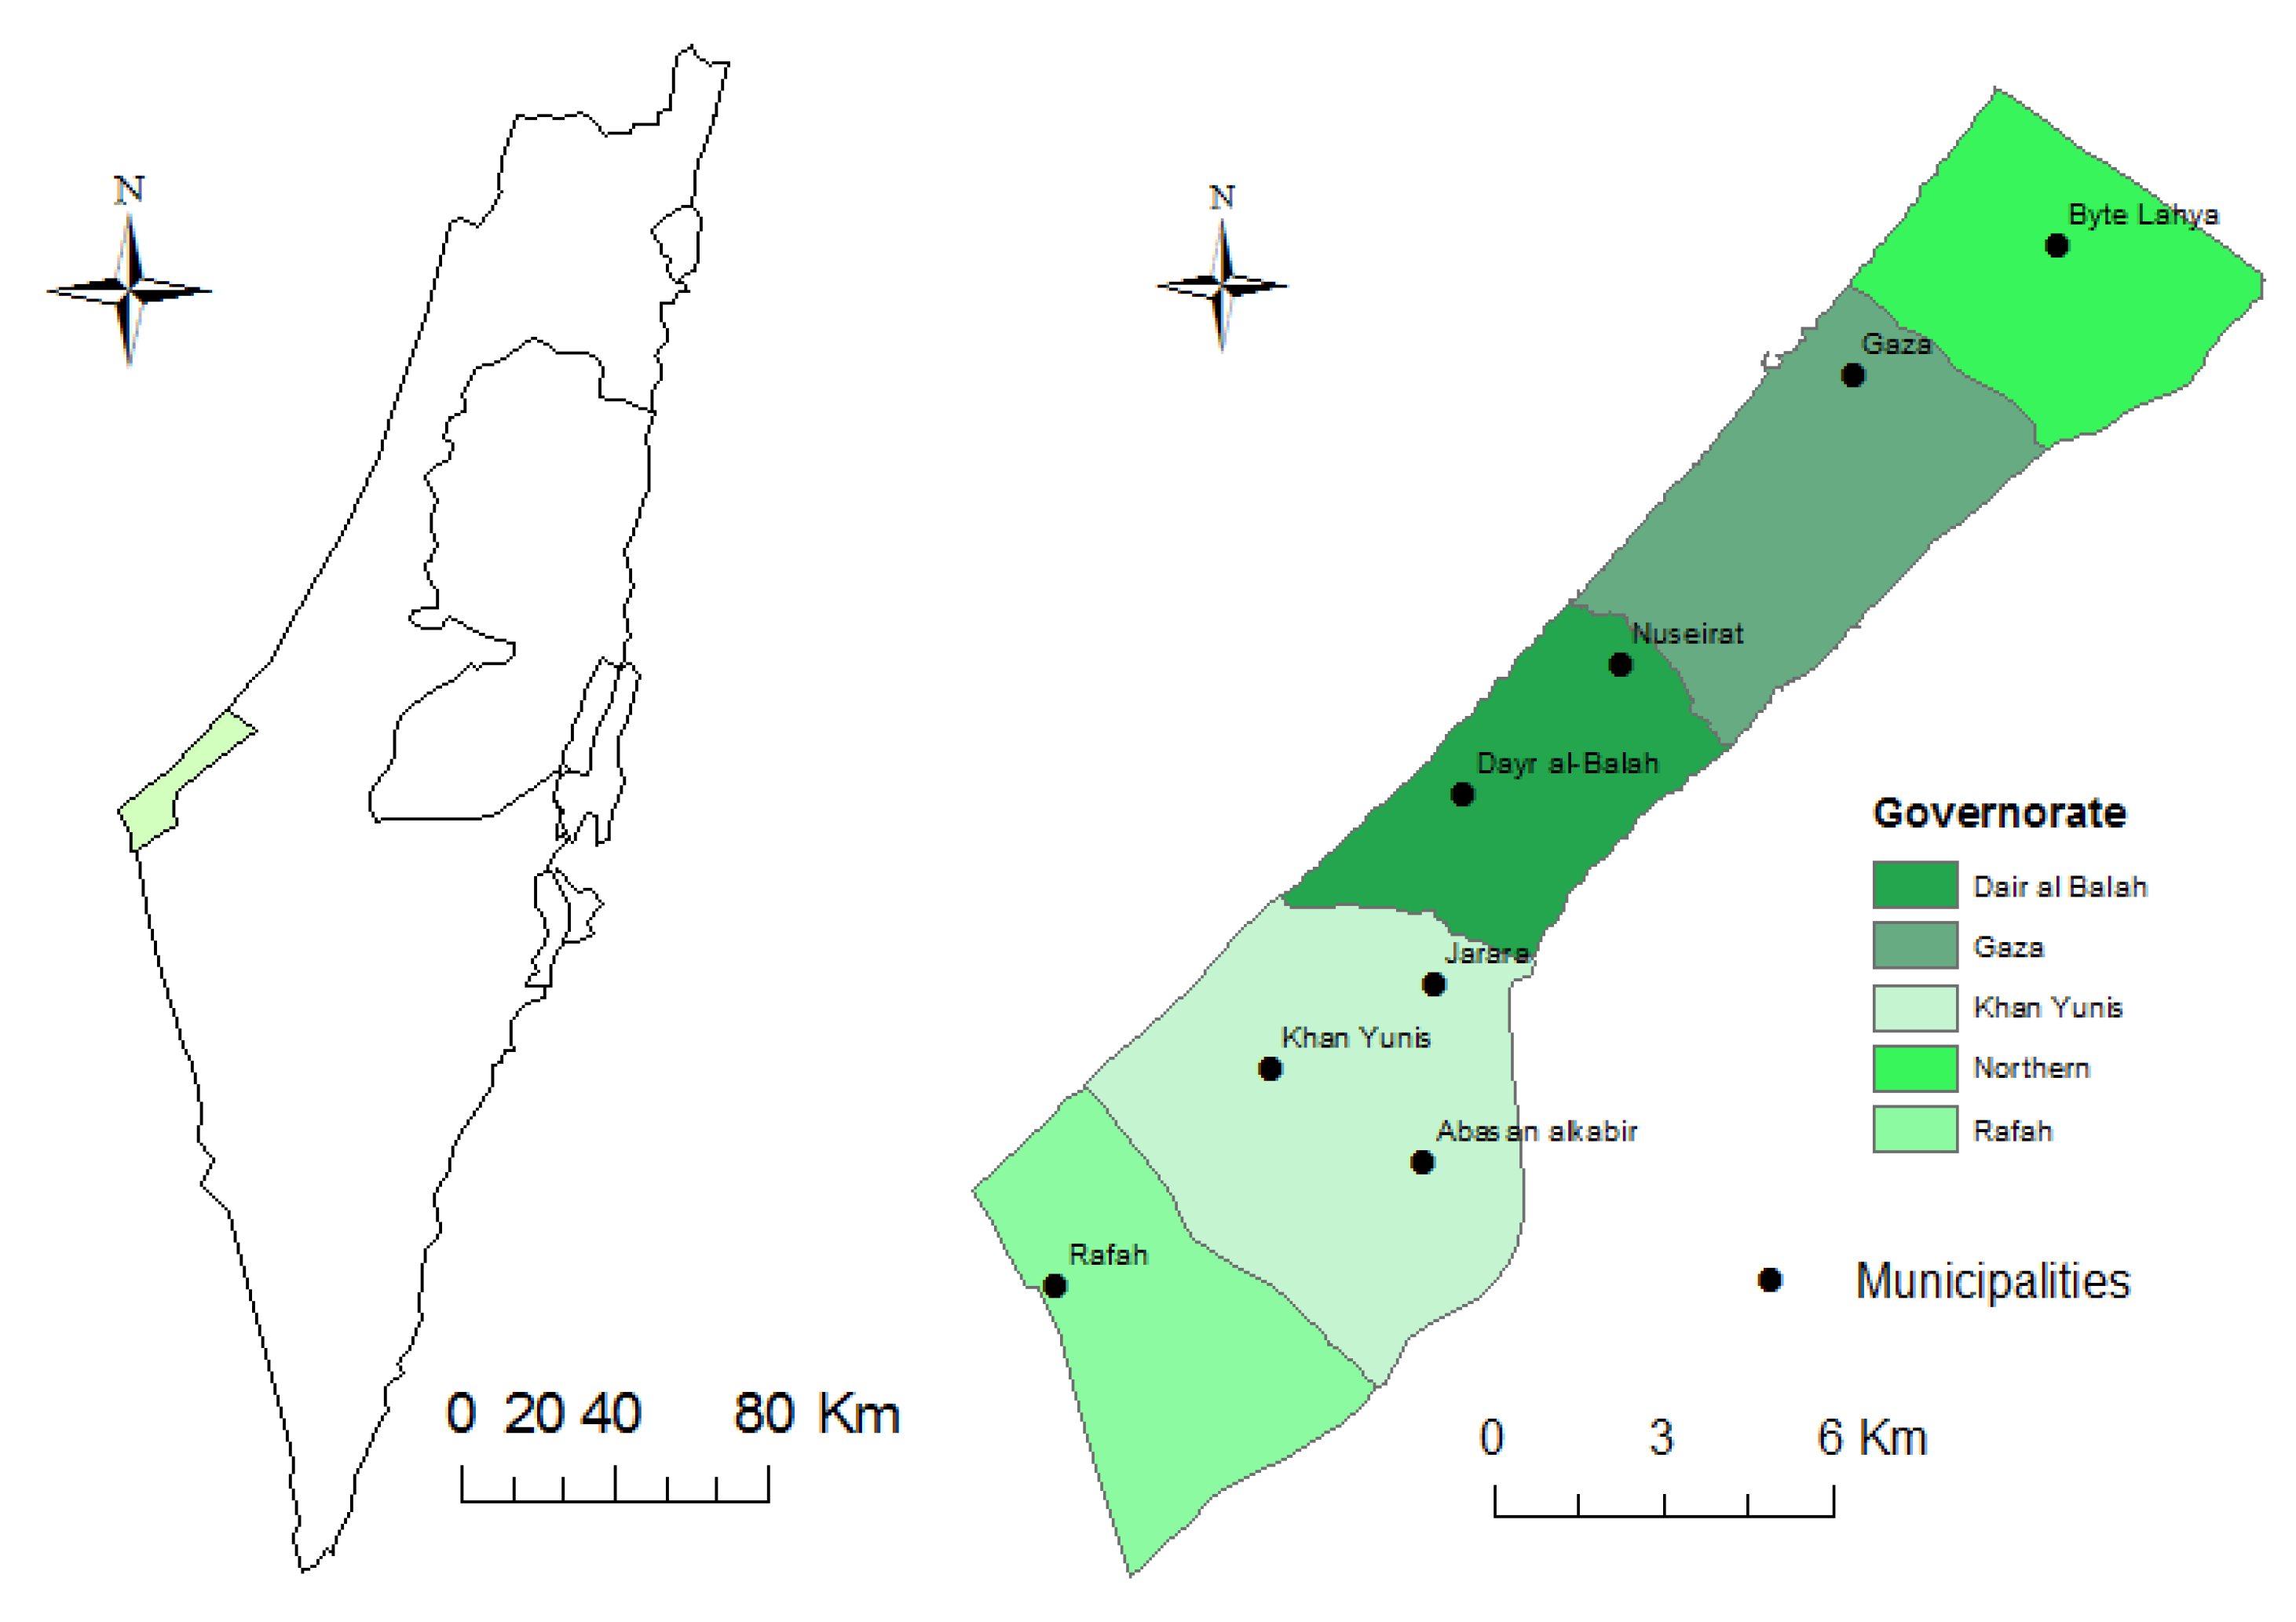
The GS is situated at the eastern shore of the Mediterranean in the southern part of the Palestinian coast. It has a length of 45 km and a width varying between 6 and 12 km from north to south. Egypt lies by the Palestinian Territories (1948) from the east and north. The GS lies 34.13°–34.34° E and 31.13°–31.35° N in the geographical position. The annual incident solar insolation on GS is approximately 5.904 kWh/m2 day [15], with an area of 356 km2, or 1% of the total area of Palestine with about 1,899,291 inhabitants, considered to be one of the most populated areas with a population density of 5335 persons/km2 according to Palestinian Central Bureau of Statistics (PCBS, 2019). The GS consists of five Governorates: Northern Gaza, Gaza, Deir al-Balah, Khan Younis, and Rafah (Figure 2) and it is divided into major towns, villages, and refugee camps [20]. The general unemployment rate in the GS is considered high, with a labor force rate of 23.4 percent. On the GS market, temporary modes of employment dominate. Most jobs are characterized by daily wages and short-term contracts; the largest portion of the population works in the services sector and other branches. Economic reports have shown that this sector has begun to grow in the GS over the past few years, while 6.4% are working in agriculture, hunting, and fishing activities. The level of literacy in the GS is generally high, amounting to 95% of the population over the age of 15. Gender discrepancy is not significant except in the groups above 45 years of age. The population educated to Bachelor’s level and above is 11.2% [23]. However, 48.2% of this population is economically inactive, involving a major economic issue. The average household size in GS is between 5 and 6 individuals, and the number of families exceeds 334,710 families; one-third of them lived in Gaza governorate alone. In 2015, nearly all of households connected to the public grid [20].
2.2. Data Collection and Meteorological Observations
An estimate evaluation is applied to determine the potential of available renewable resources in the GS, and then an integrated assessment is given. Recent meteorological observations and statistical data have been used for this purpose. The most recent available data of biomass resources in this study could be utilized to extrapolate the current situation, according to experts in this field. These data could be compensated by biomass amount variables to evaluate the energy yield and then compare the assessment results with the electrical energy demand at the corresponding time. The input biomass data consist of many arguments that vary due to population inhabitants and their activities. The second challenge encountered in data collection is the absence of a meteorological station in the study area. This problem is overcome by depending on neighboring area data, which are close in meteorological conditions to the interested study area.
Biomass data comprise statistical data belong to Municipal Solid Waste (MSW), sewage sludge, and Agricultural waste. Municipal waste being the main dry biomass source in (kg/person/year) was supplied by the Municipal Development and Lending Fund (MDLF, Gaza, Palestine). MDLF is a semi-governmental funding channel involved in the GS and is one of the 19 various waste recovery stockholders in 2017. Sewage sludge data, the sewage treatment stations number, and treated water volume (m3/day), were provided from the Palestinian Water Authority (PWA, Gaza, Palestine) in 2018, and from CMWU in 2017. Data on agricultural waste were derived from the Agriculture Ministry (MoA, New Delhi, India) in 2017. Agriculture data comprise annual yields waste (kg/ha) of plant, for 2013–2014, and the animal dung production.
Solar energy harvested from the sun mainly depends on the irradiance reading (W/m2), which is obtained using the solar energy tool in the ArcGIS 10.1 software maintained by the Environmental Systems Research Institute (ESRI, Redlands, CA, USA). Furthermore, the diffuse solar radiation was obtained from the Photovoltaic Geographical Information Systems (PVGIS) dataset [26,27].
Meteorological input data used for wind energy potentials are taken from Ashdod data for the years (1991 to 2010) due to the fact that it has similar climate as Gaza. Ashdod is located in the Mediterranean coastal area, 30 km away from Gaza at the same elevation. The wind speed data at 10 m height can reach over 13 m/s for a few hours on certain days. Most of the time, the wind comes from the sea; this means from between south–southwest and north–northwest. Based on wind speed meteorological input data most readings lie between 2 and 6 m/s; the average speed reading mostly exceeds 4 m/s, while the highest recorded readings are in February and September [8,9].
Calculation of wave potential relied on the value readings recorded by the Centre for Meteorology of the Ministry of Transport and Communications in Gaza. Values are presented for the period 2001–2006 taken at the “Gaza Station”; the minimum and maximum values of the average wave period (3.2–3.6 s) were recorded in 2006 and 2001, respectively; the minimum and maximum values of the average wave height (56.1–67.0 cm) were recorded in 2005 and 2001, respectively [28].
2.3. Renewable Resources Assessment
2.3.1. Biomass Assessment
The method suggested by [18] is proposed to assess potential biomass-based energy production in the GS. The energy production was derived from the equations calculating the annual energy (MJ/year) of the biomass resources over a given year(s).
Municipal Solid Waste
The GS currently operates three main landfills, located in Gaza, Deir Elalah, and Rafah. MSW material can be generally categorized compostable, recyclable and inert. Compostable category (organic fraction) includes food waste, residues on the vegetable market, and garden waste. MSW is typically made up of paper, plastics, food waste, metals, and other organic fractions of 0.65 [14]. The methane (CH4) yield from MSW, was measured and converted to energy using Equation (1):
where (MJ/year) is the local energy output from municipal organic solid waste, (ton/year) is the total MSW in the study area, i is the time period (2015), SP (ton/year) is the local quantity of one landfill, and ST (ton/year) is the total quantity of MSW over study area landfills. is the methane production (Nm3/ton vs.) [29], where 1 m3 CH4 = 36 MJ [30].
On the other hand, the considered energy from the remaining inorganic amount of MSW, which is non-recycling or reusable, was determined based on [31], using Equation (2):
where (MJ/year) is the lower heating value of waste burning, i is the time period (2015), P is the population, considering that only 23% of the total waste will be burned, is the mean waste production per capita (kg/year), and (MJ/kg) is the average calorific value of the MSW.
Sewage in Wastewater
Sewage sludge originates from three primary wastewater treatment plants located in the area of Beit Lahia, Gaza, and Rafah, as well as two intermediate treatment plants in Khan Younis (Mawasi) and the Wadi Gaza wastewater treatment plant (WWTP). According to a study on anaerobic digestion of sewage sludge [31], the long-term potential for methane production and its energy output from local sewage sludge (ton/year) was calculated using Equation (3):
where (MJ/year) is the annual energy output that could be generated from waste water treatment plants, i is the time period (2015), P is the inhabitants connected to the waste water network, which is equal of 69% of local people, and the wastewater network covers an area equivalent to 69% distributed among the GS Governorates [32]. Cesspits will dispose water from areas that are not connected to wastewater networks. (kg/year) is the average per capita wastewater generation, S/W is the sludge wastewater (SS) ratio, and
is methane (Nm3/ton vs.) production, where 1 m3 CH4 = 36 MJ [30].
Residues in Agriculture
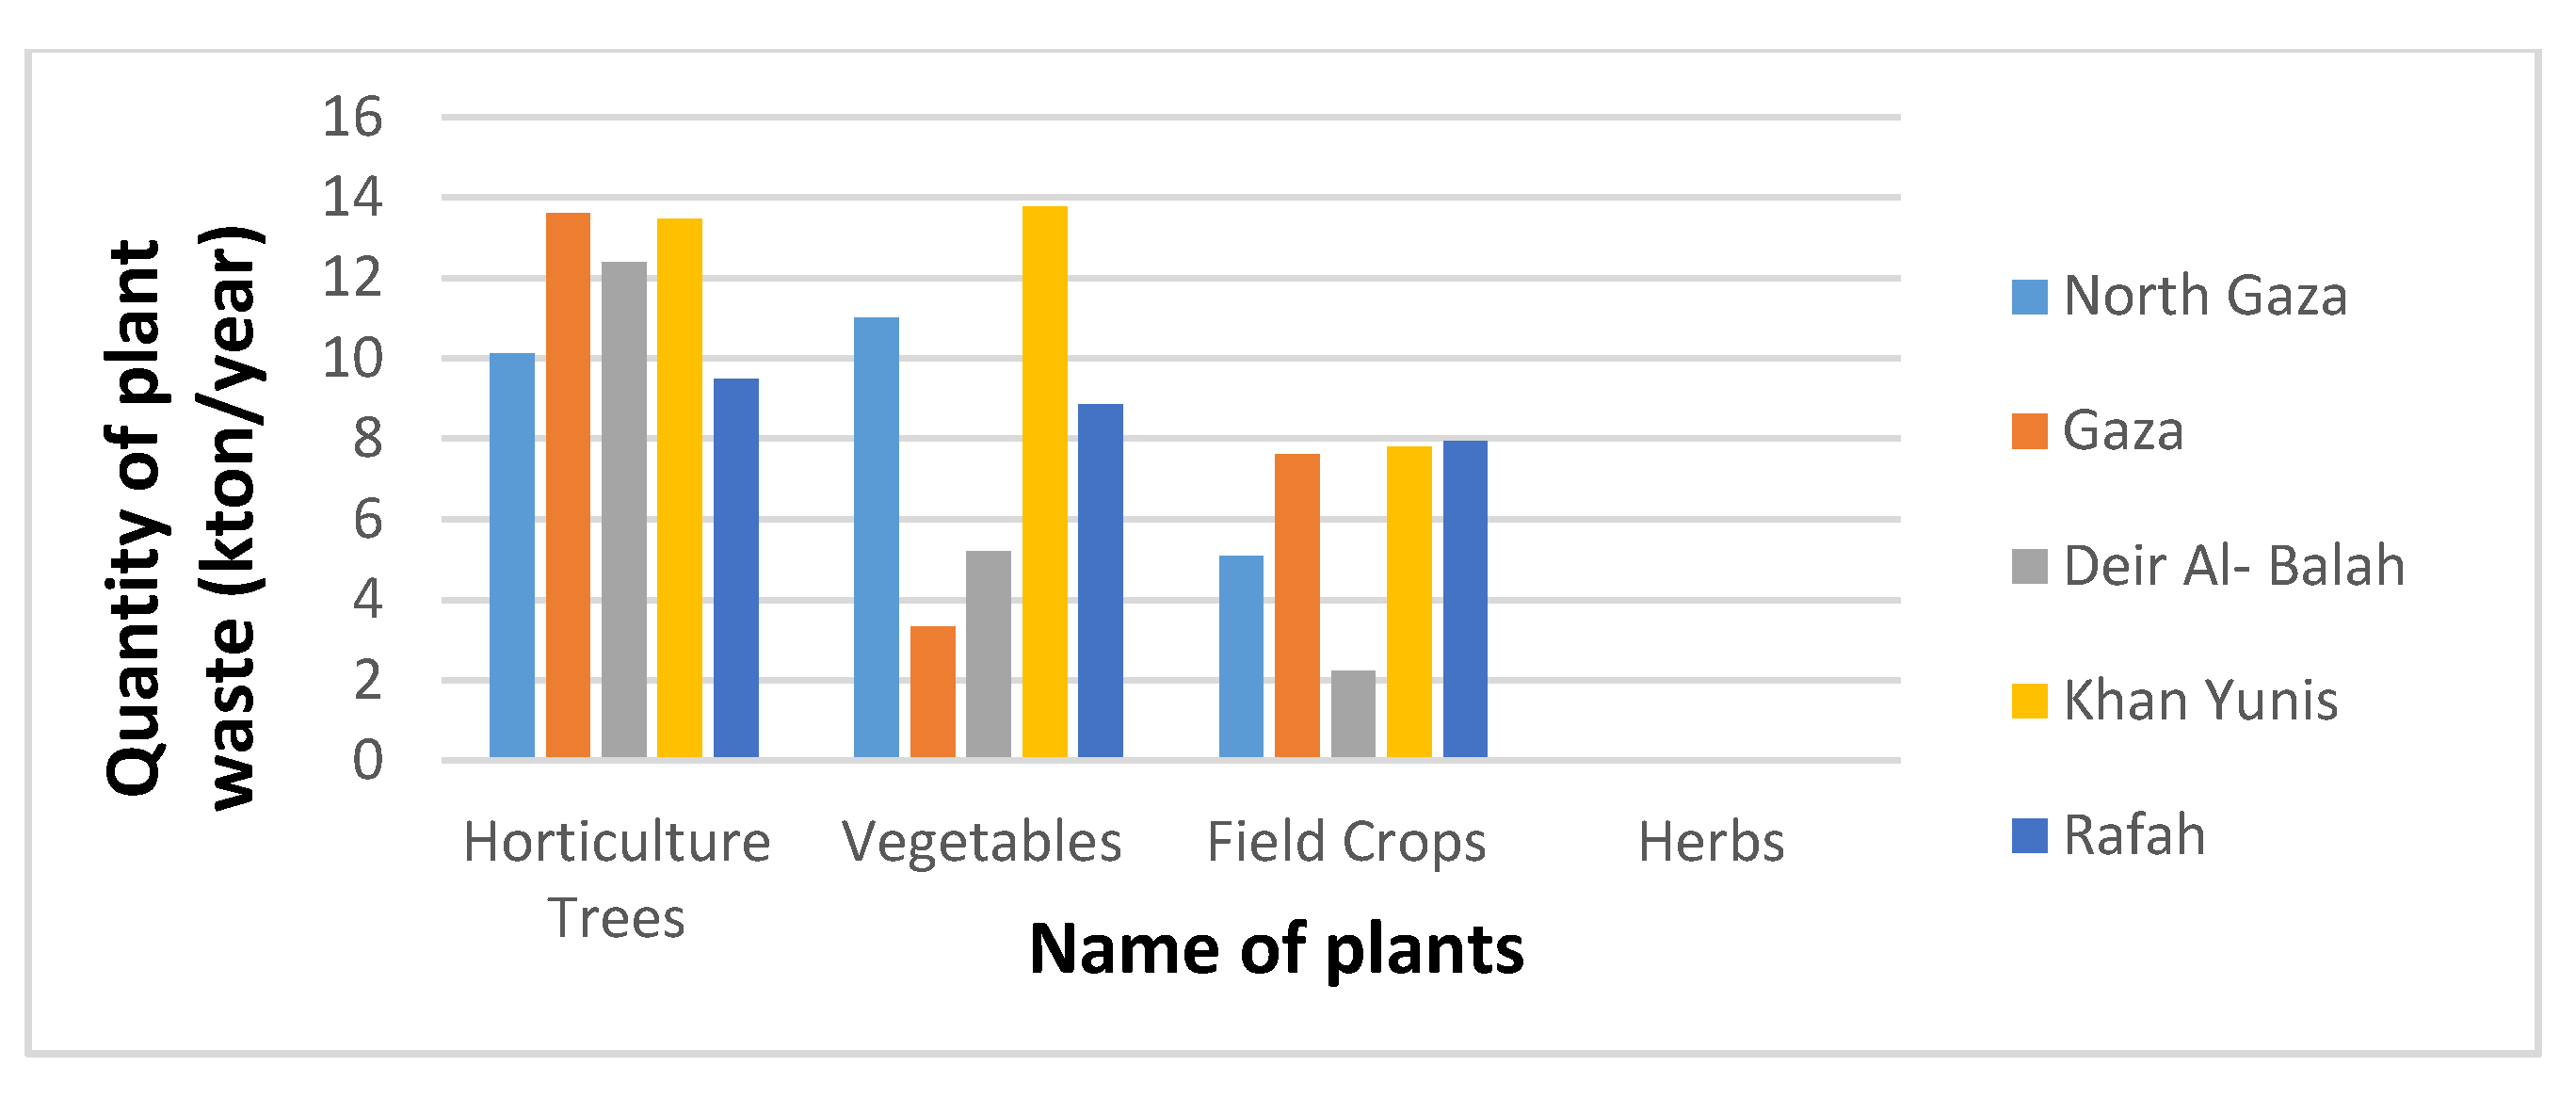
Agricultural land is about 16,400 ha, according to the MoA annual report 2013–2014, classified into 5600 ha vegetables, 8000 ha garden trees, 2800 ha field crops, and 20.8 ha as herbs [33]. On the other side, the production of agricultural waste is around 1197 tons of organic waste per day. Research in [34] obtained the amount of methane released by anaerobic digestion of vegetable and fruit waste, the total amount of methane produced from garden trees was calculated according to [35] method, the biogas can be produced from crop could be evaluated by referring to [35], and finally, the amount of methane in herbalists was obtained from Letomaki [36]. Using Equation (4) the methane generated from anaerobic digestion can be detected for agricultural land and its energy production.
where (MJ/year) is the energy output of the plant area, ∫ (ha) is the area, Yi (kg/ha) is the average plant waste yield, i is the time period (2017), and is the methane production from vegetable waste (Nm3/kg vs.), where 1 m3 CH4 = 36 MJ [30]
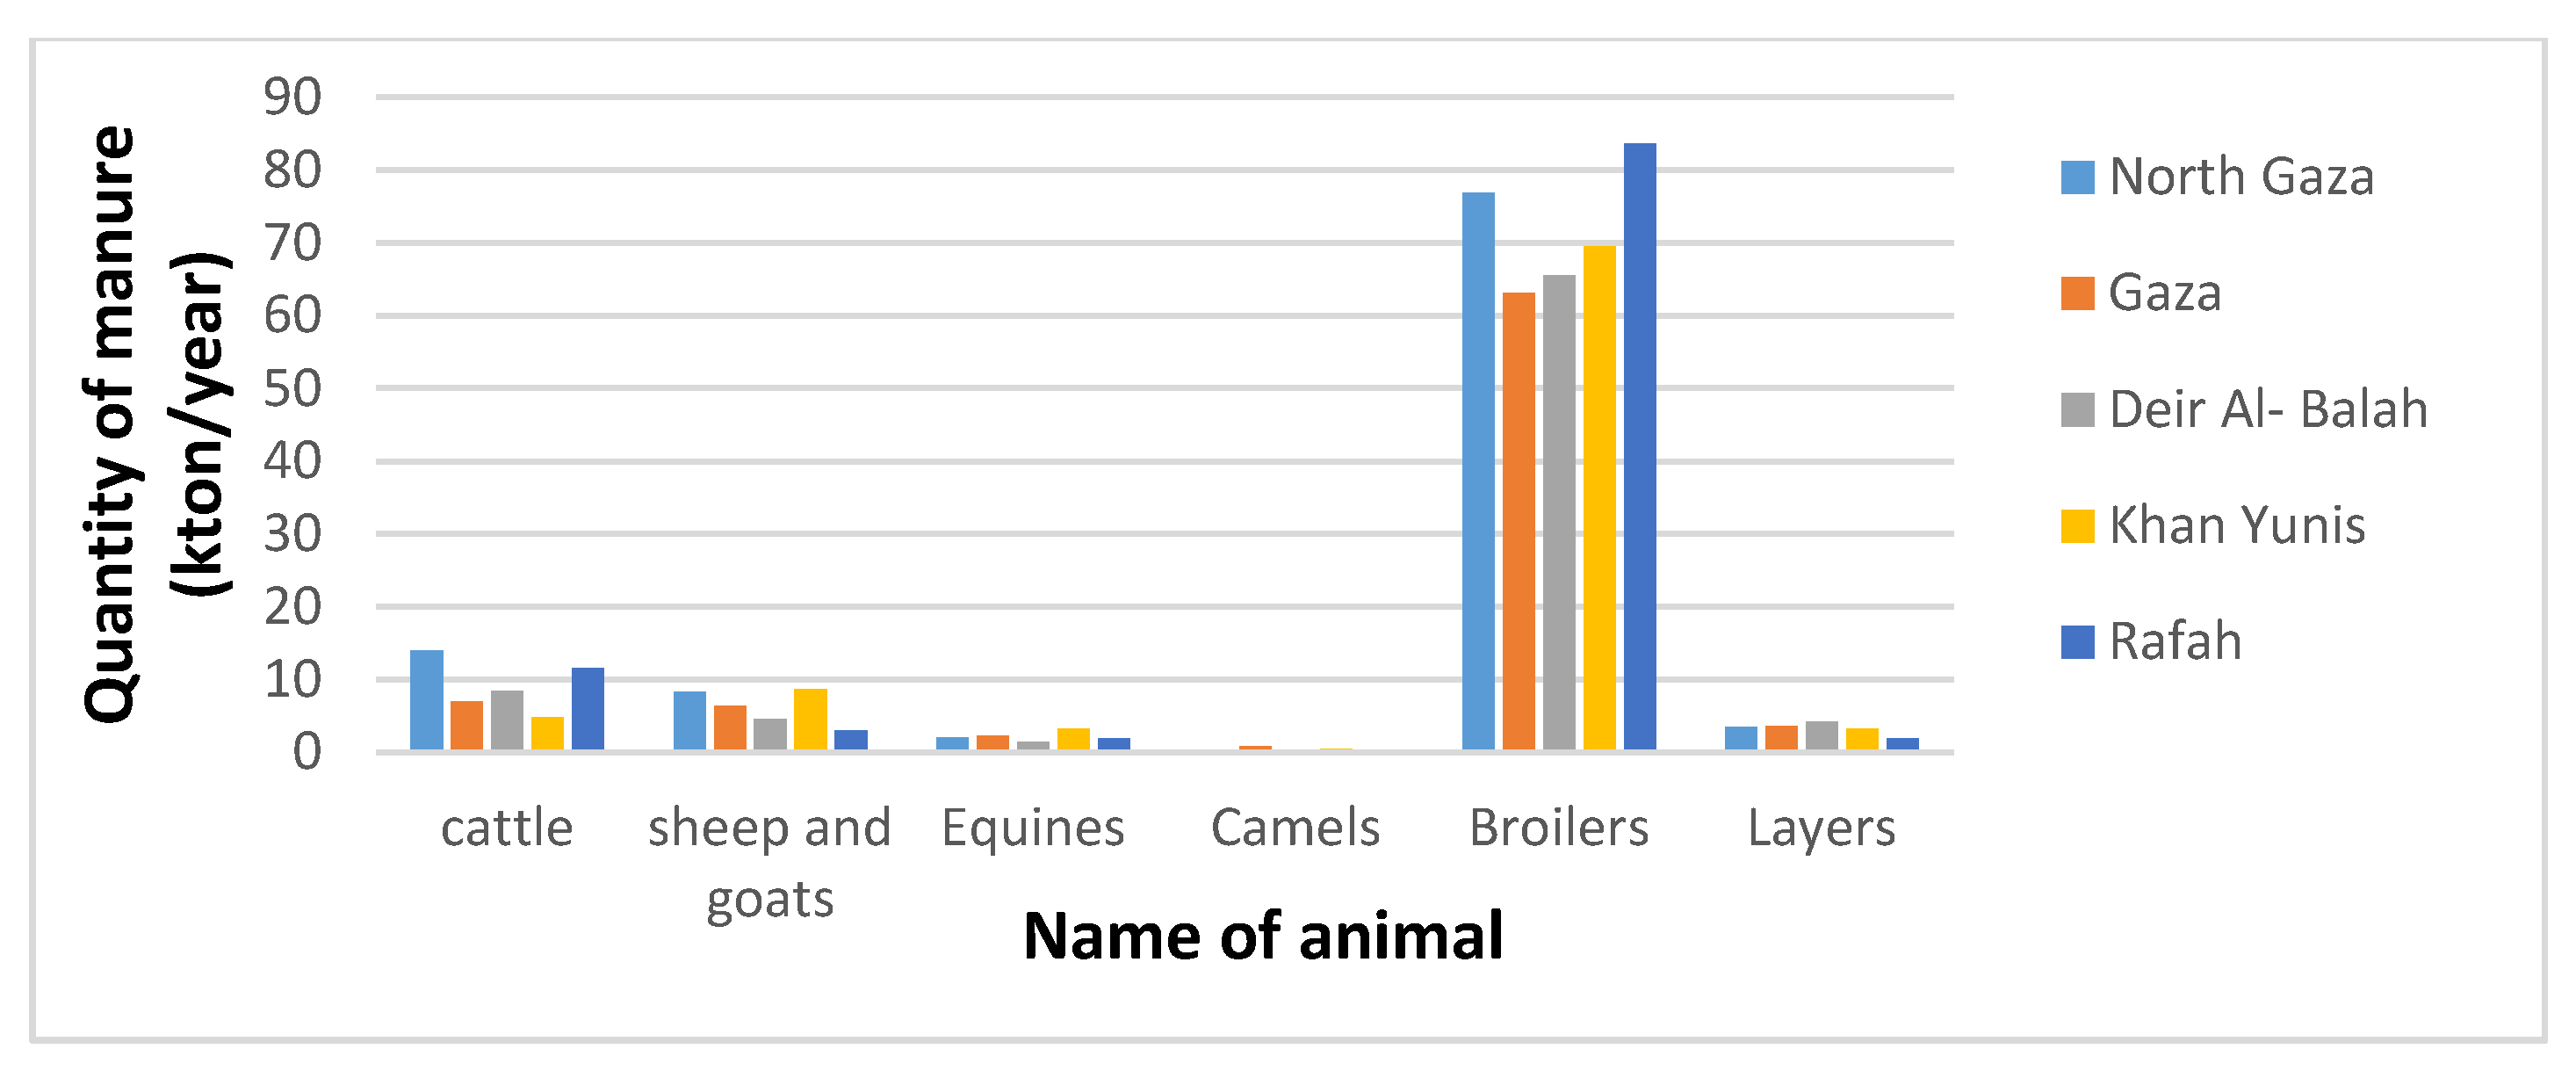
Production of animal waste in Gaza comes from sheep, goats, camels, cattle, calves, and poultry. Types of poultry in the study area are broilers, layers, broilers mothers, turkey, and rabbits. Broilers refers to the chicks which can be kept to produce white meat with 50 days as a maximum period. Layers refers to the chicks kept to produce table eggs, typically not longer than 30 months in life span. Based on methane yields obtained, the amount of methane from livestock units was evaluated and implies anaerobic digestion [37]. The density of veal, ovine, and poultry manure is 103, 103, and 970 kg/m3, respectively [35]. The total volume of methane in the animal waste and the energy yield was determined using Equation (5).
where (MJ/year) is the potential energy output of a livestock farm, i is the time period (2013–2014), represents the farm’s livestock unit, (m3) is the daily waste yield from the livestock, and is the average methane production from animal waste (Nm3/kg vs.), where 1 m3 CH4 = 36 MJ.
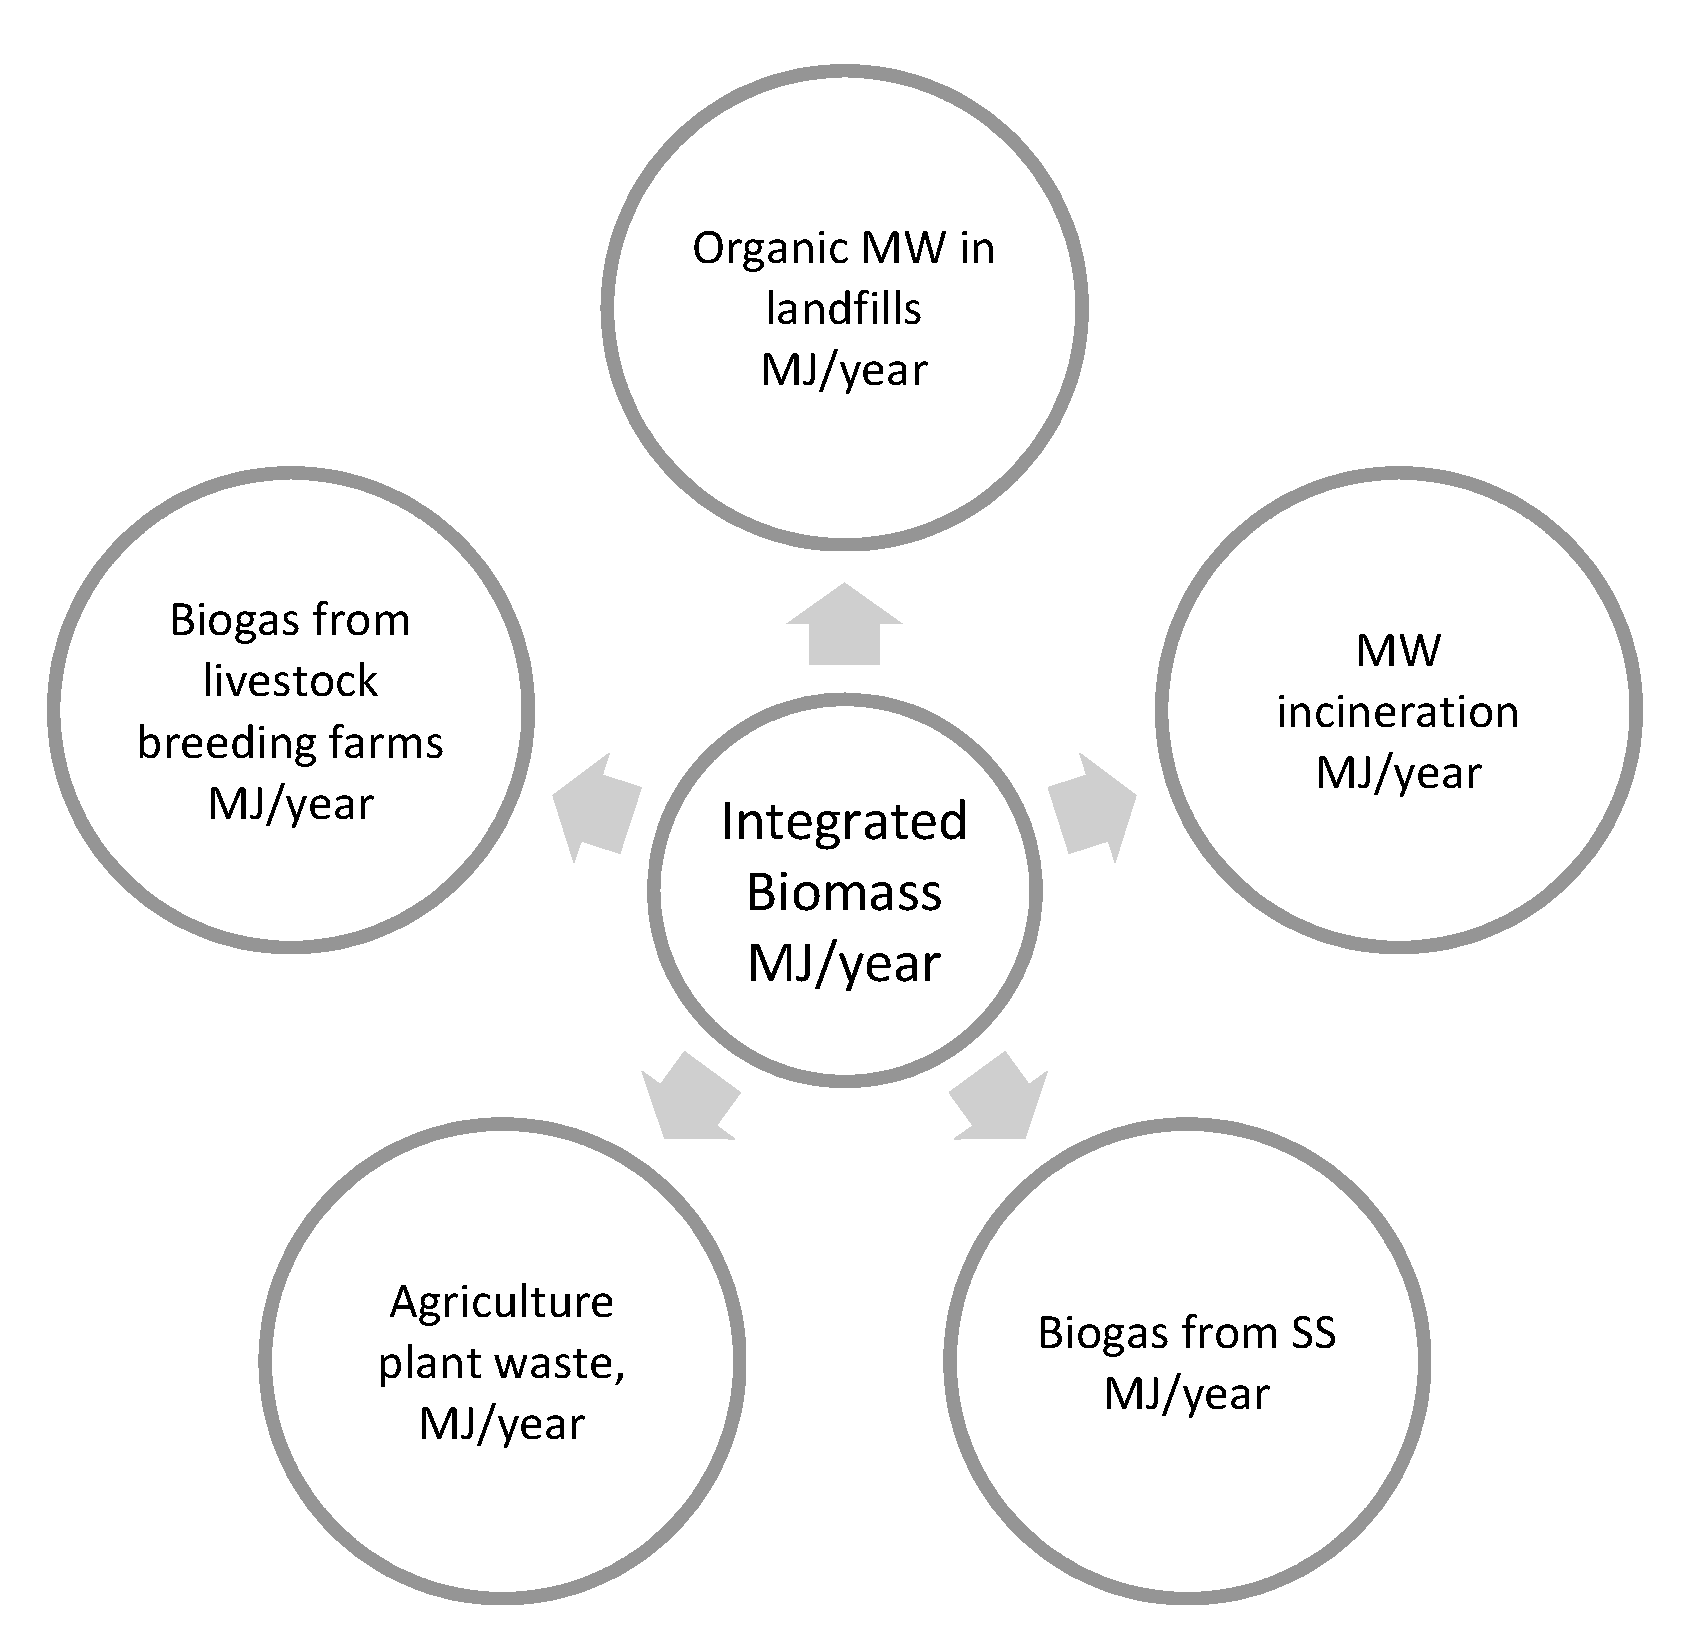
The potential energy derived from biomass was assessed using Equation (6). The method suggests anaerobic digestion, but combustion will be carried out on non-organic MSW, Figure 3 shows the incorporated energy (MJ/year) from the different biomass sources in the work area. It is good noting digested animal organic waste after biochemical treatment can be used as compost.
2.3.2. Solar Energy Assessment
GIS methods are used for solar radiation modelling. ArcGIS 10.1 (ESRI) has a module for calculating solar radiation in a given area. The characteristics of the analyzed area are derived from a Digital Elevation Model (DEM) [27]. DEM is obtained from the Shuttle Radar Topography Mission (SRTM). The solar radiation module uses a predicted coordinate scheme, which can then calculate the inclination angle of the sun’s radiation. The diffuse radiation values were obtained from the PVGIS dataset and from the Tar and et al. method [38], respectively. PVGIS is an open source online tool to assess the solar electrical energy production from a PV system; consequently, a solar radiation map of the GS was created.
A generalized procedure was defined to convert the solar energy potential into energy output using Equation (7).
where (kWh/year) is the solar energy potential in the study area, is the efficiency of the PV array, is the area of a PV module (in m2), (kWh/m2/year) is the amount of global radiation in a given Governorate, and i is the modelled period for one year (2016). The output of PV system needed for an average household in the GS is 2.86 kW. In this study, crystalline silicon technology PV system was modelled with 1 kW capacity, with 7.0 m2 roof area for each. Total solar energy potential is estimated based on the number of study area households and one PV system was assumed for each dwelling.
2.3.3. Wind Energy Assessment
WindSim 9.0.0 software [39] was used to estimate the wind energy. The software developed by the Norwegian company Vector AS. The software based on computational fluid dynamic (CFD) simulations of wind flows and required a high-resolution DEM of the region. The input wind parameters for the simulations included the eight-wind directions speed based on the wind measurements at Ashdod Station (1991 to 2010), refer to Section 2.2. The wind turbine installation depends on authority’s permits, and environmental regulations, additional to territorial environmental consideration restrictions [40]. Turbine locations were then entered into ArcGIS.
The areas suitable for wind farm installation was determined based on the methods from Staffell and Pfenninger [41], while the total wind energy production was estimated [40] using Equation (8):
where (MWh/year) is the wind power produced locally, ∫ (km2) is the area available for wind turbine installation, and is the turbine performance (MW/km2). The utilized of wind potential depends on many ecological factors and was estimated 5 MW/km2, while it decreases in the mountains, [9,12,16]. is the turbine performance of a given area in WindSim 9.0.0 simulation. The Tm values reflect the average output of the 400 kW (low capacity) turbines from Vestas WD34, expressing a mean potential value not limited by the investment scale [42].
2.3.4. Wave Energy Assessment
The west coast of the GS, 31.192°–31.354° N, 34.138°–34.293° E, has a coastline roughly 41 km long. The GS overlooks the Mediterranean to the West, and extending from the South to the North, making Gaza an exploitable area for renewable wave energy [8,9,10]. The GS coast is located in the eastern Mediterranean region; a very high-resolution integrated atmospheric/wave modelling system was developed for simulating the atmospheric circulation and sea wave evolution in the area over a period of 10 years in the Levantine Basin, Eastern Mediterranean is presented in Zodiatis et al. [43]. The most energetic offshore areas of the Levantine Basin are characterized by relatively low 10-year mean wave energy potential of about 2.5 kW/m and shows a generally stable yearly behavior of wave power values. The wave model WAM, ECMWF (European Centre for Medium-Range Weather Forecasts) [44], version CY33R1 has been used [43,44,45]; the wave energy potential is affected directly according to controlling and simulation of two main parameters which are the considerable wave height and wave energy period.
Status of the sea/ocean, installation and maintenance of the mechanical and electrical equipment as well as its efficiency, type of bed sea, and others, are important criteria concerned when selecting the wave energy conversion (WEC) system for a site and the power produced [46]. WEC systems have been developed to extract energy from the shoreline out to the deeper waters offshore. These devices are generally categorized by the installation location, such as shoreline, near-shore and offshore, and the Power Take-Off (PTO) system [46].
The annual available energy (AAE) density, in MWh/m, is used as a site’s resource parameter [45,46,47,48]. The wave energy period () and considerable wave height () are ultimately determine the wave power density (J) of the specific site, the factor for random waves is 1/16, as opposed to 1/8 for periodic waves:
where is the waves group velocity, which is a function of distance (the depth (h)) and wave energy time . The AAE density is calculated as a function of peak cycle (period) time (Tp):
where is the number of hours in a year (8766h), and is the combined probability of the partitioned wave power density J and peak cycle time . The total density is gathering over all peak time:
The average annual power density of shoreline waves is determined by dividing the total AAE density in MWh/m by the number of hours in a year, assuming no energy conversion losses. Annual means for a typical period (2001–2006) of J, Hs, and Te are 1.29 kW/m, 61.6 cm and 3.4 s. The equivalent absorbed power (kW) produced from the simulation of point absorber simulation in OpenWEC is evaluated by the force of 8 × 10³ N, and 5 m depth.
3. Results
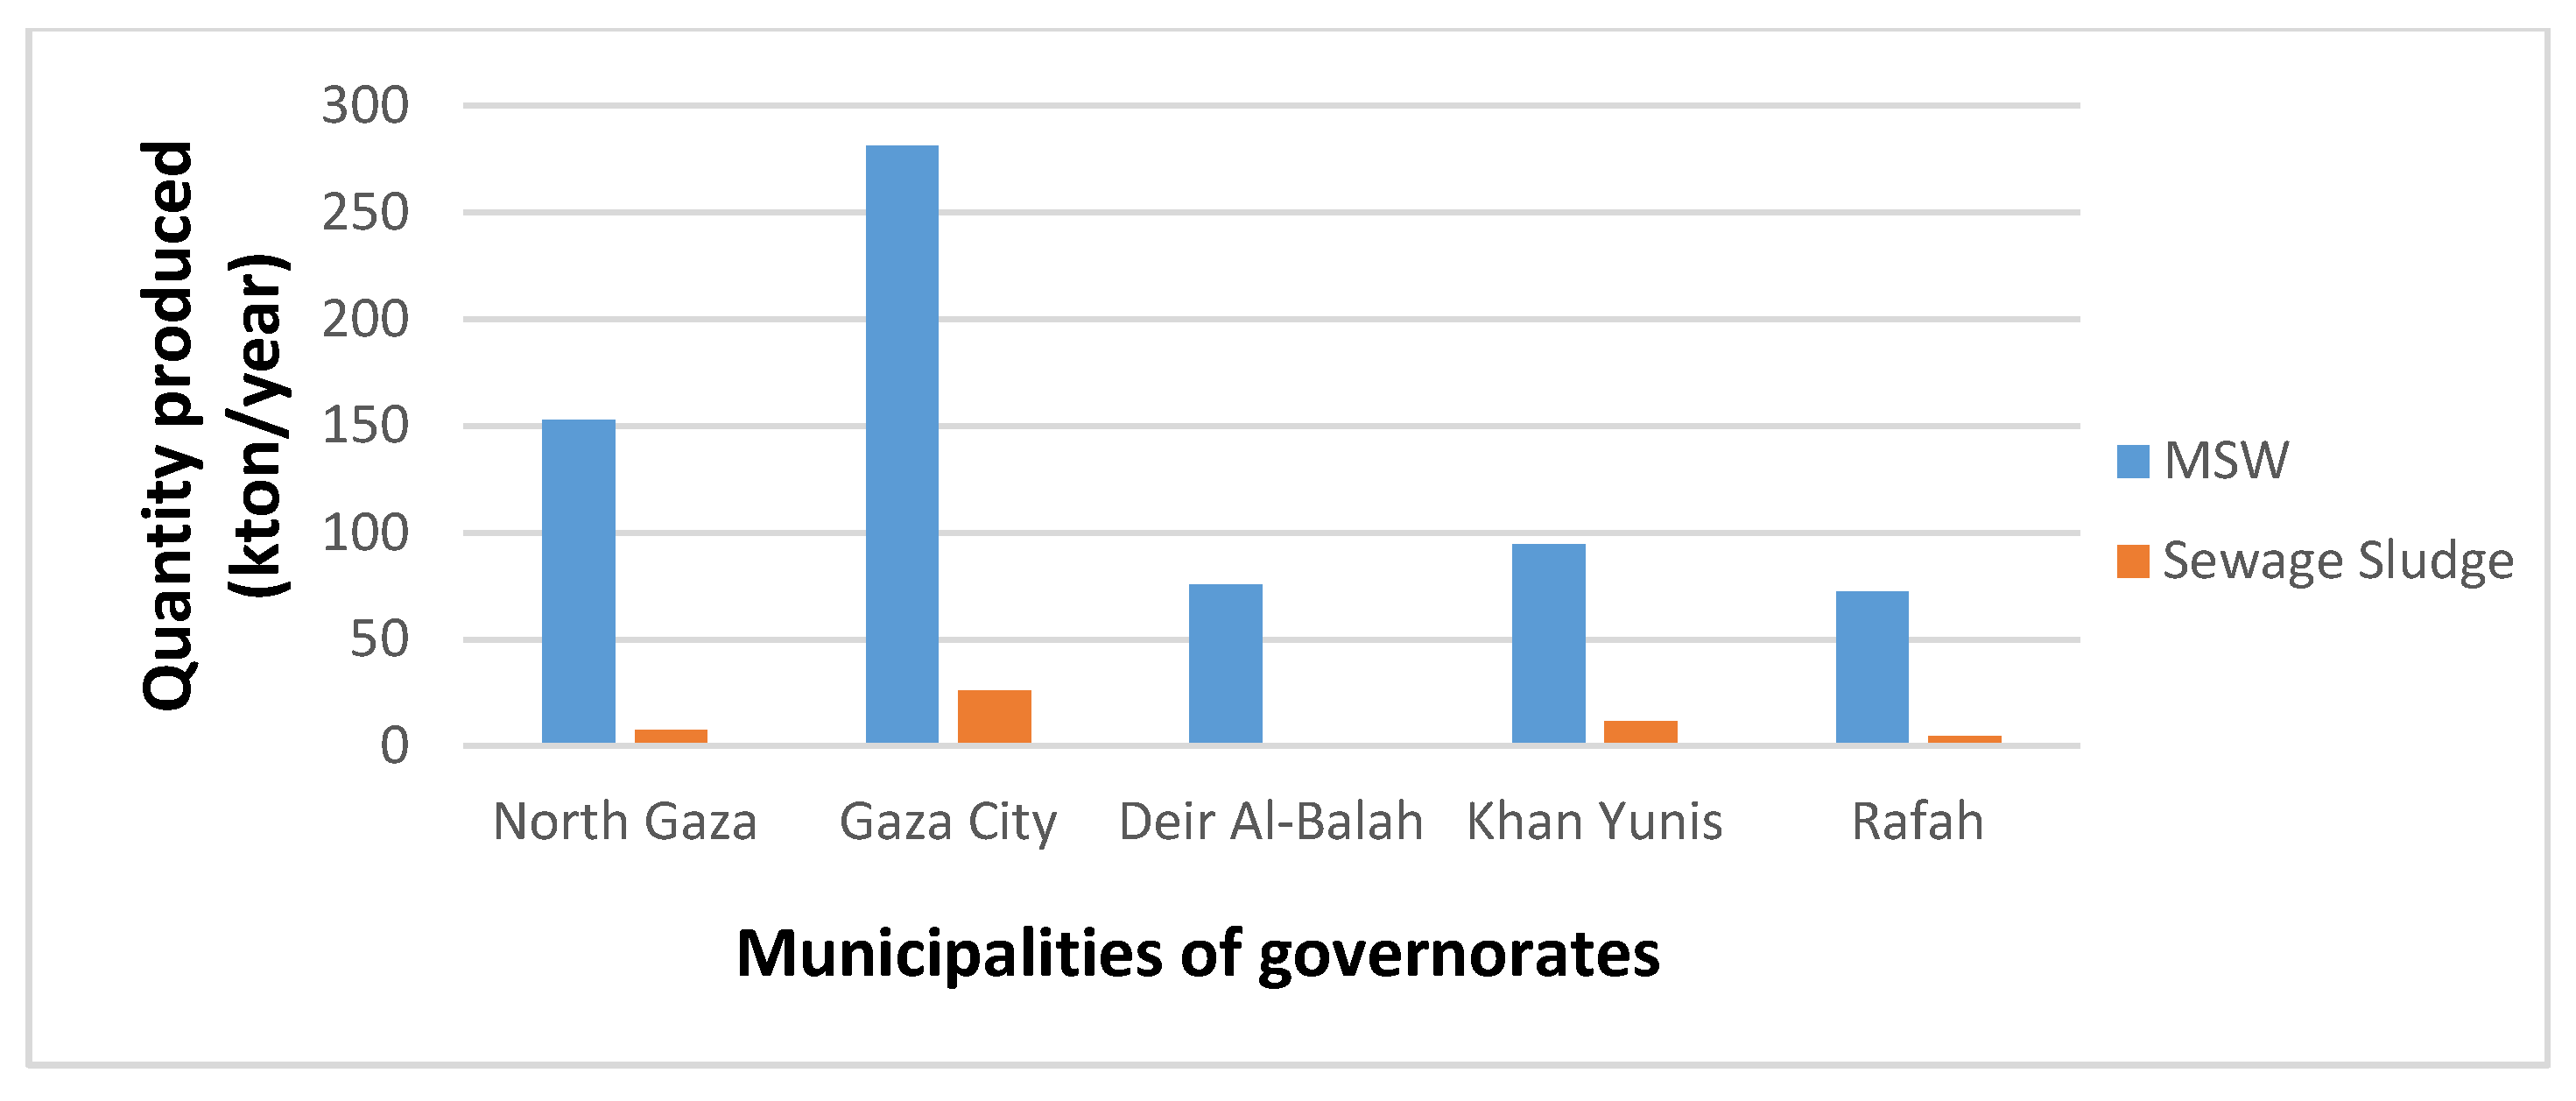
MSW, sewage sludge, and agricultural waste constitute the biomass sources in GS. Figure 4, Figure 5 and Figure 6 show the amounts (ton/year) of each Governorate according to type. The current study assumes an anaerobic digestion technique, where we estimate methane from the biomass (MSW, SS, and agriculture waste). Then extracting the energy from the inorganic combustible, which is essentially MSW.
Based on anaerobic use, the capacity to supply methane and electricity from biomass resources in the GS was estimated based on the methodology outlined in Section 2.3.1. The waste from animal manure is considered the largest RE biomass (kton/year) as depict in Figure 4, Contributing to overall biomass supplies for thermal energy generation 71.34% (1368.7 GWh/year), followed by agricultural waste energy at 14.4% (277.2 GWh/year), household solid waste at 13.8% (264.8 GWh/year), and sewage sludge energy at 0.45% (8.8 GWh/year), respectively. Table 1 reported the annual quantity (kton) biomass for each type, the output of methane (Mm3), the annual thermal energy yield of MWh and the percentage sharing of each biomass source in anaerobic digestion and mathematical method assumed [49].
3.1. Distribution of the Potential for Biomass, Solar, Wind and Wave Energies
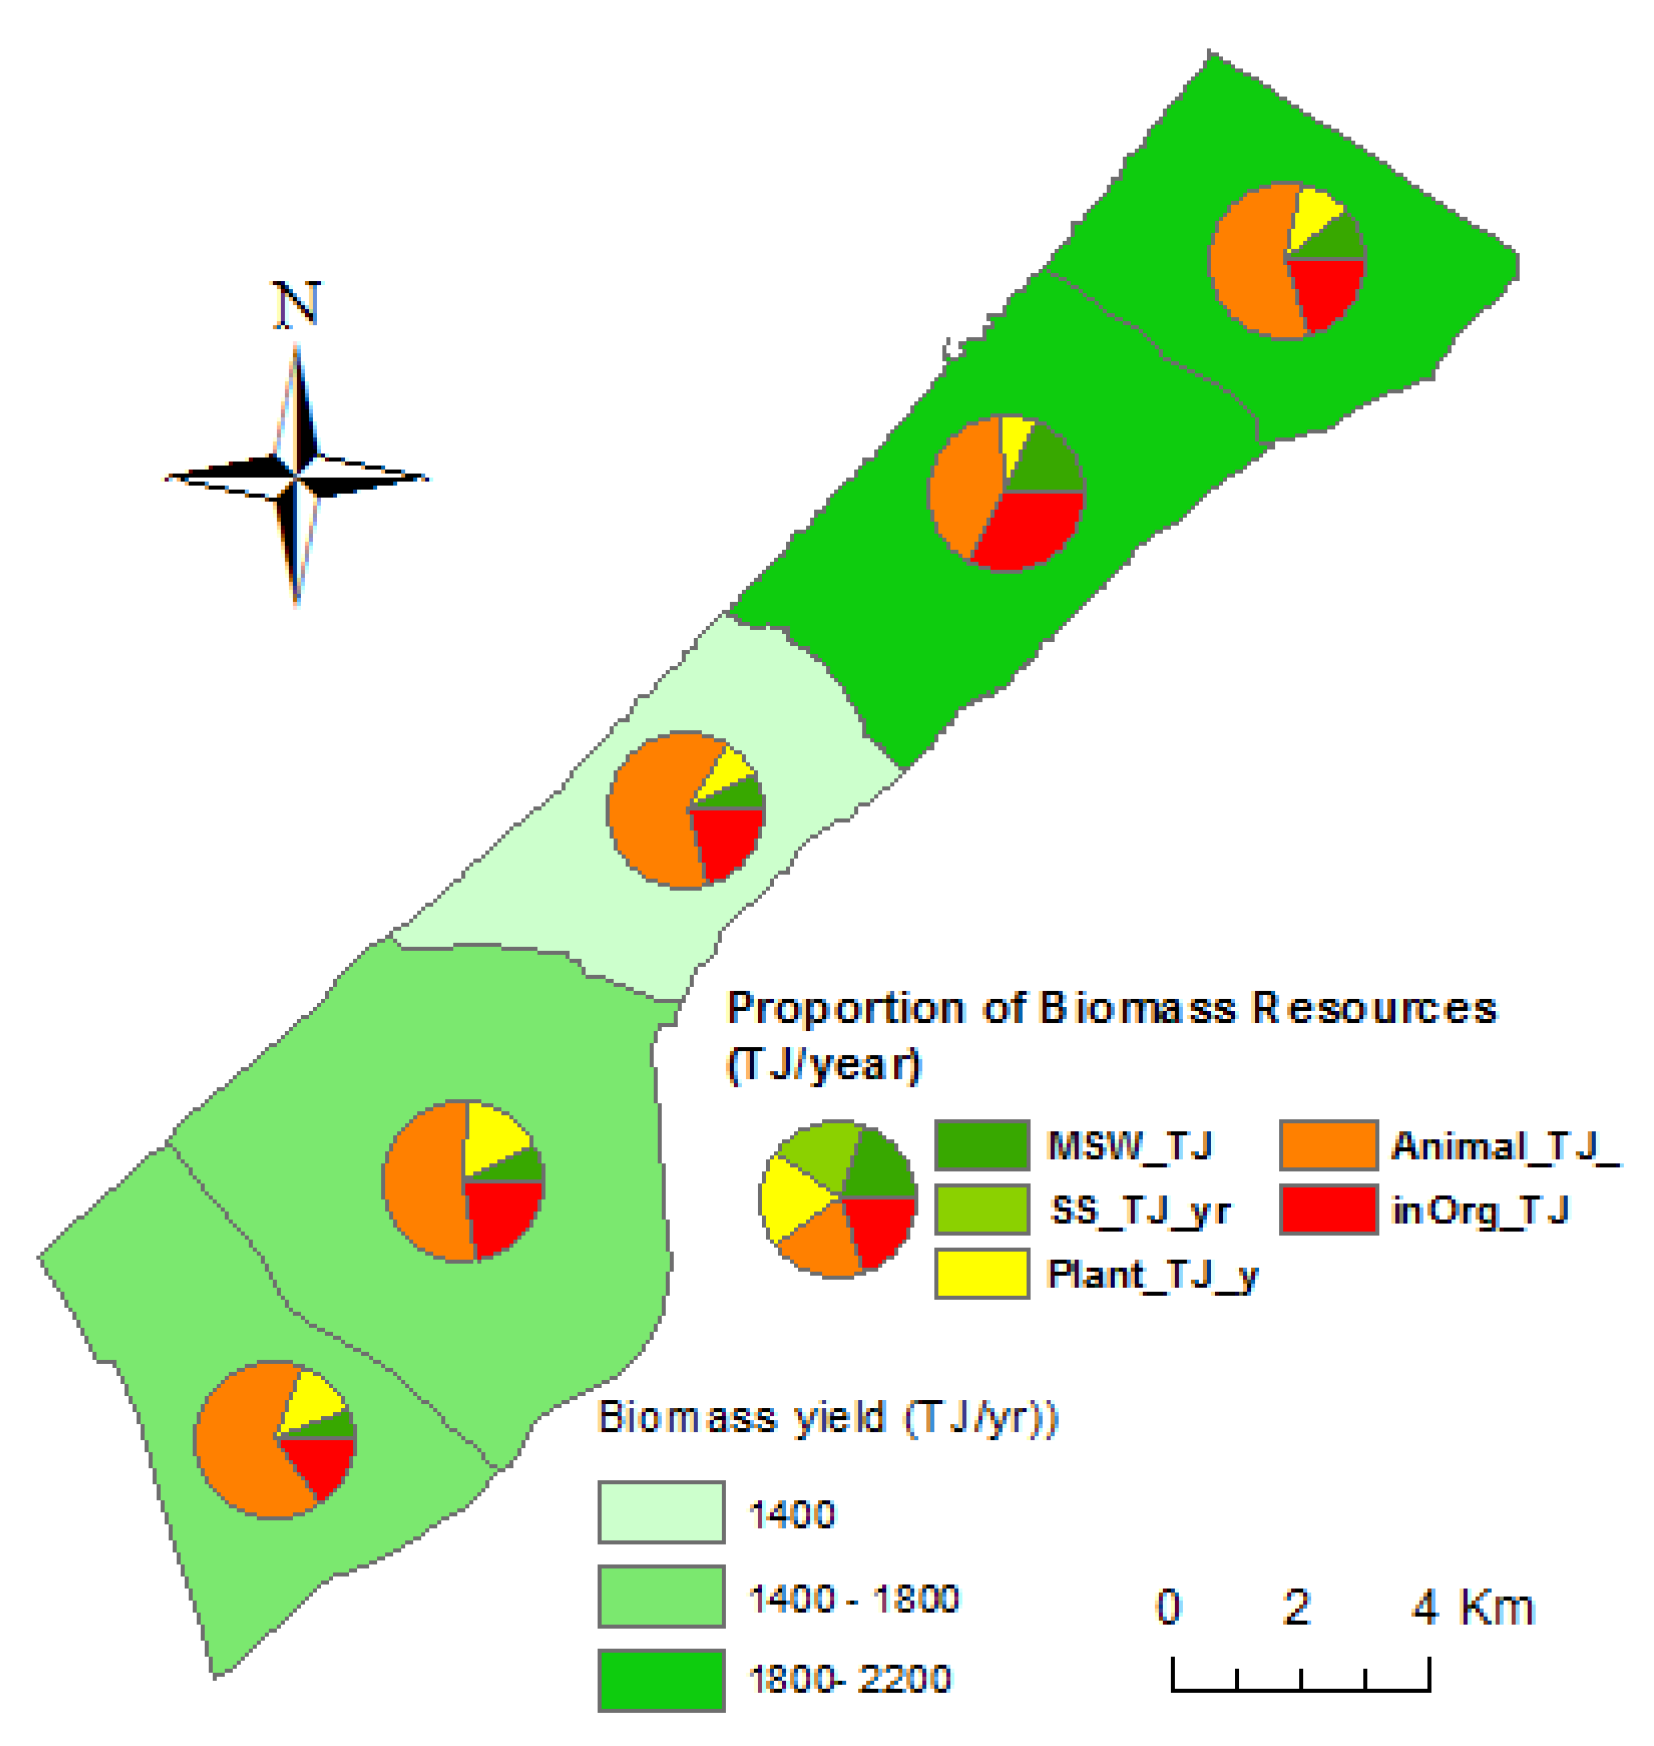
The biomass potential of the GS is 8916.4 TJ/year; depending on the calculations executed in this study 6910.45 TJ/year comes from anaerobic digestion (refer to Table 1) and the rest from inorganic incineration of red color in the circle represented in Figure 7, and the figure shows biomass resource propagation (TJ/year) in all governorates. Considering the capacity and the efficiency of the equipment used to produce heat and electricity, the electrical energy used is 2377.7 TJ/year, which is equivalent to 671.83 GWh/year, and thus the instantaneous electrical power is 65.15 MWe from biomass resources. Figure 7 depicts the proportion of biomass resources in the governorates, and Figure 8 reveals that the potential electrical energy could be generated from CH4 generated from anaerobic digestion technique.
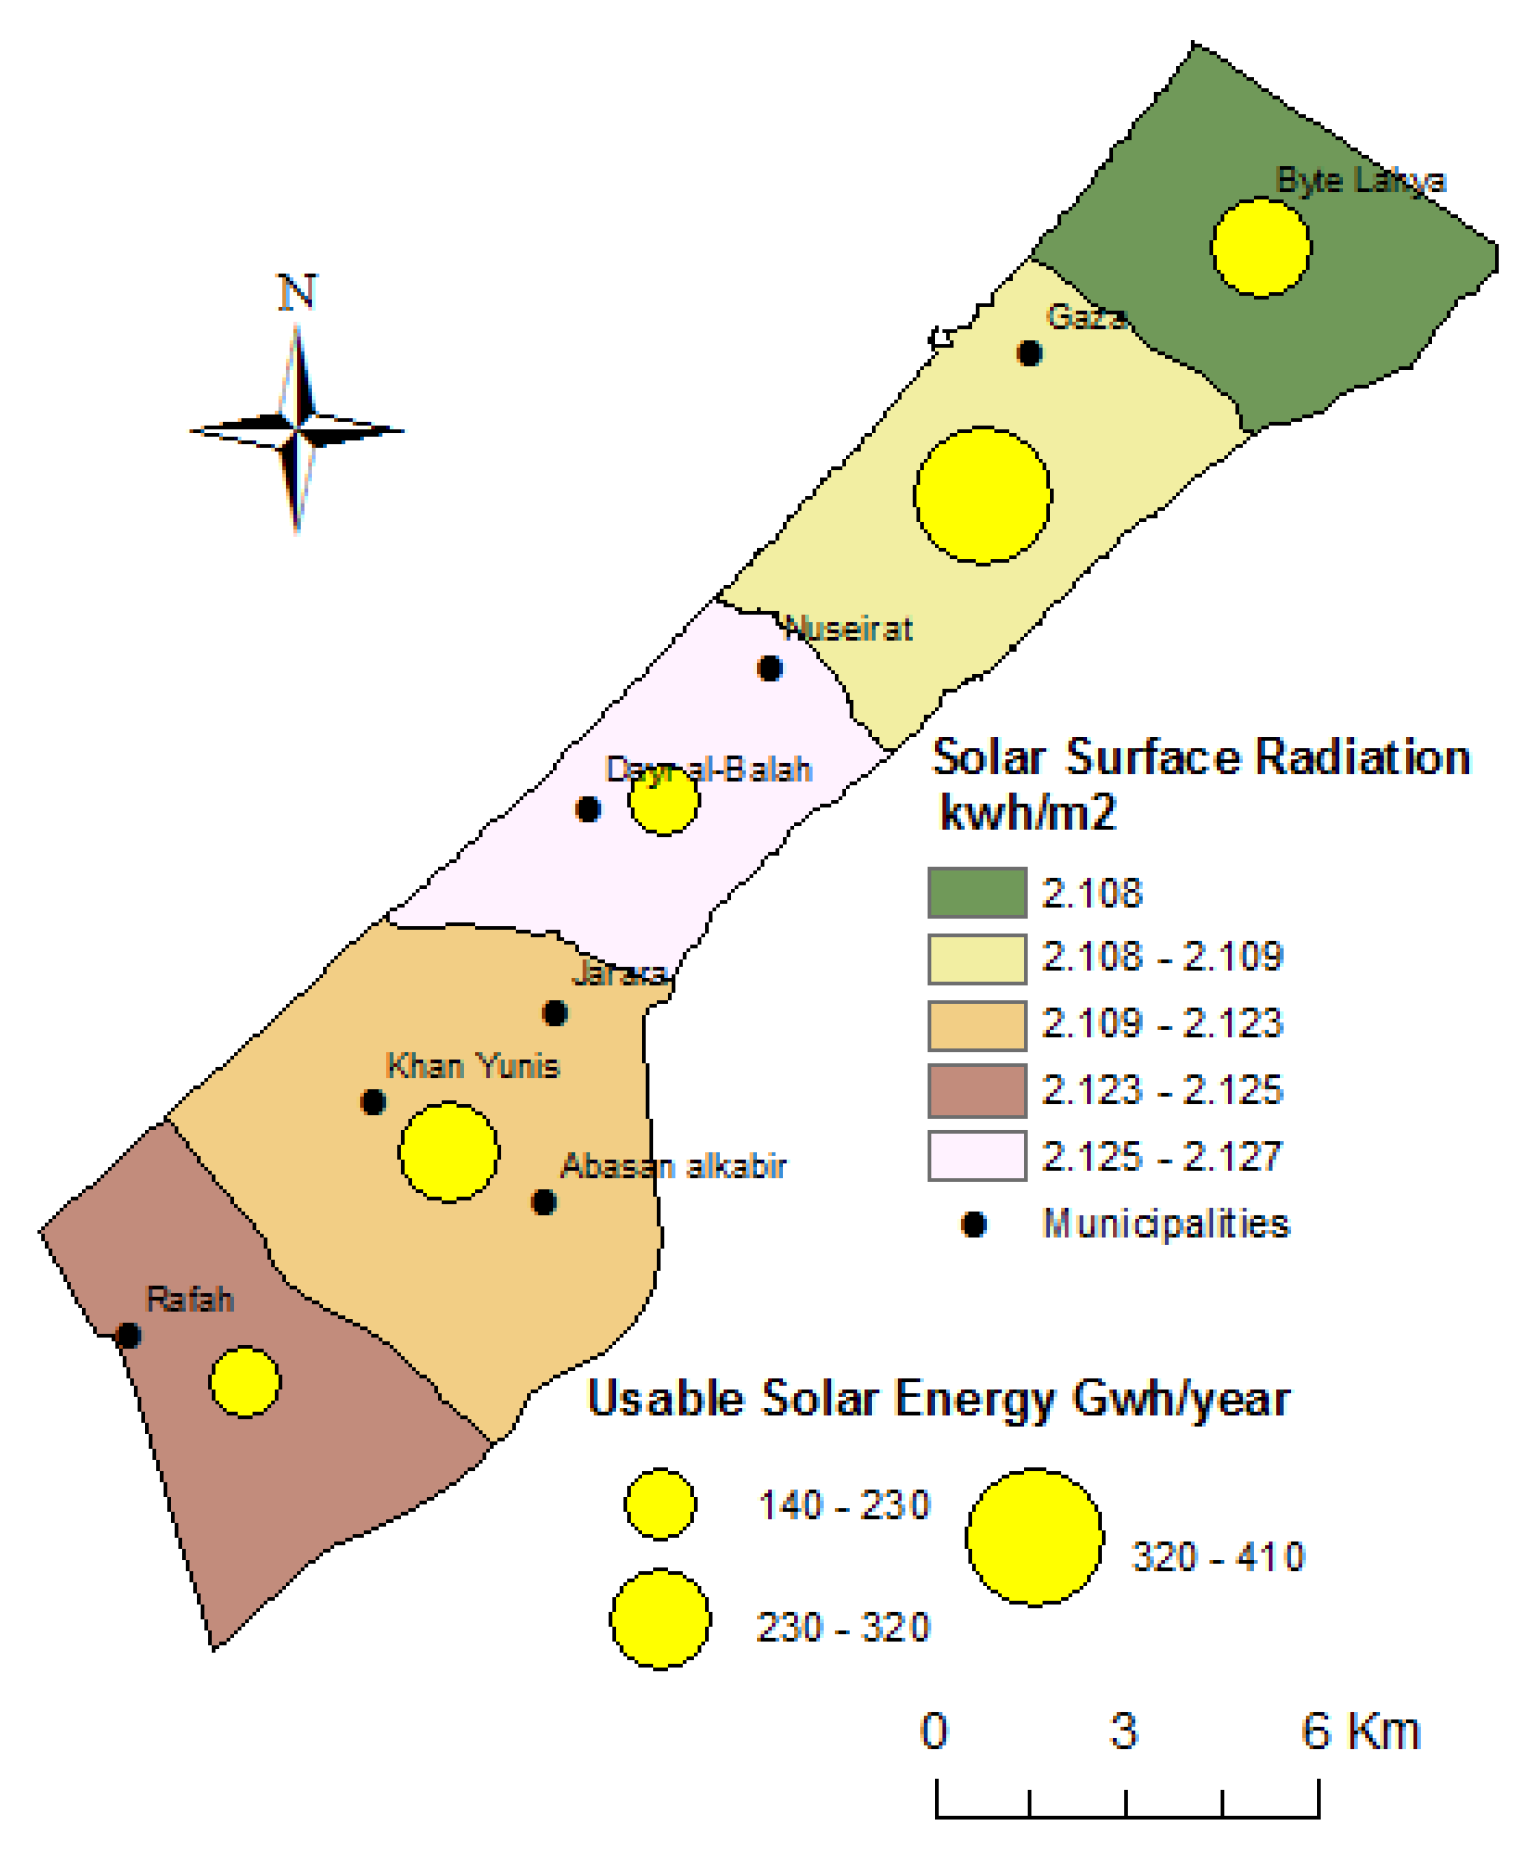
The prediction of solar energy production in all governorates is 1.195 Twh/year and the average annual global surface irradiation is 2100 kWh/m2, as seen in Table 2; the average production of solar energy is around 50% of total production of RE. Figure 9 shows the solar surface irradiation (kWh/m2) and the annual output of solar energy in yellow circles, the larger size means more energy could be generated, which reflects the high number of buildings in corresponding governorate. Clearly, in the GS Governorates, suggesting that appropriate solar energy sites would take into account the increasing population and electric demand for the installation of the PV systems in the presence of the limited area, all Governorates have approximately equal irradiance, and we presume distributed PV installation systems when calculating the solar energy harvested by the PV modules [50,51].
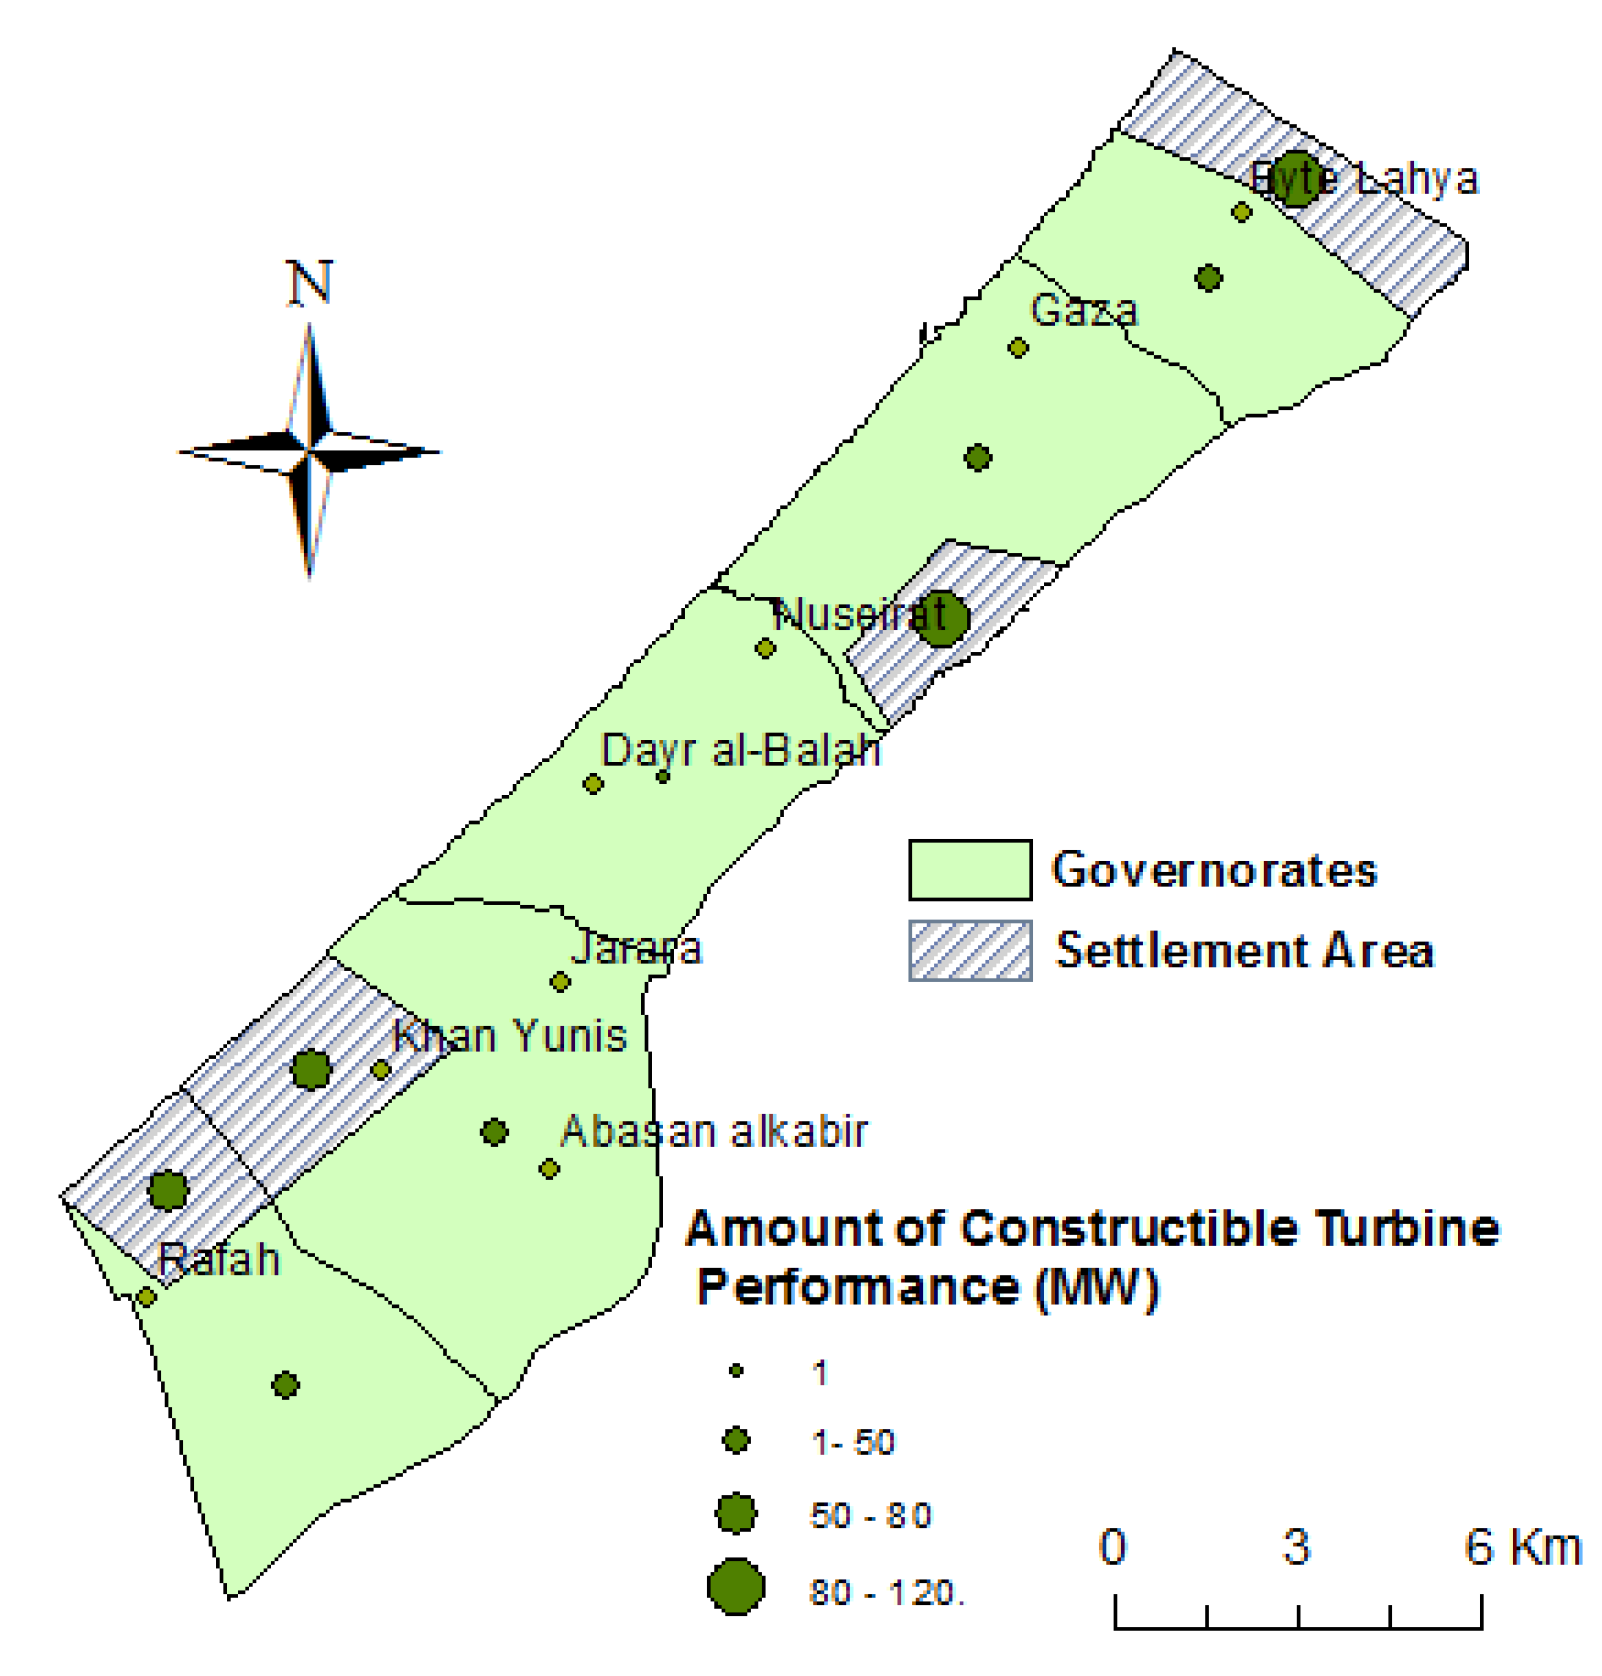
The potential for wind energy depends much on the topography of a region. As a result, considerable potential exists in the flat region. These areas are located mainly in the north-western part overlooking the Mediterranean coastal area of the GS (Figure 10). In total, 10% (3600 ha) of the GS’s area is available for wind farm installations, with the most significant potential areas being in the municipalities of North Gaza (6100 ha), Gaza (7500 ha), and Khan Younis (10,500 ha) while the other Governorates are in highly populated areas. The western coast of the GS is considered to be an area that can be exploited to set up wind farms, where the highest wind speeds have been reported in the northern areas of the coast. The average wind speed in the GS ranges from 2 to 6 m/s [52].
The average annual wave power density is determined by divided the total AAE density by the number of hours in a year. The overall AAE and power densities are depicted in Figure 11 along the coast. The largest values exceed 17.52 MWh/m along the coast. AAE densities are generally between 11.3 and 17.52 MWh/m along the coast. Two wave parameters, including wave height and wave cycle time, are very important for the estimation of wave energy in the sea. The wave period varies between 3.2 s and 3.6 s in the northern Mediterranean coastal area of the GS. In addition, the wave height varies between 0.561 m and 0.67 m in different seasons. Given the considerable wave height and the wave period, the average wave power extractable from the Mediterranean shoreline is between 1.2 kW/m and 2 kW/m. Many considerations are taken into account in the choice of a suitable location to install a conversion shoreline device at less than 10 m depth, such as the existence of breaking waves at the site, which would create very strong waves.
Based on the methods outlined in Section 2.3, the probability of producing electricity from biomass, solar, wind, and wave energy sources in the GS was estimated. Biomass is considered the main RES, adding 59.2% (1919.5 GWh/year) to overall RES energy generation Figure 12, followed by solar energy at 35.8% (1195 GWh/year) and wind and wave at 3.8% (125 GWh/year).
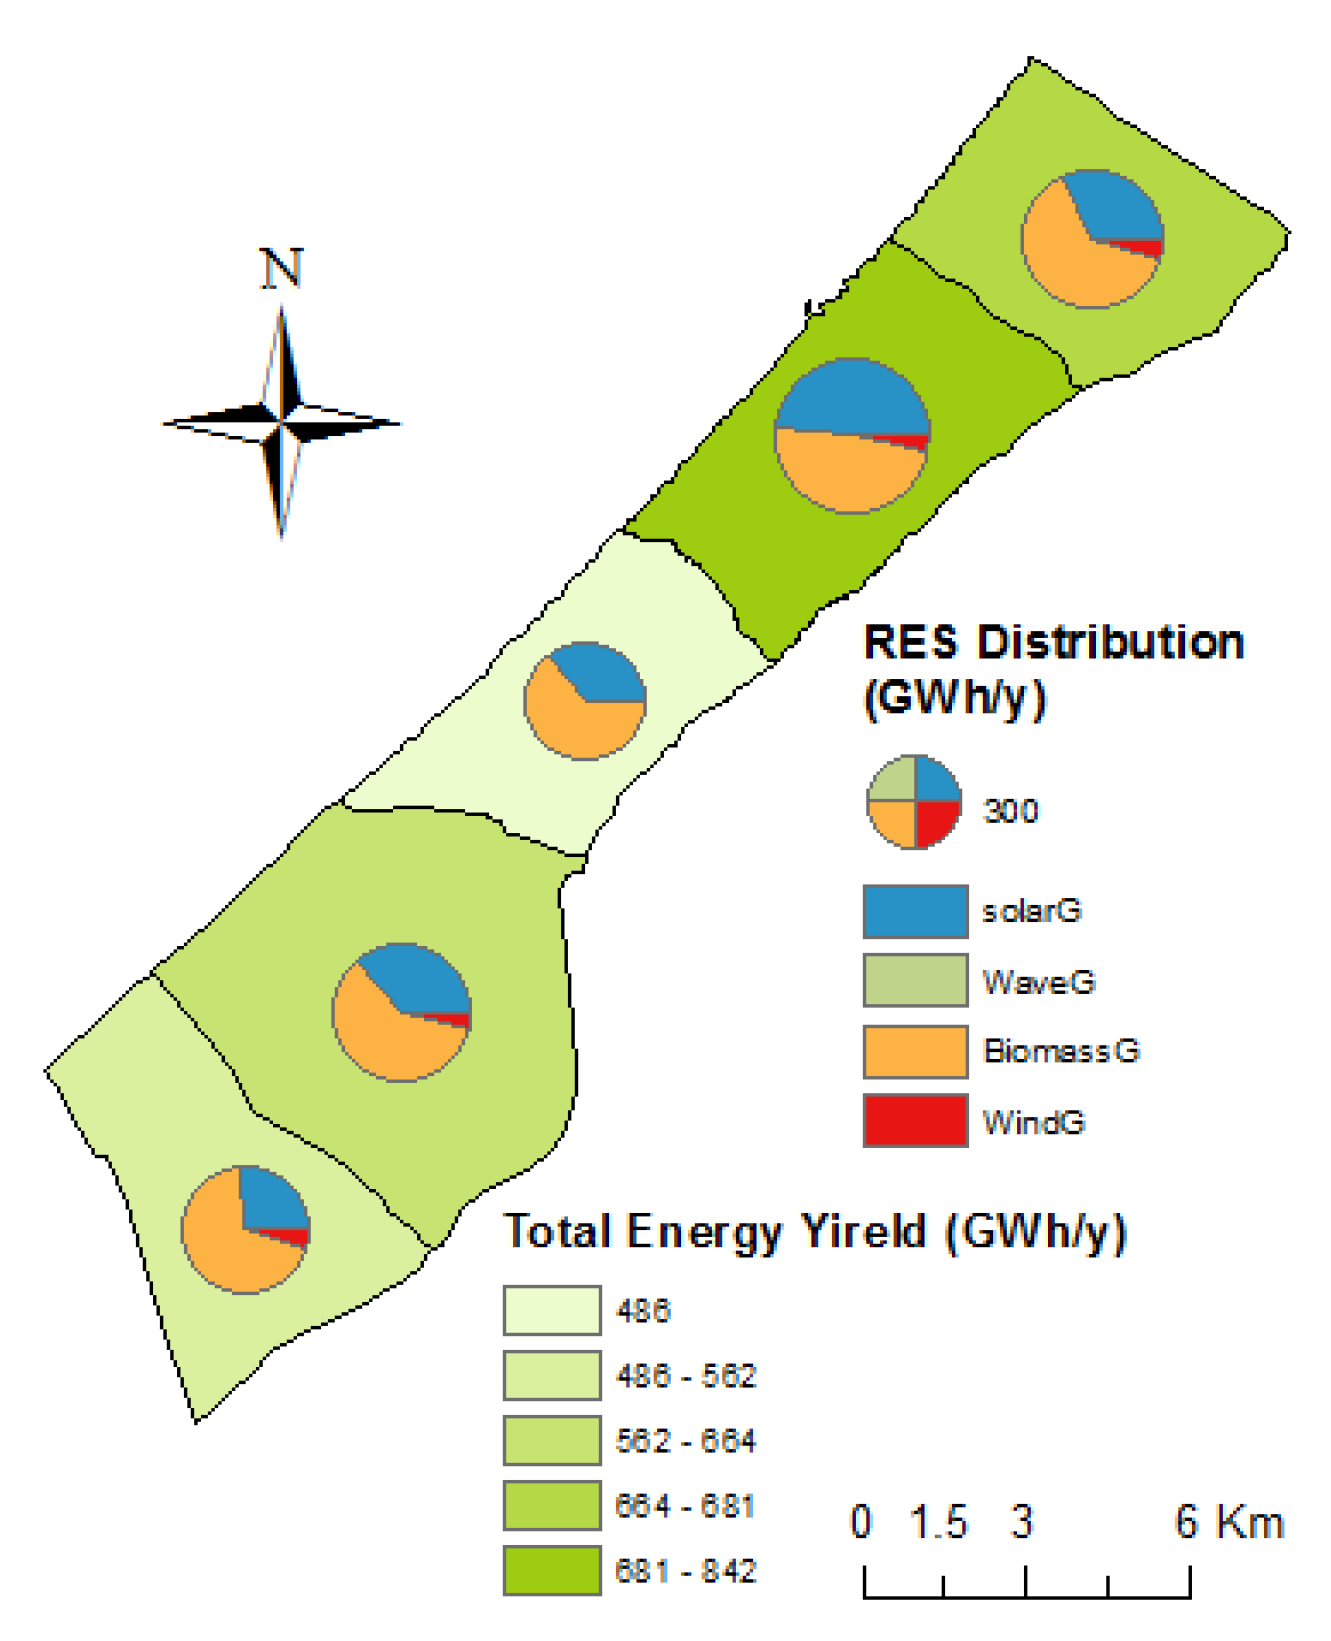
The potential and spatial distribution of various RESs is an important aspect of RES-based country development strategies. Figure 12 shows the distribution of total RESs at the local level. The figure shows biomass, solar, wind, and then wave contribution to energy output, and it is also seen that the energy yield in the Gaza Governorate is more than others, in a dark green color, and biomass and solar are the most significant contributors, when biomass exhibits a dominant renewable resource that represents aspects of society such as farming and high population. In all cases, biomass and solar represent the main energy sources, in some cases accounting for 90% of the RESs. The GS has five Governorates with roughly the same RES. The reason for this homogeneous distribution is the overall small area and the living habits.
3.2. Ratio between Energy Demand and Renewable Energy Production
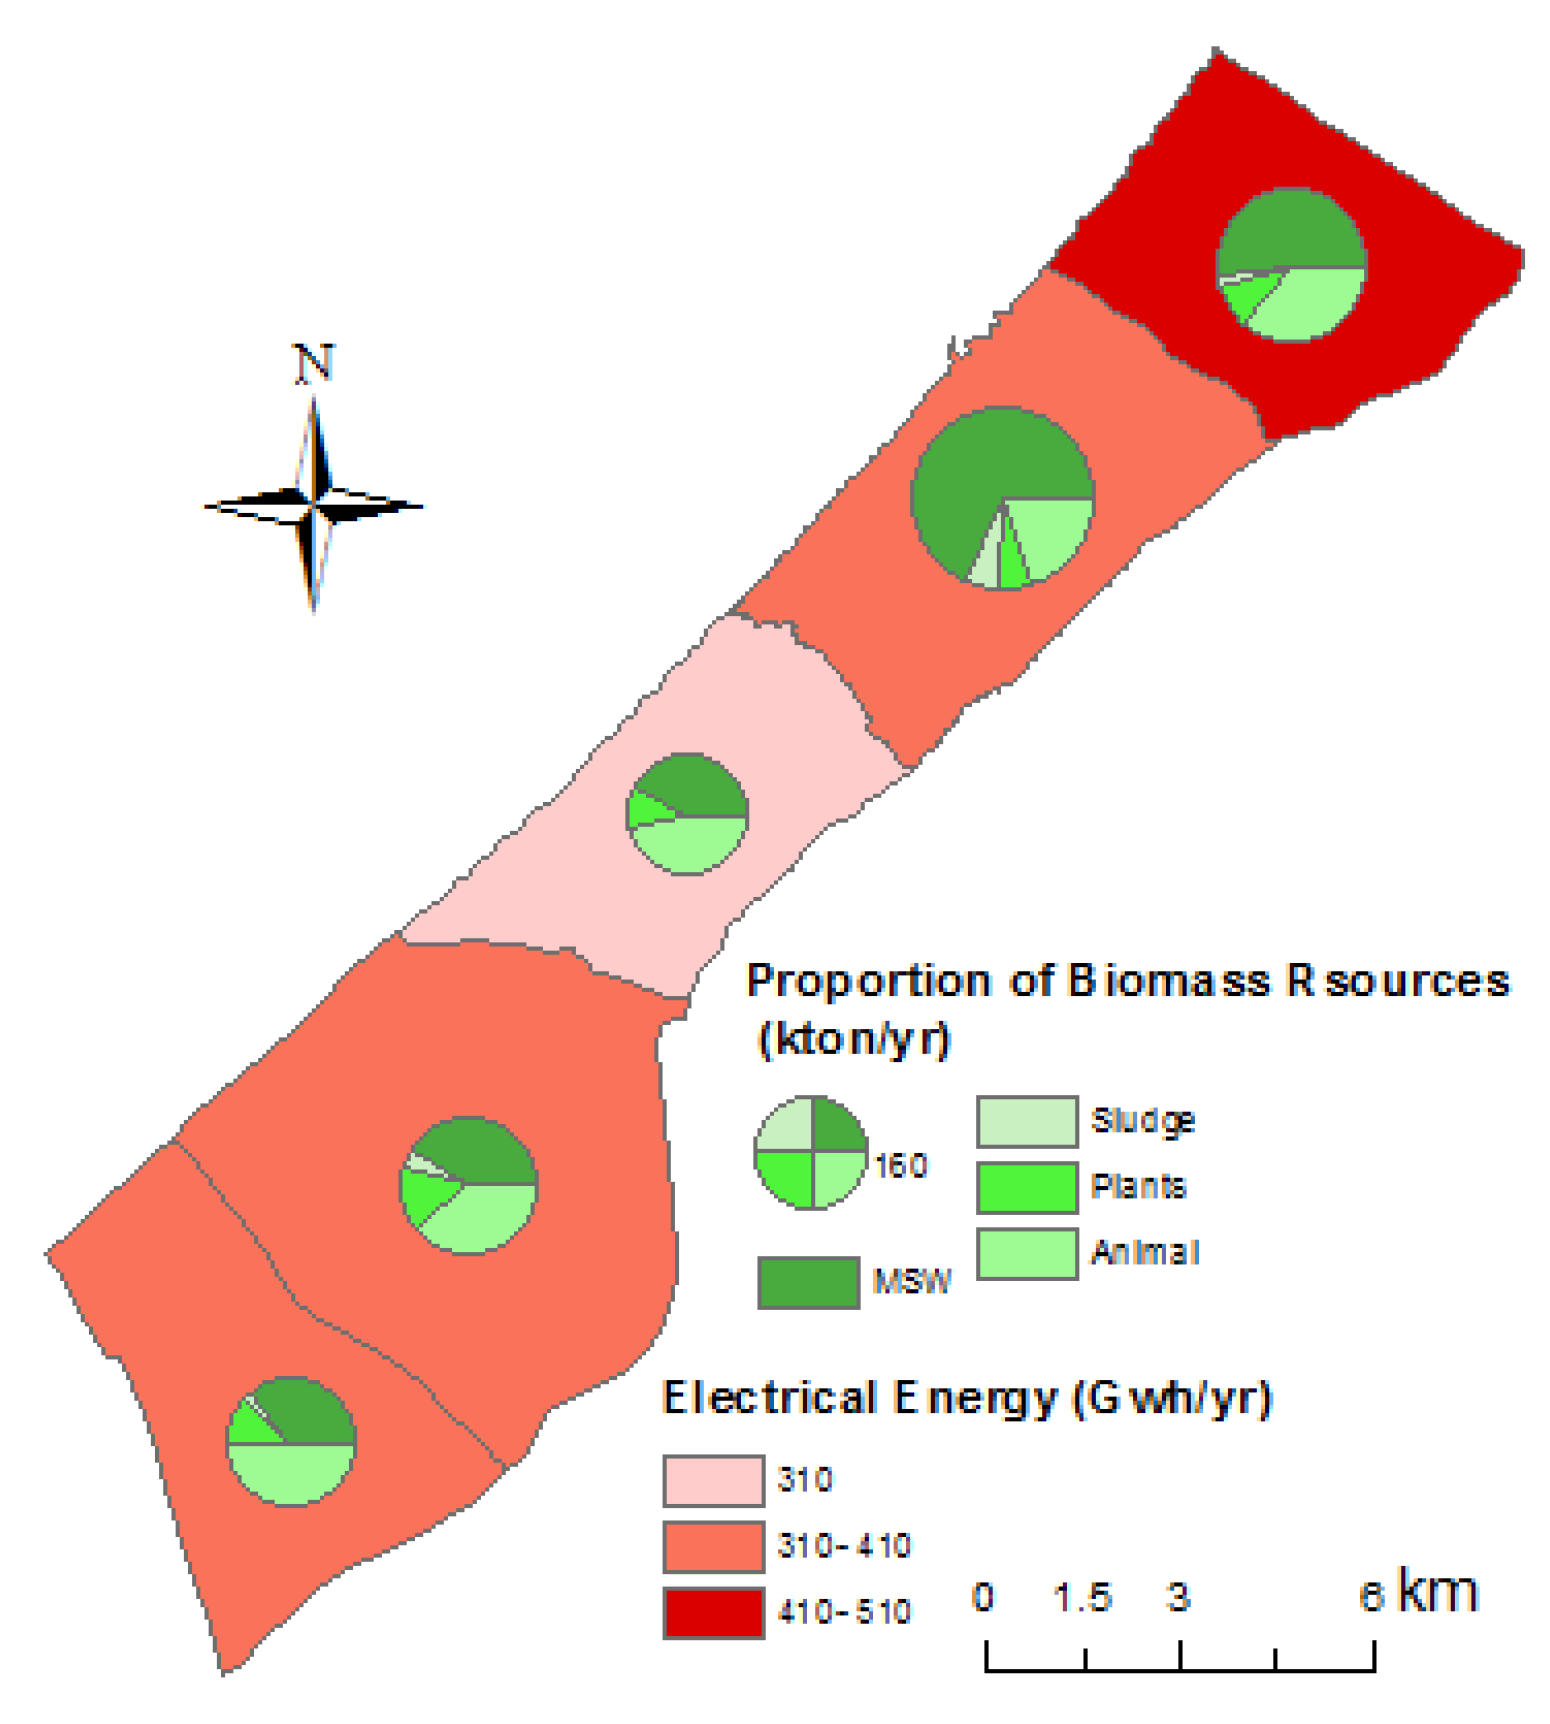
In January 2015, the percentage of households using energy in the GS, partitioned by energy type, was 99.9, 43.3, 43.8, 93.0, 3.1, 13.5, and 2.9 for electricity, wood, solar, liquefied petroleum gas (LPG), kerosene, gasoline, and diesel, respectively. Average electricity and LPG consumption of household electricity in January 2015 was 306 kWh and 22 kg, respectively, versus 275 kWh and 14 kg in January 2009. The aggregate number of households in the GS was 334,710 [53], meaning GS householders’ energy consumption was 1,064,378 MWh/year, while the estimated yield from biomass digestion is 1,919,555 MWh/year. Given the efficiency of the conversion processes, the production of electricity could be 640 GWhe/year. Figure 8 indicates the proportion of electrical energy (Gwh/year) and of biomass assets (ton/year). This means that the available electrical energy from biomass is equivalent to 60 per cent of household electrical energy consumption. Solar energy production by considering a hybrid system, covers the total average household demand with biomass. Energy policy anticipates three primary objectives: carbon stability, economic growth, and RESs profitability. As a deduction, RES solutions should be involved in the energy strategy plans of households’ electrifications to alleviate the suffering of people in the permanent long-time interruption of electricity [6]. In our case, biomass and solar is viewed as the main RES in the interest area to electrify households, as the wind energy requires wide areas, while the onshore wave energy could produce considerable energy to light sidewalks and streets to avoid power transmission losses.
4. Conclusions
The key results of this study consist of evaluating the four most effective RESs that could be implemented in the Middle East: solar, wind, wave, and biomass. The energy maps presented show their potentials as well. This study has shown that the energy potentials are 1919.5 GWh/year from biomass, 136.72 GWh/year from wind, and 1195 GWh/year from solar. Solar and biomass account for over 96% of the overall output of renewable energy (RE). Furthermore, the ability of productive wind energy is important at 3.5% of overall electricity output. Hence, the construction of wind turbines for this northern coastal region is also recommended. For these reasons, RESs are recommended for grid injection to electrify households’, buildings projects, as well as remote areas. This work enhances RE market growth in selected target communities by promoting the role of locally generated biomass, wind, sea, and solar energy as the key contributors to local energy supply. It is worth mentioning that the potential of integrated RESs in the Gaza Strip reaches 3240.4 GWh/year, which represents more than 95% of the household energy demand in the respective area. To conclude, pursuing renewable resources as a means of energy use is a way of addressing the Gaza energy crisis and offering cultural, social, or environmental benefits. As a conclusion biomass and solar energy are the most important sources of renewable energies in GS [53,54].
The methodology followed in our work and the knowledge gained from the results can be used to replicate electricity production systems and can be transferred to similar societies in other countries with similar geographical and/or political positions. Biomass acts as renewable resources that have made a significant contribution to the energy yield in the study area, suggesting the significance of future studies in choosing the correct technology between thermochemicals and biochemicals used to generate biomass biofuels [55,56]. The extremely large amounts of biomass resulting from the population and its activities demand a serious view of the concept of sustainability based on environmental, economic, and social considerations of the consequences resulting from the accumulation of these various forms of biomass resources. Our future work will be focused on the development of a hybrid system that incorporates the most contributed renewable resources to meet household demand for electricity and measure the potential of each resource to achieve a realistic and credible systemic approach.
Author Contributions
The research article Conceptualization, by all authors; methodology, software, validation, formal analysis, investigation, resources, data curation, and writing—original draft preparation, H.A.-N.; writing—review and editing, visualization, supervision, C.P., R.A.A., H.J.E.-K.; project administration and funding acquisition C.P.; All authors have read and agreed to the published version of the manuscript.
Funding
This research was funded by Austrian Development Agency and Appear scholarship, grant number ICM-2019-13718. Supported by BOKU Vienna Open Access Publishing Fund.
Acknowledgments
The financial support from the Austrian Development Agency is gratefully acknowledged: Appear project155—MakingEnergy4Palestine (Developing maker-movement-inspired training courses on renewable energy sources in the Gaza Strip) as well as Appear scholarship (Reference number ICM-2019-13718).
Conflicts of Interest
The authors declare no conflict of interest.
References
- Bergmann, A. Valuing the Attributes of Renewable Energy Investments. Smart Grid Renew. Energy 2009, 43–53. [Google Scholar] [CrossRef]
- Del Rıo, P.; Burguillo, M. Assessing the impact of renewable energy deployment on local sustainability: Towards a theoretical framework. Renew. Sustain. Energy Rev. 2008, 12, 1325–1344. [Google Scholar] [CrossRef]
- Waldenström, C.; Ferguson, R.; Sundberg, C.; Tidåker, P.; Westholm, E.; Åkerskog, A. Bioenergy from Agriculture: Challenges for the Rural Development Program in Sweden. Soc. Nat. Resour. 2016, 29, 1467–1482. [Google Scholar] [CrossRef]
- Dai, H.; Xie, X.; Xie, Y.; Liu, J.; Masui, T. Green growth: The economic impacts of large-scale renewable energy development in China. Appl. Energy 2016, 162, 435–449. [Google Scholar] [CrossRef]
- El-Khozenadar, H.; El-Batta, F. Solar Energy as an Alternative to Conventional Energy in Gaza Strip: Questionnaire Based Study. Sol. Energy Altern. Conv. Energy Gaza Strip 2018, 32, 47–74. [Google Scholar]
- Mezan. The Reality of the Electricity Crisis and Its Repercussions on the Human Rights Situation in Gaza Strip; Studies Unit-Al Mezan: Gaza, Palestine, 2016. [Google Scholar]
- Basel, T.Q. Yaseen, Renewable Energy Applications in Palestine; Palestinian Energy and Environment Research Center (PEC)-Energy Authority: Gaza, Palestine, 2013. [Google Scholar]
- Abu Hamed, T.; Ismail, L. Assessing Renewable Energy Potential in Palestine; Islamic University of Gaza, IUG: Gaza, Palestine, 2013. [Google Scholar]
- PENRA. Palestinian Energy and Natural Resources Authority-PENRA. Available online: http://www.penra.gov.ps/ (accessed on 15 October 2018).
- Abu Hamed, T.; Flamm, H.; Azraq, M. Renewable energy in the Palestinian Territories: Opportunities and challenges. Renew. Sustain. Energy Rev. 2012, 16, 1082–1088. [Google Scholar] [CrossRef]
- El-Zaza, S.Z. Development of Wave Energy Conversion Device-Gaza Shoreline. Master’s Thesis, Science in Civil Engineering, IUG, Gaza, Palestine, 2009. [Google Scholar]
- Elnaggar, M.H.; Edwan, E.; Ritter, M. Wind Energy Potential of Gaza Using Small Wind Turbines: A Feasibility Study. Energies 2017, 10, 1229. [Google Scholar] [CrossRef]
- Unal, H.; Alibas, K. Agricultural Residues as Biomass Energy. Energy Sources Part B Econ. Plan. Policy 2007, 2, 123–140. [Google Scholar] [CrossRef]
- MDLF. Assessment of Existing Waste Recovery Activities in Gaza Strip; Gaza Strip-Palestine: Gaza, Palestine, 2017. [Google Scholar]
- Alhaddad, A. Maximizing Solar Power System’s Efficiency Using Fuzzy Logic. Master’s Thesis, Science in Electrical Engineering, Islamic University of Gaza (IUG), Gaza, Palestine, 2014. [Google Scholar]
- Badawi, S. An Analytical Study for Establishment of Wind Farms in Palestine to Reach the Optimum Electrical Energy. Master’s Thesis, The Islamic University of Gaza (IUG), Gaza, Palestine, 12 January 2013. [Google Scholar]
- CRES. Centre for Renewable Energy Sources. Available online: http://www.cres.gr/kape/index_eng.htm (accessed on 2 March 2019).
- Benedek, J.; Sebestyén, T.T.; Bartók, B. Evaluation of renewable energy sources in peripheral areas and renewable energy-based rural development. Renew. Sustain. Energy Rev. 2018, 90, 516–535. [Google Scholar] [CrossRef]
- Environmental Quality Authority (EQA) ©. 1995–2018 Ecologic Institute. 2004. Available online: https://www.ecologic.eu/5962 (accessed on 3 October 2018).
- MOP. Technical Atlas of Gaza Governorates, Part One; MOP, The Ministry of Planning and International Cooperation: Gaza, Palestine, 1997. [Google Scholar]
- CMWU. Integrated Wastewater and Resource Efficiency Programme Gaza; CMWU: Gaza, Palestine, 2017. [Google Scholar]
- ESIA. Environmental and Social Impact Assessment (ESIA) for Gaza Solid Waste Management Project; EcoConServ Environmental, and Universal Group-Gaza: Gaza, Palestine, 2012. [Google Scholar]
- PCBS. Preliminary Results of the General Population, Housing and Facilities 2016; Palestinian Central Bureau of Statistics: Ramallah, Palestine, 2017. [Google Scholar]
- Campuzano, R.; González-Martínez, S. Characteristics of the organic fraction of municipal solid waste and methane production: A review. Waste Manag. 2016, 54, 3–12. [Google Scholar] [CrossRef]
- Feasibility Study. Feasibility Study and Detailed Design for Solid Waste Management in the Gaza Strip; File: BA4772-100-100, Version: 03, Classifications: Public. UNDP-PAPP, DHV ENFRA TECC, January 2012, Final; UNDP-PAPP: Gaza, Palestine, 2012. [Google Scholar]
- PVGIS. Institute for Energy and Transport: Photovoltaic Geographical Information System. Available online: http://re.jrc.ec.europa.eu/pvgis (accessed on 30 March 2019).
- Choi, Y.; Suh, J.; Kim, S.-M. GIS-Based Solar Radiation Mapping, Site Evaluation, and Potential Assessment: A Review. Appl. Sci. 2019, 9, 1960. [Google Scholar] [CrossRef] [Green Version]
- MTC. Characteristics of Gaza Sea, 2001–2006. Available online: http://www.mot.ps/ar/page/views/show/services (accessed on 4 February 2019).
- Kitani. Biomass Handbook; Gordon and Breach Science Publishers: New York, NY, USA, 1989. [Google Scholar]
- Adams, P.; Bridgwater, T.; Lea-Langton, A.; Ross, A.; Watson, I. Chapter 8—Biomass Conversion Technologies; Elsevier Inc.: Amsterdam, The Netherlands, 2018; pp. 107–139. [Google Scholar]
- AlNajjar, H.; Al Afif, R.; Pfeifer, C. Evaluation of bioenergy sources in the Gaza Strip. In Proceedings of the ICETI 2018, 2nd International Conference on Environmental Technology and Innovations, Prague, Czech Republic, 21–22 November 2018. [Google Scholar]
- PWA. Feasibility Study for Wastewater Reuse at Southern Part of Gaza Strip (Kahnyounis and Rafah); Palestinian Water Authority: Gaza, Palestine, 2016. [Google Scholar]
- MoA. Available online: http://www.moa.gov.ps/ (accessed on 15 December 2018).
- Babaei, A.; Shayegan, J. Anaerobic Digestion of Vegetable Waste. Chem. Eng. Trans. 2011, 24, 1291–1296. [Google Scholar]
- Amon, T.; Amon, B.; Kryvoruchko, V.; Machmüller, A.; Hopfner-Sixt, K.; Bodiroza, V.; Hrbek, R.; Friedel, J.; Pötsch, E.; Wagentristl, H.; et al. Methane production through anaerobic digestion of various energy crops grown in sustainable crop rotations. Bioresour. Technol. 2007, 98, 3204–3212. [Google Scholar] [CrossRef] [PubMed]
- Wang, M.; Li, W.; Liu, S.; Liu, D.; Yin, L.; Yuan, H. Biogas production from Chinese herb-extraction residues: Influence of biomass composition on methane yield. BioResources 2013, 8, 3732–3740. [Google Scholar] [CrossRef]
- Díaz-Vázquez, D.; Alvarado-Cummings, S.C.; Meza-Rodríguez, D.; Senés-Guerrero, C.; de Anda, J.; Gradilla-Hernández, M.S. Evaluation of Biogas Potential from Livestock Manures and Multicriteria Site Selection for Centralized Anaerobic Digester Systems: The Case of Jalisco, México. Sustainability 2020, 12, 3527. [Google Scholar] [CrossRef]
- Tar, K.; Kircsi, A.; Bartok, B.; Szegedi, S.; István, L.; Vass, R.; Bai, A.; Toth, T. Estimation of solar and wind energy potential in the Hernad Valley. Q. J. Hung. Meteorol. Serv. 2015, 119, 537–555. [Google Scholar]
- Windsim. Available online: http://www.windsim.com/download.aspx (accessed on 15 December 2018).
- Europe’s Onshore and Offshore Wind Energy Potential; EEA Technical Report; EEA: Copenhagen, Denmark, 2009.
- Staffell, I.; Pfenninger, S. Using bias-corrected reanalysis to simulate current and future wind power output. Energy 2016, 114, 1224–1239. [Google Scholar] [CrossRef] [Green Version]
- Power, T.W. The Wind Power, Wind Energy Market Intelegance. Available online: https://www.thewindpower.net/turbine_en_349_vestas_v34-400.php (accessed on 24 August 2020).
- Zodiatis, G.; Galanis, G.; Nikolaidis, A.; Kalogeri, C.; Hayes, D.; Georgiou, G.C.; Chu, P.C.; Kallos, G.; Hayes, D. Wave energy potential in the Eastern Mediterranean Levantine Basin. An integrated 10-year study. Renew. Energy 2014, 69, 311–323. [Google Scholar] [CrossRef]
- Advancing Global NWP through International Collaboration. Available online: https://www.ecmwf.int/ (accessed on 30 December 2018).
- Janssen, P. Chapter 3 ECMWF wave modeling and satellite altimeter wave data. Sea Level Chang. 2000, 63, 35–56. [Google Scholar]
- Rodrigues, L. Wave power conversion systems for electrical energy production. Renew. Energy Power Qual. J. 2008, 1, 601–607. [Google Scholar] [CrossRef] [Green Version]
- Alamian, R.; Shafaghat, R.; Miri, S.J.; Yazdanshenas, N.; Shakeri, M. Evaluation of technologies for harvesting wave energy in Caspian Sea. Renew. Sustain. Energy Rev. 2014, 32, 468–476. [Google Scholar] [CrossRef]
- Neary, V.S.; Coe, R.G.; Cruz, J.; Haas, K.; Bacelli, G.; Debruyne, Y.; Ahn, S.; Nevarez, V. Classification systems for wave energy resources and WEC technologies. Int. Mar. Energy J. 2018, 1, 71–79. [Google Scholar] [CrossRef] [Green Version]
- Kim, J.K.; Oh, B.R.; Chun, Y.N.; Kim, S.W. Effects of temperature and hydraulic retention time on anaerobic digestion of food waste. J. Biosci. Bioeng. 2006, 102, 328–332. [Google Scholar] [CrossRef] [PubMed]
- Sampaio, P.G.V.; González, M.O.A. Photovoltaic solar energy: Conceptual framework. Renew. Sustain. Energy Rev. 2017, 74, 590–601. [Google Scholar] [CrossRef]
- Toledo, C.; Gracia-Amillo, A.M.; Bardizza, G.; Abad, J.; Urbina, A. Evaluation of Solar Radiation Transposition Models for Passive Energy Management and Building Integrated Photovoltaics. Energies 2020, 13, 702. [Google Scholar] [CrossRef] [Green Version]
- Ouda, M. Prospects of Renewable Energy in Gaza Strip; Conference: NET2001, China; Energy Research and Development Center: Gaza, Palestine, 2001; pp. 1–6. [Google Scholar]
- Peter, J. The Interaction of Ocean. Waves and Wind; University Press: Cambridge, UK, 2004. [Google Scholar]
- United Nations. Electricity Shortages in the Gaza Strip: Situation Report; Office for the Coordination of Humanitarian Affairs: New York, NY, USA, 2003. [Google Scholar]
- Dampier, E.E.; Lemelin, R.H.; Shahi, C.; Luckai, N. Small town identity and history’s contribution to a response in policy change: A case study of transition from coal to biomass energy conversion. Energy Sustain. Soc. 2014, 4, 26. [Google Scholar] [CrossRef]
- Ruiz, J.; Juárez, M.; Morales, M.; Muñoz, P.; Mendívil, M. Biomass gasification for electricity generation: Review of current technology barriers. Renew. Sustain. Energy Rev. 2013, 18, 174–183. [Google Scholar] [CrossRef]
Figure 1.
Architecture of renewable energy resources (RESs) estimation.

Figure 2.
Cities and municipalities in the study area (GS).

Figure 3.
Integrated energy (MJ/year) from available sources of biomass in GS.

Figure 4.
Animal manure produced in each Governorate.

Figure 5.
Agricultural plant waste produced in each Governorate.

Figure 6.
Solid municipal waste and wastewater sludge generated in each governorate.

Figure 7.
Integrated biomass potential (TJ/year) and the proportions of the three forms of biomass included in the study.
Figure 7.
Integrated biomass potential (TJ/year) and the proportions of the three forms of biomass included in the study.

Figure 8.
The electrical energy (GWh/year) generated in the GS from methane and the biomass forms proportions.
Figure 8.
The electrical energy (GWh/year) generated in the GS from methane and the biomass forms proportions.

Figure 9.
Solar surface radiation (kWh/m2) and annual solar energy production (circles) for each governorate.
Figure 9.
Solar surface radiation (kWh/m2) and annual solar energy production (circles) for each governorate.

Figure 10.
Area available for wind parks (ha) at the municipality and turbine performance (MW) corresponding to each area.
Figure 10.
Area available for wind parks (ha) at the municipality and turbine performance (MW) corresponding to each area.

Figure 11.
Distribution of total annual wave power density (kWh/m).

Figure 12.
Spatial distribution of the total energy yield (GWh/year) from RESs in the GS and the proportion of biomass, solar, wave, and wind energy.
Figure 12.
Spatial distribution of the total energy yield (GWh/year) from RESs in the GS and the proportion of biomass, solar, wave, and wind energy.


Table 1.
Biomass resources amounts, potential, energy yield sharing from anaerobic digestion.
| Biomass | Unit | MSW | Sewage Sludge | Plants | Animals |
|---|---|---|---|---|---|
| Amount | kton/year | 676.71 | 49.5 | 132.1738 | 464.49 |
| Methane | MCH4/year | 26.47966 | 0.88011 | 27.72433 | 136.87 |
| Energy yield | MWh/year | 264,796.6 | 8801.1 | 277,243.3 | 1,368,714 |
| TJ/year | 953.25 | 31.7 | 998.1 | 4927.4 | |
| Factor | % | 13.8 | 0.45 | 14.4 | 71.3 |
Table 2.
Global insolation and solar energy potential in GSs’ municipalities.
| Municipality | Global Irradiation (kWh/m2/year) | Potential Power of Municipalities (GWh/year) |
|---|---|---|
| Northern Gaza | 2108.4 | 218.2 |
| Gaza | 2109.4 | 407.9 |
| Deir al-Balah | 2127.7 | 175.3 |
| Khan Younis | 2123.8 | 244.2 |
| Rafah | 2125.5 | 149.5 |
| Total | Avg.: 2100 | 1195.1 |
© 2020 by the authors. Licensee MDPI, Basel, Switzerland. This article is an open access article distributed under the terms and conditions of the Creative Commons Attribution (CC BY) license (http://creativecommons.org/licenses/by/4.0/).
Share and Cite
MDPI and ACS Style
Al-Najjar, H.; Pfeifer, C.; Al Afif, R.; J. El-Khozondar, H. Estimated View of Renewable Resources as a Sustainable Electrical Energy Source, Case Study. Designs 2020, 4, 32. https://0-doi-org.brum.beds.ac.uk/10.3390/designs4030032
AMA Style
Al-Najjar H, Pfeifer C, Al Afif R, J. El-Khozondar H. Estimated View of Renewable Resources as a Sustainable Electrical Energy Source, Case Study. Designs. 2020; 4(3):32. https://0-doi-org.brum.beds.ac.uk/10.3390/designs4030032
Chicago/Turabian StyleAl-Najjar, Heyam, Christoph Pfeifer, Rafat Al Afif, and Hala J. El-Khozondar. 2020. "Estimated View of Renewable Resources as a Sustainable Electrical Energy Source, Case Study" Designs 4, no. 3: 32. https://0-doi-org.brum.beds.ac.uk/10.3390/designs4030032