Modeling of a Plasma-Based Waste Gasification System for Solid Waste Generated Onboard of Typical Cruiser Vessels Used as a Feedstock


Abstract
:1. Introduction and Motivation
2. Theoretical Background
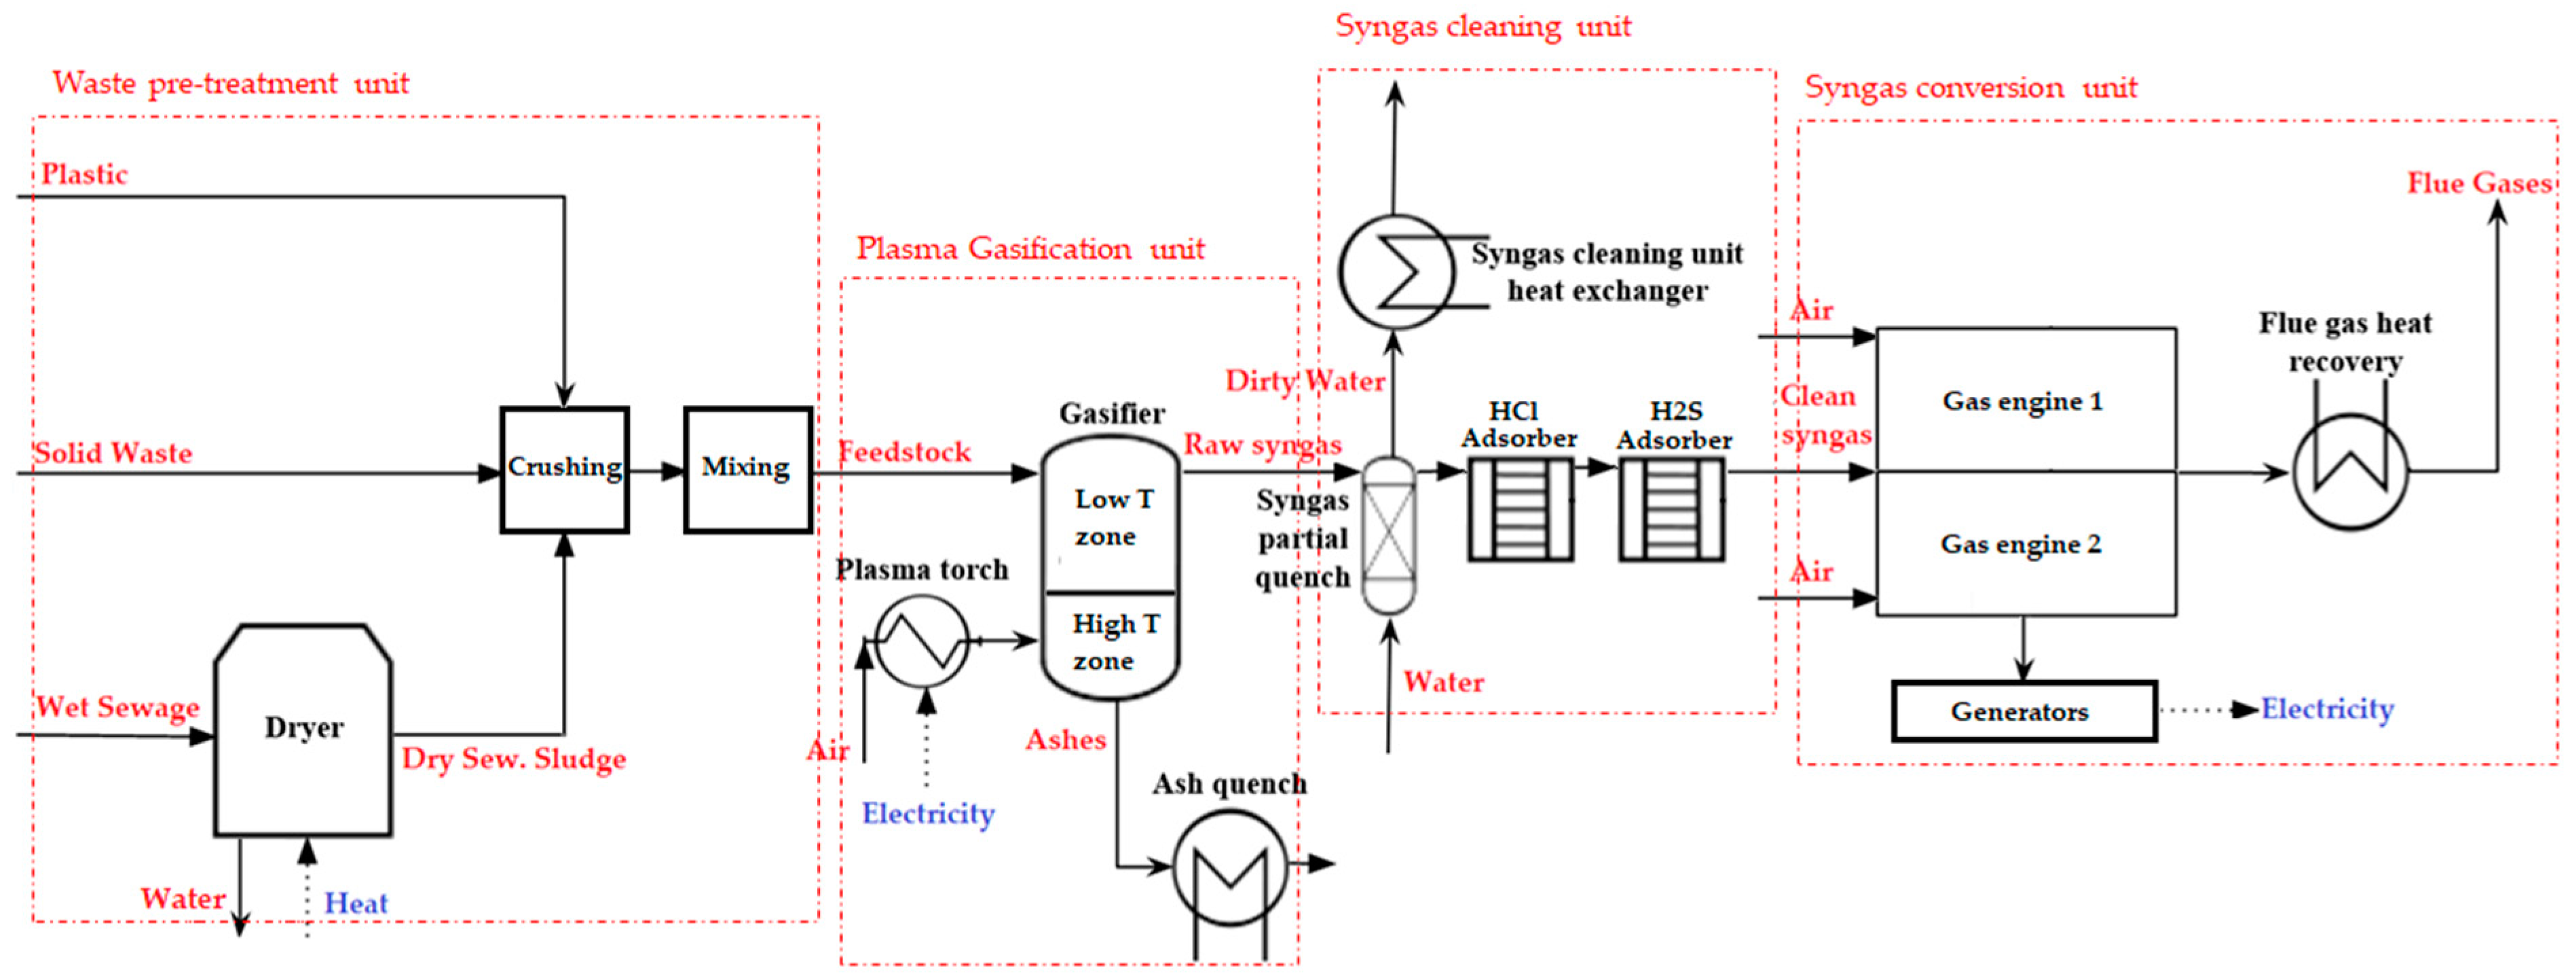
3. Description of the Process
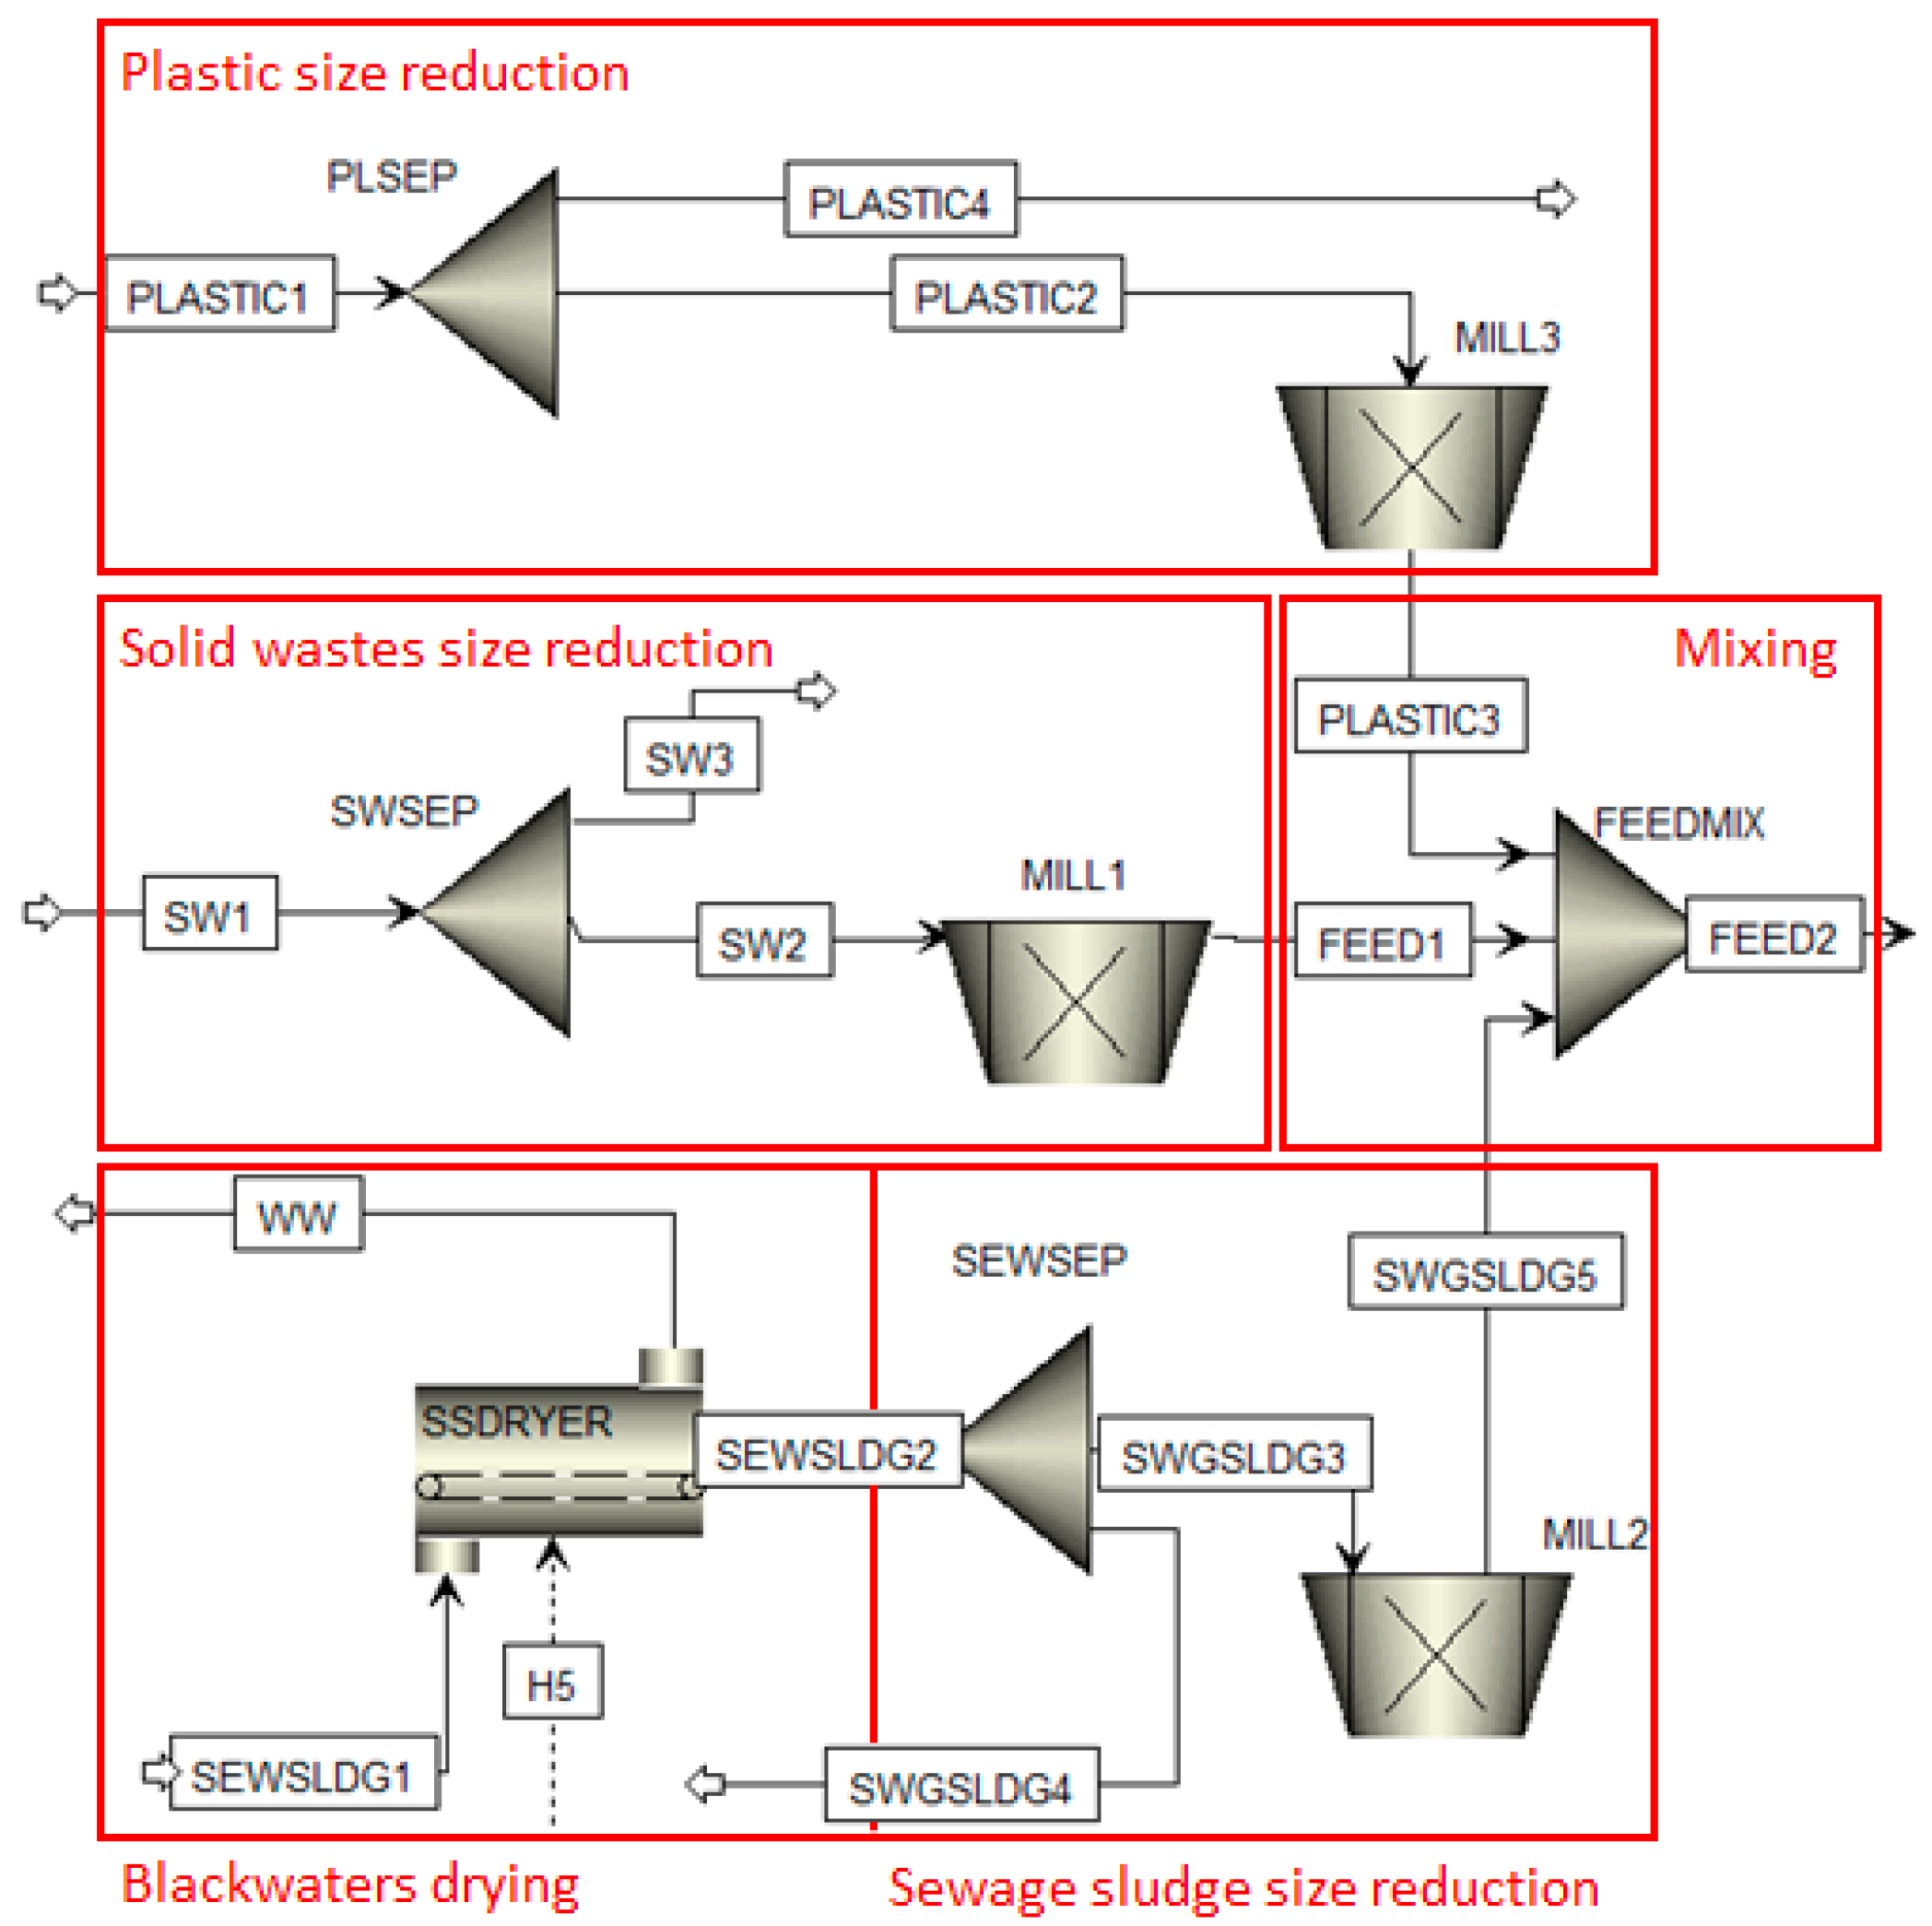
- Waste pre-treatment unit
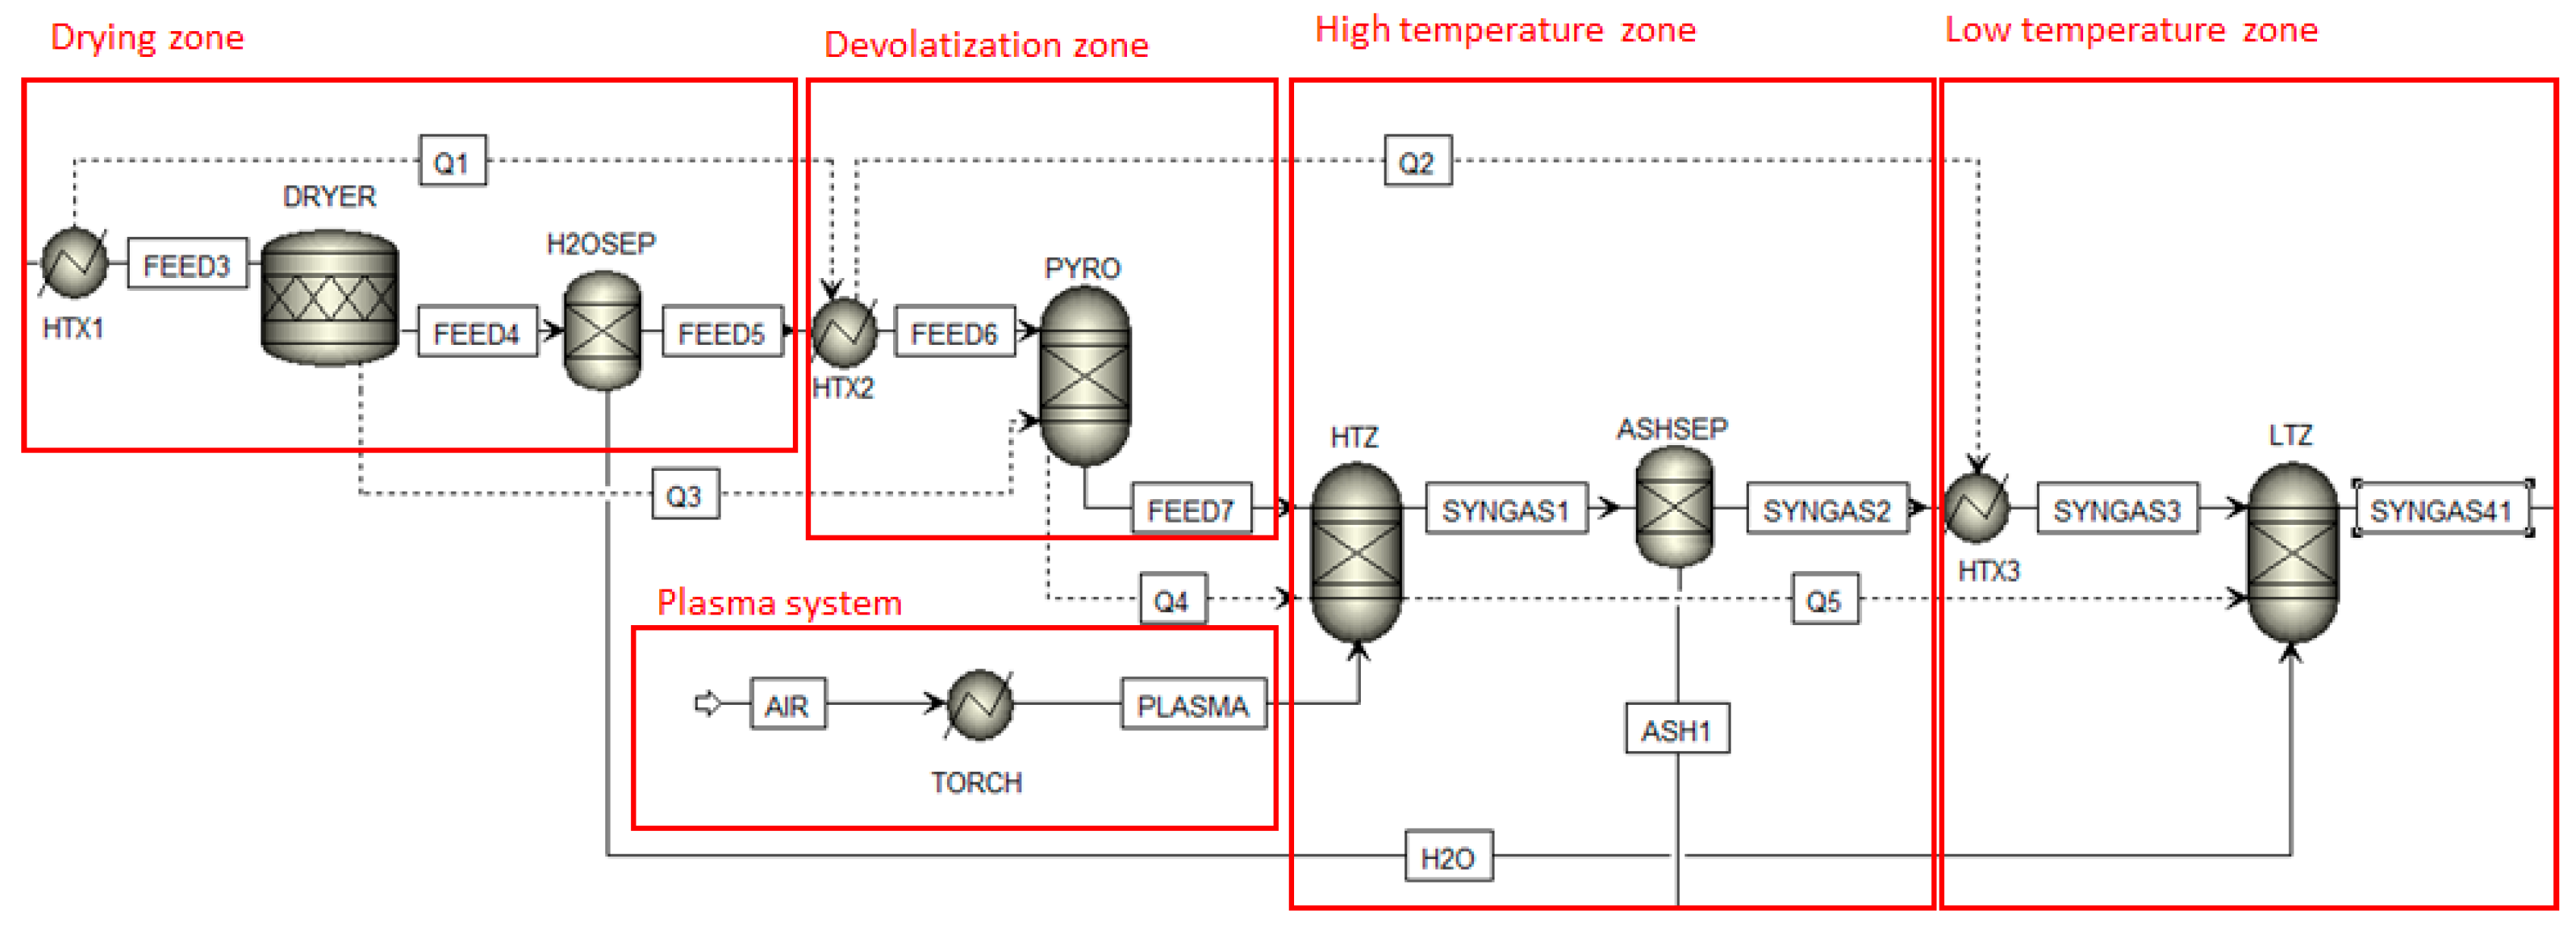
- Plasma gasification unit
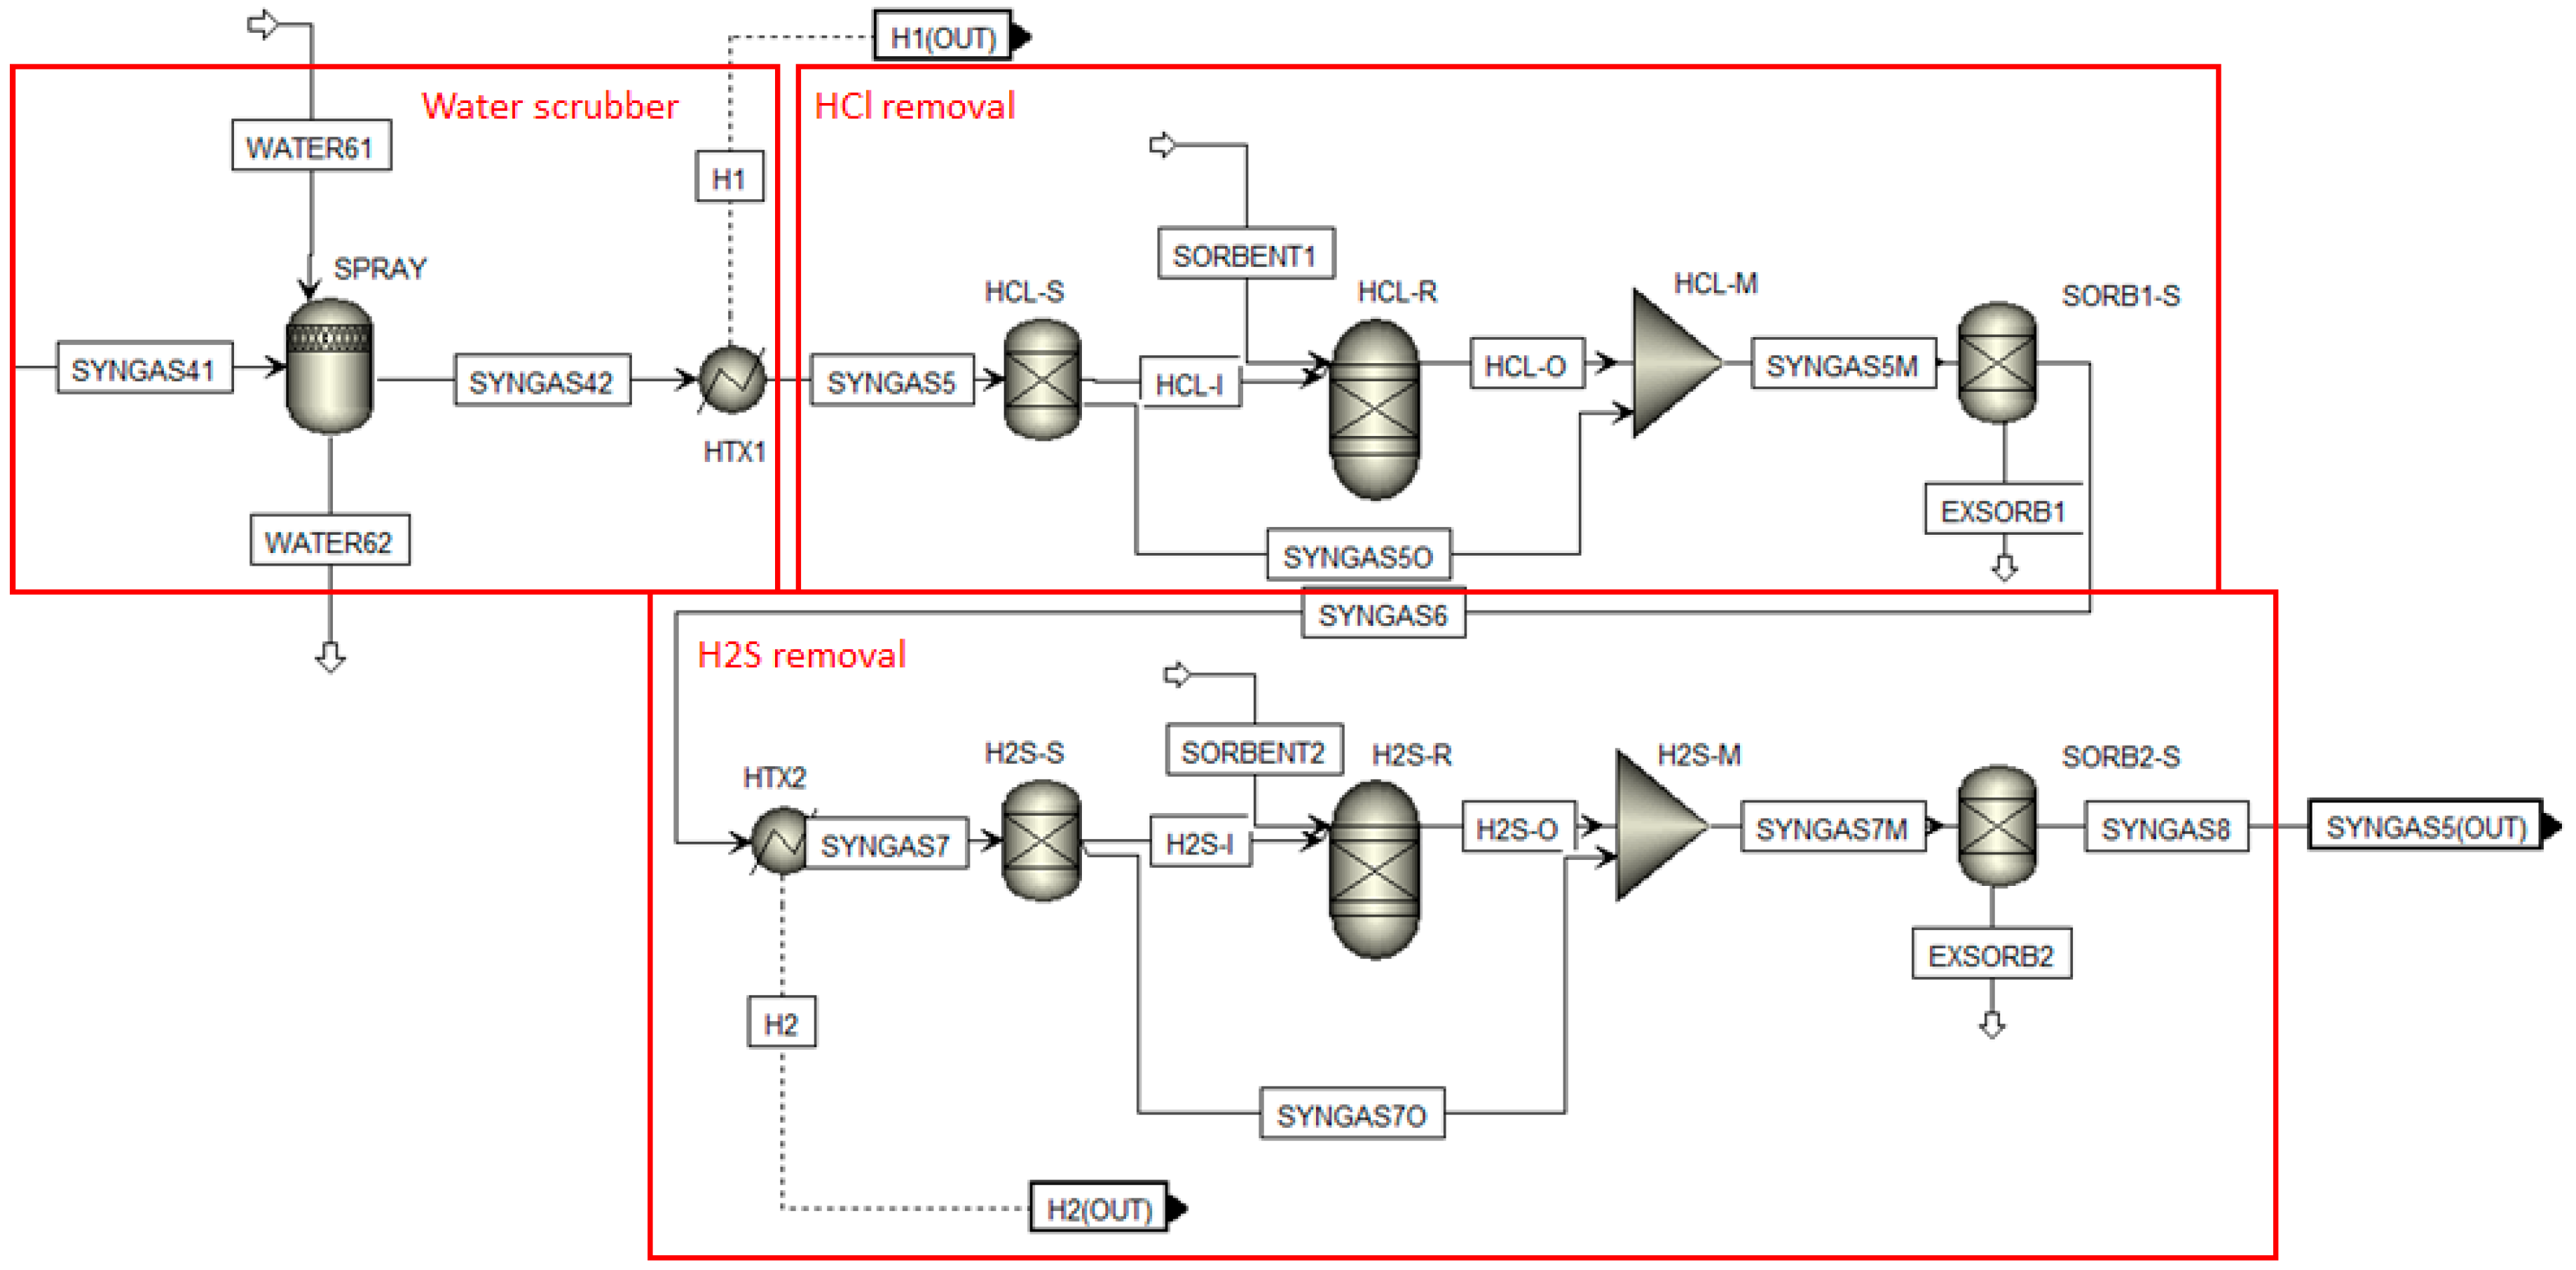
- Syngas cleaning unit
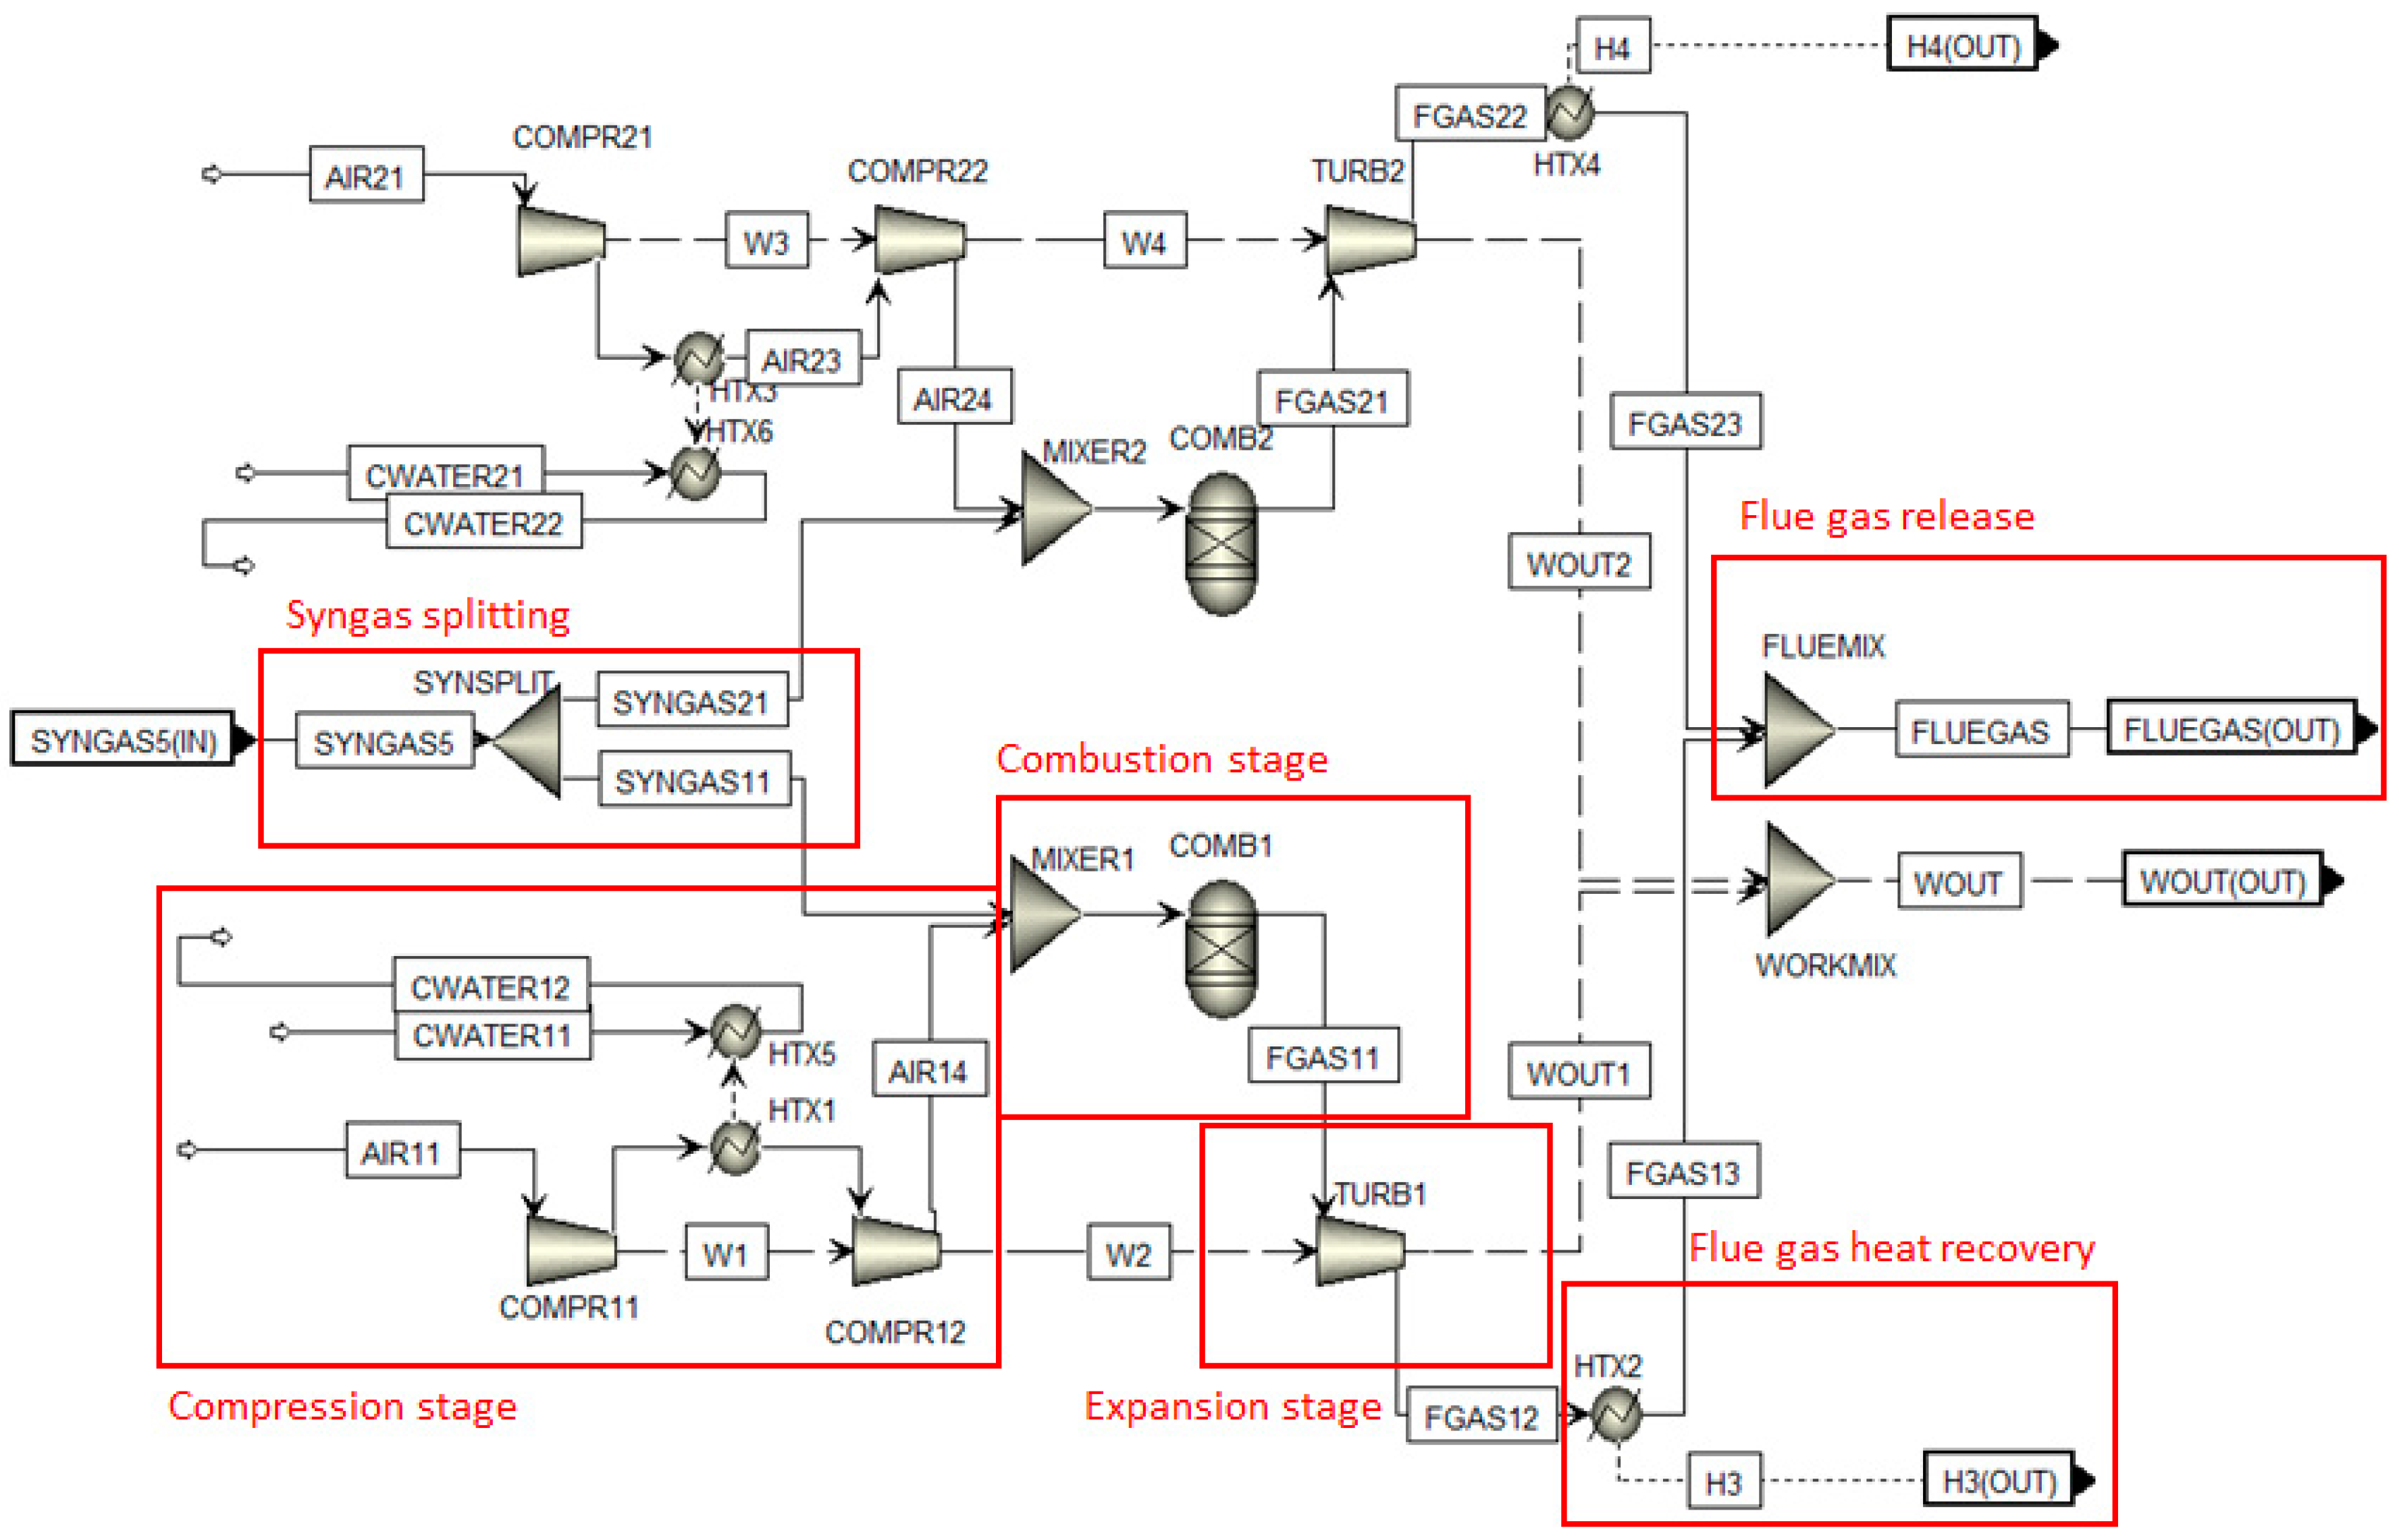
- Power production unit
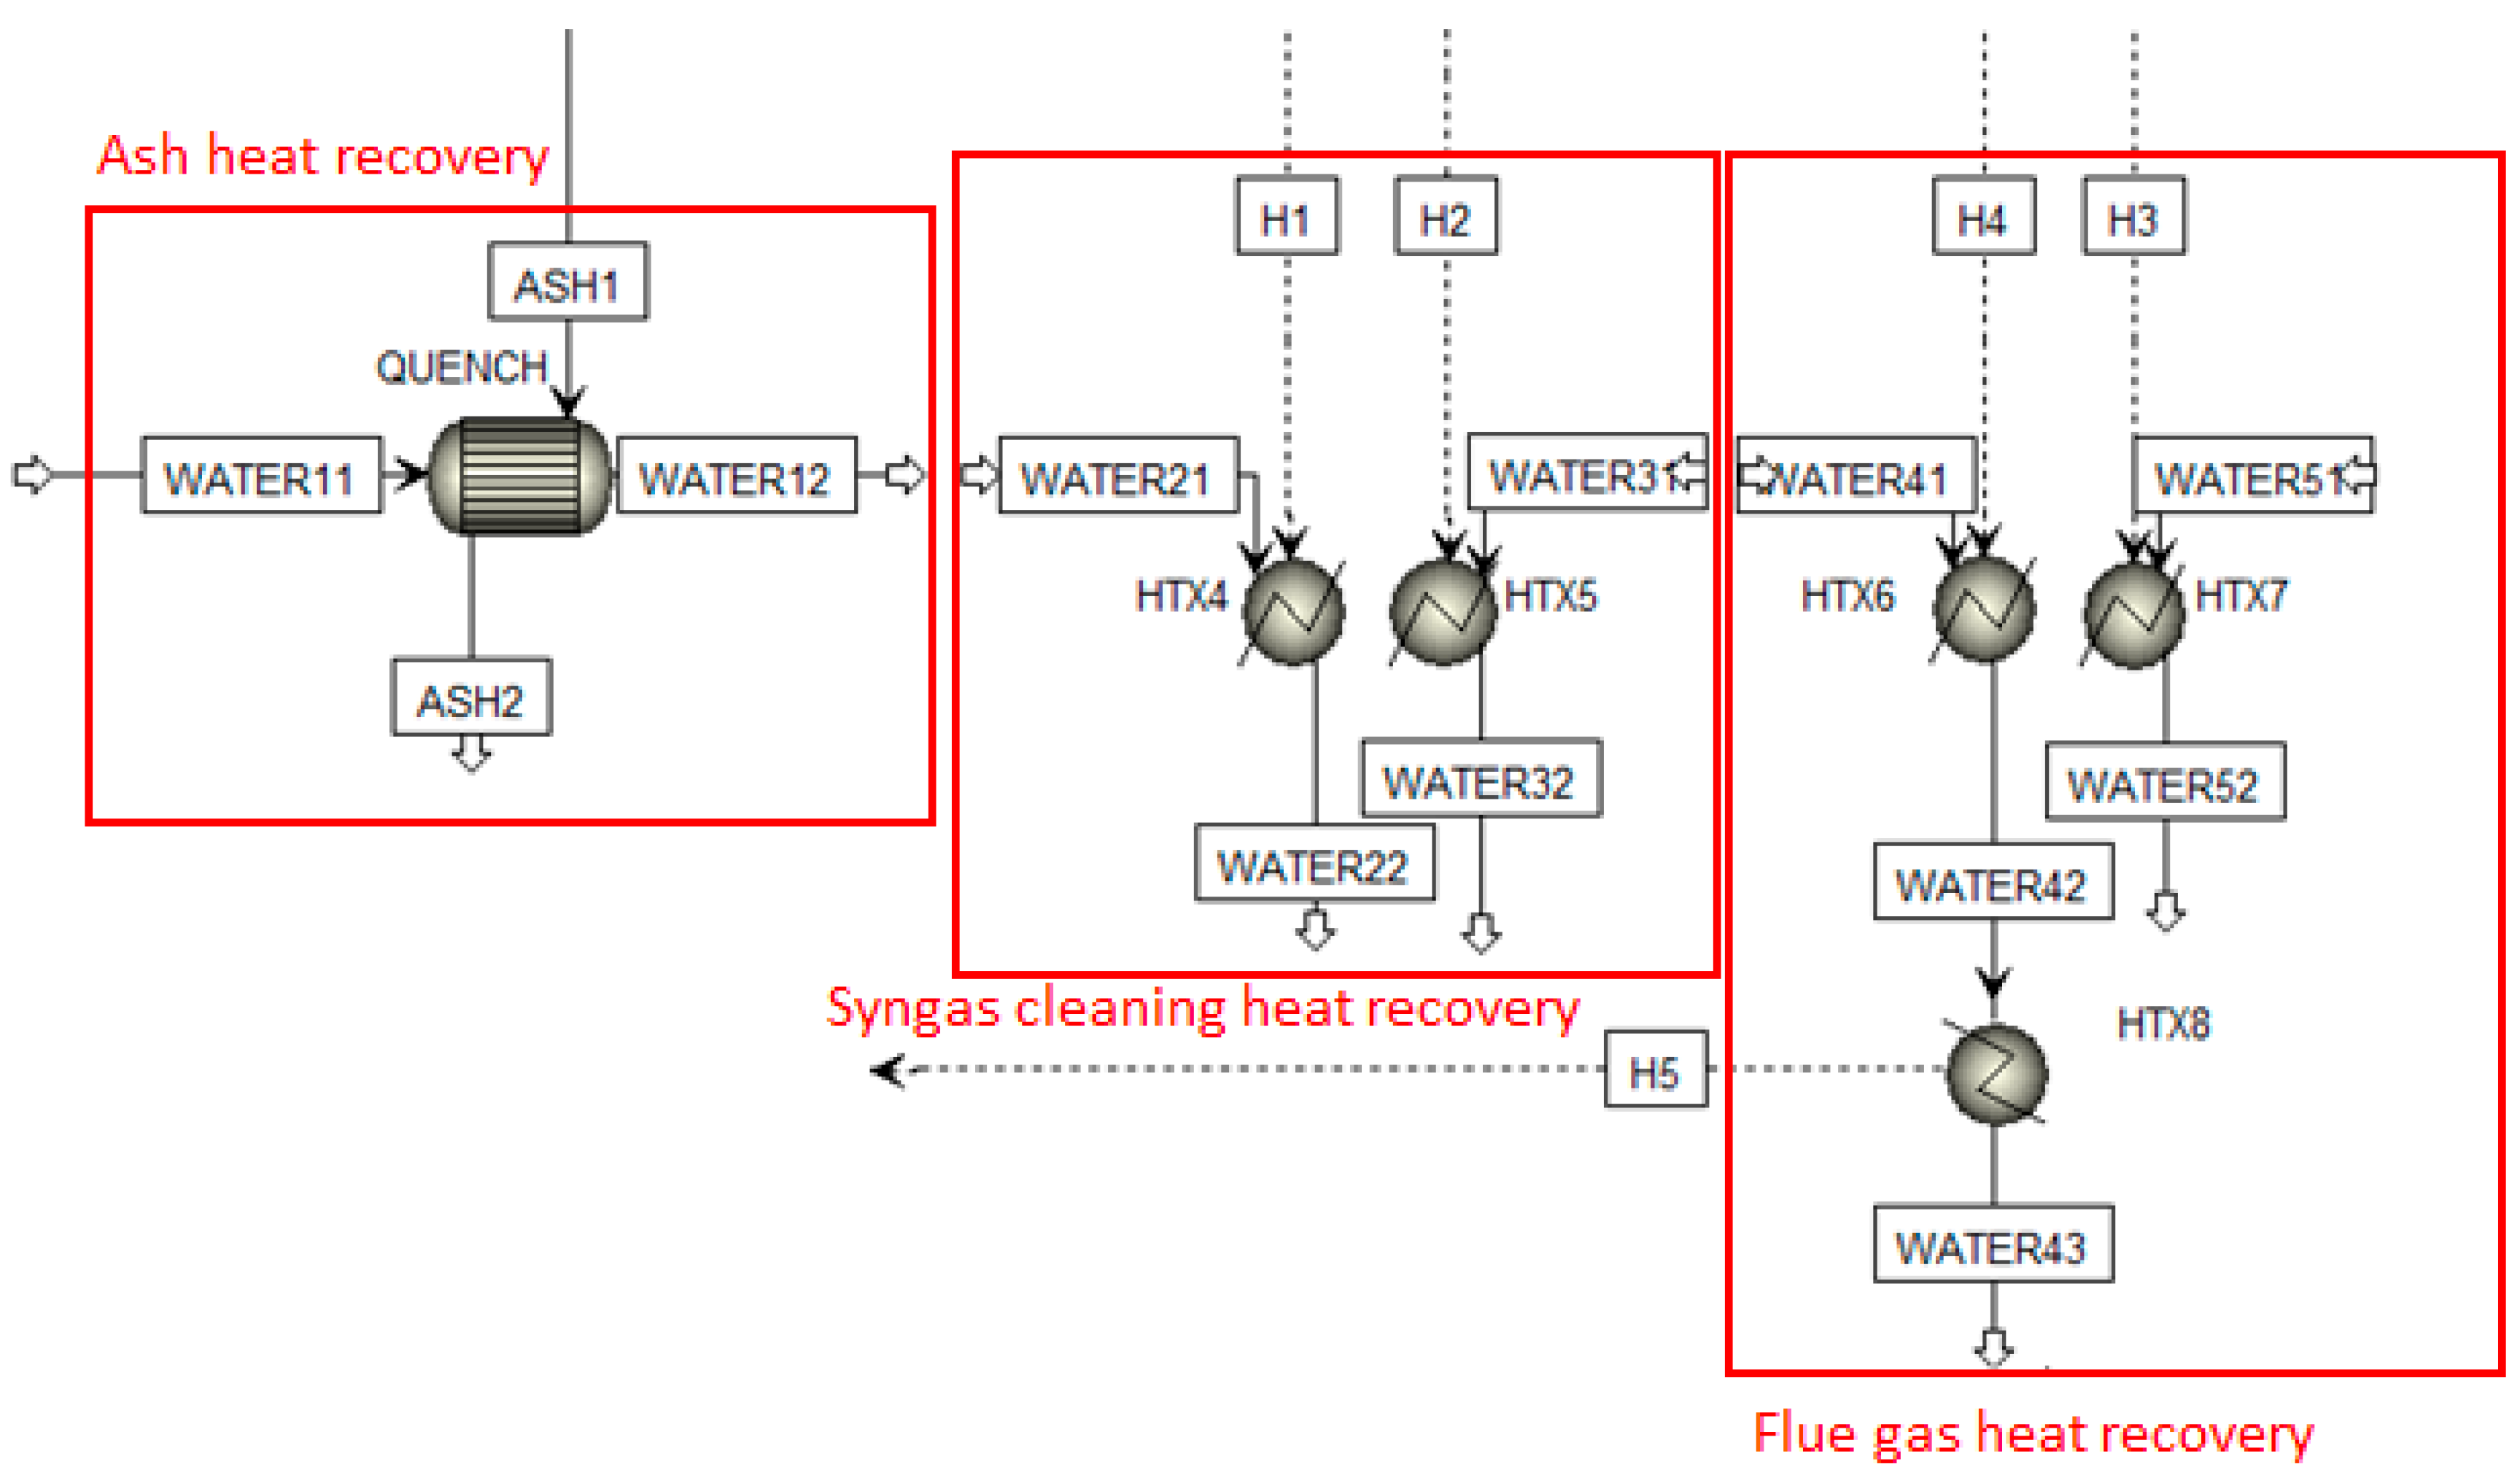
- Heat recovery unit.
4. Modeling and Simulation
- The model is 0D thermodynamic and predicts thermodynamics for pyrolysis and gasification reactions;
- The gasification process occurs at steady state condition and atmospheric pressure;
- The gasification reaction is isothermal and at a constant volume;
- Gasifier feedstock has perfect mixing and uniform temperature distribution;
- Tar and char formation are negligible and ignored in the simulation;
- Dioxins, furans, tars and heavy metals were not modeled based on the limitations of the software, in future works their generation should be assessed through experimental efforts;
- Main final products for solid waste gasification takes place instantaneously and identified volatile products are H2, CO, CO2, CH4 and H2O;
- Ideal activity coefficient model for the liquid phase (activity coefficient = 1) and ideal mixing in liquids;
- Ideal gas equation of state is used for the vapor phase;
- The fixed parameters of the process, such as the drying and decomposition temperature, are based on literature typical values and were optimized to increase the efficiency of the system.
- The feedstock is introduced at ambient conditions, 1 bar and 25°C;
- An initial particle size distribution (PSD) is assumed for the un-treated wastes, a medium particle width of 20 cm and a standard deviation of 15 cm;
- A final particle size distribution (PSD) is assumed for the treated waste, a medium particle width of 0.3 cm and a standard deviation of 0.05 cm;
- Moisture is partially removed (from 68% to 20%) from sewage sludge in the drying process and the resulting water is removed.
- Gasification and combustion reactions, as well as the chemical removal of contaminants are modeled through Gibbs reactors, which minimize the Gibbs free energy;
- The gasifier is spit in two zones, the high temperature zone (bottom) and the low temperature zone (top), which are considered isothermal during the simulations;
- The ICP generators parameters and operation conditions were obtained from COMSOL simulations and not from any commercially available device, although some examples of high power ICP generators can be found [40];
- The air/fuel ratio is optimized to obtain the highest syngas LHV, as described process that is described in chapter 5.
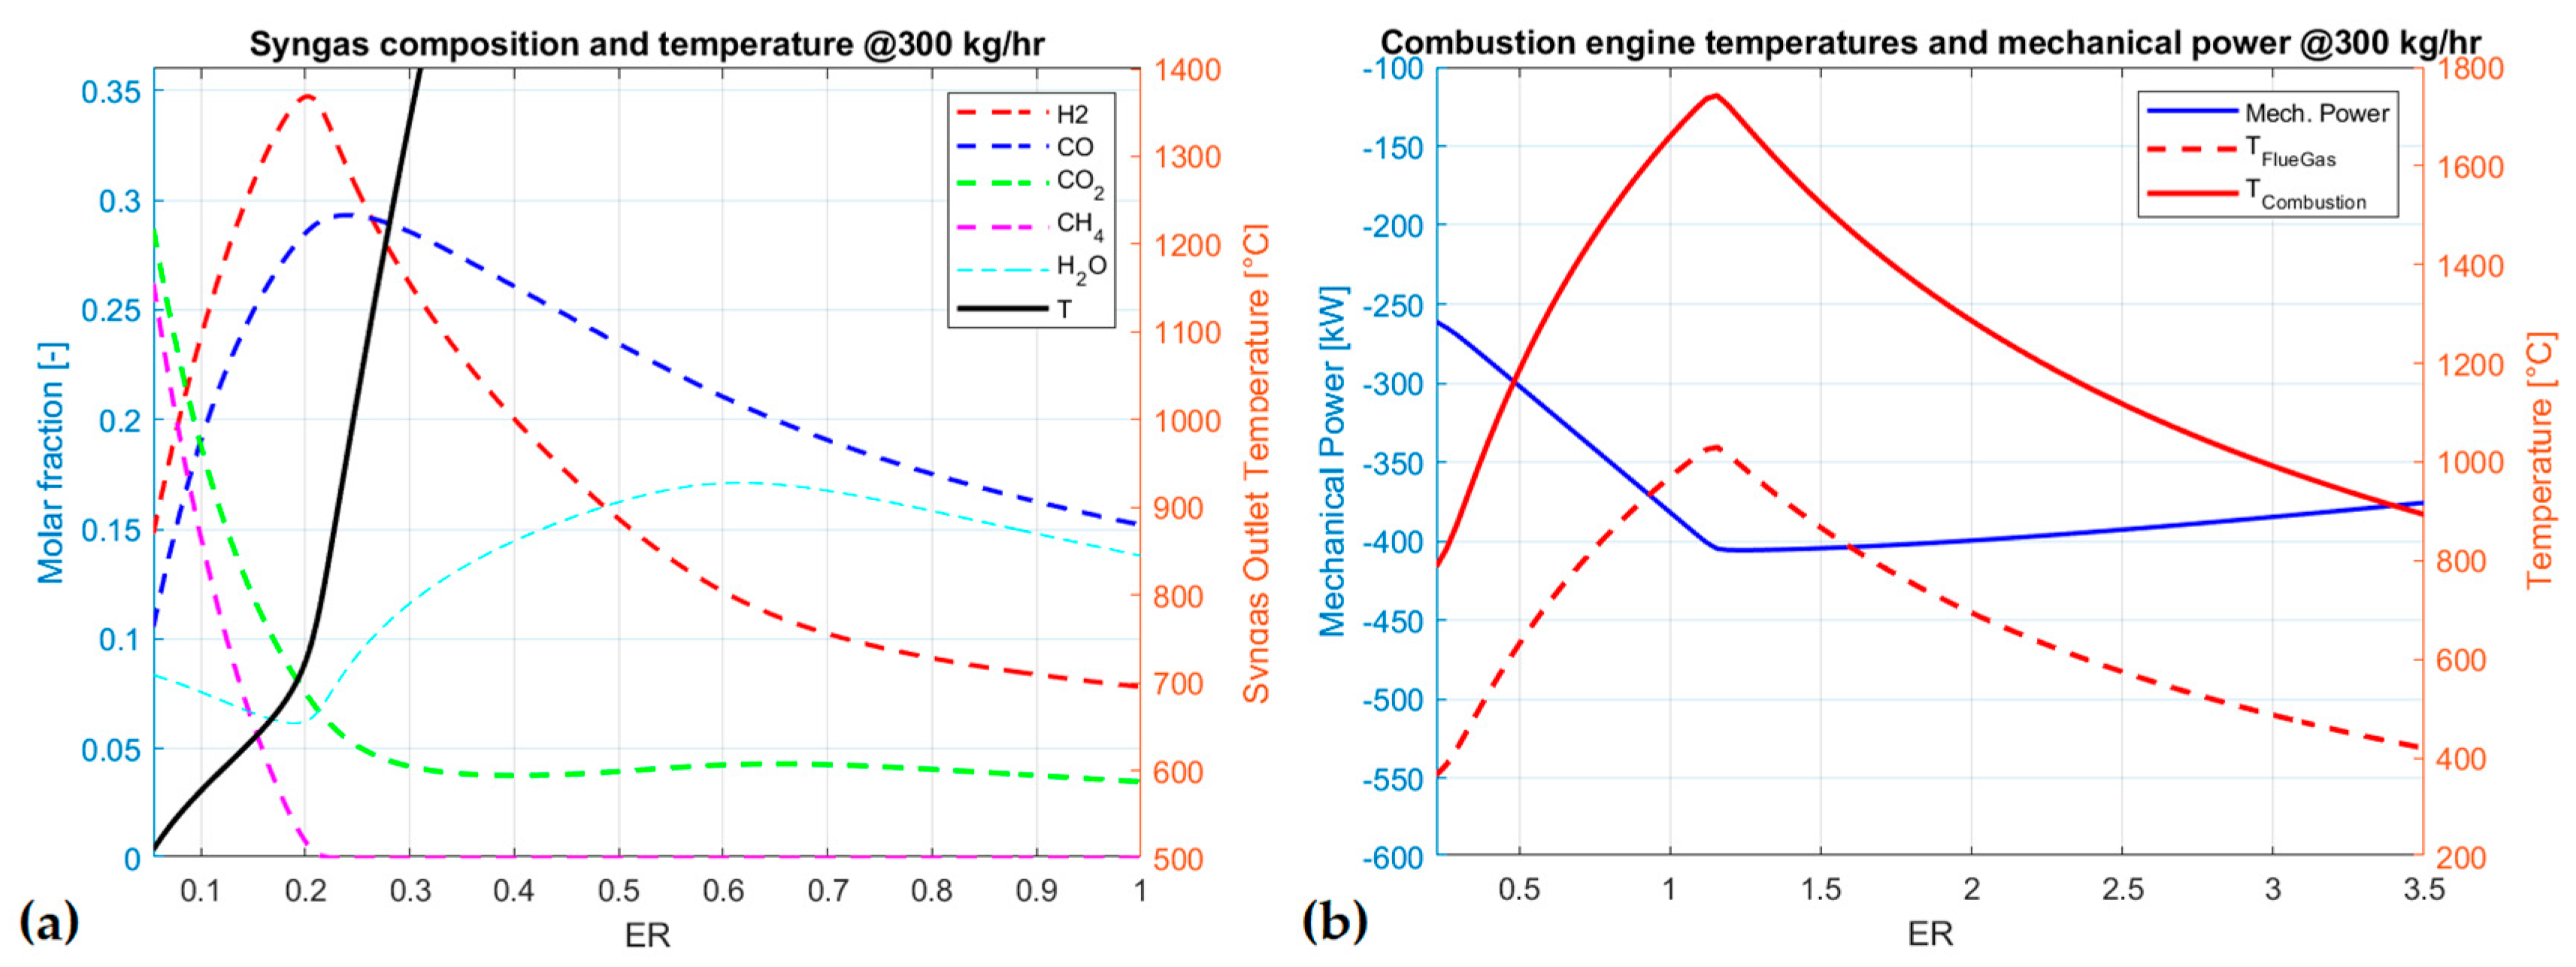
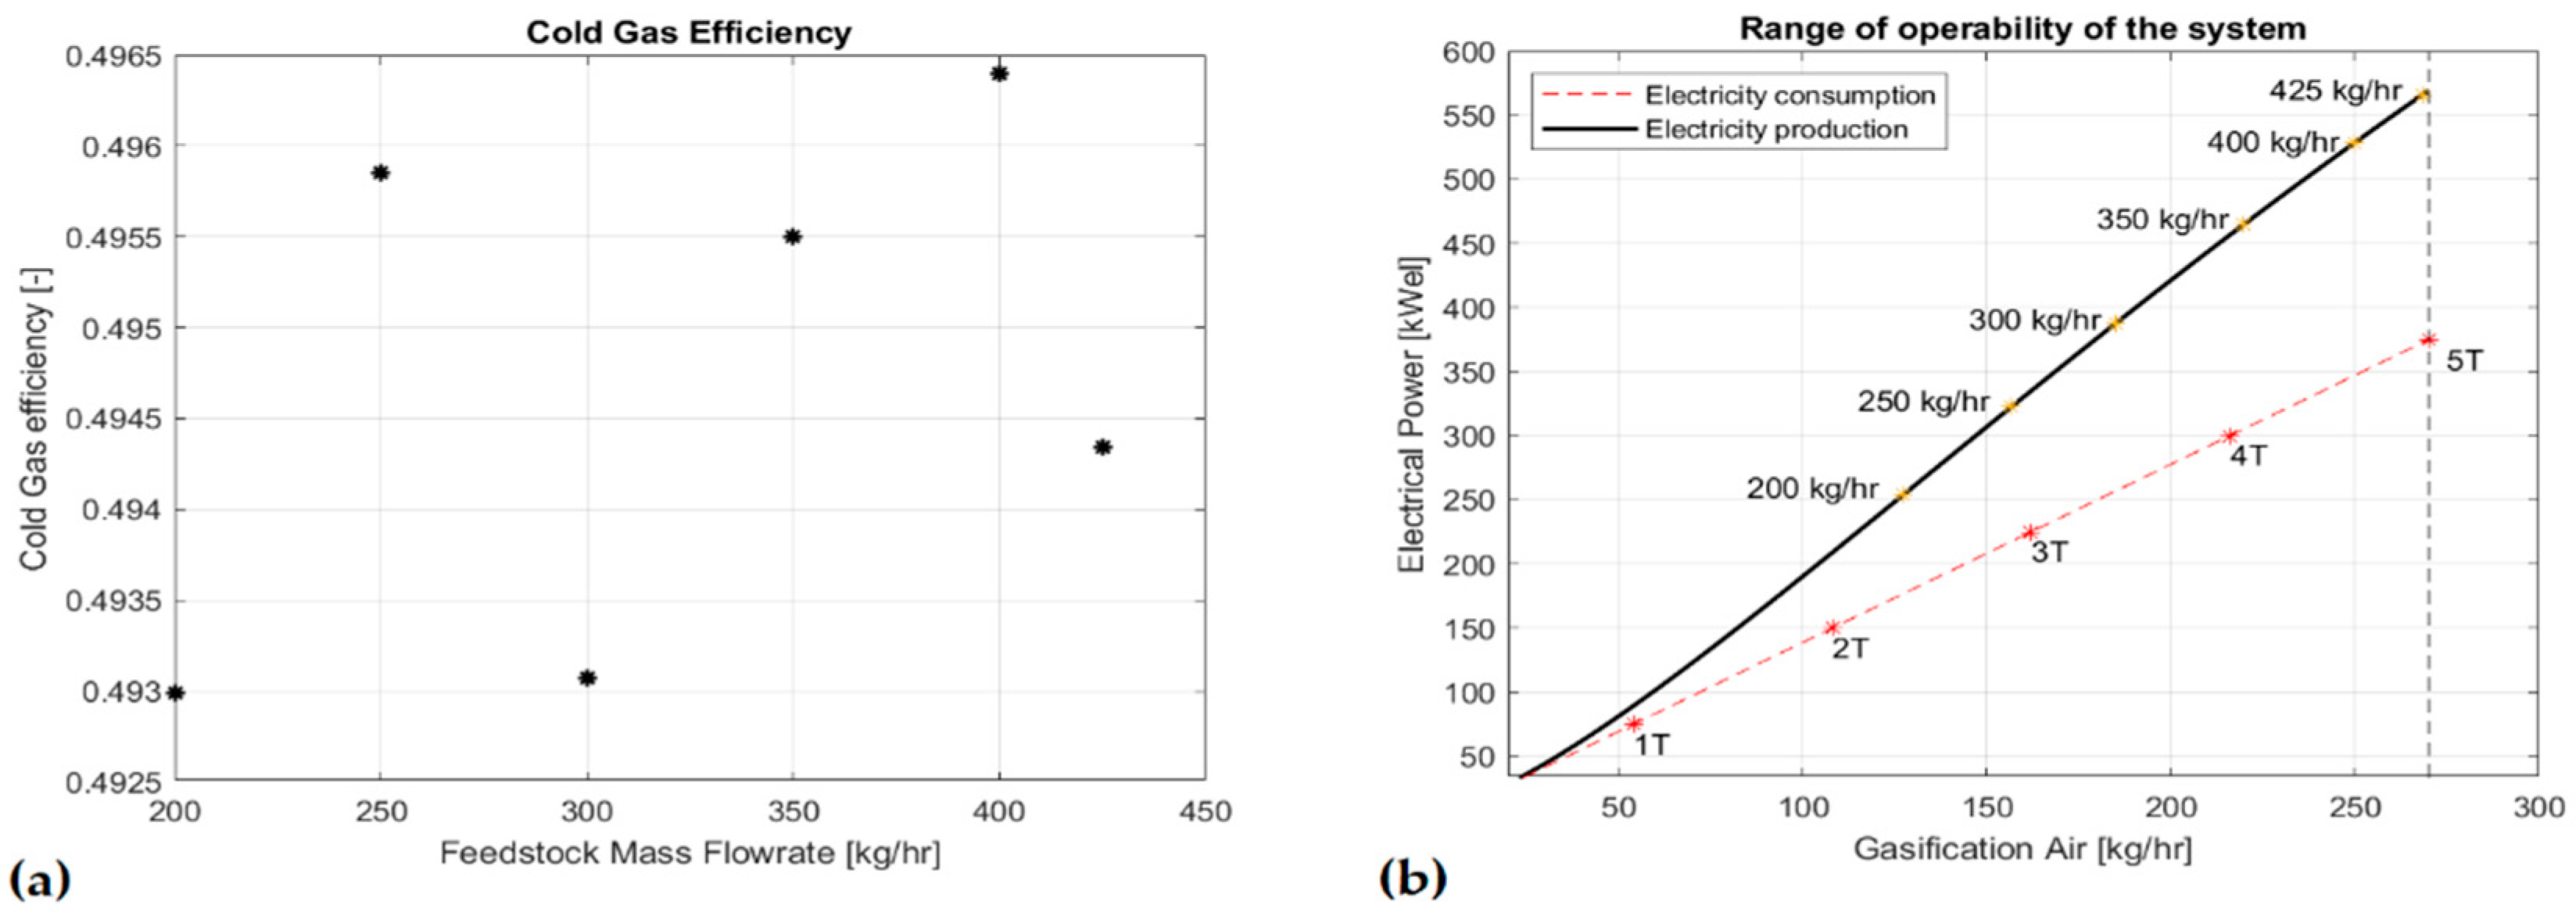
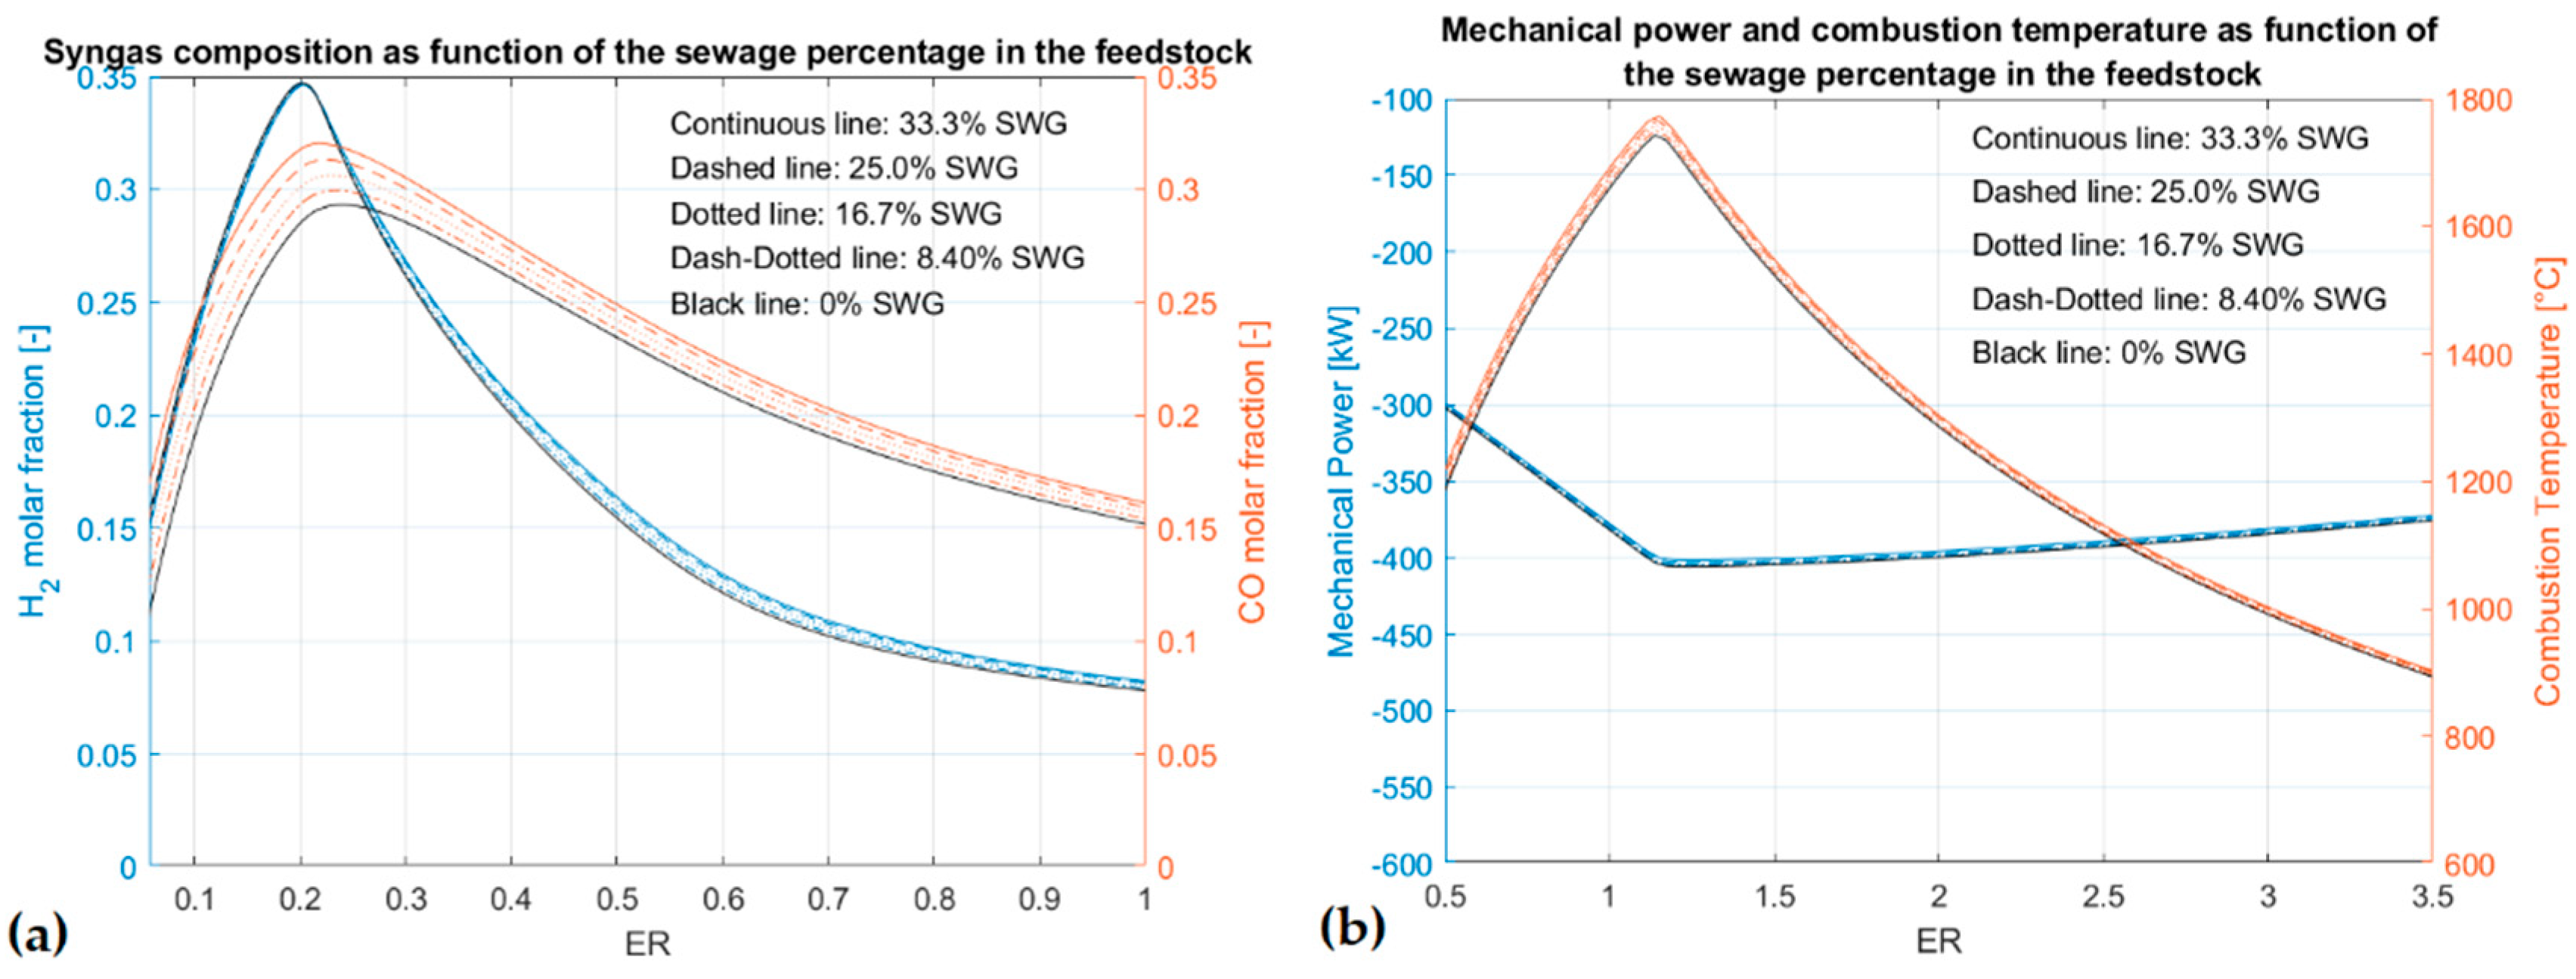
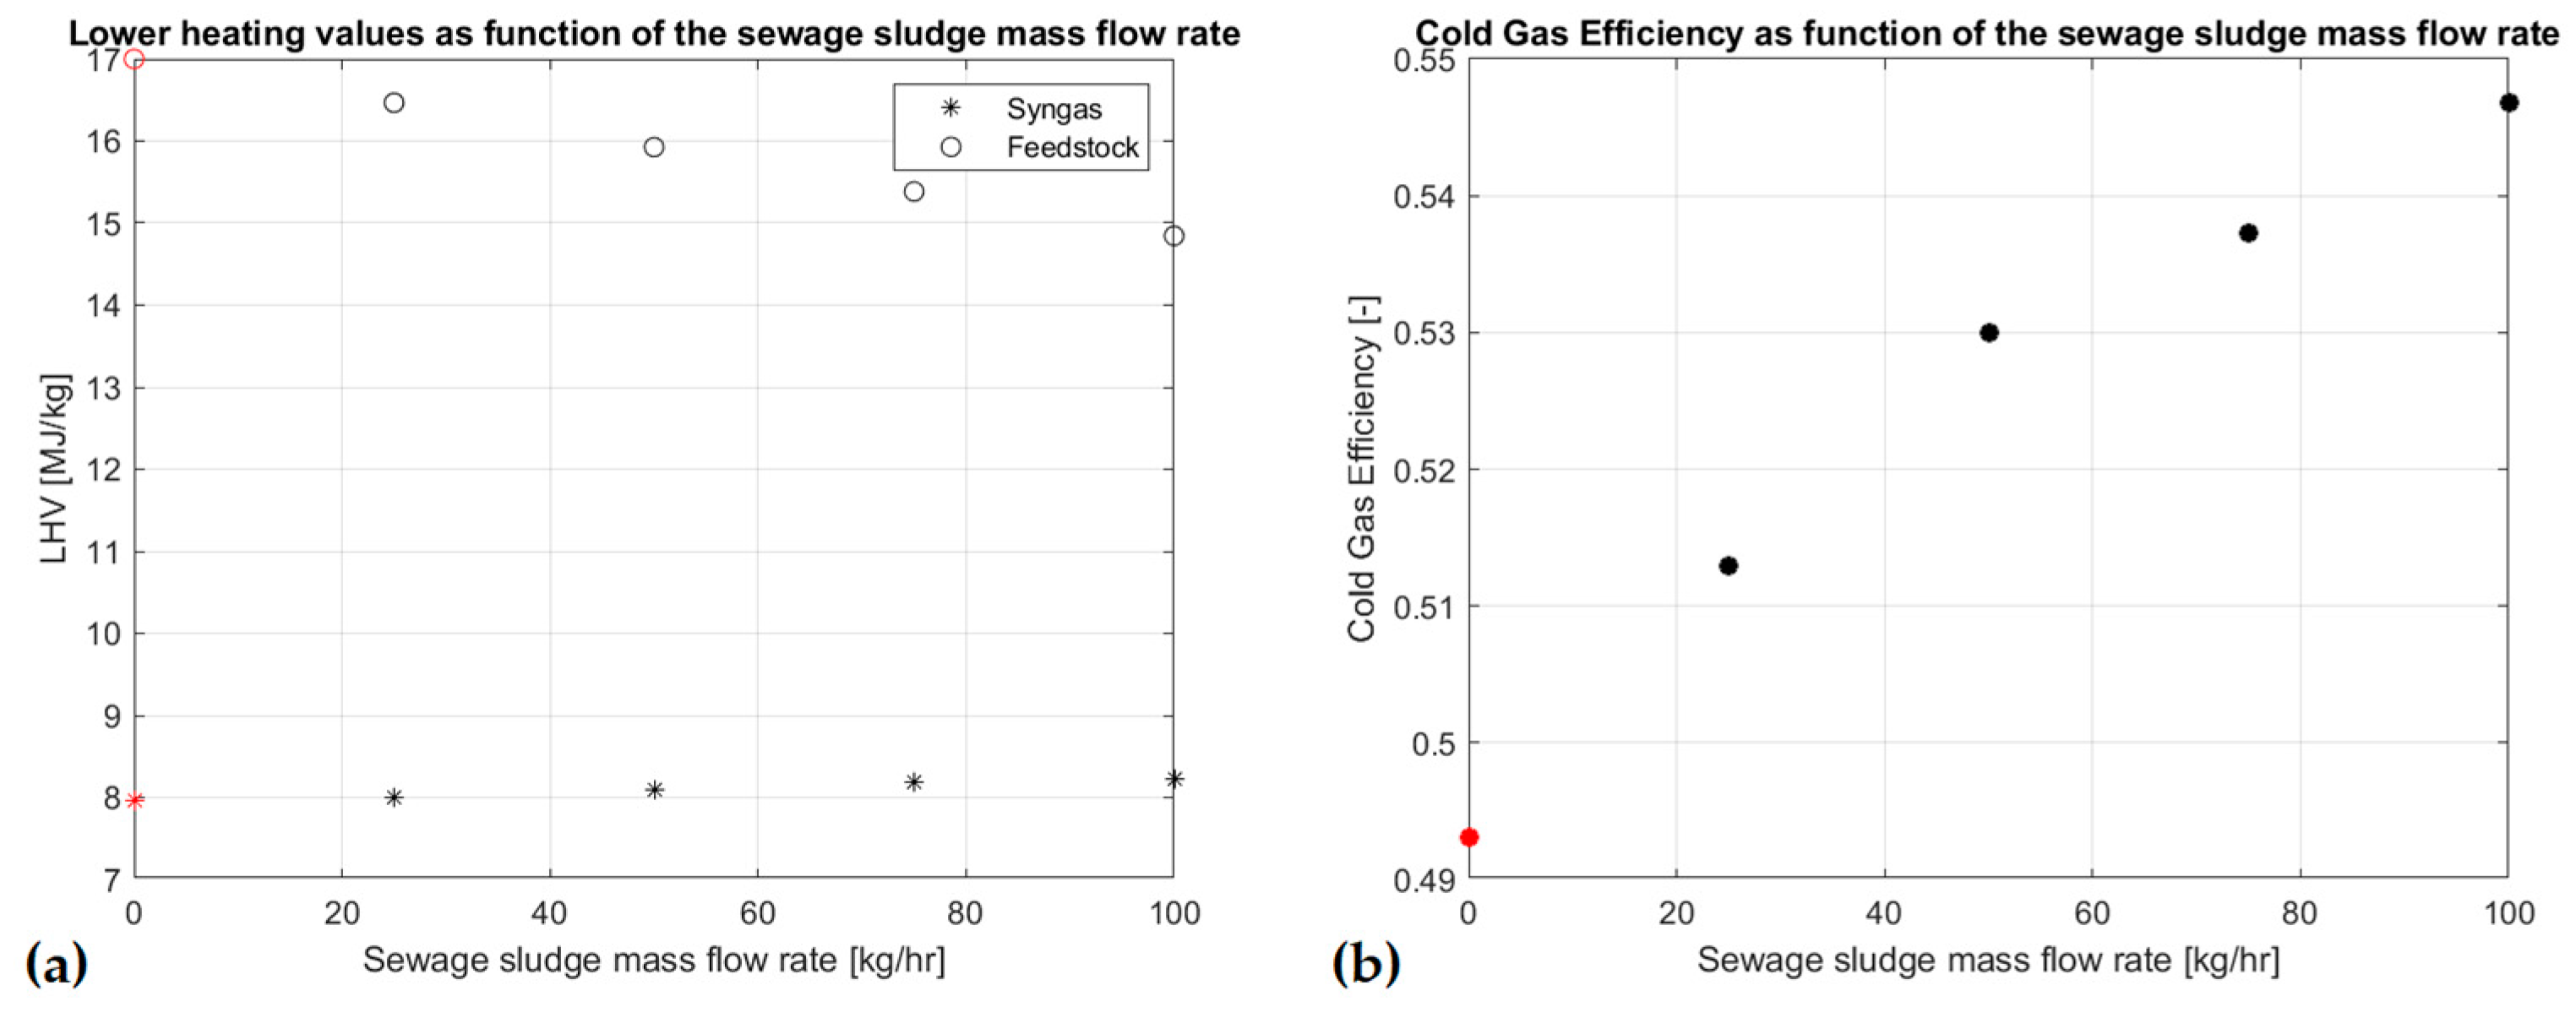
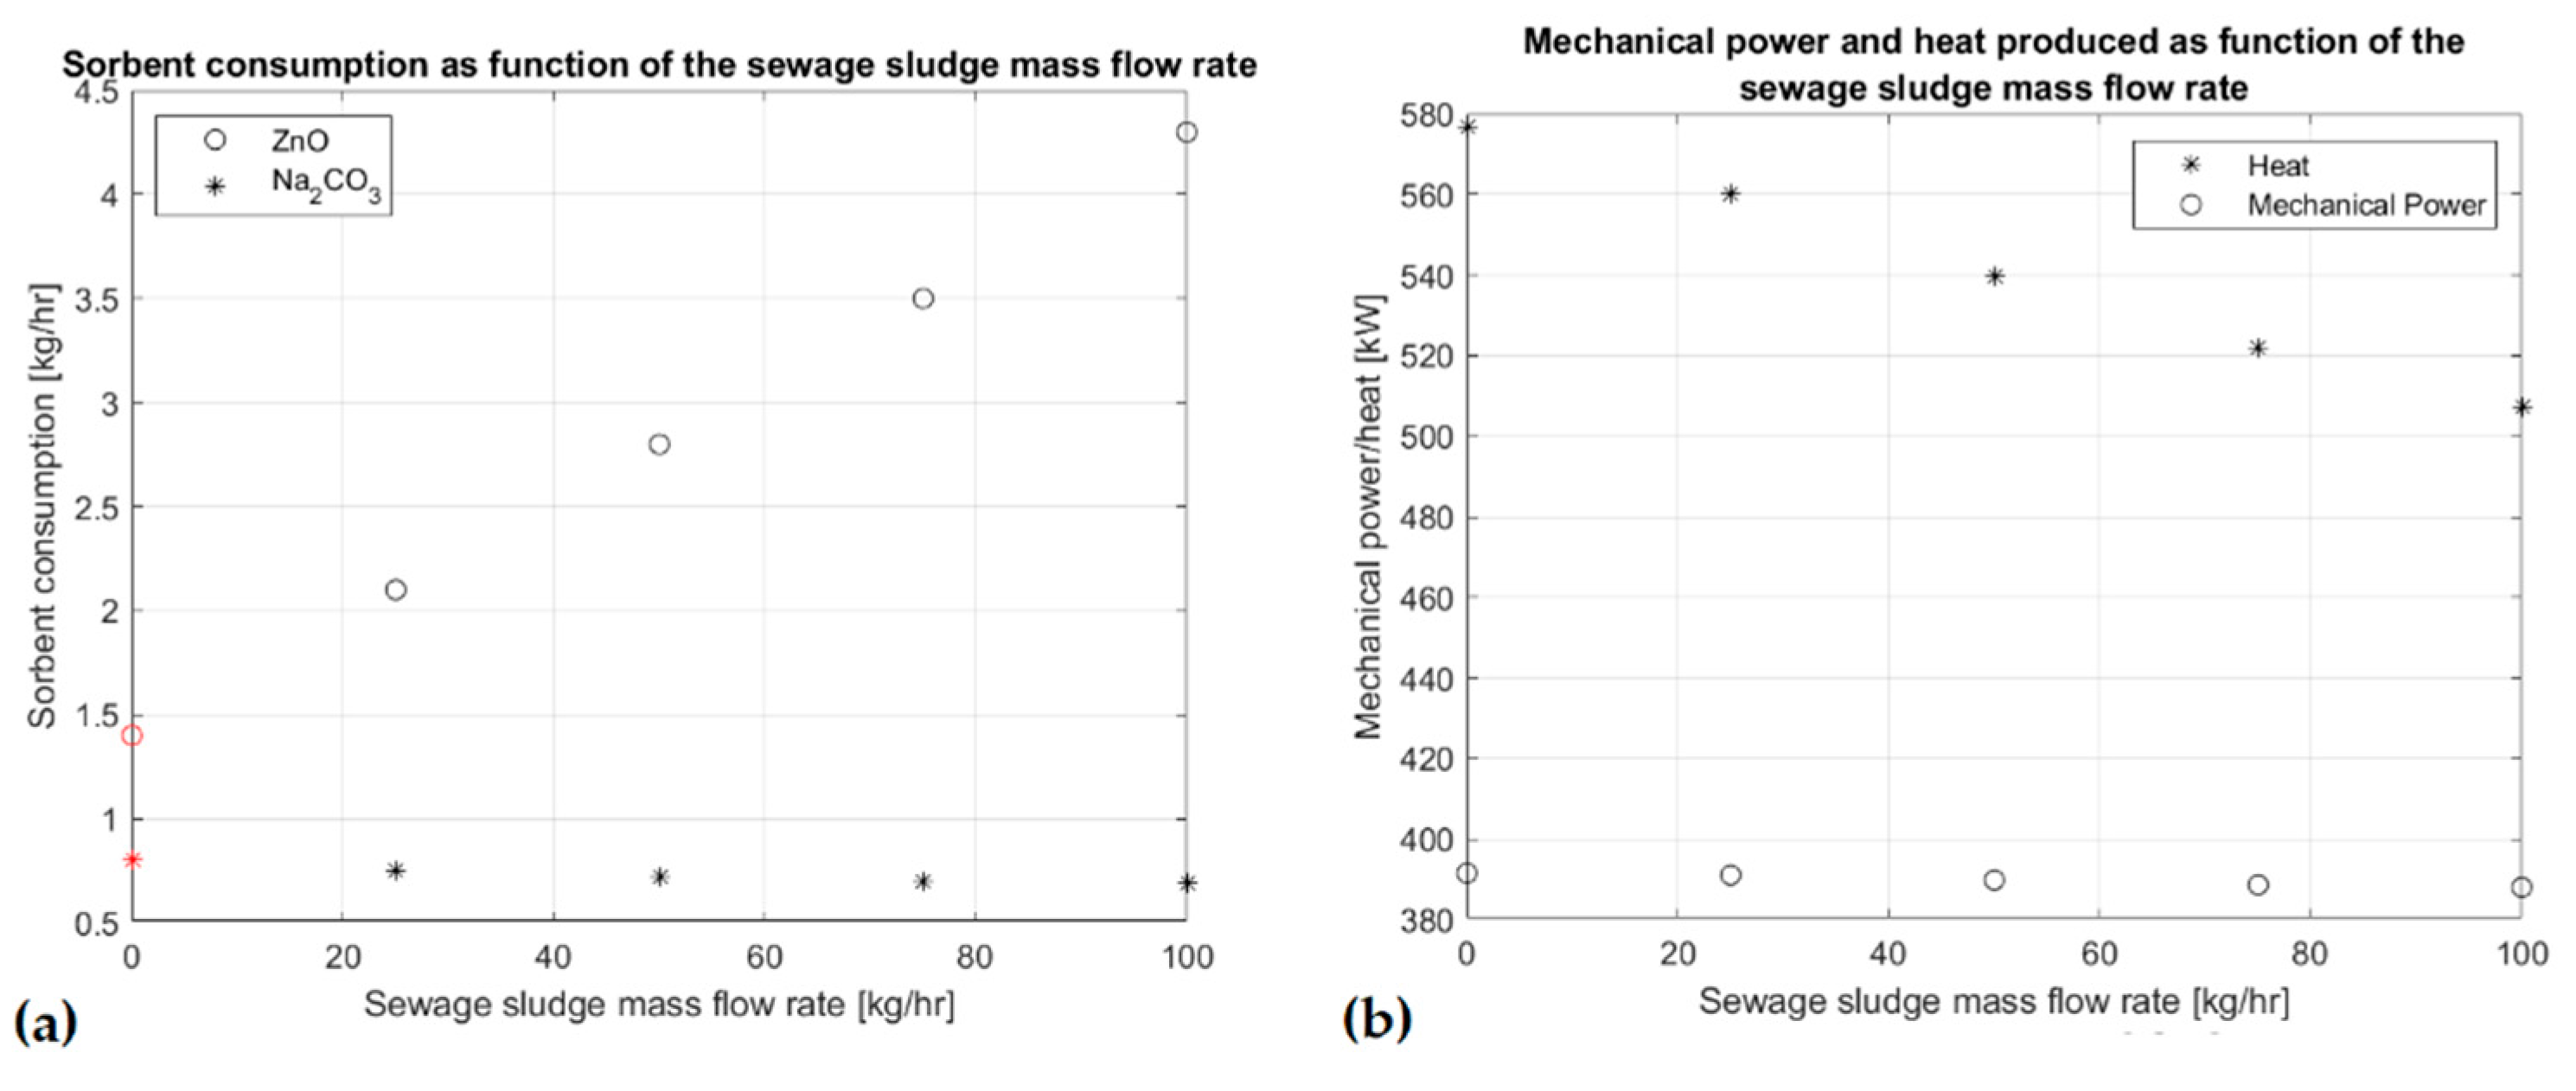
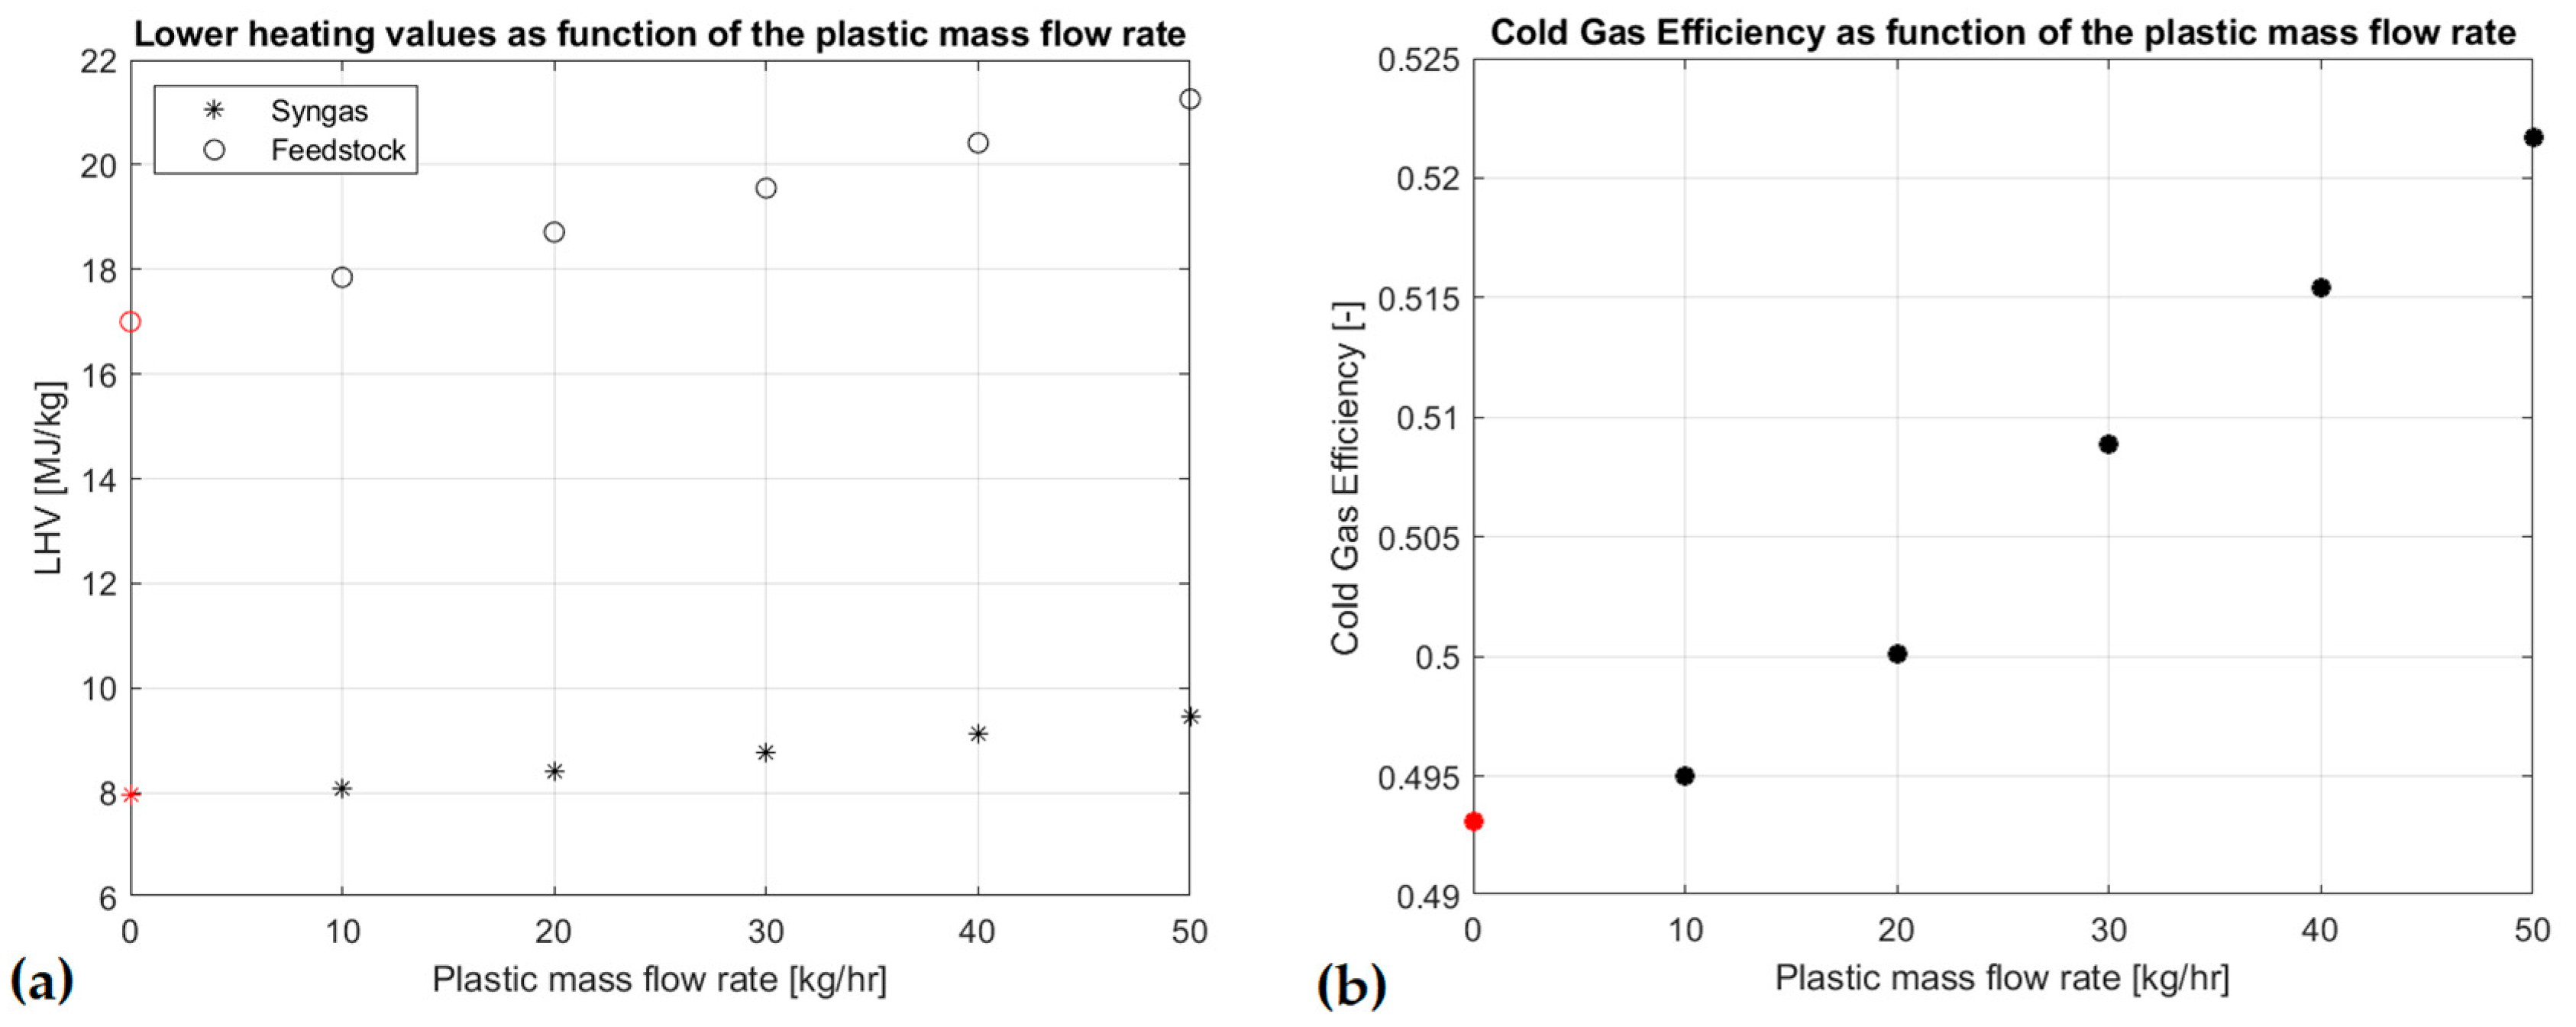
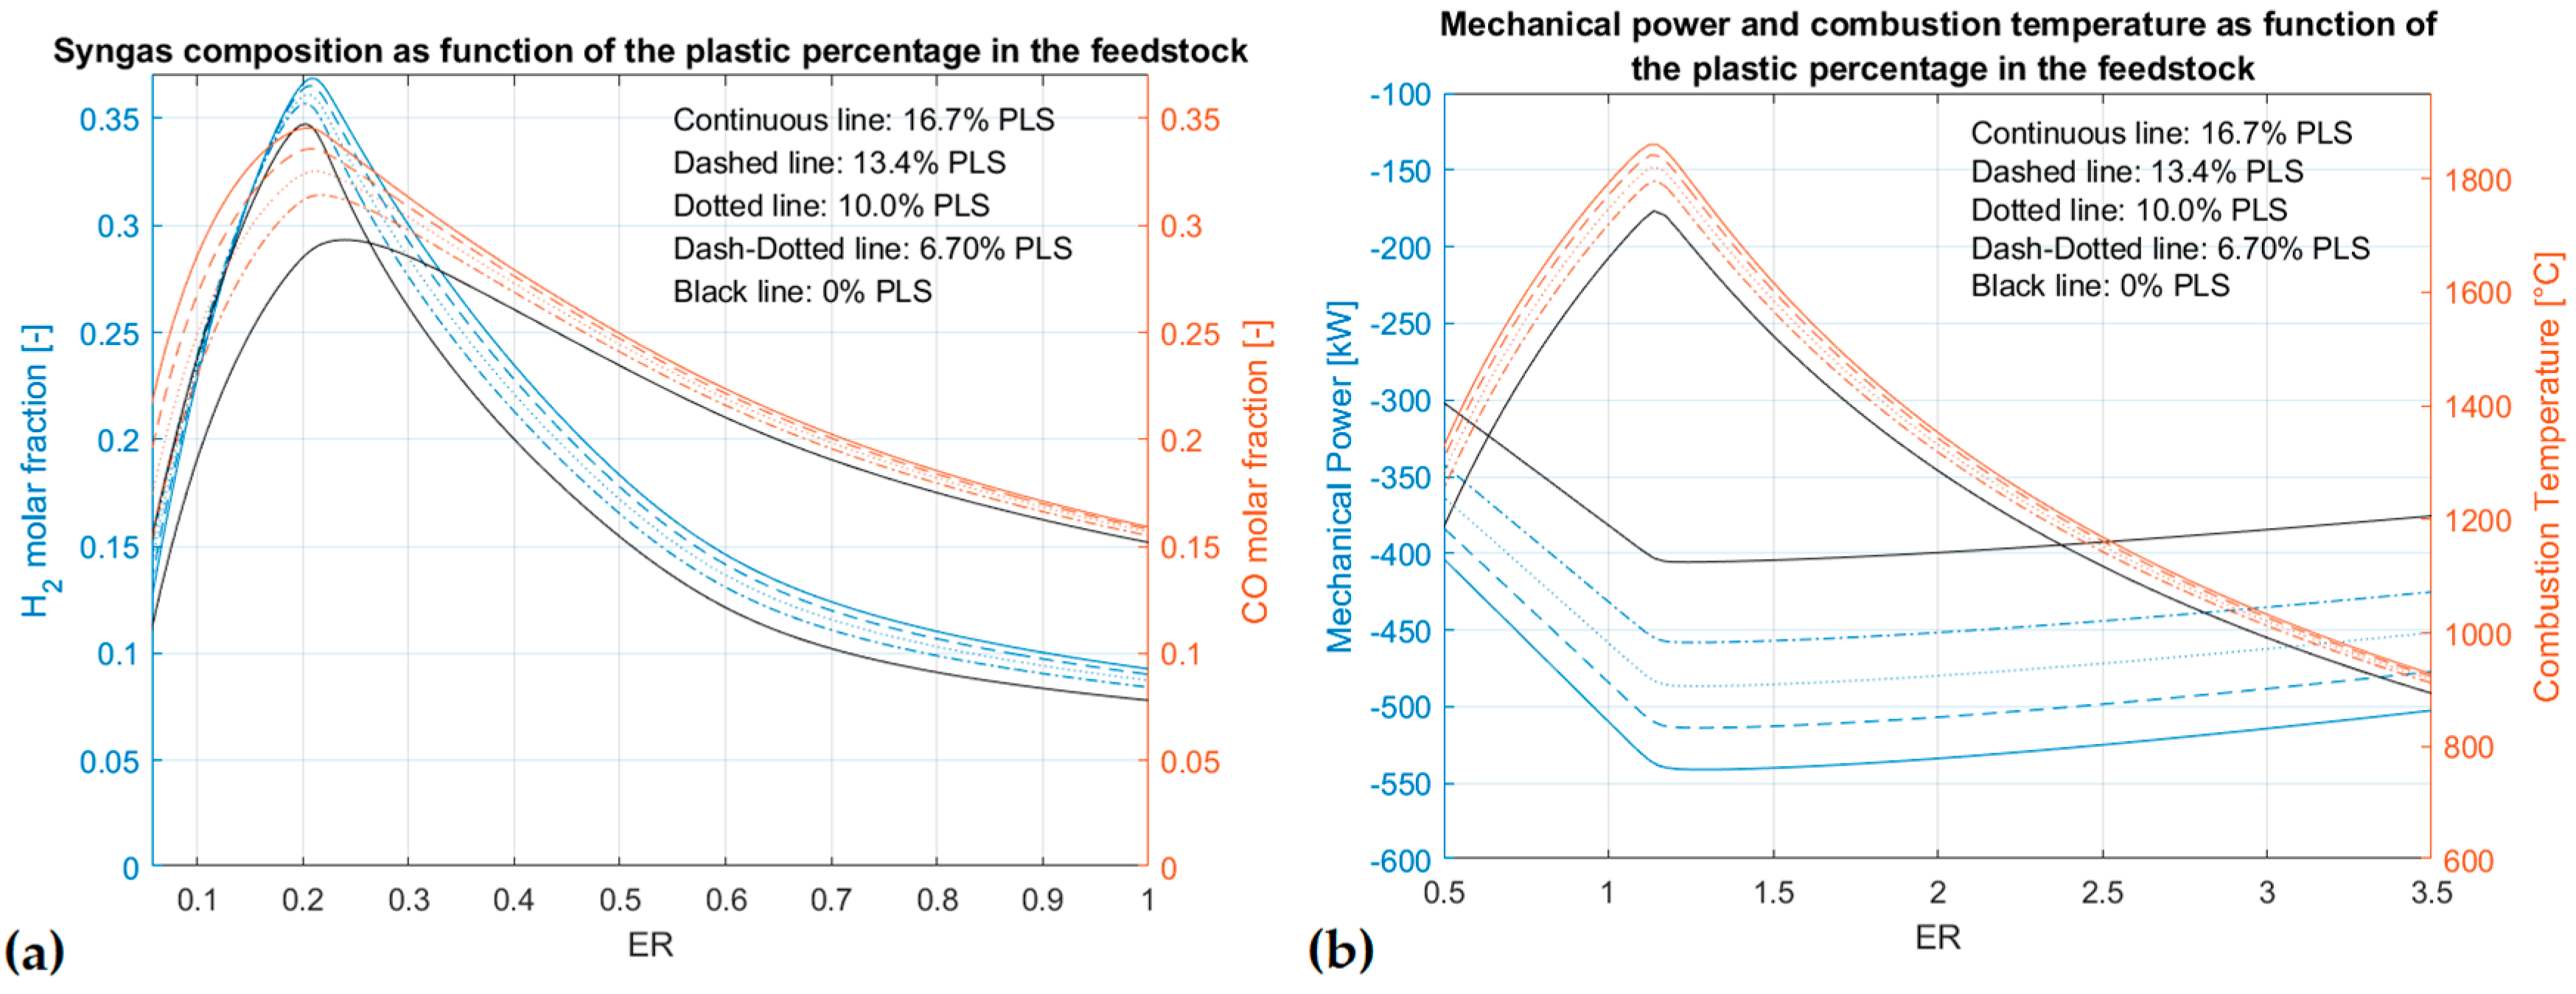
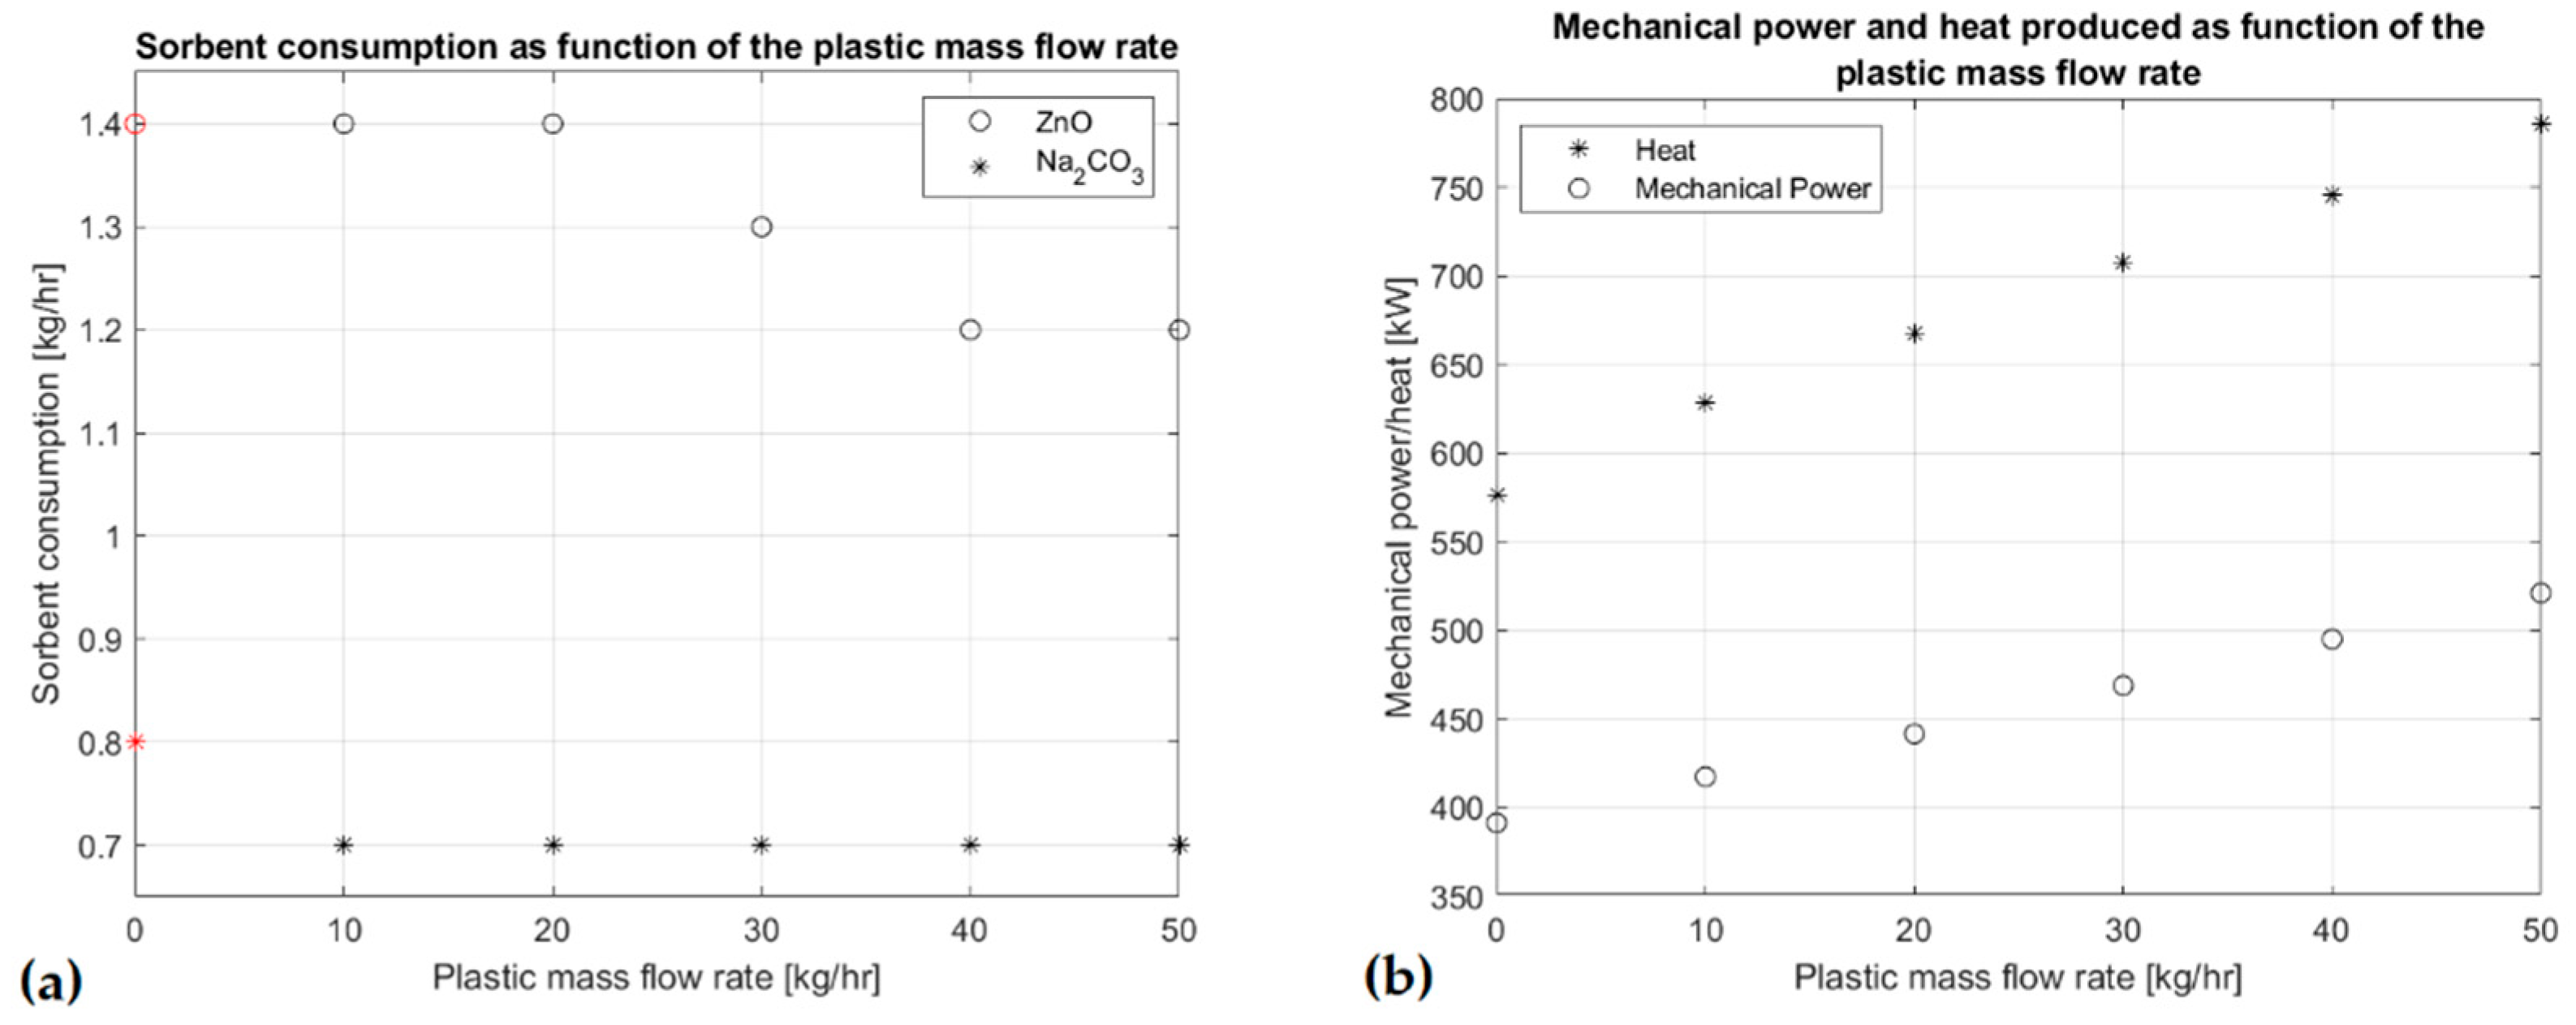
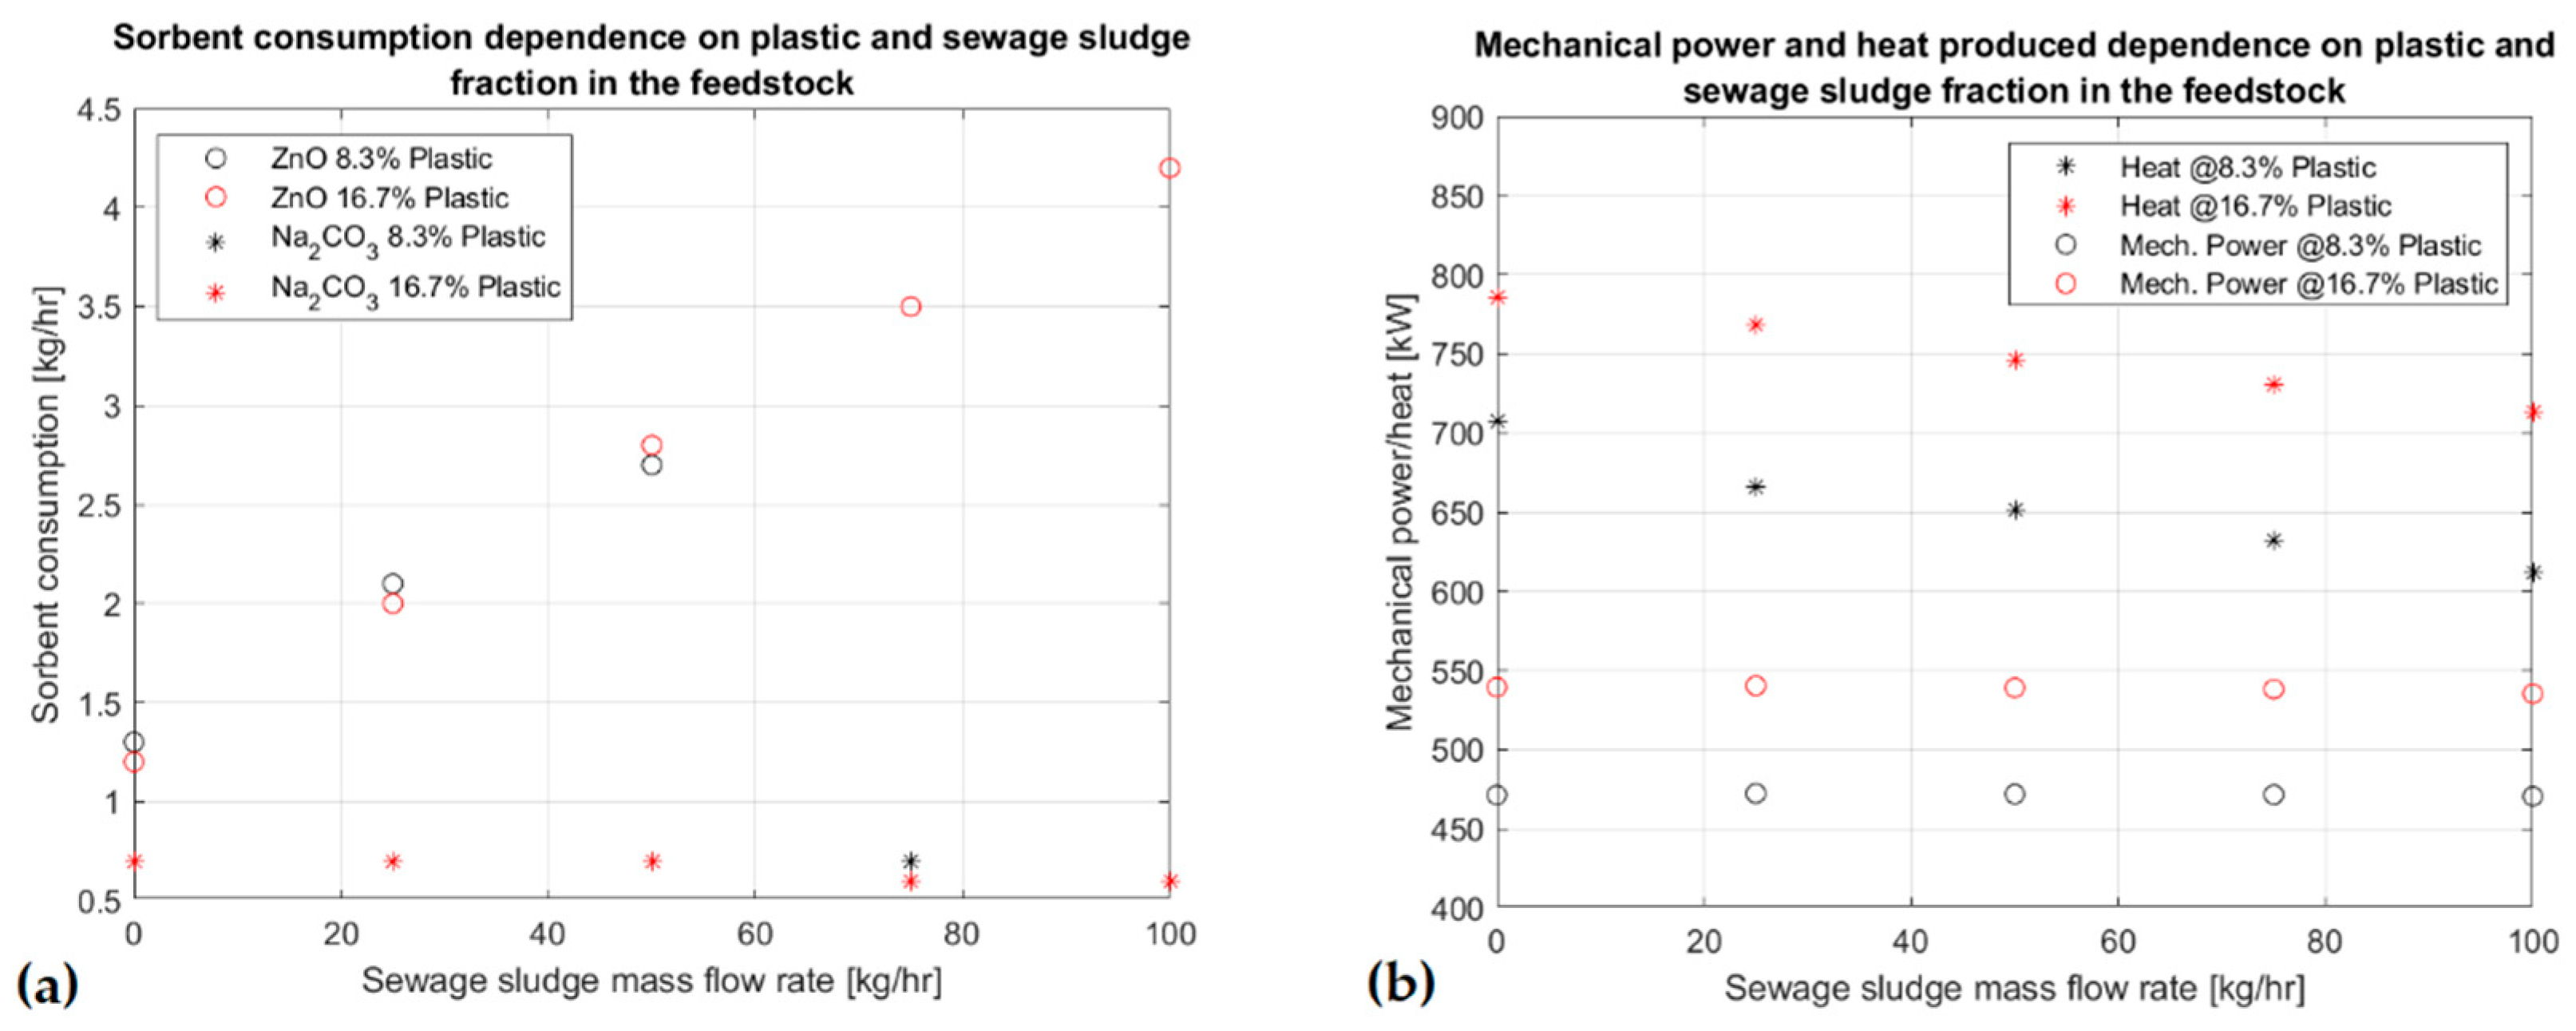
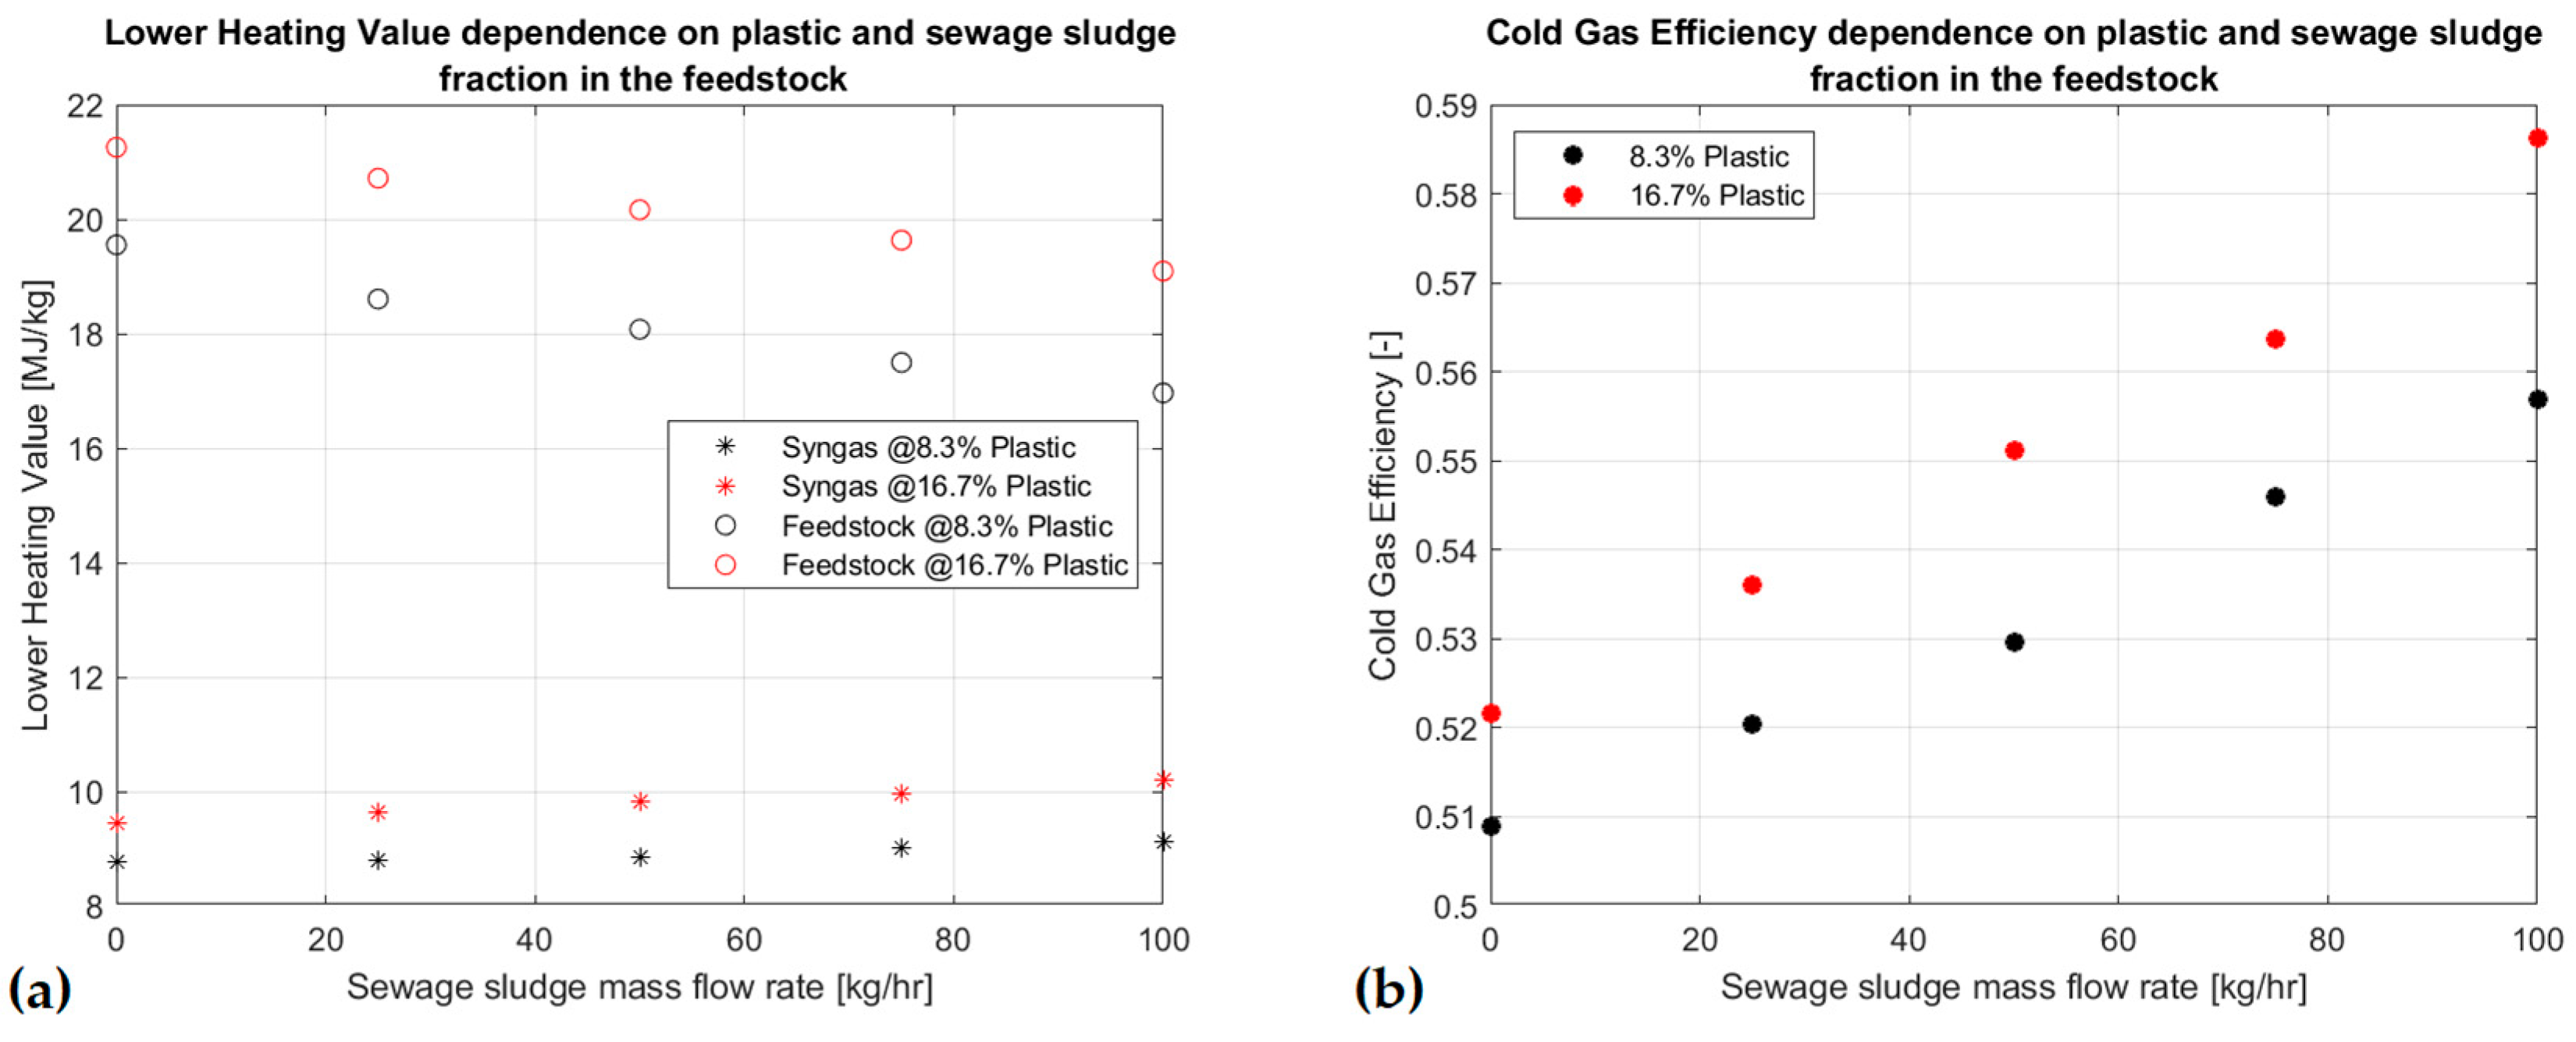
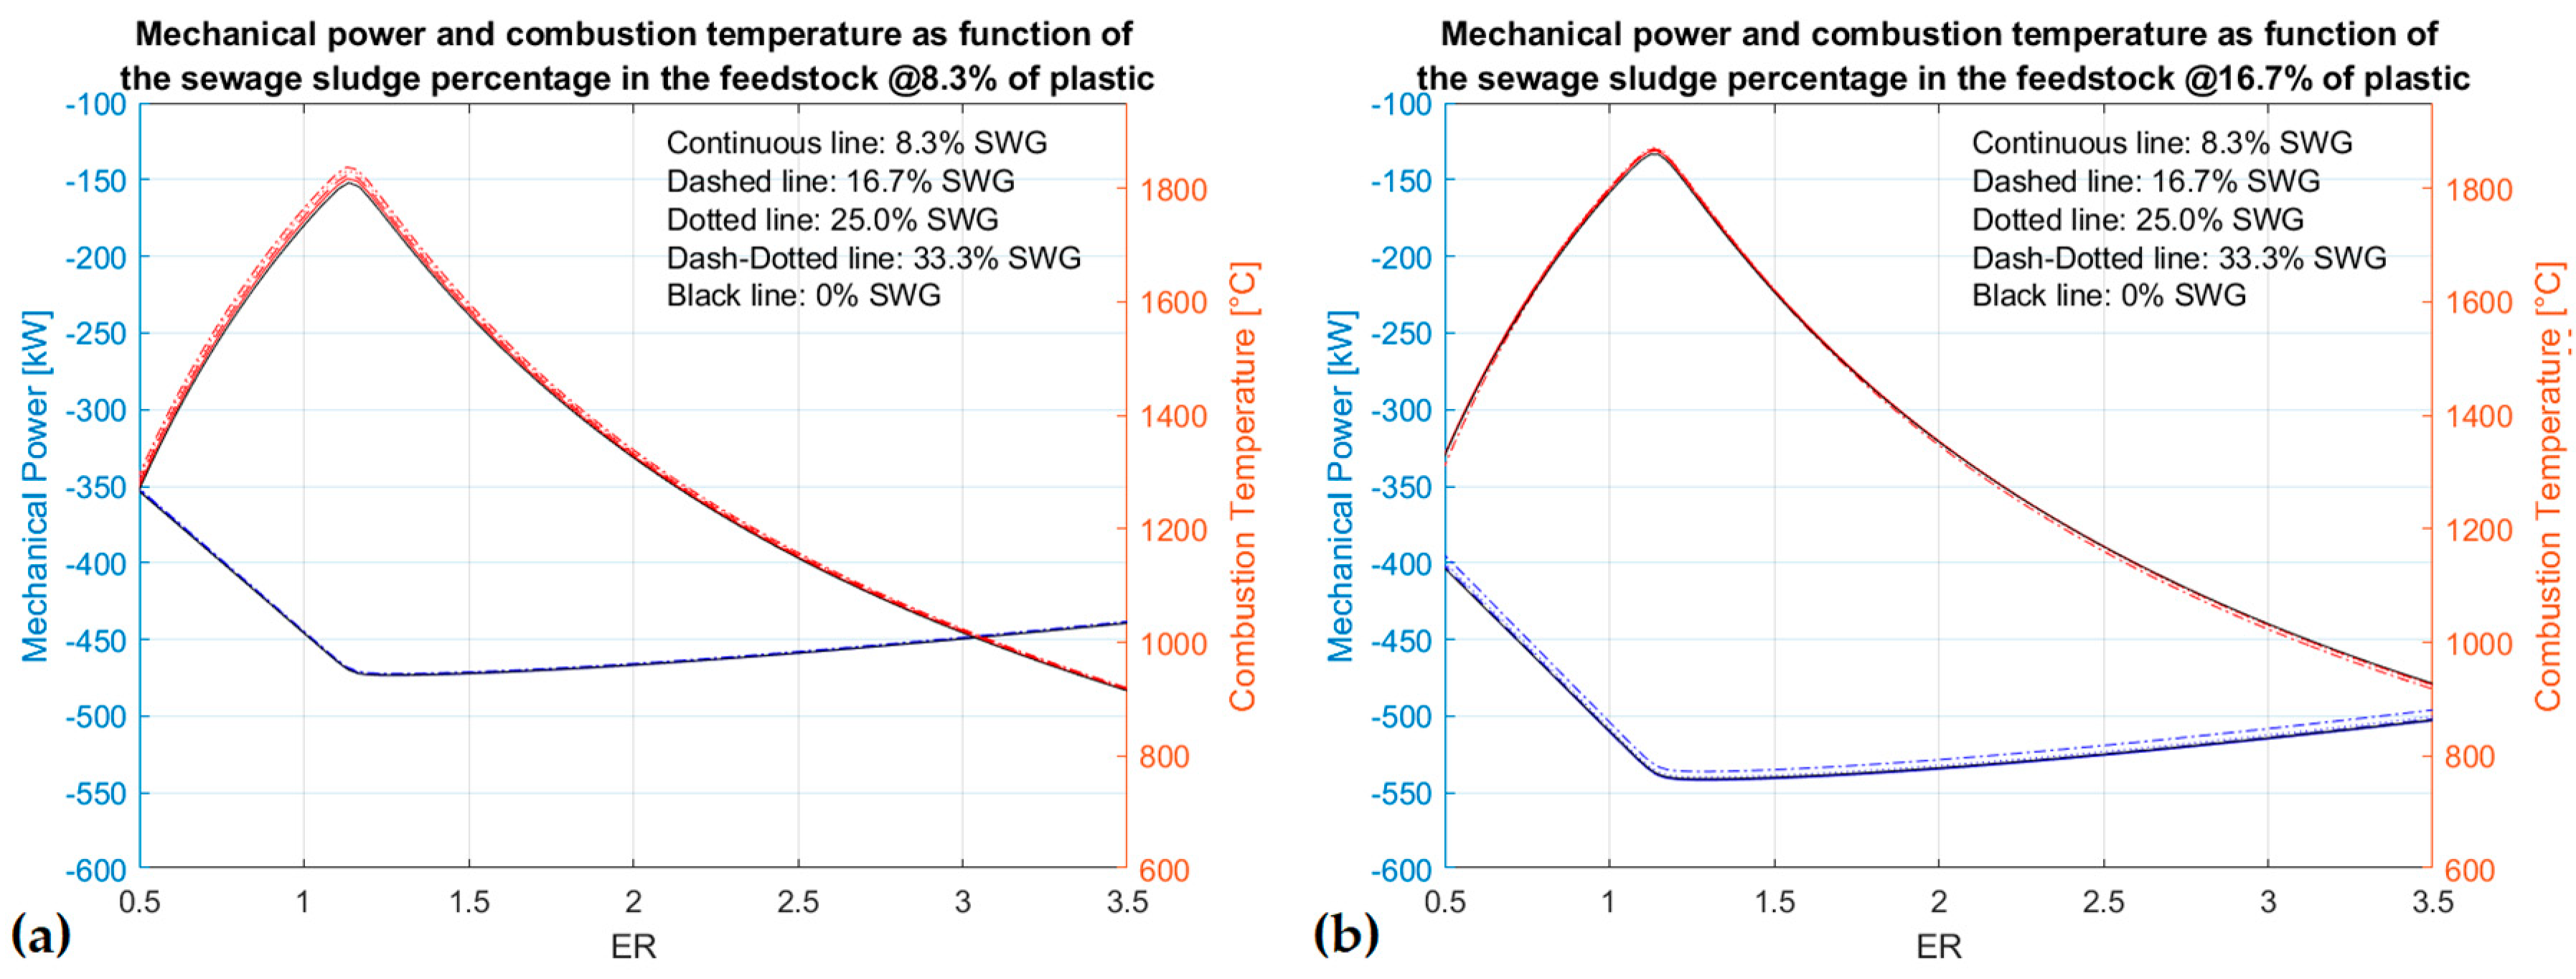
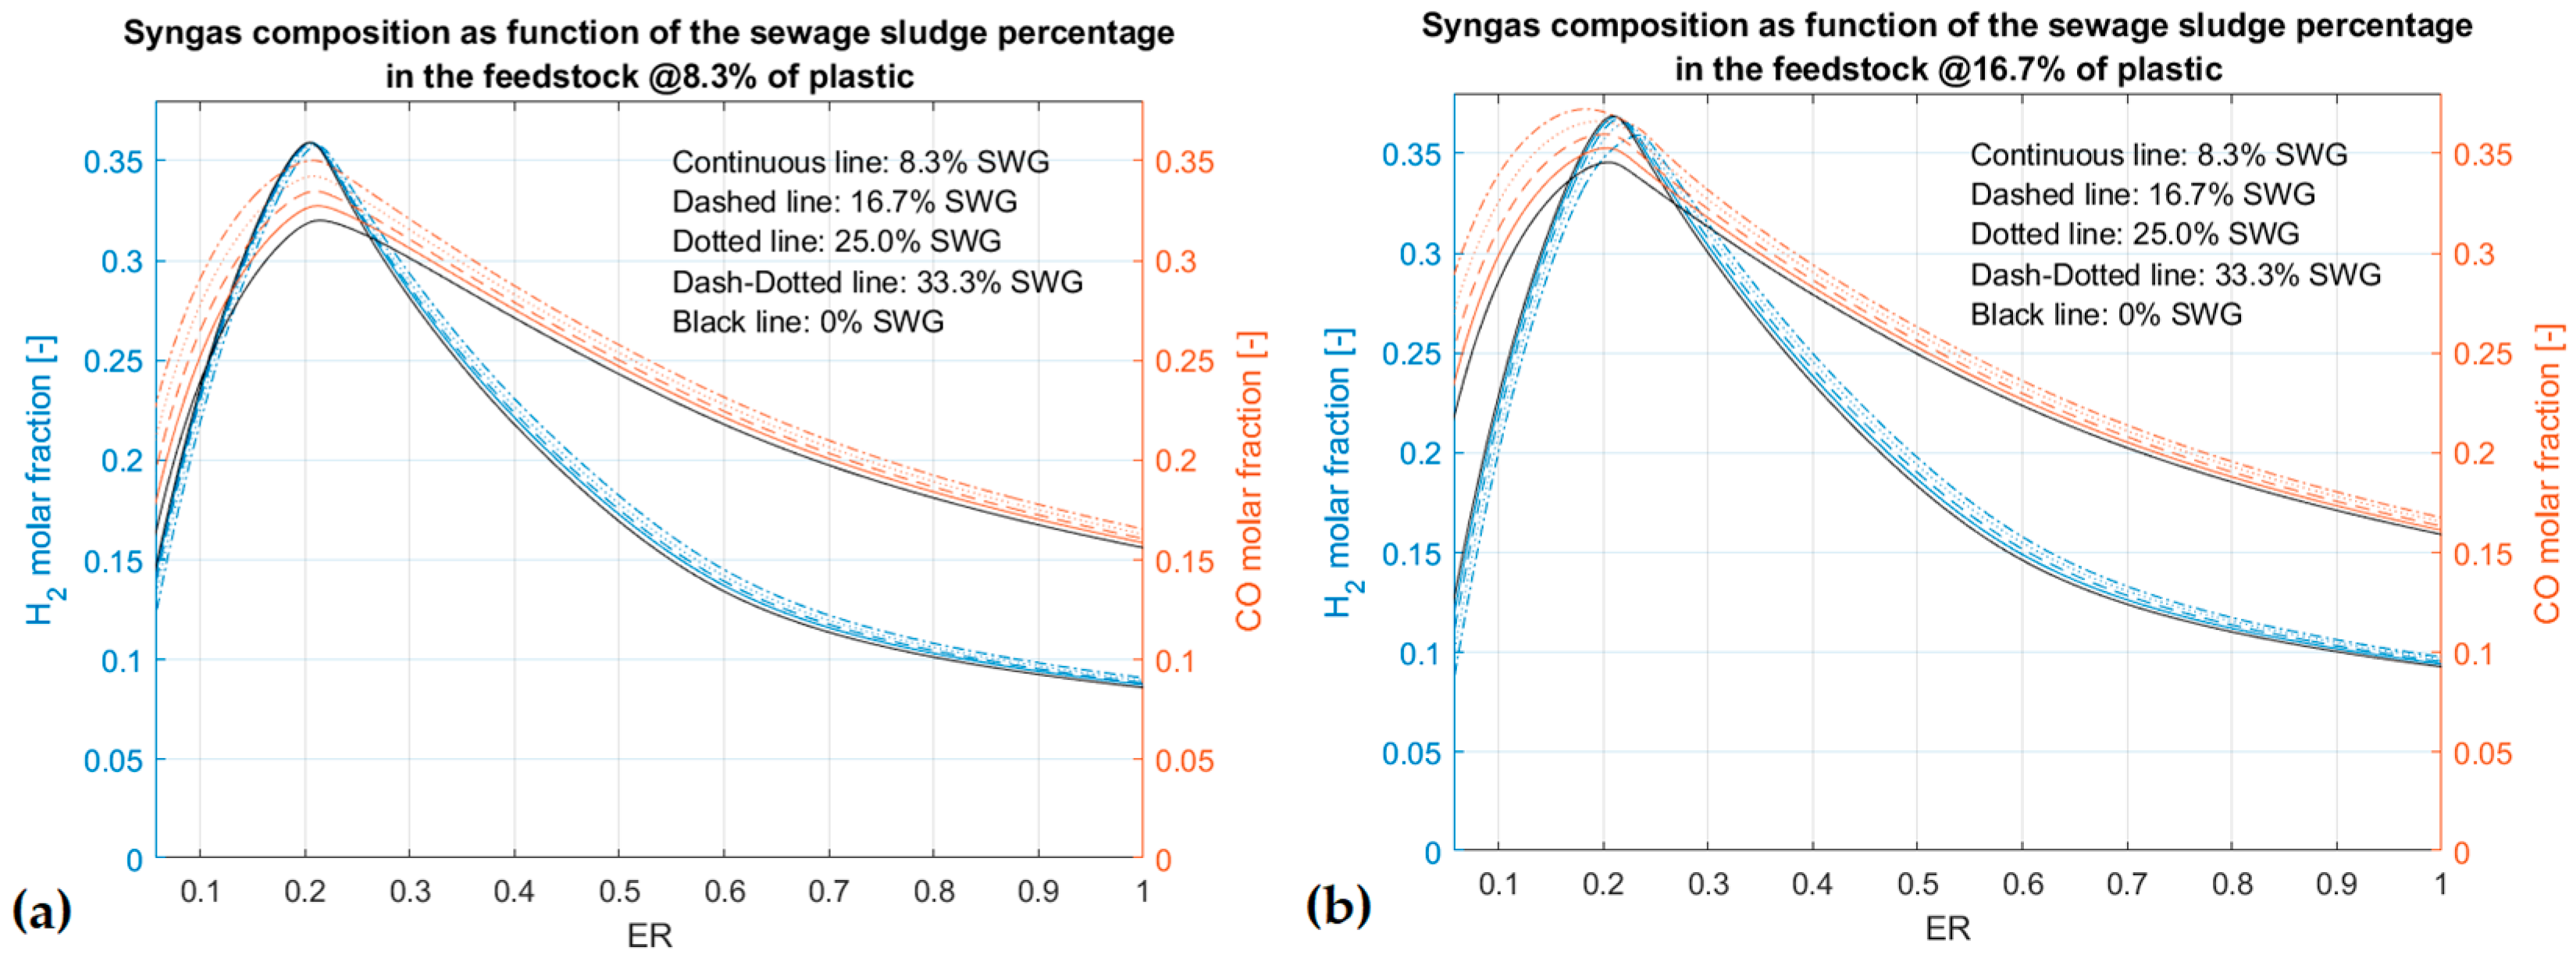
5. Results and Discussions


6. Conclusions
Author Contributions
Funding
Acknowledgments
Conflicts of Interest
Abbreviations
| ER | Equivalence Ratios |
| ICP | Inductively Coupled Plasma |
| IMO | International Maritime Organization |
| LHV | Lower Heating Value (kJ/mol) |
| PAWDS | Plasma Arc Waste Destruction System for Land |
| PFD | Process Flow Diagram |
| Pel | Electrical Power Provided to the Excitation Coils of the ICP Generator |
| ηel | Average Electric Power Plant Efficiency |
| WTE | Waste to Energy |
| ZnO | Zinc Oxide |
References
- Parks, M.; Ahmasuk, A.; Compagnoni, B.; Norris, A.; Rufe, R. Quantifying and mitigating three major vessel waste streams in the northern Bering Sea. Mar. Policy 2019, 106, 103530. [Google Scholar] [CrossRef]
- Kwortnik, R.J. Shipscape influence on the leisure cruise experience. Int. J. Cult. Tour. Hosp. Res. 2008, 2, 2289–2311. [Google Scholar] [CrossRef] [Green Version]
- Argüello, G. Environmentally sound Management of Ship Wastes: Challenges and opportunities for European ports. J. Shipp. Trade 2020, 5, 1–21. [Google Scholar] [CrossRef]
- Agamuthu, P.; Mehran, S.B.; Norkhairah, A.; Norkhairiyah, A. Marine debris: A review of impacts and global initiatives. Waste Manag. Res. 2019, 37, 987–1002. [Google Scholar] [CrossRef]
- Sweeting, J.E.N.; Wayne, S.L. A shifting tide: Environmental challenges and cruise industry responses. In Cruise Ship Tourism; CABI: Wallingford, UK, 2006; ISBN 1845930487. [Google Scholar]
- To, N.T.; Kato, T. Solid waste generated from ships: A case study on ship-waste composition and garbage delivery attitudes at Haiphong ports, Vietnam. J. Mater. Cycles Waste Manag. 2017, 19, 988–998. [Google Scholar] [CrossRef]
- Sanches, V.M.L.; da Aguiar, M.R.C.M.; de Freitas, M.A.V.; Pacheco, E.B.A.V. Management of cruise ship-generated solid waste: A review. Mar. Pollut. Bull. 2020, 151, 110785. [Google Scholar] [CrossRef]
- Cerveny, L.K.; Miller, A.; Gende, S. Sustainable cruise tourism in marine world heritage sites. Sustainability 2020, 12, 611. [Google Scholar] [CrossRef] [Green Version]
- Klein, R.A. Responsible cruise tourism: Issues of cruise tourism and sustainability. J. Hosp. Tour. Manag. 2011, 18, 107–116. [Google Scholar] [CrossRef] [Green Version]
- Carić, H.; Mackelworth, P. Cruise tourism environmental impacts—The perspective from the Adriatic Sea. Ocean Coast. Manag. 2014, 102, 350–363. [Google Scholar] [CrossRef]
- Galloway, T.S. Micro- and nano-plastics and human health. In Marine Anthropogenic Litter; Springer Nature: London, UK, 2015; ISBN 9783319165103. [Google Scholar]
- International Maritime Organization. Guidelines for Formal Safety Assessment (FSA) for Use in the IMO Rule-making Process; International Maritime Organization: London, UK, 2002. [Google Scholar]
- Wilhelmsson, D.; Thompson, R.C.; Holmström, K.; Lindén, O.; Eriksson-Hägg, H. Marine Pollution. In Managing Ocean Environments in a Changing Climate: Sustainability and Economic Perspectives; Elsevier: San Diego, CA, USA, 2013; ISBN 9780124076686. [Google Scholar]
- Faber, J.; Markowska, A.; Nelissen, D.; Davidson, M.; Eyring, V.; Cionni, I.; Selstad, E.; Kågeson, P.; Lee, D.; Buhaug, Ø.; et al. Technical Support for European Action to Reducing Greenhouse Gas Emissions from International Maritime Transport; CE Delft: Delft, The Netherlands, December 2009. [Google Scholar]
- Bungay, V.C. Kinetic study on the pyrolysis and gasification of plastic waste. Chem. Eng. Trans. 2017, 56, 193–198. [Google Scholar]
- Suhrhoff, T.J.; Scholz-Böttcher, B.M. Qualitative impact of salinity, UV radiation and turbulence on leaching of organic plastic additives from four common plastics—A lab experiment. Mar. Pollut. Bull. 2016, 102, 84–94. [Google Scholar] [CrossRef]
- Zhou, H.; Meng, A.; Long, Y.; Li, Q.; Zhang, Y. Classification and comparison of municipal solid waste based on thermochemical characteristics. J. Air Waste Manag. Assoc. 2014, 64, 597–616. [Google Scholar] [CrossRef]
- Sever Akdağ, A.; Atak, O.; Atimtay, A.T.; Sanin, F.D. Co-combustion of sewage sludge from different treatment processes and a lignite coal in a laboratory scale combustor. Energy 2018, 158, 417–426. [Google Scholar] [CrossRef]
- Zhou, H.; Meng, A.; Long, Y.; Li, Q.; Zhang, Y. An overview of characteristics of municipal solid waste fuel in China: Physical, chemical composition and heating value. Renew. Sustain. Energy Rev. 2014, 36, 107–122. [Google Scholar] [CrossRef]
- Ramos, A.; Teixeira, C.A.; Rouboa, A. Environmental assessment of municipal solid waste by two-stage plasma gasification. Energies 2019, 12, 137. [Google Scholar] [CrossRef] [Green Version]
- Rao, L.; Rivard, F.; Carabin, P. Thermal plasma torches for metallurgical applications. In Proceedings of the 4th International Symposium on High-Temperature Metallurgical Processing, TMS 2013 Annual Meeting and Exhibition, San Antonio, TX, USA, 3–7 March 2013. [Google Scholar]
- Vaneeckhaute, C.; Fazli, A. Management of ship-generated food waste and sewage on the Baltic Sea: A review. Waste Manag. 2020, 102, 12–20. [Google Scholar] [CrossRef]
- Iannello, A.; Bertagna, S.; Pozzetto, D.; Toneatti, L.; Zamarini, R.; Bucci, V. Technical and economic and environmental feasibility of an innovative integrated system of management and treatment of waste on board. In Proceedings of the 19th International Conference on Ship & Maritime Research-NAV, Trieste, Italy, 20–22 June 2018. [Google Scholar]
- Ruj, B.; Ghosh, S. Technological aspects for thermal plasma treatment of municipal solid waste—A review. Fuel Process. Technol. 2014, 126, 298–308. [Google Scholar] [CrossRef]
- Mohareb, A.K.; Warith, M.A.; Diaz, R. Modelling greenhouse gas emissions for municipal solid waste management strategies in Ottawa, Ontario, Canada. Resour. Conserv. Recycl. 2008, 52, 1241–1251. [Google Scholar] [CrossRef]
- Lombardi, L.; Carnevale, E.; Corti, A. A review of technologies and performances of thermal treatment systems for energy recovery from waste. Waste Manag. 2015, 37, 26–44. [Google Scholar] [CrossRef]
- Li, J.; Liu, K.; Yan, S.; Li, Y.; Han, D. Application of thermal plasma technology for the treatment of solid wastes in China: An overview. Waste Manag. 2016, 58, 260–269. [Google Scholar] [CrossRef]
- Heberlein, J.; Murphy, A.B. Thermal plasma waste treatment. J. Phys. D Appl. Phys. 2008, 41, 053001. [Google Scholar] [CrossRef]
- Mountouris, A.; Voutsas, E.; Tassios, D. Solid waste plasma gasification: Equilibrium model development and exergy analysis. Energy Convers. Manag. 2006, 47, 1723–1737. [Google Scholar] [CrossRef]
- Minutillo, M.; Perna, A.; Di Bona, D. Modelling and performance analysis of an integrated plasma gasification combined cycle (IPGCC) power plant. Energy Convers. Manag. 2009, 50, 2837–2842. [Google Scholar] [CrossRef]
- Jannelli, E.; Minutillo, M.; Perna, A. Experimental characterization and numerical modeling of PEMFC stacks designed for different application fields. Fuel Cells 2011, 11, 838–849. [Google Scholar] [CrossRef]
- Janajreh, I.; Raza, S.S.; Valmundsson, A.S. Plasma gasification process: Modeling, simulation and comparison with conventional air gasification. Energy Convers. Manag. 2013, 65, 801–809. [Google Scholar] [CrossRef]
- Ismail, T.M.; Monteiro, E.; Ramos, A.; El-Salam, M.A.; Rouboa, A. An Eulerian model for forest residues gasification in a plasma gasifier. Energy 2019, 182, 1069–1083. [Google Scholar] [CrossRef]
- Zhang, Q.; Dor, L.; Biswas, A.K.; Yang, W.; Blasiak, W. Modeling of steam plasma gasification for municipal solid waste. Fuel Process. Technol. 2013, 106, 546–554. [Google Scholar] [CrossRef]
- Indrawan, N.; Mohammad, S.; Kumar, A.; Huhnke, R.L. Modeling low temperature plasma gasification of municipal solid waste. Environ. Technol. Innov. 2019, 15, 100412. [Google Scholar] [CrossRef]
- Gabbar, H.A.; Aboughaly, M.; Ayoub, N. Comparative study of MSW heat treatment processes and electricity generation. J. Energy Inst. 2017, 91, 481–488. [Google Scholar] [CrossRef]
- Tan, S.T.; Ho, W.S.; Hashim, H.; Lee, C.T.; Taib, M.R.; Ho, C.S. Energy, economic and environmental (3E) analysis of waste-to-energy (WTE) strategies for municipal solid waste (MSW) management in Malaysia. Energy Convers. Manag. 2015, 102, 111–120. [Google Scholar] [CrossRef]
- Abdoulmoumine, N.; Adhikari, S.; Kulkarni, A.; Chattanathan, S. A review on biomass gasification syngas cleanup. Appl. Energy 2015, 155, 294–307. [Google Scholar] [CrossRef]
- Young, G.C. Municipal Solid Waste to Energy Conversion Processes: Economic, Technical, and Renewable Comparisons; Wiley: Hoboken, NJ, USA, 2010; ISBN 978-0-470-53967-5. [Google Scholar]
- Gabbar, H.A.; Aboughaly, M.; Damideh, V.; Hassen, I. RF-ICP thermal plasma for thermoplastic waste pyrolysis process with high conversion yield and tar elimination. Processes 2020, 8, 281. [Google Scholar]
- Gabbar, H.A.; Aboughaly, M.; Stoute, C.A.B. DC thermal plasma design and utilization for the low density polyethylene to diesel oil pyrolysis reaction. Energies 2017, 10, 784. [Google Scholar] [CrossRef]
- Arena, U. Process and technological aspects of municipal solid waste gasification. A review. Waste Manag. 2012, 32, 625–639. [Google Scholar] [CrossRef]
- Taylor, N.; Cortes, P. Lessons learnt from ITER safety & licensing for DEMO and future nuclear fusion facilities. Fusion Eng. Des. 2014, 89, 1995–2000. [Google Scholar]


| Type of Waste | Generation Rate | Unit | Drivers |
|---|---|---|---|
| Domestic wastes | 0.001–0.02 | m3/day/person | Number of people and type of products used |
| Food wastes | 0.001–0.003 | m3/day/person | Number of people and provisions |
| Plastics | 0.001–0.008 | m3/day/person | Number of people |
| Operational wastes | 0.001–0.1 | m3/day/person | Number of people and size of ships |
| Sewage | 0.01–0.06 | m3/day/person | Number of people and types of toilets |
| Oily Bilge Water | 0.01–13 | m3/day/GT | Size of the vessel |
| Waste | Solid Wastes | Sewage Sludge | Plastics (Cl-Free) |
|---|---|---|---|
| Proximate analysis (wt.%) | |||
| Moisture | 20.00 | 68.00 | 0.13 |
| Ash | 6.81 | 26.10 | 0.48 |
| Fixed carbon | 11.21 | 5.00 | 0.08 |
| Volatile matter | 81.98 | 68.90 | 99.4 |
| Ultimate analysis (wt.%) | |||
| C | 46.90 | 44.24 | 86.22 |
| H | 6.22 | 6.12 | 12.97 |
| O | 45.44 | 40.39 | 0.73 |
| N | 0.99 | 7.06 | 0.08 |
| S | 0.24 | 2.19 | 0.05 |
| Cl | 0.21 | 0.00 | 0.00 |
| N° | Name of Reaction | Reaction | ΔH (kJ/mol) |
|---|---|---|---|
| (1) | Carbon oxidation | C + O2 → CO2 | −393.65 |
| (2) | Carbon Partial oxidation | C + ½ O2 → CO | −119.56 |
| (3) | Water-Gas reaction | C + H2O ⇄ CO + H2 | +131.2 |
| (4) | Boudouard reaction | C + CO2 ⇄ 2CO | +175.52 |
| (5) | Hydrogasification | C + 2H2 ⇄ CH4 | −74.87 |
| (6) | CO oxidation | CO + ½ O2 → CO2 | −283.01 |
| (7) | H2 oxidation | H2 + ½ O2 → H2O | −241.09 |
| (8) | Water-Gas shift reaction | CO + H2O ⇄ CO2 + H2 | −41.18 |
| (9) | Methanation | CO + 3H2 ⇄ CH4 + H2O | −206.23 |
| Parameter | Description | Value | Unit |
|---|---|---|---|
| Psystem | Pressure in the process | 1 | bar |
| Tdryer | Dryer block temperature | 150 | °C |
| Tpyro | Temperature of the decomposition block | 400 | °C |
| THTZ | Temperature of the high temperature zone | 1500 | °C |
| TLTZ | Average temperature in the low temperature zone | 800 | °C |
| Tspray | Water spraying tower outlet temperature | 450 | °C |
| TH2S | H2S removal system inlet temperature | 400 | °C |
| Tcomb | Average combustion temperature | 1590 | °C |
| Tflue | Flue gas temperature | 150 | °C |
| Pel | Electric power consumption of the single ICP (Inductively Coupled Plasma) generator, power in the excitation coil | 75 | KW |
| Total power consumption of 5 ICP torches | 375 | KW | |
| mair | ICP generator air mass flow rate | 54 | kg/hr |
| f | ICP generator radiofrequency | 13.6 | MHz |
| β | Gas engine compression factor | 11.8 | - |
| Scenario | Description | Mass Flow Rate (kg/hr) | Feedstock Composition |
|---|---|---|---|
| 1 | Solid waste only, mass flow rate varied | 200–450 | 100% SW |
| 2 | Solid waste and sewage sludge, mass flow rate fixed | 300 | 0.0–33.3% SWG 100–67.7% SW |
| 3 | Solid waste and plastics, mass flow rate fixed | 300 | 0.0–16.7% PLS 100–83.3% SW |
| 4 | Solid waste, sewage sludge and plastics, mass flow rate fixed | 300 | 0.0–16.7% PLS 0.0–33.3% SWG 100–50.0% SW |
| z | Average Optimized Plasma Air Mass Flowrate (kg/hr) | Average Optimized Combustion Air Mass Flowrate (kg/hr) |
|---|---|---|
| 1 | 201.1 | 831.8 |
| 2 | 180.5 | 782.2 |
| 3 | 219.7 | 934.3 |
| 4 | 221.3 | 1050.7 |
© 2020 by the authors. Licensee MDPI, Basel, Switzerland. This article is an open access article distributed under the terms and conditions of the Creative Commons Attribution (CC BY) license (http://creativecommons.org/licenses/by/4.0/).
Share and Cite
Gabbar, H.A.; Lisi, D.; Aboughaly, M.; Damideh, V.; Hassen, I. Modeling of a Plasma-Based Waste Gasification System for Solid Waste Generated Onboard of Typical Cruiser Vessels Used as a Feedstock. Designs 2020, 4, 33. https://0-doi-org.brum.beds.ac.uk/10.3390/designs4030033
Gabbar HA, Lisi D, Aboughaly M, Damideh V, Hassen I. Modeling of a Plasma-Based Waste Gasification System for Solid Waste Generated Onboard of Typical Cruiser Vessels Used as a Feedstock. Designs. 2020; 4(3):33. https://0-doi-org.brum.beds.ac.uk/10.3390/designs4030033
Chicago/Turabian StyleGabbar, Hossam A., Davide Lisi, Mohamed Aboughaly, Vahid Damideh, and Isaac Hassen. 2020. "Modeling of a Plasma-Based Waste Gasification System for Solid Waste Generated Onboard of Typical Cruiser Vessels Used as a Feedstock" Designs 4, no. 3: 33. https://0-doi-org.brum.beds.ac.uk/10.3390/designs4030033