Intersection Sight Distance Characteristics of Turbo Roundabouts


1
Department of Civil Engineering, Ryerson University, Toronto, ON M5B 2K3, Canada
2
Transportation and planning, Delft University of Technology (TU Delft), 2628 CD Delft, The Netherlands
3
Department of Civil Engineering, SVNIT Surat, Gujarat 395007, India
*
Author to whom correspondence should be addressed.
Designs 2021, 5(1), 16; https://0-doi-org.brum.beds.ac.uk/10.3390/designs5010016
Submission received: 1 January 2021
/
Revised: 19 February 2021
/
Accepted: 20 February 2021
/
Published: 8 March 2021
Abstract
:A turbo roundabout uses spiral circulatory roads for effectively counteracting the problems faced in modern multilane roundabouts. First developed in 1996, the turbo roundabout has an advantage over the conventional roundabout regarding capacity and safety. Turbo roundabouts are still in the developing phase in North America, but even in the European subcontinent where they exist in large numbers, reliable analytical studies on the critical parameters of roundabout visibility are lacking. Visibility (sight distance) helps to shape the geometry of the intersection and aids in safety. This paper presents the mathematical characteristics of the intersection geometry and intersection sight distance (ISD) of the turbo roundabout. Mathematical formulas are presented for the sight distance from the approaching vehicle to the conflicting-entering and circulating vehicles. The maximum lateral clearances to the conflicting vehicles are derived using mathematical optimization. The developed analytical method is verified graphically using AutoCAD. To assist in practical applications, design aids for the maximum lateral clearance are presented. The presented method and design aids should aid in promoting safety at turbo roundabouts.
1. Introduction
Transportation organizations have been struggling to cope with traffic congestion and delay resulting from conventional signalized and un-signalized intersections. Public resistance initially hindered switching over to these safer options in North America, but it has rapidly progressed in replacing the signalized intersections with small diameter- roundabouts in the last two decades [1]. Roundabouts became popular due to their highly safe traffic operations compared to signalized intersections. They brought advantage in safety, delay, emissions, and fuel savings. In understanding the impacts of roundabouts, numerous research studies have been conducted over time, including performance comparison of turbo and conventional roundabouts [2], single-lane roundabouts [3], safety standards for turbo roundabouts [4], safety at roundabouts with traffic signals [5], turbo roundabouts in comparison to two-lane roundabouts [6], urban scenarios [7], and formulating design principles for turbo roundabouts [8,9].
From the previous studies [10,11], most roundabouts manage traffic operations entirely well on single lanes. However, degradation in safety and capacity standards are reported [12,13] when single-lane roundabouts are converted into multi-lane roundabouts to cater to the increased traffic congestion. The most significant problem with a multilane roundabout is that it has 16 conflict points that ultimately decrease traffic safety. Moreover, the vehicle sideswipe collisions increase at multilane roundabouts compared to single lane roundabouts due to an increase in the curvature of the vehicle path, hence making them more prone to property damage only collisions [14]. In addition, there is a maneuvering problem for drivers who want to exit from the left-hand access lane as they need to change lanes over a very short distance at the roundabout and the situation becomes worse if the roundabout has two exit lanes. Another principal maneuvering problem is that the drivers behind the vehicle near the exit have no idea whether the driver ahead will take an exit or will continue through the roundabout. In addition, there is a problem of inner lane usage that negatively affects roundabout capacity [15]. Other driving behaviour challenges faced at multilane roundabouts are that drivers fail to maintain lane positions in multilane roundabouts and often take exits from the incorrect lane [16].
To address the problems of multi-lane roundabouts, designers have devised many solutions such as flower roundabouts [17], compact-semi-two-lane roundabouts [18], target roundabouts [19], and turbo roundabouts [20]. The best solution for the multi-lane intersection was found with the provision of turbo roundabouts. In turbo roundabouts, a reduction of 40% to 50% was observed for potential accidents, where injuries were decreased by 20% to 30% [21]. In addition, the best type of turbo roundabout is the one with raised traffic lane dividers that further reduce collision rate [15]. In turbo roundabouts, traffic streams flow separately even before the entry into the roundabout, where they occupy separate lanes throughout the roundabout. In addition, traffic flows run separately at the exit from the roundabout [22].
To the authors’ knowledge, analytical modelling of sight distance of turbo roundabouts has not been addressed in the literature. This paper presents the mathematical characteristics of turbo roundabouts and analytical models of the intersection sight distance (ISD) that assist as handy tools during the design compared to the traditional graphical approach. General analytical models for lateral clearance at multi-lane turbo knee roundabouts to the circulatory and entering vehicles are developed. The models are developed for two cases. The first case (Case 1) corresponds to an approaching vehicle at 15 m from the yield line and the second case (Case 2) corresponds to an approaching vehicle at the yield line. The developed method is validated graphically using AutoCAD and its application is illustrated using a numerical example.
2. Geometric Characteristics
2.1. Design of Circulatory Roadway
Turbo Roundabout is a spiral circulatory roadway in which the radius increases after every interval [6]. The interval is defined by the translation axis which is at angle θt from the y-axis, as shown in Figure 1. The study by Murphy [23] suggests that the angle of translation axis should depend on the swept path of the vehicle and should be applied iteratively. The geometry of a knee-type roundabout with an initial radius R1 and a primary translation axis is shown in Figure 2. Note that a knee type roundabout is a regular roundabout, except that it includes a bypass lane. The advantage of the bypass lane is that it offers more capacity in turbo roundabouts since capacity is generally less in turbo roundabouts compared to conventional multilane roundabouts [24]. The procedure of the transition from the turbo-block to turbo roundabout consists of adding a truck-apron and approach legs. By constructing the width of the apron according to the Dutch guidelines, a shift is observed between the inner and outer truck aprons [25,26]. This shift is applied by a constant m. The width of a circulatory roadway is denoted by Wc. In all the given templates of the turbo block including knee-type turbo roundabouts, the value inner radius R1 is defined based on the area of the intersection. The width of circulatory roadway WC depends on the swept path of the vehicle. Using R1, Wc, and m, the radius for other consecutive circles can be formulated. Since 2R2 – 2R1 = Wc + m, the radius of other circles is given by
where R2 denotes the radius of the second consecutive semi-circle with centre n (m), R1 denotes the turbo roundabout initial radius with centre O1 (m), Wc denotes the circulatory roadway width (m), and m denotes the shift between inner and outer apron (m), as shown in Figure 2.
Similarly, the radius of the next semicircle is determined by replacing R2 with R3 and R1 with R2. This process continues to find the next radius and so on. In general, Equation (1) can be generalized as
where Rn denotes the radius of the semicircle of turbo roundabout with centre O1 and Rn+1 denotes the radius of next consecutive semi-circle of turbo roundabout with centre N. From Figure 1 and Figure 2, the coordinates of the new center N are given by
On closely observing the turbo block and turbo roundabout, note that it has many different semi-circles but only two centres O1 and N, where O1 is the centre of all the semi-circles on the right-hand side of the translation axis and N is the centre of all the semi-circles on the left-hand side of the translation axis (Figure 1). The difference between the two centres is approximately equal to half the circulatory roadway width (Wc/2). After laying out the turbo block using Equation (2), the turbo roundabout is carved out by constructing the roundabout legs at the intersection points of the horizontal and vertical axes of the turbo block or at an exactly 90-degree angle along the roundabout, as suggested by Fortuijn [8] and Fortuijn and Hendrik [9].
There are a total of four approaches at the Turbo roundabout with a bypass lane at Approach 2. The width of the circulatory roadway is Wc and the width of the approach road is W1. In addition, there is a median of width Wm separating the flow of the traffic. The two-lane knee type turbo multilane turbo roundabout consists of a total of five semicircles, the radius and centre of which goes on changing with each rotation at the translation axis.
2.2. Intersection Sight Distance
Intersection sight distance is the distance which a driver, having no right of way, needs to see and then safely react to the conflicting vehicle. Intersection collisions are mainly caused by inadequate sight distance at intersections. For ISD, a clear view of traffic is provided for the approaching vehicle at the intersection to enable the driver to perceive and react to the acceptable gap. The required sight distance at roundabouts is achieved using a sight triangle. The sight triangle is provided and checked at the entry point of each leg of the intersection.
Intersection sight distance should be measured using a driver height and an object height of 1.080 m, as stated by the American Association of State Highway and Transportation Officials [27]. In addition, ISD should be calculated for a particular critical time. The critical time is defined as the minimum time interval in the vehicle stream that a minor street driver is ready to accept for crossing or entering the major stream conflict zone [28].
In traditional and turbo roundabouts, the vehicle entering the roundabout at any of the approaches must yield for the vehicles in the circulating stream, which makes the entering leg as a minor street and the circulating stream as a major stream conflict zone. For roundabouts, the sight distance triangle is checked for the conflicting-circulating and entering vehicles. The sight distance of the approaching vehicle is checked at two different positions for each of the above-mentioned cases. The first position is when the approaching vehicle is 15 m from the yield line and the second position is when the approaching vehicle is at the yield line [29]. The distance travelled during the critical time is given by
where D1 denotes the sight distance of the sight triangle corresponding to the conflicting-circulating vehicle (m), tc denotes the critical time (s), Vc denotes the speed of the conflicting-circulating vehicle (km/h), D2 denotes the sight distance of the sight triangle corresponding to the conflicting-entering vehicle (m), and Ve denotes the speed of the conflicting-entering vehicle (km/h).
D1 = 0.278 tc Vc
D2 = 0.278 tc Ve
As per NCHRP [16] and AASTHO [27], the critical time for multilane roundabouts should be taken as 5 s. A study by Guerrieri et al. [30] suggested a critical time for turbo roundabouts between 4.03 s and 5.48 s. This range was determined using traffic sample data at a real turbo roundabout and was found to be consistent with previous studies. In this paper, a value of 5 s for critical time was used, which is the recommended value by both AASTHO [27] and NCHRP [16]. The sight triangle consists of the sightline from the approaching vehicle to the conflicting vehicle, the line from the approaching vehicle to the conflict point, and the line on the vehicle path from the conflict point to the conflicting vehicle.
In the case of multiple lanes, each lane has an approaching vehicle and two sightlines to the conflicting-circulating and entering vehicles are considered. Out of these two sightlines, the sightline that requires more area is selected for design purposes. The sightline from the approaching vehicle to the conflicting vehicle is needed for calculating the lateral clearance. According to the Roundabout Information Guide [16], it is recommended not to provide more than the required lateral clearance. The reason is that excessive intersection sight distance can lead to higher vehicle speeds and thus affects roundabout safety. This can be achieved through landscaping tools such as planting trees along the sightline.
3. Assumptions and Procedures
Analytical models for the conflicting-entering and circulating vehicles are developed and will be graphically verified. The following assumptions were made in developing the models:
- The centre of the turbo roundabout arcs on the right side is O1 (Figure 2).
- The approach legs are intersecting the turbo roundabout exactly at a 90-degree angle.
- The critical time tc for ISD is 5 s.
- The distance from the front end of the vehicle and the driver’s eye is assumed to be 2.43 m.
The procedure for developing ISD models for the turbo roundabout involves the following steps (see Figure 3):
- Choose the type of turbo roundabout and determine its initial parameters.
- A swept path and speed analyses of the design vehicle are carried out. If the analyses do not satisfy the swept path or speed requirements, redesign the parameters.
- Once the initial radius and translation axis have been defined, develop the radii of other consecutive semi-circles.
- To analyse ISD, determine the coordinates of the centre of the arcs on the left and right sides of the translation axis. The coordinates of right side semicircles are assumed to be at the origin.
- Determine the coordinates of the approaching vehicle when it is at 15 m from the yield line (Case 1) and when it is at the yield line (Case 2).
- Determine the coordinates of the conflict point. These coordinates are important because they are needed to determine the coordinates of the conflicting-circulating and conflicting-entering vehicles.
- Determine the coordinates of the conflicting-circulating and conflicting-entering vehicles by calculating the distance travelled by the vehicle during the critical time from the conflict point following the vehicle movement trajectory.
- Determine the equation of the sightline using the coordinates of the approaching vehicle and those of the conflicting-circulating or the conflicting-entering vehicle. Then, develop an equation for the lateral clearance.
4. Sight Distance Model: Conflicting-Circulating Vehicle
Following the procedures of Easa [31], the sight distance for the approach is determined at 15 m from the yield line (Lmin). As shown in Figure 4 for the approaching vehicle, the driver eye from the yield line is Point a. From this point, the vehicle will move toward the center of the entry lane W1 so that it can comfortably take turn either to the inner or the outer circulatory lane of width WC. This center of the lane is Point e. There is a median separating the entry and exit lanes, and the center of the median intersects with R5 Point z. The width of the median is Wm. Interestingly; the nature of the turbo roundabout is such that the y-axis exactly passes through the center off the median. For the circulating vehicle, the distance from the driver’s eye to the outer edge of the circulatory roadway is denoted as A2 and for the approaching vehicle, the distance from the driver’s eye to the outer edge of the median is denoted as A1, as shown in Figure 4.
4.1. Coordinates of Conflict Point
Consider first Case 1, where the approaching vehicle is located 15 m before the yield line. To determine the coordinates of the conflict point and the approaching vehicle, the coordinates of Point e (xe,ye ) are first determined as
where R5 denotes the radius of the outer semi-circle of the roundabout with O1 as a center, Wm denotes the width of median, and W1 denotes the width of the entry lane. The coordinates of the approaching vehicle are given by
where A1 denotes the distance between the driver eye and outer edge of the median and Lmin denotes the distance from the yield line (15 m).
To find coordinates of Point c; let us denote coordinates of Point c be (xc,yc) As Point c lies on the extension of the line ae and both ae and ac have the same slopes, the equation of line ac in terms of xc and yc is given by
where
In addition, since the coordinates (xc,yc) satisfy the equation of a circle of radius (R5-A2) with the centre O1 (0, 0), the equation of this circle is given by
Since the conflict Point c lies on both the circle and the straight-line ac, xc and yc can be determined by solving for their point of intersection as follows. Substituting for xc from Equation (11) into Equation (13), then
Converting Equation (14) into a quadratic form in terms of yc, then
This is a quadratic equation in yc, which is written as
where
Solving Equation (16) gives
The solution for yc gives two values, and only the feasible value is used for further analysis. Substituting for yc from Equation (20) into Equation (13), the xc is then given by
4.2. Coordinates of the Circulating Vehicle
To determine the coordinates of the circulating vehicle, the position of the circulating vehicle is first determined using Equation (3). Using this equation, the total distance (SSD travelled by the vehicle in tc) is obtained. The total SSD can be divided into three parts (d1, d2, d3) as depicted in Figure 4, where d3 is the distance travelled by the vehicle between Points s and c, d2 is the distance travelled by the vehicle between Points k and s, and d1 is the distance covered by the vehicle between Point k and the front end of the conflicting-circulating vehicle. The total distance D1 = d1 + d2 + d3. Since D1, d2, and d3 are known, then d1 is given by
To determine θ3, from the triangle O1cz
where . Determine the coordinates of Point b, given by
Thus, the coordinates of Point b are given by
For Case 2 (approaching vehicle at yield line), only the coordinates of the approaching vehicle change. The equations of the coordinates of the conflict point and those of the circulating vehicle do not change as they are independent of the coordinate value of the approaching vehicle. The only parameter that will vary is the lateral clearance. As the vehicle approaches the yield line, there is a certain distance between the front end of the vehicle and the driver’s eye, de, which is assumed to be equal to 2.43 m [31]. In addition, the vehicle is assumed to be at the centre of the inner lane when at the yield line, so Point a overlaps with Point e when the vehicle is at the yield line. Thus, the coordinates of the approaching vehicle (xa,ya) are given by
4.3. Lateral Clearance Formulation
4.3.1. General Lateral Clearance
The lateral clearance is the clear distance required to be maintained between the line of sight and the outer circular edge of the truck-apron to provide a mutual unobstructed view of the approaching vehicle and the conflicting vehicle.
The formulation of the lateral clearance depends on the coordinates of the approaching and conflicting-circulating vehicles both of which are determined using Equations (9), (10), (26), and (27). In Figure 4, considering an arbitrary Point f on the edge of the truck apron (xf, yf), Point g is determined where line ab intersects nf. Now that the points are set, the lateral clearance (Cf) is equal to the distance gf, which is given by
where
4.3.2. Maximum Lateral Clearance
Note that Point f is variable, and the coordinates of Point g depend on the coordinates of Point f. To determine the maximum clearance Cf(Max), Point f is considered as a variable and the maximum lateral clearance is obtained using mathematical optimization with the Microsoft Excel add-in tool Solver software. The optimization model for determining the maximum lateral clearance is given by
Maximize Z = Cf
Subject to dL < df < dU, where df denotes the distance of Point f on the edge of the truck apron (decision variable), dL and dU denote the arbitrary lower and upper limits of the decision variable df, which covers the possible range of the lateral clearance.
5. Sight Distance Model: Conflicting-Entering Vehicle
5.1. Coordinates of Entering Vehicle
Consider first Case 1, where the approaching vehicle is located 15 m before the yield line. Point a denotes the driver’s eye in the approaching vehicle. b2 is the point which lies at such a distance as travelled by the entering vehicle during the critical time tc from the conflict Point c. Cf2 is the lateral clearance distance required for ISD for the conflicting-entering vehicle. z1 is the point (not shown in the figure) which is the center of the bypass lane with radius Rbypass. The total sight distance D2 from the conflict Point c to b2 is given by
where d6 denotes the distance covered by vehicle from b2 to q, d5 denotes the distance covered by vehicle from q to p′, d4 denotes the distance covered by vehicle from p′ to k, d3 denotes the distance covered by vehicle from s to c, and d2 denotes the distance covered by vehicle from k to s, as shown in Figure 5. Therefore, the distances d2, d3, d4 are determined as
where and is given by Equation (24). To determine d5, the coordinates of p and q are needed. The coordinates of p are given by
The coordinates of q are given by
Using Equations (38)–(41), the distance between Points p and q is obtained as
The coordinates of z1 are
Similarly using Equations (38)–(41) and (43), the distance between Points p and z1 and between Points q and z1 is given by
From the three distances , , and of triangle pqz1, the angle θ5 is determined as
The entering vehicle travels along the straight portion b2q and then accelerates at the curve qp with center z1. However, before the vehicle reaches p, it reverses the curvature and tends to move along a curve around the center n. Thus, instead of touching p, it crosses Point p′ and thus the trajectory of the vehicle will be along b2-q-p′-k-s-c, as shown in Figure 5. Locating the exact position of Point p′ mathematically is quite cumbersome. Therefore, for practical purposes and to maintain simplicity, p′ is assumed to coincide with p. Thus, and . Then, the curved distance along qp′ (Figure 5) is given by
As the distance pp′ is negligibly small, θ5 can also be simply but less precisely determined by considering as a circular arc of radius qz1 and drawing the right bisector of the chord qp:
D2 = dcir + d + dentry
We have already found d2, d3, d4 and d5. Now, we must find d6. As per Easa et al. [32], dcir denotes the distance along circulatory path, d denotes the distance during deceleration, and dentry denotes the distance along entry curve. Based on Figure 5,
D2 = (d2 + d3 + d4) + d5 + d6
As per Easa et al. [32], depending on the position of the entry vehicle, there are three cases for which D2 can be determined. The first case is when the end of the sight distance leg lies on the circulatory part of the entry path (vehicle b2 lies between Point p′ and c), where the distance D2 is given by
D2 = tc vcir
The second case is when the end of the sight distance leg lies on the deceleration part (vehicle b2 lies between Points q and p′), where the distance D2 is given by
Both of these cases are not relevant to this study because when vehicle b2 lies between Points q and c, the lateral clearance is always negative. This means that, in Figure 5, the distance z1f2 is always greater than the radius of the bypass lane, hence there is no requirement for providing any lateral clearance. The third case is when vehicle b2 lies on the end of the sightline.
The entry part before deceleration (between Points b2 and q) requires calculating the lateral clearance. The distance D2 for the third case is given by
After finding D2 for the third case, the distance d6 is obtained from Equation (50). Hence, the coordinates of b2 are given by
When the approaching vehicle is at the yield line, only the coordinates of this vehicle change. The equations for the coordinates of conflict point and the conflicting-circulating vehicle do not change. In addition, as the vehicle approaches the yield line, there will be a certain distance from the front end of the vehicle and the driver’s eye, de. As previously stated, this distance is assumed to be 2.43 m. Then, the coordinates of the approaching vehicle are given by
5.2. Lateral Clearance Formulation
The equation of lines ab2 and qz1 can be derived as
Solving Equations (58) and (59), the coordinates of Point f2 can be determined as
Now, the lateral clearance is given by
As shown in Figure 5, the lateral clearance Cf2 is measured along the line qz1. By defining the lateral clearance at this location, the sightline can be defined by connecting Point a and the outer end of the lateral clearance Cf2. Thus, the required lateral clearance for the entire sightline is completely defined. In addition, Cff is approximately equal to the maximum lateral clearance and can be implemented along the entire sightline.
6. Model Validation
The proposed analytical ISD models were validated using an application example. The results of the analytical models were compared with those obtained graphically using AutoCAD. Consider a turbo roundabout with initial radius R1 = 10.50 m, Vcir = 30 km/h, width of circulatory road width W1 = 3.19 m, and width of entry lane Wc = 5.15 m. The primary translation axis is at 15 degrees (0.27 radians) with the y-axis. The width of the median Wm = 4.00 m and critical time tc = 5 s. Table 1 shows the input data.
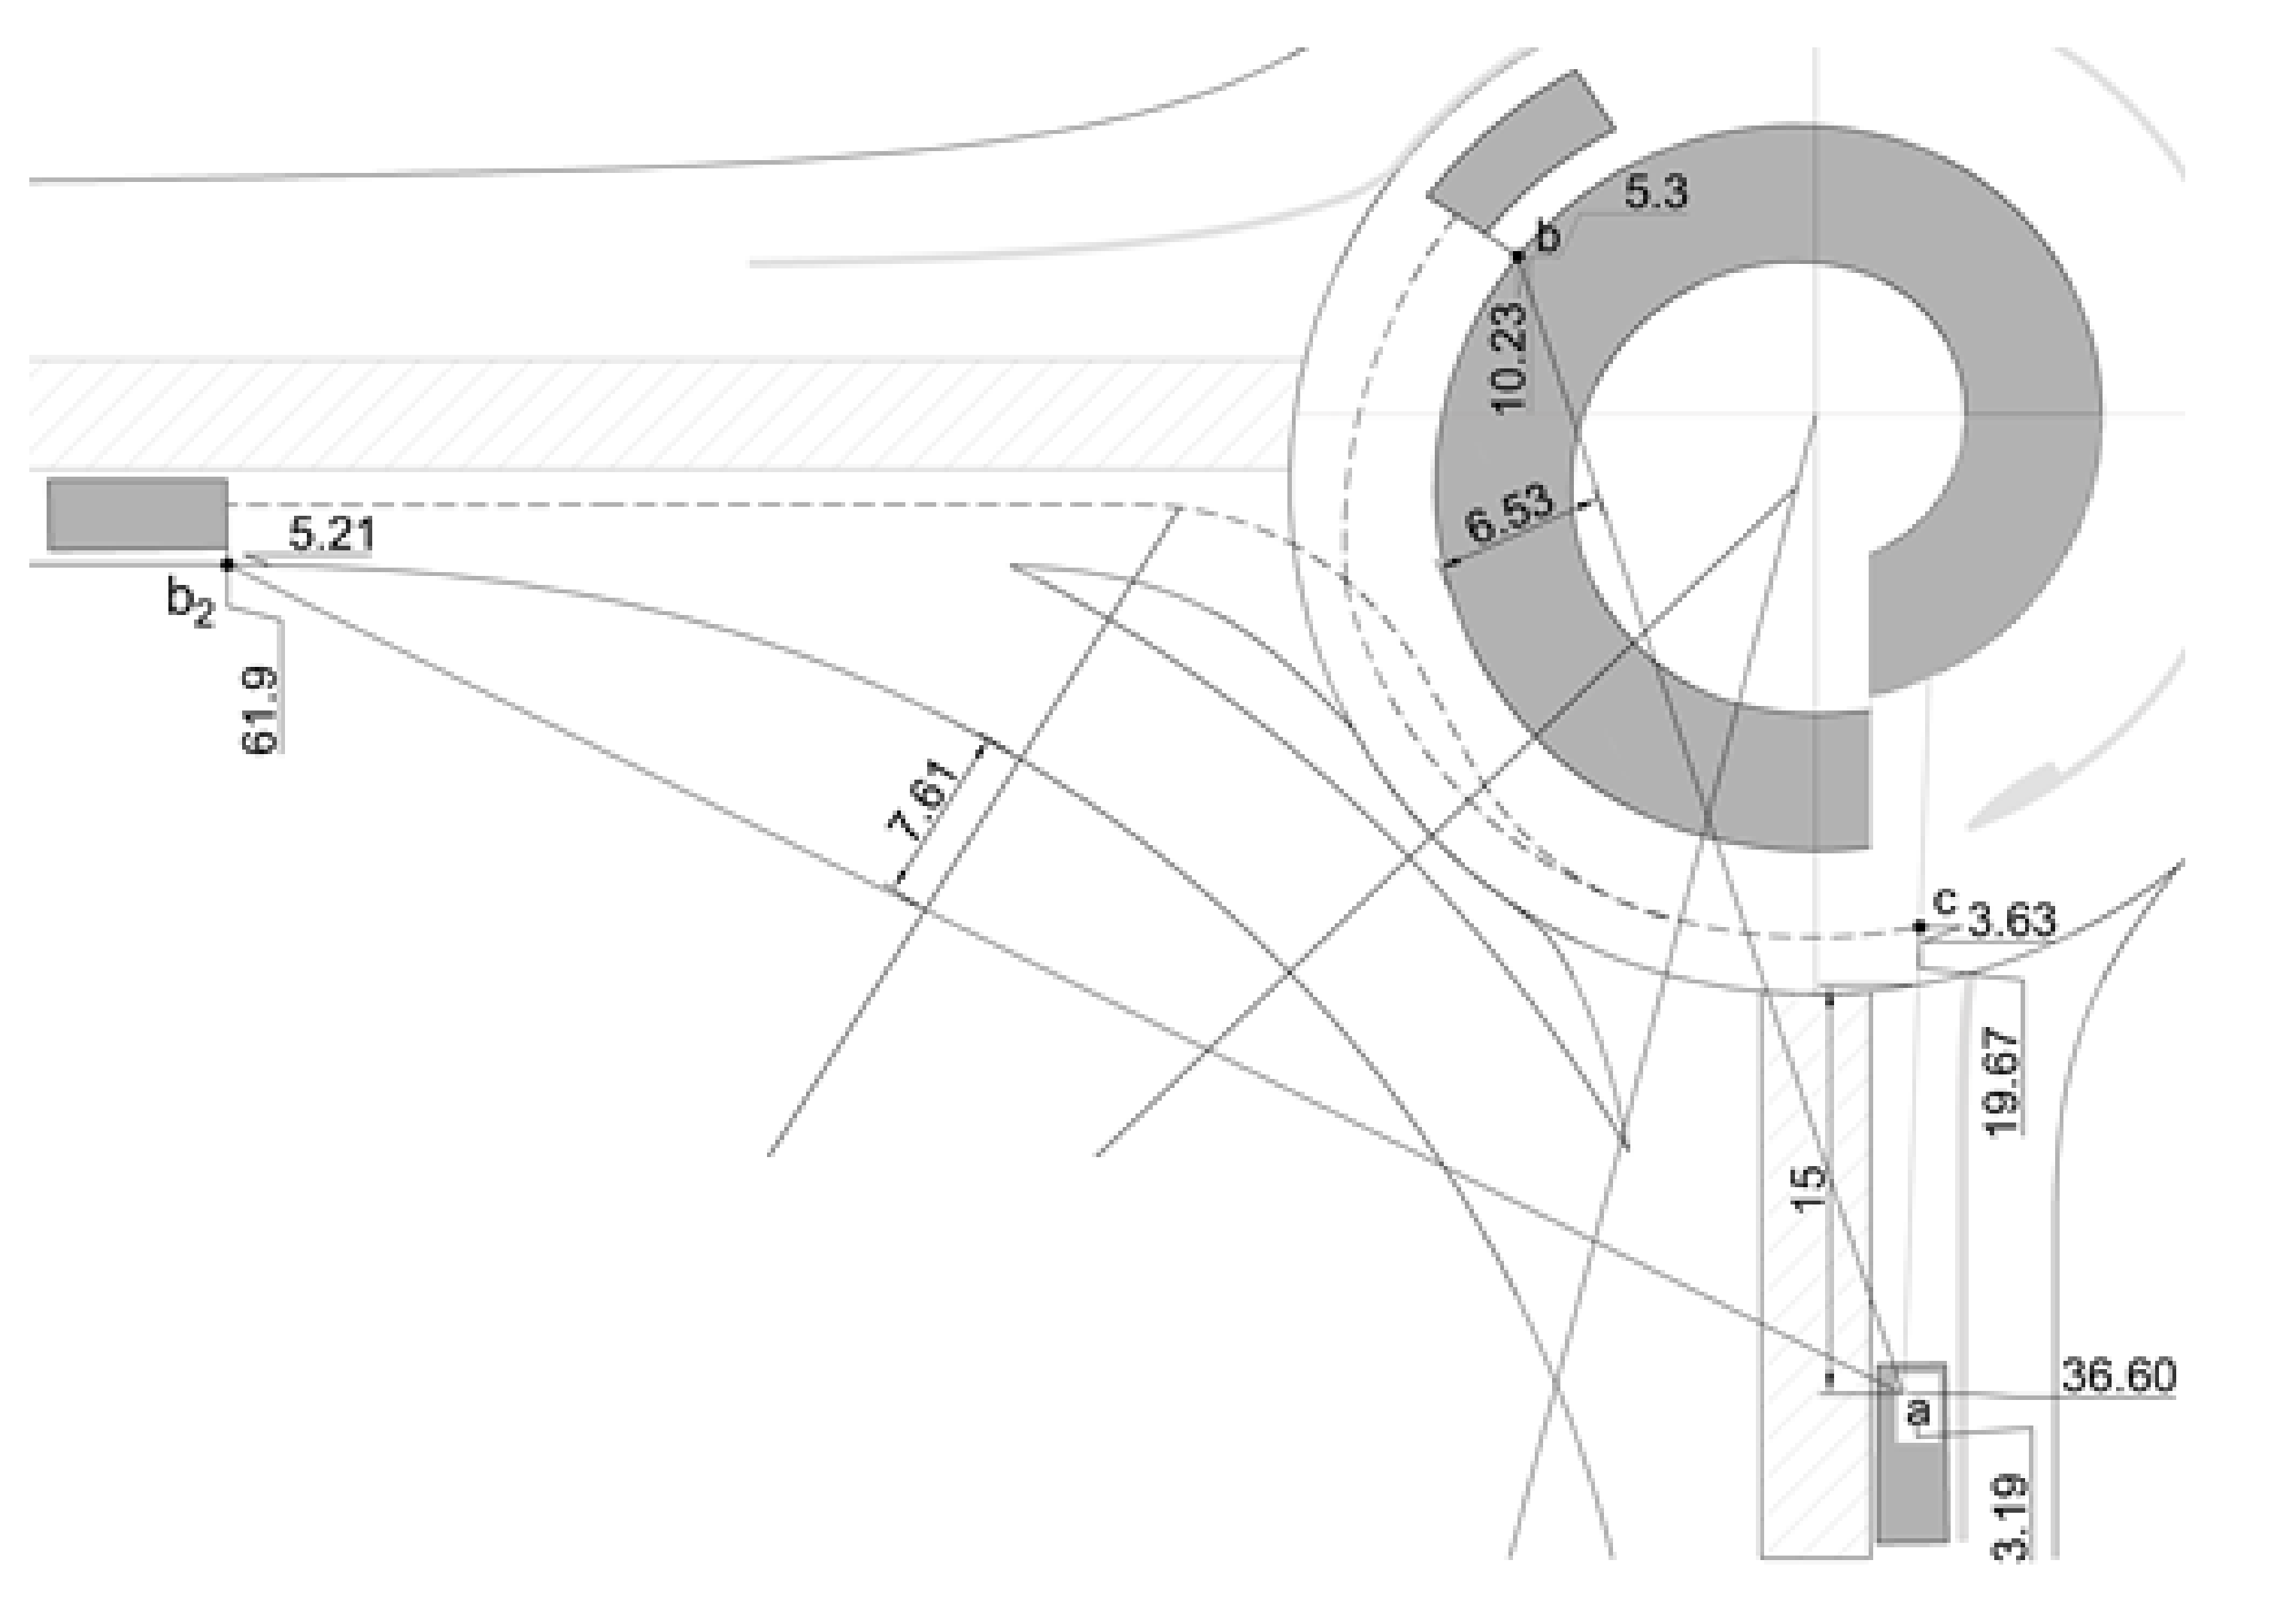
The input data for model validation and application are shown in Table 1. Using the given value of the initial radius R1 = 10.5 m, the width of circulatory road Wc = 5.15 m, and the shift m = 0.43, Equation (2) was used to calculate the subsequent radii as R2 = 13.3 m, R3 = 16.1 m, R4 = 18.9 m, R5 = 21.7 m, and R6 = 24.5 m. For validating the analytical model, the input values were plotted on AutoCAD. The comparison of the analytical and graphical results are shown in Table 2. The analytical results of the application example are obtained using the derived equations, and the results are shown in Figure 6.
It was observed from the above comparison tables that the values calculated using the analytical model closely matche those obtained graphically. The small variation observed for a few parameters is due to the complex mathematics involved.
7. Design Aids
Table 3 shows the required maximum lateral clearance to the conflicting-circulating vehicle for different speeds and radii. Table 4 shows the lateral clearance Cf2 to the conflicting-entering vehicle vehicle for different speeds and radii. Note that the values of lateral clearance of Table 4 are applicable only for Approach 1. For Approach 2 (where there is no bypass lane), the required lateral clearance approximately equals those shown in Table 4 plus half the width of the bypass lane roadway (3.19 m). The required lateral clearance for this approach are shown in Table 5. Note that the range of the circulatory speed is 15 km/h to 30 km/h, according to the literature [30]. As noted in Table 3, the maximum lateral clearance increases when the approach vehicle is at yield line. However, for the conflicting-entering vehicle, the results are the opposite as the lateral clearance decreases when the approach vehicle is at the yield line, as shown in Table 4 and Table 5. The negative values of the lateral clearance in these tables mean that no lateral clearance is required as the sightline lies entirely in the inside of the bypass roadway. For Approaches 3 and 4, the lateral clearance is approximately the same as those for Approach 2 (Table 5) since there is only a minor difference between the radii and centers of the inscribed semi-circles of the respective approaches.
8. Conclusions
Intersection sight distance for knee-type turbo roundabout has been modelled for two key positions of the approaching vehicle. In the study, ISD was analytically formulated by constructing sightlines and sight triangles that help the drivers of the approaching vehicles to see the conflicting vehicles and decide to safely enter the roundabout. The developed analytical model is of a generic nature and can be used for any knee-type turbo roundabout conditions. The model was validated using AutoCAD and its application was illustrated using a numerical example. Based on the present research, a few important insights are provided:
- The results of the present study show that the required lateral clearance for the conflicting circulating vehicle increases when the approaching vehicle is at the yield line compared when the vehicle is 15 m before the yield line at any speed or radius. The reverse is true for the conflicting-entering vehicle.
- Intersection sight distance has been established to increase the safety of turbo roundabouts. However, providing greater sight distances than the required ISD values is not recommended as the collision rate may increase. In this regard, landscaping techniques can be used to restrict the sightlines to only ISD requirements.
- The developed method may be further used in developing safety performance functions or crash modification factors under varying roadway and traffic conditions. A detailed study on calibrating the developed equations along with its robust validation using field conditions may be considered as one of the ways forward to extend this study. In addition, reliability-based performance analysis of the developed method can be performed to improve efficiency and safety of turbo roundabouts.
- This paper has focused on modeling ISD for turbo roundabouts. The presented design aids should be helpful for designers to directly determine the lateral clearance requirements, and as such the paper helps bridge the gap between theory and practice. Future research should address several aspects, including the implications of the findings of this paper for research, practice, and society, and the economic viability of turbo roundabouts. In addition, a comparison of the AASHTO and European Union standards is warranted.
Author Contributions
Conceptualization: S.M.E., A.S.; Methodology: S.M.E., A.S.; Formal analysis: S.M.E., A.S., N.R.; Investigation: S.M.E., A.S., S.A.; Visualization, S.M.E., A.S.; Validation: S.M.E., A.S.; Writing—original draft preparation: S.M.E., A.S., N.R., S.A.; Writing—review and editing, S.M.E., A.S., N.R., S.A.; Supervision and funding acquisition: S.M.E. All authors have read and agreed to the published version of the manuscript.
Funding
This research was financially supported by the Natural Sciences and Engineering Research Council of Canada (NSERC), Grant No. RGPIN-2020-04667.
Acknowledgments
The authors are grateful to four anonymous reviewers for their thorough and most helpful comments. The authors thank Elzbieta Macioszek from the Silesian University of Technology, for her useful comments on an earlier version of the paper. The help of Jaydeep Goyani of SVNIT Surat with the preparation of the manuscript is appreciated.
Conflicts of Interest
The authors declare no conflict of interest. The funders had no role in the design of the study; in the collection, analysis, or interpretation of data; in the writing of the manuscript; or in the decision to publish the results.
Abbreviations
The following notations are used in this paper:
| a | position of approach vehicle |
| A1 | distance between the driver eye and outer edge of the median |
| A2 | distance between the driver eye and outer edge of the roundabout |
| b | position of circulating conflicting vehicle |
| b2 | position of entering conflicting vehicle |
| c | conflict point |
| Cf | lateral clearance for circulating conflicting vehicles |
| Cf2 | lateral clearance for entering conflicting vehicles |
| d | distance during deceleration |
| d2 | distance covered by vehicle from k to s |
| d3 | distance covered by vehicle from s to c |
| d4 | distance covered by vehicle from p′ to k |
| d5 | distance covered by vehicle from q to p′ |
| d6 | distance covered by vehicle from b2 to q |
| dcir | distance along circulatory path |
| dentry | distance along entry curve |
| D1 | sight distance of the sight triangle of the conflicting-circulating vehicle |
| D2 | sight distance of the sight triangle of the conflicting-entering vehicle |
| Lmin | distance from the yield line (15 m) |
| m | shift between inner and outer apron |
| N | centre of all the semi-circles on the left-hand side of the translation axis |
| O1 | centre of all the semi-circles on the right side of the translation axis |
| R1 | turbo roundabout initial radius with centre O1 |
| R2 | radius of the second consecutive semi-circle with centre n |
| R5 | radius of outer semi-circle of roundabout with center O1 |
| Bypass | radius of the bypass lane |
| Rn | radius of the semicircle of turbo roundabout with centre O1 |
| Rn+1 | radius of next consecutive semi-circle of turbo roundabout with centre n |
| tc | critical time |
| Vc | speed of the conflicting-circulating vehicle |
| Ve | speed of the conflicting-entering vehicle |
| Wm | width of median |
| W1 | width of the entry lane |
| Wc | circulatory roadway width |
| Z1 | centre of the radius of bypass lane |
| θT | angular distance between translation axis and y-axis |
References
- Bailey, S. Roundabouts Are Just Another Piece o the Road Becoming Popular in Canada; Toronto Star: Toronto, ON, Canada, 2016. [Google Scholar]
- Eva, P.; Andrea, K. Case study: Capacity characteristics comparison of single-lane roundabout and turbo-roundabouts. Proc. Eng. 2017, 192, 701–706. [Google Scholar] [CrossRef]
- Giuffrè, O.; Granà, A.; Marino, S. Comparing performances of turbo-roundabouts and double lane roundabouts. Mod. Appl. Sci. 2012, 6, 70–79. [Google Scholar] [CrossRef]
- Kieć, M.; Ambros, J.; Bąk, R.; Gogolín, O. Evaluation of safety effect of turbo-roundabout lane dividers using floating car data and video observation. Accid. Anal. Prev. 2019, 125, 302–310. [Google Scholar] [CrossRef]
- Tracz, M.; Chodur, J. Performance and safety roundabouts with traffic signals. Procedia Soc. Behav. 2012, 53, 788–799. [Google Scholar] [CrossRef] [Green Version]
- Engelsman, J.C.; Uken, M. Turbo roundabouts as an alternative to two lane roundabouts. In Proceedings of the 26th Annual Southern African Transport Conference: The Challenges of Implementing Policy, Pretoria, South Africa, 9–12 July 2007. [Google Scholar]
- Corriere, F.; Guerrieri, M. Performance analysis of basic turbo-roundabouts in urban context. Procedia Soc. Behav. Sci. 2012, 53, 622–632. [Google Scholar] [CrossRef] [Green Version]
- Fortuijn, L.G. Turbo roundabouts estimation of capacity. Transp. Res. Rec. 2009, 2130, 83–92. [Google Scholar] [CrossRef]
- Fortuijn, L.G.; Hendrik, G. Turbo roundabouts: Design principles and safety performance. Transp. Res. Rec. 2009, 2096, 16–24. [Google Scholar] [CrossRef]
- Flannery, A.; Elefteriadou, L.; Koza, P.; Mcfadden, J. Safety, delay, and capacity of single-lane roundabouts in the United States. Transp. Res. Rec. 1998, 1646, 63–70. [Google Scholar] [CrossRef]
- Qin, X.; Bill, A.; Chitturi, M.; Noyce, D.A. Evaluation of roundabout safety. In Proceedings of the Transportation Research Board 92nd Annual Meeting, Washington, DC, USA, 3–17 January 2013. [Google Scholar]
- Akçelik, R. Evaluating roundabout capacity, level of service and performance. In Proceedings of the ITE 2009 Annual Meeting and Exhibition, San Antonio, TX, USA, 9–12 August 2009. [Google Scholar]
- Chen, X.; Lee, M.S. A case study on multi-lane roundabouts under congestion: Comparing software capacity and delay estimates with field data. J. Traffic Transp. Eng. (Engl. Ed.) 2016, 3, 154–165. [Google Scholar] [CrossRef] [Green Version]
- Weber, P. Roundabout safety experience. In Proceedings of the Transportation Association of Canada Conference, Saskatoon, SK, Canada, 14–17 October 2007. [Google Scholar]
- Macioszek, E. The road safety at turbo roundabouts in Poland. Arch. Transp. 2015, 33, 2300–8830. [Google Scholar] [CrossRef] [Green Version]
- Rodegerdts, L.A.; Bansen, J.; Tiesler, C.; Knudsen, J.; Myers, E.; Johnson, M.; Moule, M.; Persaud, B.; Lyon, C.; Hallmark, S.; et al. Roundabouts: An Informational Guide; NCHRP Report 672; Transportation Research Board: Washington, DC, USA, 2010. [Google Scholar]
- Tollazzi, T.; Renčelj, M.; Turnšek, S. New type of roundabout: Roundabout with “depressed” lanes for right turning: Flower roundabout. Promet-Traffic Transp. 2011, 23, 353–358. [Google Scholar] [CrossRef] [Green Version]
- Gallelli, V.; Iuele, T.; Vaiana, R. Conversion of a semi-two lanes roundabout into a turbo-roundabout: A performance comparison. Proc. Comput. Sci. 2016, 83, 393–400. [Google Scholar] [CrossRef] [Green Version]
- Tollazzi, T.; Tesoriere, G.; Guerrieri, M.; Campisi, T. Environmental, functional and economic criteria for comparing target roundabouts with one or two-level roundabout intersections. Transp. Res. Part D Transp. Environ. 2015, 34, 330–344. [Google Scholar] [CrossRef]
- Tollazzi, T. Modern types of roundabouts: Trends and future expectations. In Proceedings of the III International Conference on Road Safety, Rome, Italy, 30–31 October 2014. [Google Scholar]
- Mauro, R.; Cattani, M.; Guerrieri, M. Evaluation of the safety performance of turbo roundabouts by means of a potential accident rate model. Baltic J. Road Bridge Eng. 2015, 10, 28–38. [Google Scholar] [CrossRef] [Green Version]
- Tollazi, T.; Zgrablić, T.; Bergoč, J.; Renčelj, M. Comparative analysis of “turbo”, “reduced-turbo”, “flower” and “semi-turbo” roundabout. Teh. Vjesn. 2020, 27, 1410–1417. [Google Scholar] [CrossRef]
- Murphy, T. The turbo roundabout a first in North America. In Proceedings of the Transportation Association of Canada Conference, Charlottetown, PEI, Canada, 27–30 September 2015. [Google Scholar]
- Guerrieri, M.; Corriere, F. Calculation of turbo-roundabouts with slip lanes. Appl. Mech. Mater. 2013, 459, 595–600. [Google Scholar] [CrossRef]
- Džambas, T.; Ahac, S.; Dragčević, V. Geometric design of turbo roundabout. Teh. Vjesn. 2017, 24, 309–318. [Google Scholar]
- Silva, A.B.; Santos, S.; Gaspar, M. Turbo roundabouts use and design. In Proceedings of the 6th Annual Confrence on Planning and Research, Coimbra, Portugal, 17 May 2013. [Google Scholar]
- American Association of State Highway and Transportation Officials. A Policy on Geometric Design of Highway and Streets; AASHTO: Washington, DC, USA, 2018. [Google Scholar]
- Vansconcelos, L.; Silva, A.B.; Seco, Á.; Rouxinol, G. Estimation of Critical Headways at Unsignalized Intersections—A Microscopic Approach. In Proceedings of the 3rd International Conference on Road Safety and Simulation, Indianapolis, IN, USA, 14–16 September 2011. [Google Scholar]
- Easa, S.M. Modeling of unsymmetrical single-lane roundabouts based on stopping sight distance. KSCE J. Civ. Eng. 2018, 23, 800–809. [Google Scholar] [CrossRef]
- Guerrieri, M.; Mauro, R.; Parla, G.; Tollazzi, T. Analysis of kinematic parameters and driver behavior at turbo roundabouts. J. Transp. Eng. Part A Syst. 2018, 144. [Google Scholar] [CrossRef]
- Easa, S.M. Design guidelines for symetrical single lane roundabouts based on intersection sight distance. J. Transp. Eng. 2017, 143, 04017052. [Google Scholar] [CrossRef]
- Easa, S.M.; Ma, Y.; Liu, S.; Yang, Y.; Arkatkar, S. Reliability analysis of intersection sight distance at roundabouts. Infrastructures 2020, 5, 67. [Google Scholar] [CrossRef]
Figure 1.
Design of the circulatory roadway.
Figure 2.
Geometry of the modified turbo roundabout.

Figure 3.
Procedure of ISD analysis of turbo roundabout.
Figure 4.
Geometry of ISD for the approaching and conflicting-circulating vehicles.

Figure 5.
Geometry of ISD of the approaching and conflicting-entering vehicles.

Figure 6.
Model validation.


Table 1.
Input data used for validation.
| Parameter | Value |
|---|---|
| X0 | 0 |
| Y0 | 0 |
| R1 | 10.50 m |
| W1 | 3.19 m |
| m | 0.43 m |
| Wm | 4.00 m |
| WC | 5.15 m |
| A1 | 2.00 m |
| A2 | 1.78 m |
| Lmin | 14.95 m |
| θT | 0.26 (rad) |
| tC | 5 s |
| VC | 30 km/h |
| Ve | 60 km/h |
Table 2.
Results of application example and comparison with graphical results.
| No. | Variable | Symbol | Analytical | Graphical |
|---|---|---|---|---|
| 1 | x-Coordinate of approaching vehicle | xa | 3.19 | 3.19 |
| 2 | y-Coordinate of approaching vehicle | ya | −36.60 | −36.60 |
| 3 | x-Coordinate of conflict point | xC | 3.60 | 3.63 |
| 4 | y-Coordinate of conflict point | yC | −19.64 | −19.67 |
| 5 | x-Coordinate of circulating vehicle | xb | −10.17 | −10.23 |
| 6 | y-Coordinate of circulating vehicle | yb | 5.19 | 5.3 |
| 7 | Lateral Clearance at Point f | Cf | 6.57 | 6.53 |
| 8 | x-Coordinate of entering vehicle | xb2 | −61.83 | −61.9 |
| 9 | y-Coordinate of entering vehicle | yb2 | −5.21 | −5.21 |
| 10 | Lateral Clearance at Point f2 | 7.54 | 7.61 |
Table 3.
Maximum lateral clearance for conflicting-circulating vehicle (in meters).
| VC (km/h) | Approaching Vehicle at | |
|---|---|---|
| 15 m from the Yield Line | Yield Line | |
| (a) R1 = 10.50 m | ||
| 15 | 1.4 | 1.5 |
| 20 | 1.6 | 2.6 |
| 25 | 3.6 | 5.0 |
| 30 | 6.6 | 7.9 |
| (b) R1 = 12.00 m | ||
| 15 | 1.3 | 1.4 |
| 20 | 1.6 | 2.3 |
| 25 | 3.1 | 4.5 |
| 30 | 5.8 | 7.2 |
Table 4.
Lateral clearance Cf2 (m) for conflicting-entering vehicle (Approach 1).
| Speed of Circulating Vehicle, Vc (km/h) | Speed of Entry Vehicle, Ve (km/h) | |||||
|---|---|---|---|---|---|---|
| 40 | 50 | 60 | ||||
| R1 = | R1 = | R1 = | R1 = | R1 = | R1 = | |
| 10.5 m | 12 m | 10.5 m | 12 m | 10.5 m | 12 m | |
| (a) Approaching Vehicle at the Yield Line | ||||||
| 15 | −9.0 | −10.42 | −7.07 | −8.66 | −5.64 | −7.37 |
| 20 | −4.4 | −4.7 | −2.24 | −2.42 | −0.63 | −0.71 |
| 25 | −2.7 | −2.51 | −0.42 | −0.15 | 1.19 | 1.57 |
| 30 | −1.8 | −1.41 | 0.5 | 0.97 | 2.12 | 2.71 |
| (b) Approaching Vehicle 15 m from the Yield Line | ||||||
| 15 | −9.2 | −11.3 | −6.5 | −9.0 | −4.5 | −7.1 |
| 20 | −2.7 | −3.4 | 0.7 | −0.1 | 3.2 | 2.5 |
| 25 | 0.1 | −0.3 | 3.5 | 3.3 | 6.1 | 6.0 |
| 30 | 1.4 | 1.4 | 5.0 | 5.1 | 7.6 | 7.8 |
Table 5.
Approximate maximum lateral clearance (m) for conflicting-entering vehicle (Approach 2).
| Speed of Circulating Vehicle, Vc (km/h) | Speed of Entry Vehicle, Ve (km/h) | |||||
|---|---|---|---|---|---|---|
| 40 | 50 | 60 | ||||
| R1 = | R1 = | R1 = | R1 = | R1 = | R1 = | |
| 10.5 m | 12 m | 10.5 m | 12 m | 10.5 m | 12 m | |
| (a) Approaching Vehicle at the Yield Line | ||||||
| 15 | −7.3 | −8.8 | −5.4 | −7.0 | −4.0 | −5.7 |
| 20 | −2.8 | −3.0 | −0.6 | −0.8 | 0.9 | 0.9 |
| 25 | −1.0 | −0.9 | 1.2 | 1.4 | 2.8 | 3.1 |
| 30 | −0.1 | 0.2 | 2.2 | 2.5 | 3.7 | 4.3 |
| (b) Approaching Vehicle 15 m from the Yield Line | ||||||
| 15 | −7.5 | −9.7 | −4.8 | −7.3 | −2.8 | −5.5 |
| 20 | −1.0 | −1.7 | 2.2 | 1.5 | 4.7 | 4.0 |
| 25 | 1.6 | 1.3 | 5.0 | 4.8 | 7.63 | 7.5 |
| 30 | 3.0 | 3.0 | 6.5 | 6.6 | 9.1 | 9.3 |
Publisher’s Note: MDPI stays neutral with regard to jurisdictional claims in published maps and institutional affiliations. |
© 2021 by the authors. Licensee MDPI, Basel, Switzerland. This article is an open access article distributed under the terms and conditions of the Creative Commons Attribution (CC BY) license (http://creativecommons.org/licenses/by/4.0/).
Share and Cite
MDPI and ACS Style
Salwan, A.; Easa, S.M.; Raju, N.; Arkatkar, S. Intersection Sight Distance Characteristics of Turbo Roundabouts. Designs 2021, 5, 16. https://0-doi-org.brum.beds.ac.uk/10.3390/designs5010016
AMA Style
Salwan A, Easa SM, Raju N, Arkatkar S. Intersection Sight Distance Characteristics of Turbo Roundabouts. Designs. 2021; 5(1):16. https://0-doi-org.brum.beds.ac.uk/10.3390/designs5010016
Chicago/Turabian StyleSalwan, Akshay, Said M. Easa, Narayana Raju, and Shriniwas Arkatkar. 2021. "Intersection Sight Distance Characteristics of Turbo Roundabouts" Designs 5, no. 1: 16. https://0-doi-org.brum.beds.ac.uk/10.3390/designs5010016