1. Introduction
Additive Manufacturing (AM) of metals is of high interest in various industries. While the predominant processes are all powder bed-based, they rely on high investment cost for machines and peripheral equipment [
1]. Additionally, the fine metal powder leads to work safety issues [
2]. Thus, the use of highly filled polymer filaments for fabricating metal parts is a promising low-cost alternative, which eases the entry into metal AM. Extrusion based Additive Manufacturing (EAM) and Fused Filament Fabrication (FFF), are the most common AM techniques across all materials, because they are relatively simple to use and have low investment costs [
3]. For the fabrication of metallic components, a filament with a mixture of metal powder particles and binding agents is used, which is debindered and sintered subsequently [
4,
5,
6,
7,
8,
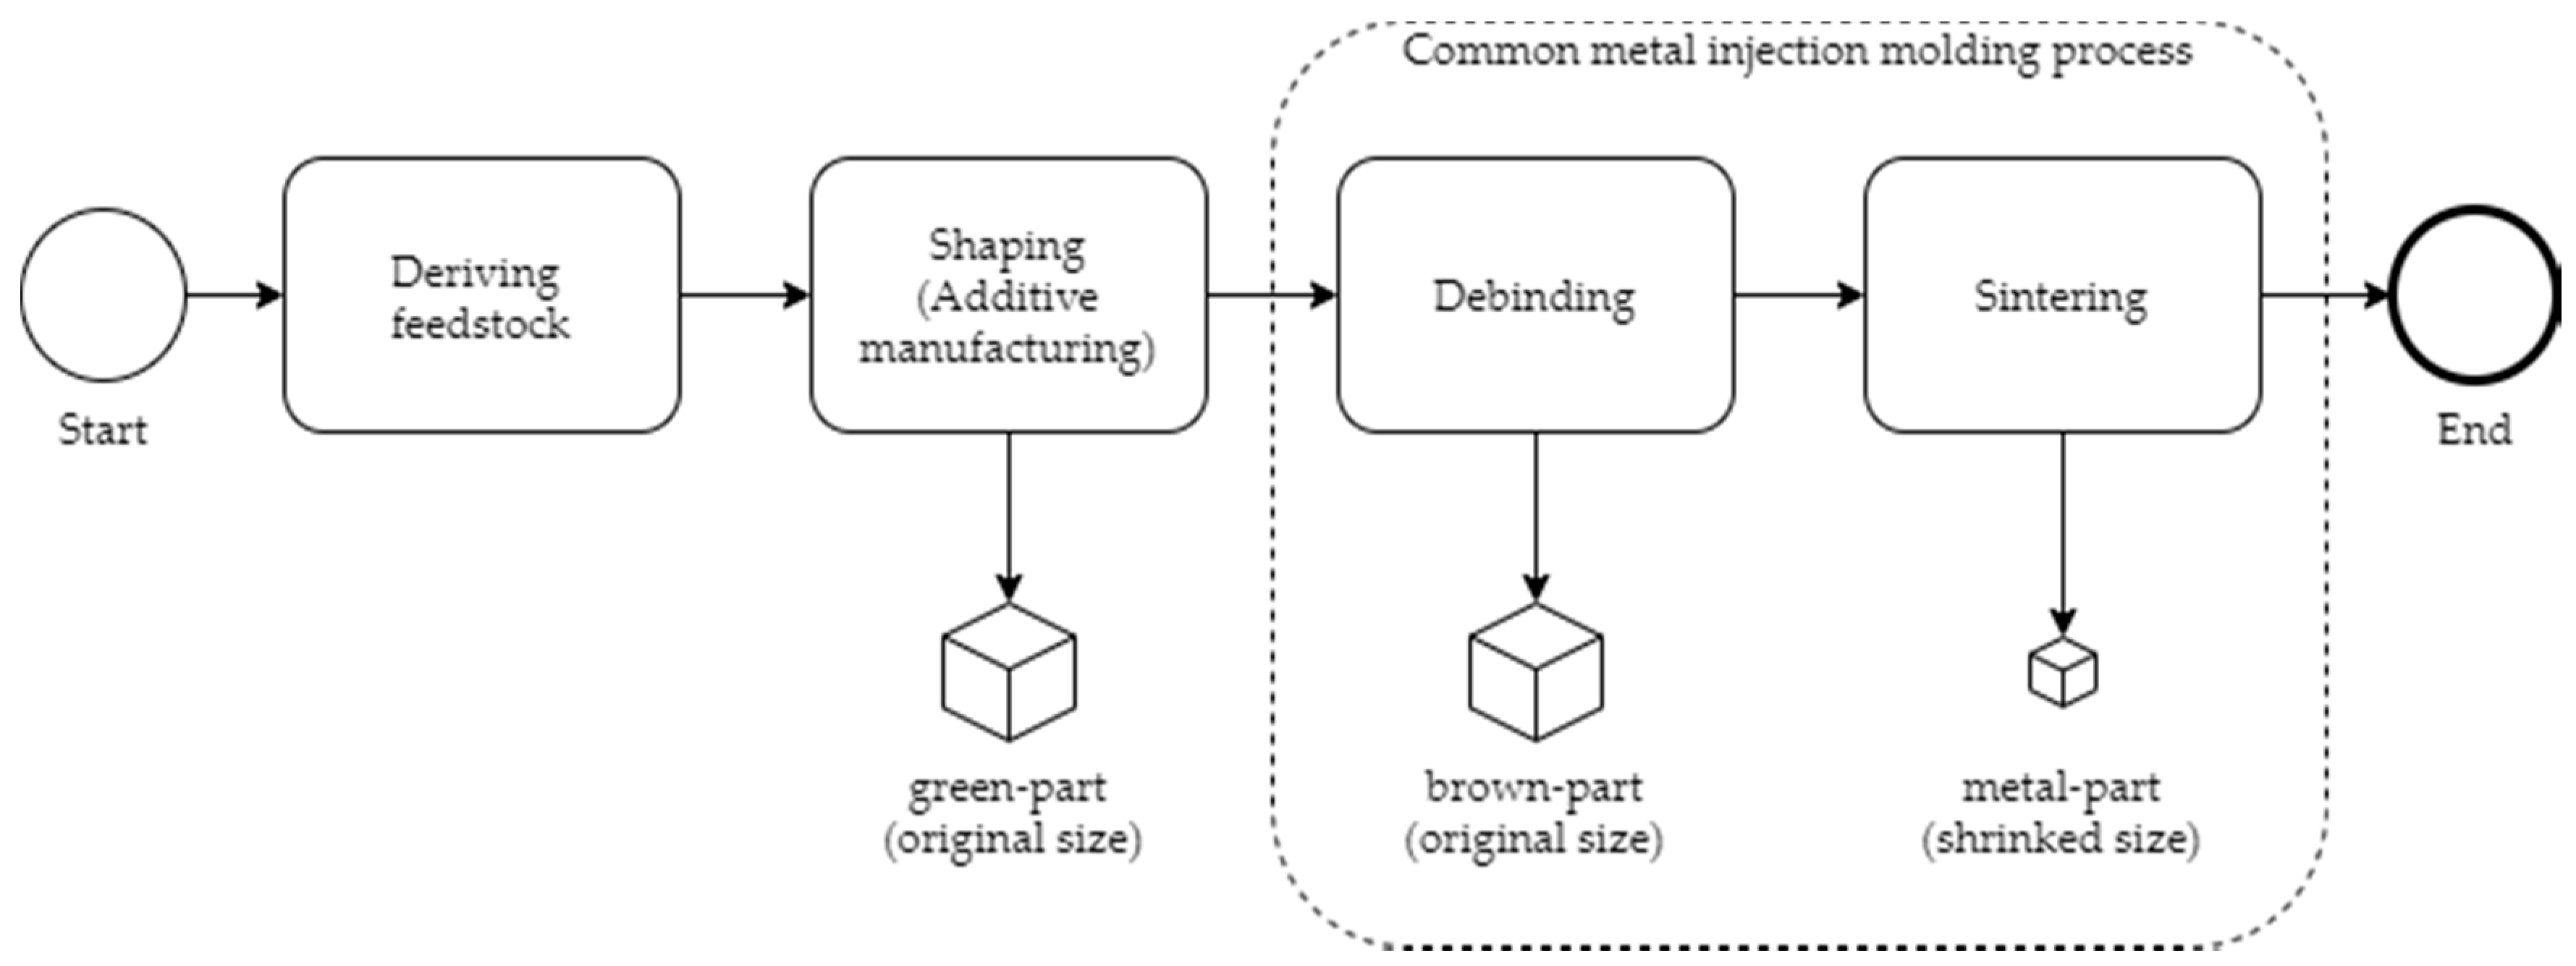
9]. This whole process can be summarized in alignment with [
10] into the four steps of deriving the feedstock, shaping, debinding and sintering and is shown in
Figure 1.
Apart from the shaping step, in which the filament is pushed through a nozzle in a softened form and is deposited layer-wise, this process is analogous to powder injection molding (PIM) [
11]. In the first step, the so-called green-part is fabricated by the layer-wise deposition of the feedstock filament. Its geometry is scaled up to compensate shrinkage during the sintering step. In the following, the majority of the binding agent is removed from the green-part during the debinding step. The debinding can be done either thermal, solvent, or catalytic. It is important that only a backbone of the binding agent remains in the part to ensure its structural integrity. Due to this fact, the part is highly porous and very fragile after the debinding step and is commonly referenced to as the brown-part. These highly porous and brittle brown-parts are solely held together by the binding agent backbone and Van-der-Waal couplings. The final sintering step is a thermal treatment near the powder’s melting point. In this step, several diffusion and rearrangement effects are leading to a densification of the brown-part. The backbone of the binding agent is removed after the first so-called sinter necks to ensure structural integrity. The result is a full metal part with a final density up to 99% of its theoretical maximum value. [
5,
7,
12,
13,
14]
In order to be produced on the machine equipment, the filament must meet various requirements, such as suitable viscous properties. Therefore, the feedstocks commonly have a binding agent content of 35 to 65% by volume [
13,
15,
16]. During the debinding sintering, the binding agent content is removed, and the part is compacted. Consequently, this leads to an overall volume shrinkage in accordance with the binding agent content during the sintering process. Furthermore, it is essential to consider scaling operations when designing models in order to achieve sufficient dimensional accuracy [
14]. Nevertheless, the removal of the binding agent itself during debinding is a critical part of the process, as the resulting brown-parts are highly porous and threaten to collapse due to their dead load. In the field of PIM research, debinding simulations are mostly conducted. The solvent debinding process can be modelled by calculating the extrusion and diffusion rate of the solvable components using the Fick diffusion law, which can be written as
for one-dimensional diffusion, where
is the concentration of the diffusing component,
is the diffusion direction and
is the time [
17]. The thermal debinding process can be simulated using thermokinetic analysis; therefore, a conversion function
can be defined as follows
where
stands for the temperature, and
and
are equivalent to the concentration of the reactant and to the concentration of the product. The conversion function can be expressed by using two functions
that define the temperature dependent rate constant and
for defining the reaction type [
18].
Nevertheless, both simulation methods give no information on the material behavior after debinding nor the structural integrity of the debindered part and also extensive input data has to be acquired for running the simulations. Besides the work in [
19], where stress distributions during debinding are simulated using fluid-structure interaction simulations, stress distribution during debinding or material behavior after debinding are barely considered. This is due to the fact normally, classical PIM applications are produced in very large volumes, and the final geometry and orientation is either determined experimentally or based on experience. These two approaches cannot be applied to metal EAM, since on the one hand, only small batches or even single parts are produced, and on the other hand, the process is too immature to have a broad experience knowledge base [
11].
Consequently, it is desirable to find a suitable part orientation for the debinding of metal EAM parts based on simulations and not on an experimental basis in order to save time and resources during the product development. Therefore, this article addresses a simplified phenomenological approach for the simulation of the debinding process, as provided in simulation guidelines by BASF 3D Printing Solutions for their Ultrafuse 316L metal filament [
20]. In this approach, the parts are solely loaded with their dead load and the occurring stresses are compared to empirical determined stress limits. In addition to the simplified debinding simulation, this article shows the whole simulation process from pre- to postprocessing being automated, so that the debinding process in all six main directions is being simulated and evaluated simultaneously. This leads to insights that allow for considerable conclusions on how to orientate or re-design parts for the metal EAM process. To ensure that this method is widely applicable, this approach is based solely on open-source software and is available at the cited website [
21].
It is the objective of this article to develop an automated open source simulation framework for the simplified debinding simulation presented in [
20]. Additionally, the influence of the finite element order is evaluated. The main goal is to obtain plausible results for arbitrary geometries in a technical context. Therefore, by using the automated simulation framework it is expected to obtain brown-parts without defects or less residual stress. Since it is suspected that a brown-part without defects or with less residual stress is more likely to be successfully sintered, more robust designs for metal EAM can be determined.
2. Materials and Methods
The debinding simulation is exemplary shown for the Ultrafuse 316L metal filament from BASF (Heidelberg, Germany) [
22]. This filament consists of a polyacetal binding system and hence requires a catalytic debinding process [
13] but is easily adaptable to other filament-feedstocks. For the simulation of the debinding process, the guidelines presented in [
23] are used as the basics for the model setup. The processing and meshing steps of the models are done with [
20], while the simulation itself is performed with Z88 [
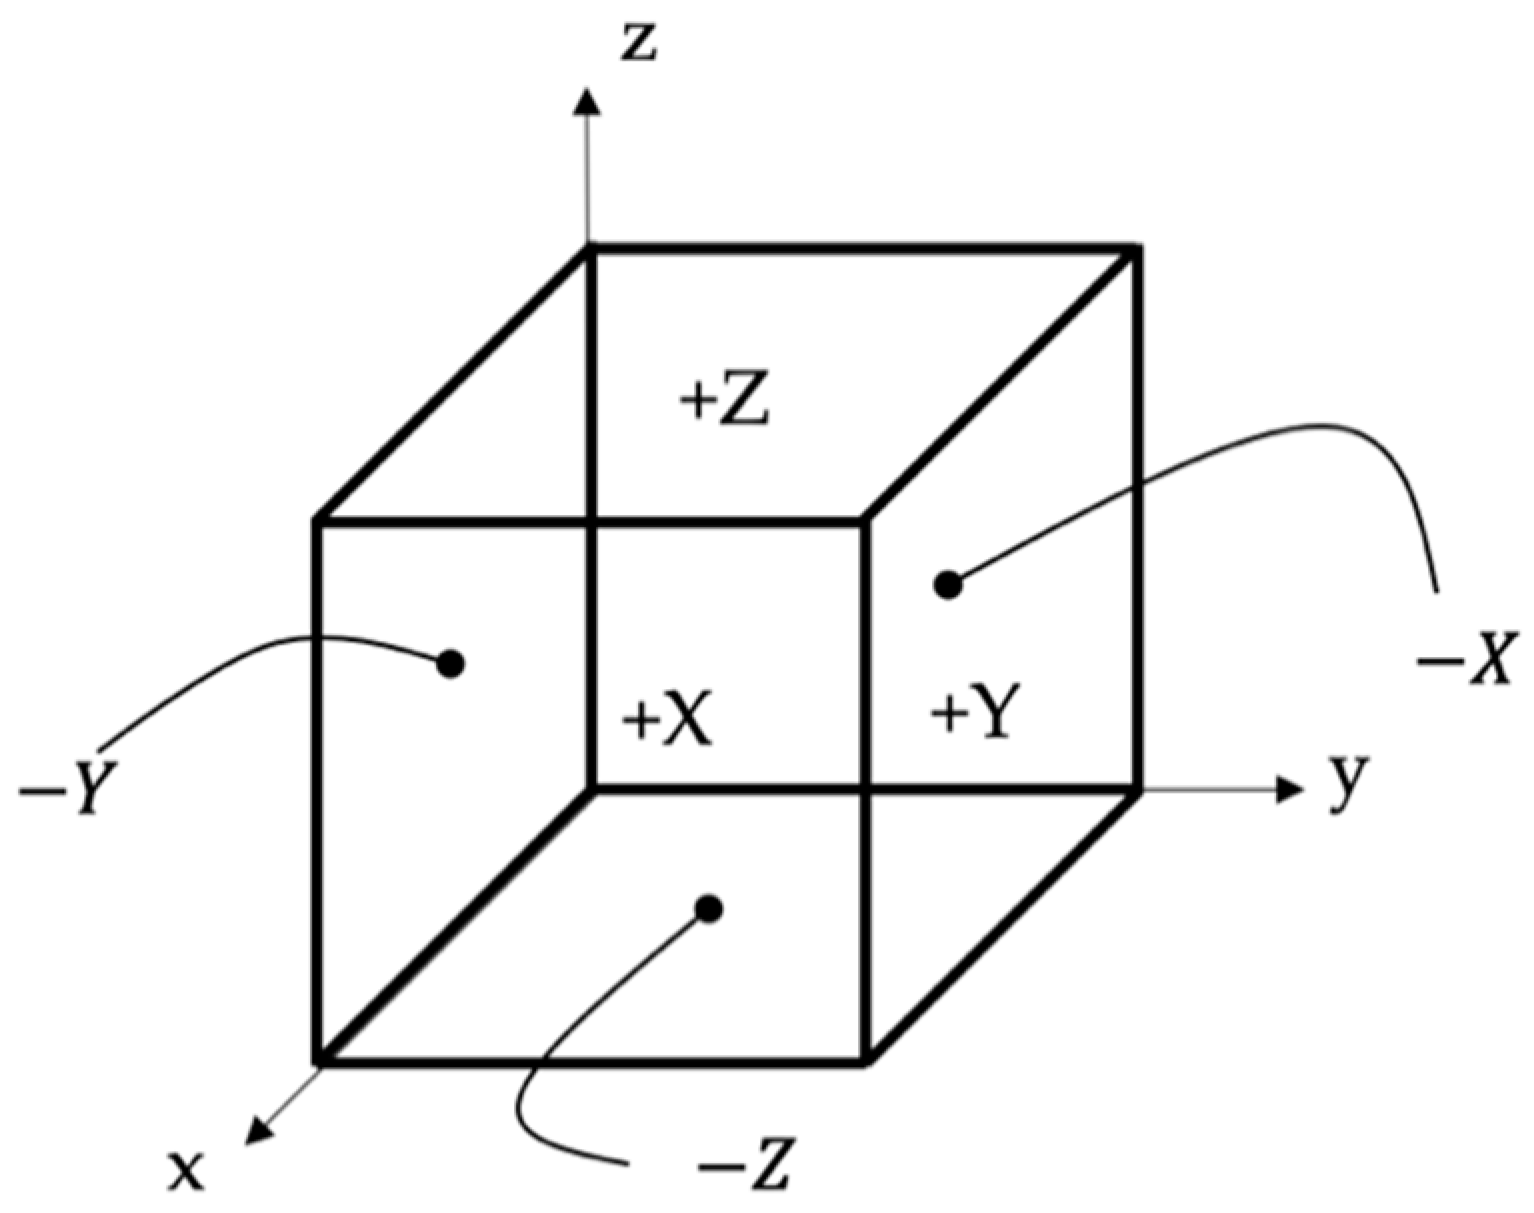
24]. The post-processing is torn out with the python package PyVista [
25]. In order to identify a suitable part orientation for debinding, the part is rotated, so that each of its surface is used as the bottom plane once. This leads to the six orientations
,
,
and
,
,
(
Figure 2).
2.1. Design for Debinding and Sintering
Apart from the design guidelines for EAM in general, it is also important to consider the subsequent debinding and sintering processes when developing applications for metal EAM. Since this contribution focuses on the phenomenological simulation of the debinding process in order to determine the optimal part orientation, the requirements for the sintering process are not specifically addressed. Hence, it is sufficient to be aware that the sinter-induced shrinkage leads to a non-uniform geometry change, which must be considered for a meaningful simulation of the debinding process.
Consequently, scaling is necessary to compensate for the shrinkage that is caused by the densification of the part during the sintering process. The sinter-induced shrinkage is thereby dependent on elastic-, viscoplastic-, and thermal-strain [
26]. Hence, only the initial and the final state of the part are important for determining the needed scaling, and it is reasonable to use the total sinter strain for rescaling the parts.
As reported in various contributions [
6,
13,
14,
15,
16,
27] the shrinkage shows orthotropic behavior, with an identical coefficient in the printing plane (x and y) and a higher coefficient in the stacking direction (z), as depicted in
Figure 3.
This effect can be stated as a result of the typical FFF mesostructure, as it is explained in [
3]. Therefore, two shrinkage coefficients must be determined, for instance by printing a unit cube and measuring its dimensions in printing plane and stacking direction before and after sintering. The shrinkage coefficients
in the printing plane and stacking direction are expressed by
where the initial length is
in each direction, and its aligned change after sintering is
[
10]. To apply this effect to the green-part design, the shrinkage coefficients have to be converted into scaling factors
. These factors represent the proportions of the green-part and the sintered-part dimension and are therefore defined as follows:
Since the geometries are scaled none-uniformly, running a debinding simulation on the unscaled parts may cause misleading results. Therefore, it is essential to consider the scaling in the presented simulation framework.
Debinding itself is a diffusion-controlled process. Consequently, thinner areas of the part lose their weight more quickly. This is a considerable drawback when setting up the printing layout, since structures that are sufficient to mechanically support the green-part may not be sufficient to support the brown-part after the debinding process. Additionally, the part’s porosity rises, depending on the binding agent fraction, up to nearly 65%. This makes it difficult to determine the green- and brown-part’s strength. This holds true especially since the bonding of the particles is based on Van der Waals couplings rather than on metallic bonds. For simulating the part collapse during debinding, the scaled green-part is used as a starting point. If the dead load causes stresses in the part that exceeds critical stress limits, it is assumed that part collapses while the binding agent is being removed. This can be examined with linear-elastic finite element analysis. The results can be evaluated by the means of maximum occurring global stresses.
2.2. Setup of the Finite Element Model
If the allowable stresses are exceeded during the debinding process, the part is likely to collapse. To simulate the occurring stresses, the finite element method (FEM) is used. The FEM is a numerical procedure to simulate various physical effects. In technical context, the method is often used for mechanical simulations of parts, but it also can be used for thermal simulations or electromagnetics. The method is based on a discretization of the whole structure into smaller parts, the so-called finite elements. The stiffness of each element, from which the stiffness of the entire structure can be derived, can be calculated. [
28,
29].
Thus, the procedure can be seen as a generalization of the Hooke’s Law to several dimensions. The stiffness matrix
of one element can be derived via the integral
whereby
C describes the material matrix (consisting of the Young’s Modulus and the Poisson’s ratio of the material) and the displacement-strain-transformation matrix
B. Assembling the individual stiffness matrices leads to the following overall linear equation system:
Knowing the external load vector
F, the system can be solved for the displacement vector
U. The displacements are calculated at each node of the elements. The occurring stresses
can be derived elementwise via the equation
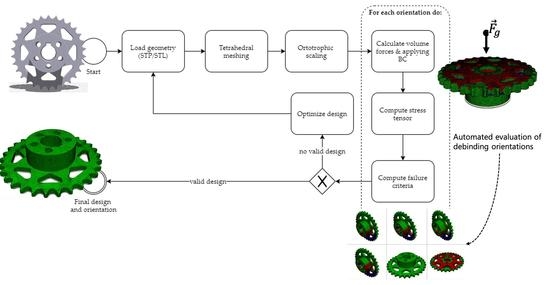
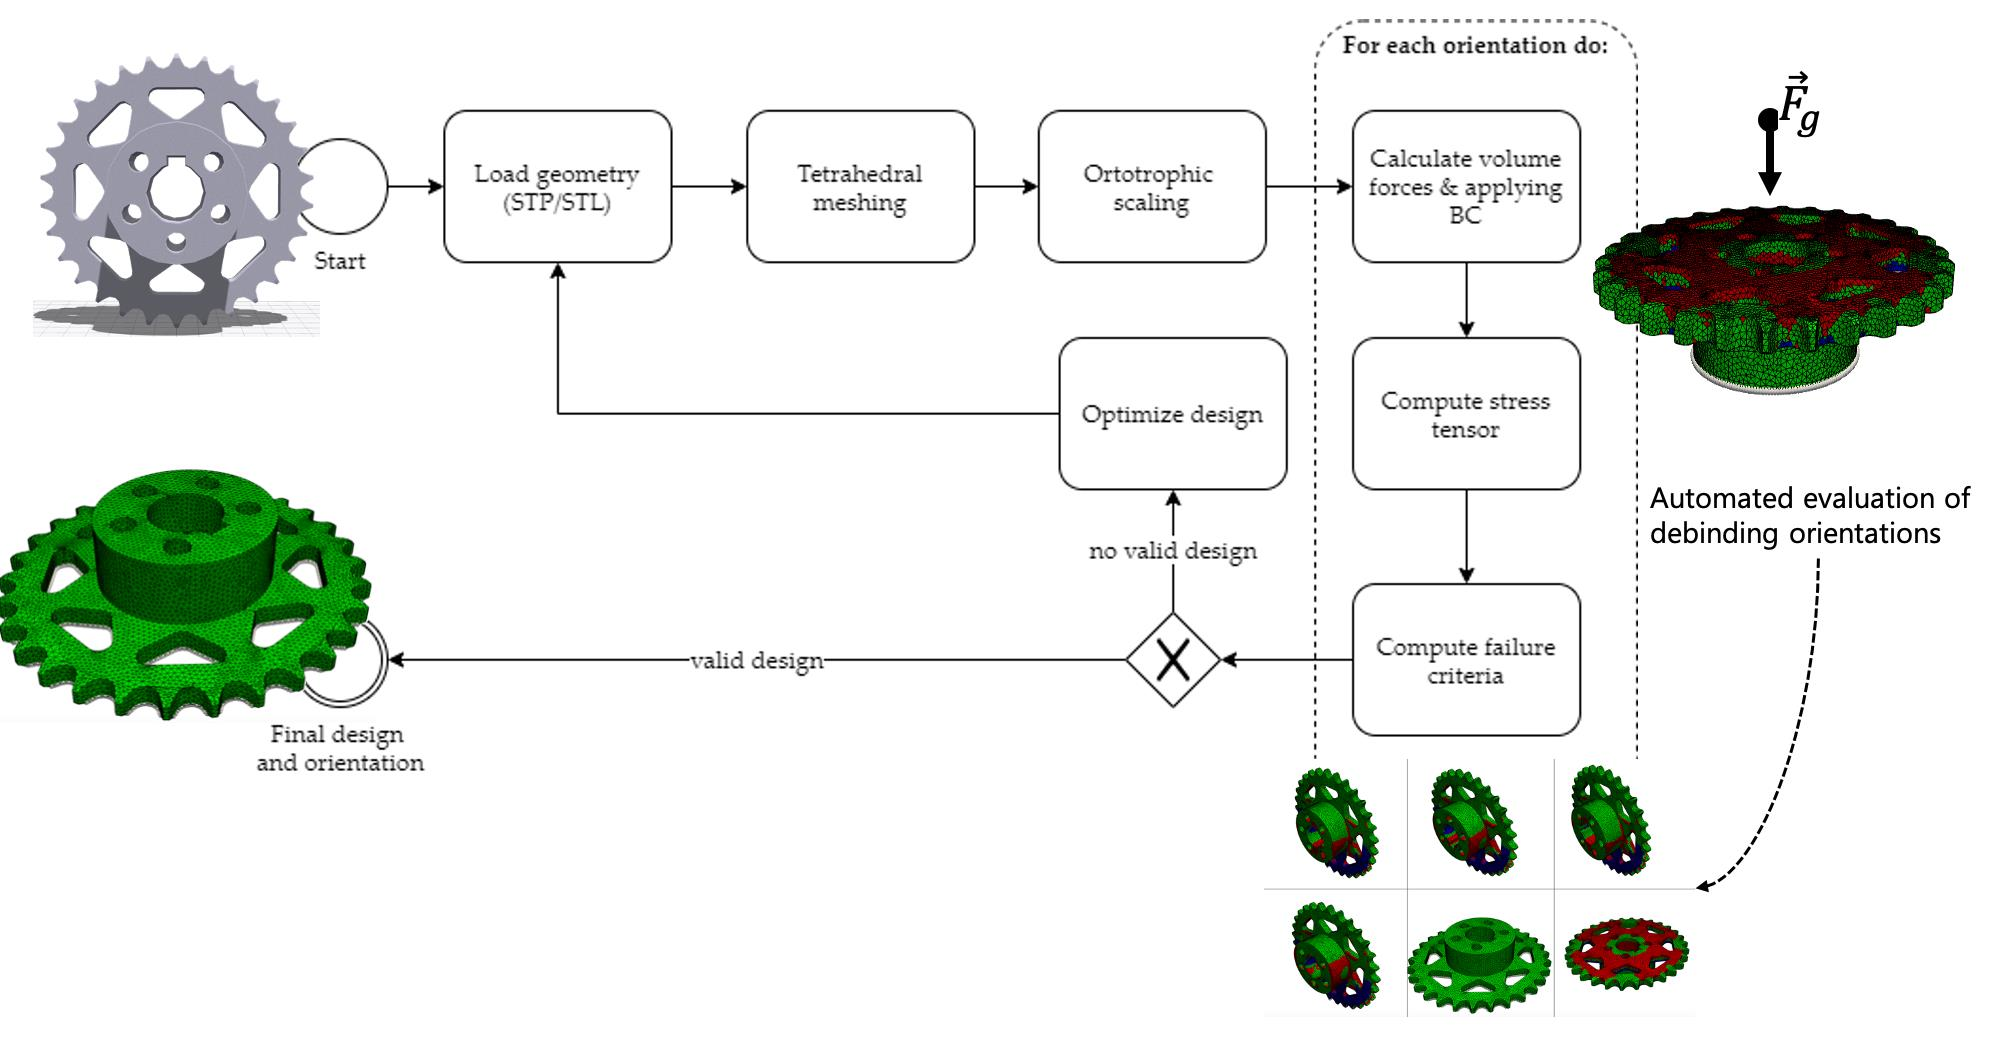
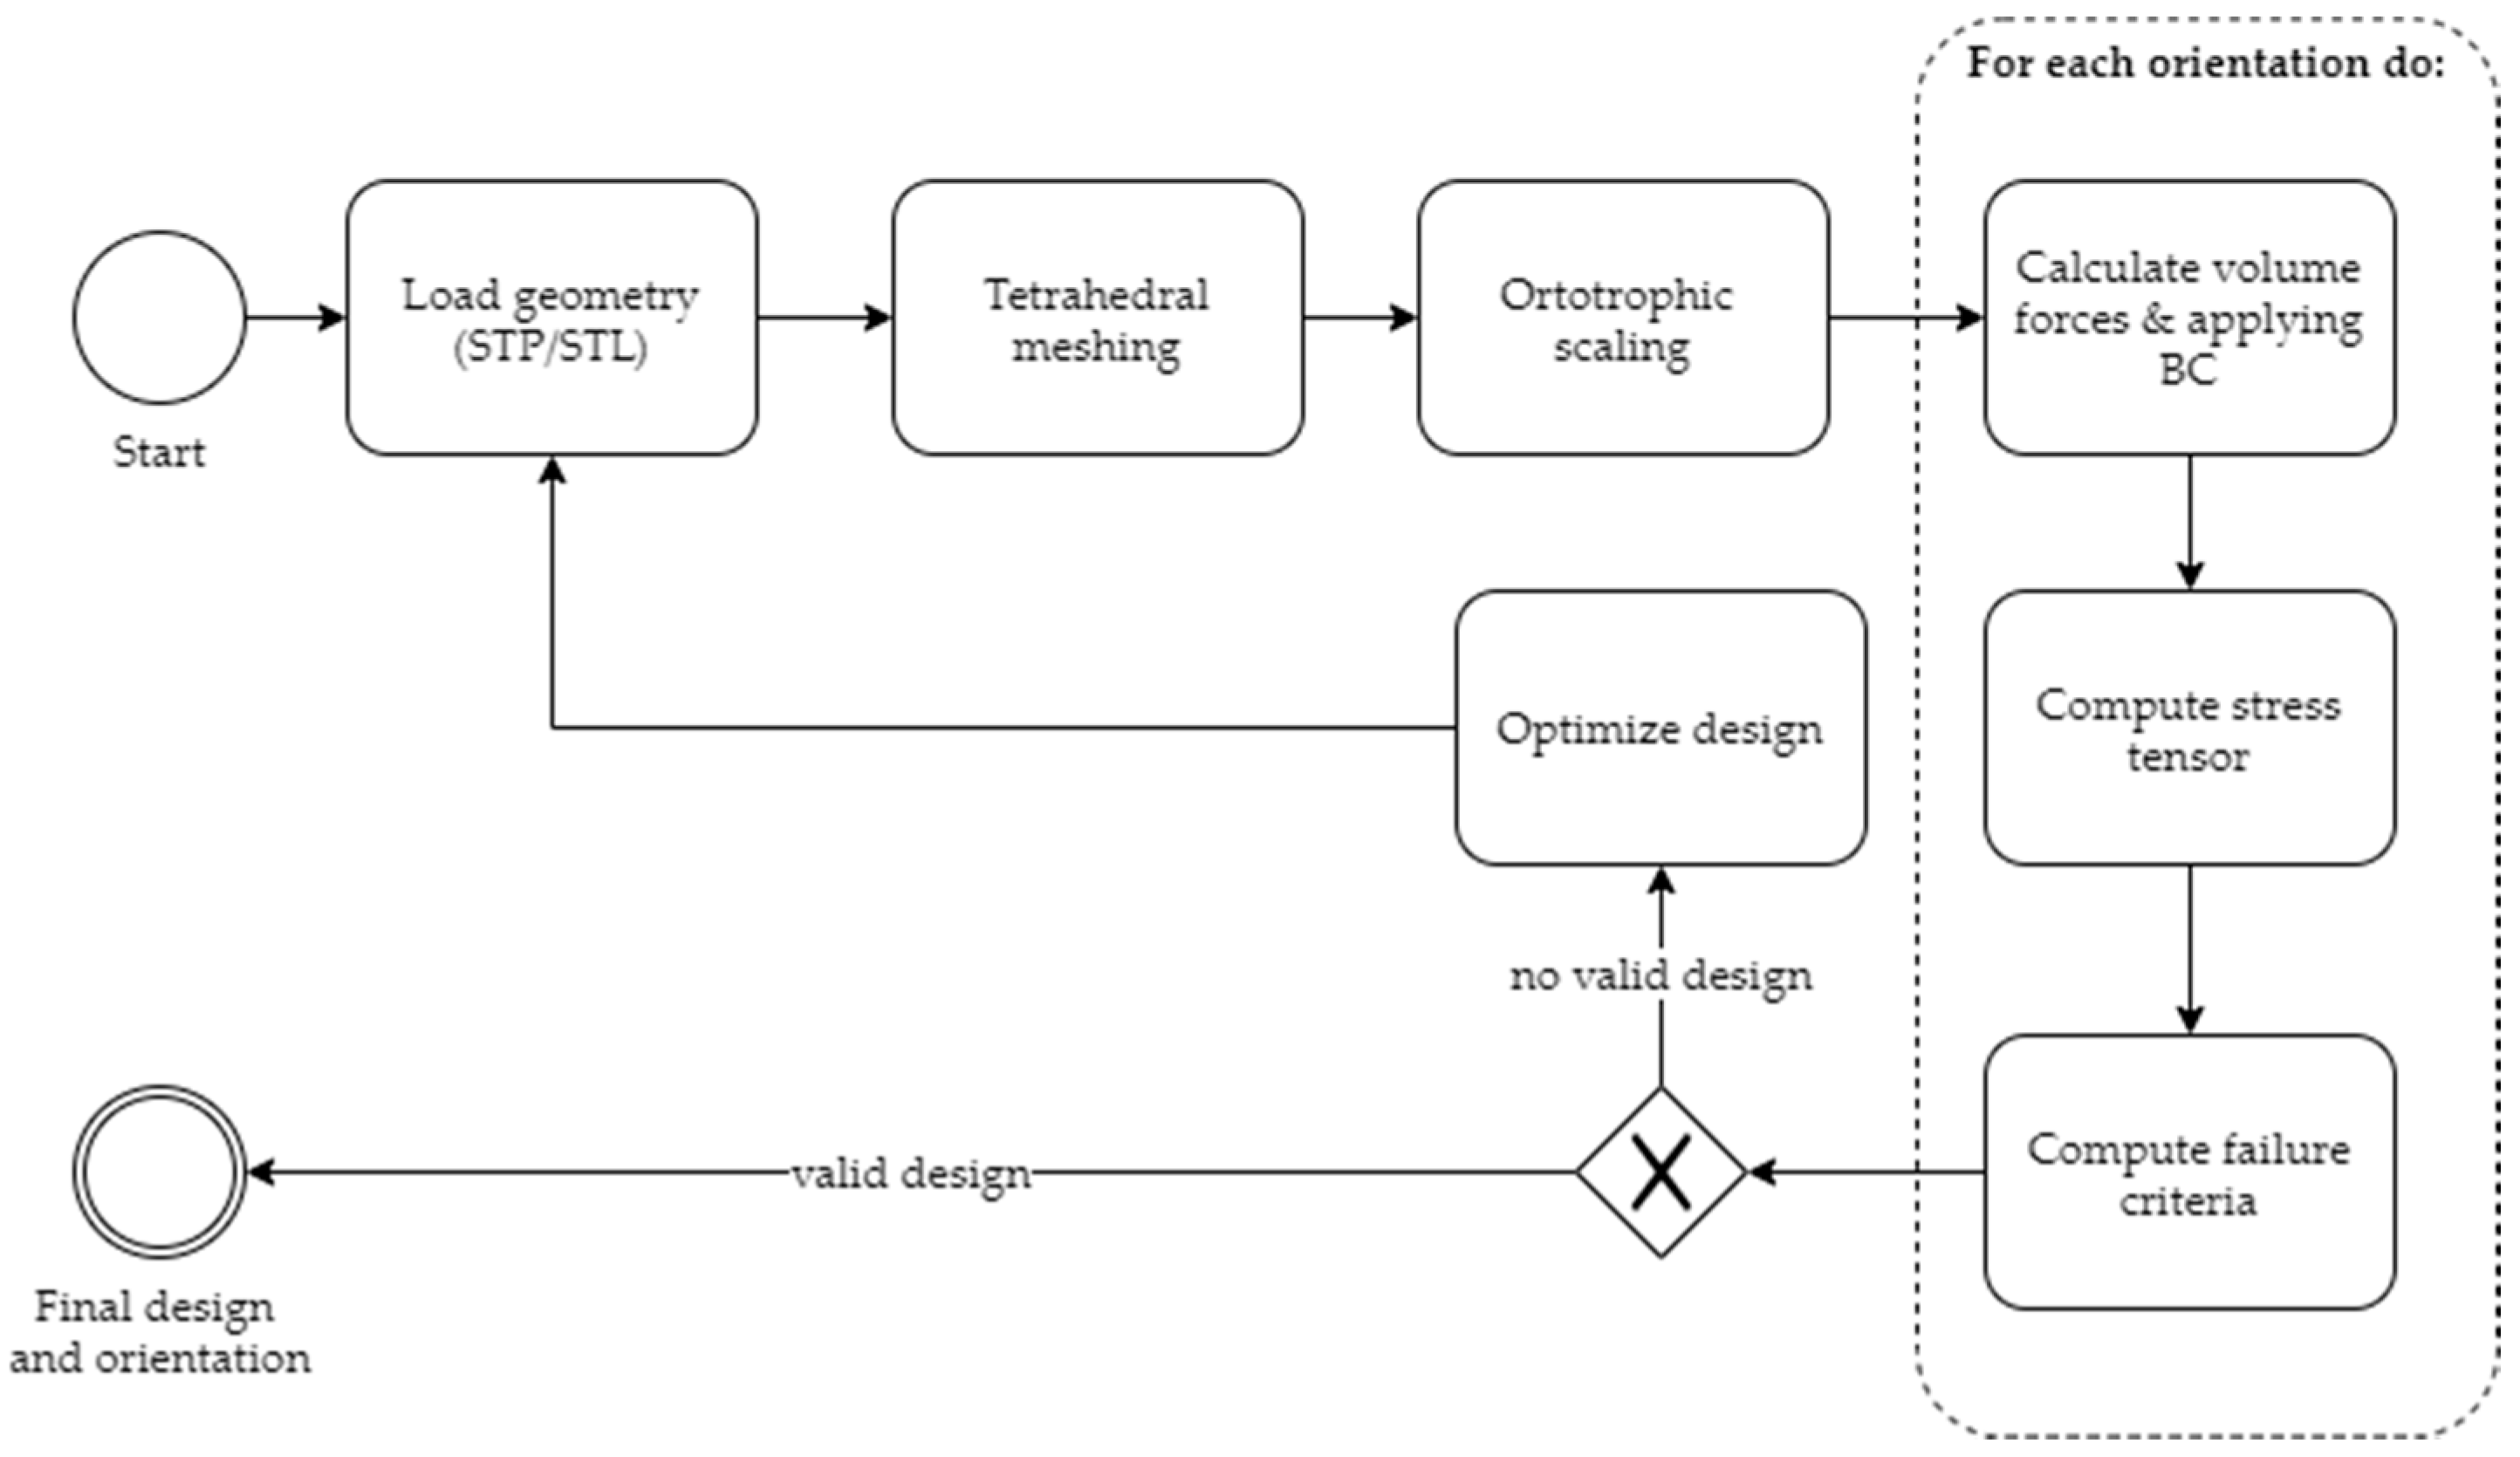
2.3. Automated Simulation Framework
The simulation framework is strongly aligned with the guidelines provided in [
20]. It aims to automate the overall process and therefore computes all main part orientations for debinding. The main workflow of the process is shown in
Figure 4.
First, the part is imported, with a choice between STEP and STL format. It must be made sure that the part is defined in the correct coordinate system with the stacking direction z. Then, the meshing software Gmsh is used to generate a tetrahedral finite element mesh, whereby the desired element size and element order (linear or quadradic) can be prescribed. As stated in the previous sections, an orthotropic scaling of the part is needed to compensate the shrinkage during debinding. For this purpose, the user can provide two scaling factors, one for the printing plane scaling (x and y) and one for the stacking direction (z). The default parameters are
= 1.2 for the printing plane and
= 1.26 for the stacking direction [
22]. Using these supplied factors, the generated mesh is scaled afterwards.
To conduct the FEA for each orientation, certain material parameters are required. Since a static linear-elastic FEA is carried out, Hooke’s law is applicable and the stresses that occur are related to the selected Young’s modulus and poisson ratio. To consider the gravitational force, the density of the green-part is also required. The material data used for the validation of the framework and set as the default values are chosen from [
20] and are presented in
Table 1.
Afterwards, each part orientation during debinding is being simulated. The boundary conditions are chosen as follows: All nodes that are in contact with the build plate are fixed in all three spatial directions (x, y, and z). The only occurring load is the gravitational force due to the part’s dead load. Since the used Finite-Element-Solver Z88OS currently does not support this kind of loads, a simplified approach is used. For each finite element, the volume is calculated (whereby for quadratic tetrahedra a linearization is made), which makes it possible to calculate the force acting on this element, taking the density and the acceleration due to gravity into account. This force is then distributed to the element nodes, with additional weighting depending on distance to the center of the element. This approach is not exact but allows for a quick calculation and integration into the automated process and is also used in the free-vibration solver Z88EI without the need of computing a mass matrix for the system [
28,
30].
Based on the input data, the deflection and the occurring stresses can be determined by using the FE-Solver Z88OS. For the failure evaluation, the stresses at the integration points are used. The critical stress limits given in [
20] are used by default and listed in
Table 2 beneath.
All finite elements that exceed the maximum tensile limit at any integration point will be highlighted in red and blue for exceeding the maximum compression limit. This procedure is repeated for all six orientations and the results are plotted using the software package PyVista. Since elements inside the part can also exceed the limits which cannot be detected in the plotted results, the total number of critical elements is printed additionally.
The framework is exemplarily shown on three parts. It is tested if the results differ when using STEP- and STL-files as the import format. Further, the impact of the integration order of the finite elements is evaluated by comparing the results to linear meshed parts. The results for exemplary parts are shown in the next section.
3. Results
The automated simulation framework is exemplarily tested on the three models that are displayed in
Figure 5. In order to evaluate the correctness of the presented automated simulation framework in a practical way, a staircase with several overhangs is used. Additionally, a sprocket and a topology optimized chassis diverter are chosen to represent parts with a more practical meaning to mechanical engineering. The parts are designed in Creo parametric (PTC Inc., Boston, MA, USA) [
31] and exported as STL- and STEP-files. The topology optimized chassis diverter was optimized with the topology optimization freeware Z88Arion
® (Chair of Engineering Design and CAD, Bayreuth, Germany) [
23], using the hybrid optimization algorithm TOSS (Topology Optimization for Stiffness and Strength) [
32] with a target volume of 75%. The chassis diverter was manually redesigned in Creo parametric based on the Topology optimization result. All presented example parts are meshed using quadratic tetrahedral elements and an edge length of 2 mm.
The results are presented in failure-plots that contain all six orientations, starting the counting in the upper left. For each orientation, the global stresses
,
and
are evaluated. If any integration point in an element exceeds the maximum tensile stress limit in any direction, the element is marked red. Analogously, if the stress exceeds the maximum compression stress limits in any direction, the element is marked blue. All elements within the limits (listed in
Table 2) are plotted in green. This allows for a quick visual evaluation, if an orientation for successful debinding is found or not. Furthermore, the maximum global tensile and compression stresses in x-, y-, and z-direction for each orientation are presented for each example in tabular form, which use the same color-scheme as the failure-plots. The tables are used to estimate whether the parts fail due to tensile or compression. A safety factor
, which is defined as follows
where
denotes the number of the orientation, is written in brackets beneath the stress value. The safety factor is used to rank the individual orientations hierarchically. This means that if there are more than one suitable orientation, the orientation with the highest
should be considered.
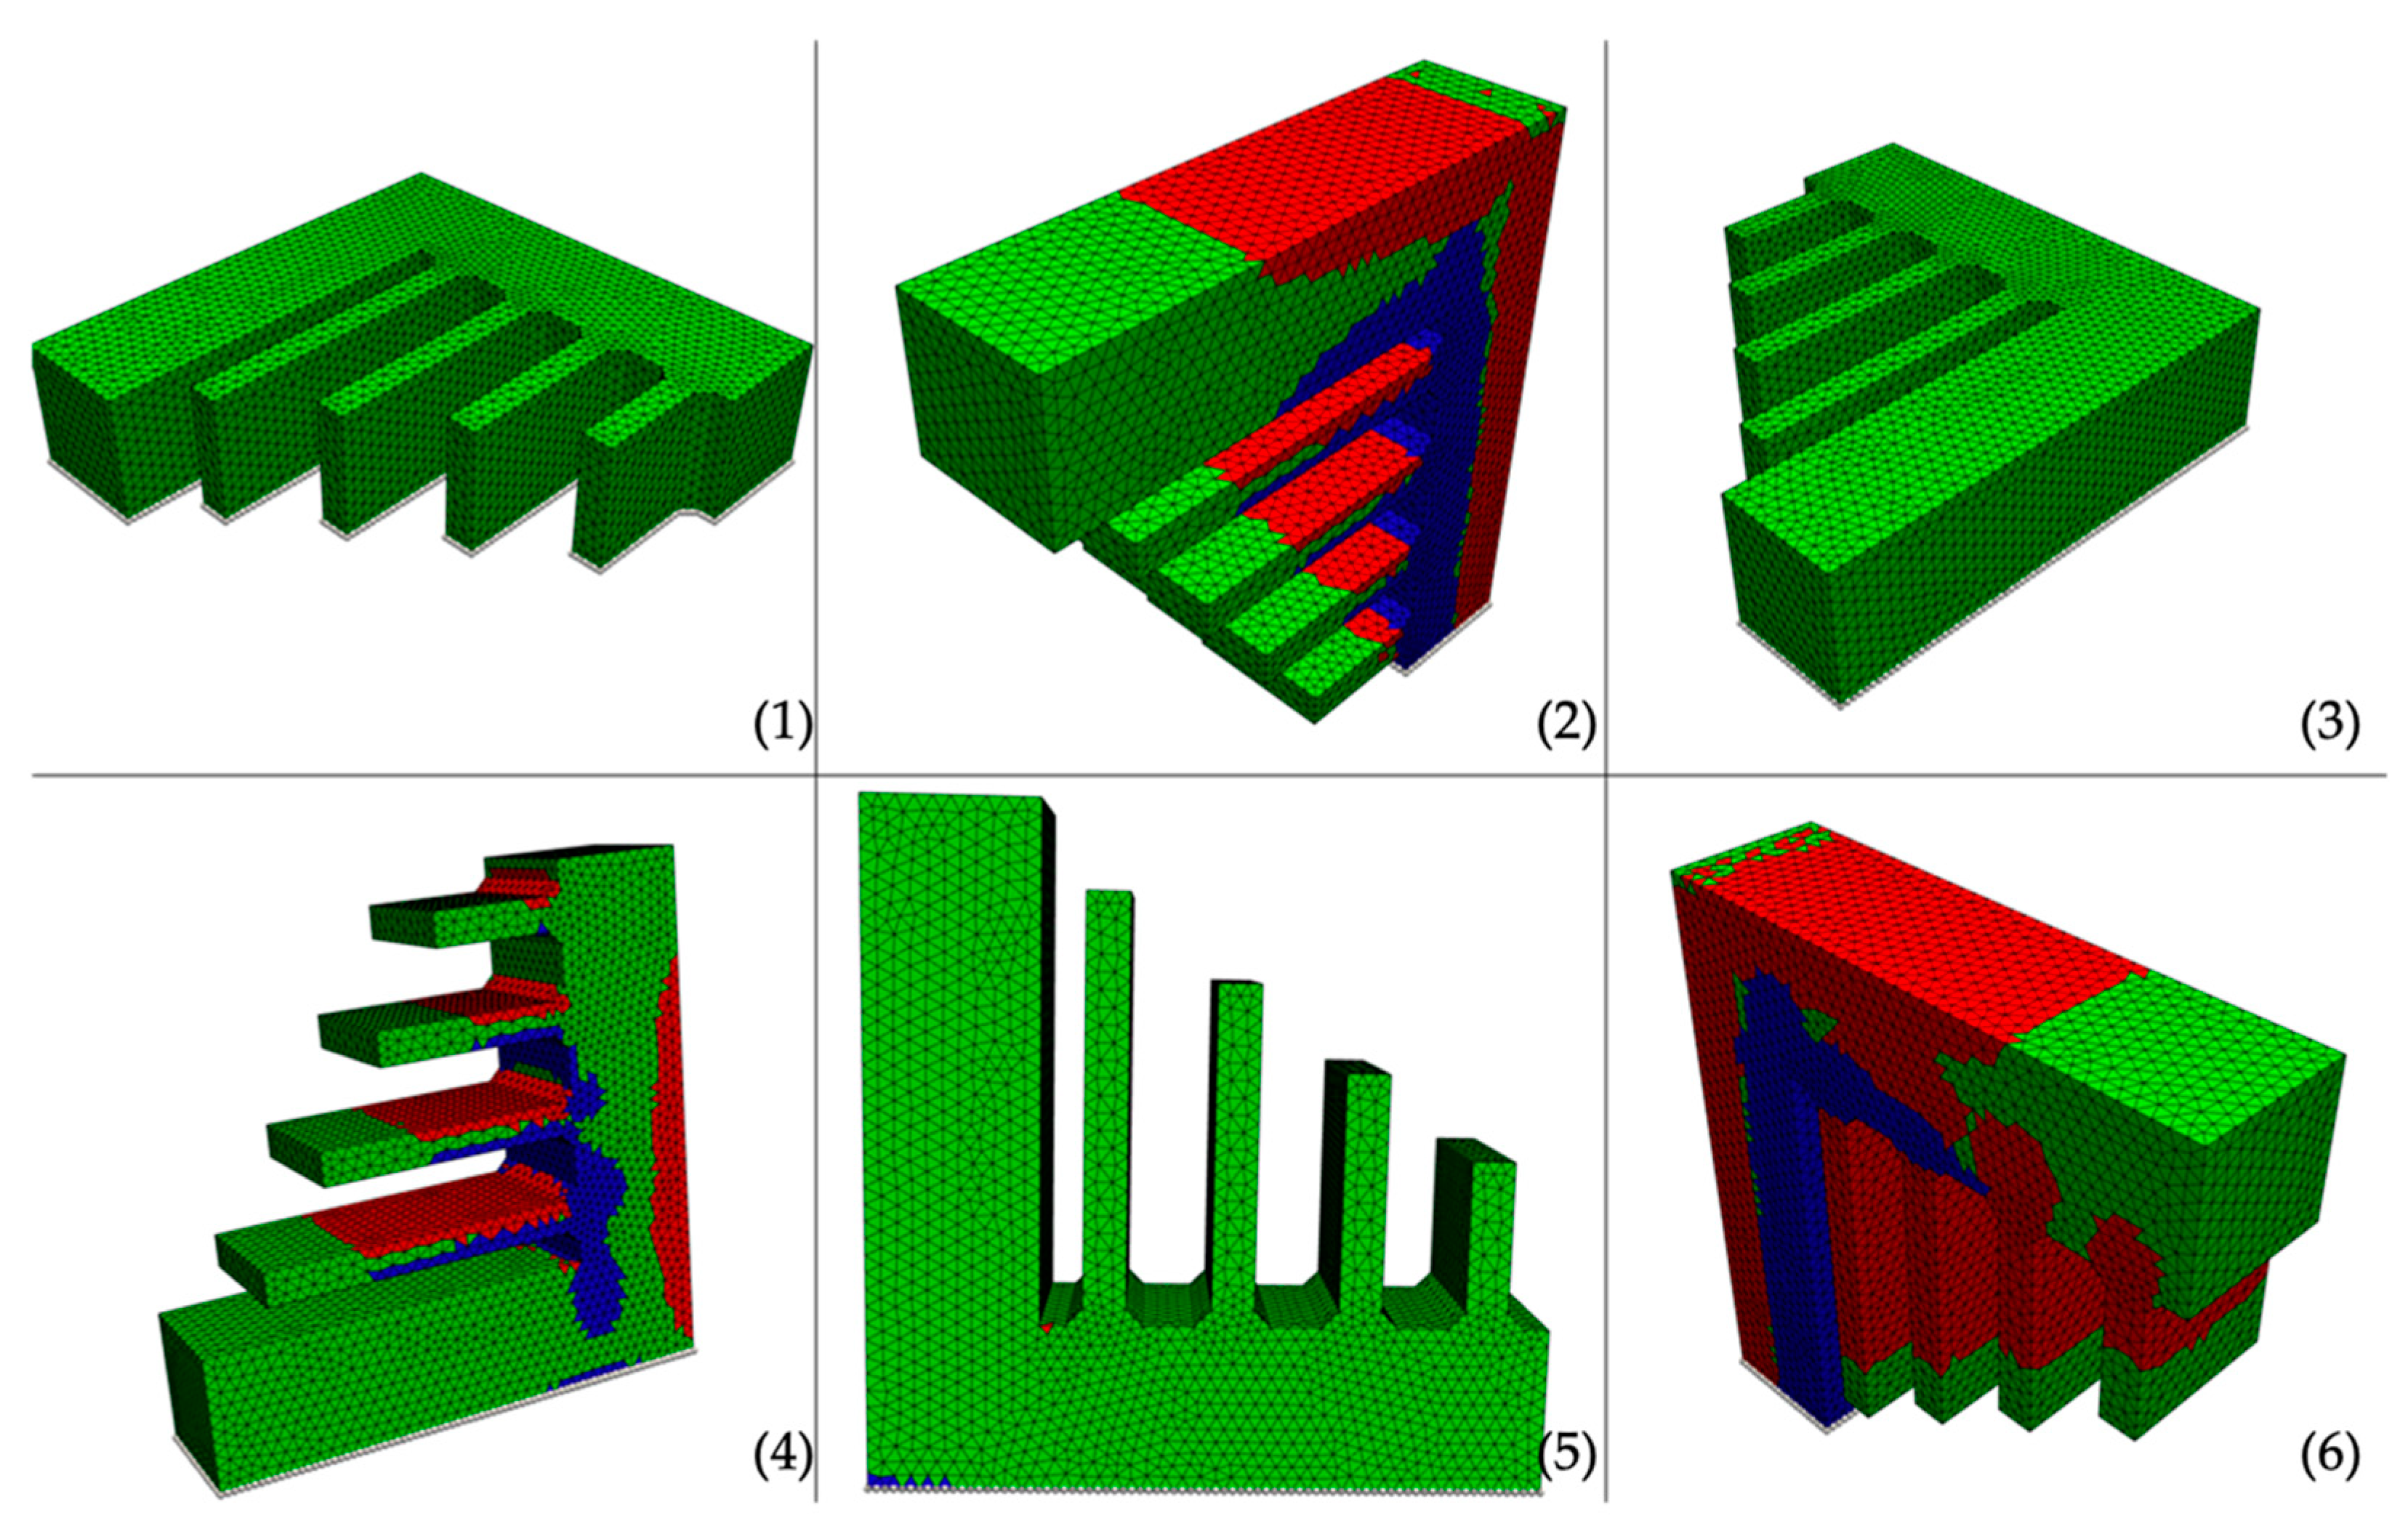
3.1. Staircase
The simulation results for the staircase are shown in
Figure 6. The simulation results match the expected behavior and are in good alignment to the results in [
20]. For the orientations (1) and (3) no elements exceeding the critical stresses are detected, while orientations (2), (4), and (6) are clearly not reasonable for debinding. Although orientation (5) intuitively would be considered as suitable, the simulation results show very few critical elements; 44 by number for the chosen settings, which are exceeding the critical limit for compression stresses and are thus indicating part failure during sintering. Nevertheless, one isolated element that exceeds the tension stress limit is attributed to a numerical singularity.
The results from the failure-plot are further supported by the maximum stresses for each orientation shown in
Table 3. It can be seen clearly, that for orientation (5), the stresses in z-directions are too high and thus, orientations (1) or (3) should be used for debinding. The failure in orientations (2), (4), and (6) is suggested to be due to tensile stress in z-direction. For orientation (5), failure is attributed to compression in z-direction.
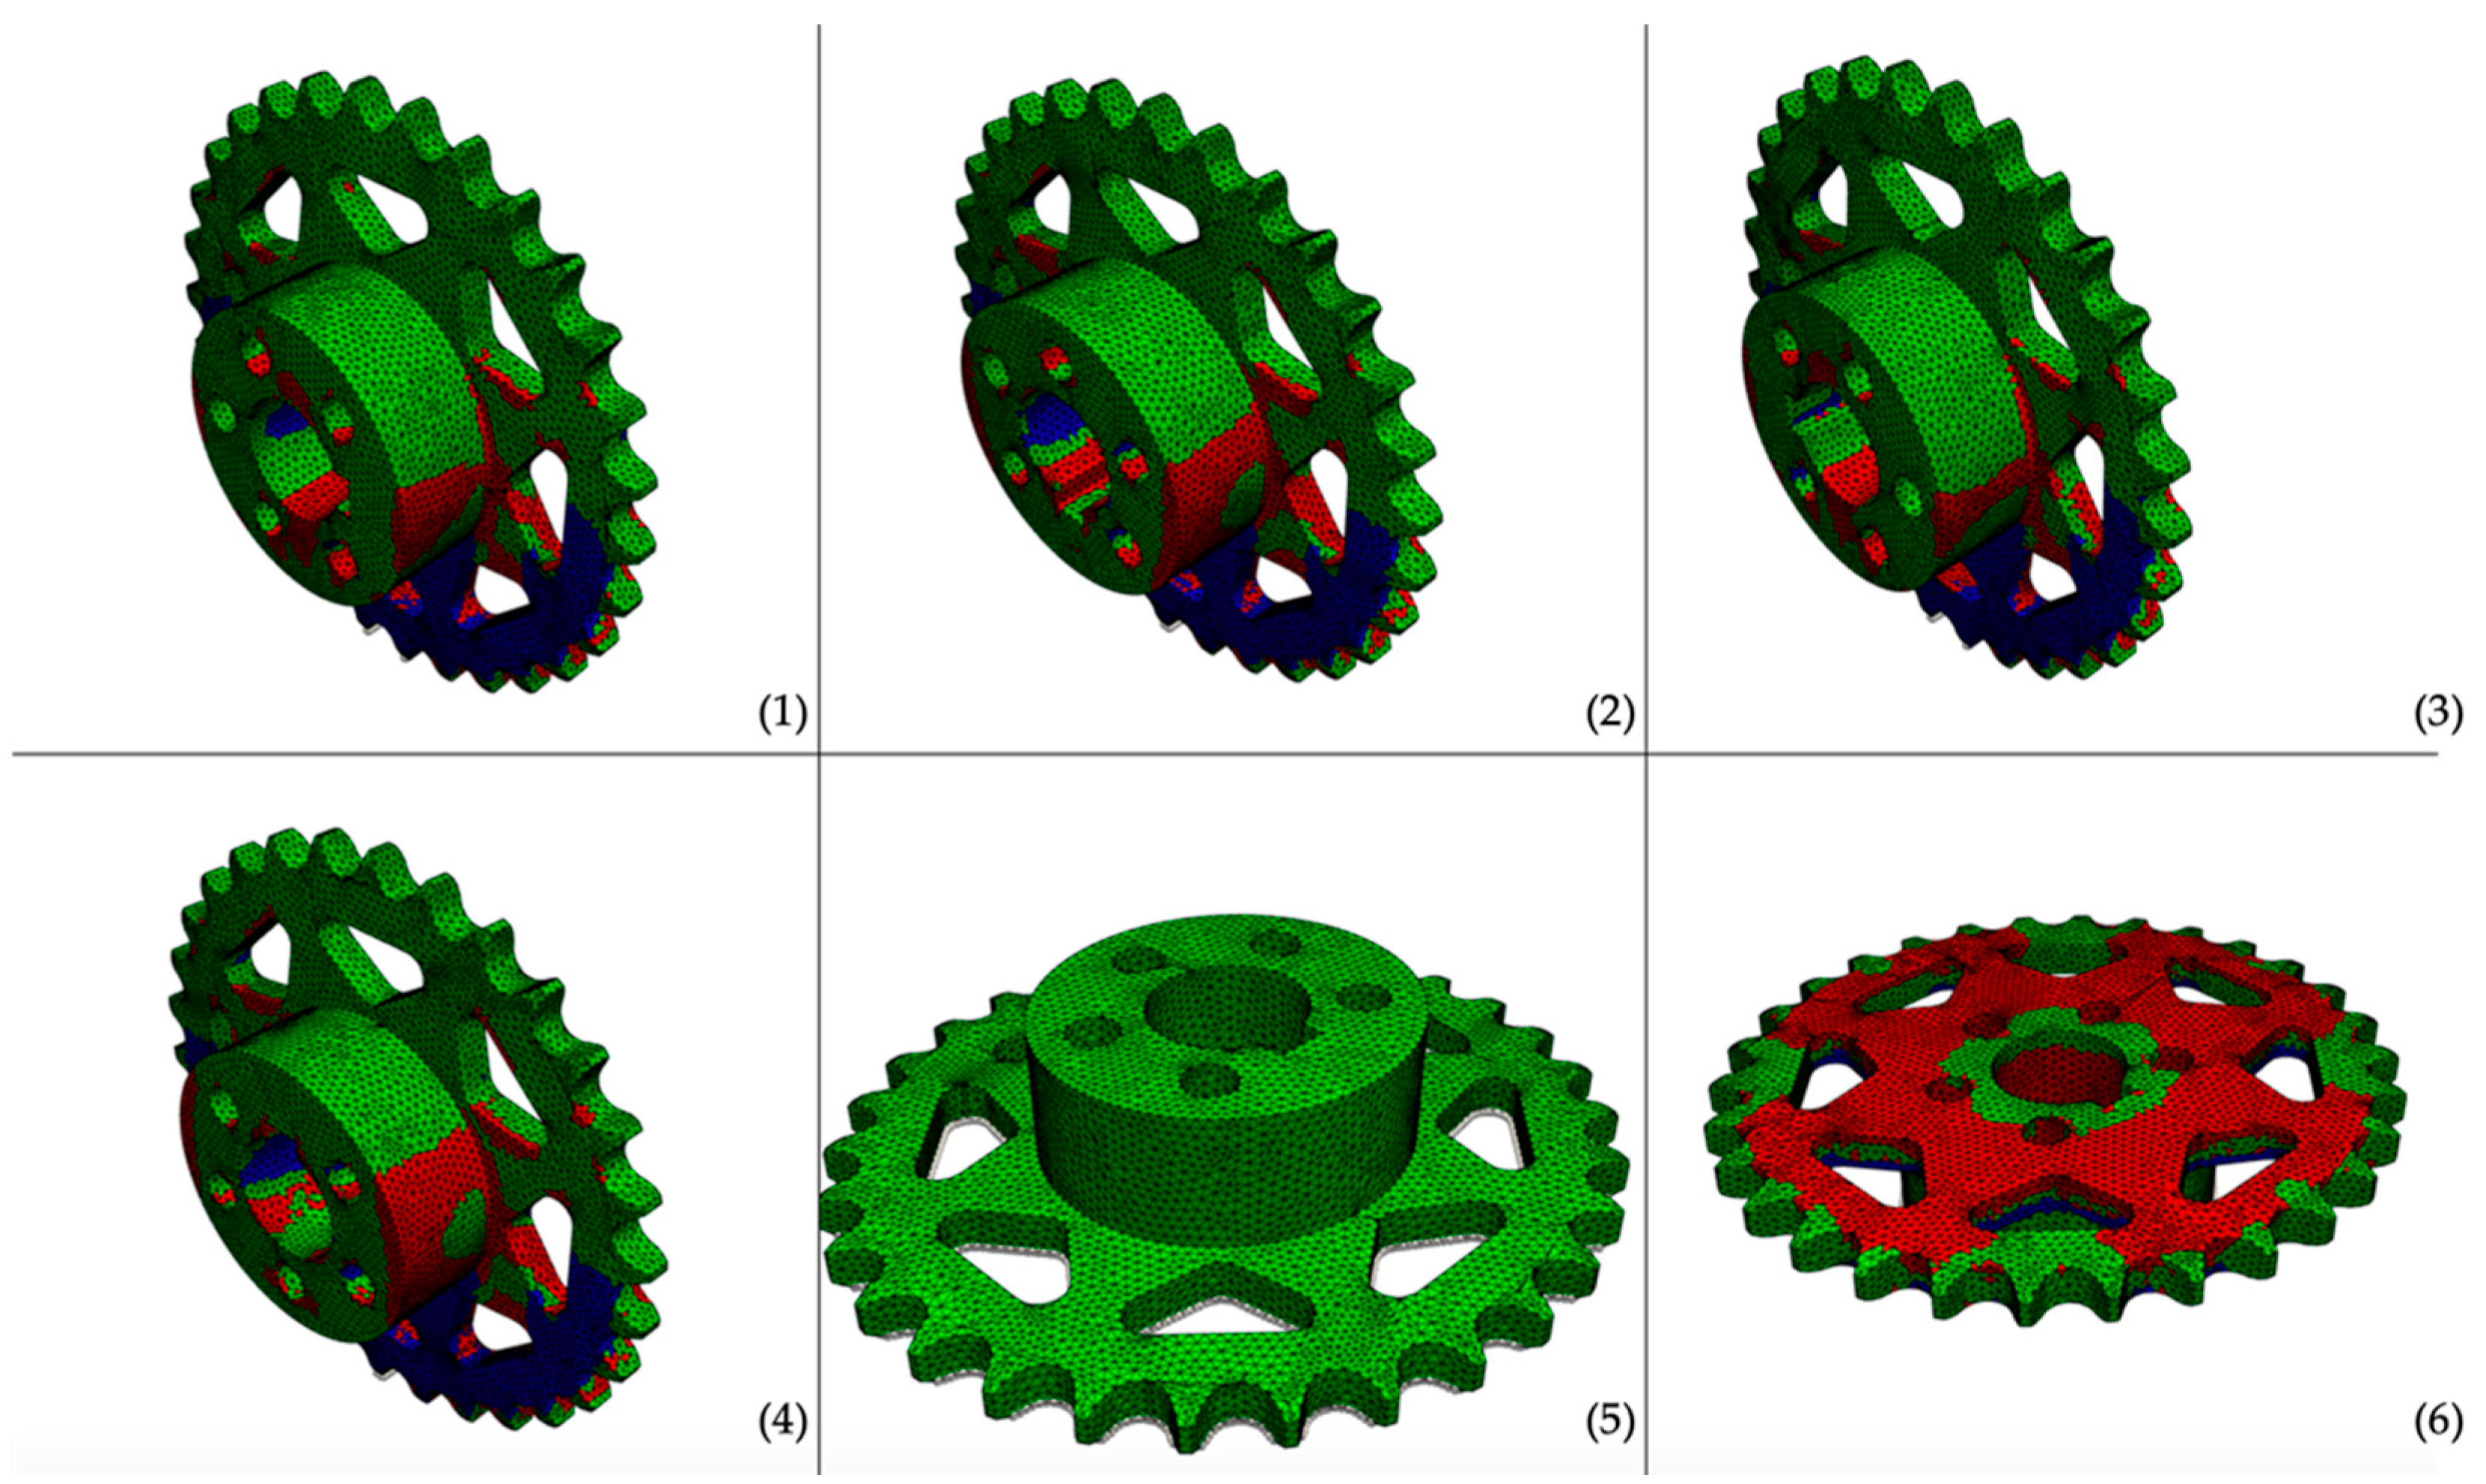
3.2. Sprocket
This simulation results of the sprocket (
Figure 7) show critical elements for every orientation except orientation 5, making this the only reasonable orientation for the debinding step.
Table 4 shows, that the orientations (1) to (4) and (6) will fail most likely due to compression in z-direction.
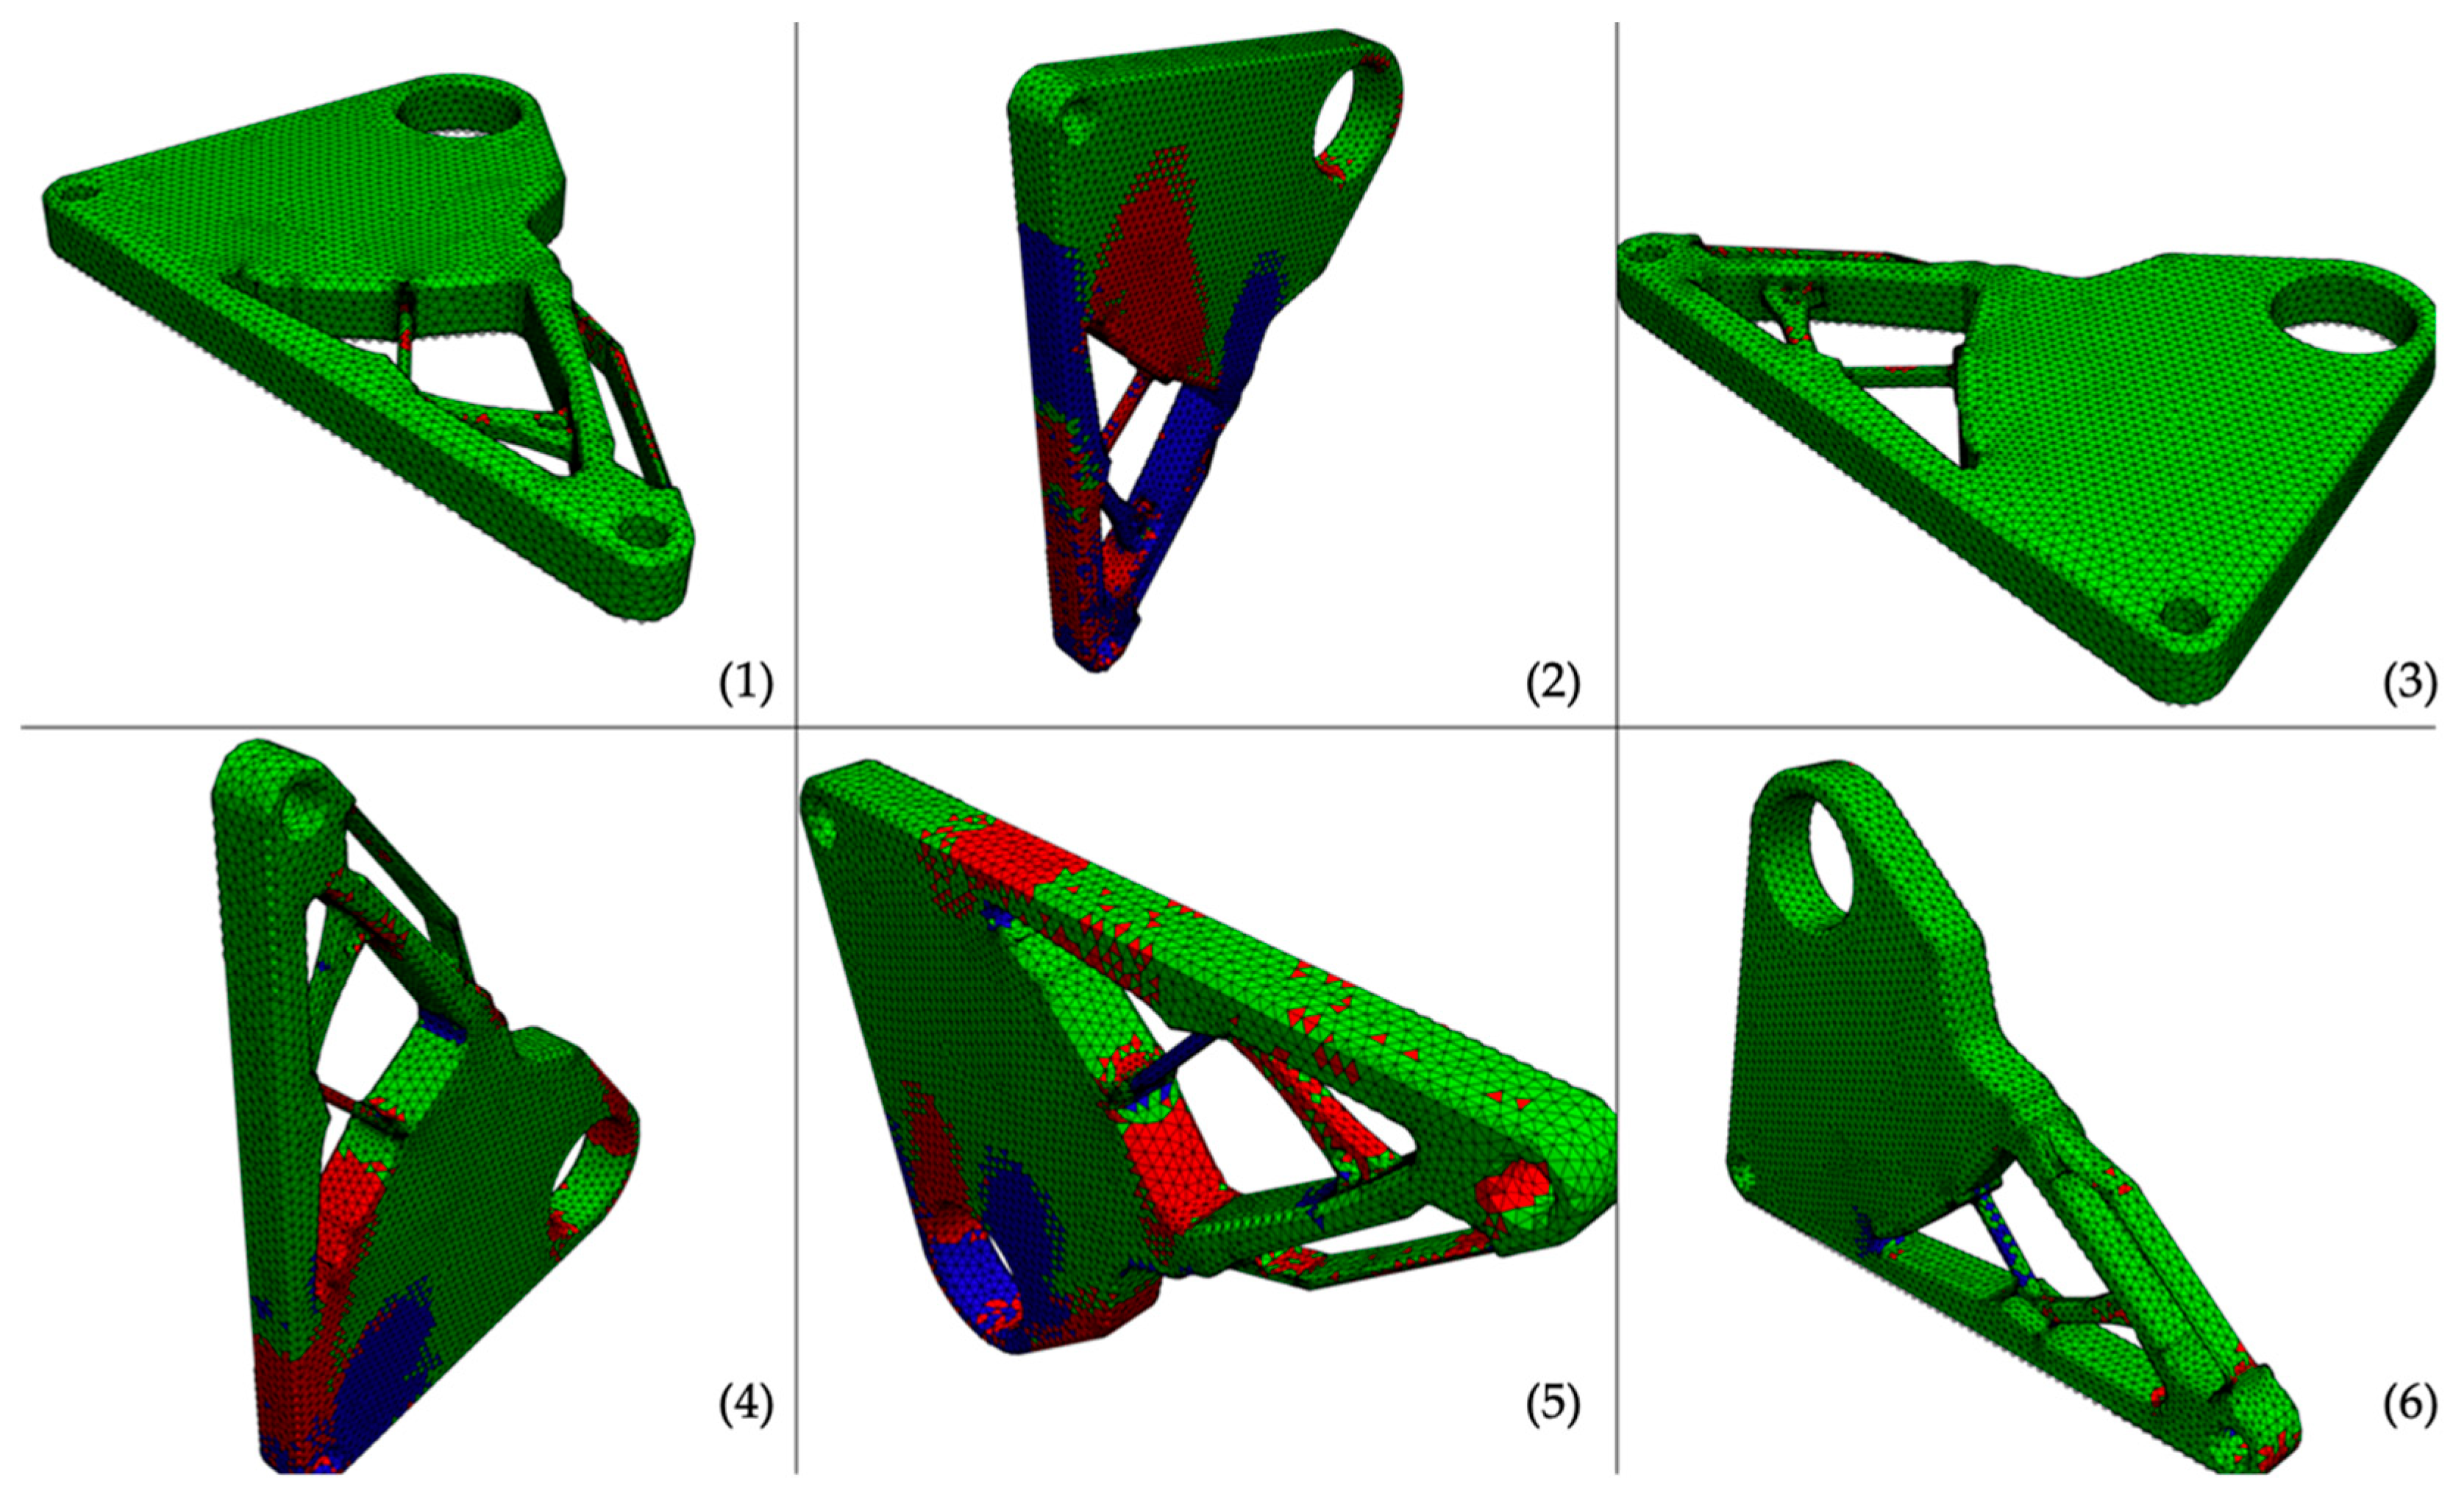
3.3. Topology Optimized Chassis Diverter
For the chassis diverter, no orientation without failure due to tensile or compression stress limits is obtained (
Figure 8). This result emphasizes the redesign of the part or the usage of support structures. In this simulation, the base coordinate system is chosen, so that the axis through both small drill holes is aligned to the
y-axis. Therefore, in the automated preprocessing, the fixed nodes are not selected very reasonably for some orientations. However, this can be resolved by changing the initial coordinate system of the part and running the simulation framework again with the updated part orientation.
To adapt the part for metal EAM, the information from
Table 5 can be very useful to decide in which manner the part can be redesigned, or support structures can be are arranged. Besides, all orientations are suggested to fail due to tensile stress in z-direction, orientations (1) and (3) show components that are within the acceptable stress interval and are therefore a good starting point for refining the part.
4. Discussion
The objective of the developed framework is to enable a fast estimation whether a part can be successfully debindered in any direction. The stress limits used in this work are taken from [
20] and have to be validated in future work. The main goal of the framework is to obtain failure plots that display the influence of the dead weight correctly. This can be explained very descriptively by using orientation 6 of the staircase simulation. By looking at the two stairs, displayed in
Figure 9, the lower region of the stairs is not leading to failure. As the load due to dead weight of the stairs increases, the dead weight increases and exceeds the tensile stress limit. At the step transition, the stress is then distributed evenly in the part and gradually decreases until it falls below the stress limit again. This conformity of theoretically expected stress distribution and simulation result is considered as a plausible result in the technical context.
The shown approach simplifies the phenomenological debinding simulation, but still requires user input in some respects. For instance, the accuracy of the FEA is important, whereby the element size, the element order, and the integration order of the elements have to be chosen. In general, smaller element sizes lead to smaller discretization errors. However, simultaneously, the computation time is increased. The guidelines in [
20] propose at least three elements over the thinnest entities. As the comparison of linear and quadratic tetrahedra in
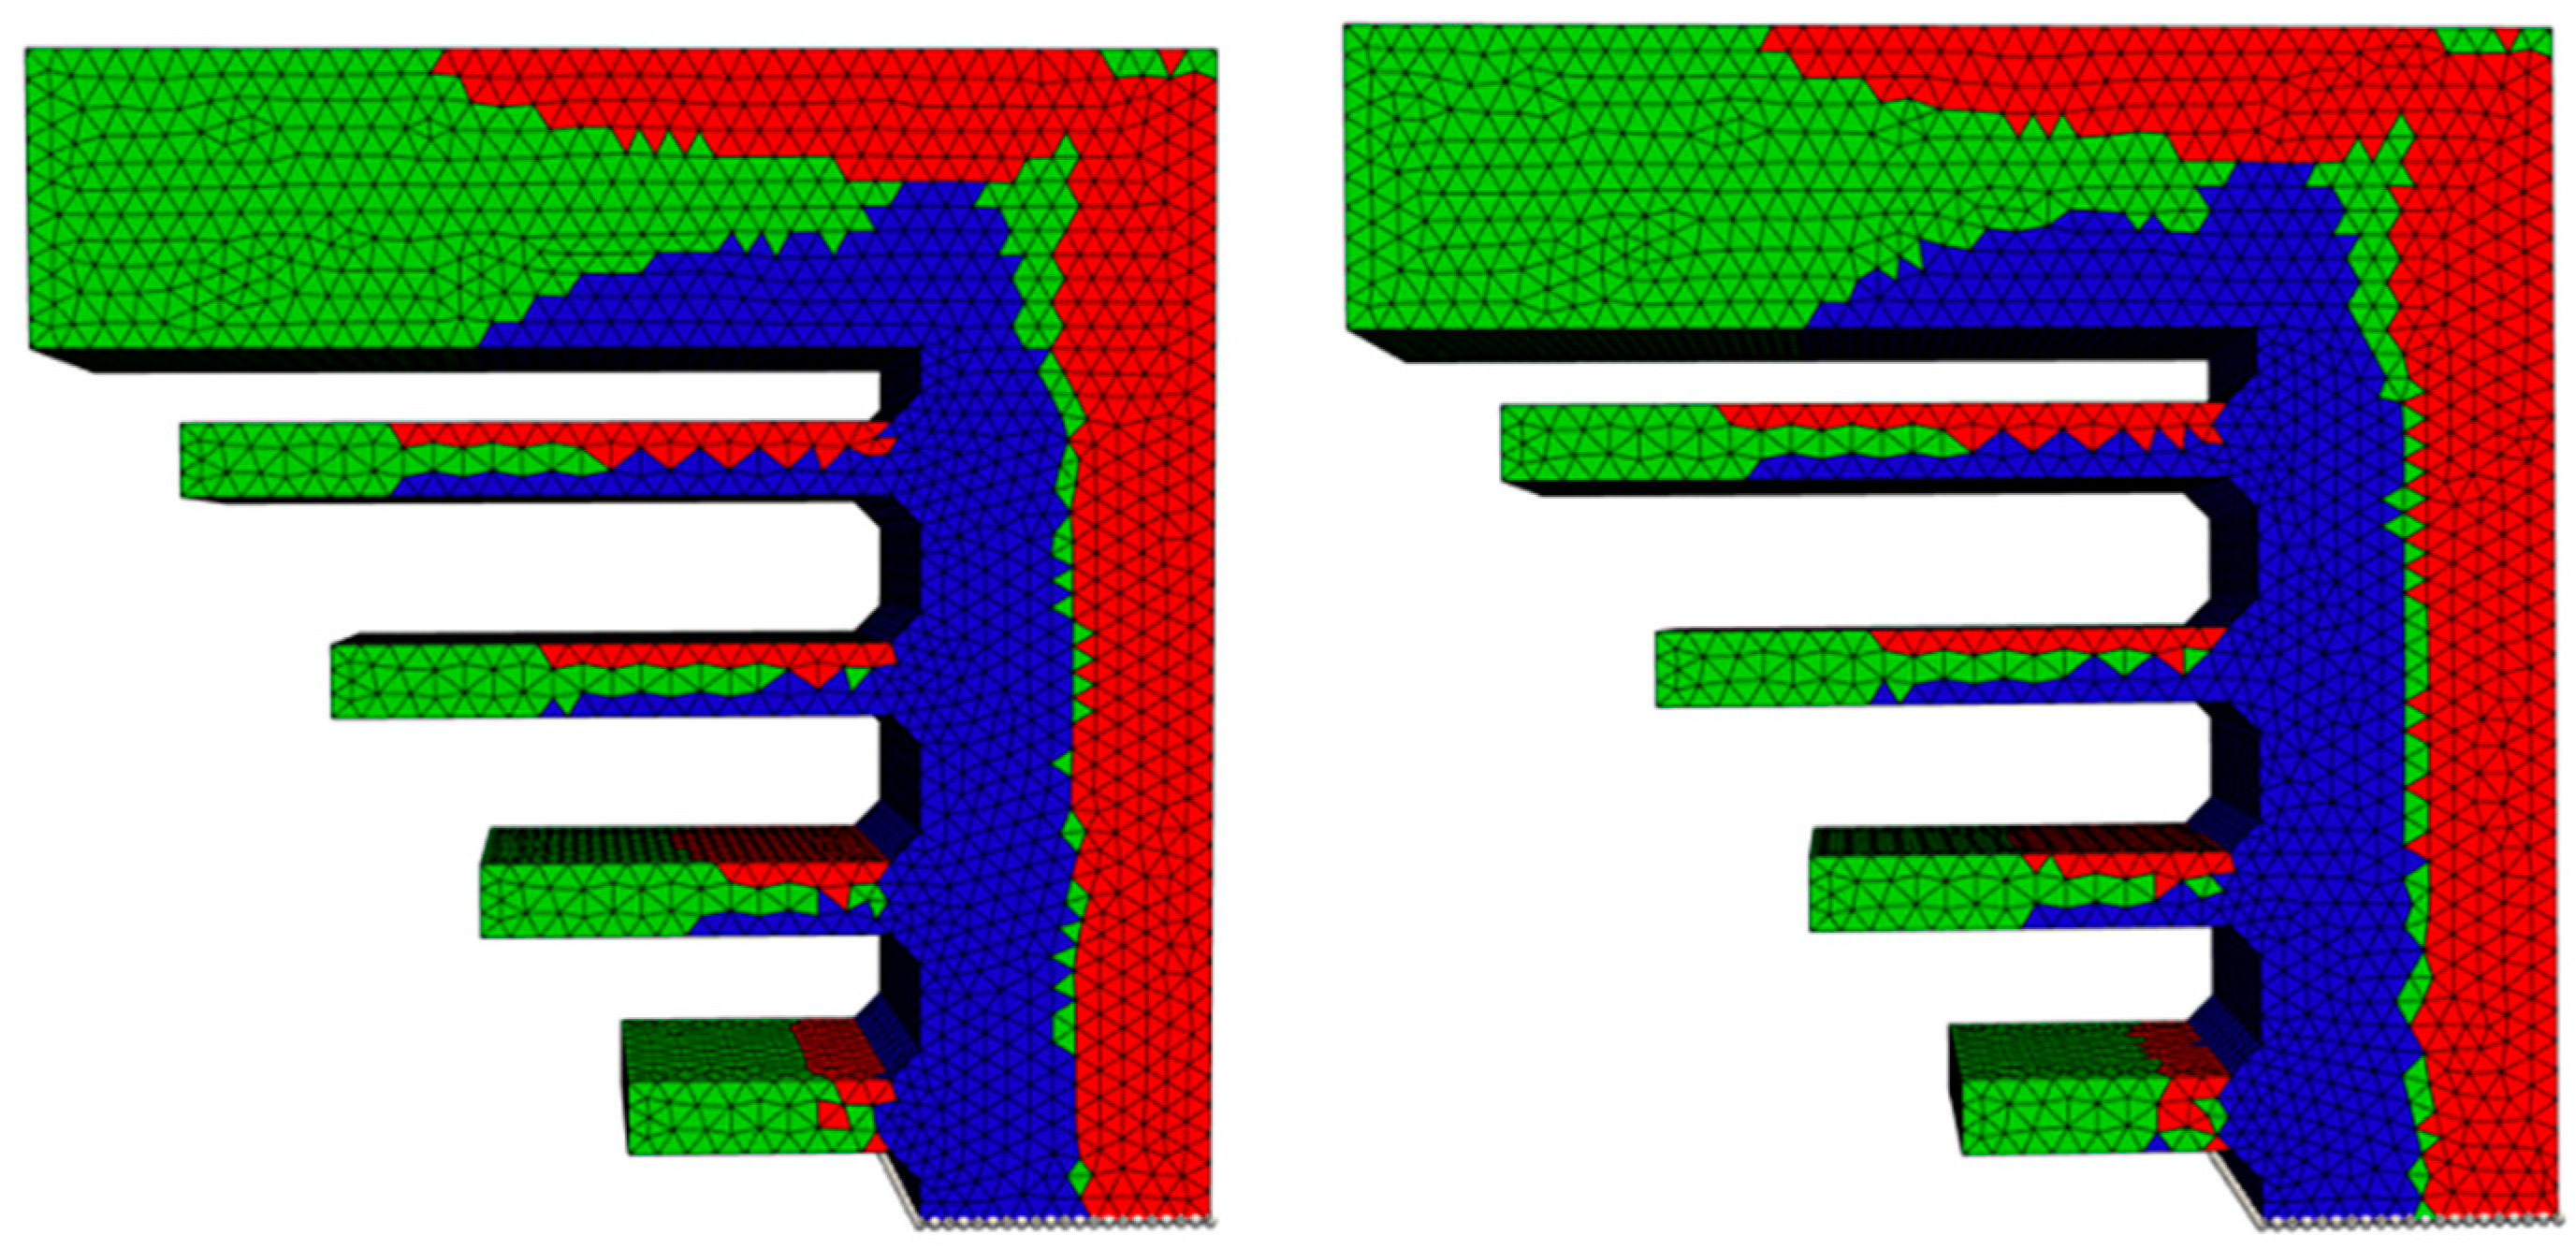
Figure 10 shows, quadratic elements are recommended for smoother simulation results.
It is observed in general that quadratic meshing leads to slightly better results, since the isolated critical elements could be avoided. Therefore, quadratic tetrahedra should always be preferred for this simulation framework. By comparing the impact of using STEP or STL files (
Figure 11) only minor changes can be found and it can be concluded that the framework works well for both file formats.
Nevertheless, for STL files, the quadratic meshing in the presented framework is not always successful for arbitrary geometries, so that sometimes distorted elements are created, or meshing fails completely. Therefore, it is suggested to use the STEP file format, if possible. Furthermore, the framework is tested on Linux, MacOS, and Microsoft Windows platforms, demonstrating a high portability.
4.1. Evaluation of Application Examples
For the simulation of the staircase (
Figure 6), two orientations that are clearly not feasible for the debinding process are obtained. Orientation (5) also indicates part failure, but the results are not evident since a numerical singularity is also observed in this single simulation. The remaining two orientations are both suitable for debinding according to the simulation framework. By comparing the results for orientations (1) and (3) of the staircase failure-plot in
Figure 6, identical results are expected. This in good agreement for all maximum stresses in
Table 3 except for
. This deviation may result either from an unsymmetrical mesh or the approximating approach used to calculate the volume forces without the need of a mass matrix. Since the goal is to obtain a quick estimate, these types of deviations that can potentially occur are tolerated. This is acceptable, since in the examples considered no case occurred in which they changed the meaning of the result.
The sprockets geometry (
Figure 7) already implies that only two orientations for placing the part within the debinding furnace are practically possible. With the aid of the simulation framework, it can easily be examined that the free overhangs in orientation (6) are too large and are therefore causing failure due to high tension stress. It is thus implied clearly that orientation (5) must be used for debinding.
Adversely to the two previous examples, the chassis diverter cannot be orientated suitably for debinding (
Figure 8). This is implying either a redesign of the part or using support structures. As it is a common objective of the design step to minimize the postprocessing effort, redesigning should always be considered before applying support structures. Additionally, the minimization of supports also reduces the material waste during the whole process. Based on these results, it is conducted that the presented automated simulation framework can be used as a simplified evaluation tool for the debinding process.
Generally, the most detected failure mechanism over all examples is the tensile stress in the z-direction. Yet, the results are also strongly dependent on the parts’ initial orientation as can be seen in the example of the chassis diverter. However, it is possible to use the framework to make fast design iterations with quick evaluation of the part’s suitability for the debinding process. It is questionable if the simple global stress failure criterion is to predict the failure of complex structures on a high-fidelity level. In regard to the porous powder-based structure and brittle material behavior, Weibull statistics [
33,
34] could be used to increase the fidelity. In addition, other failure criteria for brittle materials as described for instance in [
35] can be considered in future research. Since the similarity of brown-parts to sandstones further suggests an influence of the hydrostatic stress on the failure stress limits, it can be further auspicious to investigate if the failure criteria for sandstone that are developed for example in [
36] can be applied to metal EAM brown-parts.
4.2. Impact for Design for Additive Manufacturing
By automating the entire simulation process, there is no need for user intervention until the results are evaluated and a decision is made whether a valid design has been found. Thus, especially the time-consuming steps inside the preprocessing can be conducted in a much more efficient manner. This enables shorter lead times in product development for metal EAM applications.
An automated debinding simulation is furthermore beneficial for efficiently determining design guidelines with reduced experimental effort, e.g., the results can be used to evaluate critical lengths for unsupported overhangs in debinding and sintering. Additionally, weak spots of the design can be identified leading to more robust designs and reducing experimental trial and error. If restrictions disallow the redesign of the investigated part, the planning of the support structures can be done in respect to the simulation results. This could be achieved by arranging support structures at locations where high displacements occur. Therefore, support structures can be planned smarter and more reasonable, leading to the potential of drastically saving material and post-processing effort.
Nevertheless, it is important to emphasize that stress limits in [
20] are empirically determined for the catalytic debinding process of solid printed parts with 100% infill. This should be used as an estimation tool in the design process. The next step of future research is thereby to fabricate the application examples and validate the developed framework. Additionally, it is also the subject of future work to evaluate stress limits for other debinding processes such as solvent debinding, or the final thermal debinding, where the binder backbone is removed, to obtain a broader flexibility of the framework. Furthermore, the investigation of stress limits for various infill degrees and infill structures are of high interest for the practical use of metal EAM.


