Geometrical Optimization of a Venturi-Type Microbubble Generator Using CFD Simulation and Experimental Measurements


Abstract
:1. Introduction
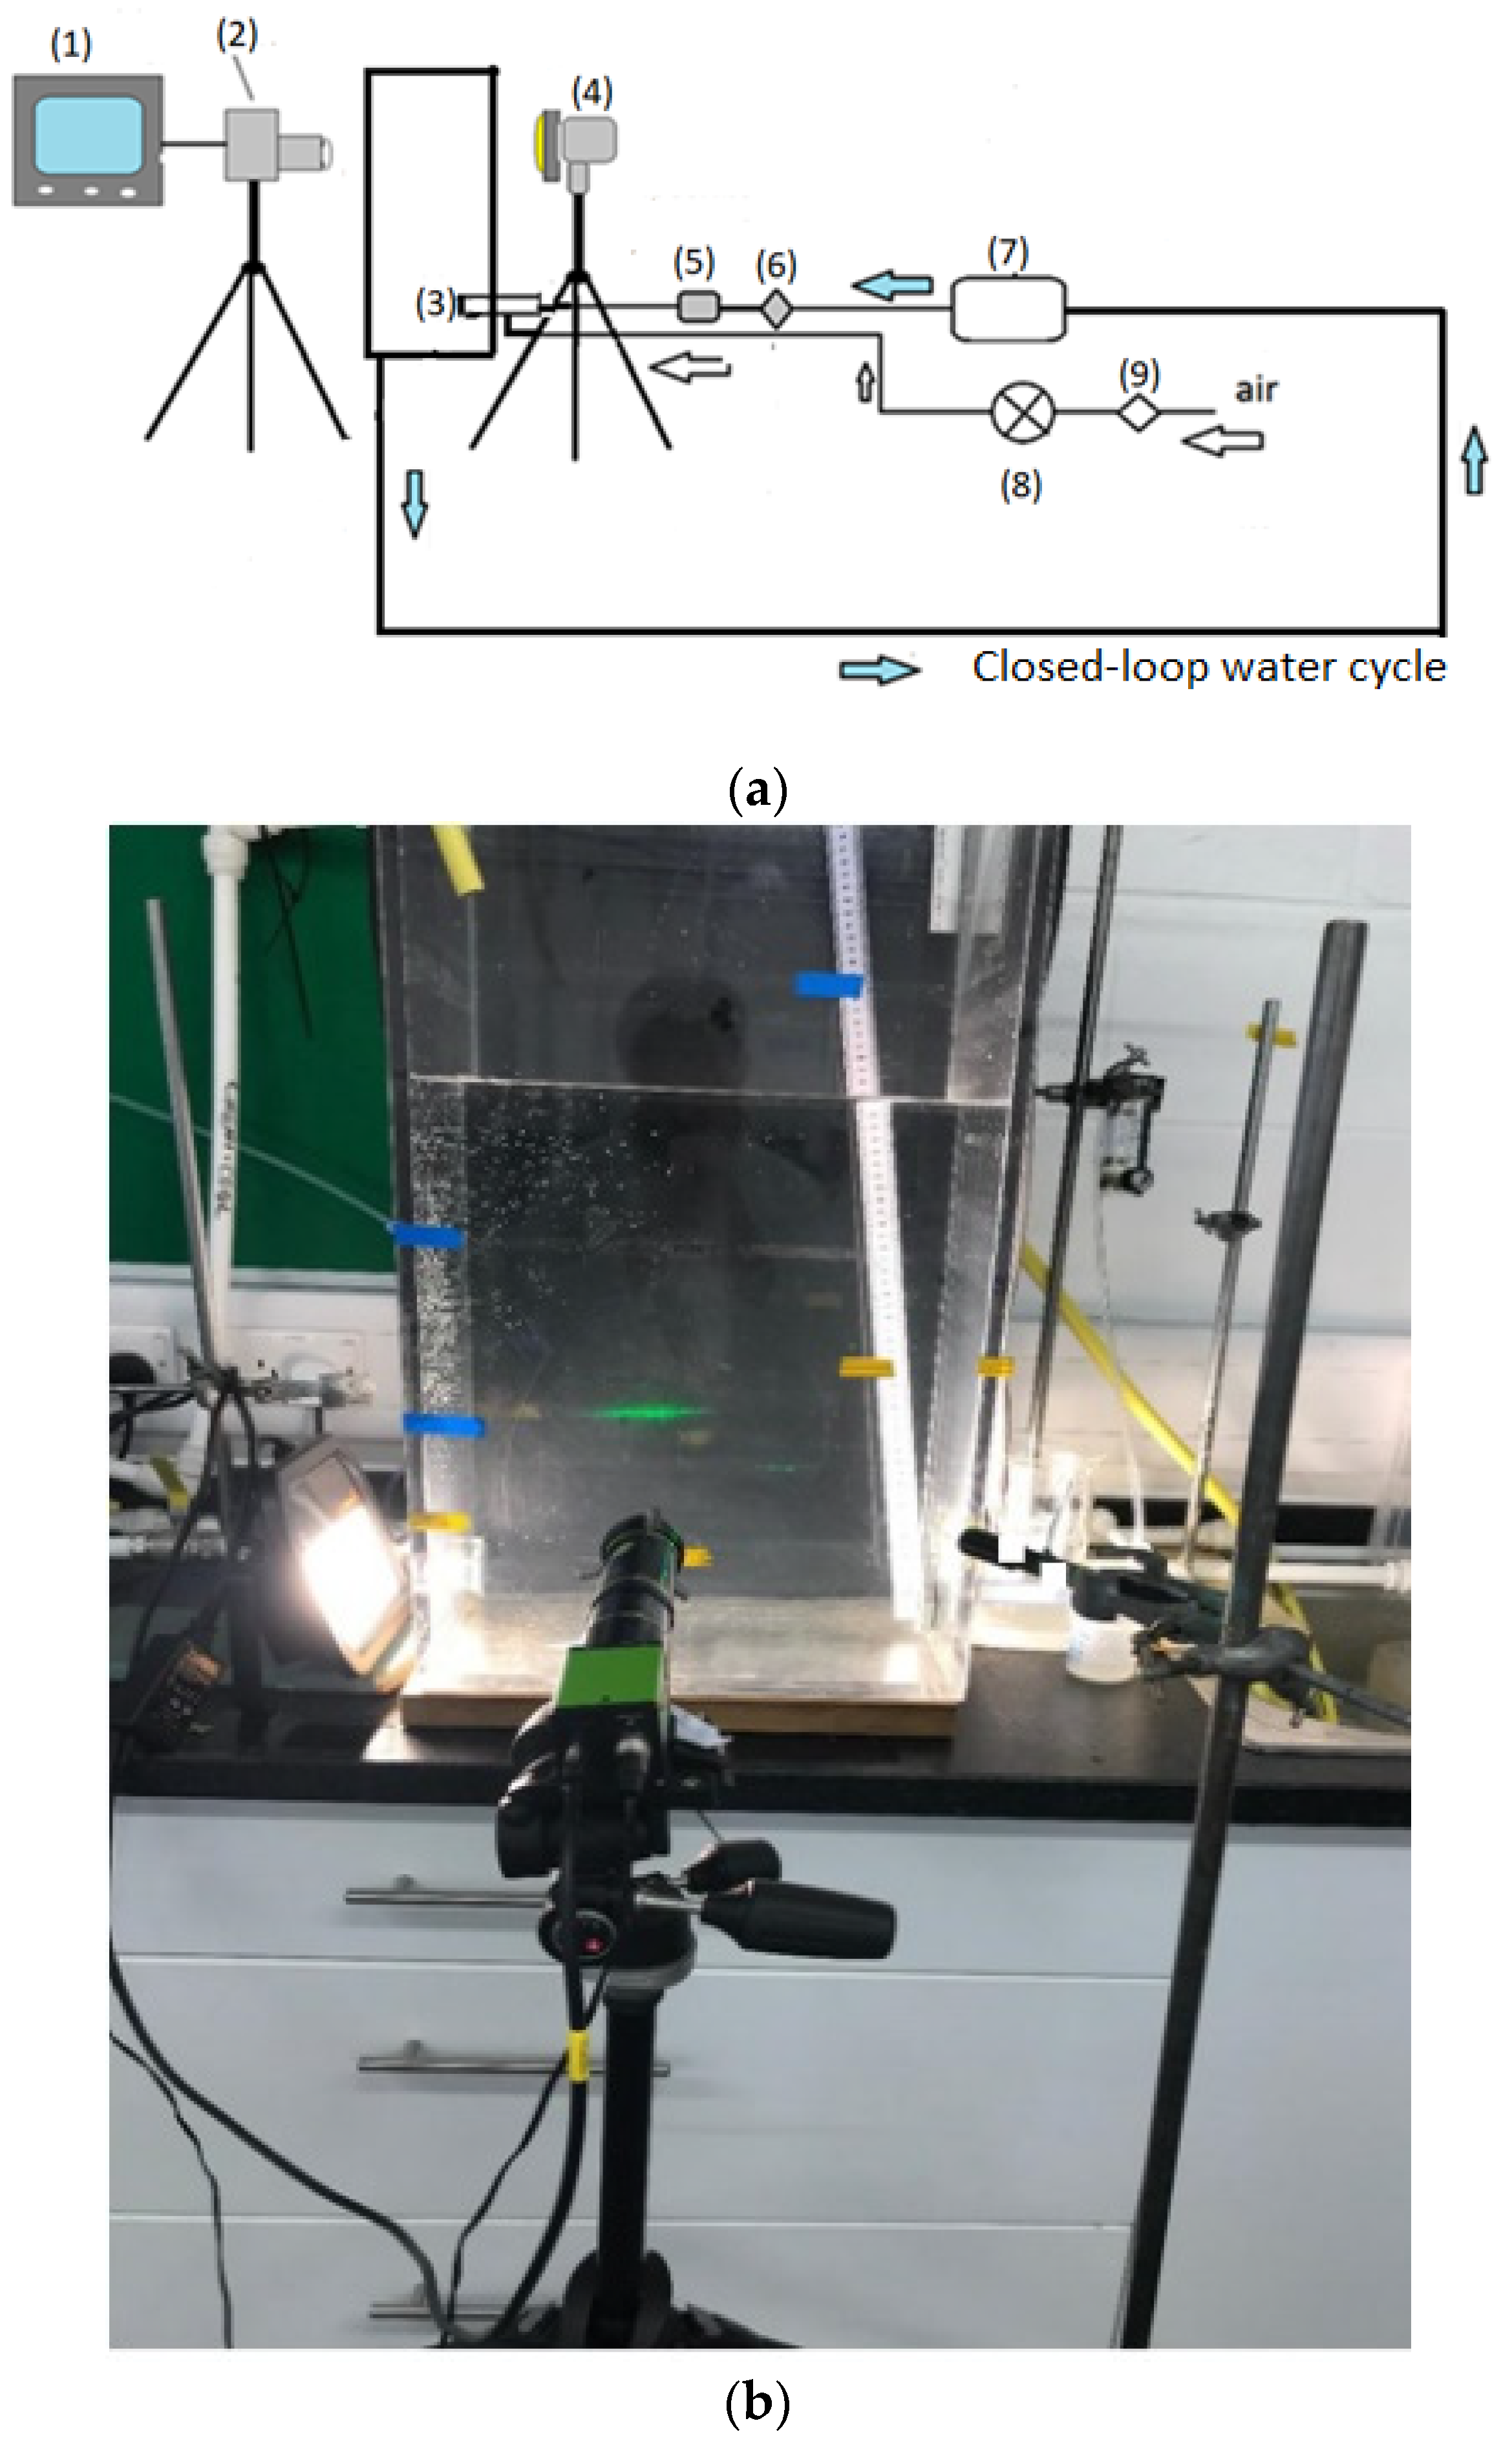
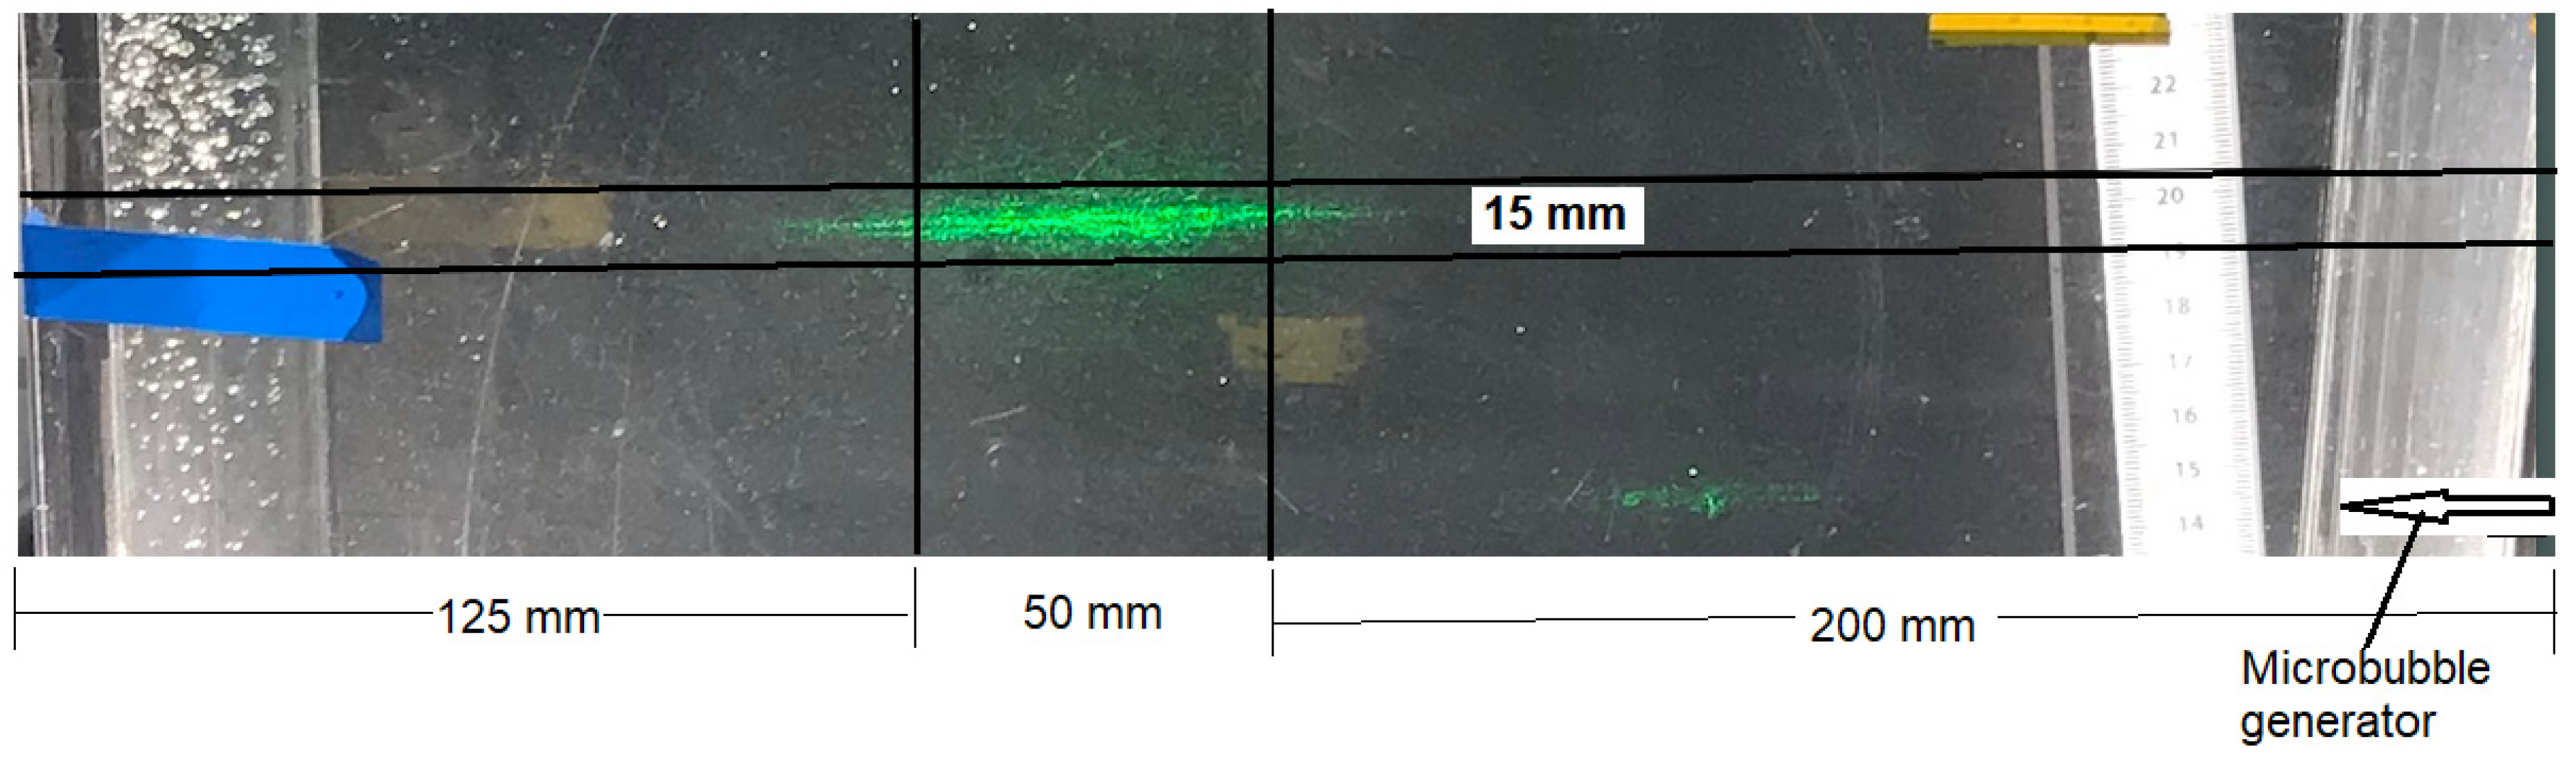
2. Experimental
3. CFD Model and Simulation
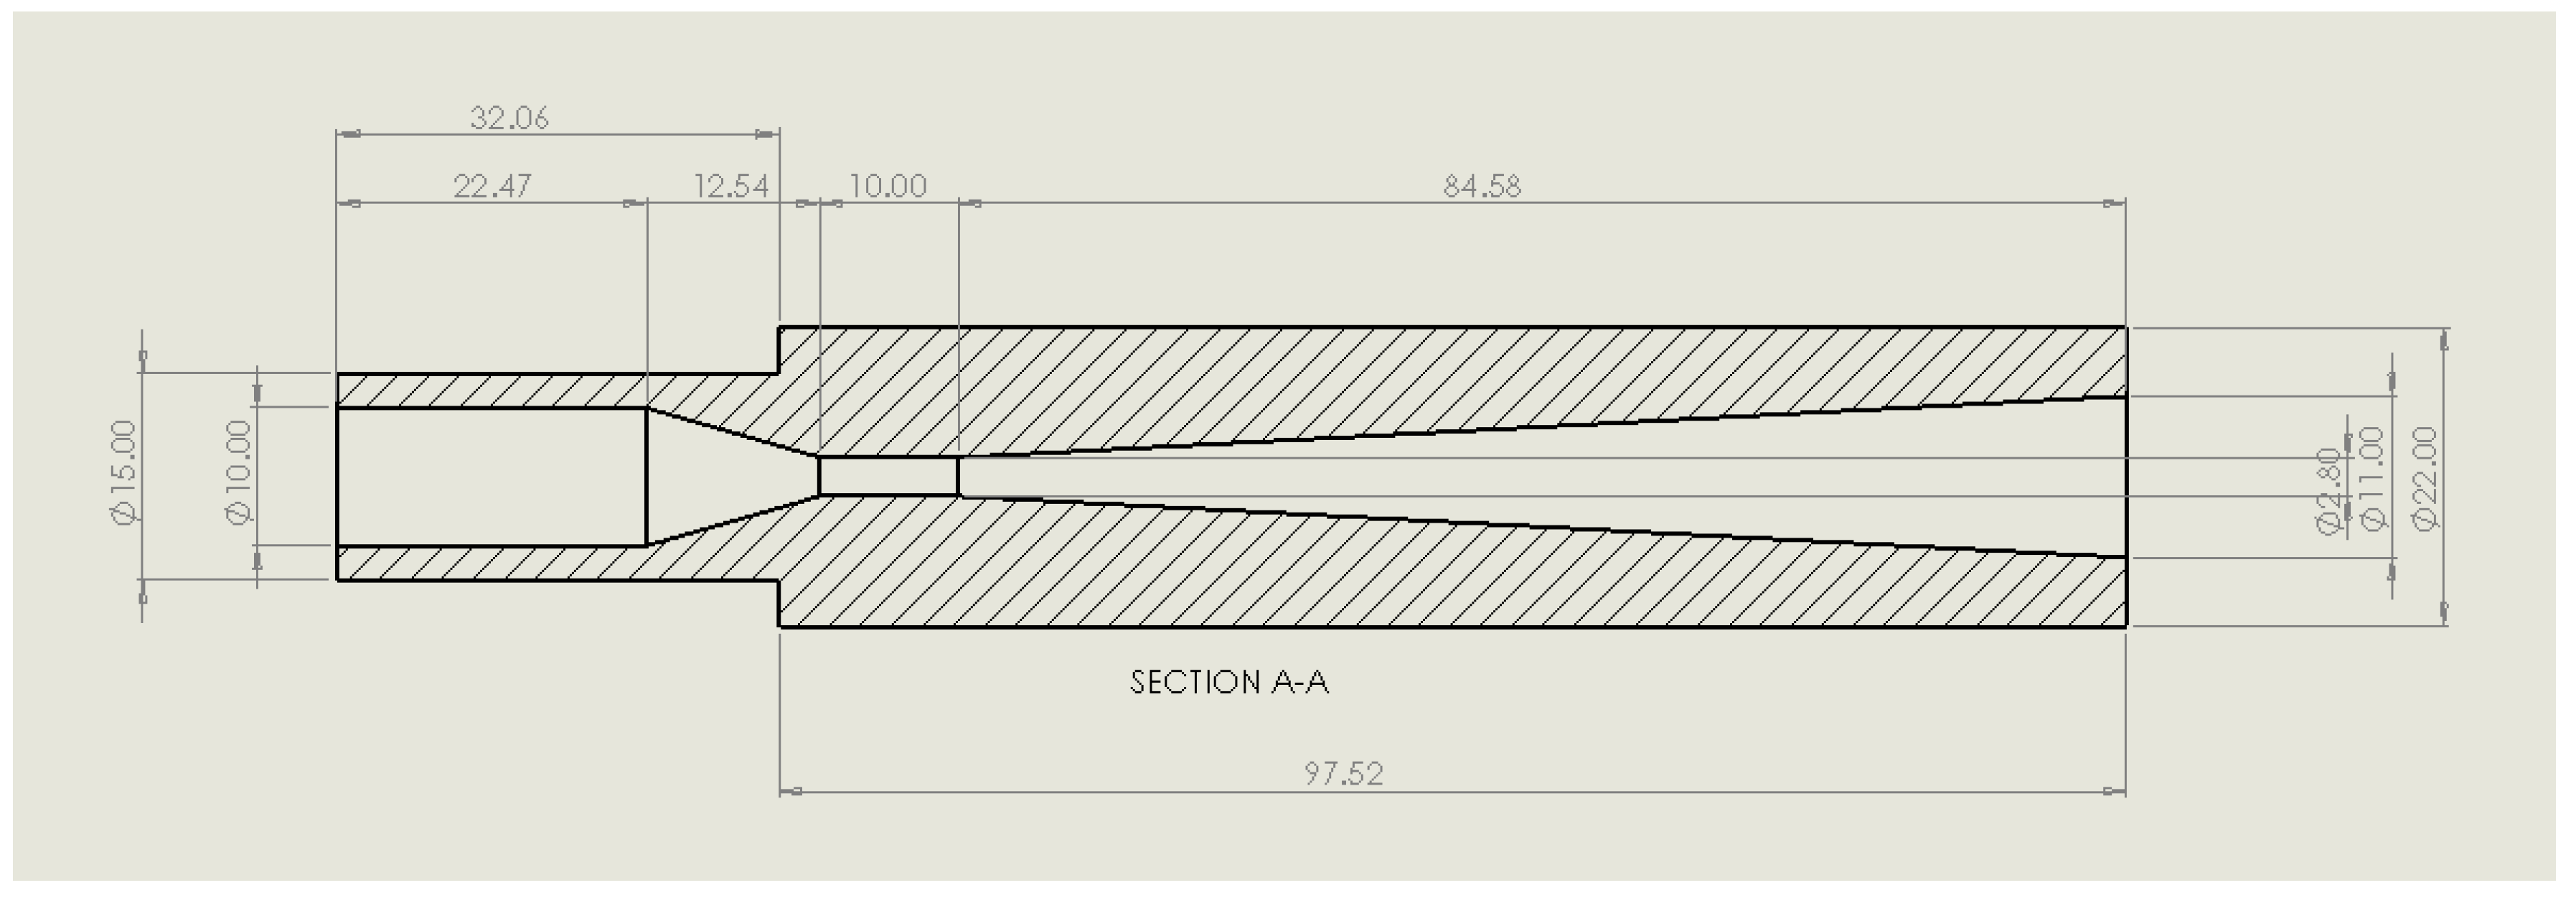
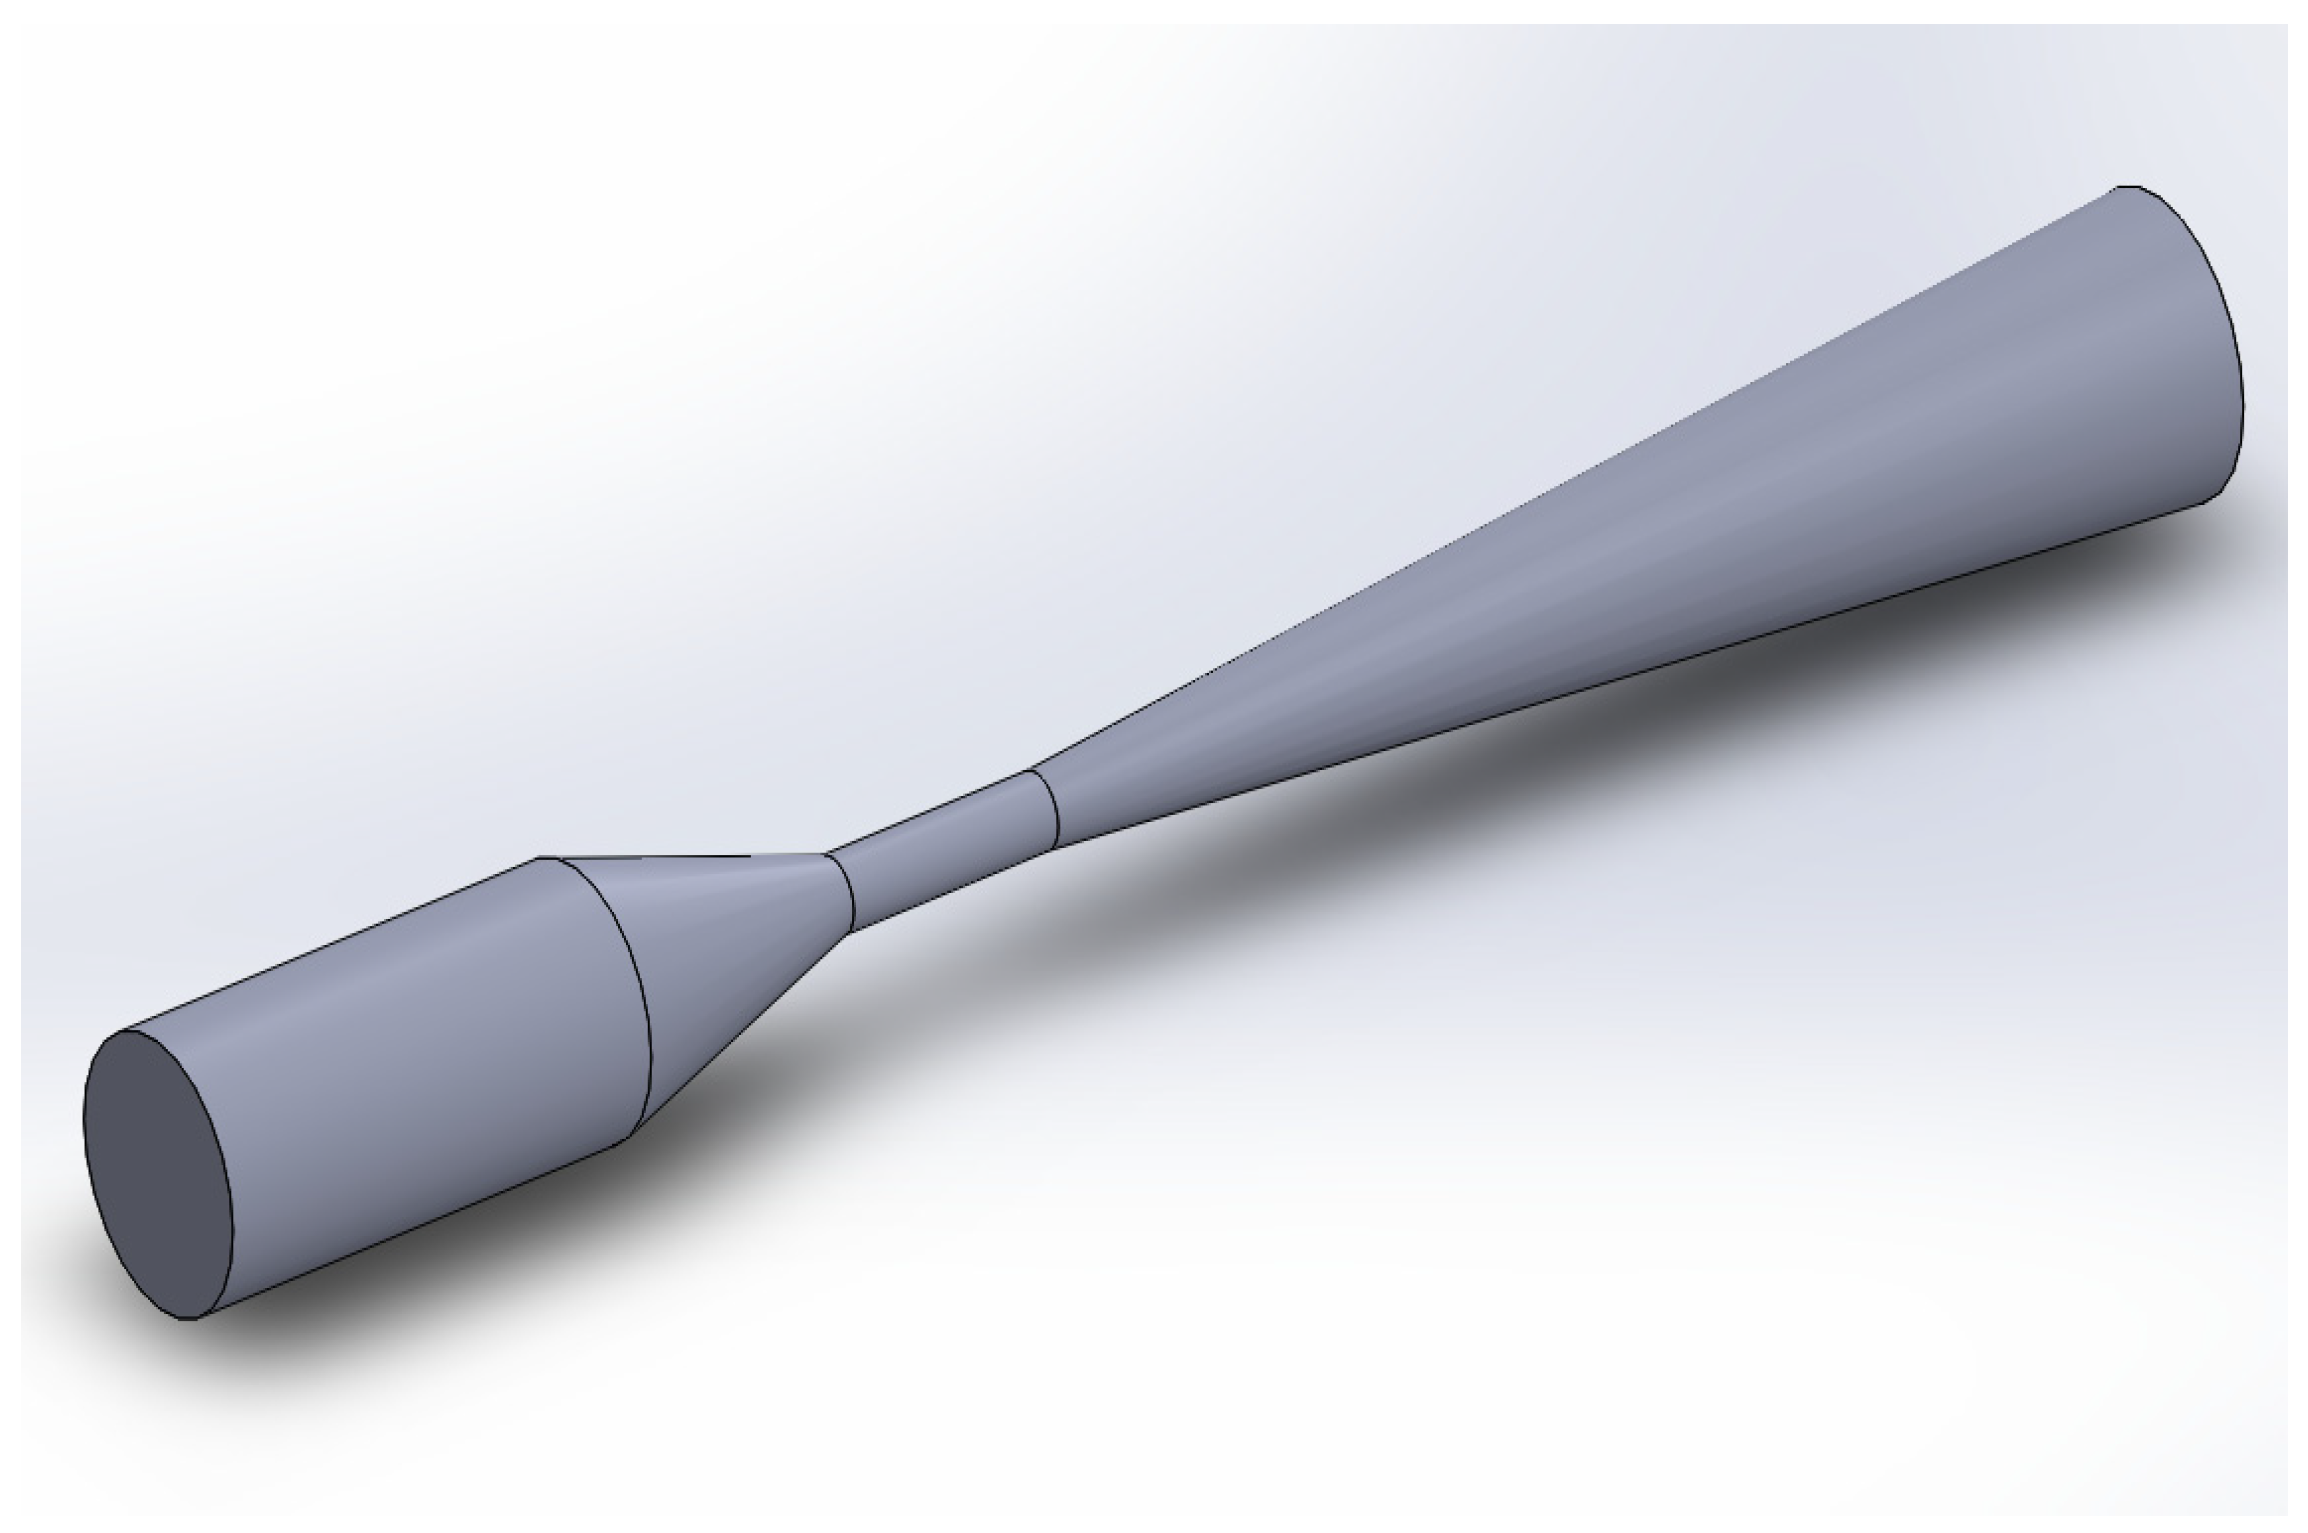
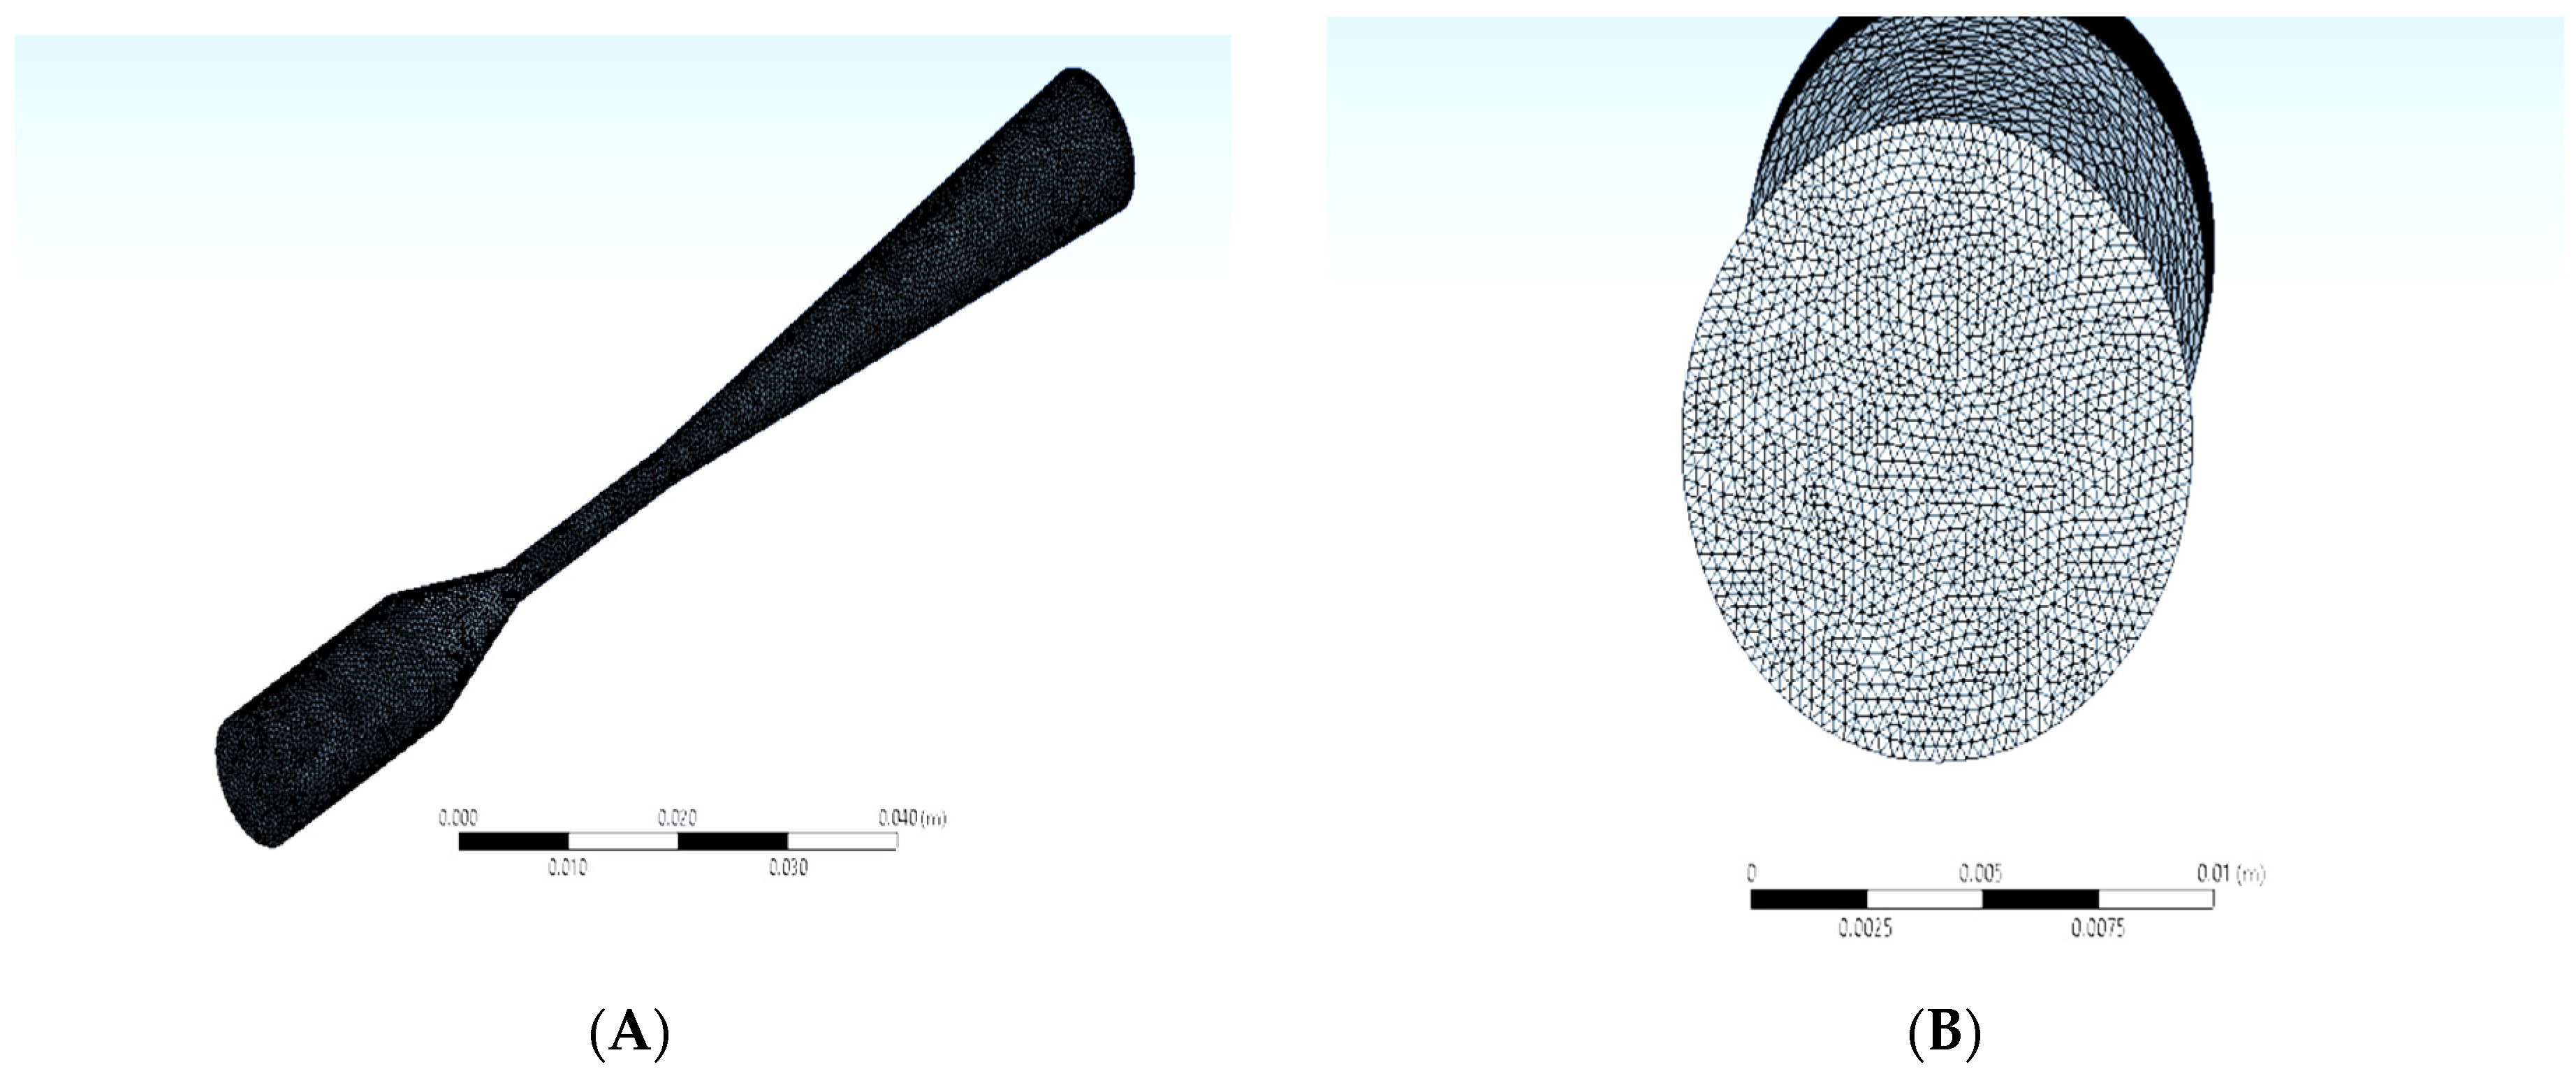
3.1. Geometry Setup
3.2. The Mathematical Model
3.2.1. Continuous Phase
3.2.2. Bubble Equation
4. Results and Discussion
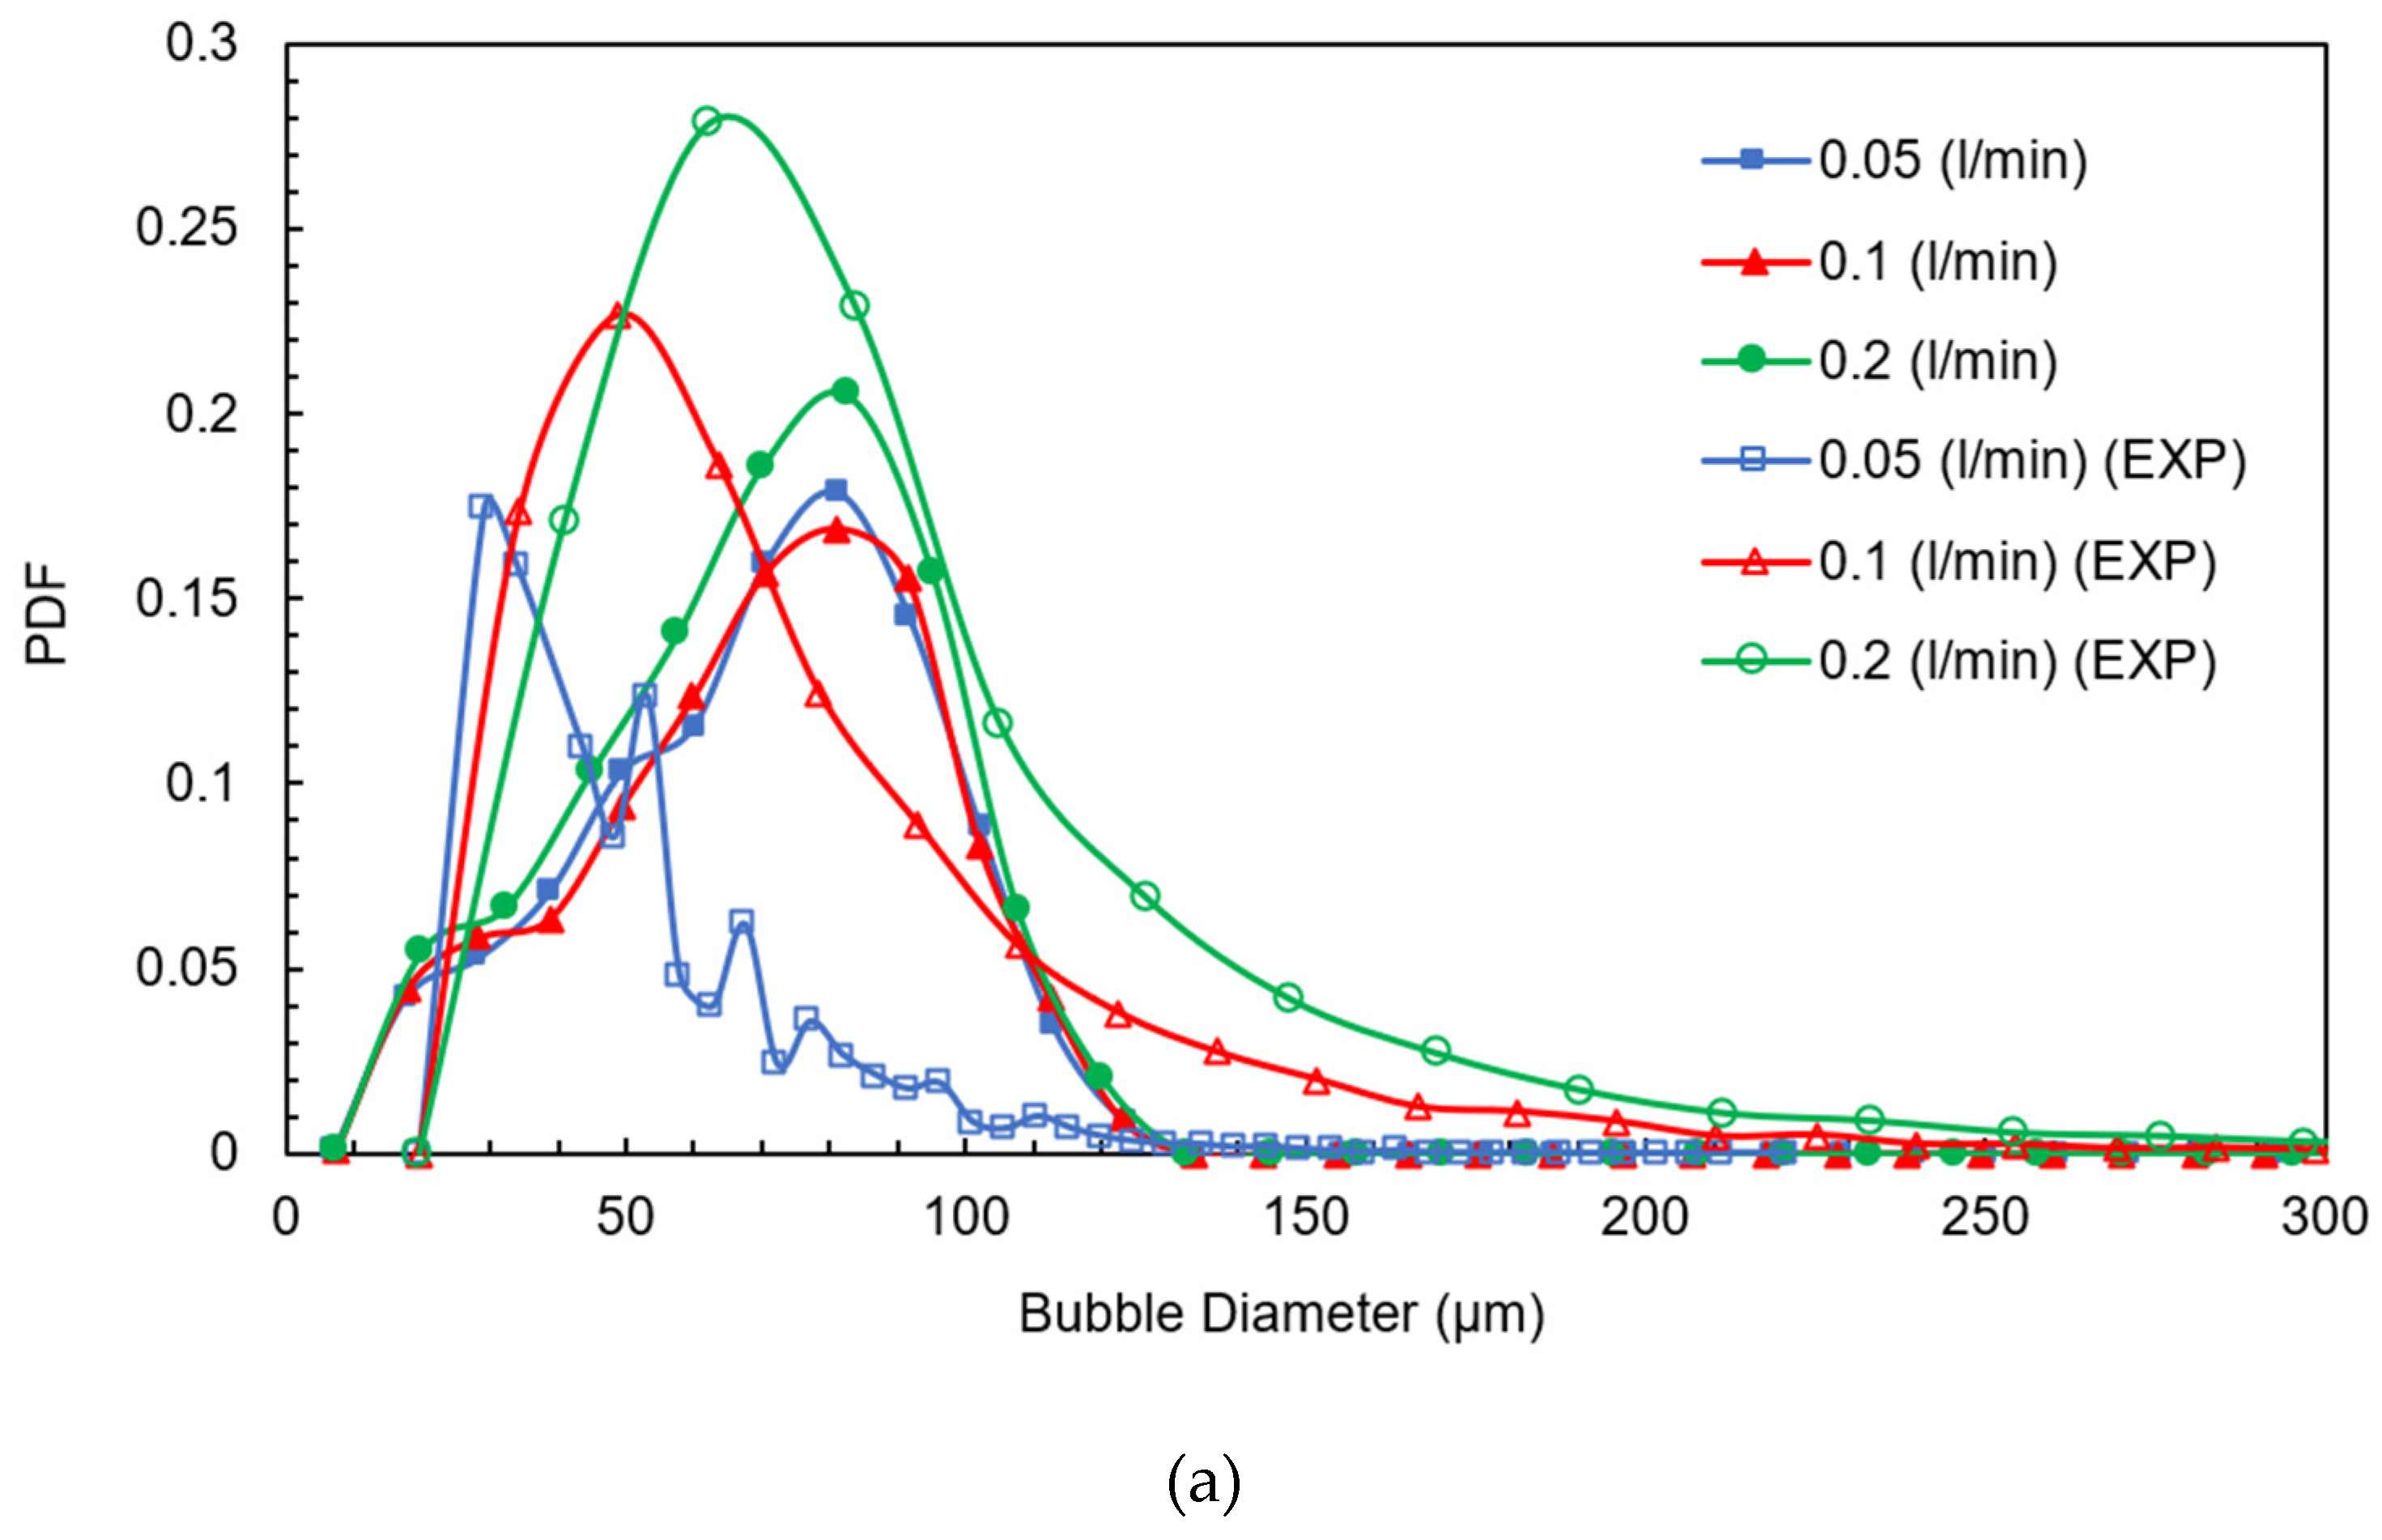
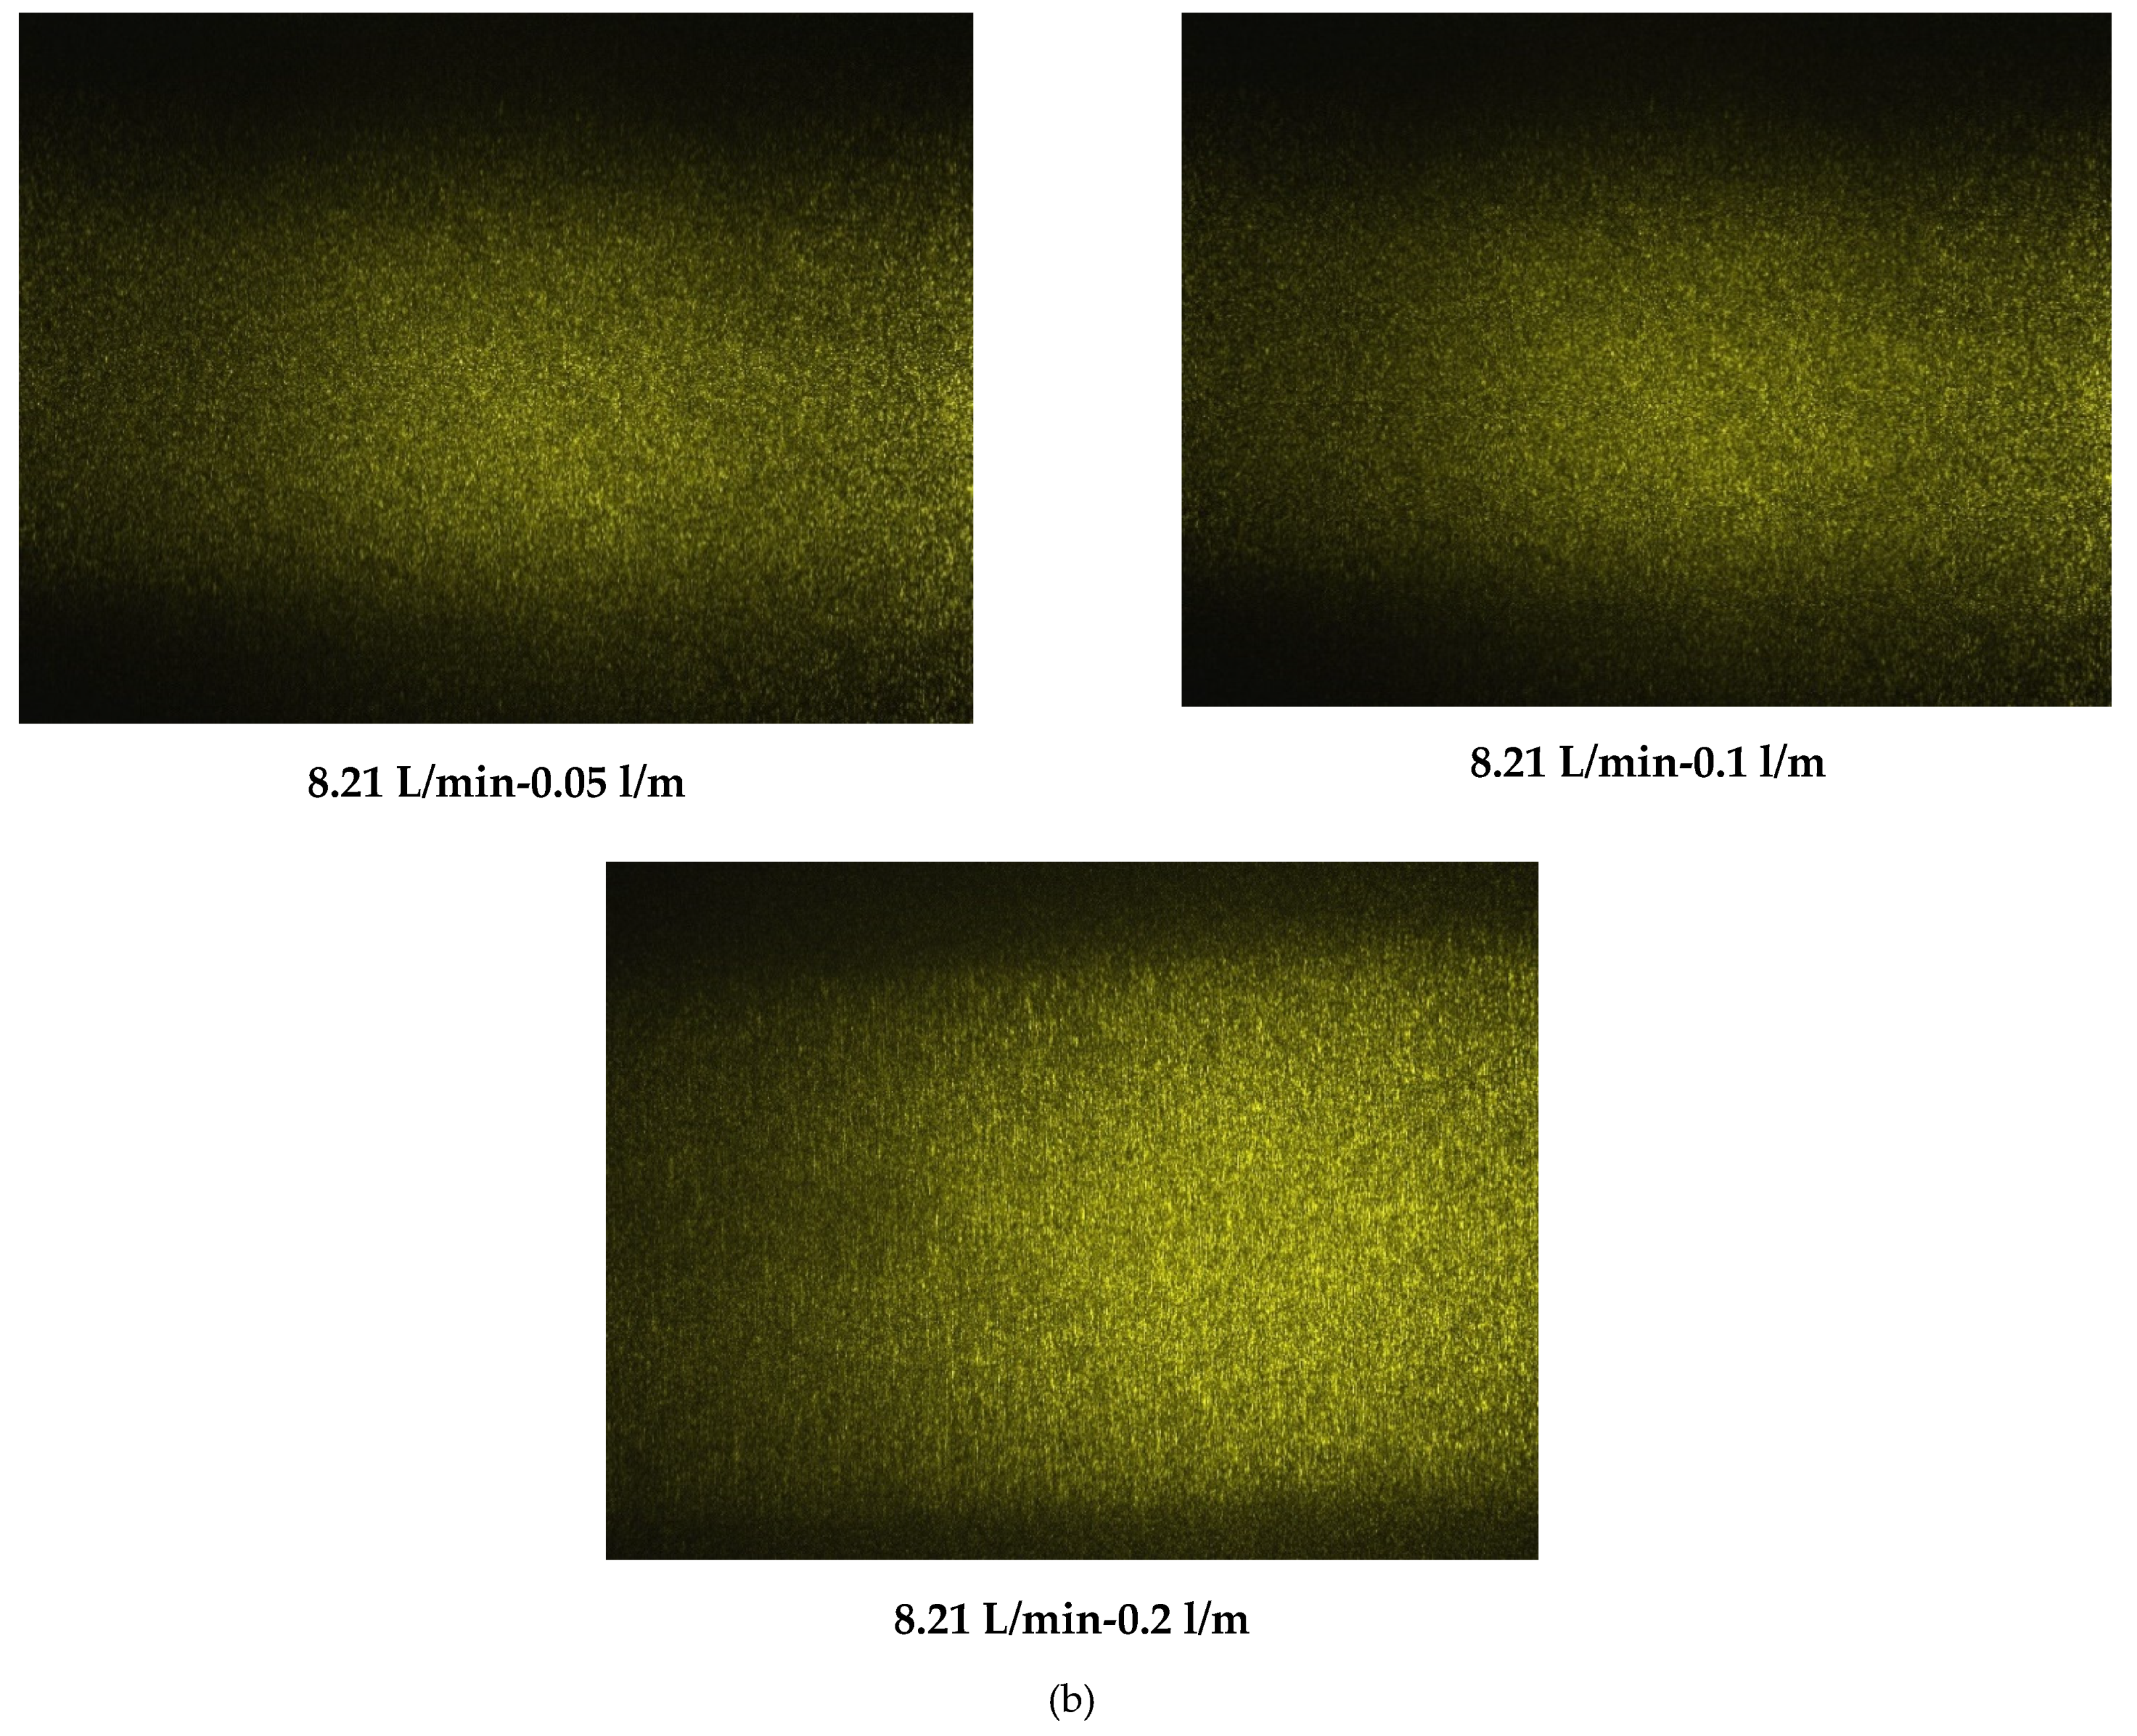
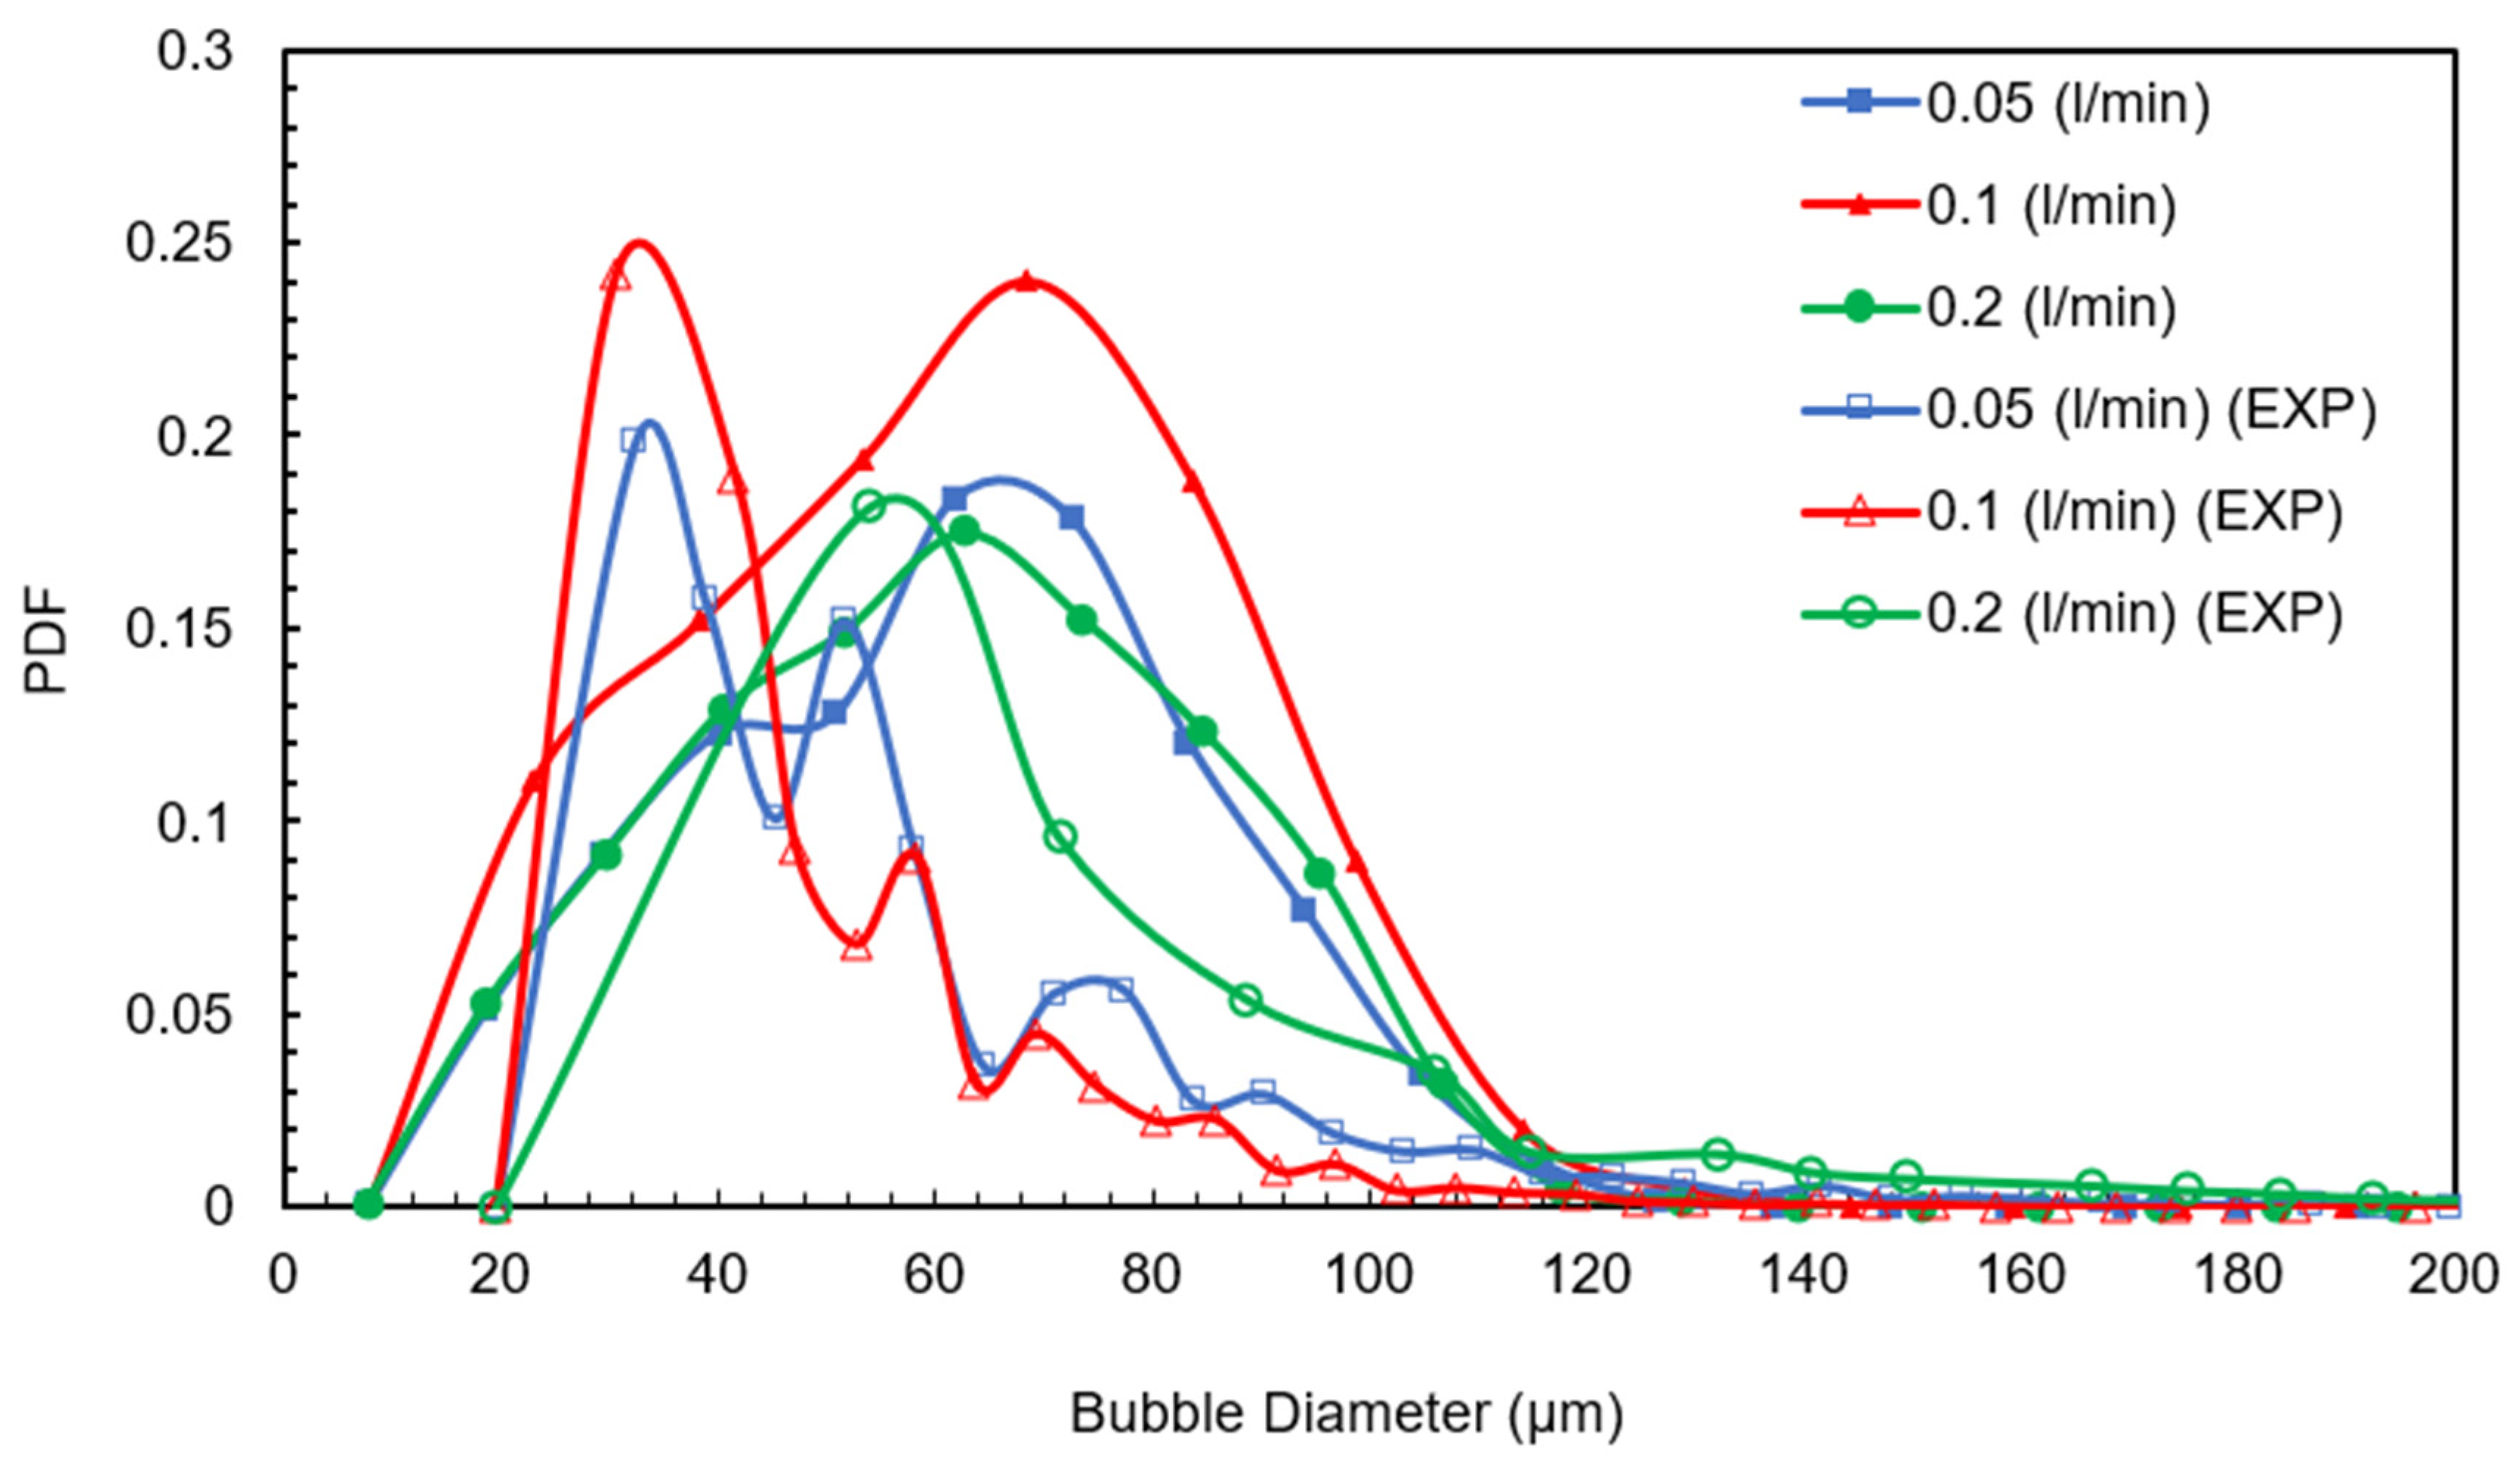
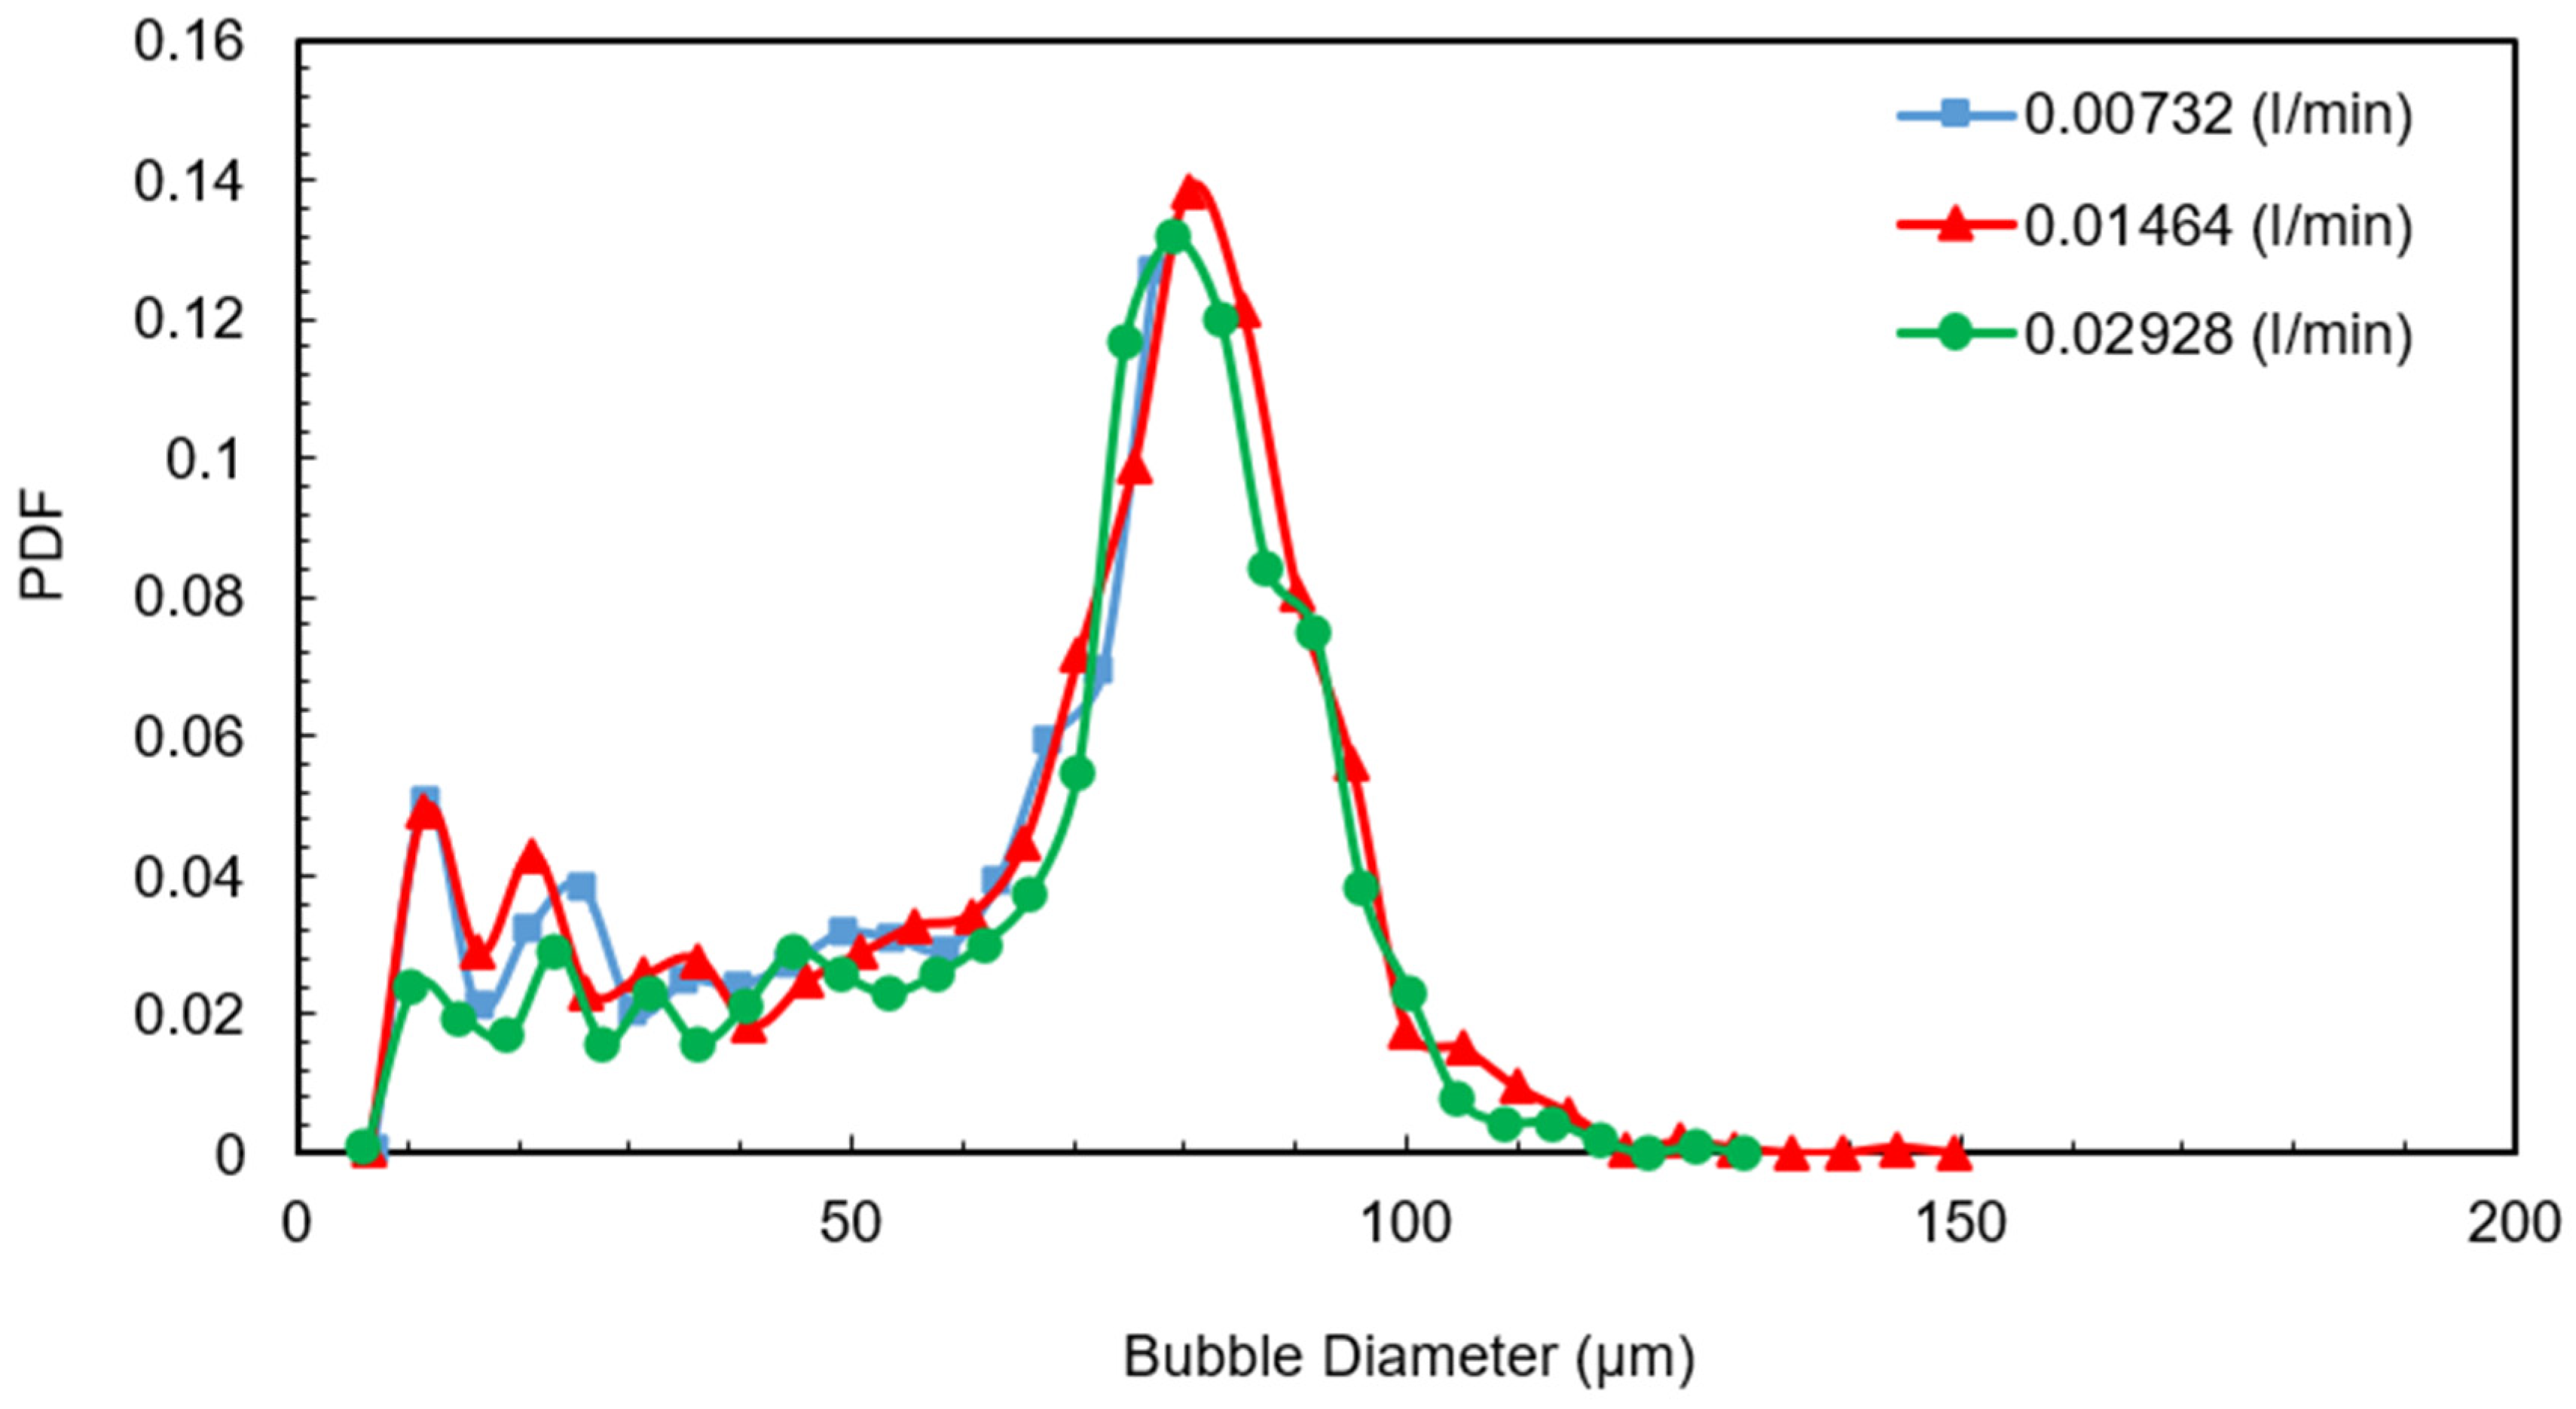
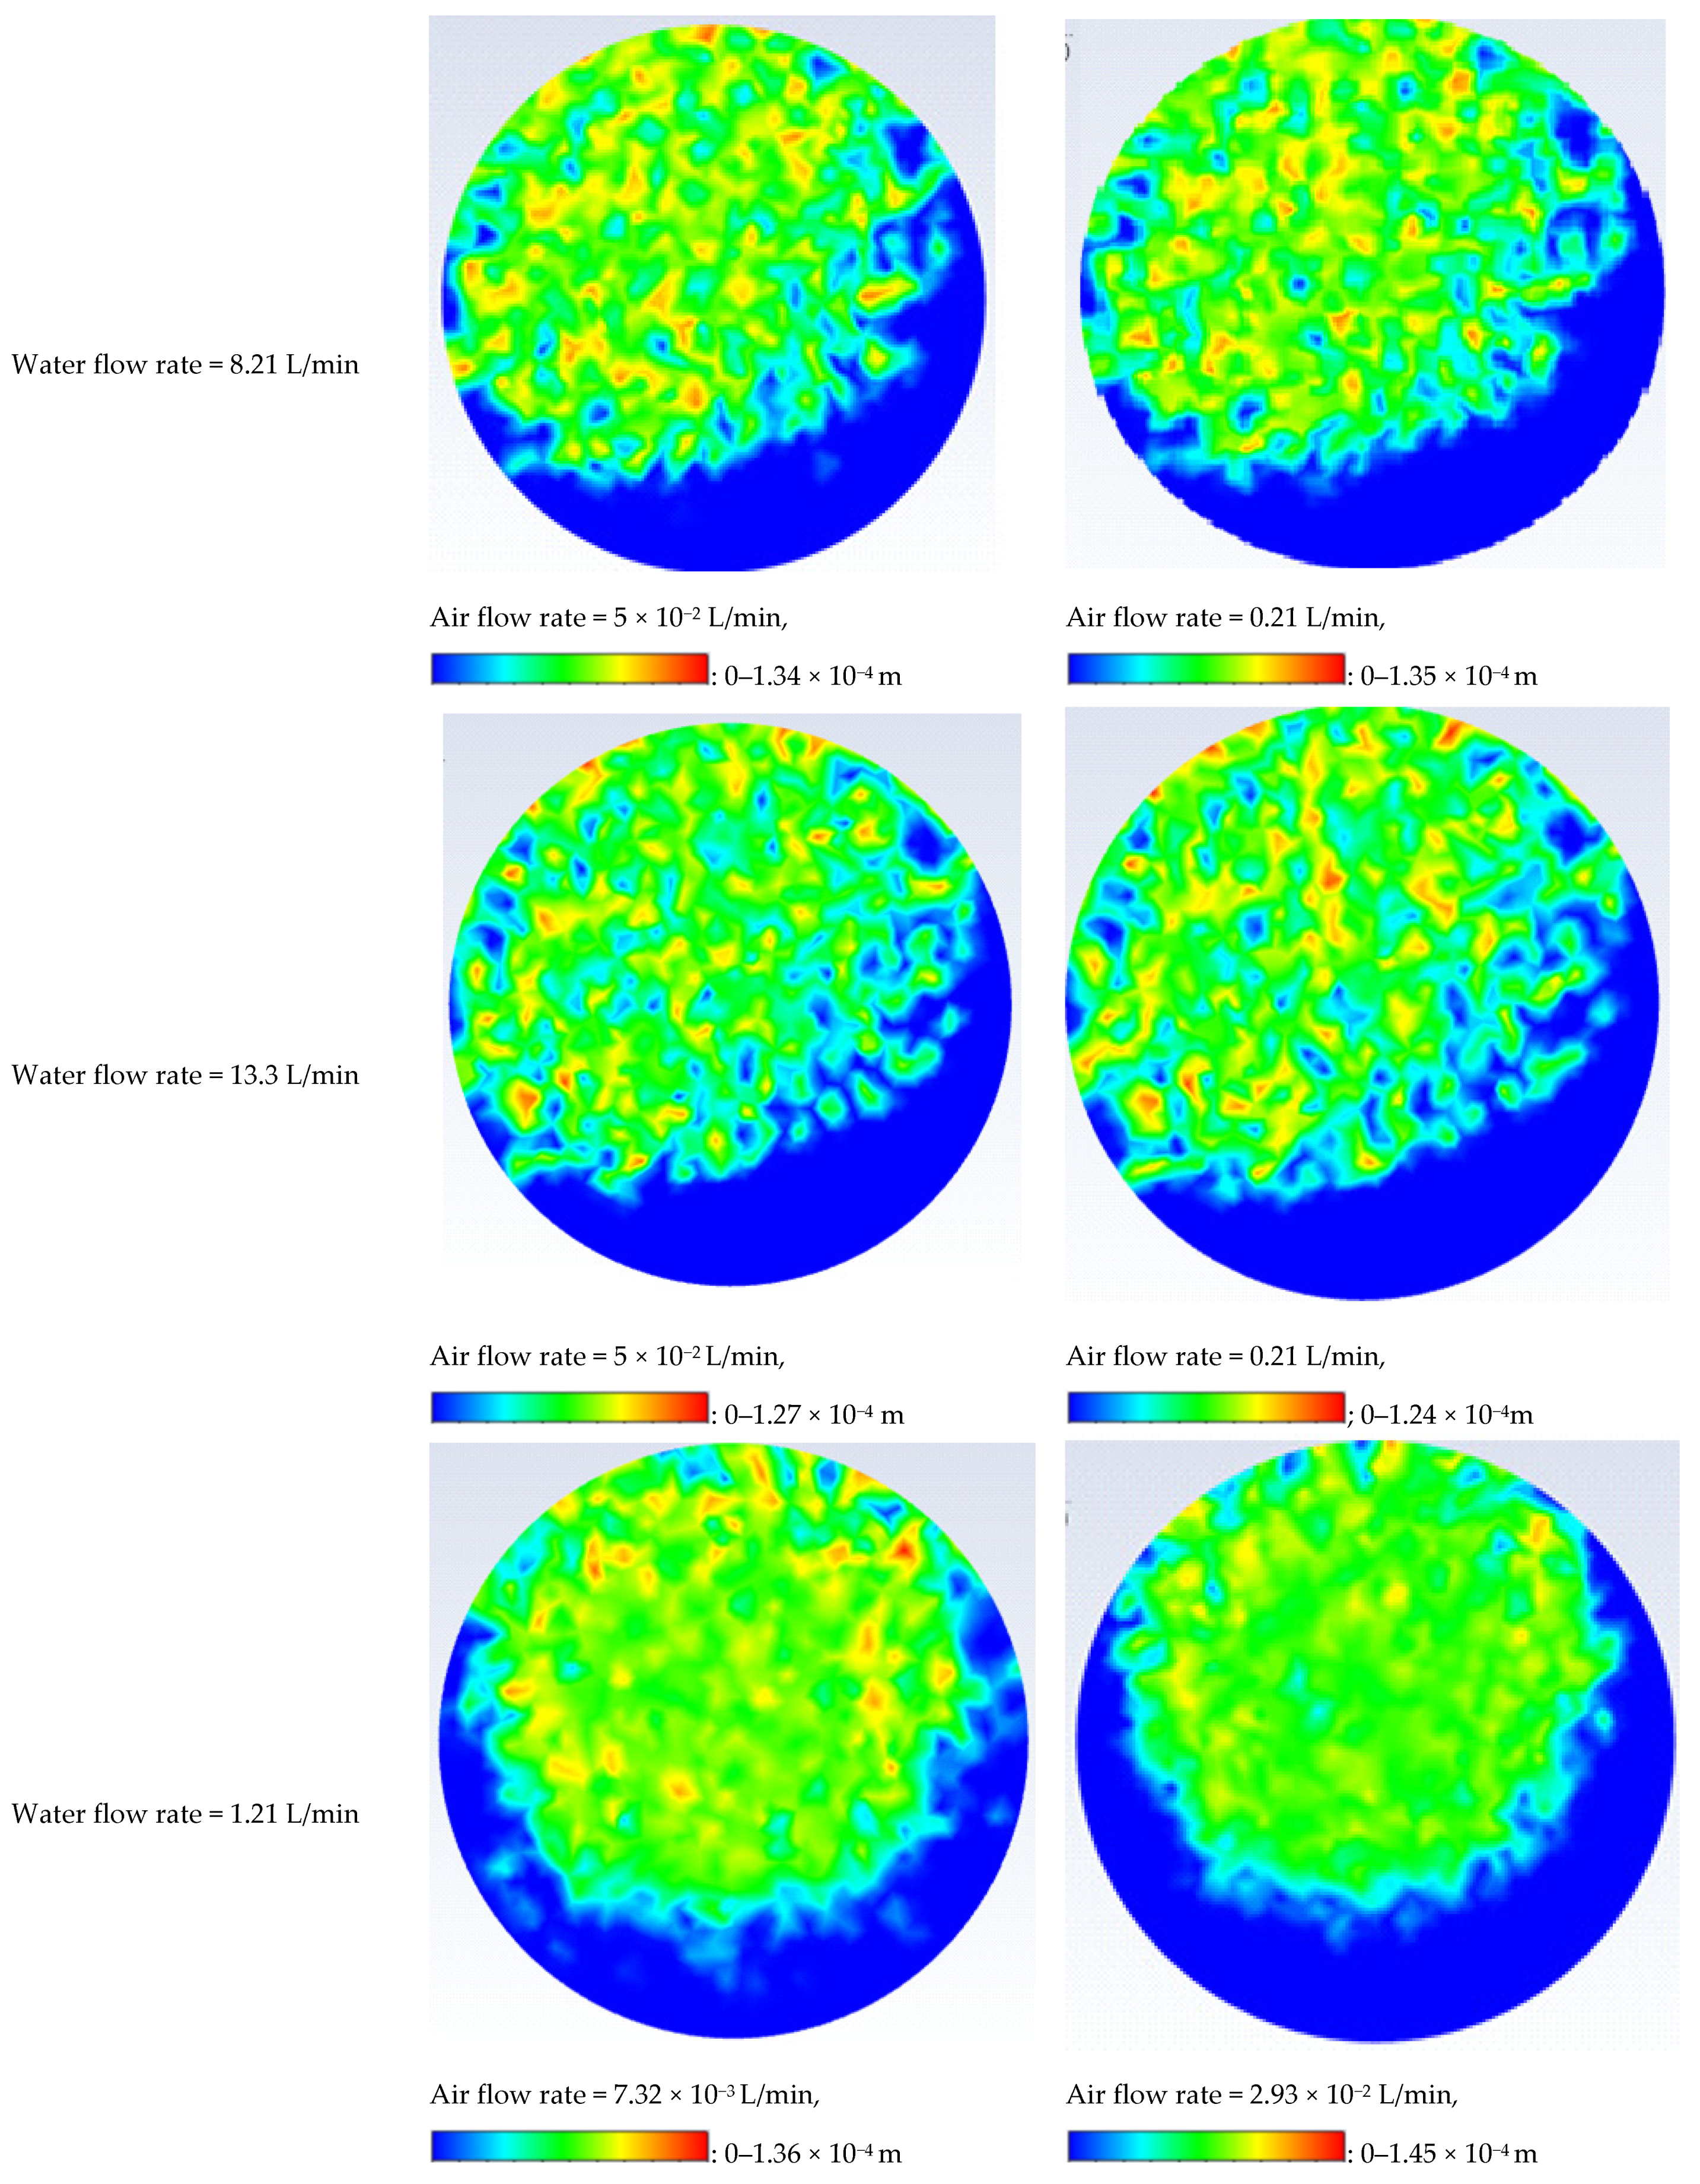
4.1. Effect of Flow Rate and Volumetric Quality
4.2. The Effect of Geometrical Parameters on Average Bubble Diameter and Bubble Diameter Distribution
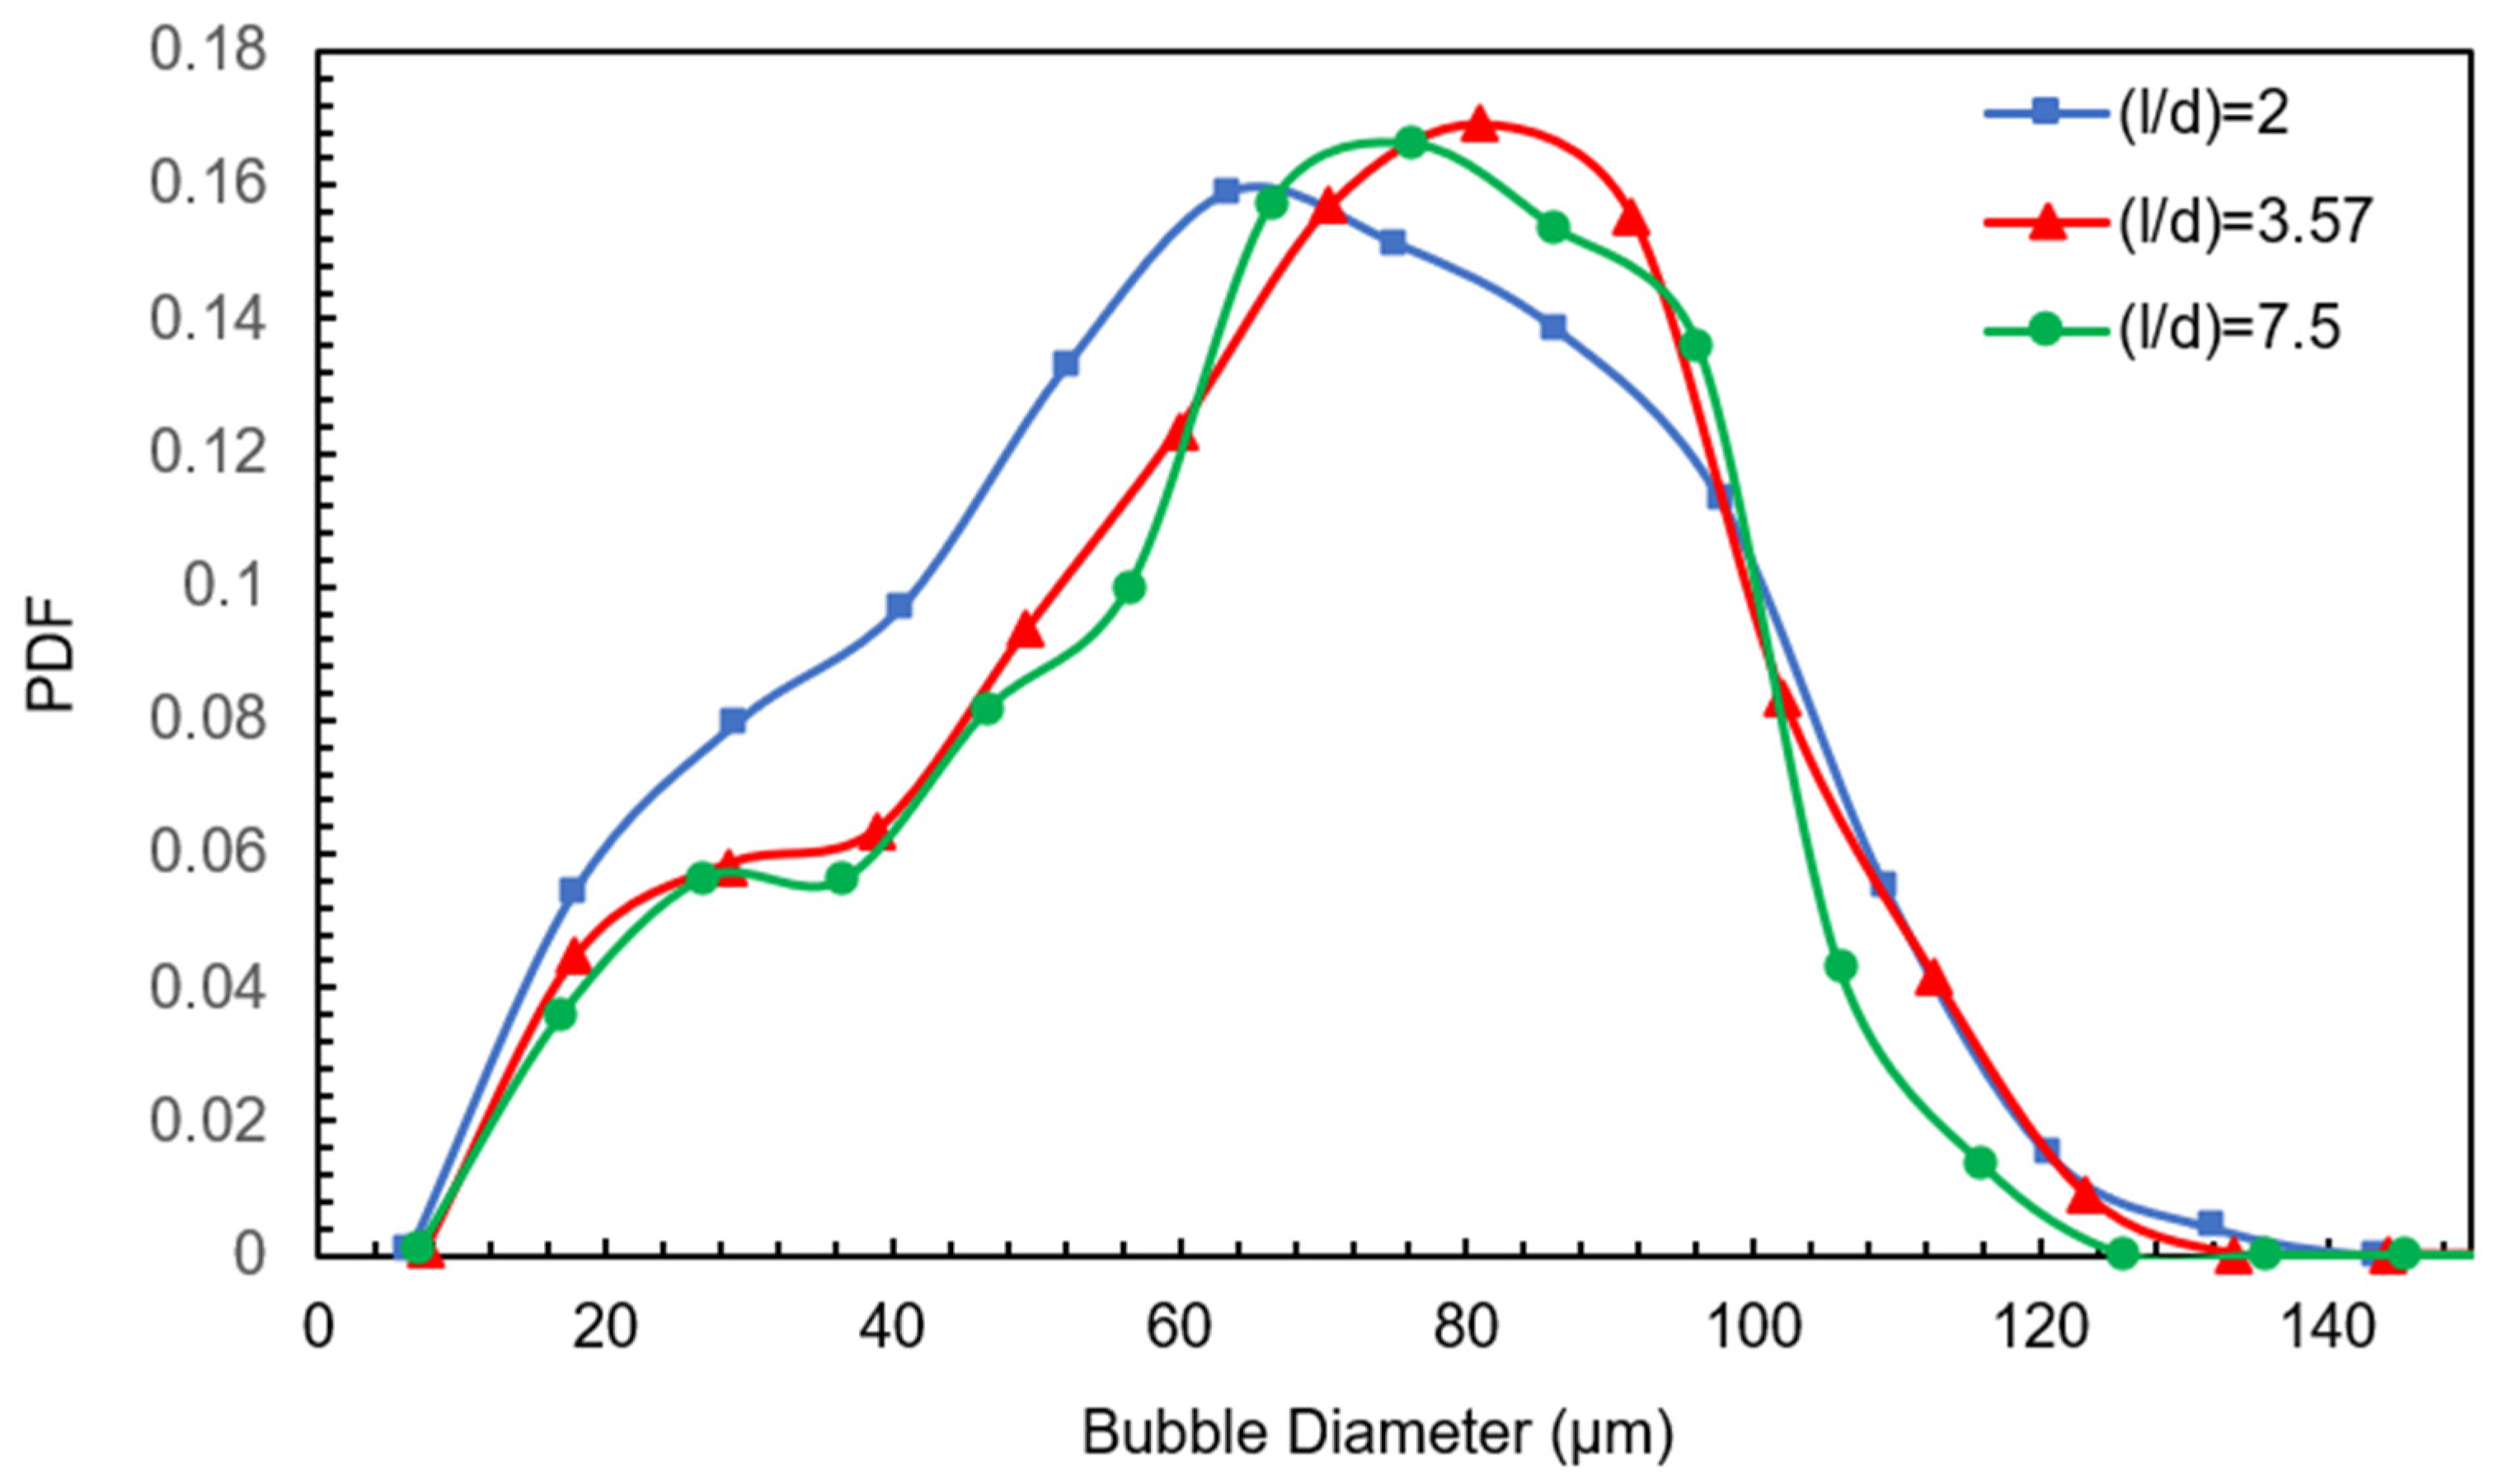
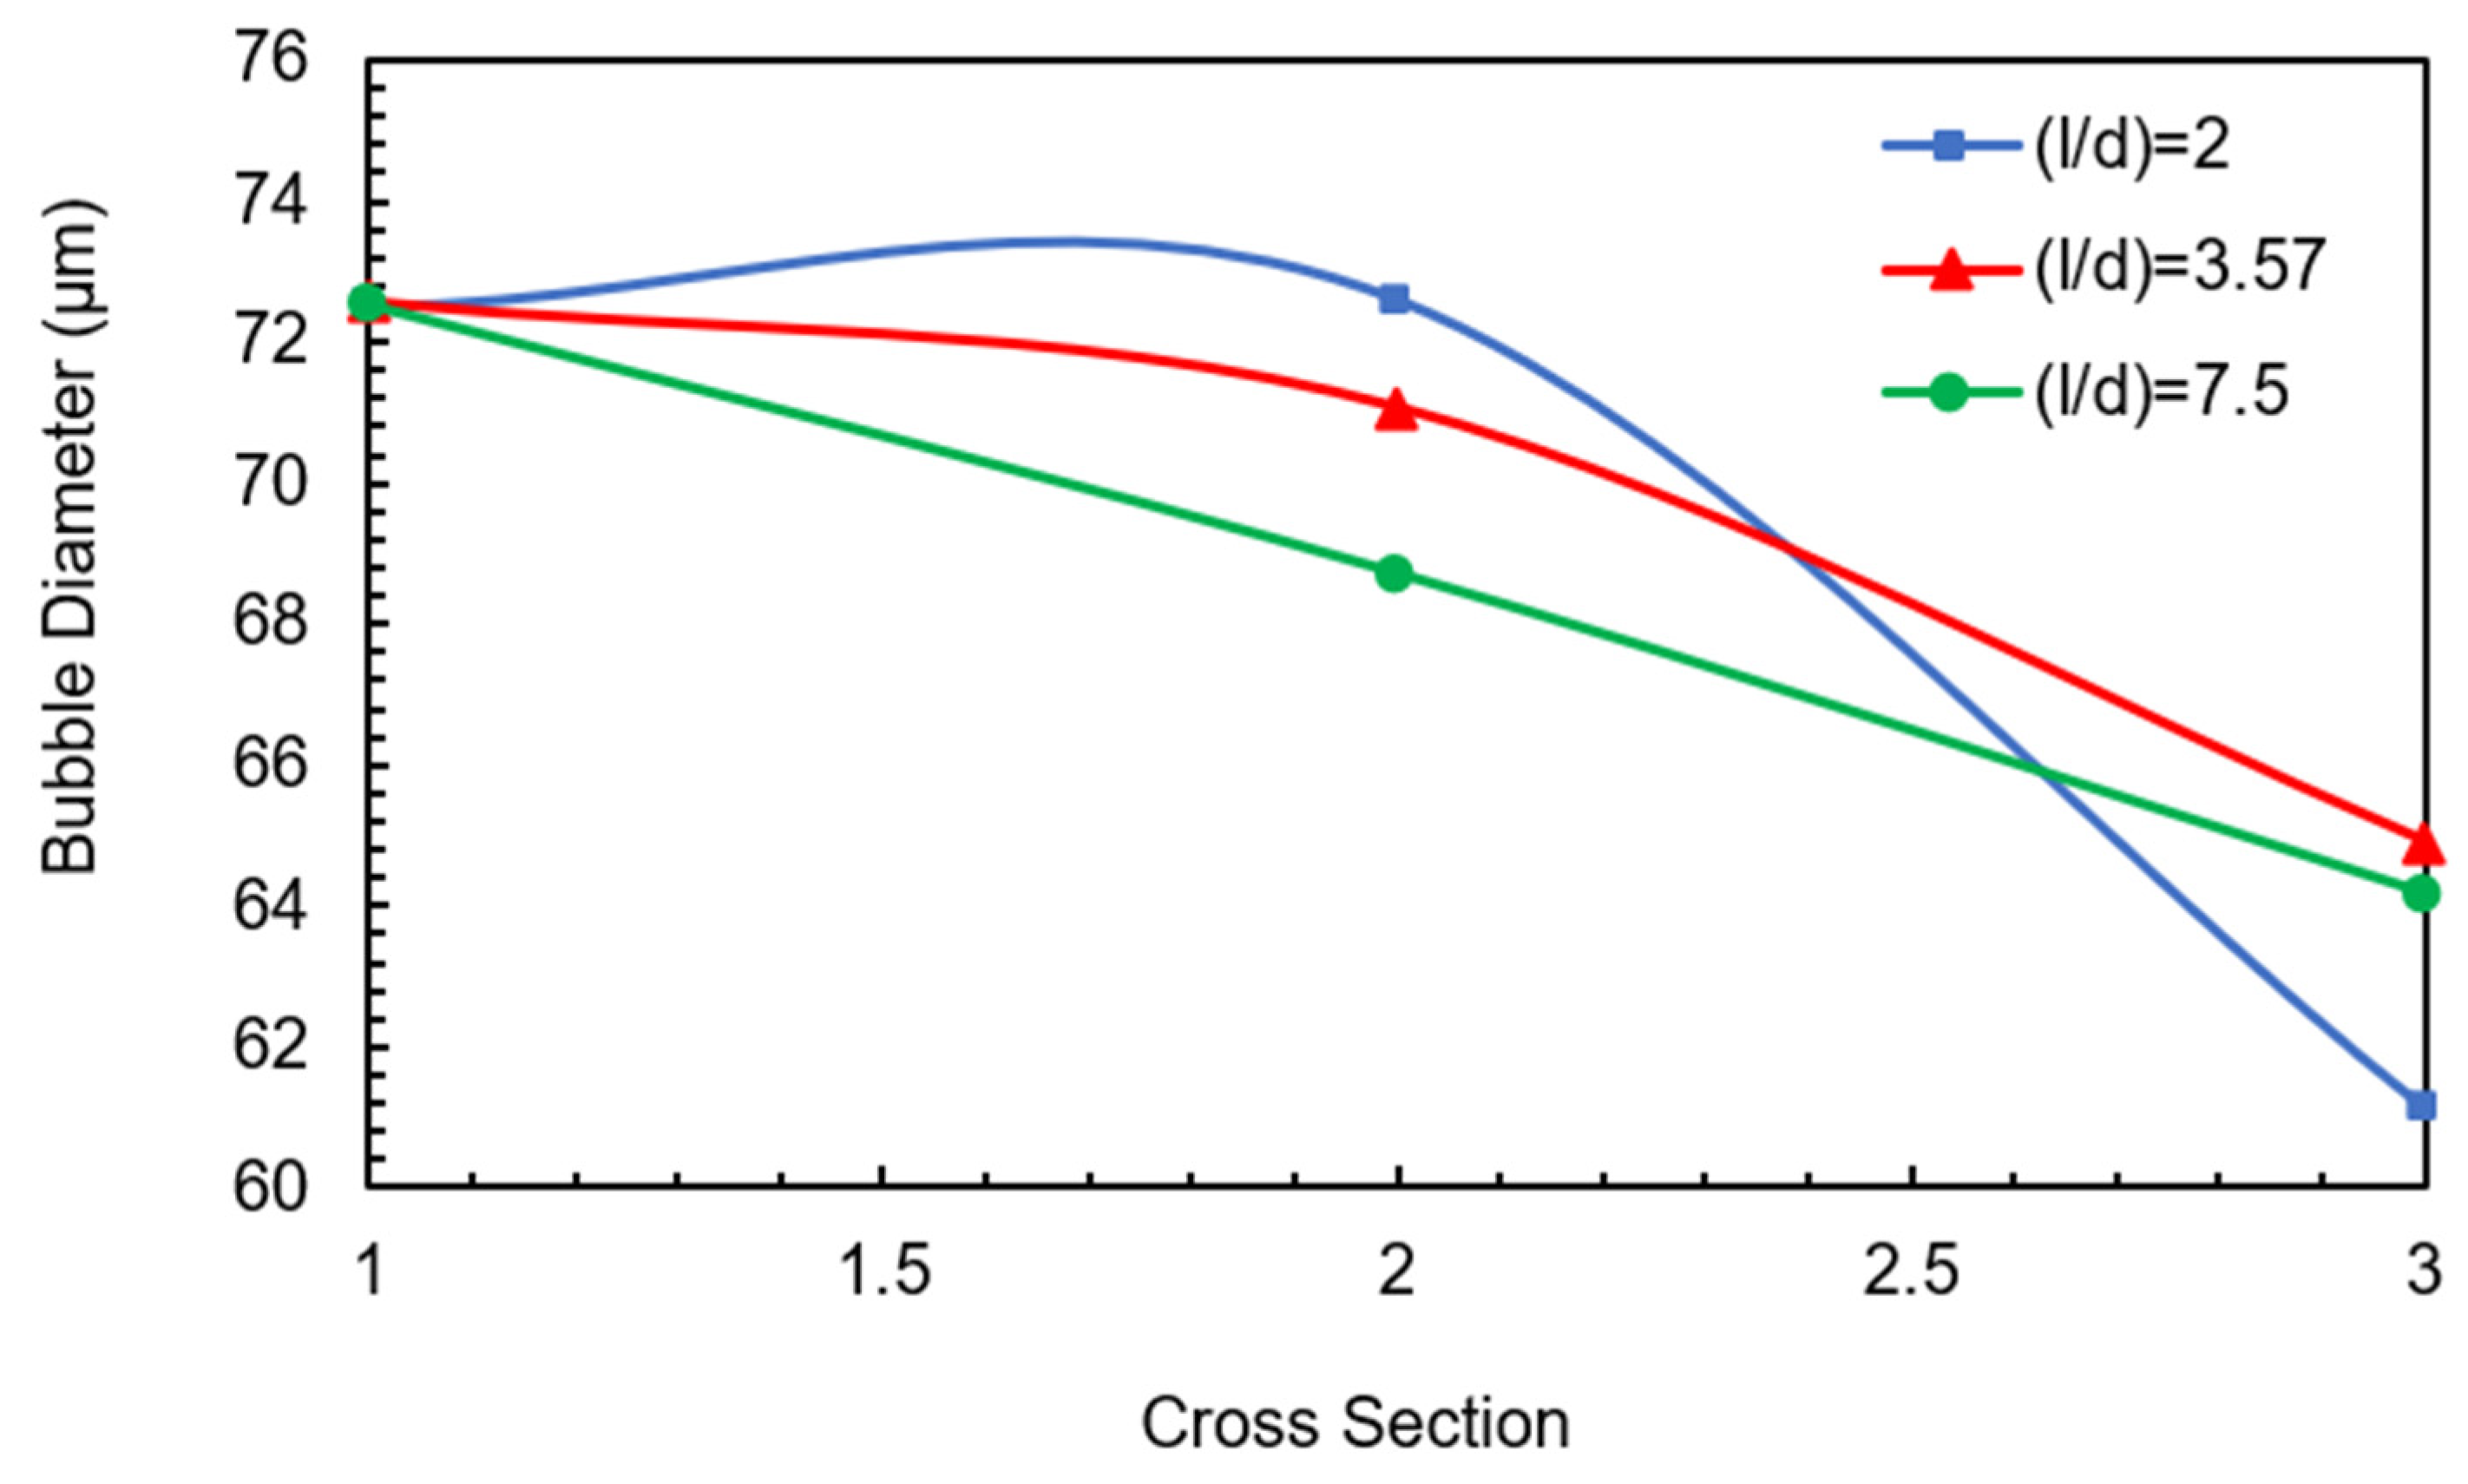
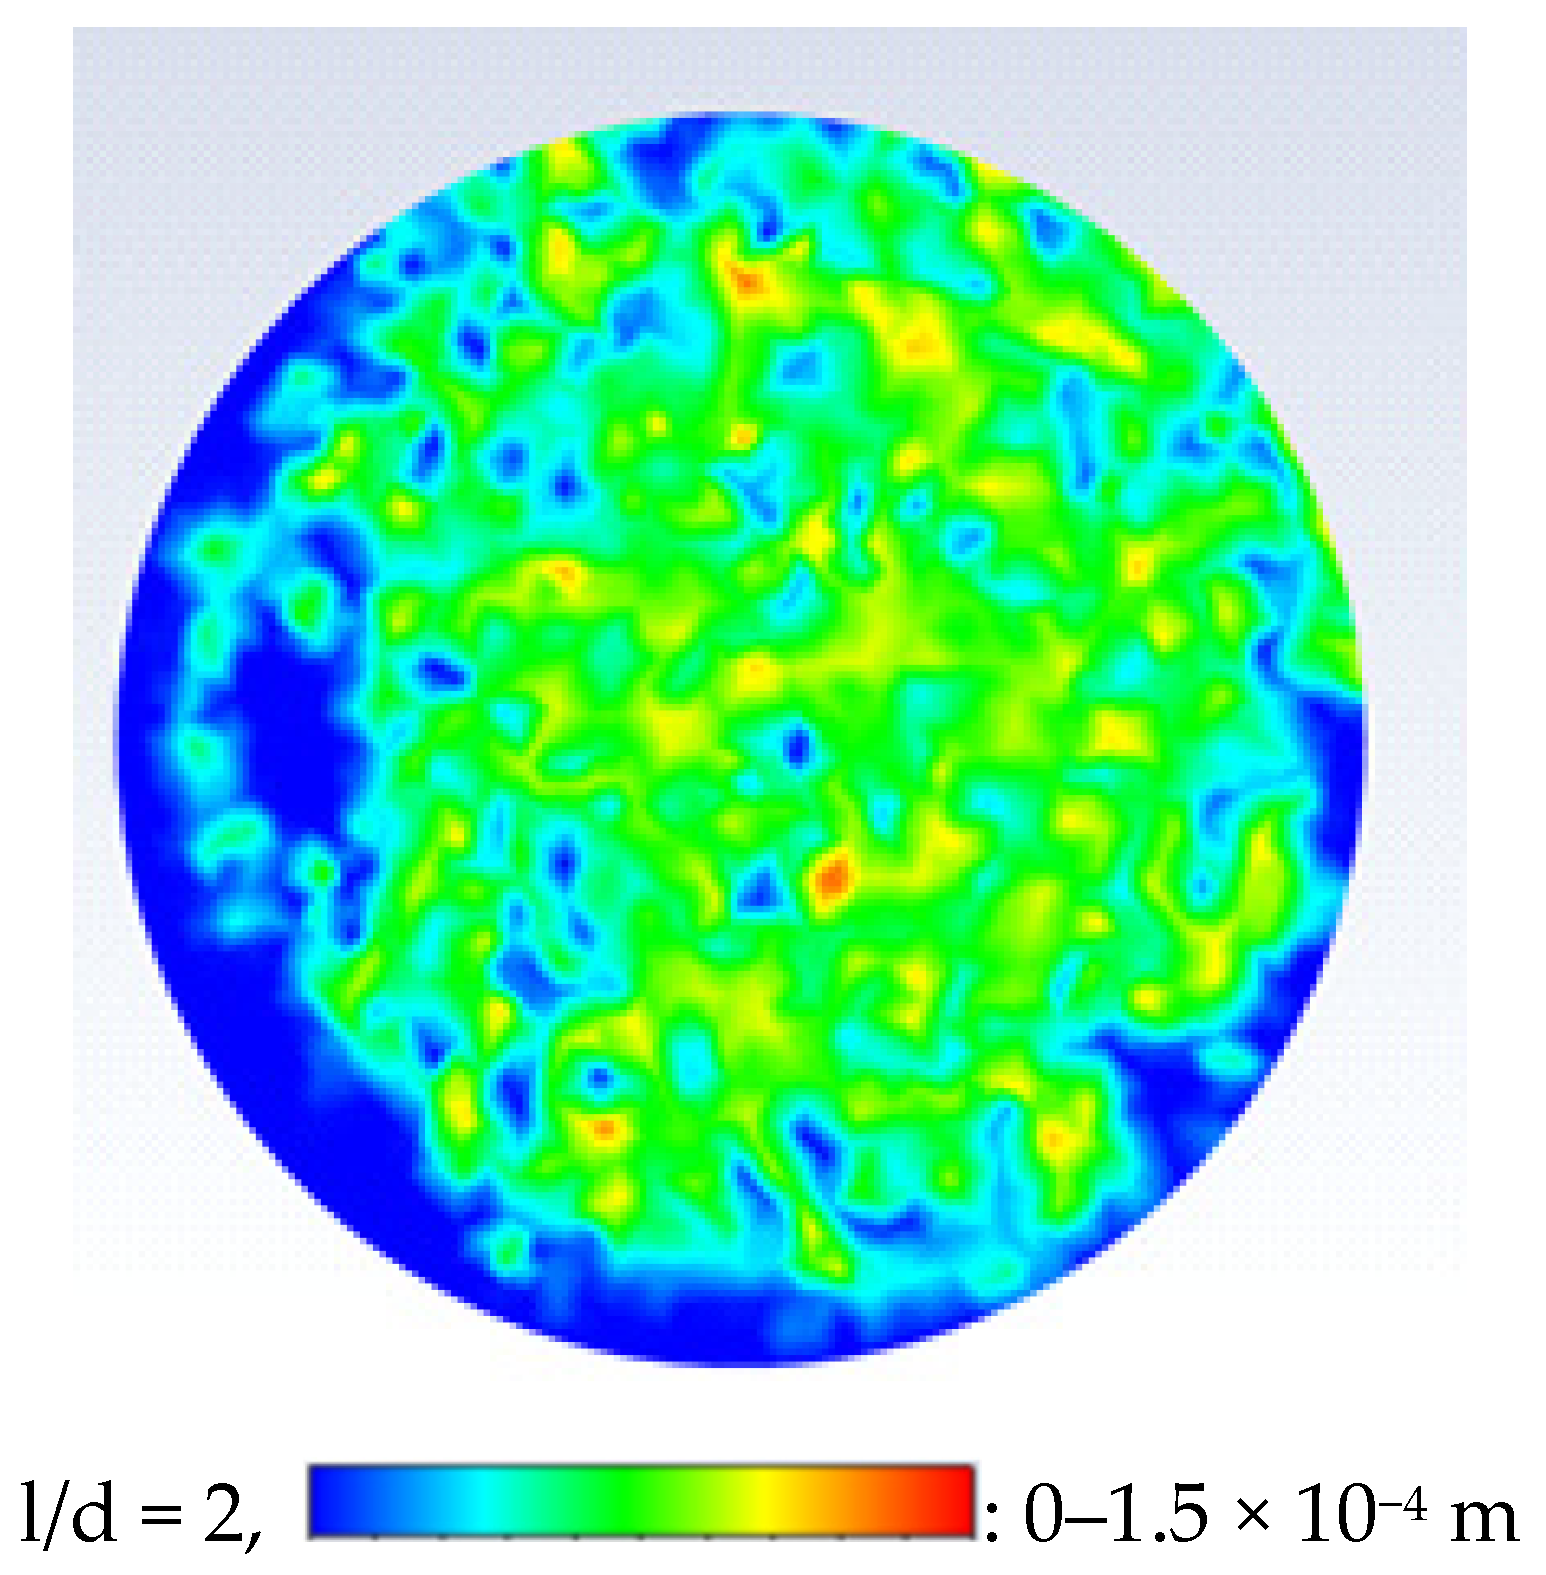
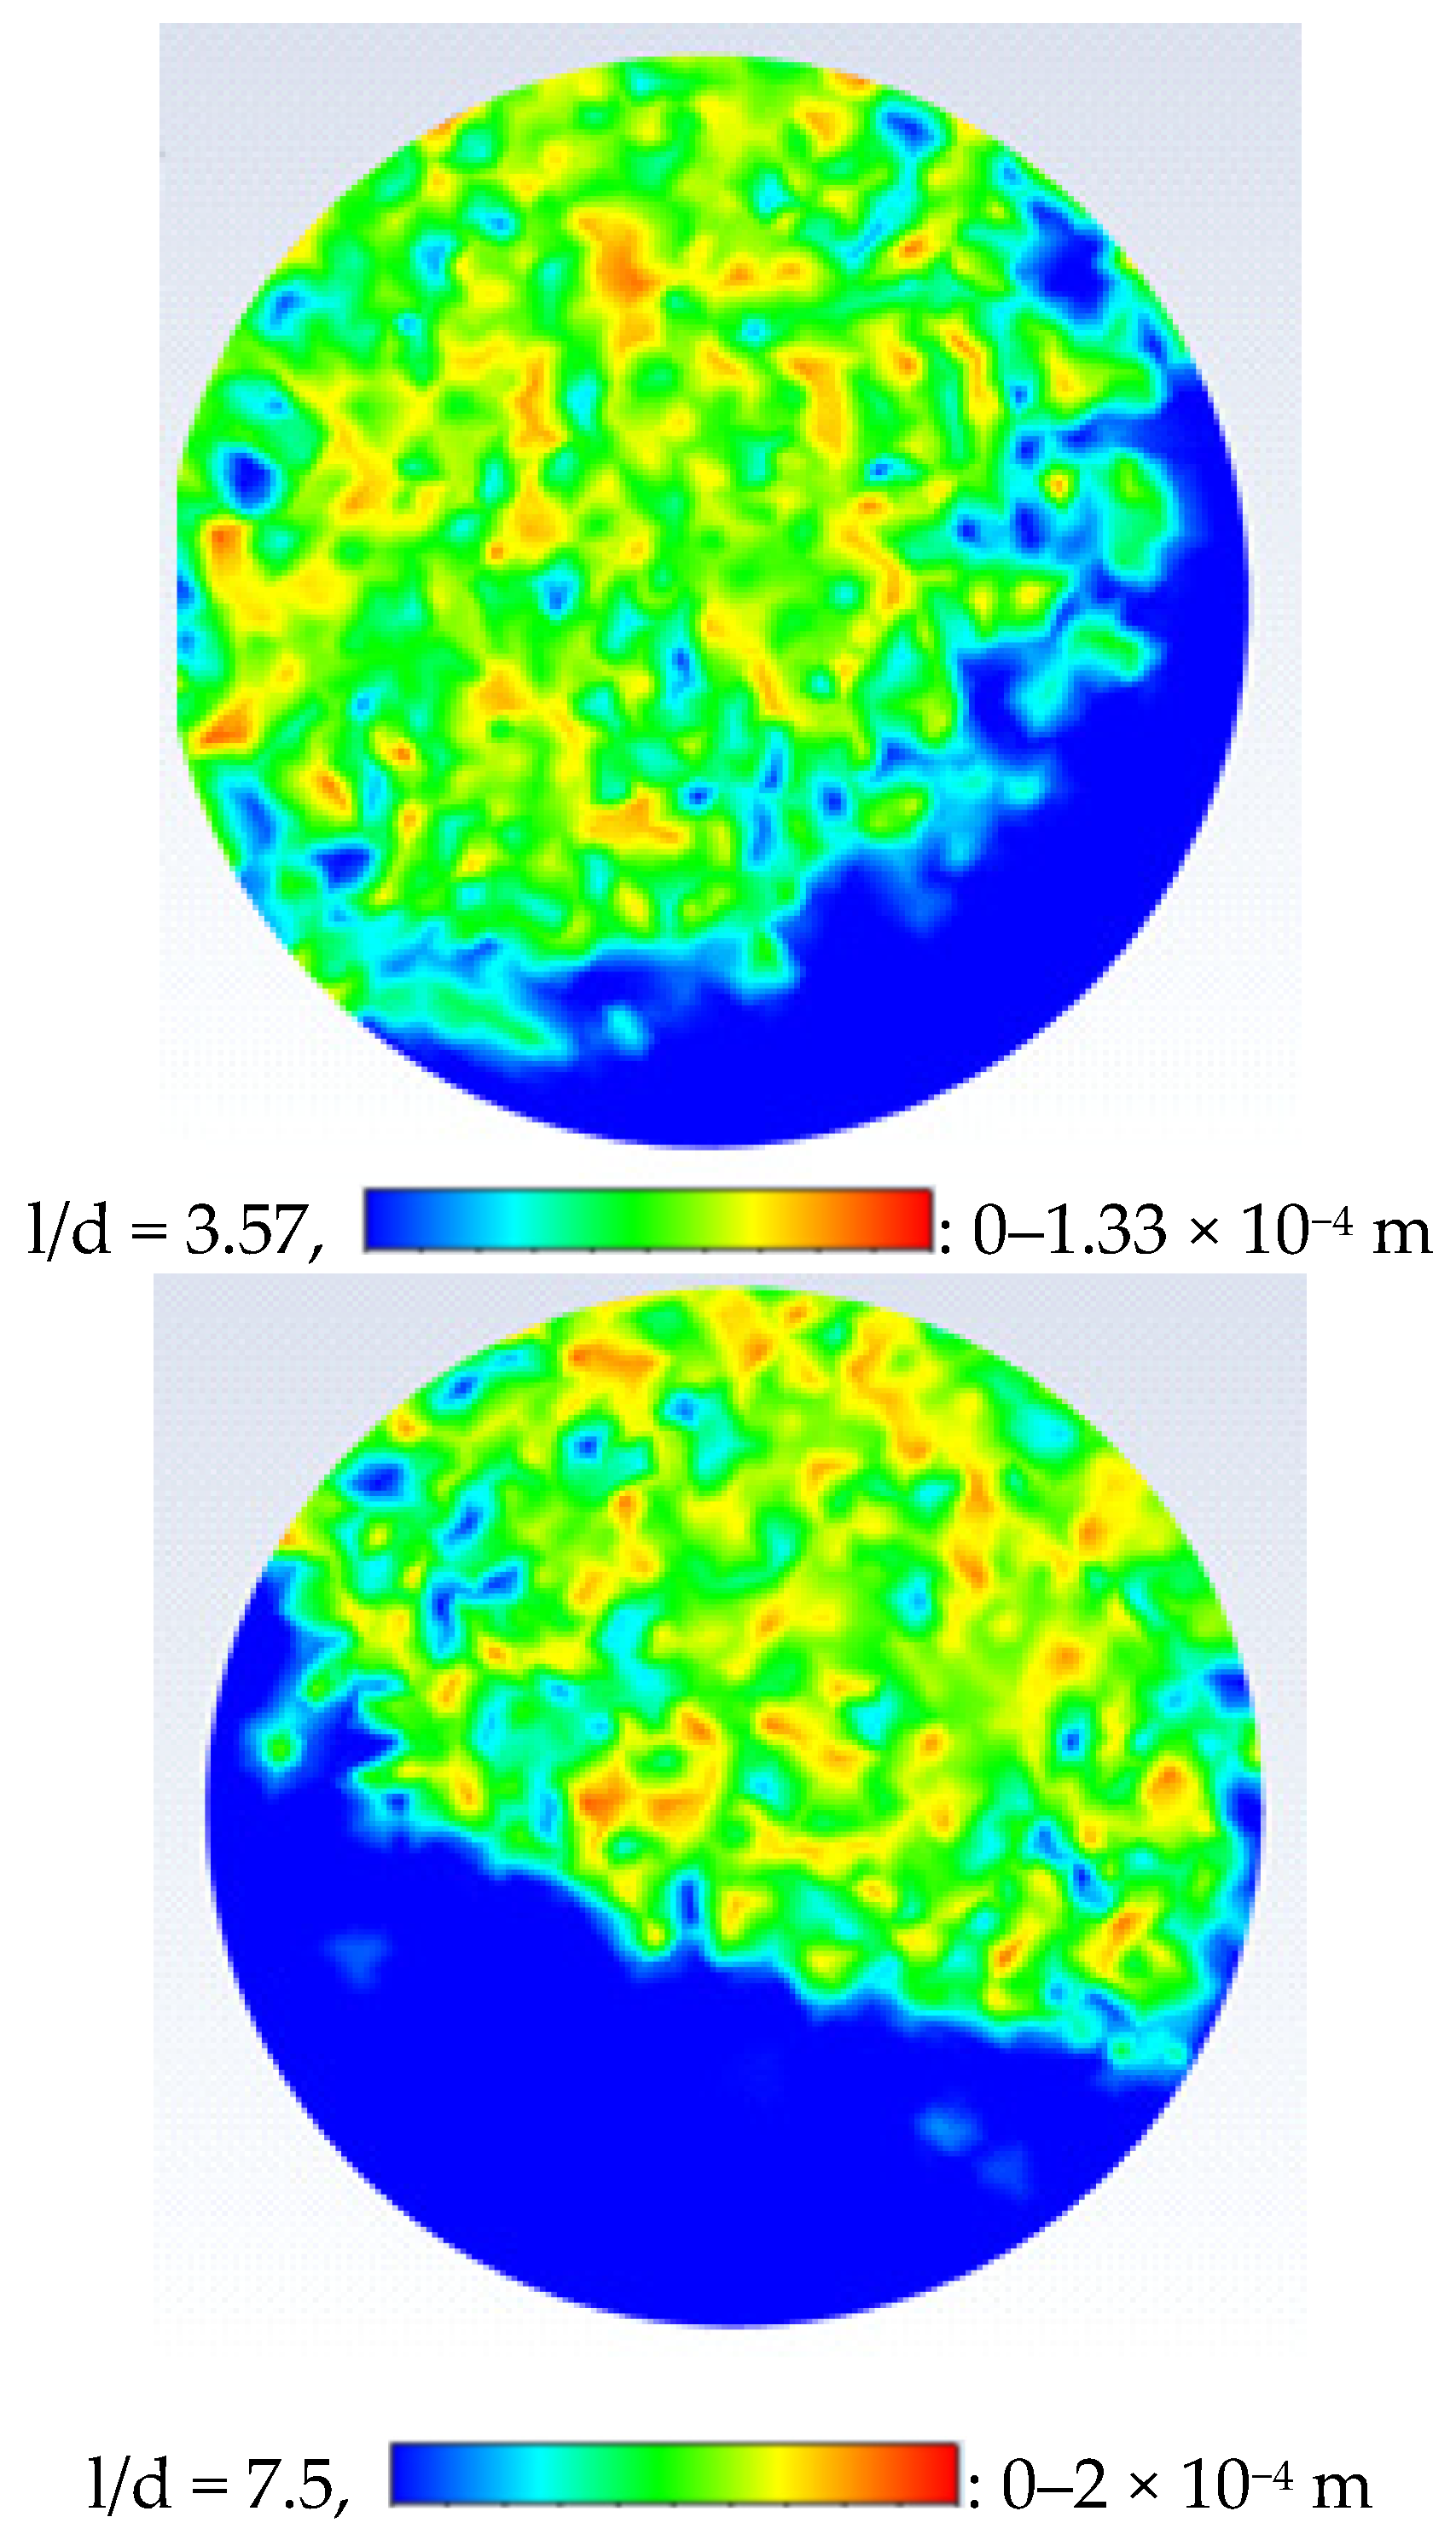
4.2.1. The Effect of Throat Length to Throat Diameter Ratios (l/d)
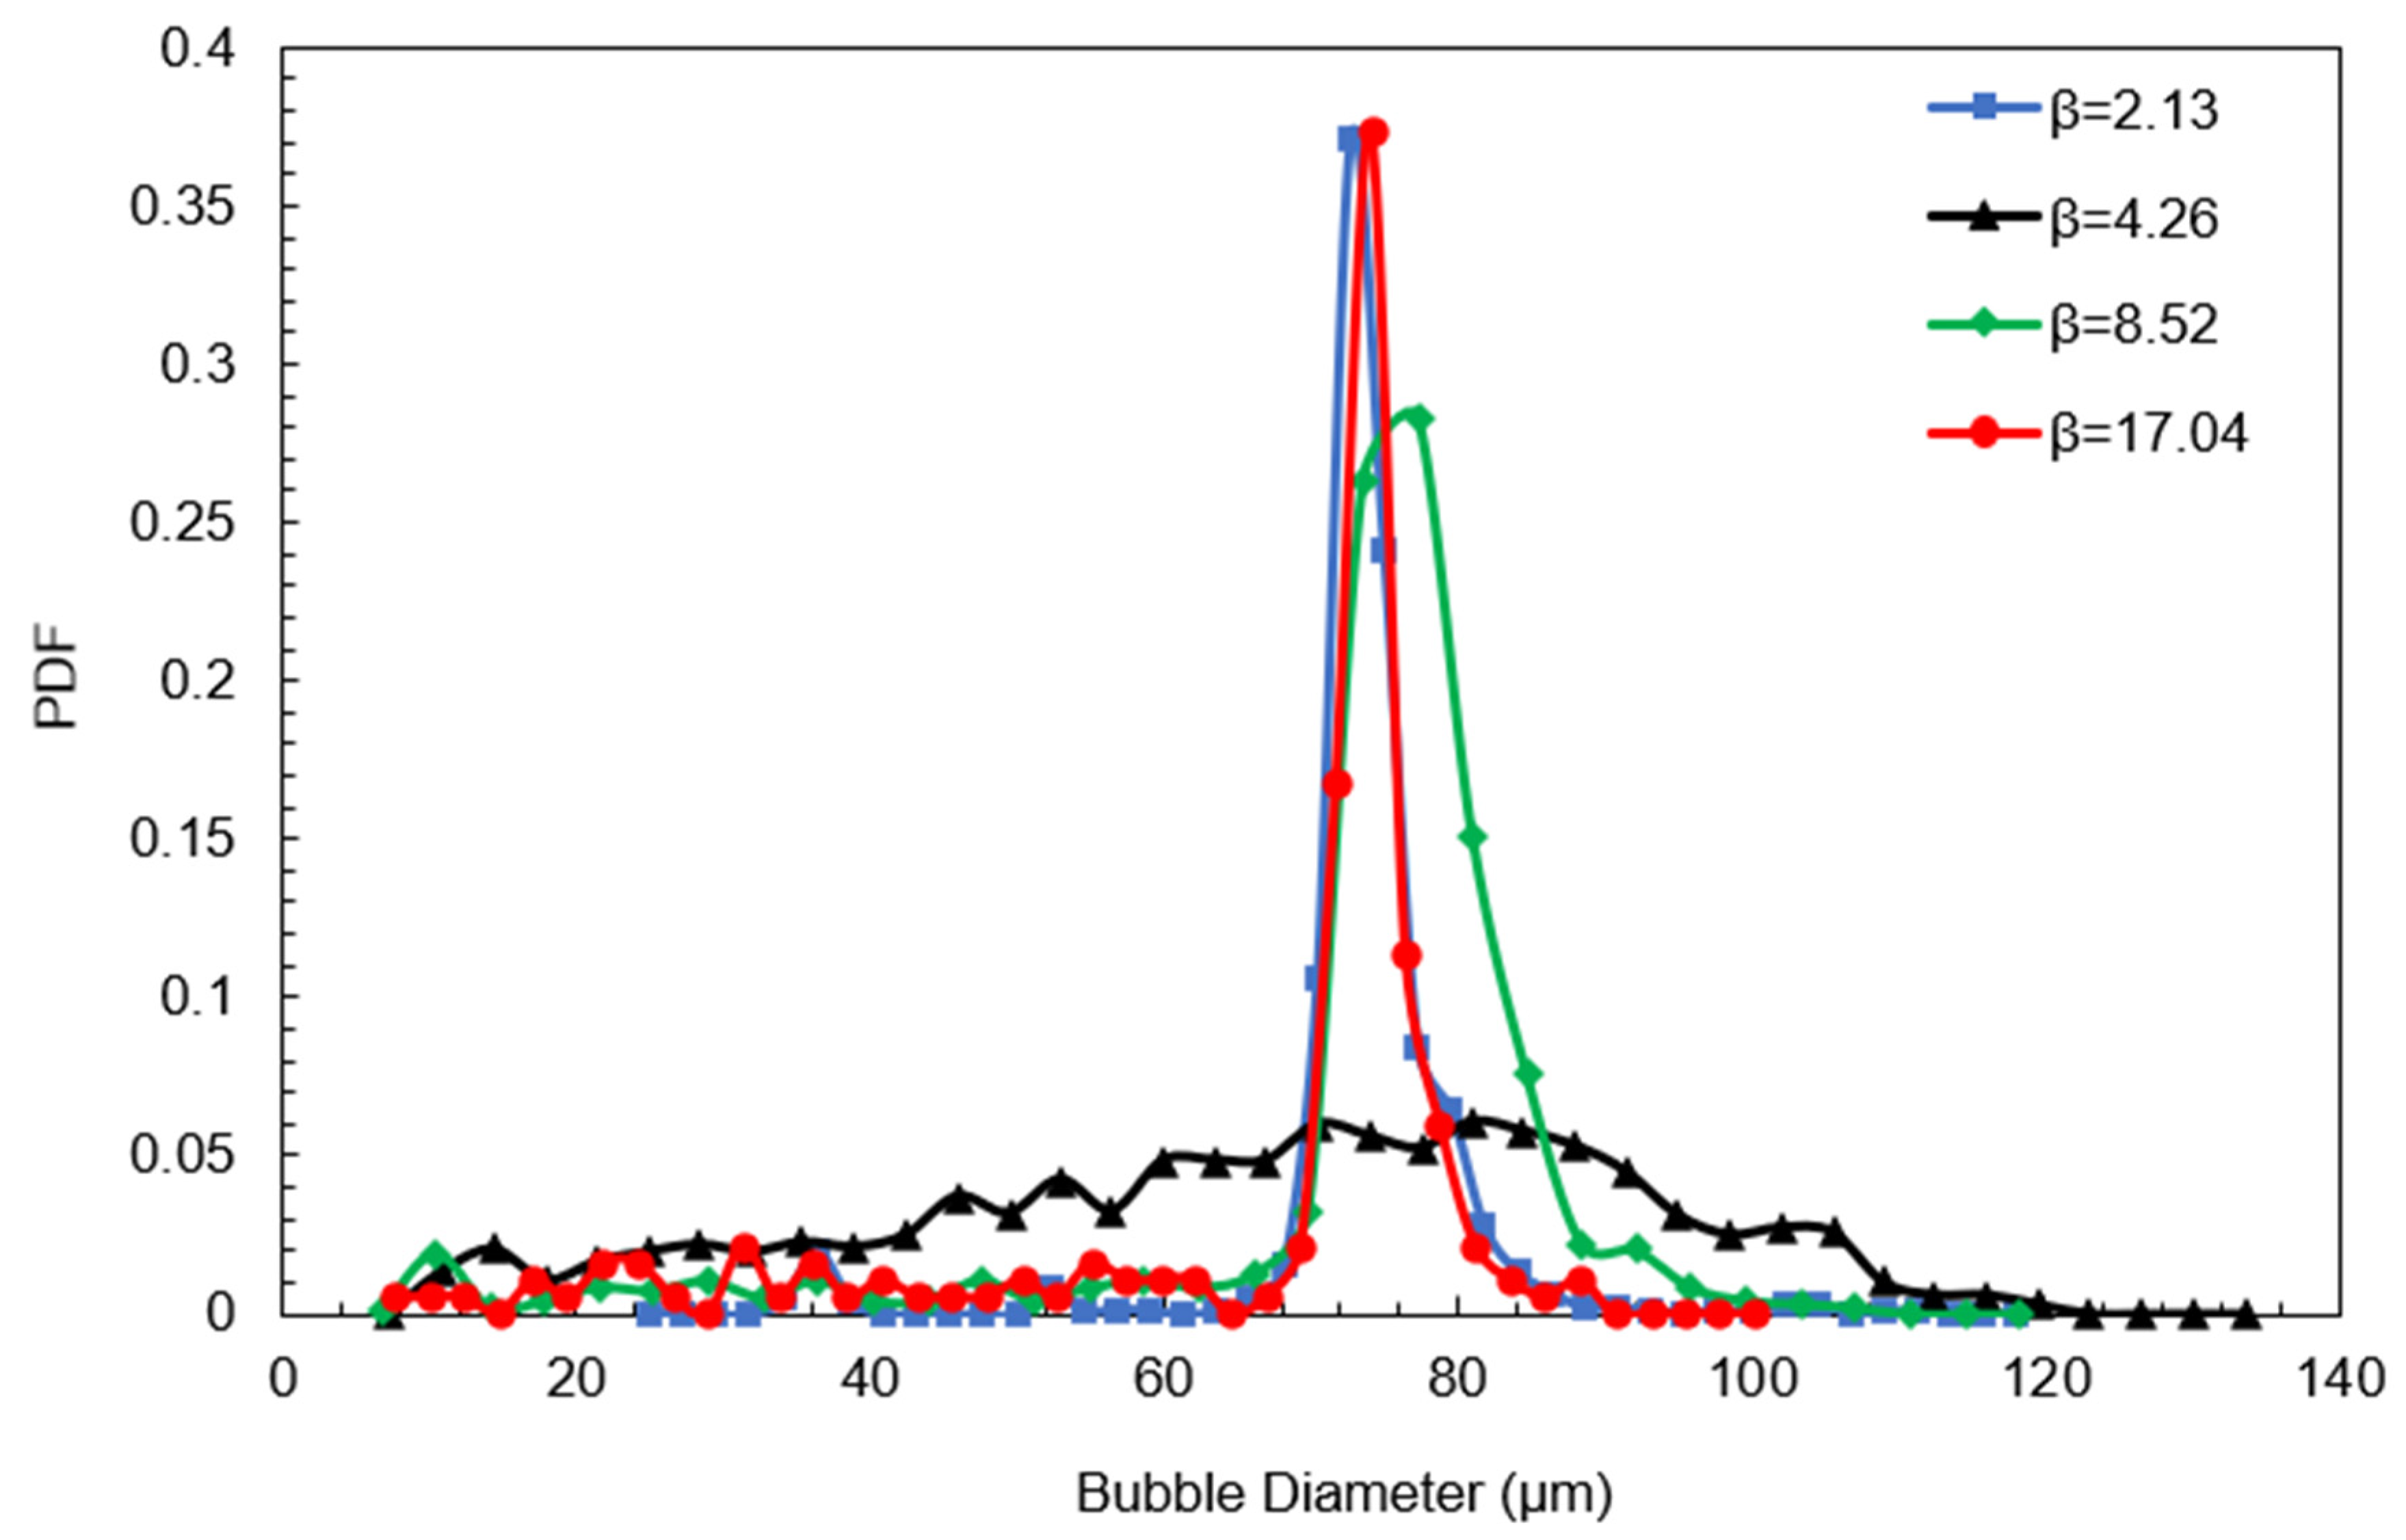
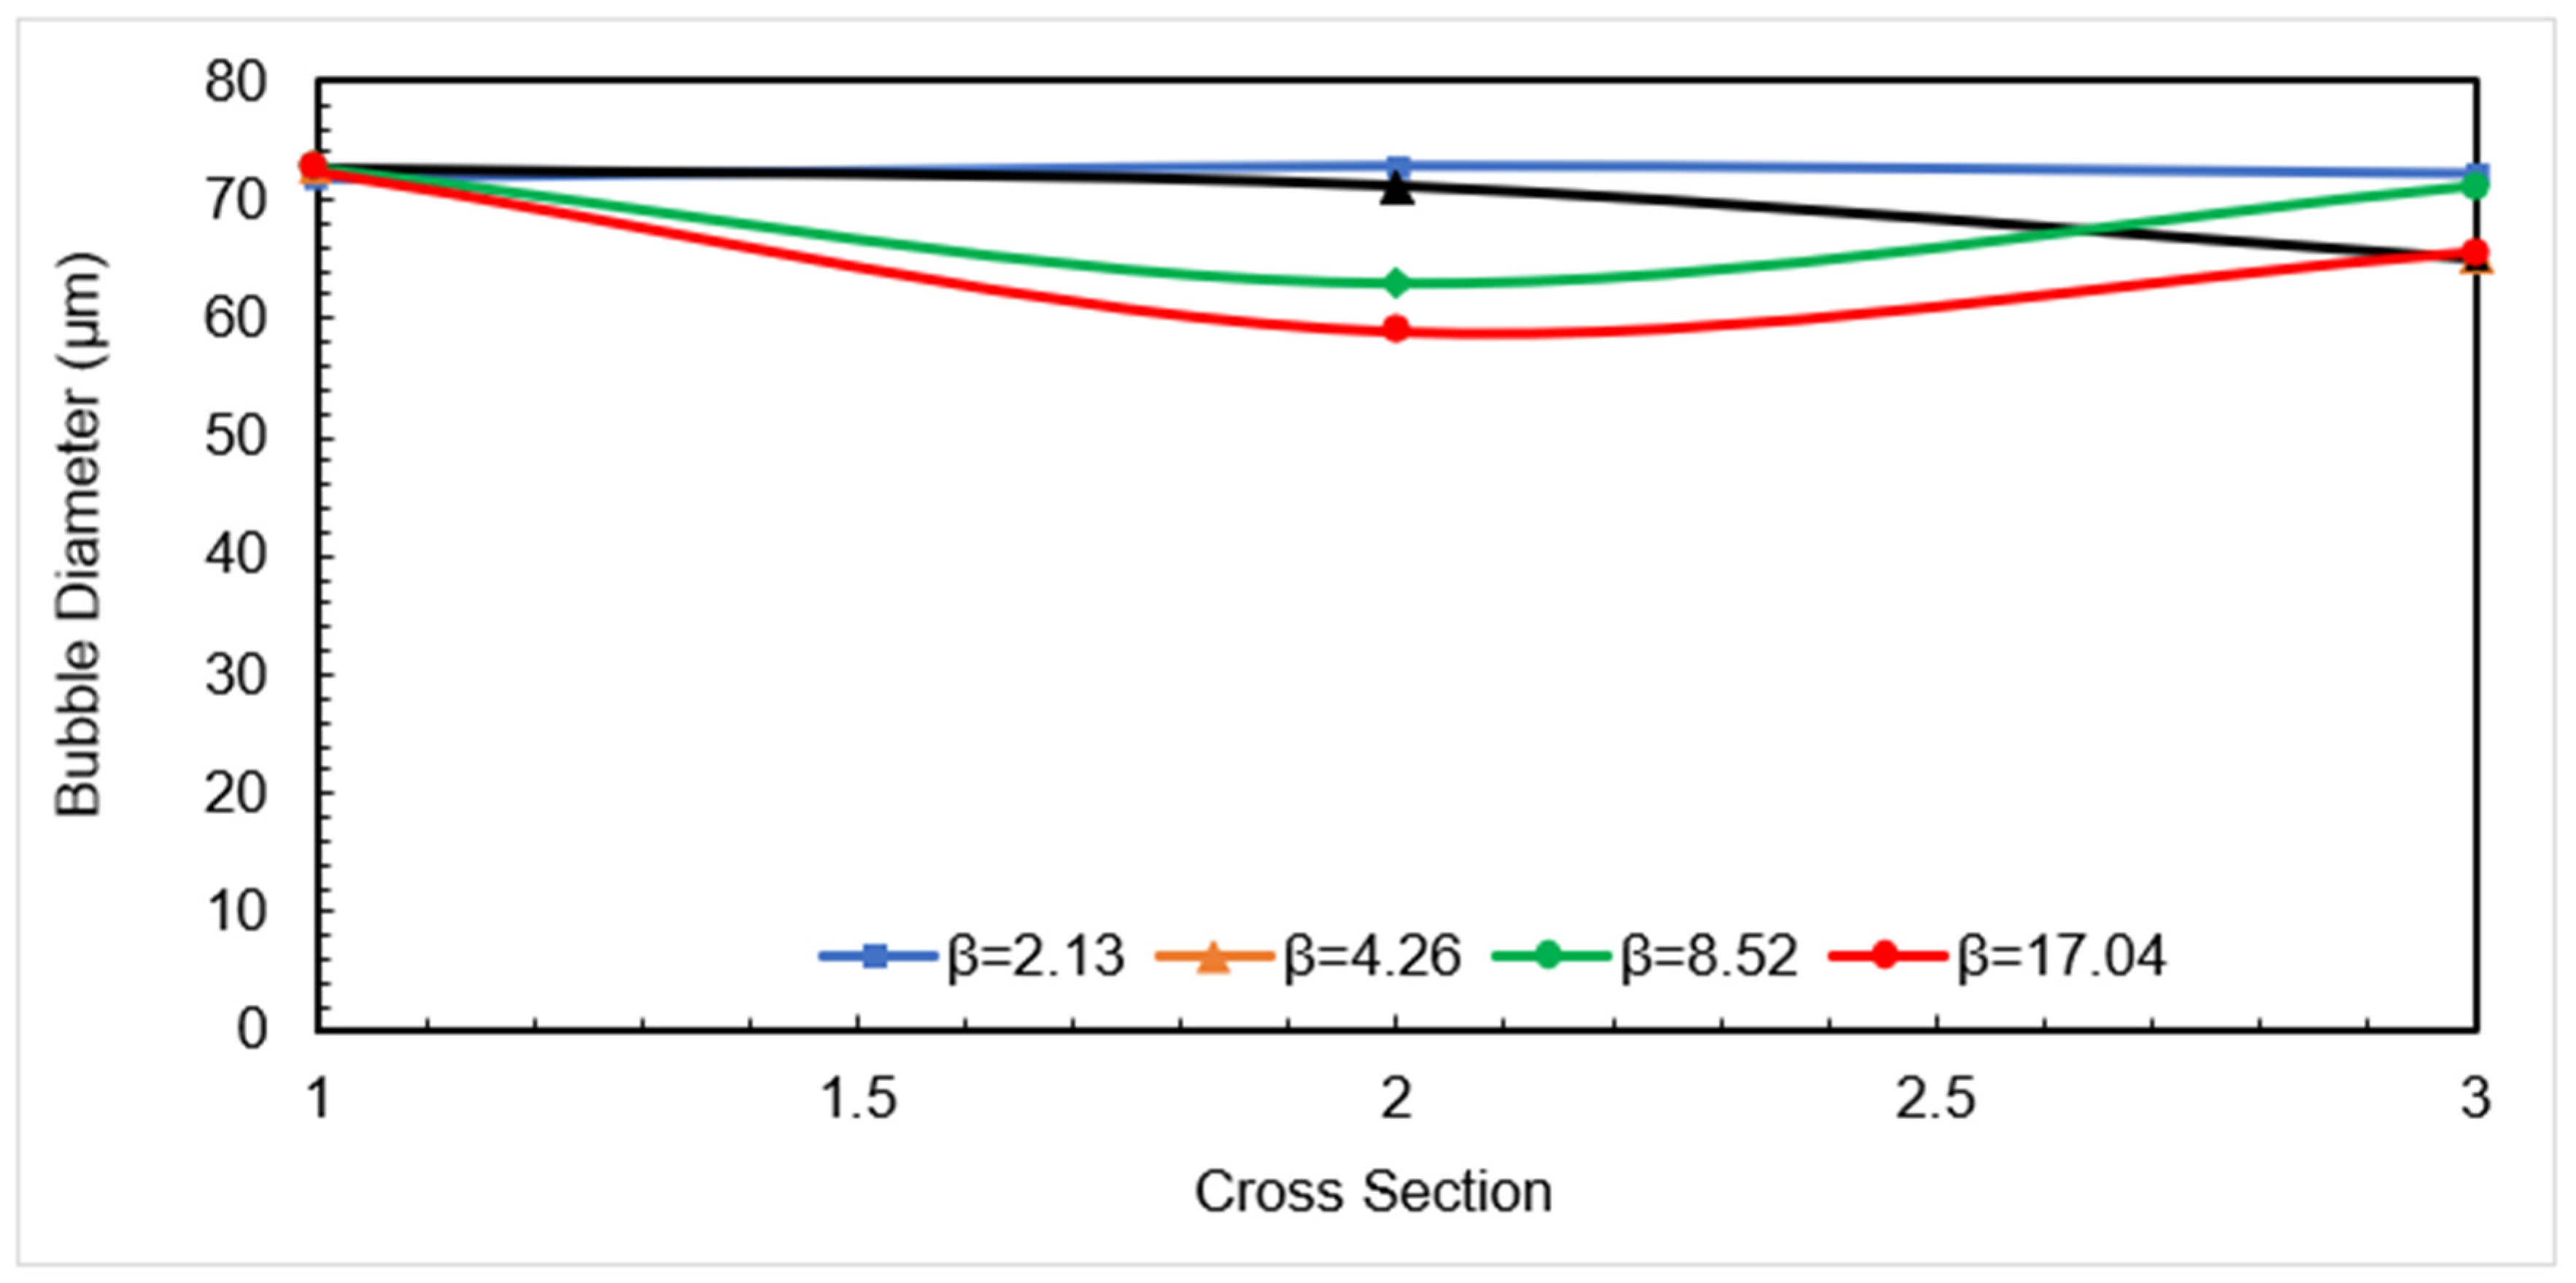
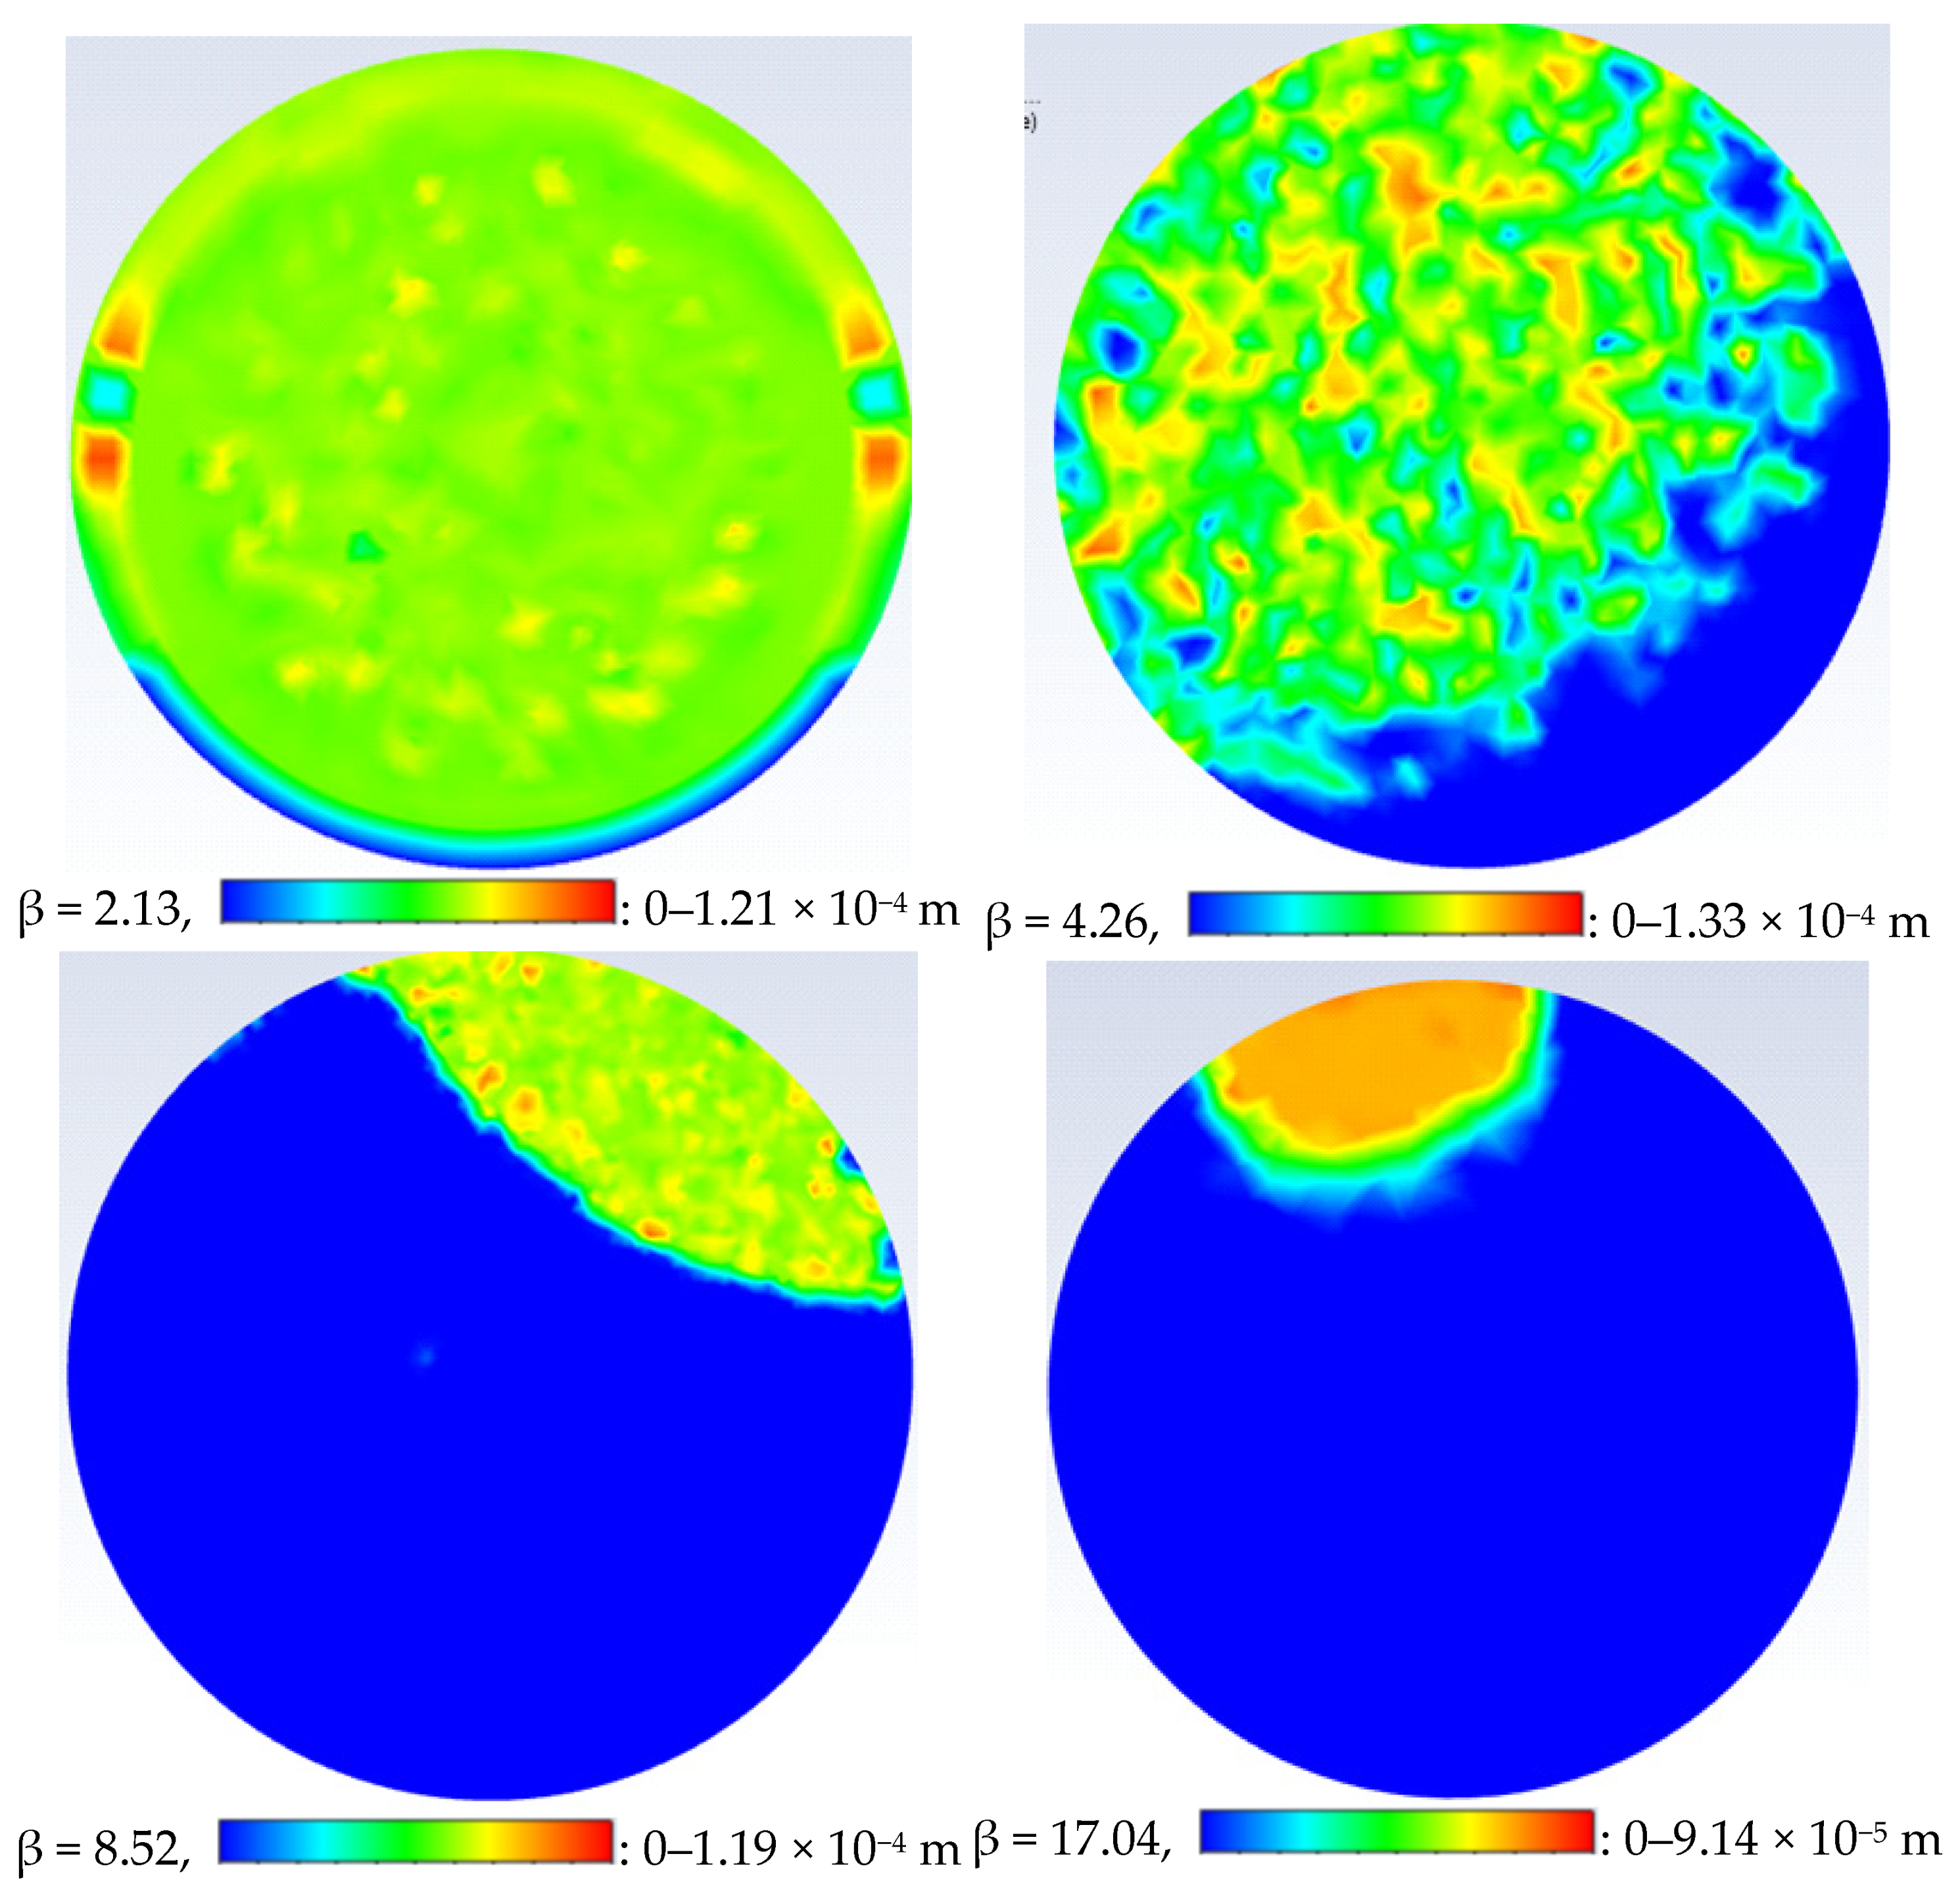
4.2.2. Effect of Diffuser Divergent Angle
5. Conclusions
- It is evident that controlling a combination of flow parameters and geometry will allow good control over the range and average bubble diameters produced at the outlet. In particular, the water flow rate used has the greatest influence on the bubbles produced at the outlet out of all properties tested in this research.
- The throat length/throat diameter ration and diffuser divergent angle had a minor effect on bubble diameter distribution and average bubble diameter for the range of the throat water velocities used in this study (22–35 m/s) compared to the low velocity used in literature (>10 m/s).
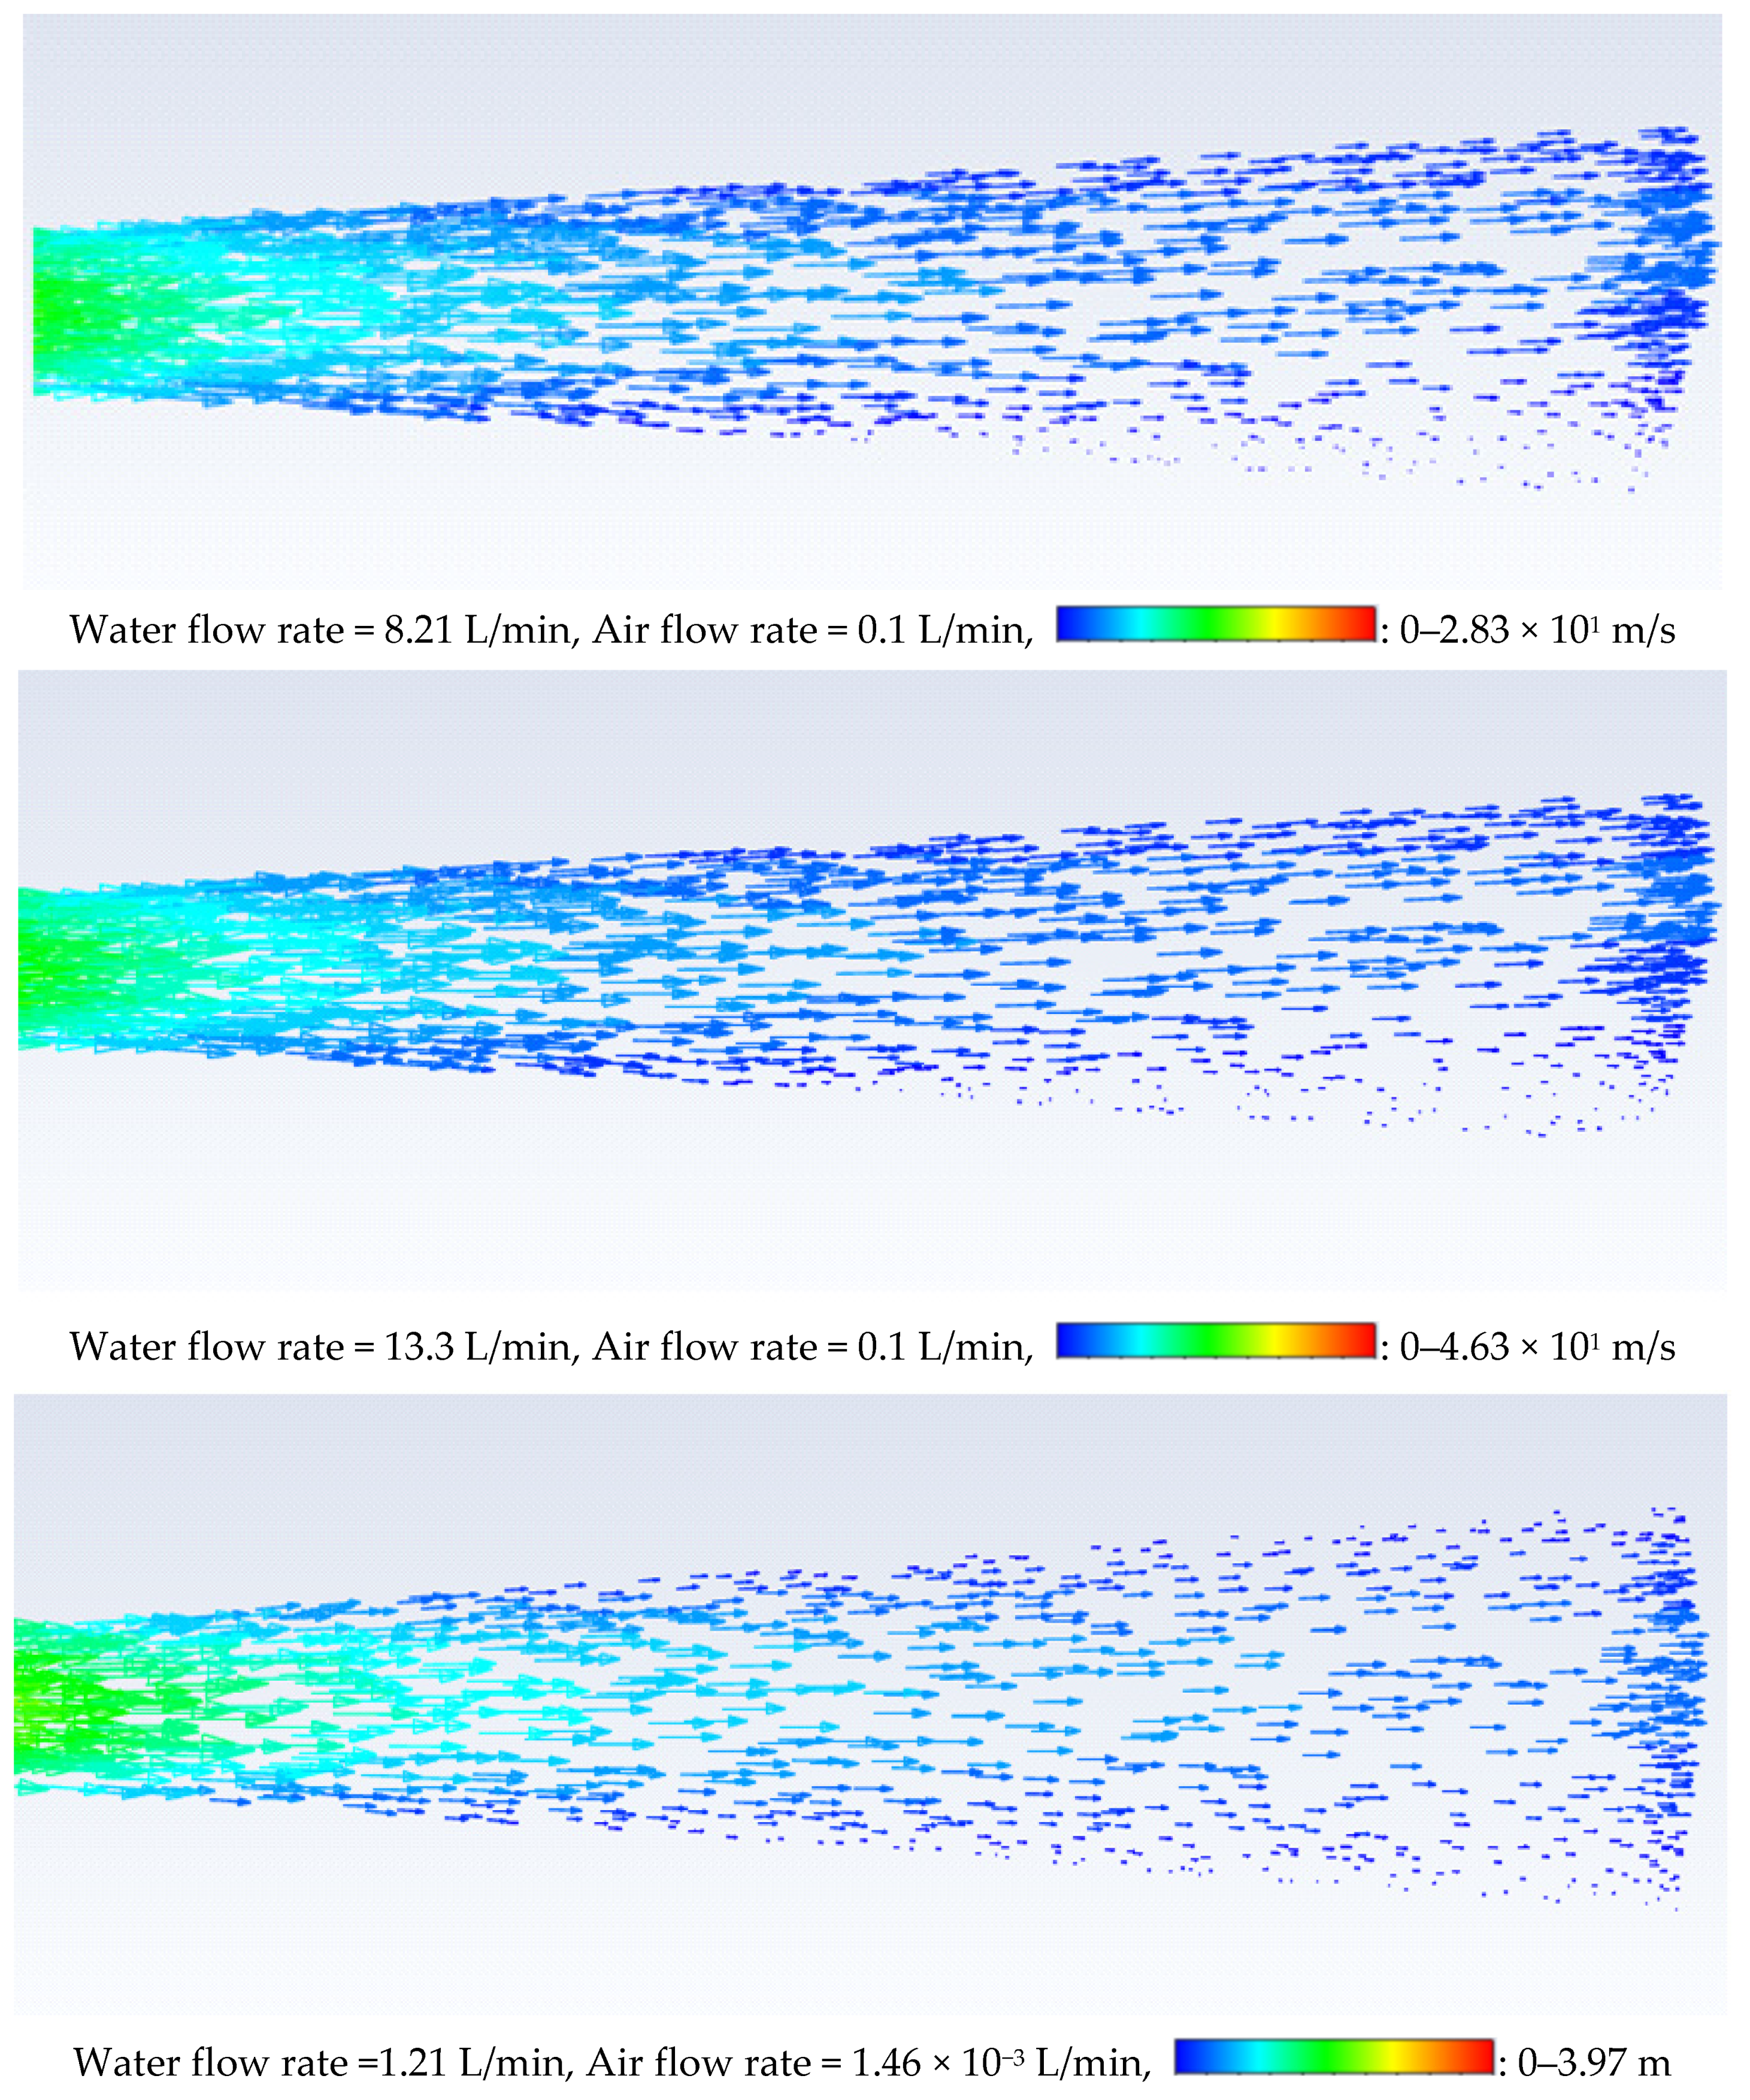
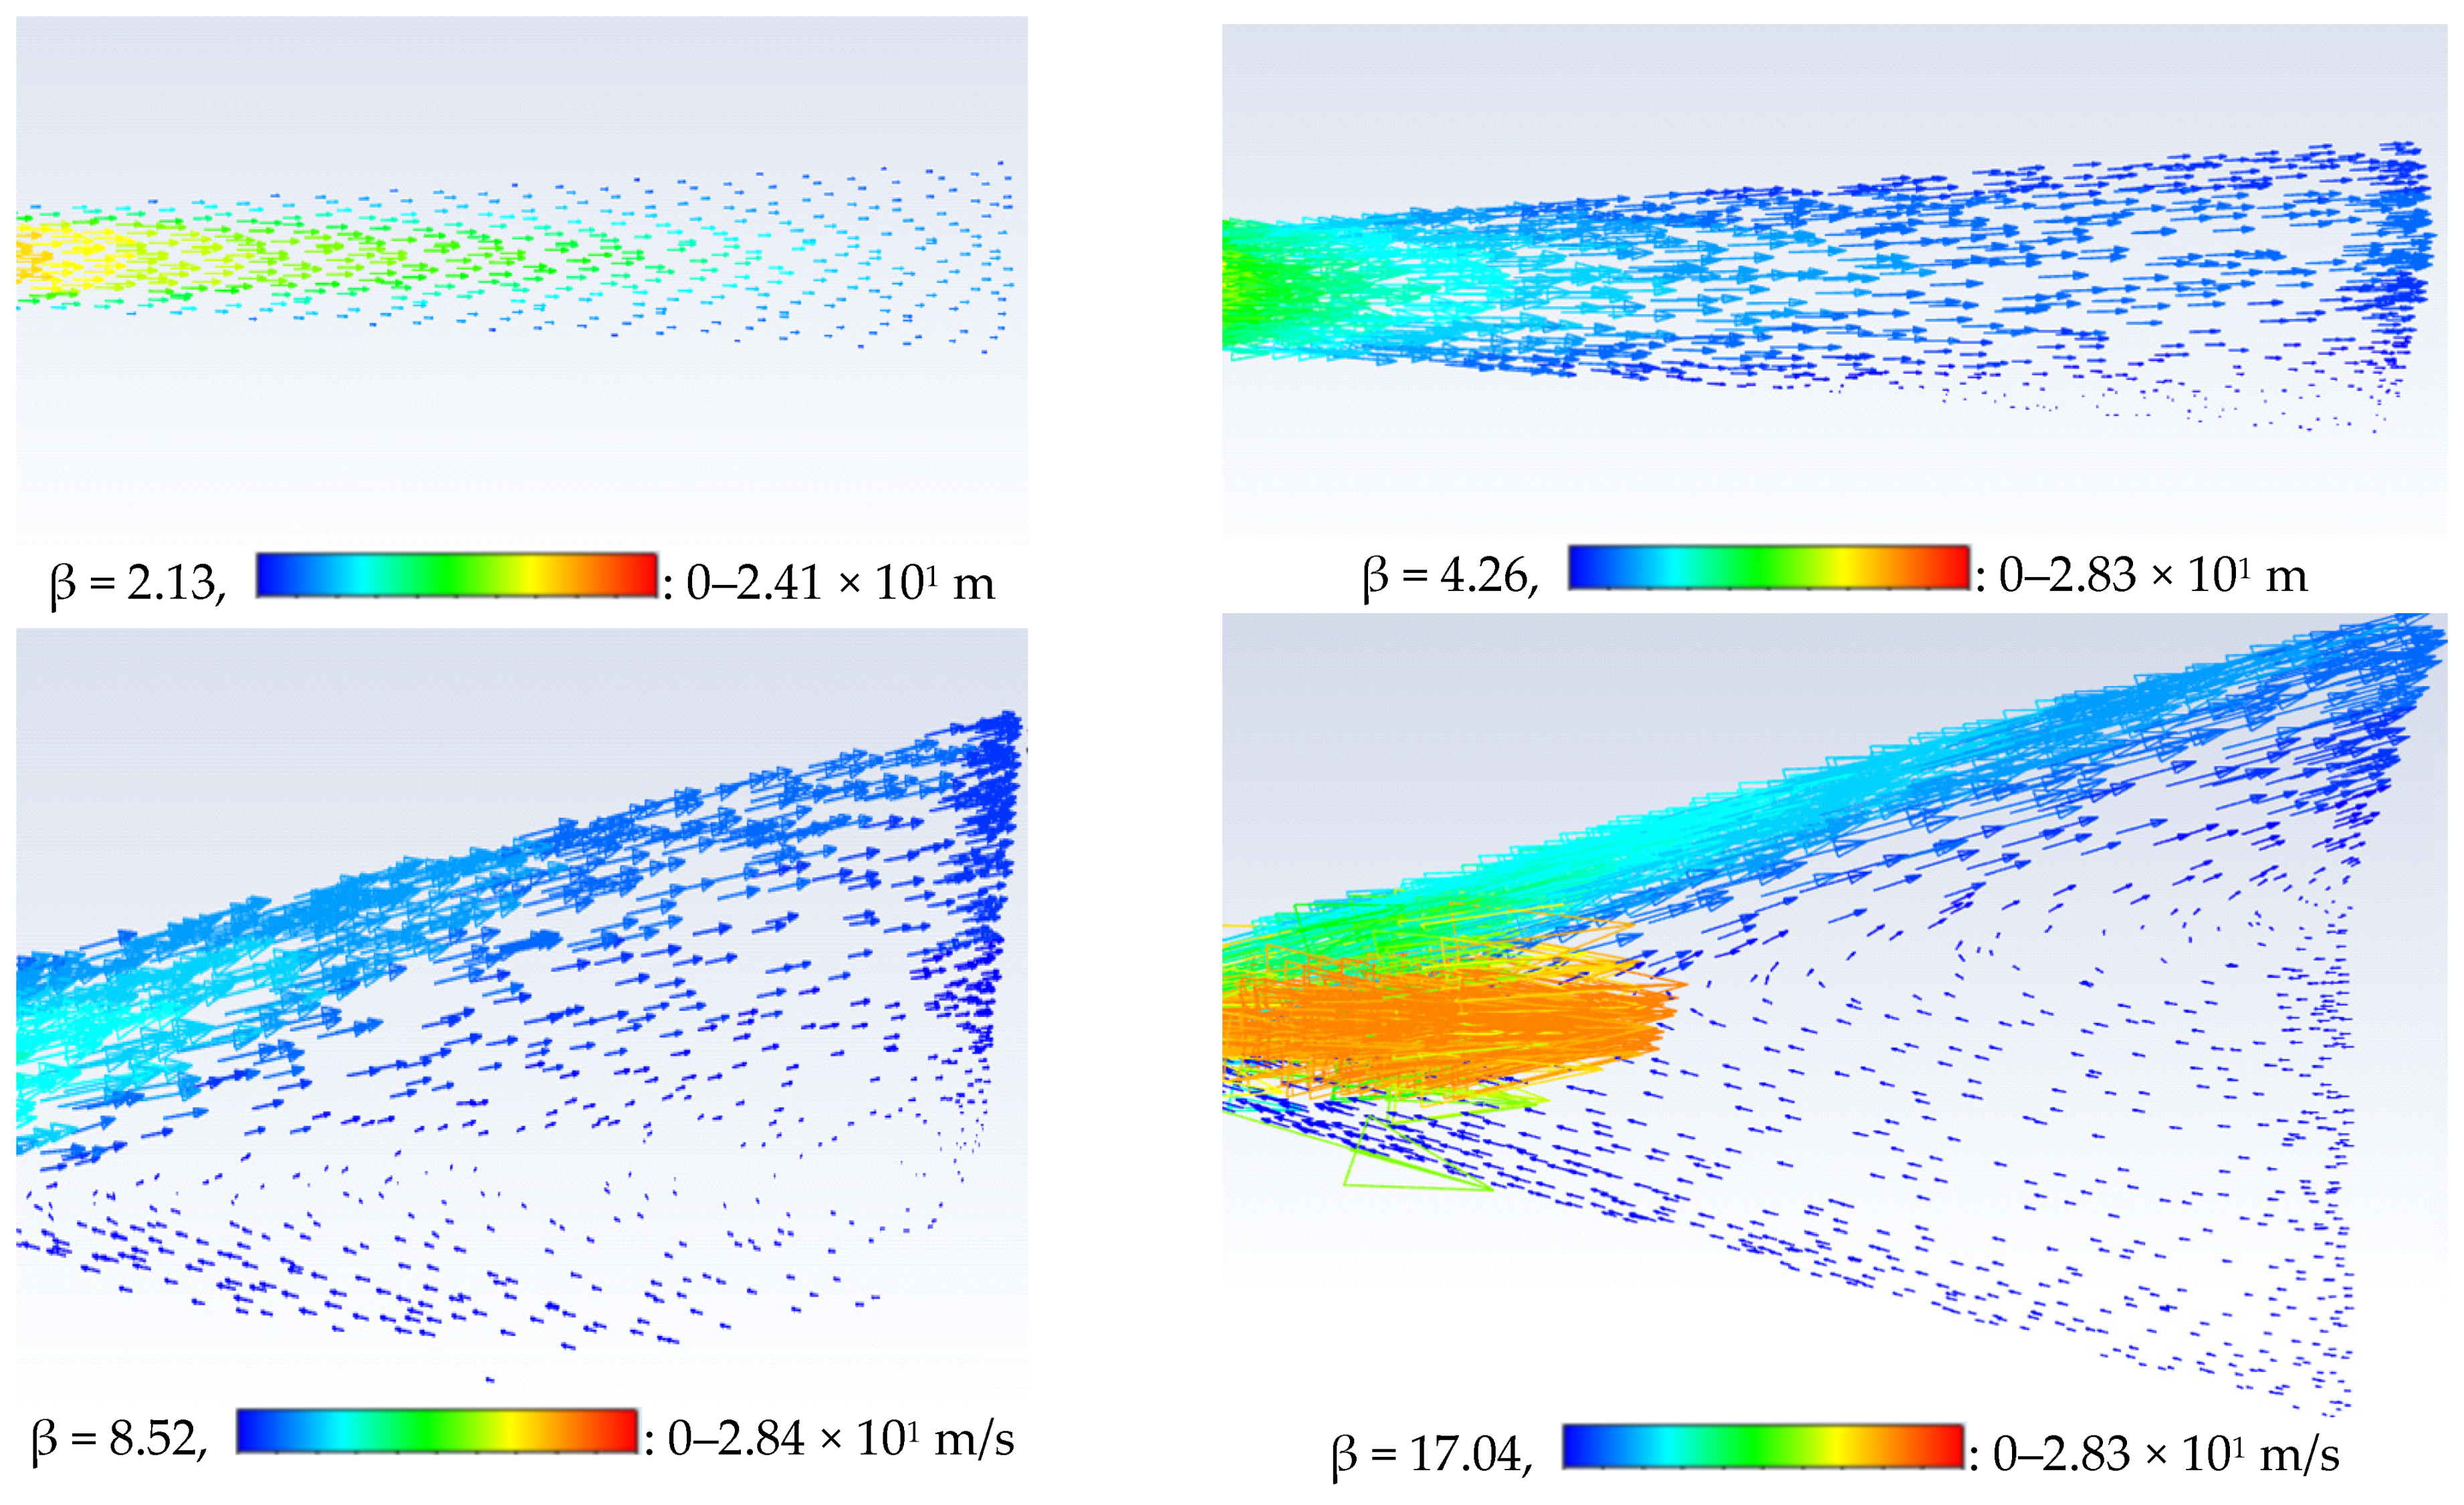
- Reversed flow in the divergent section of the microbubble generator due to the pressure gradients in this region were a significant factor in bubble breakup, further work into the bubble break up mechanisms would be useful to control the bubble sizing further.
- The contours of the bubble distribution at outlet and the velocity vectors in the diffuser section present a detailed picture of the flow behavior and help to select the optimum design to use.
Author Contributions
Funding
Conflicts of Interest
References
- Tao, D. Role of Bubble Size in Flotation of Coarse and Fine Particles—A Review. Sep. Sci. Technol. 2005, 39, 741–760. [Google Scholar] [CrossRef]
- Agarwal, A.; Ng, W.J.; Liu, Y. Principle and applications of microbubble and nanobubble technology for water treatment. Chemosphere 2011, 84, 1175–1180. [Google Scholar] [CrossRef]
- Gomez-Flores, A.; Solongo, S.K.; Heyes, G.W.; Ilyas, S.; Kim, H. Bubble−particle interactions with hydrodynamics, XDLVO theory, and surface roughness for flotation in an agitated tank using CFD simulations. Miner. Eng. 2020, 152, 106368. [Google Scholar] [CrossRef]
- Chowdhurri, A.; Talib, A.; Yahya, K. A review on marine shrimp aquaculture production trend Malaysia and the world perspective. In Proceedings of the International Fisheries Symposium 2012, Can Tho University, Cab Tho, Vietnam, 6–8 December 2012. [Google Scholar]
- Dijkmans, P.; Juffermans, L.; Musters, R.; Van Wamel, A.; Cate, F.T.; Van Gilst, W.; Visser, C.; De Jong, N.; Kamp, O. Microbubbles and ultrasound: From diagnosis to therapy. Eur. J. Echocardiogr. 2004, 5, 245–256. [Google Scholar] [CrossRef] [PubMed]
- Takahashi, M.; Kawamura, T.; Yamamoto, Y.; Ohnari, H.; Himuro, S.; Shakutsui, H. Effect of Shrinking Microbubble on Gas Hydrate Formation. J. Phys. Chem. B 2003, 107, 2171–2173. [Google Scholar] [CrossRef]
- Basso, A.; Hamad, F.; Ganesan, P. Effects of the geometrical configuration of air–water mixer on the size and distribution of microbubbles in aeration systems. Asia-Pac. J. Chem. Eng. 2018, 13, e2259. [Google Scholar] [CrossRef] [Green Version]
- Lijun, W. Gas-liquid numerical simulation on micro-bubble generator and optimization on the nozzle-to-throat spacing. Asia-Pac. J. Chem. Eng. 2015, 10, 893–903. [Google Scholar]
- Reichmann, F.; Varel, F.; Kockmann, N. Energy Optimization of Gas–Liquid Dispersion in Micronozzles Assisted by Design of Experiment. Processes 2017, 5, 57. [Google Scholar] [CrossRef] [Green Version]
- Huang, J.; Sun, L.; Liu, H.; Mo, Z.; Tang, J.; Xie, G.; Du, M. A review on bubble generation and transportation in Venturi-type bubble generators. Exp. Comput. Multiph. Flow 2020, 2, 123–134. [Google Scholar] [CrossRef] [Green Version]
- Li, M.; Bussonnière, A.; Bronson, M.; Xu, Z.; Liu, Q. Study of Venturi tube geometry on the hydrodynamic cavitation for the generation of microbubbles. Miner. Eng. 2019, 132, 268–274. [Google Scholar] [CrossRef]
- Basso, A.; Hamad, F.; Ganesan, P. Initial Results from the Experimental and Computational Study of Microbubble Generation. In Proceedings of the 4th World Congress on Momentum, Heat and Mass Transfer; Avestia Publishing: Orléans, ON, Canada, 2019. [Google Scholar]
- Rhody, H.; Carlson, C. Lecture 10: Hough Circle Transform. 2005. Available online: https://www.cis.rit.edu/class/simg782/lectures/lecture_10/lec782_05_10.pdf (accessed on 6 July 2020).
- ANSYS Fluent. 2020. Available online: http://www.ansys.com/Industries/Academic/Tools/Citations (accessed on 6 July 2020).
- Zhou, J.-S.; Luo, Z.-Y.; Gao, X.; Ni, M.-J.; Cen, K.-F. Effect of particle loading ratio on heat transfer enhancement in a gas-solid suspension cross flow. J. Zhejiang Univ. Sci. A 2002, 3, 381–386. [Google Scholar] [CrossRef]
- Stakic, M.; Zivkovic, G.; Sijercic, M. Numerical analysis of discrete phase induced effects on a gas flow in a turbulent two-phase free jet. Int. J. Heat Mass Transf. 2011, 54, 2262–2269. [Google Scholar] [CrossRef]
- Huang, J.; Sun, L.; Mo, Z.; Liu, H.; Du, M.; Tang, J.; Bao, J. A visualized study of bubble breakup in small rectangular Venturi channels. Exp. Comput. Multiph. Flow 2019, 1, 177–185. [Google Scholar] [CrossRef] [Green Version]
- Unyaphan, S.; Tarnpradab, T.; Takahashi, F.; Yoshikawa, K. Improvement of tar removal performance of oil scrubber by producing syngas microbubbles. Appl. Energy 2017, 205, 802–812. [Google Scholar] [CrossRef]
- Lee, C.H.; Choi, H.; Jerng, D.-W.; Kim, D.E.; Wongwises, S.; Ahn, H.S. Experimental investigation of microbubble generation in the venturi nozzle. Int. J. Heat Mass Transf. 2019, 136, 1127–1138. [Google Scholar] [CrossRef]
- Zhao, L.; Sun, L.C.; Mo, Z.Y.; Du, M.; Huang, J.; Bao, J.J.; Tang, J.G.; Xie, G. Effects of the divergent angle on bubble transpor-tation in a rectangular Venturi channel and its performance in producing fine bubbles. Int. J. Multiph. Flow 2019, 114, 192–206. [Google Scholar] [CrossRef]
- Huang, J.; Sun, L.; Du, M.; Liang, Z.; Mo, Z.; Tang, J.; Xie, G. An investigation on the performance of a micro-scale Venturi bubble generator. Chem. Eng. J. 2020, 386, 120980. [Google Scholar] [CrossRef]


| Generator Part | Dimension |
|---|---|
| Generator inlet diameter | 10 mm |
| Generator inlet length | 20.47 mm |
| Throat diameter (d) | 2.8 mm |
| Throat length (l) | 10 mm |
| Diffuser outlet diameter | 11 mm |
| Diffuser length | 55 mm |
| Diffuser divergent angle (β) | 4.26° |
| Pre-throat length (v) | 12.54 mm |
| Pre-throat angle (α) | 16.02° |
| Fluid Property | Value and Unit |
|---|---|
| Gas (air) density | 1.225 kg/m3 |
| Gas (air) dynamic viscosity | 1.7894 × 10−0.5 kg/m·s |
| Initial bubble diameter (average) | 100 μm |
| Liquid (water) density | 998.2 kg/m3 |
| Liquid (water) dynamic viscosity | 0.001003 kg/m·s |
| Gravity acceleration | −9.81 m/s2 |
| Boundary Name | Liquid | Gas |
|---|---|---|
| Inlet | Volumetric quality 0.9988 Flow rate 8.21 L/min | Volumetric quality 0.012 Flow rate 0.1 L/min |
| Flow Conditions | ||||
|---|---|---|---|---|
| Boundary Name | Water Flow Rate (L/min) | Throat Reynolds Number | Air Flow Rate (L/min) | Volumetric Quality (%) |
| Inlet | 13.3 | 100,800 | 0.05 | 0.375 |
| 0.1 | 0.75 | |||
| 0.2 | 1.48 | |||
| 8.21 | 62,200 | 0.05 | 0.61 | |
| 0.1 | 1.22 | |||
| 0.2 | 2.41 | |||
| 1.22 | 9250 | 0.00732 | 0.61 | |
| 0.01464 | 1.186 | |||
| 0.02928 | 2.344 | |||
Publisher’s Note: MDPI stays neutral with regard to jurisdictional claims in published maps and institutional affiliations. |
© 2021 by the authors. Licensee MDPI, Basel, Switzerland. This article is an open access article distributed under the terms and conditions of the Creative Commons Attribution (CC BY) license (http://creativecommons.org/licenses/by/4.0/).
Share and Cite
Wilson, D.A.; Pun, K.; Ganesan, P.B.; Hamad, F. Geometrical Optimization of a Venturi-Type Microbubble Generator Using CFD Simulation and Experimental Measurements. Designs 2021, 5, 4. https://0-doi-org.brum.beds.ac.uk/10.3390/designs5010004
Wilson DA, Pun K, Ganesan PB, Hamad F. Geometrical Optimization of a Venturi-Type Microbubble Generator Using CFD Simulation and Experimental Measurements. Designs. 2021; 5(1):4. https://0-doi-org.brum.beds.ac.uk/10.3390/designs5010004
Chicago/Turabian StyleWilson, Dillon Alexander, Kul Pun, Poo Balan Ganesan, and Faik Hamad. 2021. "Geometrical Optimization of a Venturi-Type Microbubble Generator Using CFD Simulation and Experimental Measurements" Designs 5, no. 1: 4. https://0-doi-org.brum.beds.ac.uk/10.3390/designs5010004