
Optimization of Controlled Mechanical Ventilation Systems for Indoor Acoustic Comfort


PROGETTO DECIBEL S.r.l., via Uruguay 53/C, 35127 Padova, Italy
Designs 2021, 5(3), 48; https://0-doi-org.brum.beds.ac.uk/10.3390/designs5030048
Submission received: 23 June 2021
/
Revised: 12 July 2021
/
Accepted: 21 July 2021
/
Published: 2 August 2021
(This article belongs to the Special Issue Sustainable and Conventional Buildings)
Abstract
:The indoor air quality inside living spaces is a fundamental factor in providing adequate comfort. In order to do this, a minimum air exchange must be ensured. This can be obtained by means of natural or mechanical ventilation or using the Controlled Mechanical Ventilation system (CMV). CMV ensures better energy performance, as in the winter period, the warm air that comes out of the building preheats the cold air that enters, and the opposite occurs in the summer period. A possible problem with CMV is the noise of the fans due to the movement of air and to the electric motor rotation. This work presents the results of acoustic measurements performed on an apartment equipped with CMV, operating in a single and simultaneous mode. Acoustic simulations are also presented using raytracing software on three typical apartments. The acoustic simulation carried out using an adequately calibrated 3D model has proved to be a valid support for the study of noise in rooms connected by doors and corridors. By differentiating the fan speed of the CMV, a considerable acoustic comfort improvement was obtained in the bedrooms and in the living room/kitchen. Class I for living rooms and class I or II for bedrooms according to the EN 16798-1 standard were achieved through speed optimization.
1. Introduction
Human activities inside residential buildings contaminate the indoor air with carbon dioxide, odors, water vapor, Volatile Organic Compounds (VOCs), etc. Even natural gases such as Radon can significantly contaminate environments. Indoor Air Quality (IAQ) is of paramount importance inside buildings in relation to the health and comfort of occupants. For these reasons, adequate air exchange through natural or mechanical ventilation is necessary to ensure the health of the environment and avoid the formation of pollutants and allergens. Through adequate ventilation, it is possible to guarantee conditions of comfort, hygiene and health. Ventilation increases the healthiness of the environment but on the other hand it can increase energy consumption both in electrical and thermal terms and increase indoor noise. The main pollutants and health impacts are [1]:
- −
- Viral agents: can be emitted simply by coughing or breathing and circulate in the air in the form of bioaereosols;
- −
- Particulates: cause eye, nose and throat irritation and breathing problems, headaches, fatigue and low concentration. Prolonged contact can lead to heart and respiratory diseases;
- −
- Humidity: causes condensation, mold and proliferation of dust mites;
- −
- Radon: an odorless natural gas released from the ground; it is highly carcinogenic in cases of prolonged exposure;
- −
- Mold: releases spores that are harmful to health and cause allergies;
- −
- Volatile organic compound (VOC): airborne substances, including formaldehyde, which can cause respiratory tract irritation or central nervous system disorders;
- −
- CO2: in excessive concentrations, such as when experiencing the sensation of stale air, it causes headaches and difficulty in concentration.
The control of the indoor air quality is of primary importance for all buildings and in particular for sustainable ones. Accordingly, thermal and acoustic properties of materials depend on humidity conditions [2,3] and recycled ones could be affected also by environmental conditions.
Wei et al. [4] reported the parameters adopted by the various green building certification systems, certification regulations and IAQ values that should be assessed by: (a) source control by removing pollutants through the choice of building materials and furnishings; (b) the use of CMV and air tightness; (c) instrumental measurement of pollutant concentration and IAQ. Mechanical ventilation improves internal thermal comfort, air temperature and energy savings. The impact of comfort and efficiency of a specific CMV technology has been proved by Chen et al. [5].
Tronchin et al. [6] performed a study using three different models for the energy consumption calculation with an Energy Performance of Buildings software, comparing the real consumption with the hypothesized one. The study was conducted considering a single-family house and focusing on the differences between consumption and numerical codes in relation to flexible architectural solutions, widely used, especially in rural areas of Mediterranean countries. A study that performs a simulation energy in an Italian building retrofit was presented [7]; a building containing enlargements made in subsequent years, with different thermophysical parameters was studied; four energy requalification actions were applied with software evaluation of energy performance. It has been shown that CMV systems are particularly efficient for high-performance buildings, where there are no energy losses due to air infiltration through windows [8].
Among the research applied to residential buildings and IAQ, Fabbri et al. [9] reported the results obtained from monitoring the Indoor Environmental Quality (IEQ) of a low-energy building. The results showed that buildings with low energy performances do not always guarantee a better level of IEQ, particularly during the summer.
Sekhar et al. [10] carried out a study of 12 bedrooms subjected to natural or mechanical conditioning, measuring thermal comfort and IAQ over a two-month period. Tests were performed on the occupants where they were asked to express their opinion on the quality of sleep. In rooms where there was mechanical ventilation, better quality was reported.
Perone et al. studied CMV to reduce primary energy consumption in air conditioning of greenhouses [11], and Evola et al. studied financial issues and primary energy balances in residential buildings [12].
An issue in the use of CMV systems is the noise caused by the ventilation system, particularly during the night period. In order to maintain adequate IAQ comfort, it is necessary to use high fan rotation speeds; however, the noise increases indicatively with the square of the fan speed.
According to the EN 12831 standard, the recommended minimum external ventilation rate to guarantee comfort inside an apartment is 0.5 1/h [13]. This airflow in a single room means an increase in speed and an increase in noise.
A way to ensure adequate air exchange inside an apartment, and provide acoustic comfort, could be increasing the fan speed in the less used rooms. For instance, during the day period, the fans speed in the bedrooms can be increased and those in the living room lowered and during the night period the speed in the bedrooms can be decreased and those in the living room increased.
In the literature, many studies dealt with the characterization of room acoustics parameters, in different conditions [14,15], both for the point of view of sound emissions [16] and of users [17].
Occupants’ acoustic comfort is a very complex problem [18]. Indeed, many different aspects can influence the indoor sound field like façade [19,20,21] or wall sound insulation [22], impact noise reduction and thermo-hygrometric parameters [23].
This work presents the results of acoustic measurements performed in an apartment equipped with CMV Alpac Flow Smart (SM) and Alpac Flow Compact (CM) systems inserted in an extruded polystyrene integrated window system, operating in a single and simultaneous mode. Acoustic simulations are also presented using RAMSETE raytracing software on 3 apartments.
The sound pressure levels inside the apartments were measured assuming furnished rooms with a reverberation time of around 0.5 s and CMV sound power levels measured in the laboratory according to ISO 3744 [24].
2. Materials and Methods
The reference noise levels produced by equipment inside a residential room according to the EN 16798-1 standards were assumed [25]. This standard reports different types of buildings and three comfort classes (I, II, III). The equivalent continuous sound pressure level in octave-bands, standardized to a reference reverberation time, is:
where LAeq is the equivalent continuous sound pressure level, T is the reverberation time and T0 is the reference reverberation time (0.5 s for residential buildings).
The reference values for a residential building are shown in the Table 1, highlighting living rooms and bedrooms.
2.1. Experimental Evaluation of CMV Sound Pressure Level and Calibration of the Simulation Model
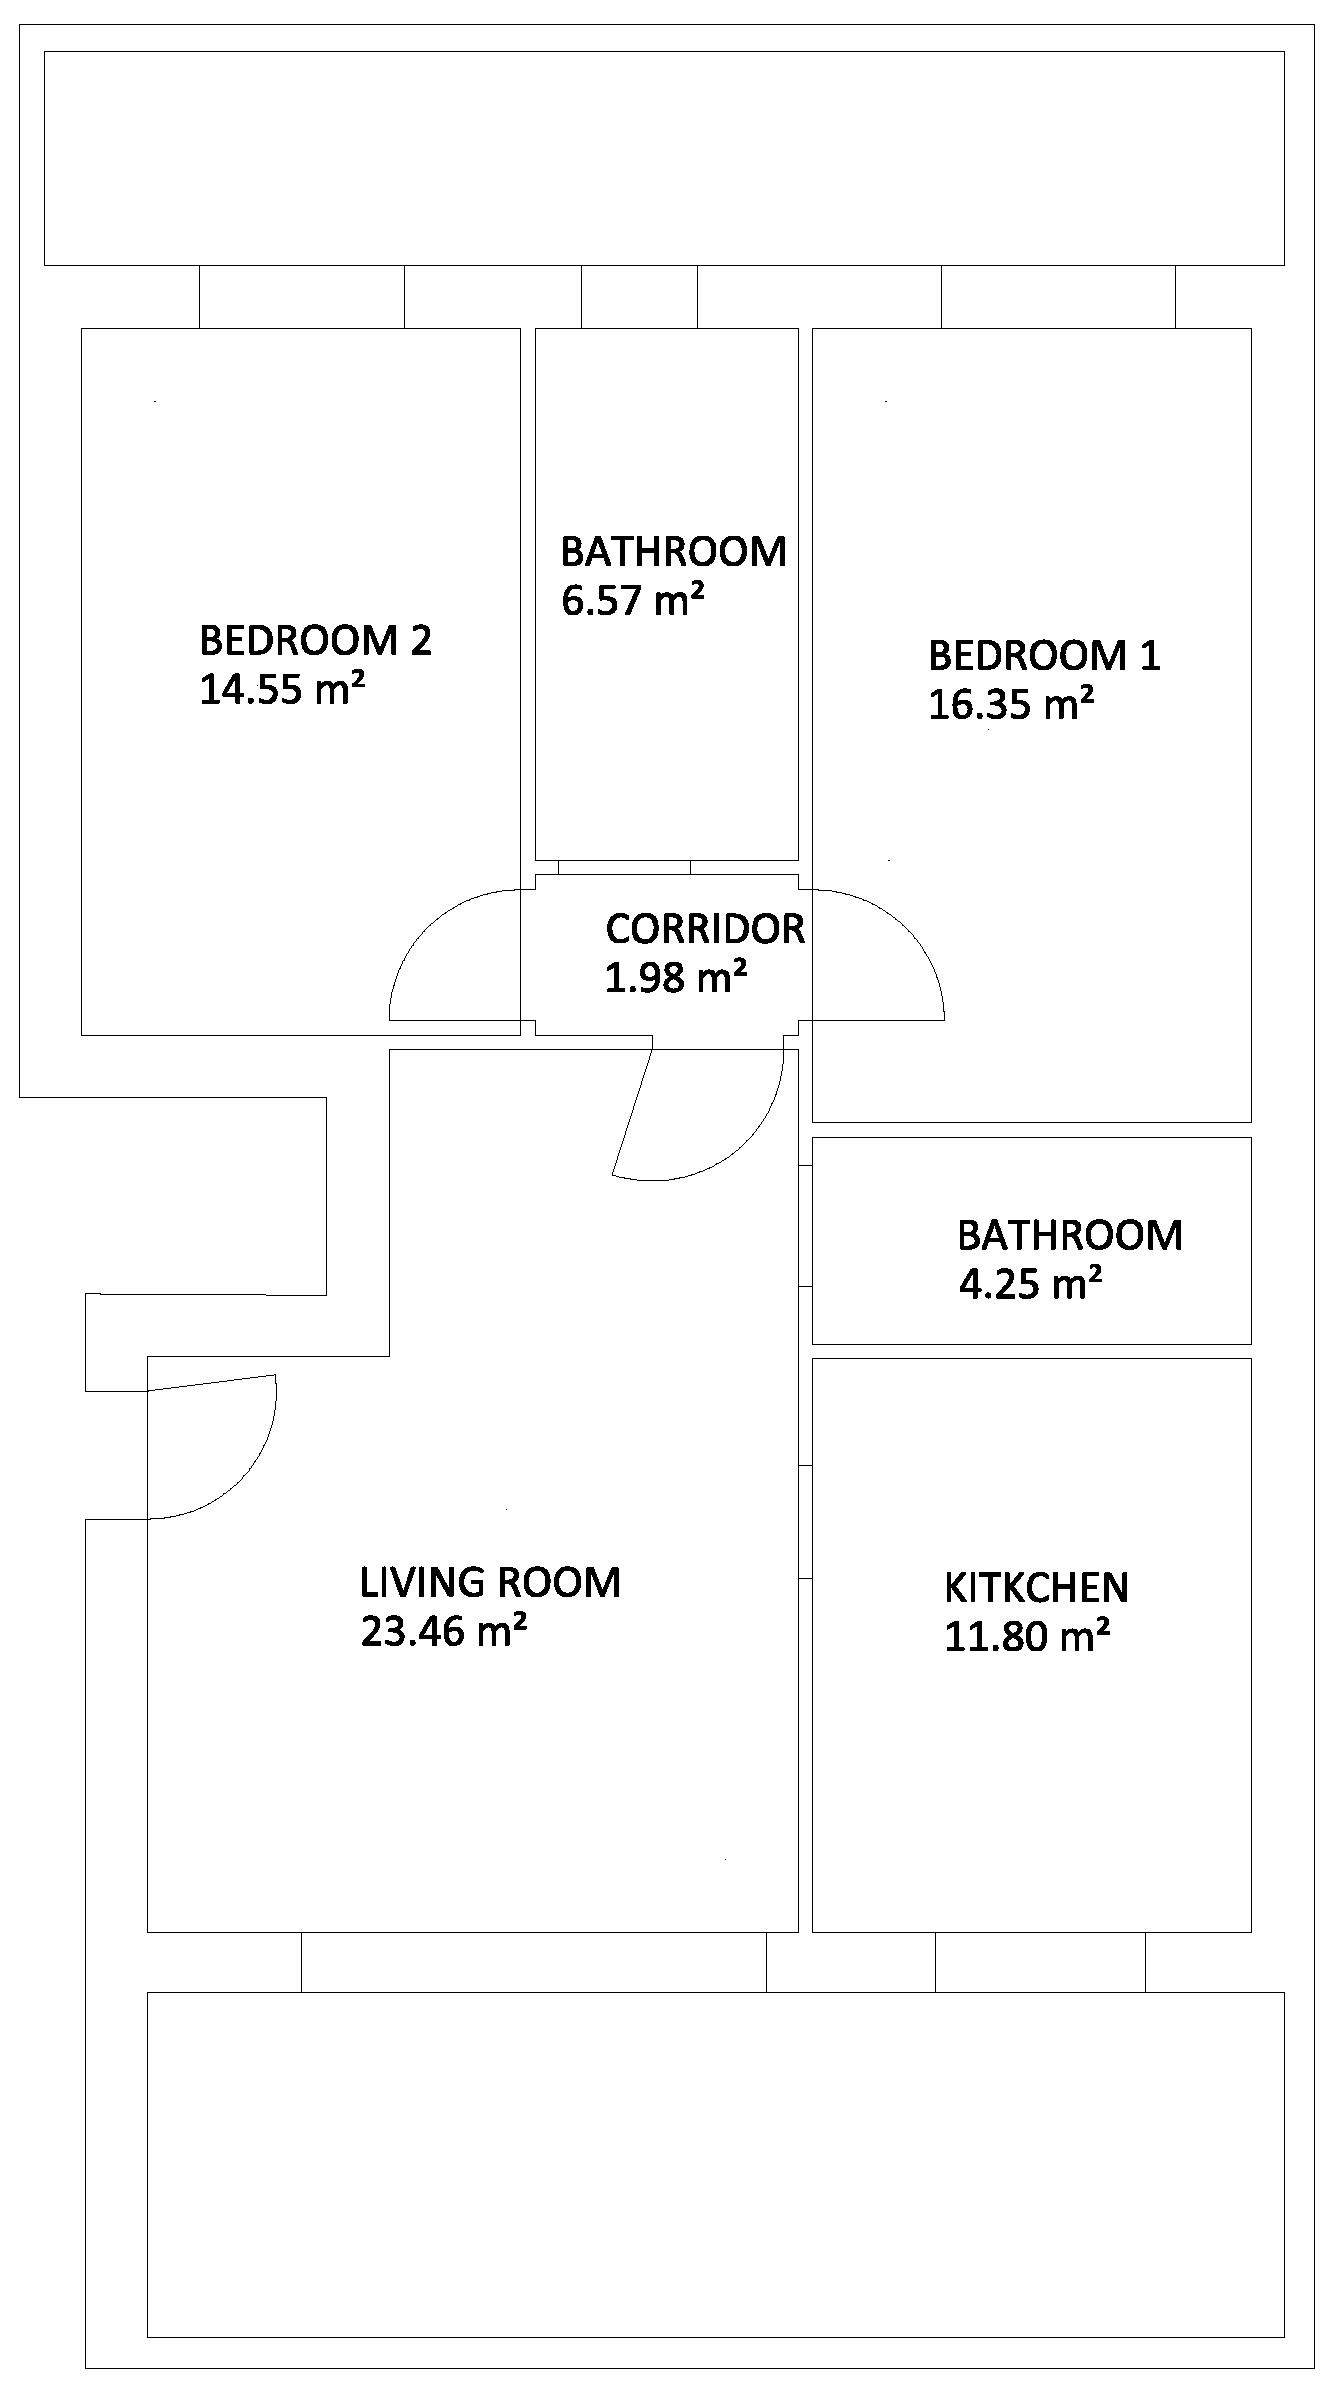
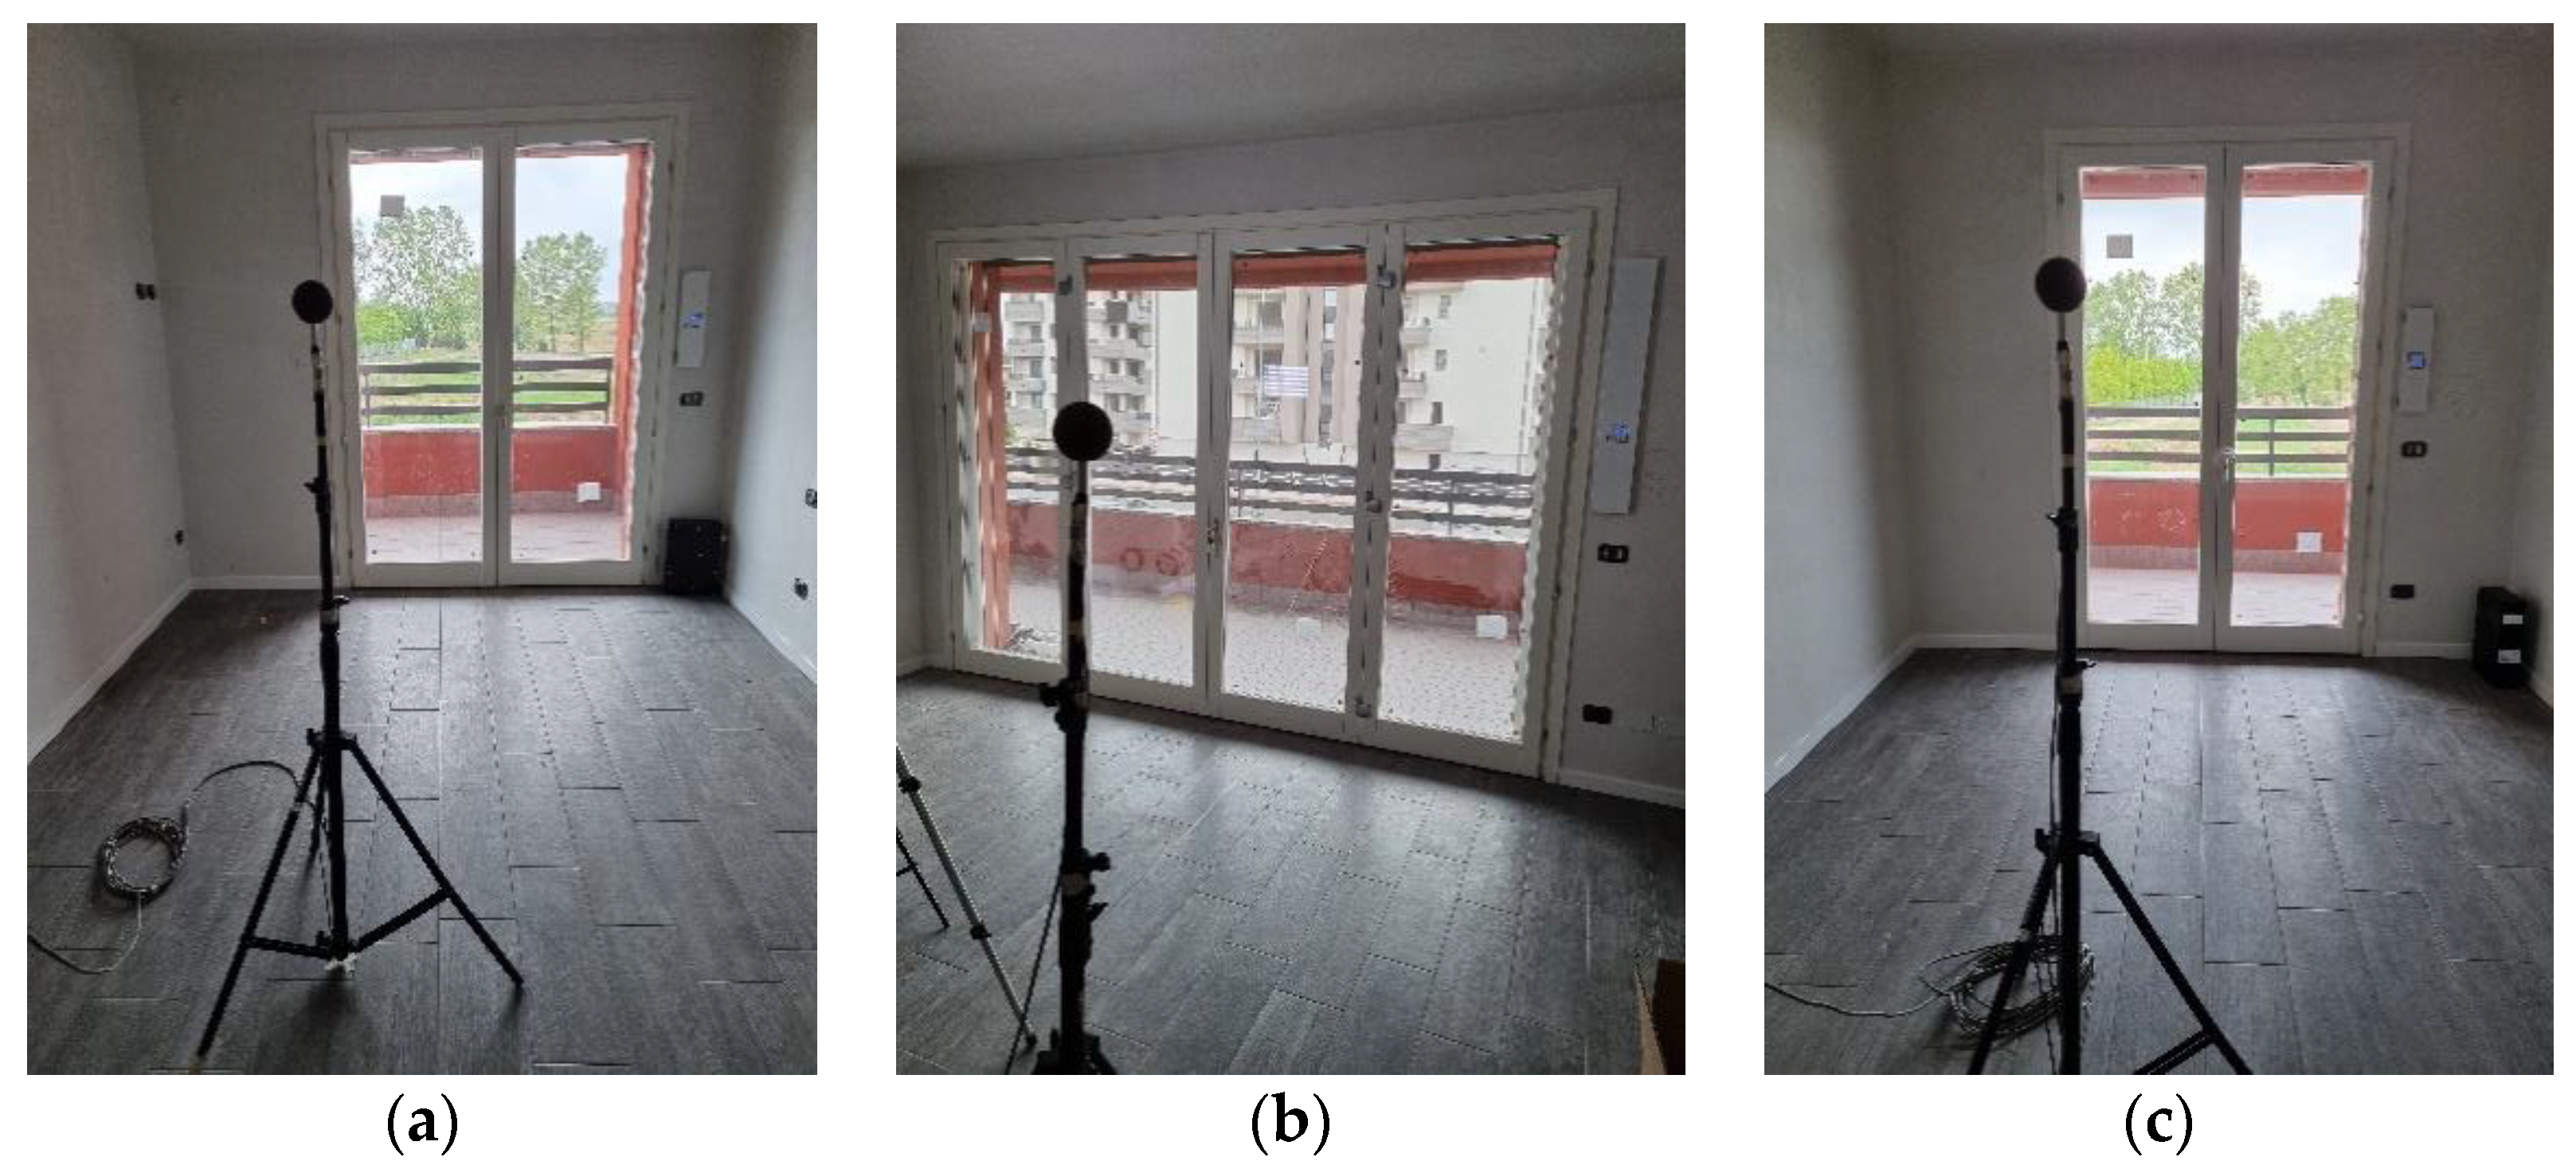
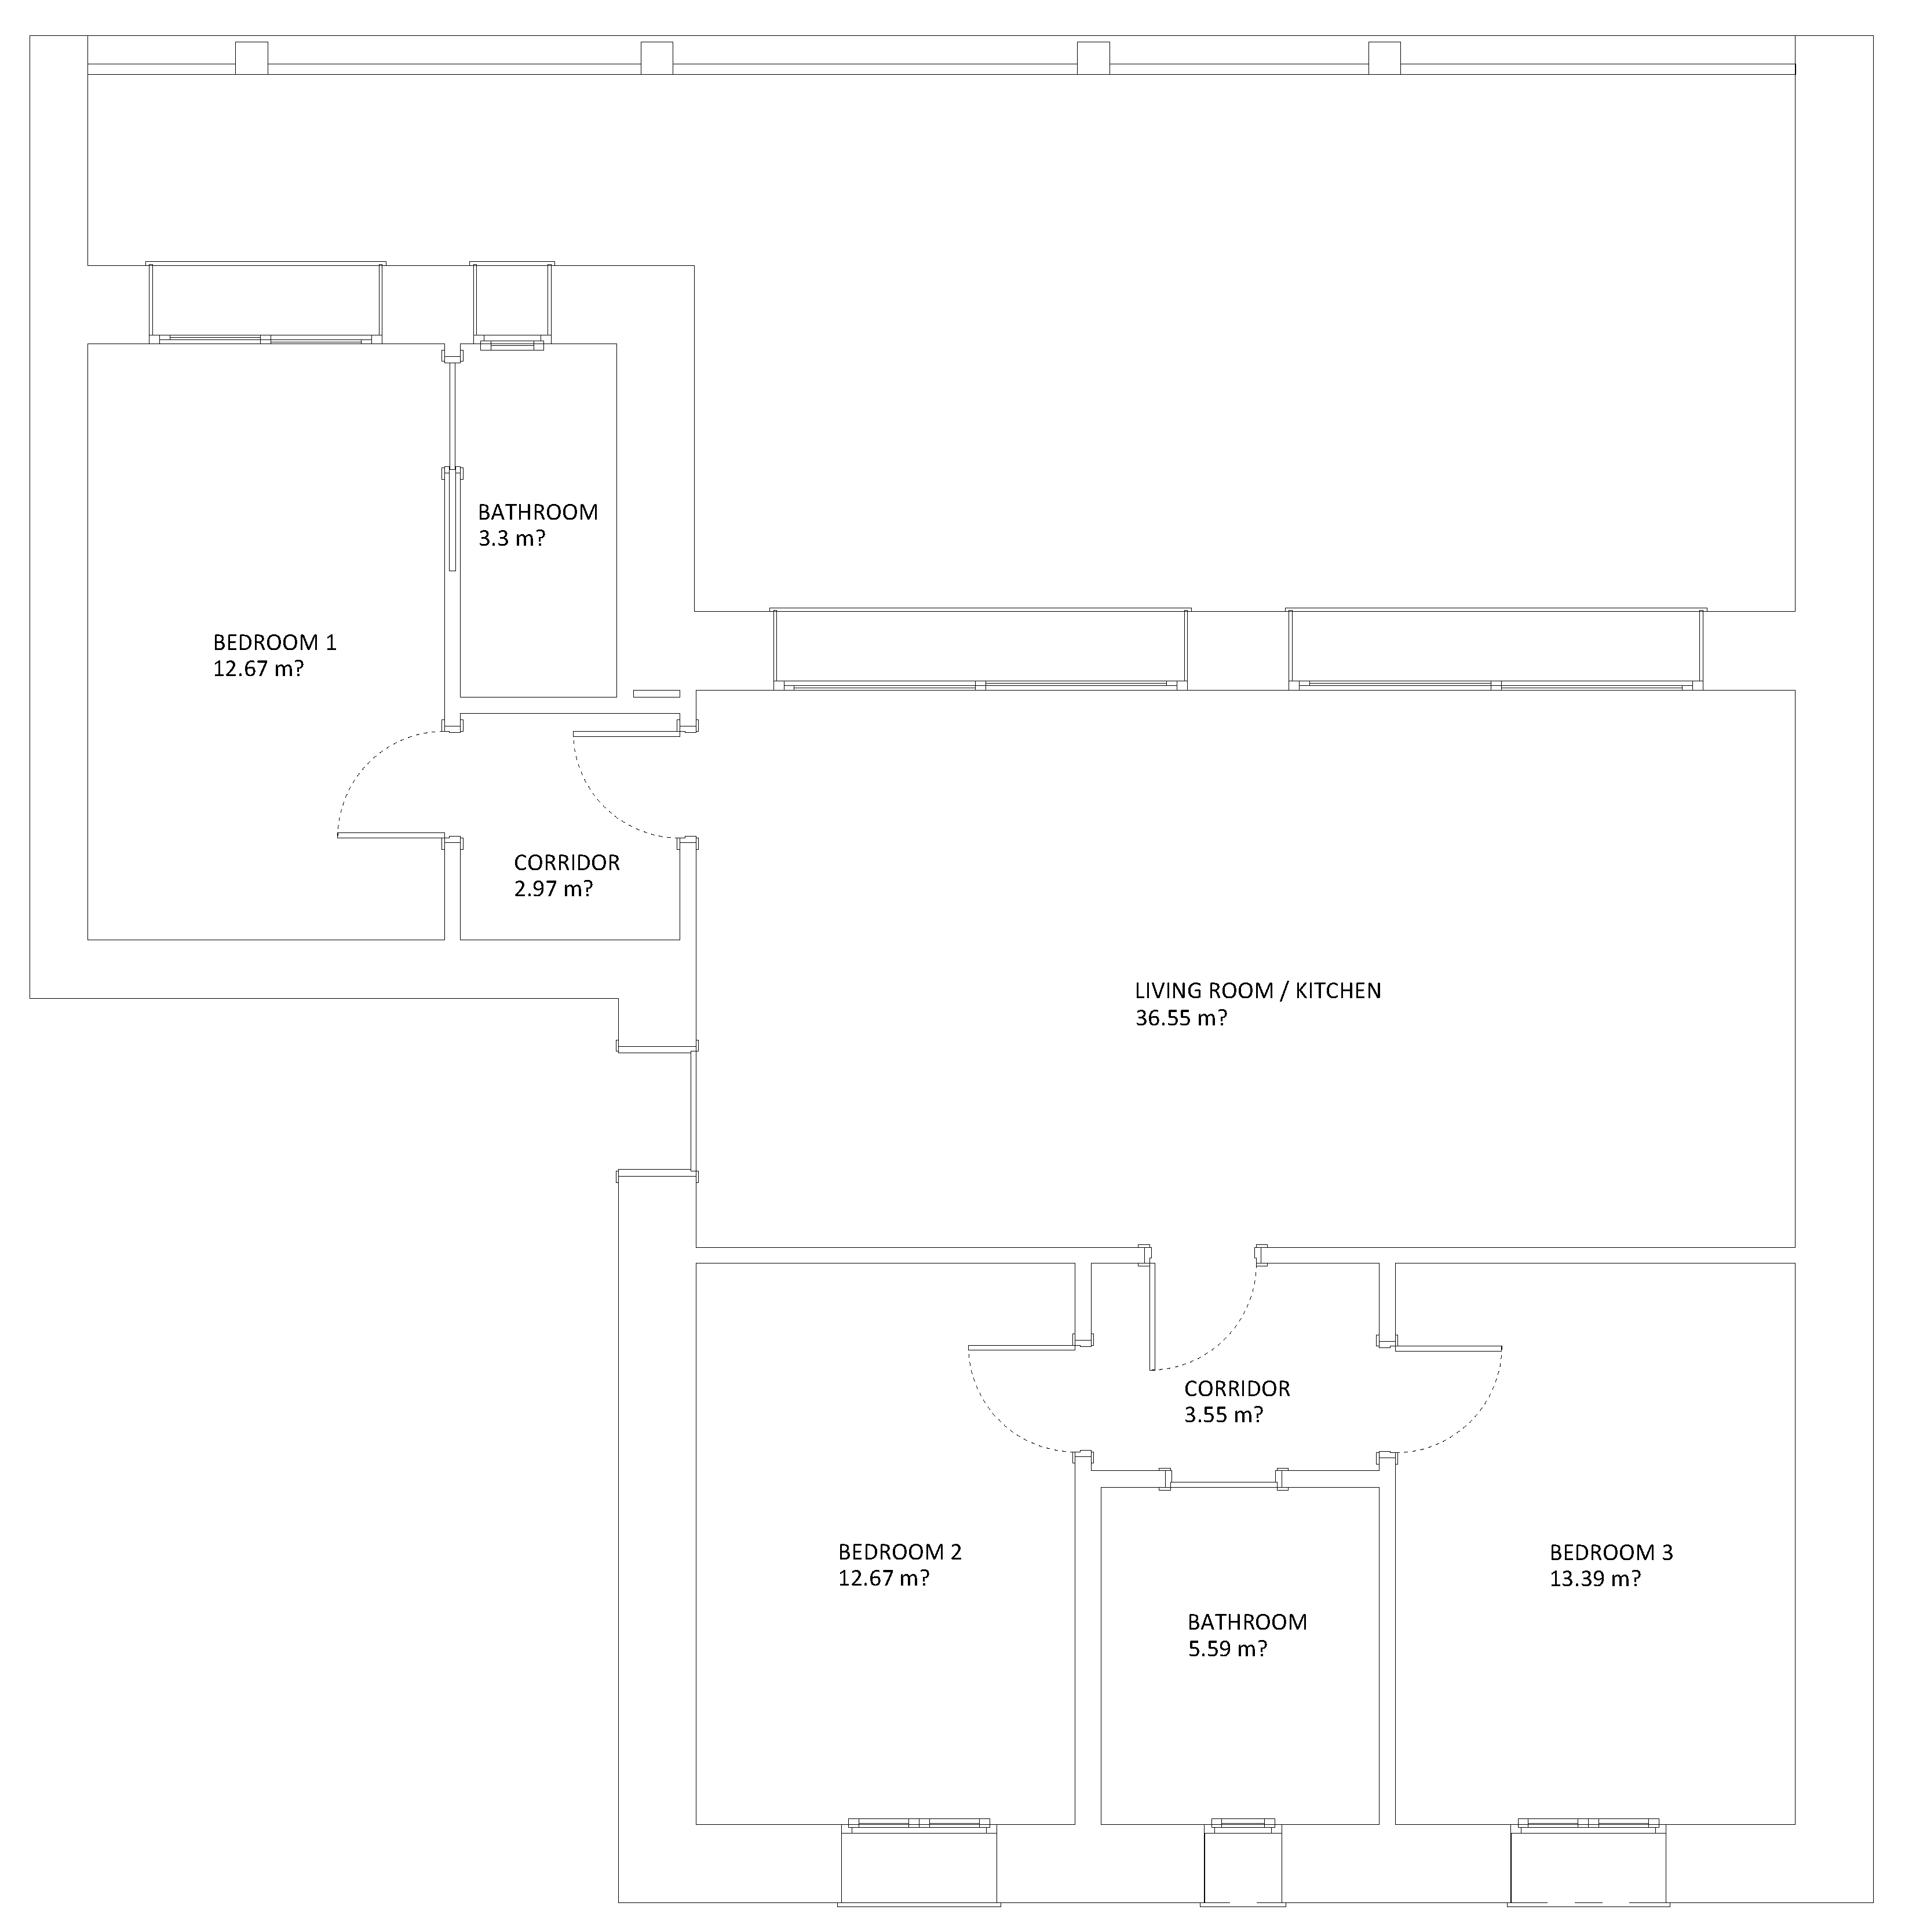
Sound pressure level measurements according to ISO 16032 [26] on an unfurnished apartment with two bedrooms, a living room, a kitchen and two bathrooms were made (Figure 1 and Figure 2). CMV were installed in the bedrooms (CM) and in the living room (SM).
The air flow rates at different speeds, which can be set via a control panel, are shown in Table 2.
To carry out the software simulations, sound power levels measured in a semi-anechoic chamber in accordance with the ISO 3744 standard, have been used. The calibration of the model was carried out by imposing an absorption coefficient for the surfaces that would allow the values of the measured reverberation time to be obtained.
From the measurements, it was possible to calibrate a three-dimensional simulation model using dedicated software. A calculation model based on the raytracing technique with RAMSETE software was implemented. This software, which uses pyramid rays, allows one to simulate and study the acoustic propagation of waves in space, considering the diffractive, insulating and absorbing effects of interposed barriers to sources and receiver.
The three-dimensional model recreates the morphology of the investigated rooms, considering the sound absorption, diffusion and sound insulation properties of the identified materials.
The software calculates the direct components of transmission of the sound wave in three-dimensional space, the indirect components and attenuated by the presence of obstacles along the wave propagation path and permits one to model the diffraction and edge phenomena of objects and elements interposed between source and receiver.
2.2. Simulation of the Sound Pressure Level
Once the model was calibrated and validated on a real apartment, it was possible to analyze other types of apartments assuming various models of CMV and various speeds in order to satisfy the overall air exchange requirement of 0.5 1/h and at the same time, decrease the sound pressure level.
The following apartment types were considered:
- −
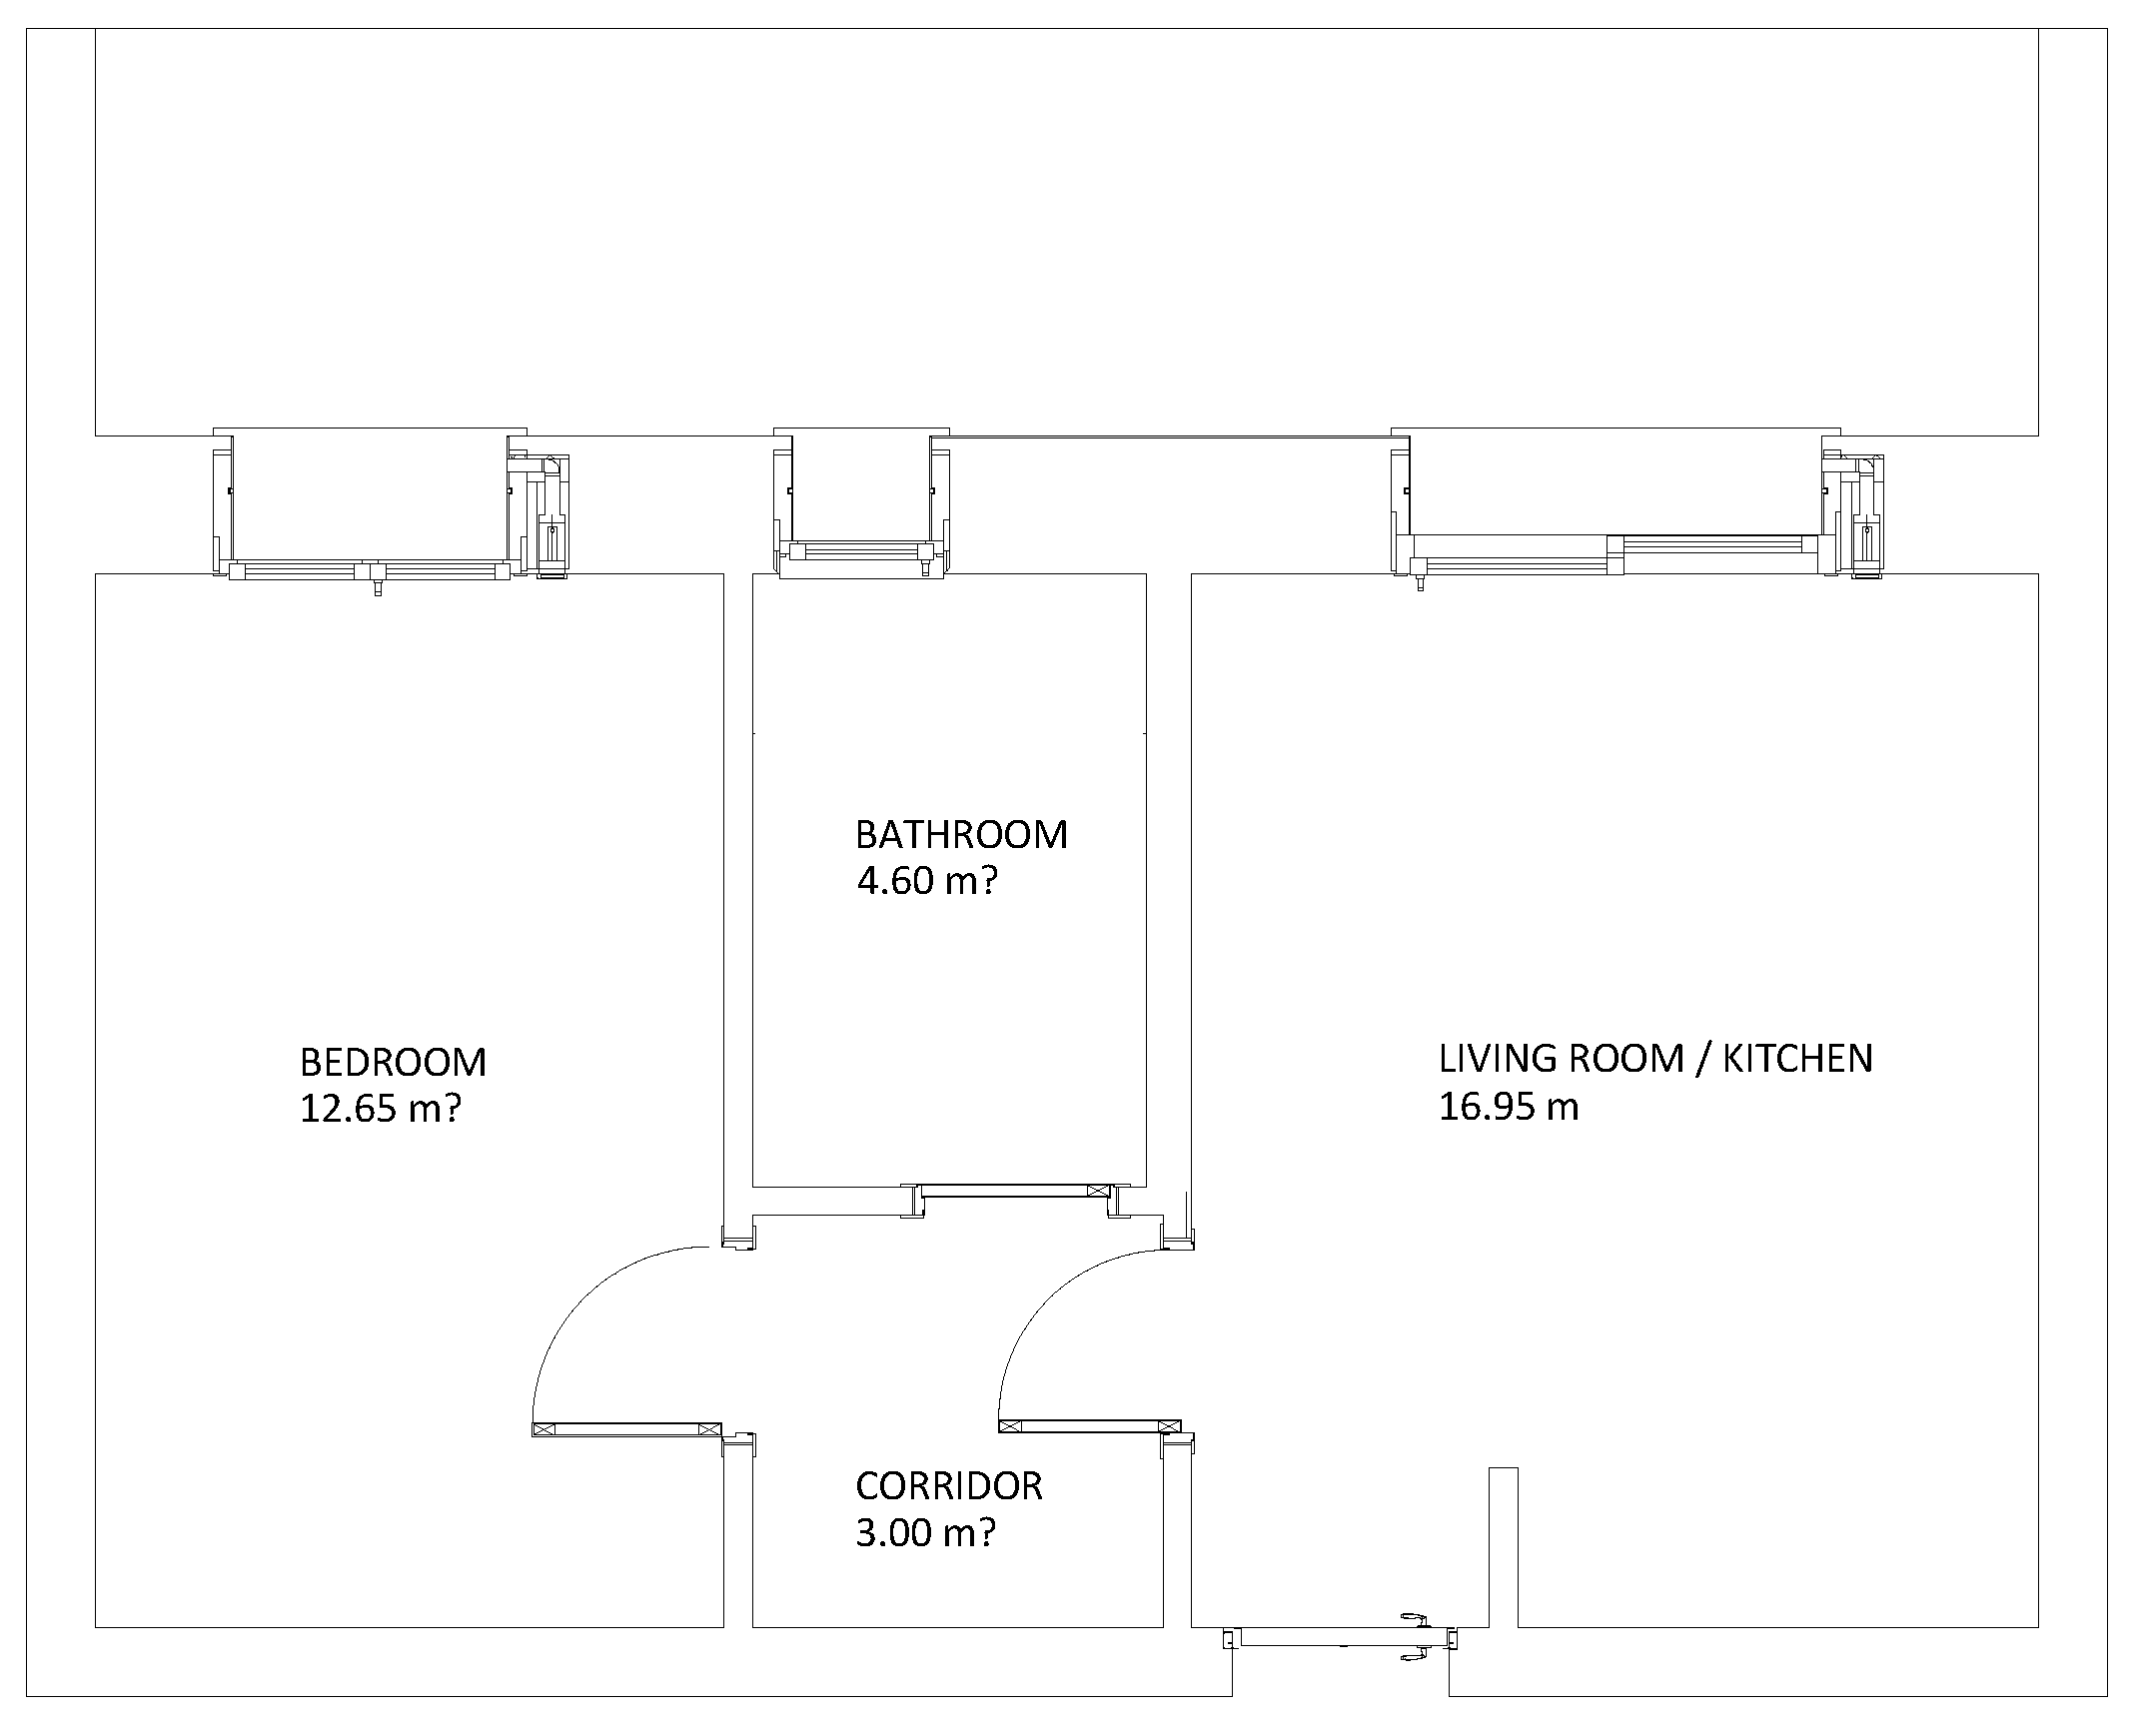
- two-room apartment with SM CMV installed in the bedroom and living room/kitchen (Figure 3);
- −
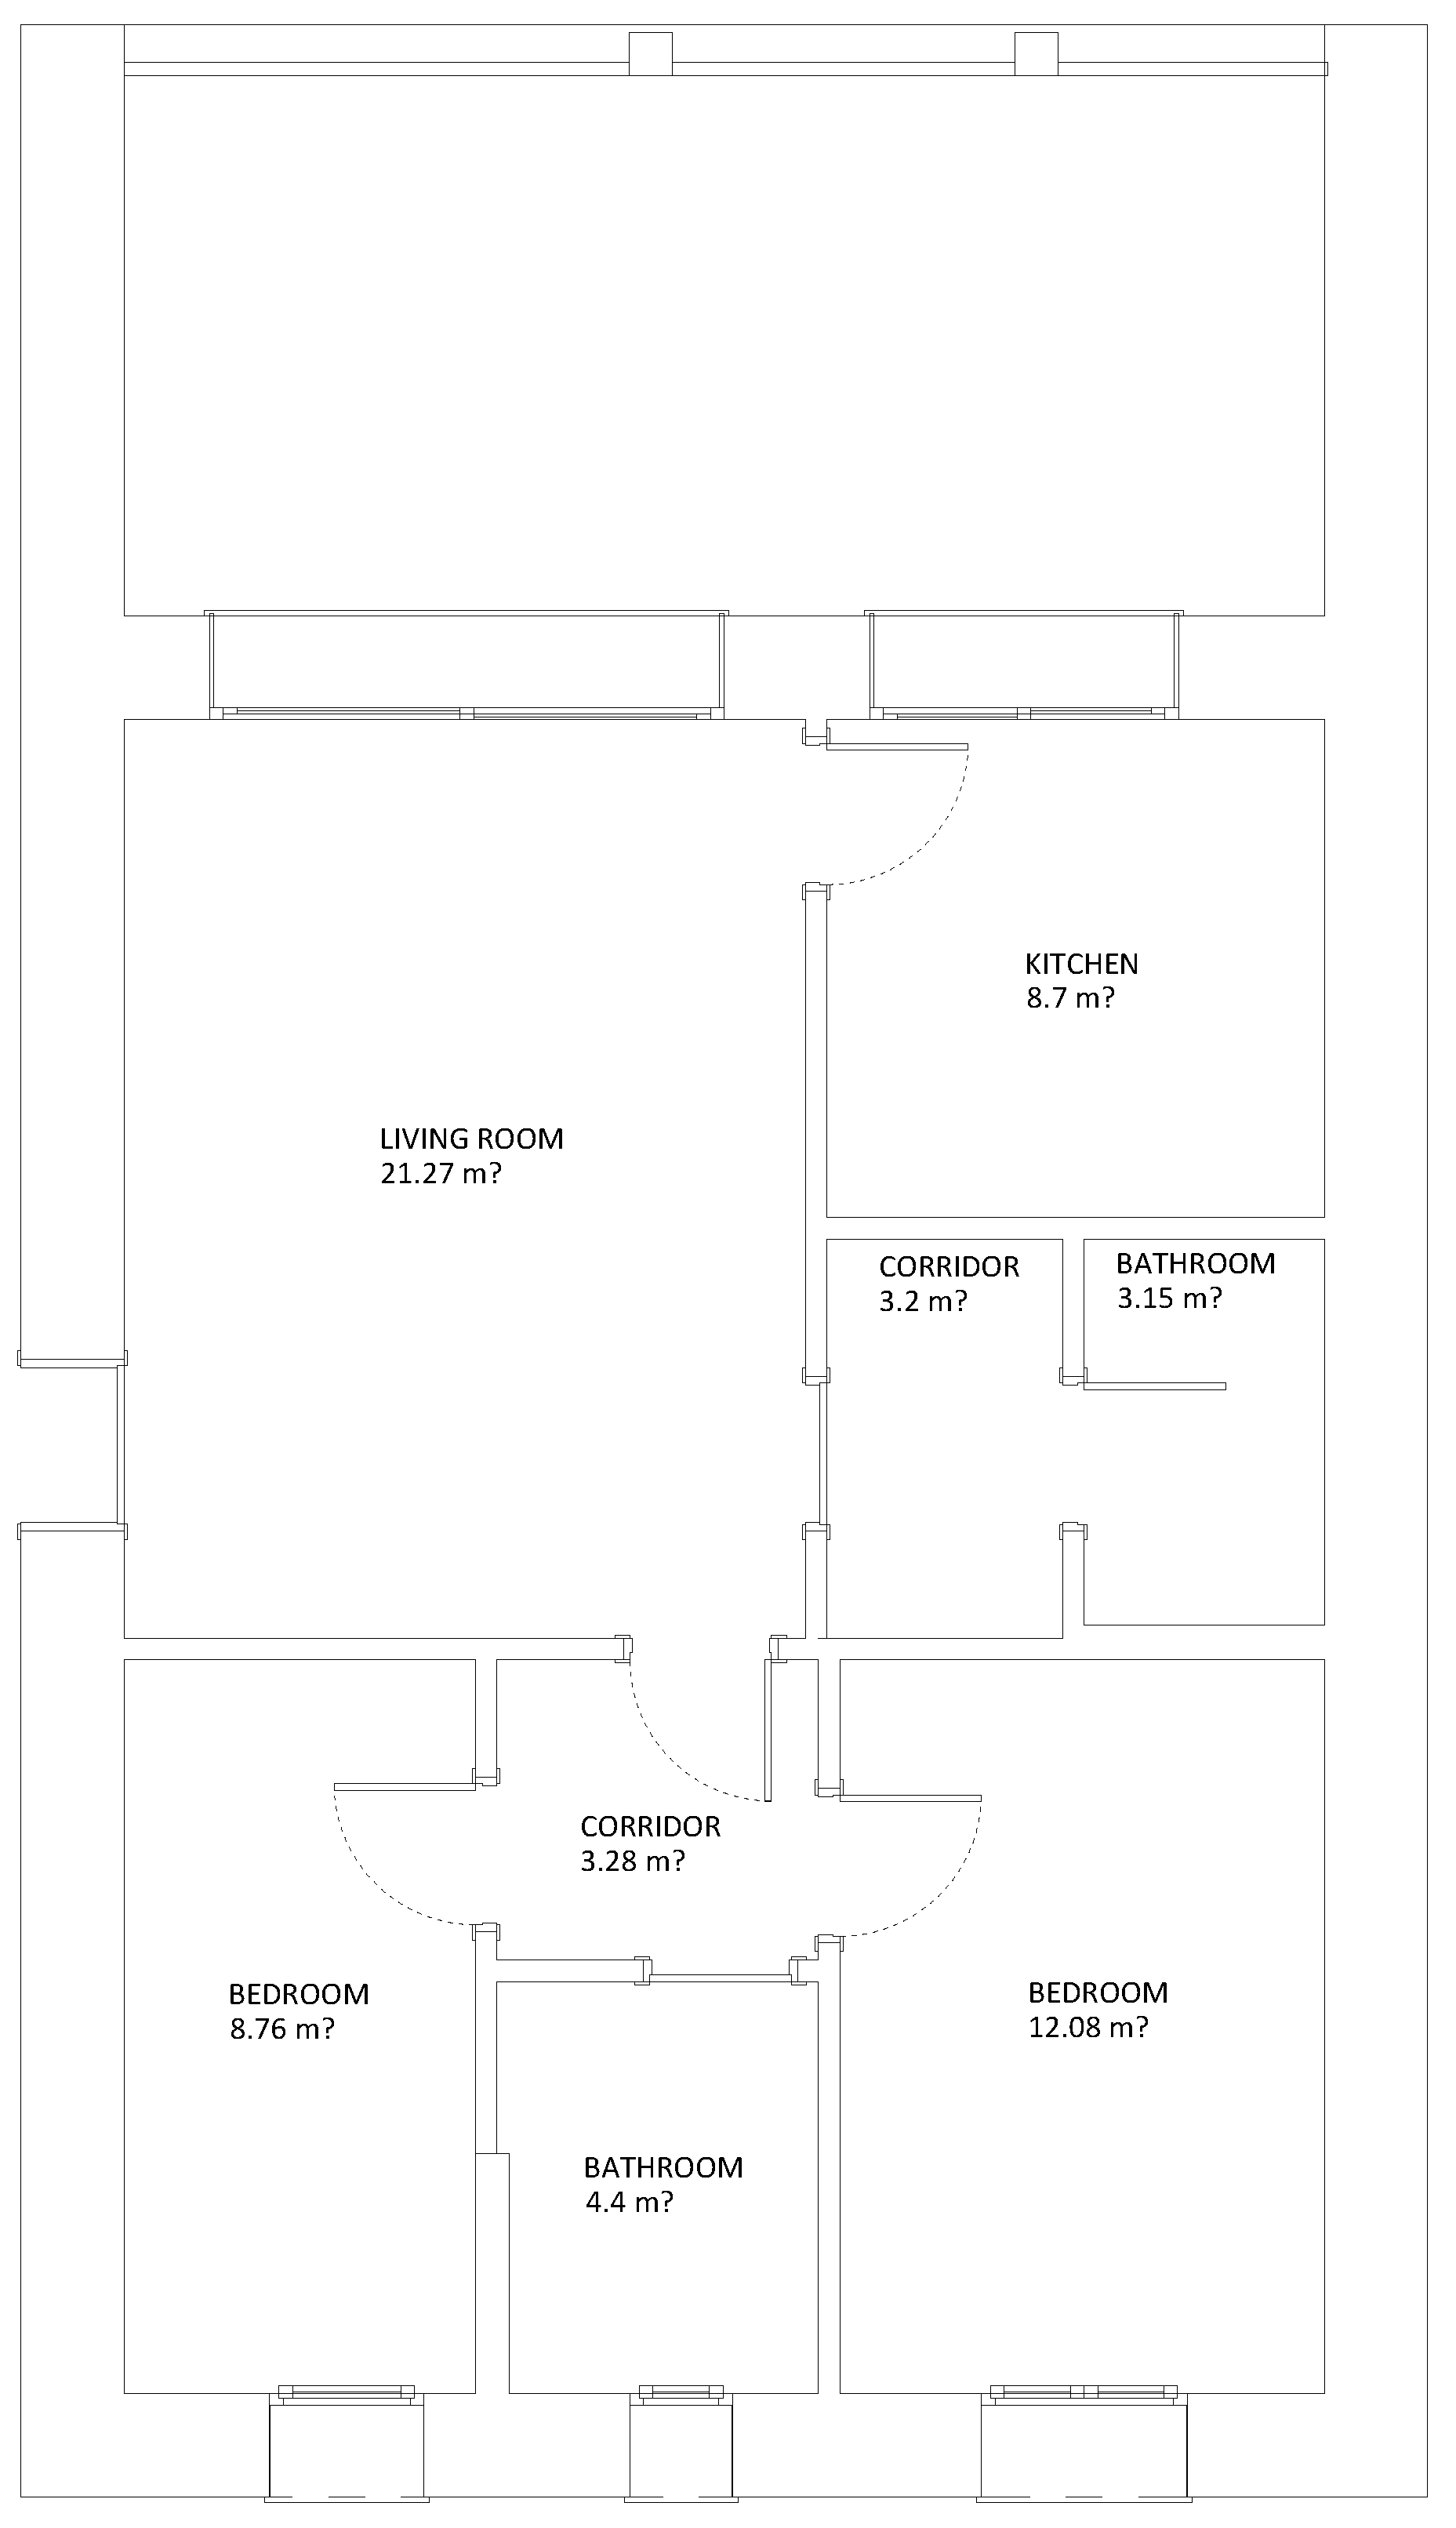
- three-room apartment with SM CMV installed in the bedrooms and living room and CM CMV installed in the kitchen (Figure 4);
- −
- four-room apartment with SM CMV installed in the bedroom and two SM CMV in the living room/kitchen (Figure 5).
Two configurations have been hypothesized:
- −
- “night” with lower airflows in the bedrooms and higher in the living rooms;
- −
- “day” with lower airflows in the living rooms and higher in the bedrooms.
For bedrooms “day” configuration, a factory speed setting equal to 2 or lower according to the needs of these specific rooms has been assumed.
Table 3 (“night” configuration) and Table 4 (“day” configuration) show information regarding the types of apartment, the volume of the rooms, the target air exchange, the type/number of CMV and the factory speed setting of the fans assumed in order to obtain the desired air exchange equal to 0.5 1/h overall inside the apartment.
The simulations carried out for the three types of apartments are shown in the following section. In the simulations, furnished rooms with mean reverberation time of 0.5 s ± 0.2 in the 125–4000 Hz 1/1 octave bands range were assumed. Background noise was not considered in the simulations because it mainly depends on noises outside the apartment and cannot be determined.
3. Results
3.1. Sound Pressure Level Measurements
Inside bedroom 1 and bedroom 2 (Figure 1 and Figure 2), the CM CMV were installed, while inside the living room, the SM CMV was installed. Measurements were performed with a Larson Davis 824 Class 1 sound level meter. During the measurements, the doors remained open.
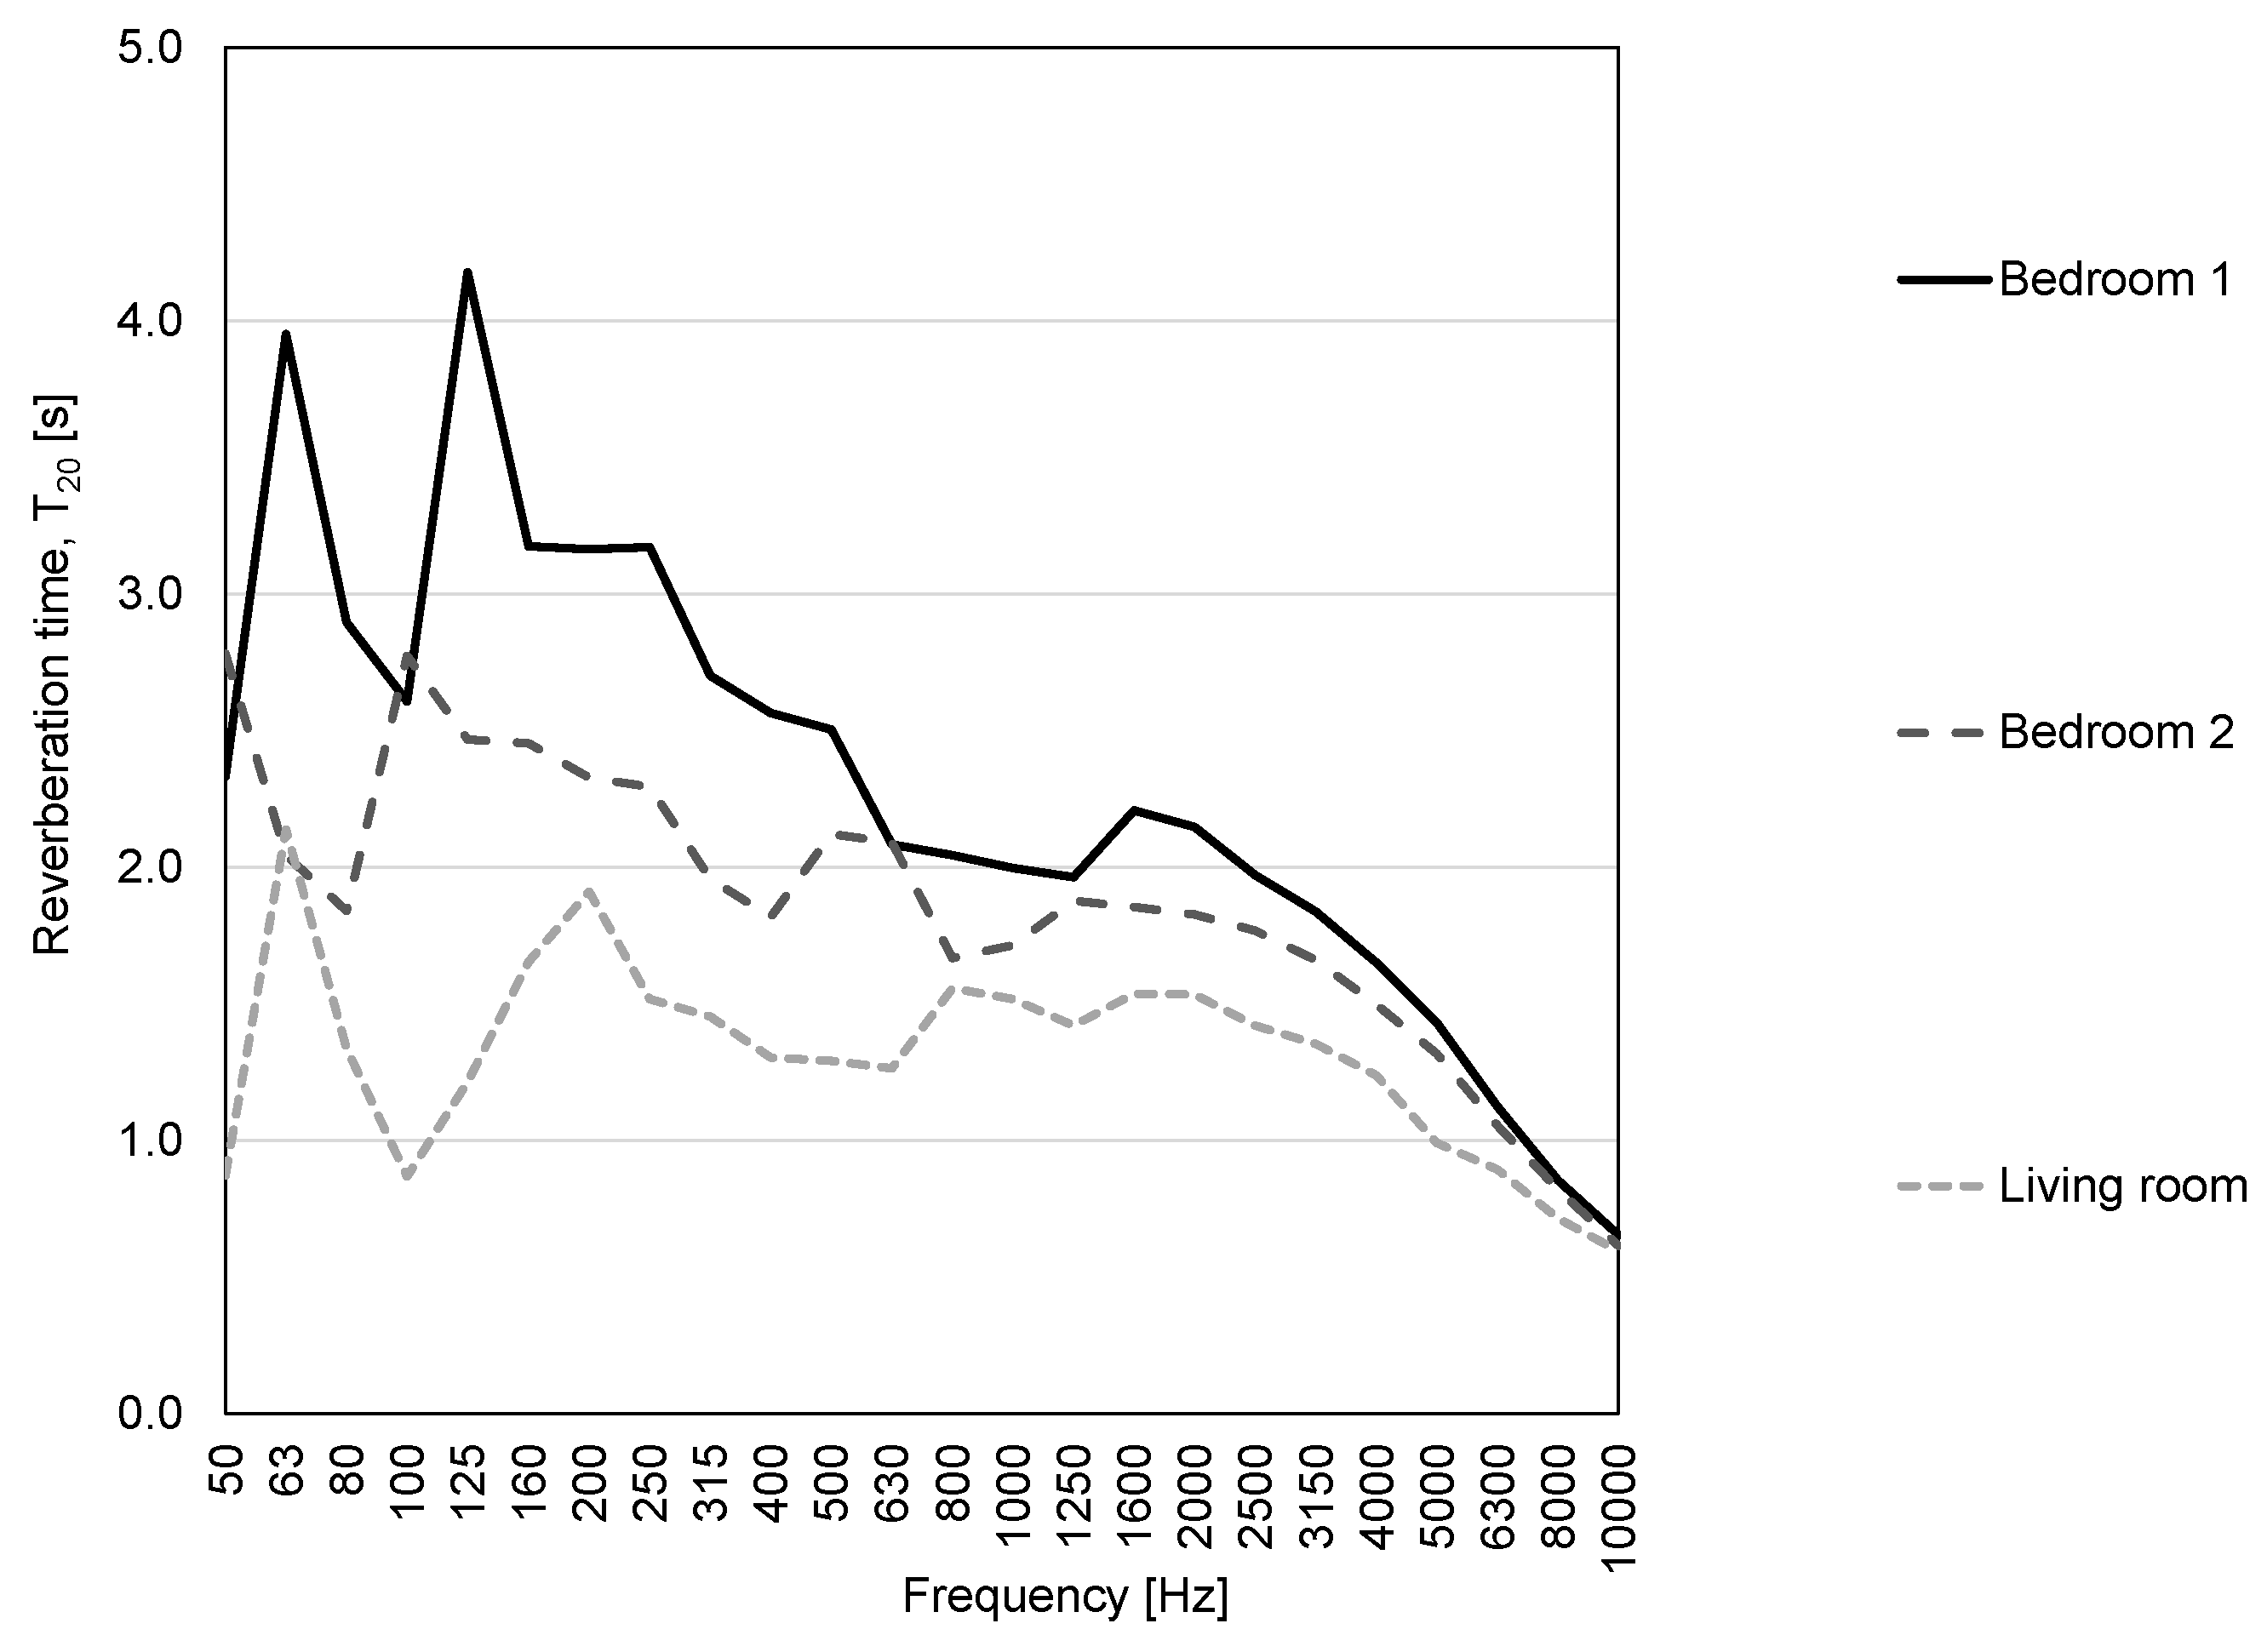
The reverberation times of the three rooms with 2 source positions and 3 microphone positions were measured according to ISO 3382-2 [27], and the results are shown in Figure 6. It can be noted that the reverberation times in the living room are lower than in the bedrooms because the bedrooms were completely empty while the living room had objects for the finishing of the apartment (not visible in the photos) such as cardboard boxes, tiles, insulating panels and floor protection fabric.
Then, sound pressure level measurements were made inside bedroom 2, turning on the CMV of bedroom 1, bedroom 2 and the living room.
Sound pressure level measurements were performed setting speed 1 in the bedrooms and speed 3 in the living room. This level was then compared with the ones obtained by setting speed 1 or speed 2 in bedroom 2 only.
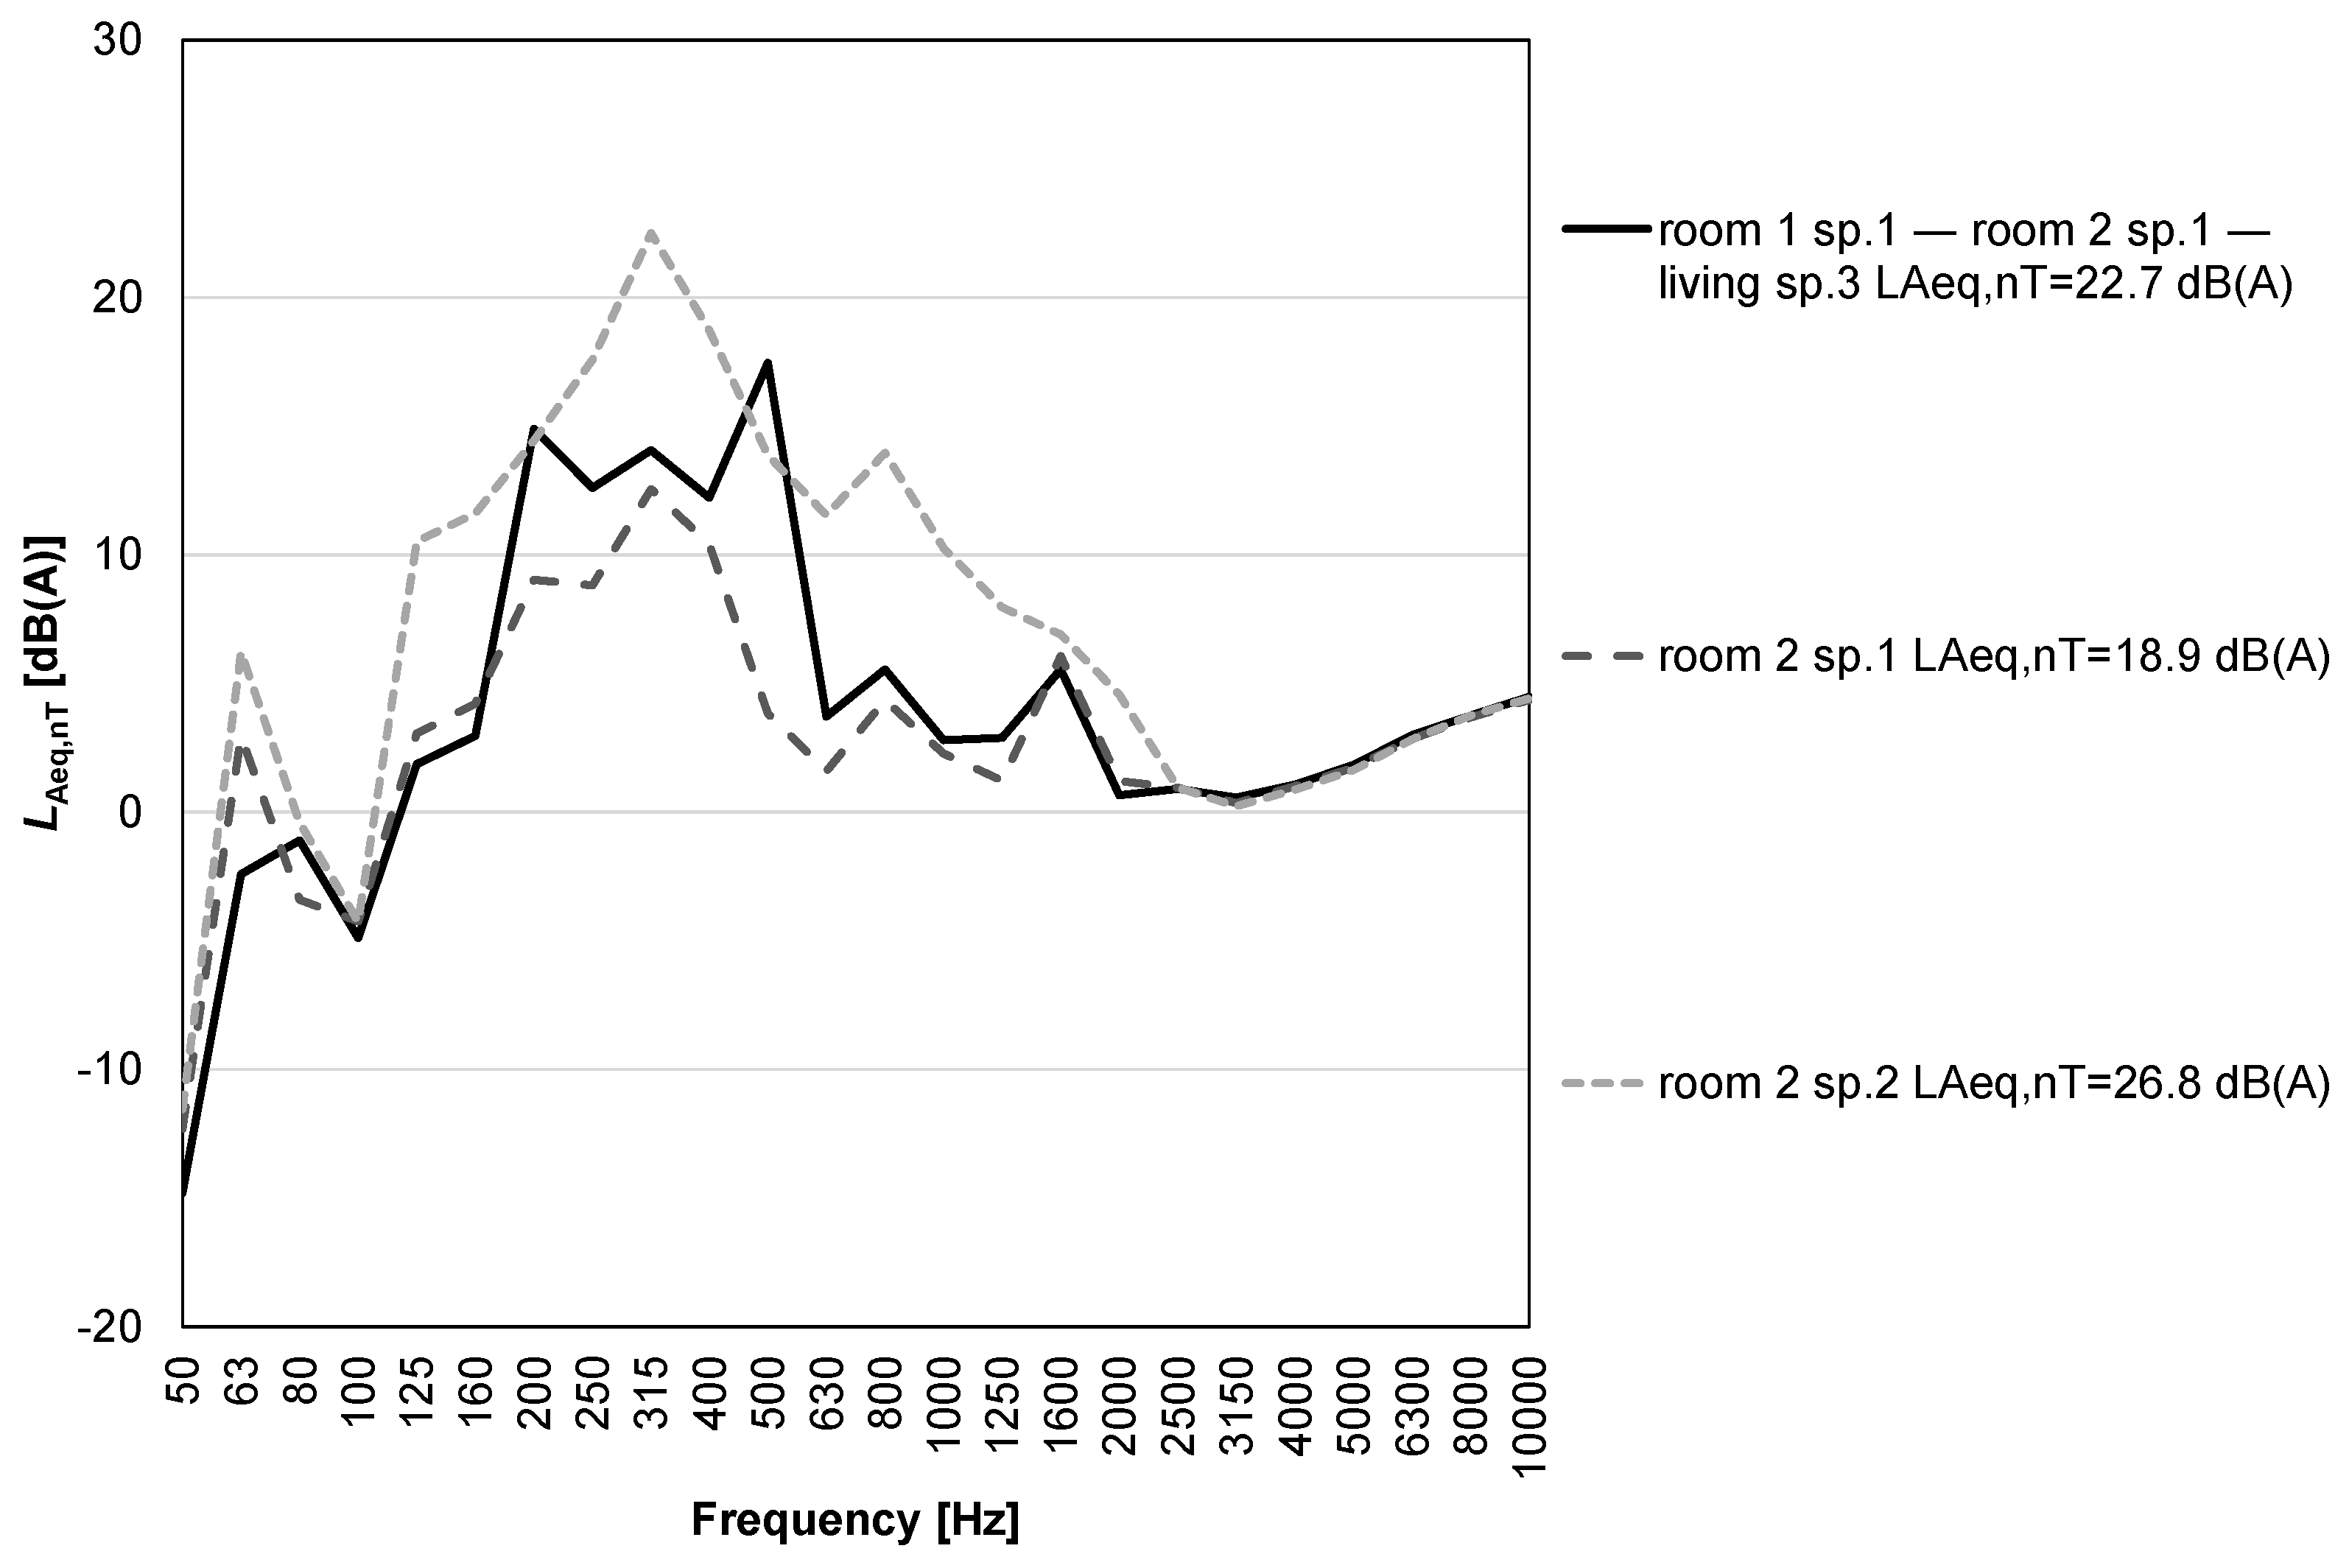
The frequency A-weighted sound pressure levels at different speeds corrected with the background noise and the reverberation time according to the ISO 16032 standard are shown in Figure 7.
The sound pressure levels corrected with the background noise, LAeq, and corrected with the reverberation time, LAeq,nT, are shown in Table 5.
It can be noted that the difference between configuration 1 and 2 is equal to 3.8 dB(A), but using the CMV in bedroom 2 at speed 2, a worsening of 4.1 dB(A) is obtained.
3.2. Sound Pressure Level Model Calibration
From the measurements, it was possible to calibrate a three-dimensional simulation model using RAMSETE software (Figure 8).
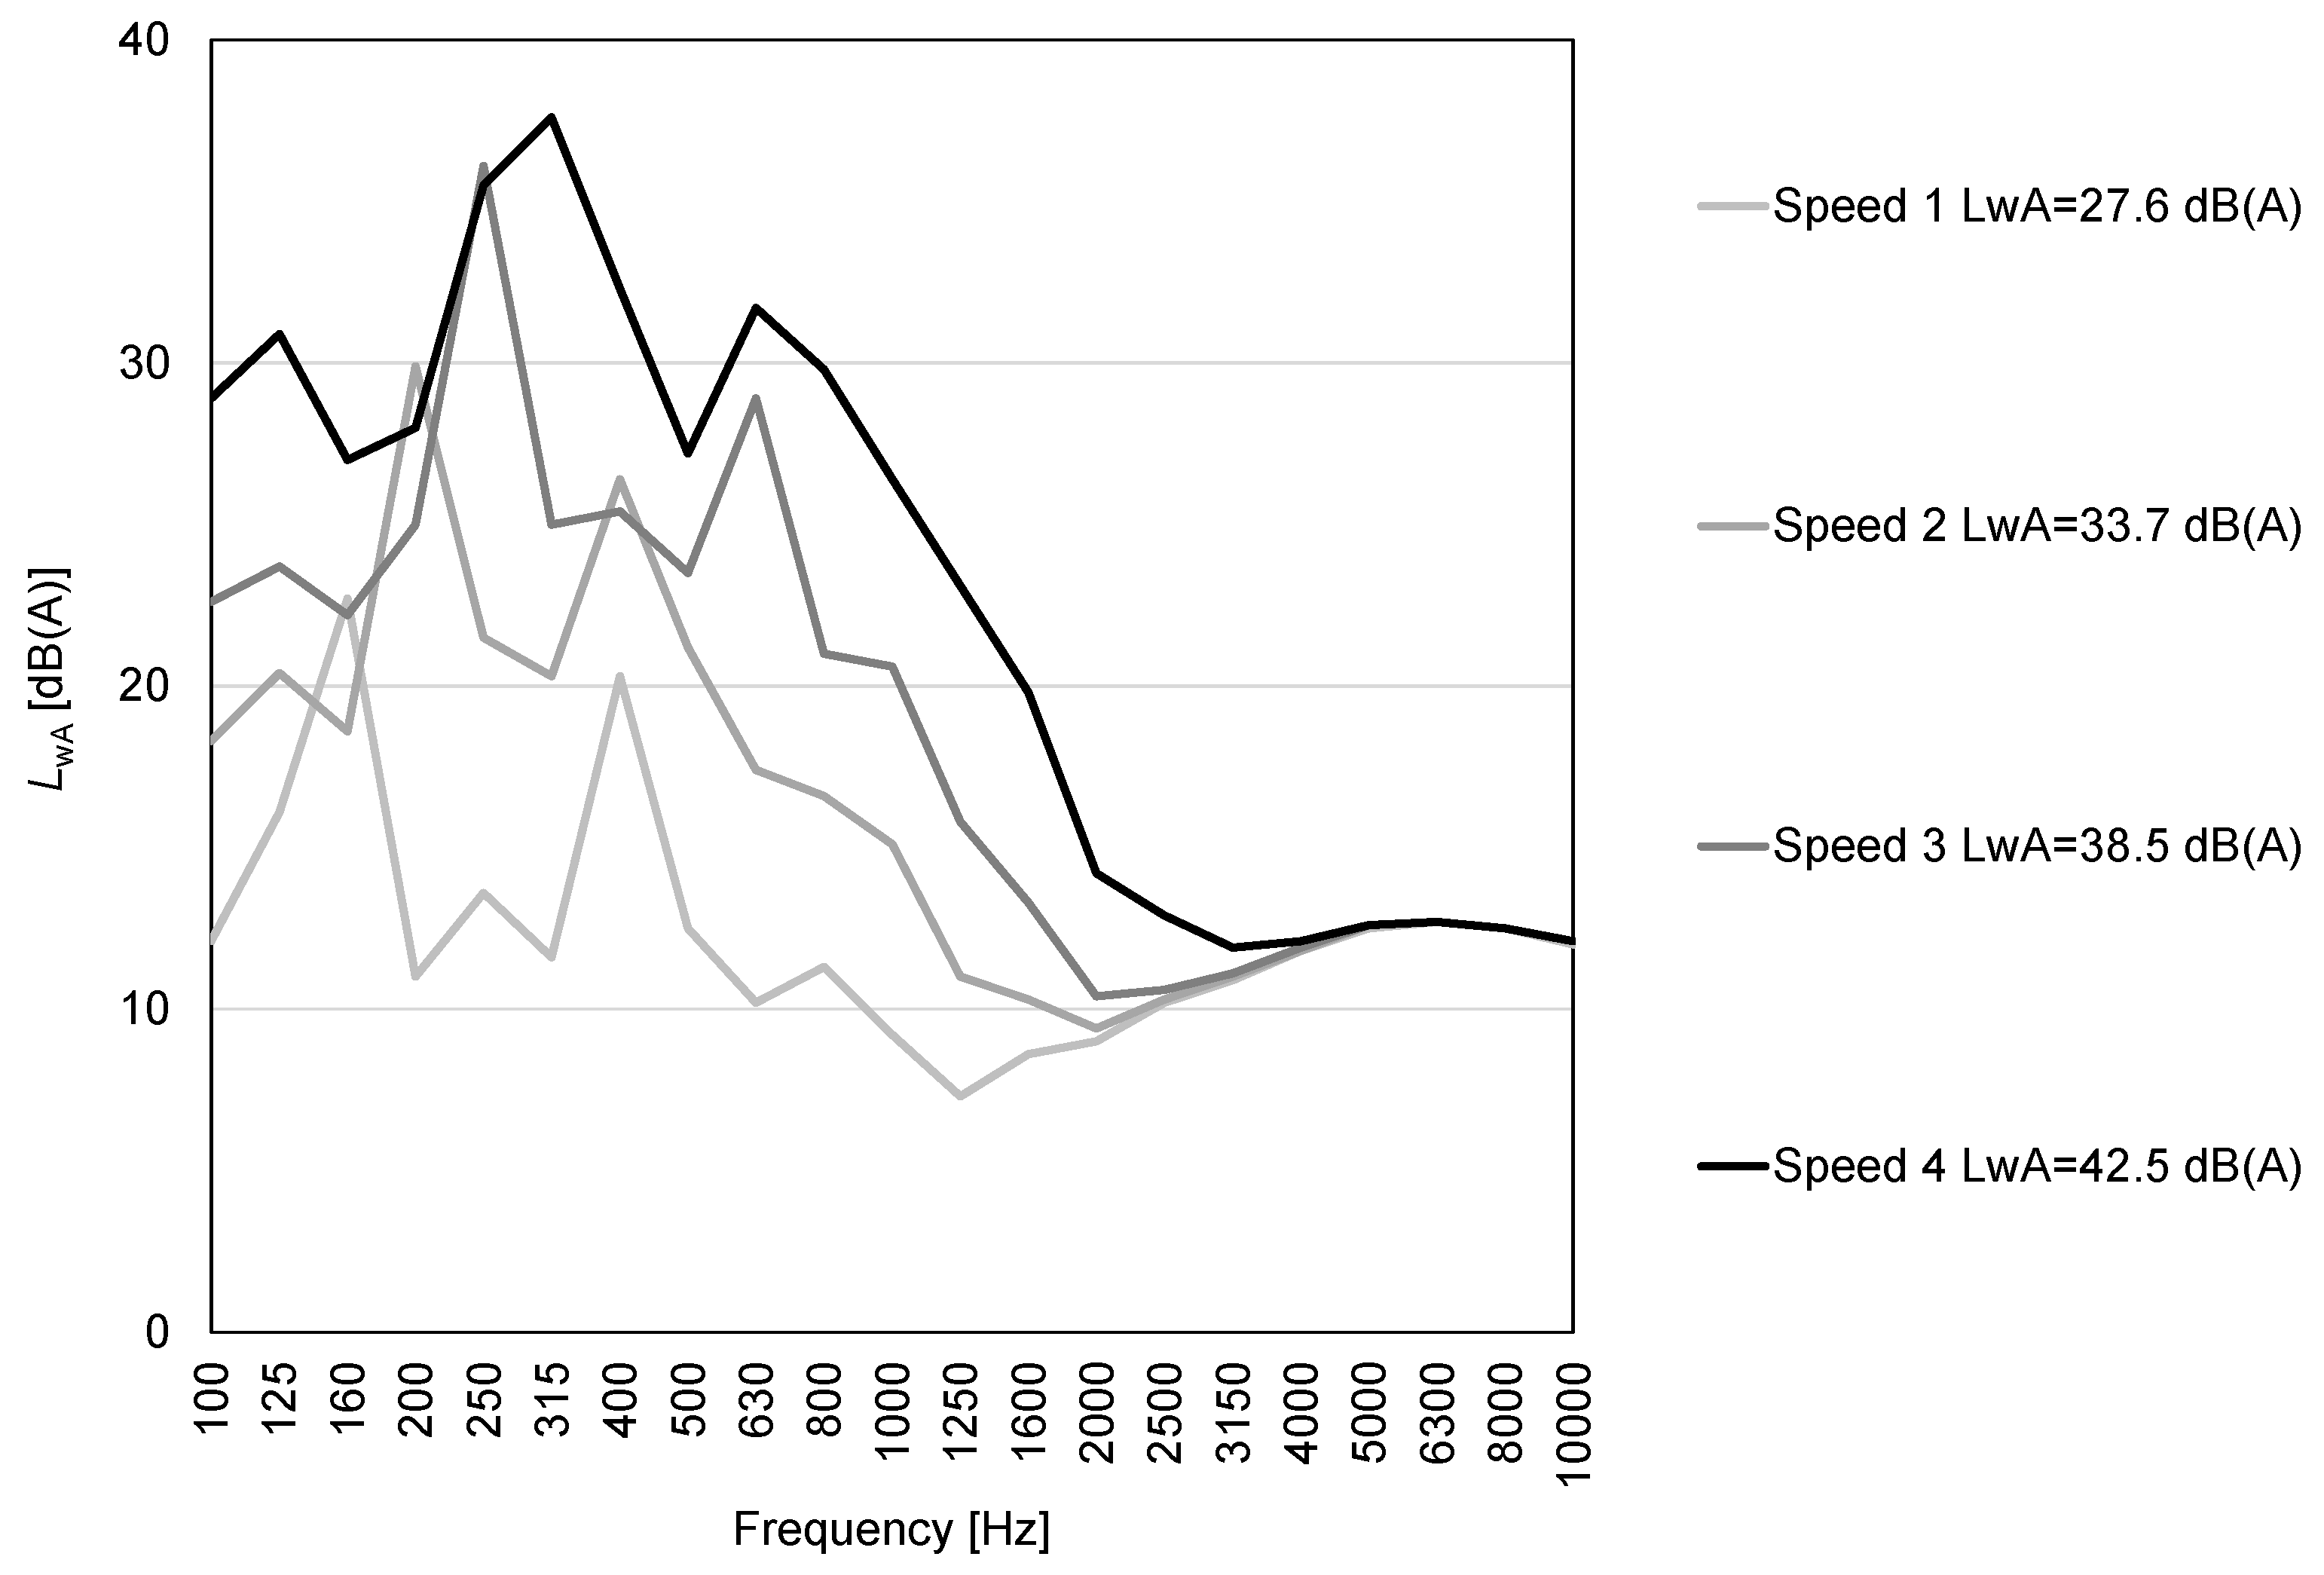
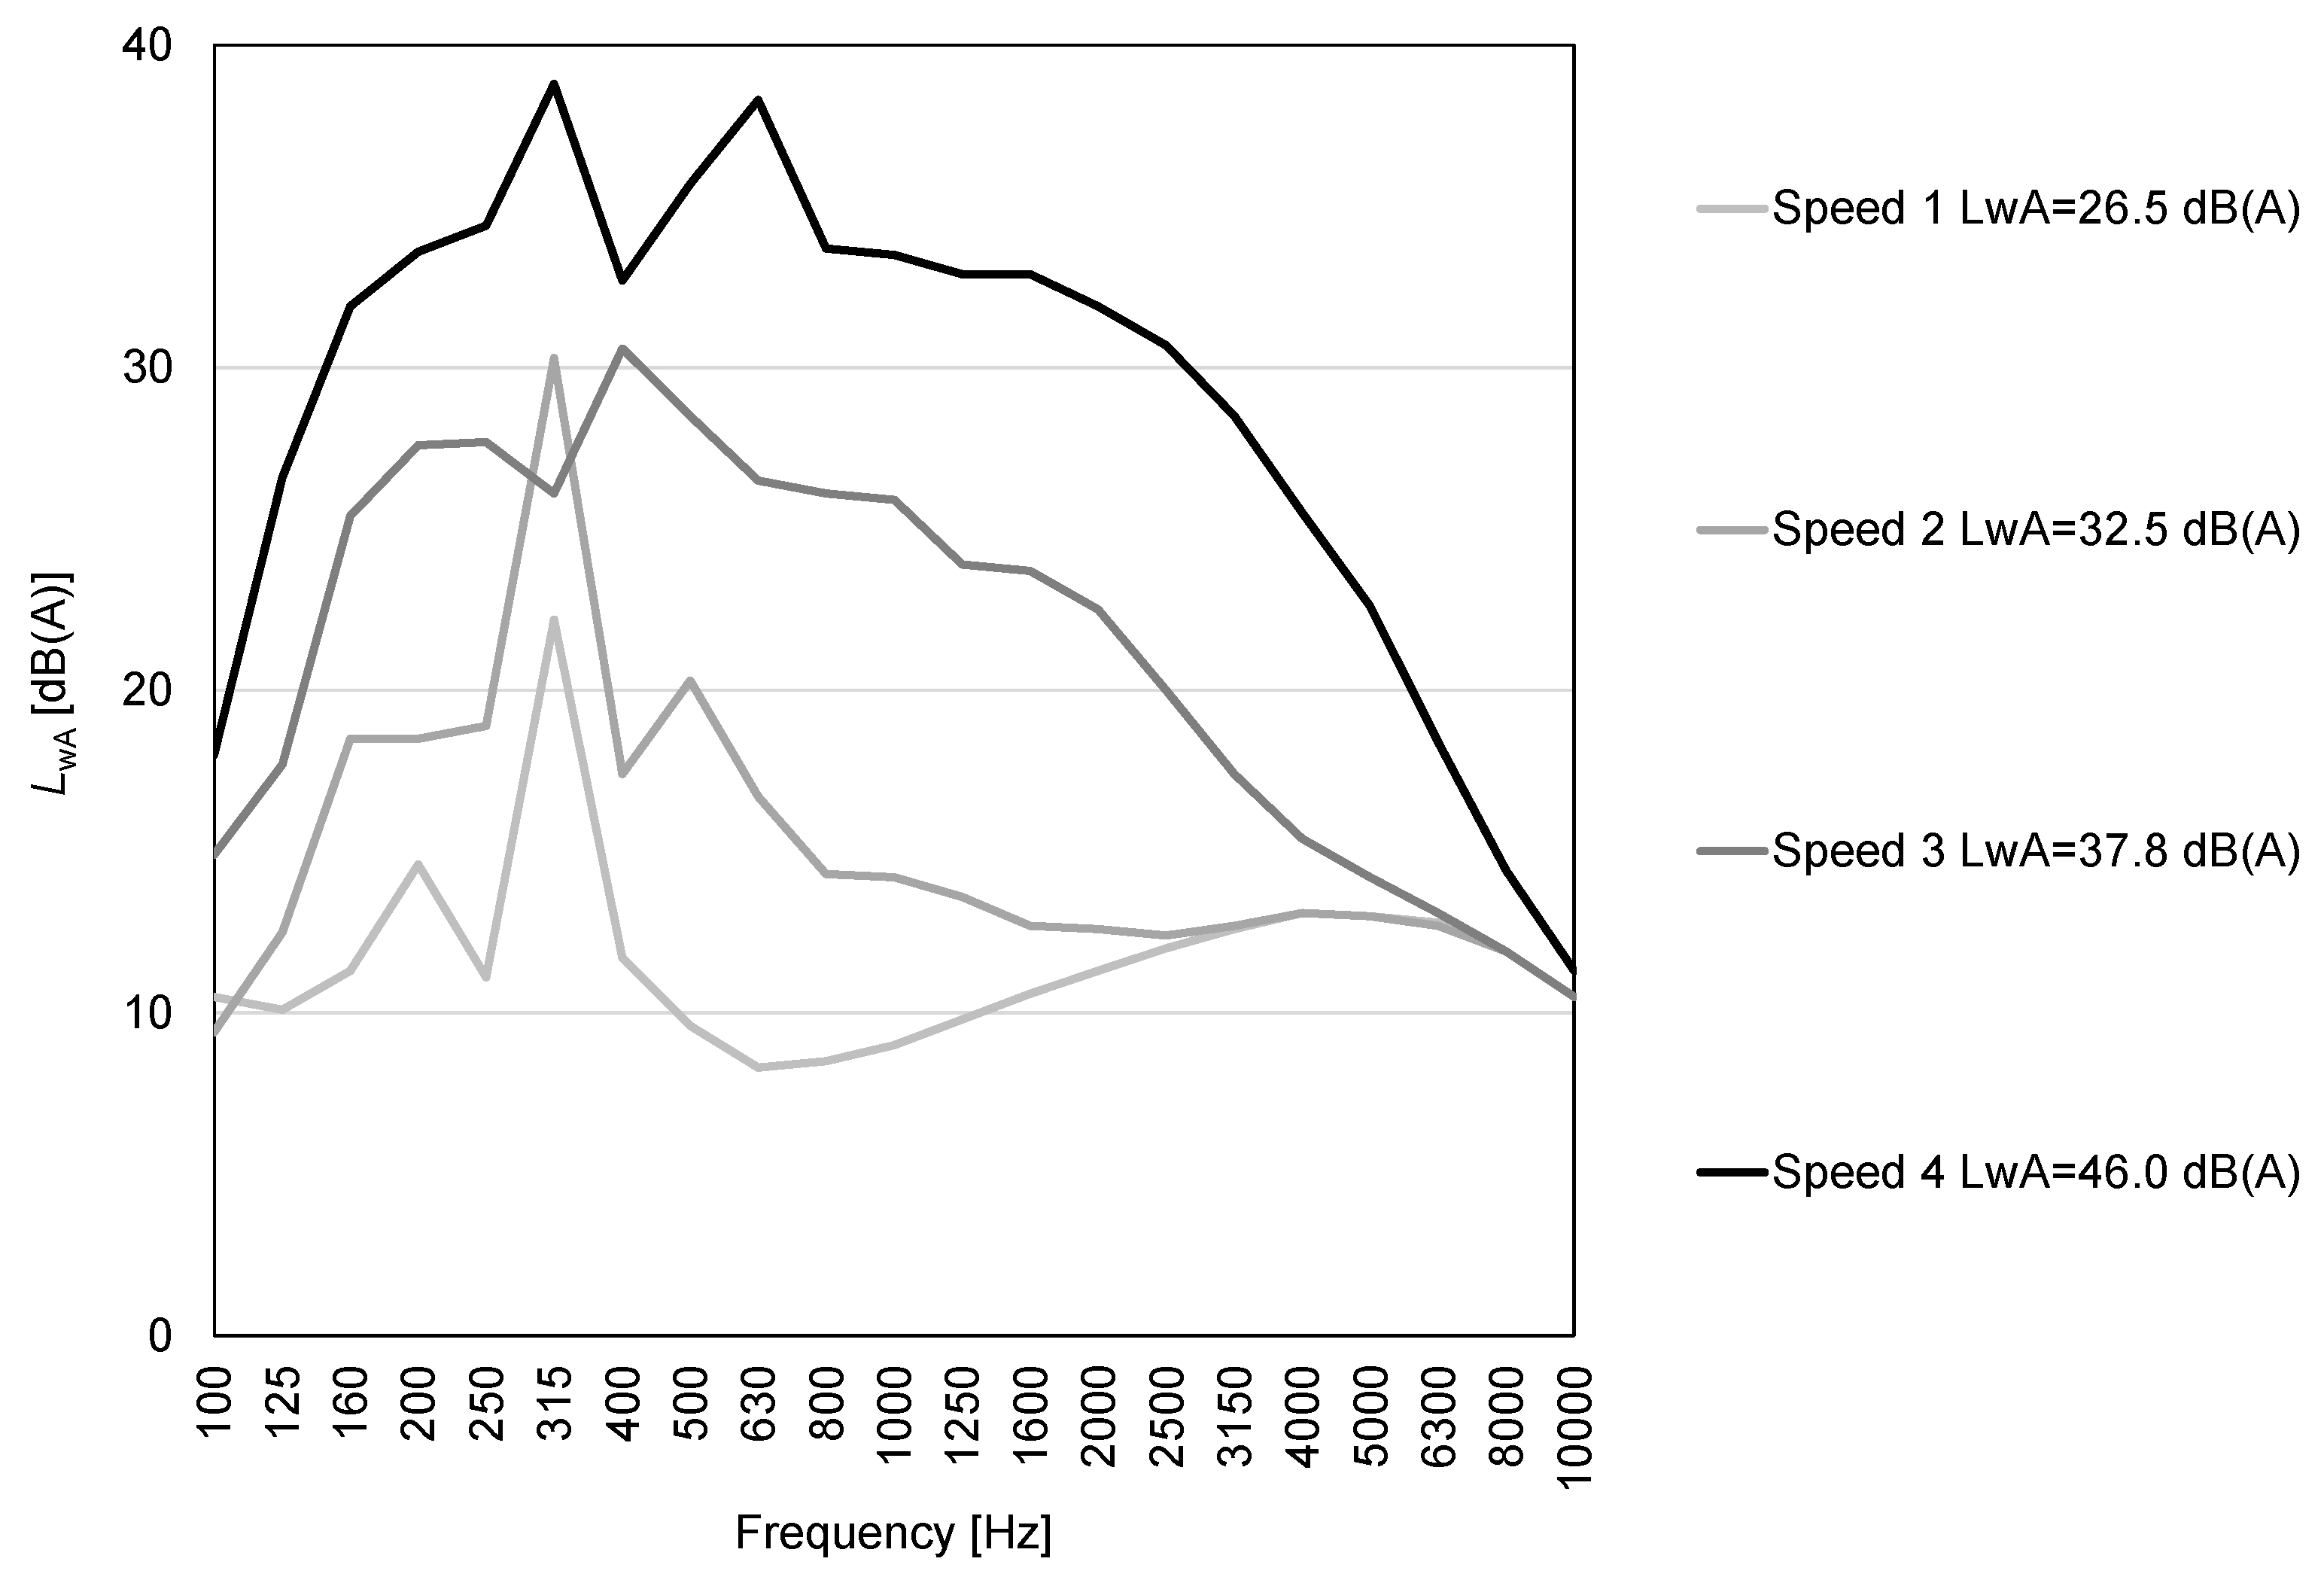
The A-weighted sound power levels in a semi-anechoic chamber in accordance with the ISO 3744 standard were measured (Figure 9 and Figure 10).
First of all, the rooms surface absorption coefficients, of the three rooms, have been chosen in such a way as to obtain a mean reverberation time T20, from 125 Hz to 4000 Hz in 1/1 octave bands, within ±20% in respect to the measured values. Then, the equivalent sound pressure levels LAeq in the rooms, for the three configurations, were simulated in such a way as to obtain a value within ±1 dB(A) with respect to that measured.
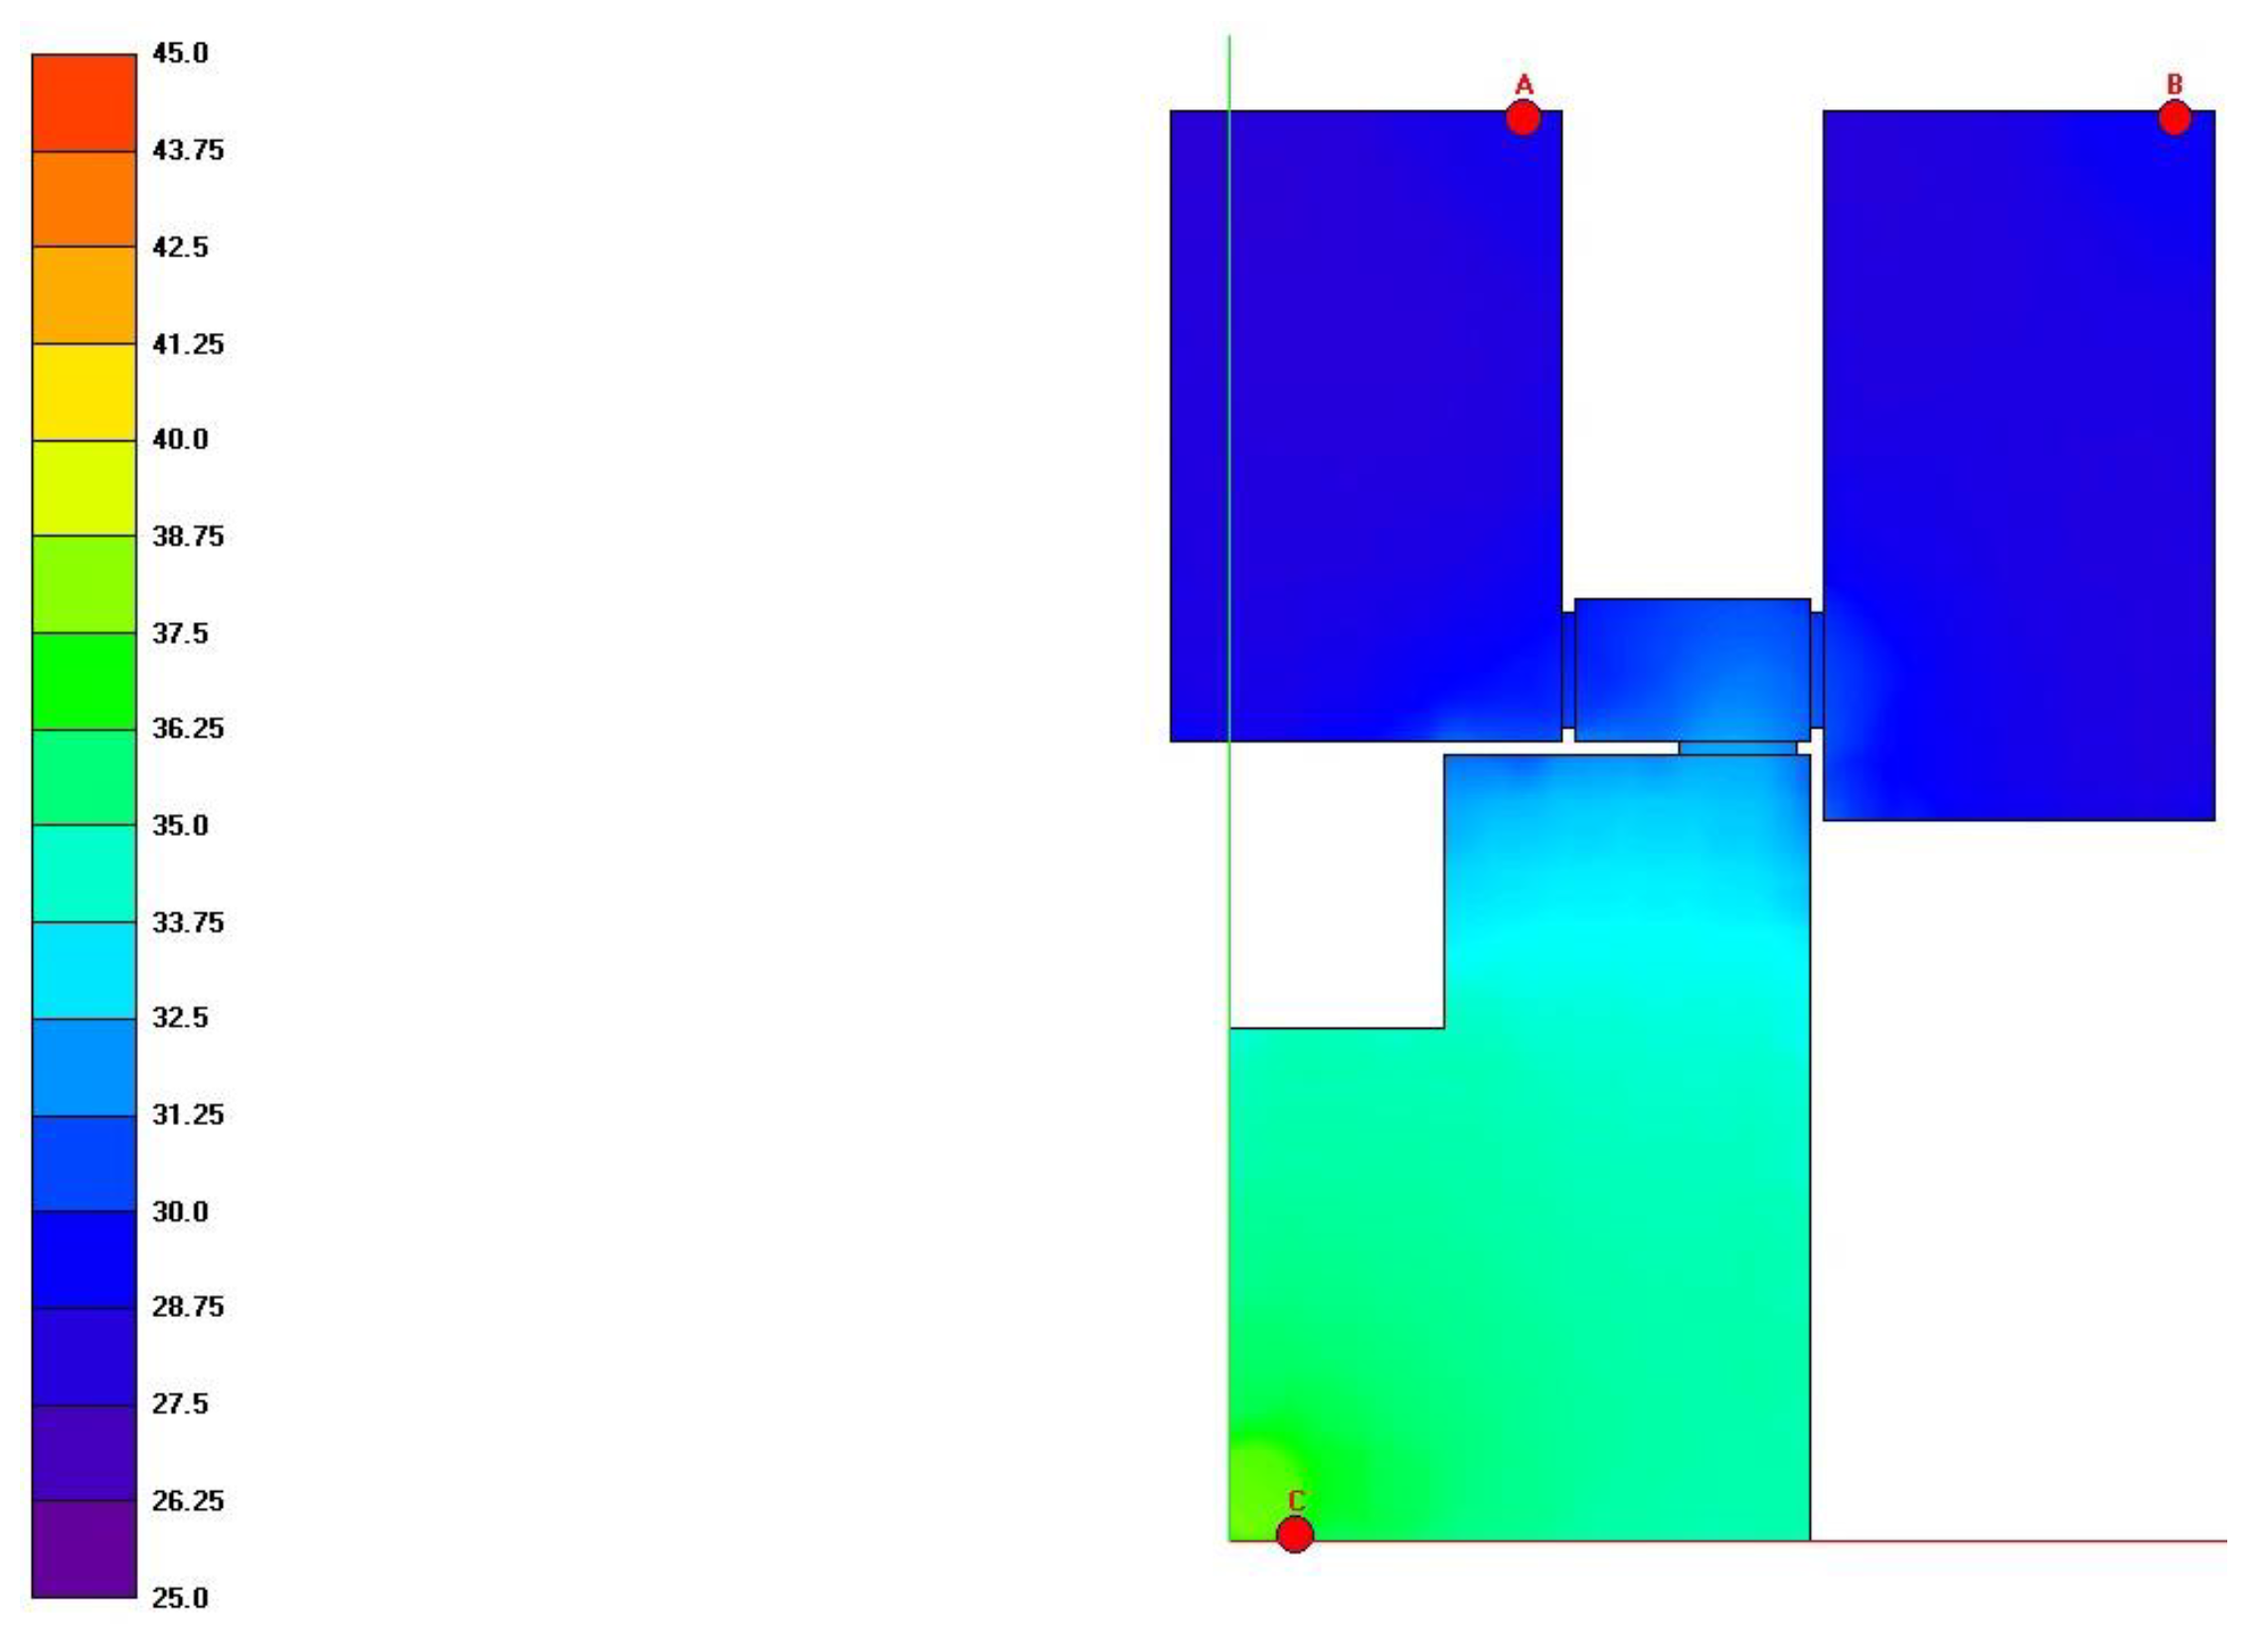
The sound pressure levels of the calibrated model of the configuration 1 are shown in Figure 11.
The calibration of the model was fundamental in order to correctly set the calculation parameters of the software. The number of rays was considerably increased, in comparison to the default software set up, in order to verify an adequate passage of pyramid rays through the open doors. For example, for single residential room analysis, it is sufficient to use a number of 2048 rays, while with coupled rooms connected by small openings (doors), 32,768 rays was necessary.
3.3. Sound Pressure Level Simulation
For the simulation of the sound pressure level, wall surface absorption coefficients were set in such a way as to have a mean reverberation time of 0.5 ± 0.2 s. Since noise that passes through the walls is negligible compared to that which passes through the open doors, an infinite sound reduction index of the wall was assumed.
The reverberation times, T20, assumed for the three type of apartment, considered furnished, are shown in Table 6, Table 7 and Table 8.
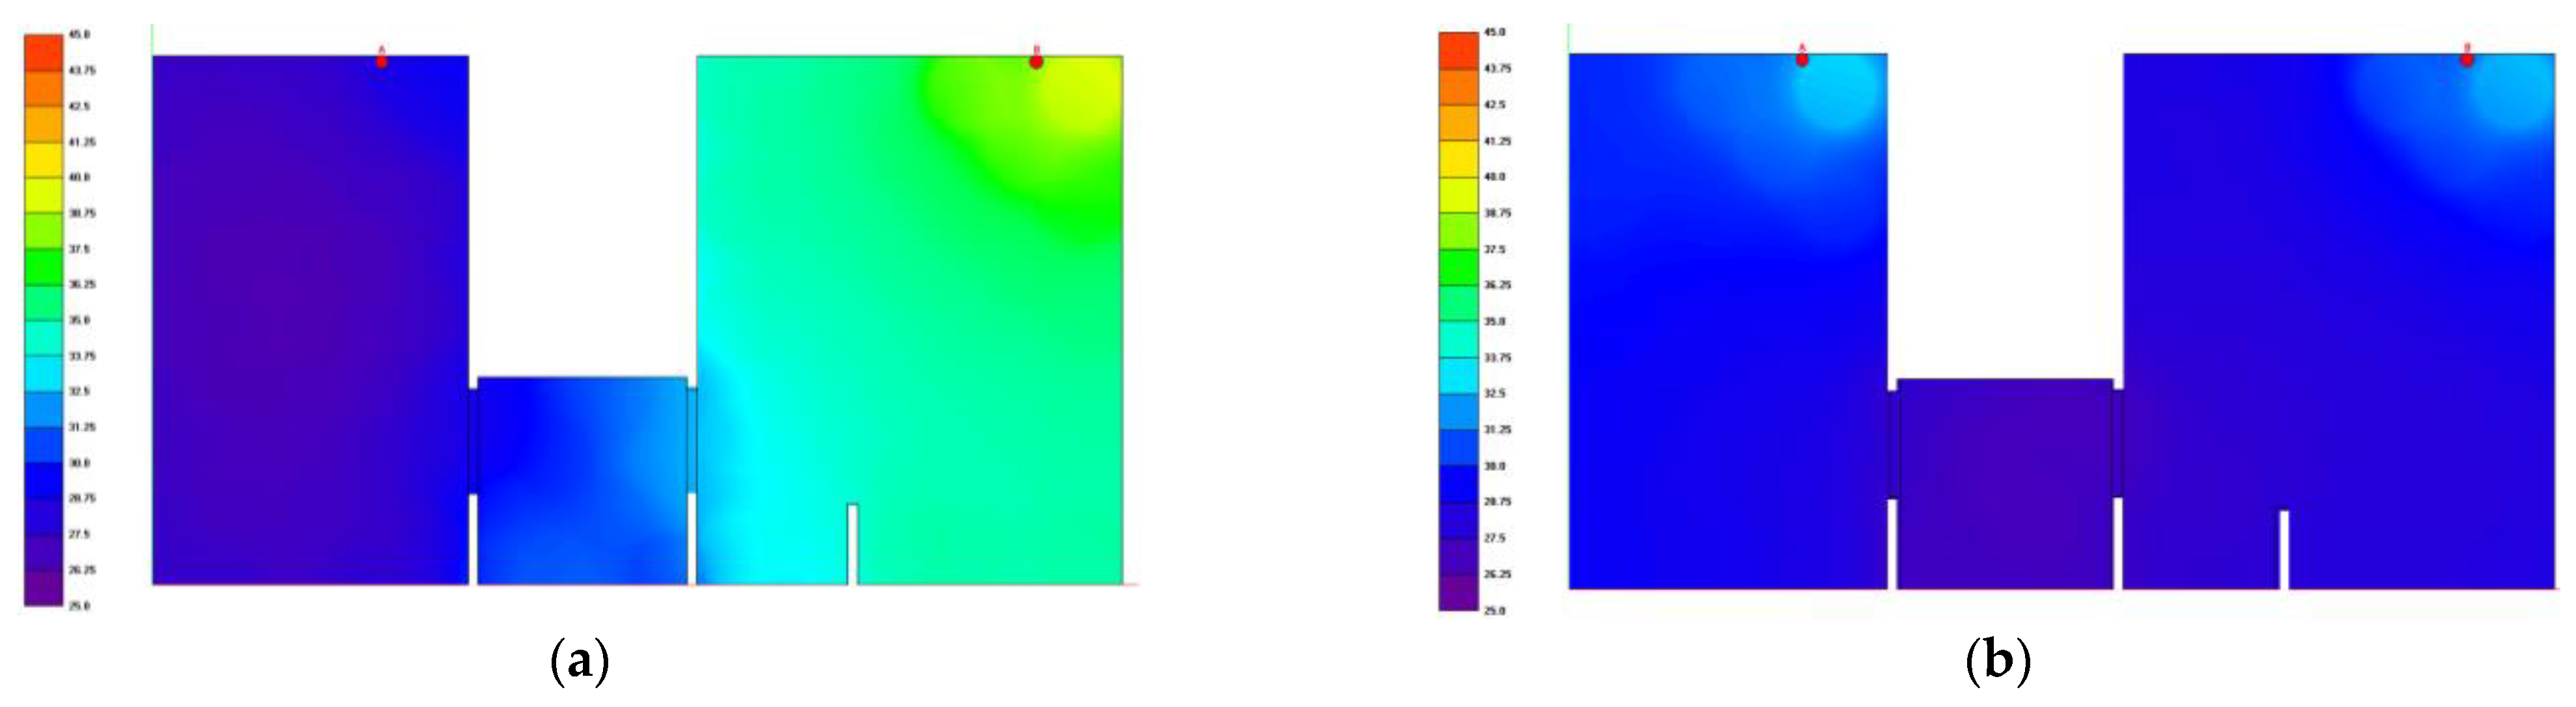
The software model and the sound pressure level maps for the two-room apartment are reported in Figure 12, Figure 13 and Figure 14.
The results of the simulations are shown in Table 9. The factory speed setting that would allow one to obtain the air exchange of 0.5 1/h with the only machine present inside the analyzed room switched on and the relative LAeq are indicated with blue font.
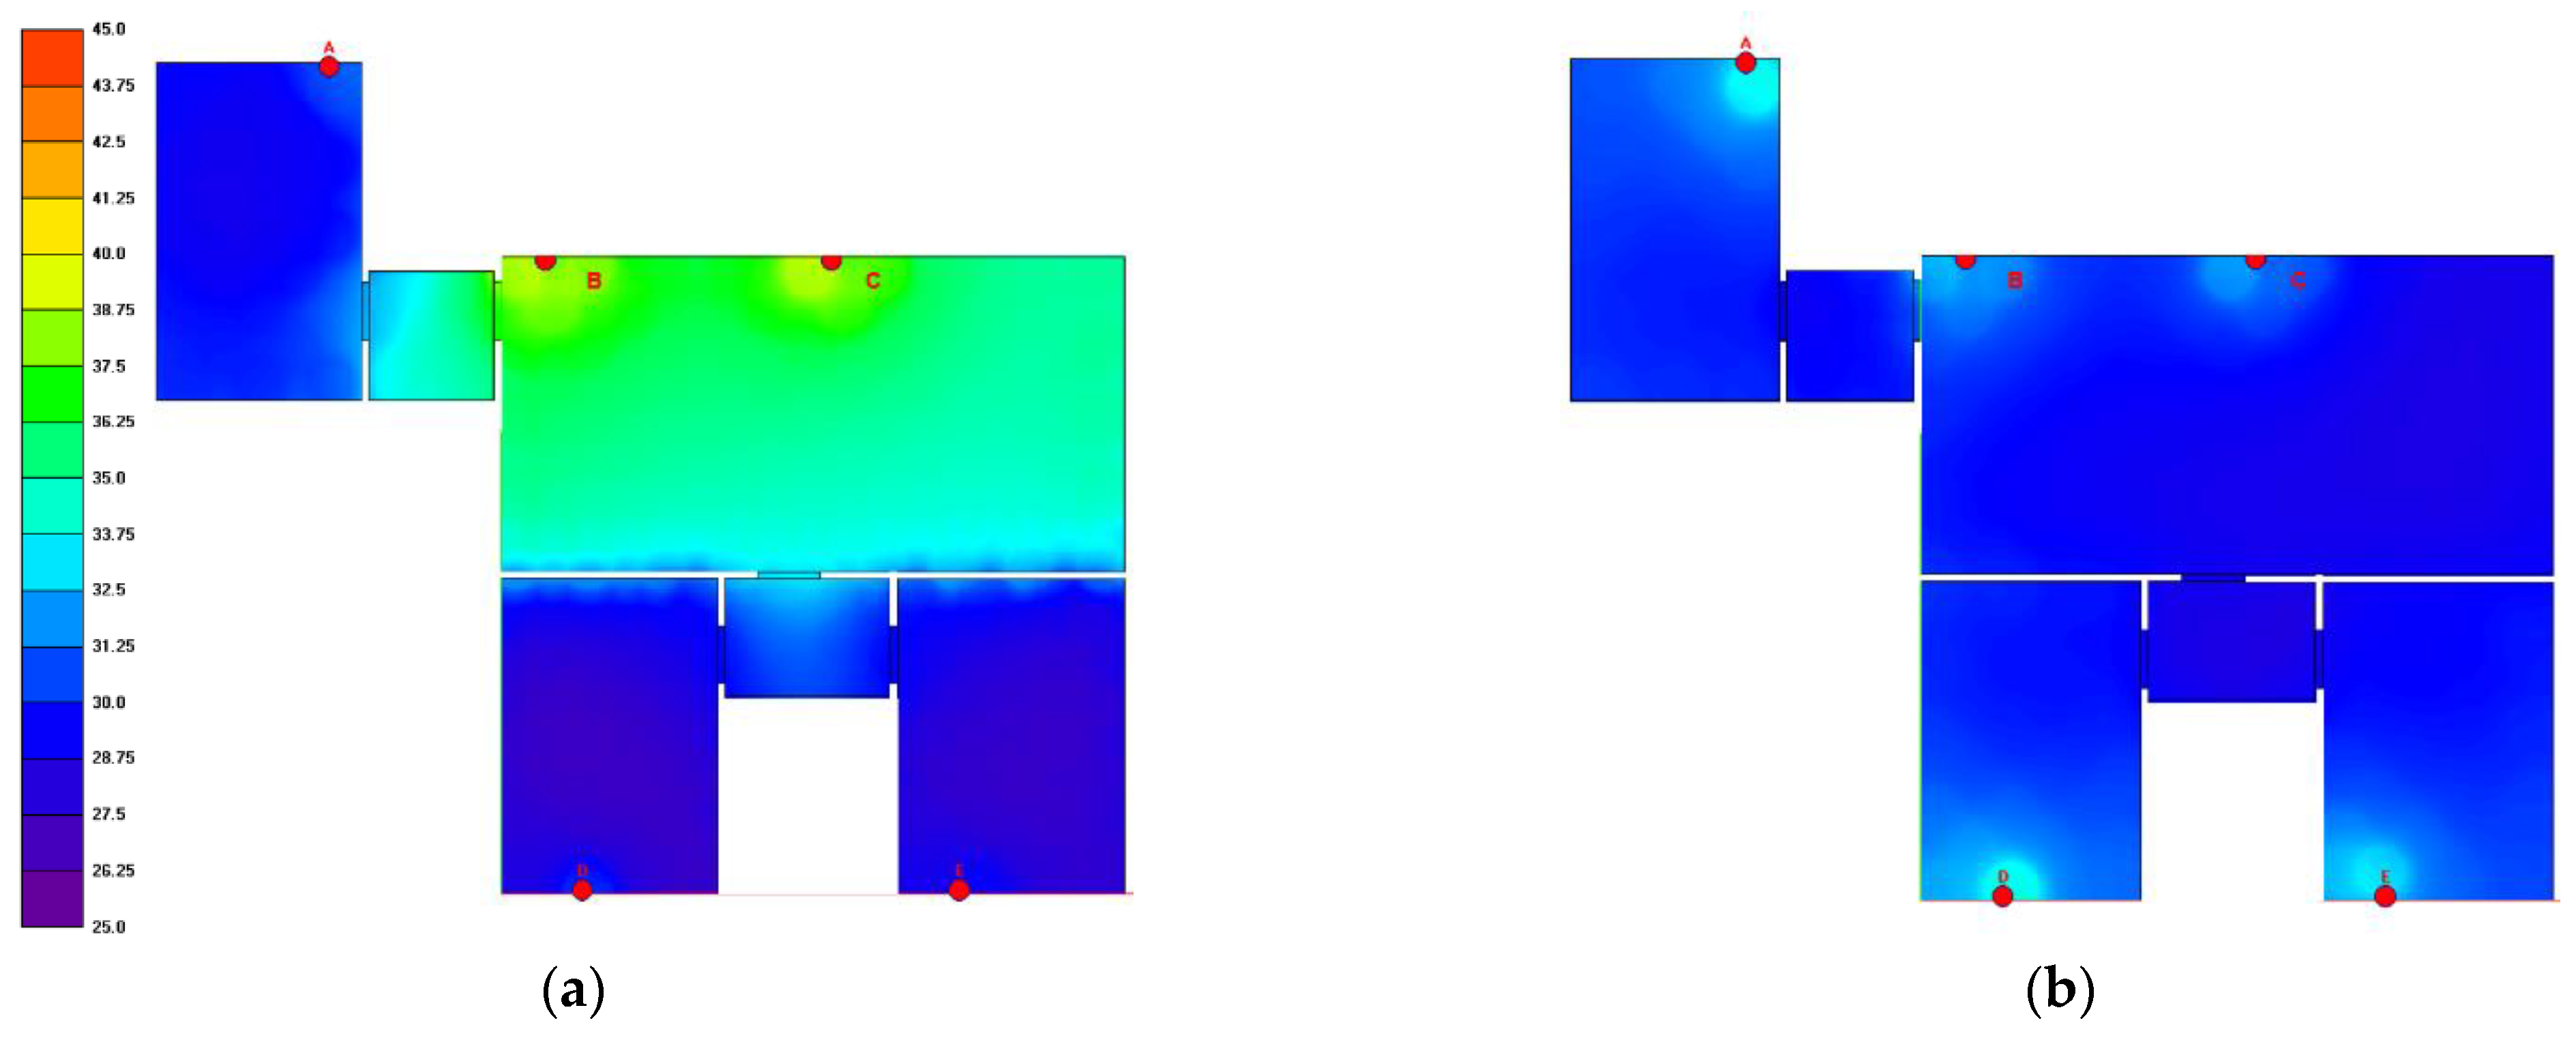
It can be noted that there is an increase of 2.7 dB(A) in the bedrooms in the “night” configuration and 1.0 dB(A) in the living room/kitchen in the “day” configuration.
By operating only one CMV in the bedroom with factory speed setting 2, that allows 0.5 1/h in the night configuration, a sound pressure level of 3.2 dB(A) higher than would be obtained in the CMV simultaneous operation.
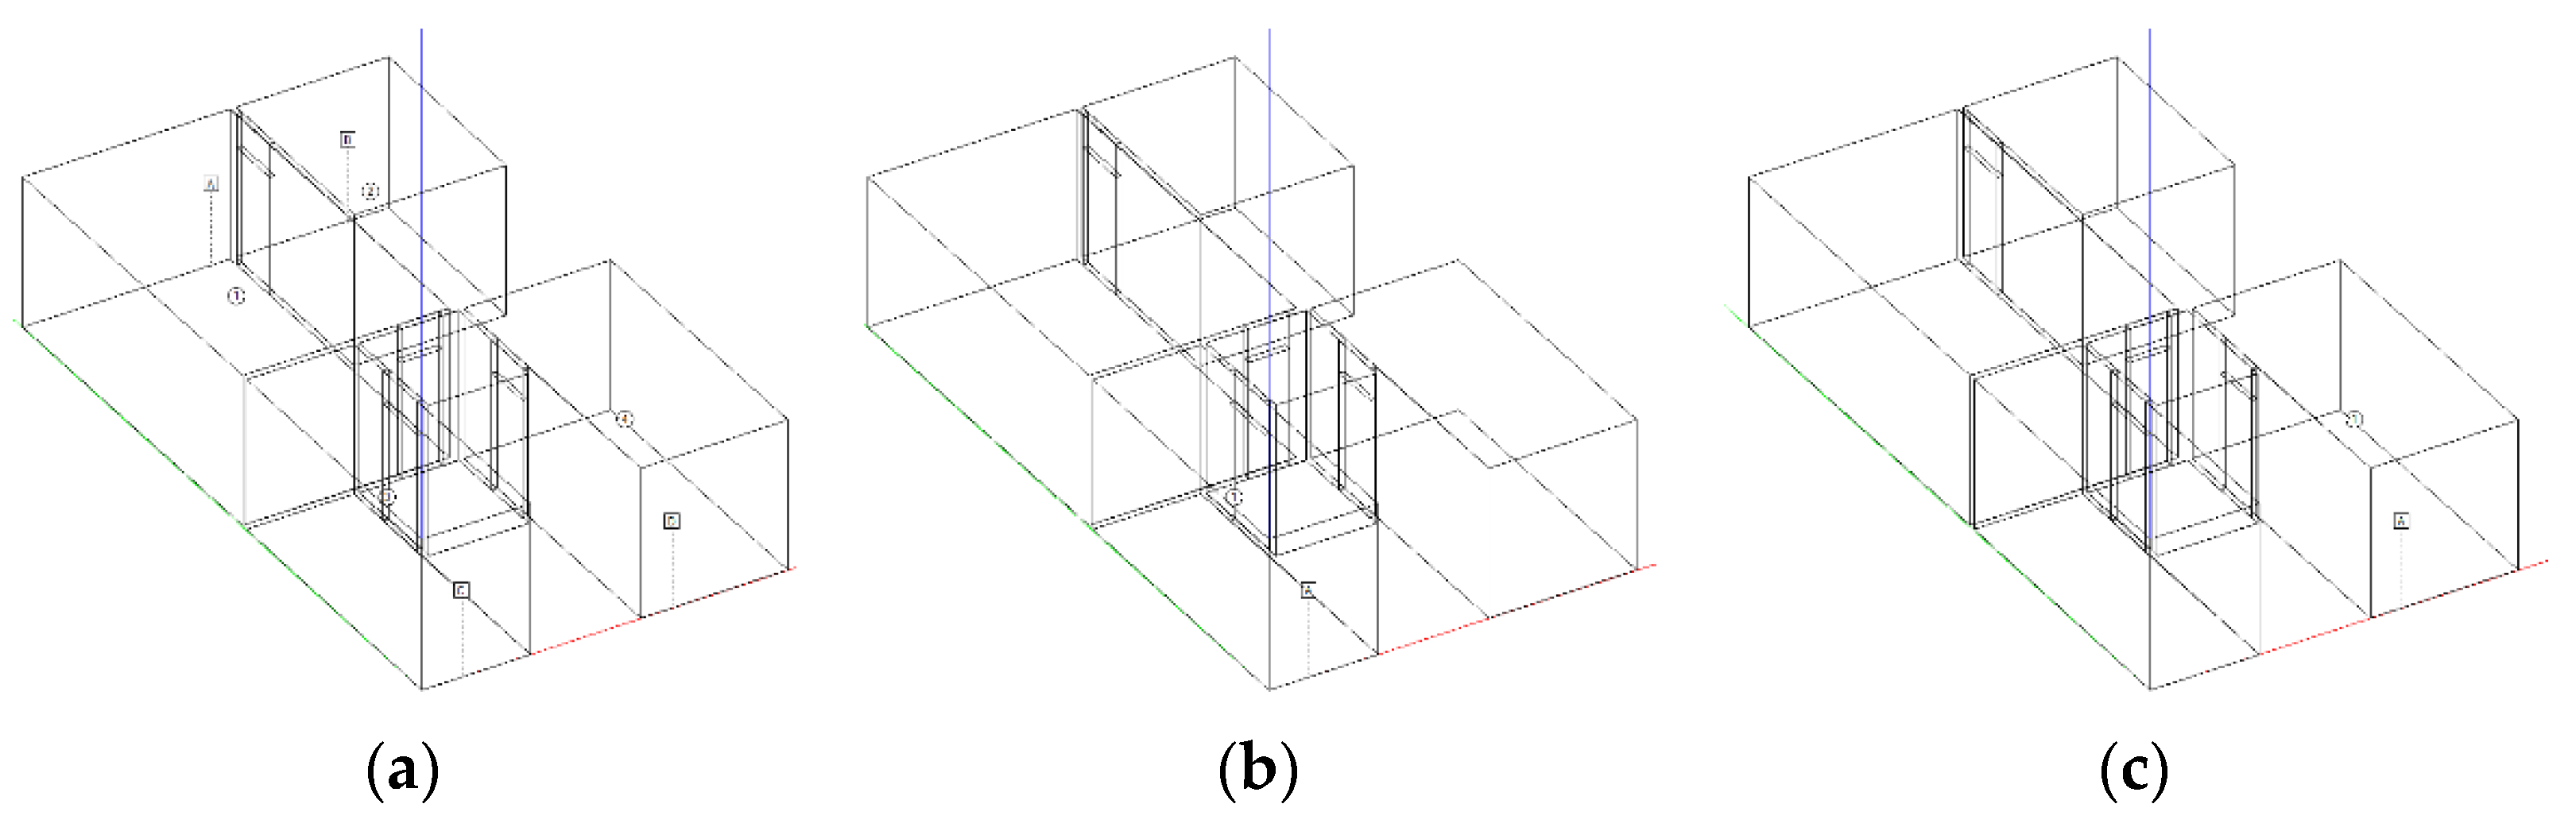
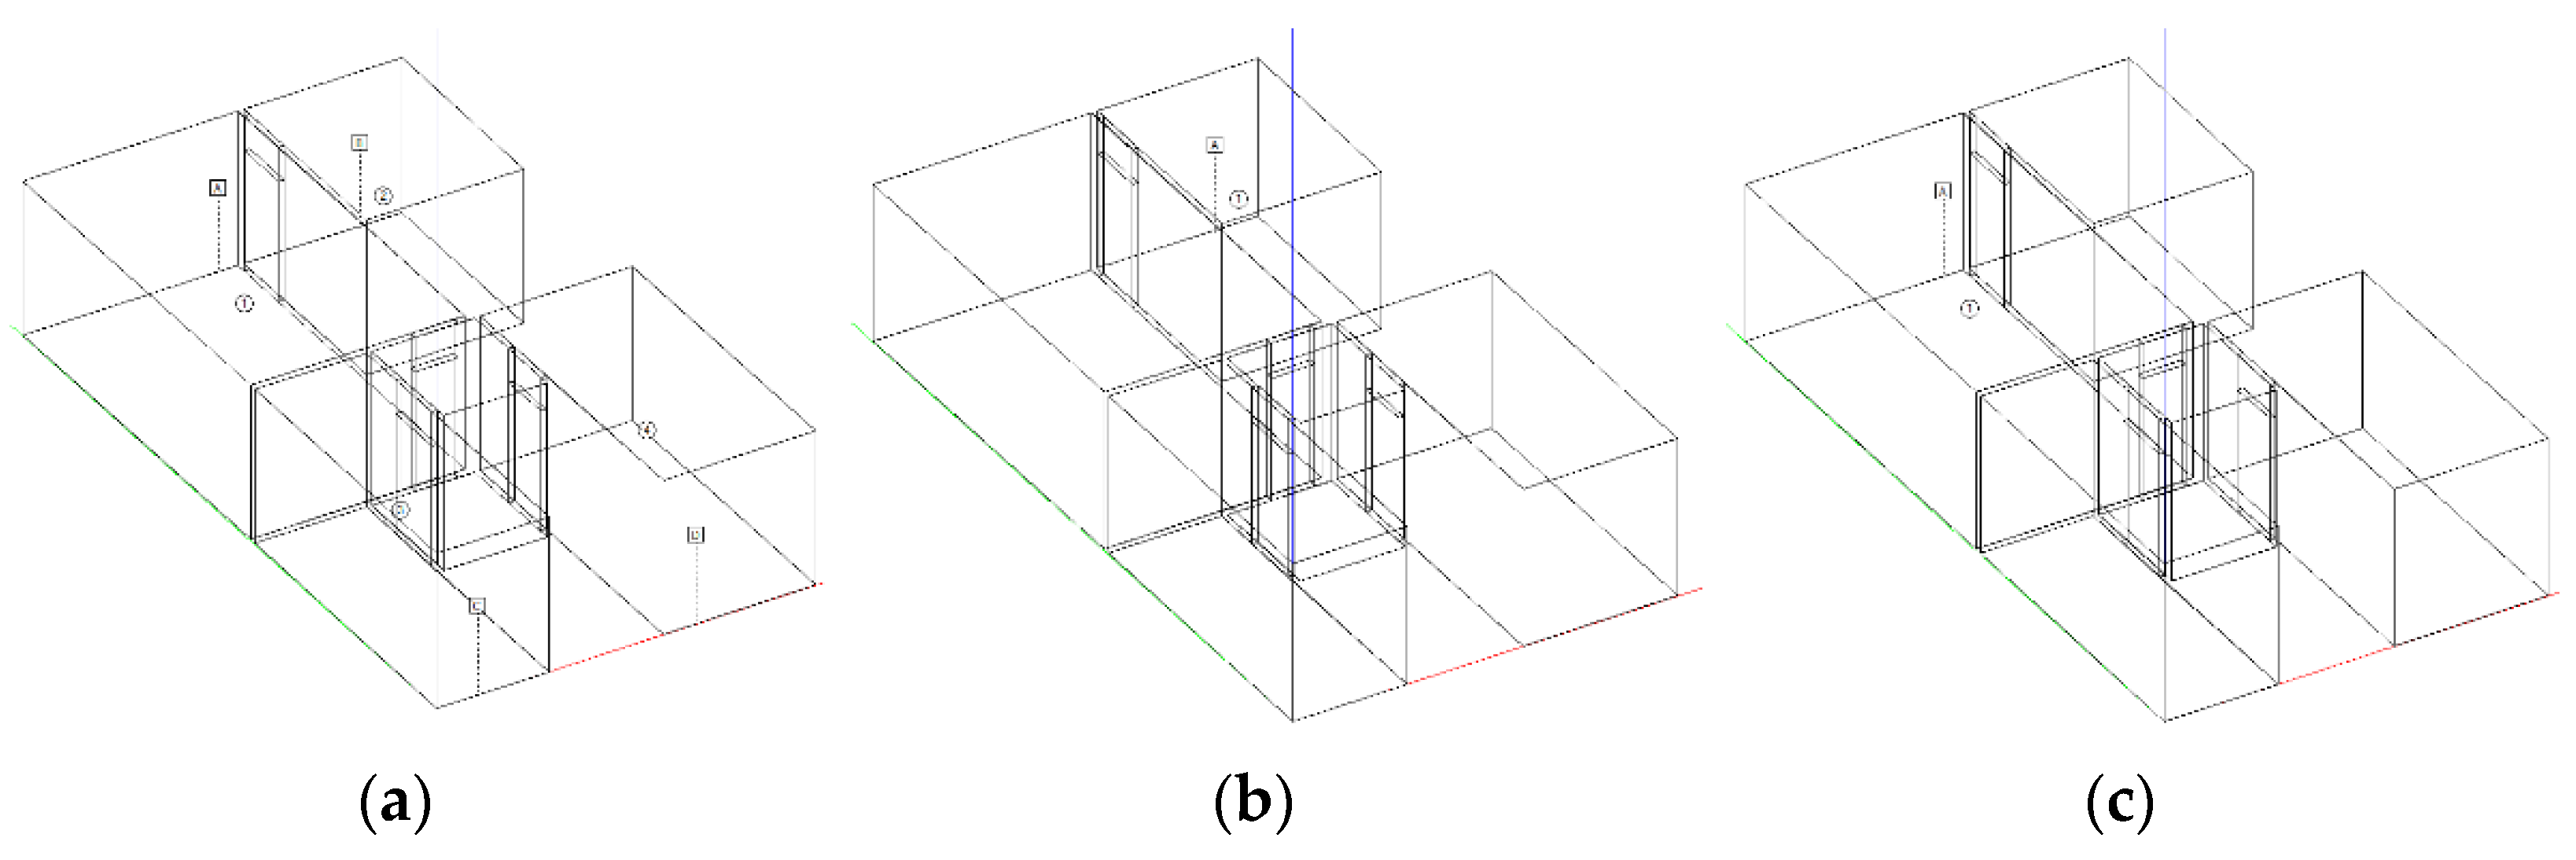
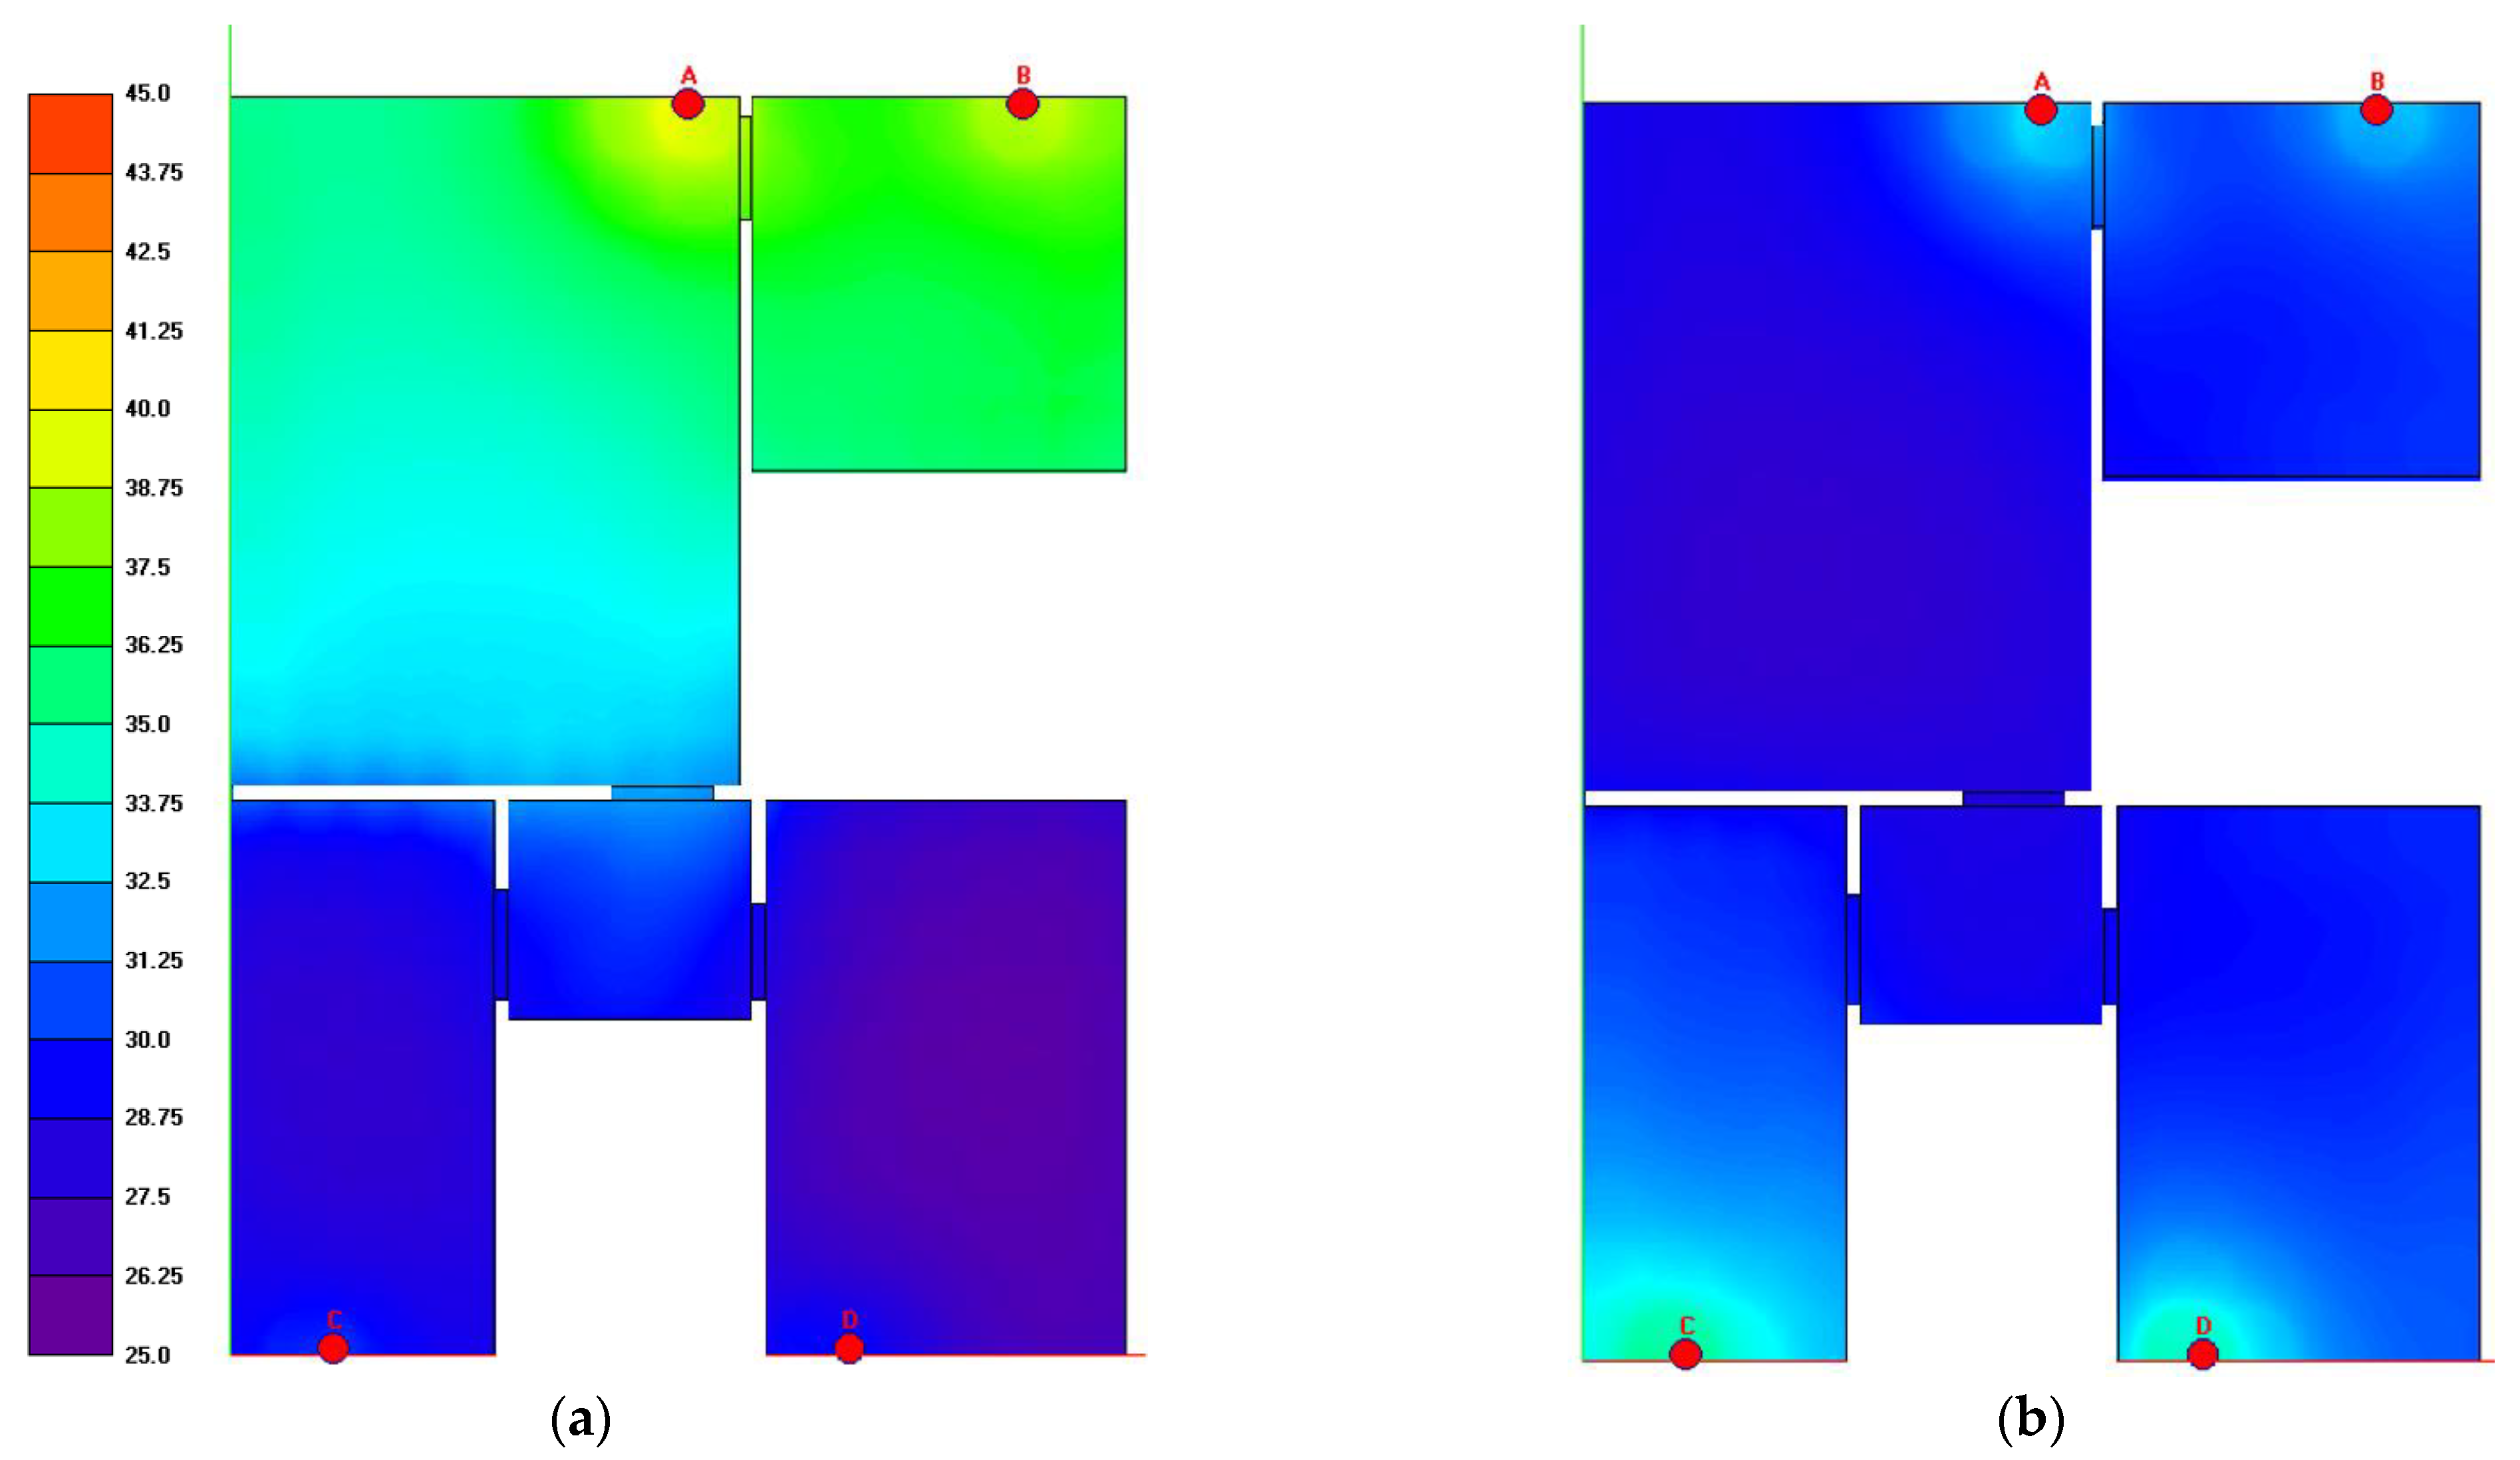
The software model and the sound pressure level maps for the three-room apartment are reported in Figure 15, Figure 16 and Figure 17.
The results of the simulations are shown in Table 10.
It can be noted that there is an increase of the A-weighted sound pressure level of 2.4–2.7 dB(A) in the bedrooms in the “night” configuration and 2.5–2.6 dB(A) in the living room–kitchen in the “day” configuration.
By operating only one CMV in the 12.08 m2 bedroom with factory speed setting 2, that allows 0.5 1/h in the night configuration, a sound pressure level of 3.7 dB(A) higher than would be obtained in the CMV simultaneous operation.
By operating only one CMV in the living room with factory speed setting 3, that allows 0.5 1/h in the day configuration, a sound pressure level of 1.0 dB(A) higher than would be obtained in the CMV simultaneous operation.
The software model and the sound pressure level maps for the four-room apartment are reported in Figure 18, Figure 19 and Figure 20.
The results of the simulations are shown in Table 11.
It can be noticed that there is an increase of the A-weighted sound pressure level of 2.4–4.9 dB(A) in the bedrooms in the “night” configuration and 1.1 dB(A) in the living room-kitchen in the “day” configuration.
By operating only one CMV in the bedrooms with factory speed setting 2, that allows 0.5 1/h in the night configuration, a sound pressure level of 1.3–3.3 dB(A) higher than would be obtained in the CMV simultaneous operation.
By operating only one CMV in the living room-kitchen with factory speed setting 3, that allows 0.5 1/h in the day configuration, a sound pressure level of 2.3 dB(A) higher than would be obtained in the CMV simultaneous operation.
4. Conclusions
This work studies the optimization of Controlled Mechanical Ventilation systems for indoor air quality and acoustic comfort. In order to ensure an adequate air exchange and to maintain low sound pressure levels, different fan speeds have been assumed for night and day operations.
First of all, a 3D model was calibrated using measurement of sound pressure level according to ISO 16032 standard and sound power levels of the CMV according to the ISO 3744 standard.
Acoustic simulations with RAMSETE software were carried out to determine the sound pressure level present in the rooms of three types of apartments (two/three/four rooms). Then, a calculation model based on the raytracing technique was used, which permits one to simulate and study the acoustic propagation of waves in space, considering the diffractive, insulating and absorbing effects of interposed barriers to sources and receivers.
The main findings can be resumed as follows:
- −
- the acoustic simulation carried out using an adequately calibrated 3D model has proved to be a valid support for the study of noise in rooms connected by doors and corridors. However, the number of rays has been considerably increased in order to ensure a passage of noise from one room to another as similar as possible to the real case;
- −
- with simultaneous operation and optimized regulation of CMV speeds inside an apartment, a considerable comfort improvement between 1.3 dB(A) and 3.7 dB(A) was obtained in the bedrooms in the “night” configuration, while an improvement between 1.0 dB(A) and 2.3 dB(A) was obtained in the living room–kitchen in the “day” configuration;
- −
- the optimization of the values of LAeq,nT permitted us to obtain class I for living rooms and class I or II for bedrooms according to the EN 16798-1 standard.
Funding
This research received no external funding.
Institutional Review Board Statement
Not applicable.
Informed Consent Statement
Not applicable.
Data Availability Statement
The data presented in this study are available on request from the corresponding author. The data are not publicly available due to privacy reasons.
Acknowledgments
Thanks to Alpac S.r.l. for support on technical documentation.
Conflicts of Interest
The author declares no conflict of interest.
References
- Vinh van Tran, V.; Park, D.; Lee, Y.C. Indoor air pollution, related human diseases, and recent trends in the control and improvement of indoor air quality. Int. J. Environ. Res. Public Health 2020, 17, 2927. [Google Scholar] [CrossRef] [PubMed] [Green Version]
- Caniato, M.; Cozzarini, L.; Schmid, C.; Gasparella, A. Acoustic and thermal characterization of a novel sustainable material incorporating recycled microplastic waste. Sustain. Mater. Technol. 2021, 28, e00274. [Google Scholar] [CrossRef]
- Caniato, M.; Kyaw Oo D’Amore, G.; Kaspar, J.; Gasparella, A. Sound absorption performance of sustainable foam materials: Application of analytical and numerical tools for the optimization of forecasting models. Appl. Acoust. 2020, 161, 107166. [Google Scholar] [CrossRef]
- Wei, W.; Ramlho, O.; Mandin, C. Indoor air quality requirements in green building certifications. Build. Environ. 2015, 92, 10–19. [Google Scholar] [CrossRef]
- Chen, Y.; Raphael, B.; Sekhar, S.C. Experimental and simulated energy performance of a personalized ventilation system with individual airflow control in a hot and humid climate. Build. Environ. 2016, 96, 283–292. [Google Scholar] [CrossRef]
- Tronchin, L.; Fabbri, K. Energy performance building evaluation in Mediterranean countries: Comparison between software simulations and operating rating simulation. Energy Build. 2008, 40, 1176–1187. [Google Scholar] [CrossRef]
- Tronchin, L.; Tommasino, M.C.; Fabbri, K. On the cost-optimal levels of energy-performance requirements for buildings: A case study with economic evaluation in Italy. Int. J. Sustain. Energy Plan. Manag. 2014, 3, 49–62. [Google Scholar]
- Tronchin, L.; Fabbri, K.; Bertolli, C. Controlled Mechanical Ventilation in Buildings: A Comparison between Energy Use and Primary Energy among Twenty Different Devices. Energies 2018, 11, 2123. [Google Scholar] [CrossRef] [Green Version]
- Fabbri, K.; Tronchin, L. Indoor Environmental Quality in Low Energ Buildings. Energy Procedia 2015, 78, 2778–2783. [Google Scholar] [CrossRef] [Green Version]
- Sekhar, S.C.; Goh, S.E. Thermal comfort and IAQ characteristics of naturally/mechanically ventilated and air-conditioned bedrooms in a hot and humid climate. Build. Environ. 2011, 46, 1905–1916. [Google Scholar] [CrossRef]
- Perone, C.; Catalano, P.; Giametta, F.; La Fianza, G.; Brunetti, L.; Bianchi, B. Controlled Mechanical Ventilation to Reduce Primary Energy Consumption in Air Conditioning of Greenhouses. In Innovative Biosystems Engineering for Sustainable Agriculture, Forestry and Food Production; MID-TERM AIIA 2019; Lecture Notes in Civil Engineering; Springer: Cham, Switzerland, 2020; Volume 67, p. 399. [Google Scholar]
- Evola, G.; Gagliano, A.; Marletta, L.; Nocera, F. Controlled mechanical ventilation systems in residential buildings: Primary energy balances and financial issues. J. Build. Eng. 2017, 11, 96–1071. [Google Scholar] [CrossRef]
- EN 12831:2003. Heating Systems in Buildings—Method for Calculation of the Design Heat Load; European Standardization Organizations: Brussels, Belgium, 2019. [Google Scholar]
- Caniato, M.; Bettarello, F.; Sbaizero, O.; Schmid, C. Recycled materials for noise reduction in floating floors. In Proceedings of the 22nd International Congress on Sound and Vibration, ICSV 2015, Florence, Italy, 12–16 July 2015. Code 121474. [Google Scholar]
- Caniato, M.; Favretto, S.; Bettarello, F.; Schmid, C. Acoustic Characterization of Resonance Wood. Acta Acust. United Acust. 2018, 104, 1030–1040. [Google Scholar] [CrossRef]
- Caniato, M.; Marzi, A.; Gasparella, A. How much COVID-19 face protections influence speech intelligibility in classrooms? Appl. Acoust. 2021, 178, 108051. [Google Scholar] [CrossRef]
- Bettarello, F.; Caniato, M.; Scavuzzo, G.; Gasparella, A. Indoor Acoustic Requirements for Autism-Friendly Spaces. Appl. Sci. 2021, 11, 3942. [Google Scholar] [CrossRef]
- Caniato, M.; Schmid, C.; Gasparella, A. A comprehensive analysis of time influence on floating floors: Effects on acoustic performance and occupants’ comfort. Appl. Acoust. 2020, 166, 107339. [Google Scholar] [CrossRef]
- Caniato, M. Sound insulation of complex façades: A complete study combining different numerical approaches. Appl. Acoust. 2020, 169, 107484. [Google Scholar] [CrossRef]
- Granzotto, N.; Piana, E.A. Evaluation method for façade acoustic insulation for a corner room: Discussion on the results obtained as a function of the source position. Appl. Sci. 2020, 10, 7434. [Google Scholar] [CrossRef]
- Ruggeri, P.; Peron, F.; Granzotto, N.; Bonfiglio, P. A combined experimental and analytical approach for the simulation of the sound transmission loss of multilayer glazing systems. Build. Acoust. 2015, 22, 177–192. [Google Scholar] [CrossRef]
- Caniato, M.; Bettarello, F.; Bonfiglio, P.; Gasparella, A. Extensive Investigation of Multiphysics Approaches in Simulation of Complex Periodic Structures. Appl. Acoust. 2020, 166, 107356. [Google Scholar] [CrossRef]
- Tronchin, L. Variability of room acoustic parameters with thermo-hygrometric conditions. Appl. Acoust. 2021, 177, 107933. [Google Scholar] [CrossRef]
- ISO 3744:2010. Acoustics—Determination of Sound Power Levels and Sound Energy Levels of Noise Sources Using Sound Pressure. Engineering Methods for an Essentially Free Field over a Reflecting Plane; International Organization for Standardization: Geneva, Switzerland, 2010. [Google Scholar]
- EN 16798-1:2019. Energy Performance of Buildings—Ventilation for Buildings—Part 1: Indoor Environmental Input Parameters for Design and Assessment of Energy Performance of Buildings Addressing Indoor Air Quality, Thermal Environment, Lighting and Acoustics—Module M1-6; European Standardization Organizations: Brussels, Belgium, 2019. [Google Scholar]
- ISO 16032:2004. Acoustics—Measurement of Sound Pressure Level from Service Equipment in Buildings—Engineering Method; International Organization for Standardization: Geneva, Switzerland, 2004. [Google Scholar]
- ISO 3382-2:2008. Acoustics—Measurement of Room Acoustic Parameters Reverberation Time in Ordinary Rooms; International Organization for Standardization: Geneva, Switzerland, 2008. [Google Scholar]
Figure 1.
Sound pressure level measurements. Apartment plan.

Figure 2.
Sound pressure level measurements: (a) bedroom 1 with CM CMV, (b) living room with SM CMV and (c) bedroom 2 with CM CMV.
Figure 2.
Sound pressure level measurements: (a) bedroom 1 with CM CMV, (b) living room with SM CMV and (c) bedroom 2 with CM CMV.

Figure 3.
Two-room apartment plan.

Figure 4.
Three-room apartment plan.

Figure 5.
Four-room apartment plan.

Figure 6.
Reverberation time of bedroom 1, bedroom 2 and living room.

Figure 7.
Sound pressure levels corrected with the background noise and the reverberation time, LAeq,nT.
Figure 7.
Sound pressure levels corrected with the background noise and the reverberation time, LAeq,nT.

Figure 8.
RAMSETE 3D model.

Figure 9.
SM CMV A-weighted sound power levels LwA.

Figure 10.
CM CMV A-weighted sound power levels LwA.

Figure 11.
A-weighted sound pressure level of the calibrated model (configuration 1).

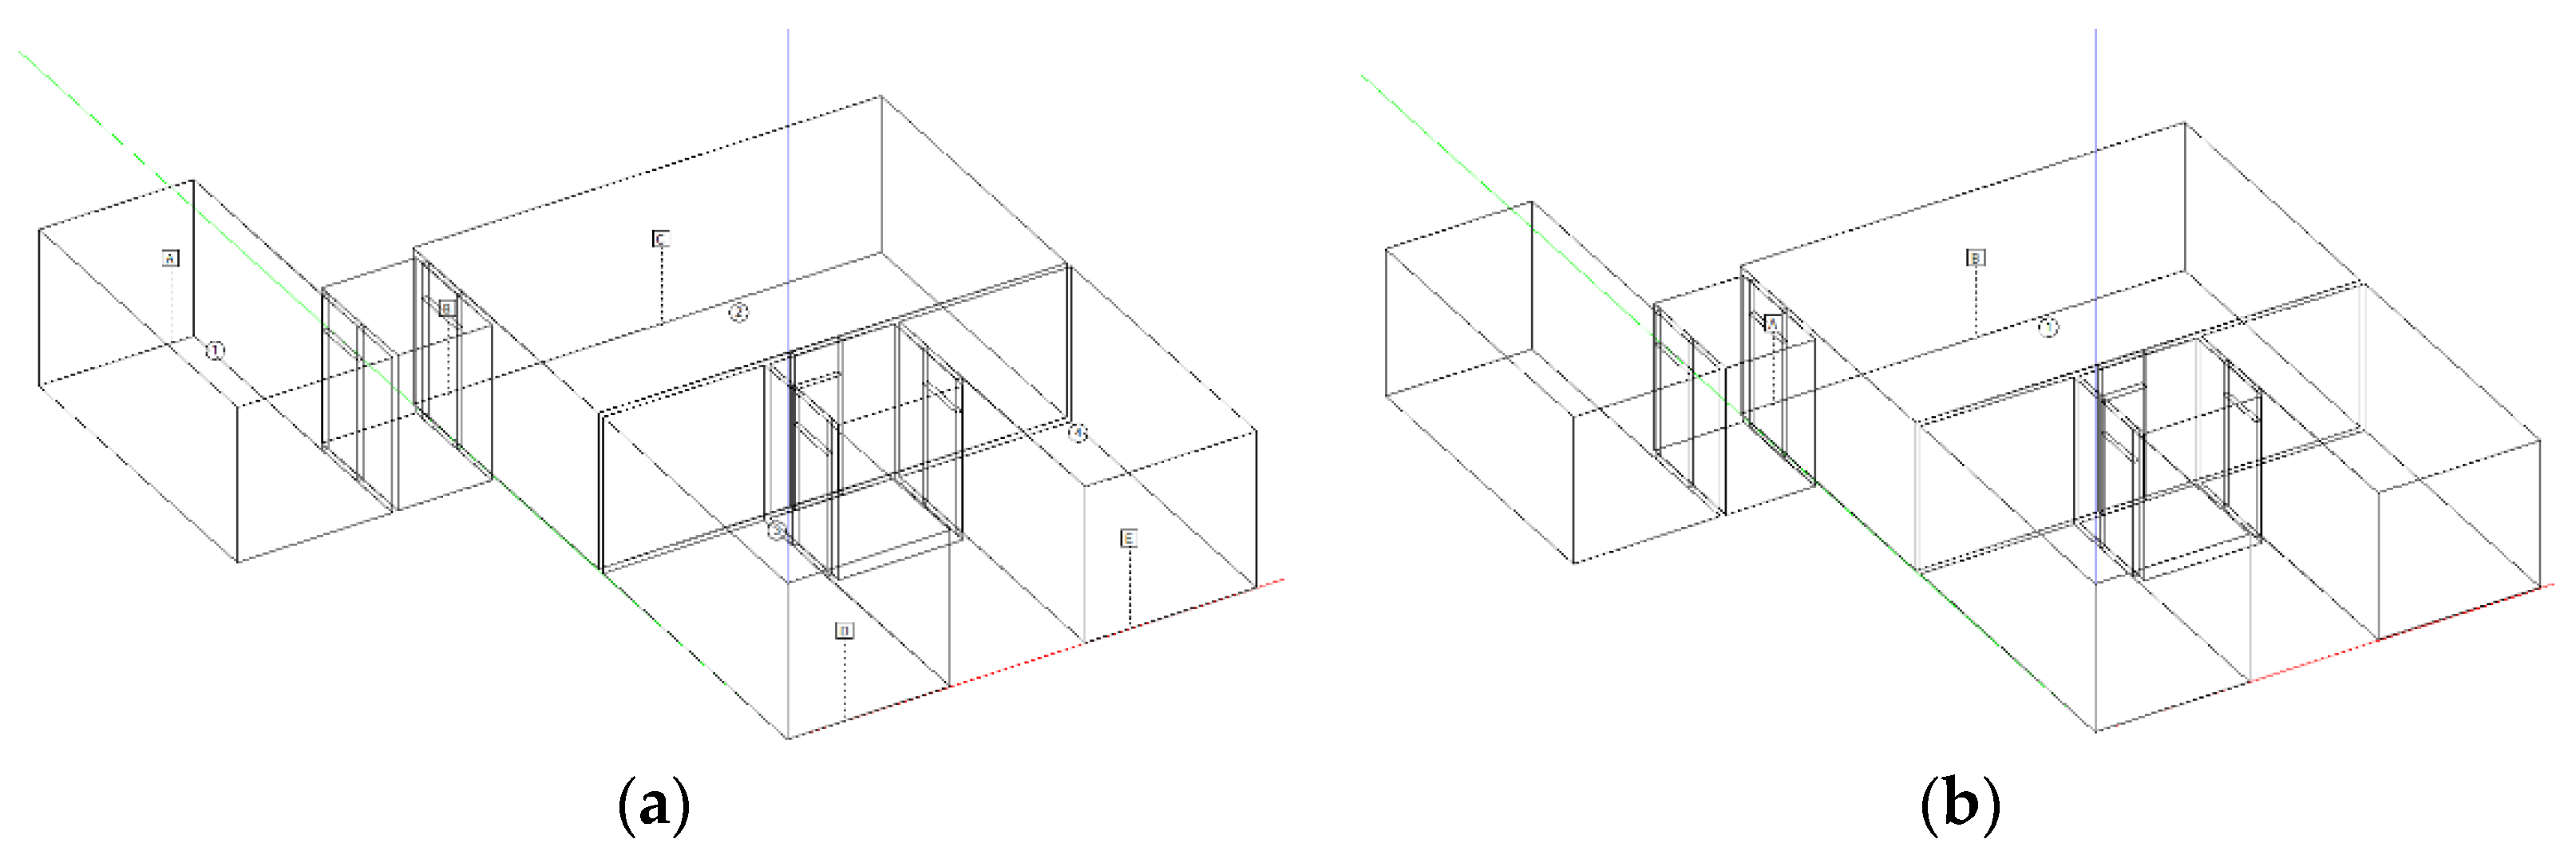
Figure 12.
Two-room apartment. Night configuration: (a) all CVM on, (b) only bedroom CVM on.

Figure 13.
Two-room apartment. Day configuration: (a) all CVM on, (b) only living room/kitchen CVM on.
Figure 13.
Two-room apartment. Day configuration: (a) all CVM on, (b) only living room/kitchen CVM on.

Figure 14.
Two-room apartment. (a) “Night” configuration A-weighted sound pressure levels. (b) “Day” configuration A-weighted sound pressure levels.
Figure 14.
Two-room apartment. (a) “Night” configuration A-weighted sound pressure levels. (b) “Day” configuration A-weighted sound pressure levels.

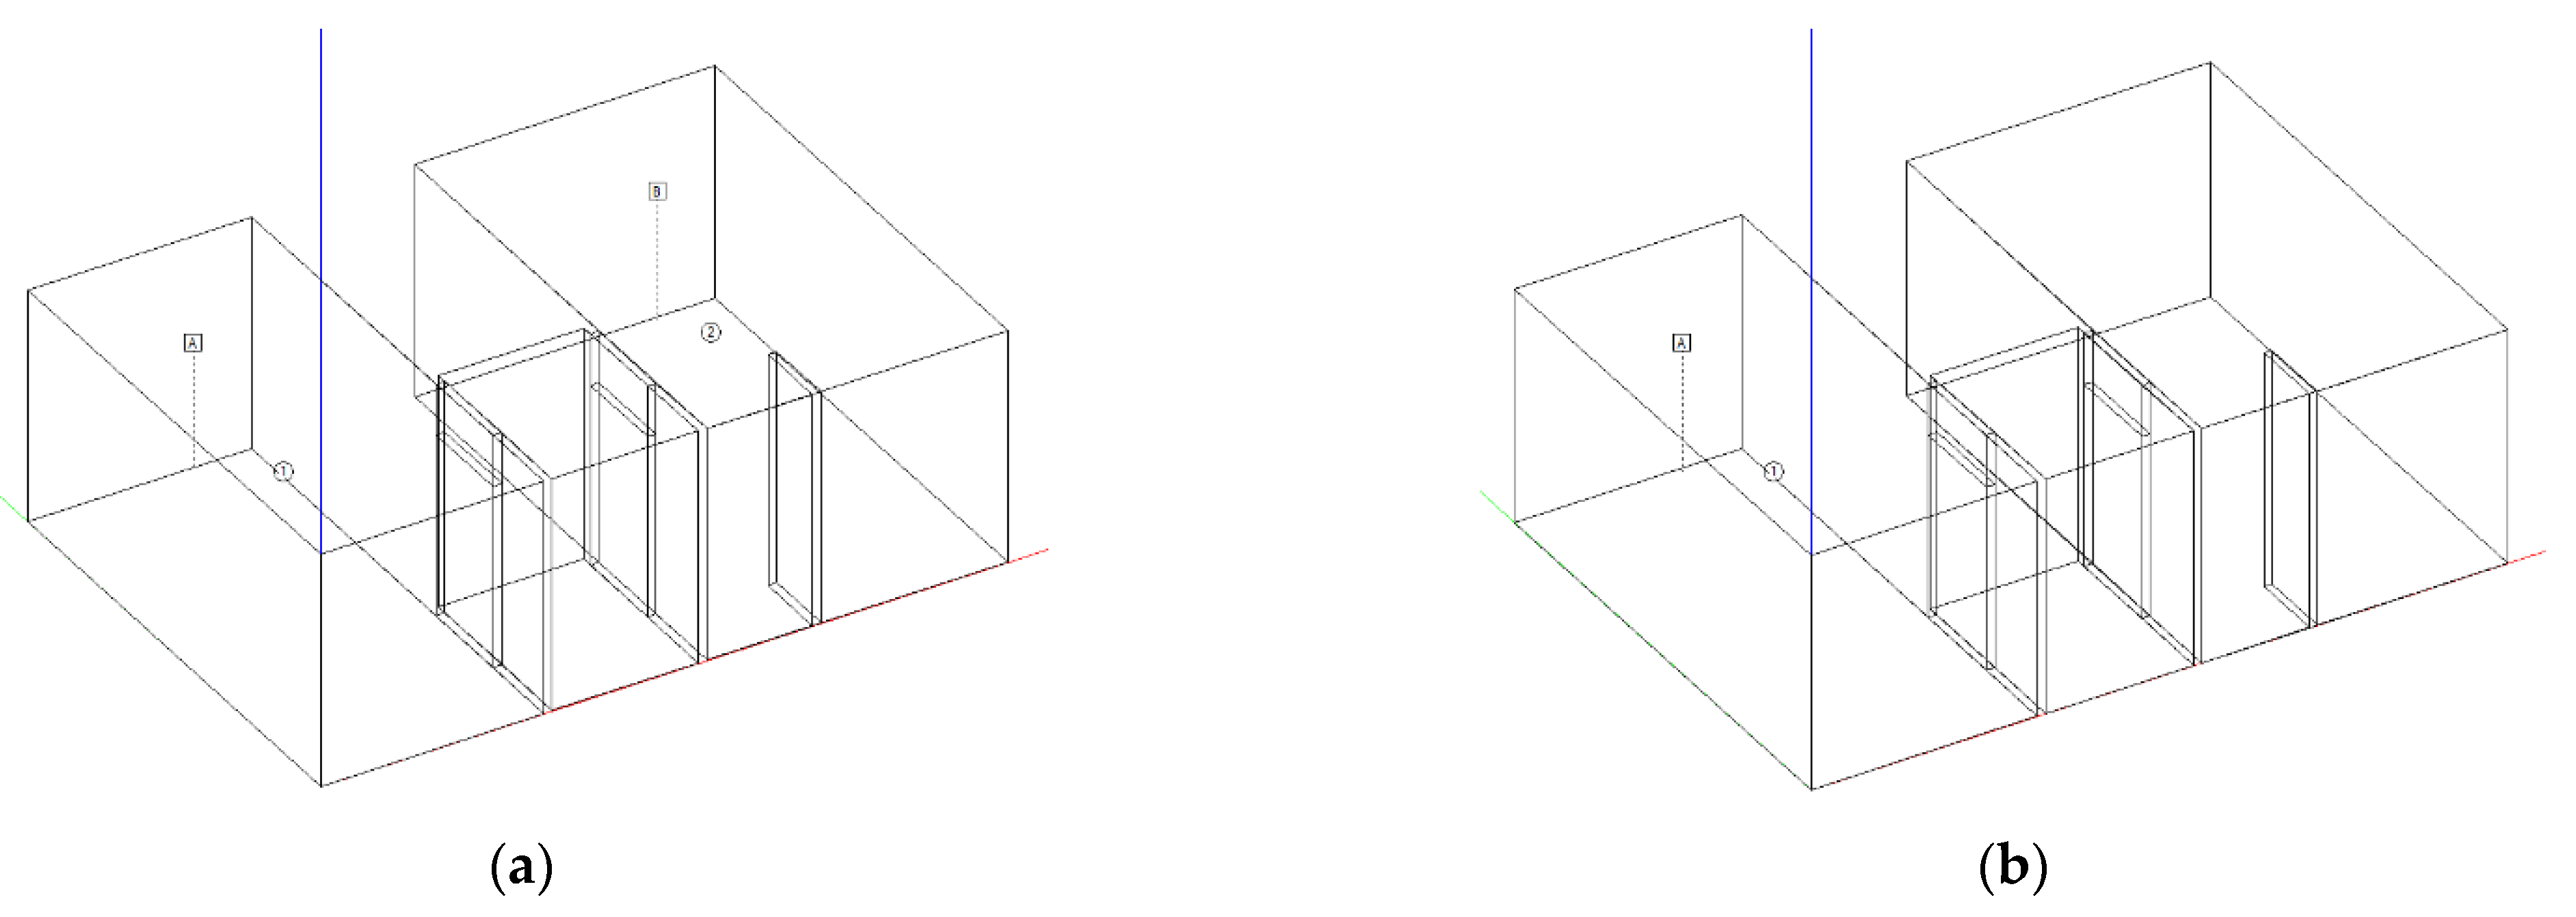
Figure 15.
Three-room apartment. “Night” configuration: (a) all CVM on, (b) only bedroom 8.76 m2 CVM on, (c) only bedroom 12.08 m2 CVM on.
Figure 15.
Three-room apartment. “Night” configuration: (a) all CVM on, (b) only bedroom 8.76 m2 CVM on, (c) only bedroom 12.08 m2 CVM on.

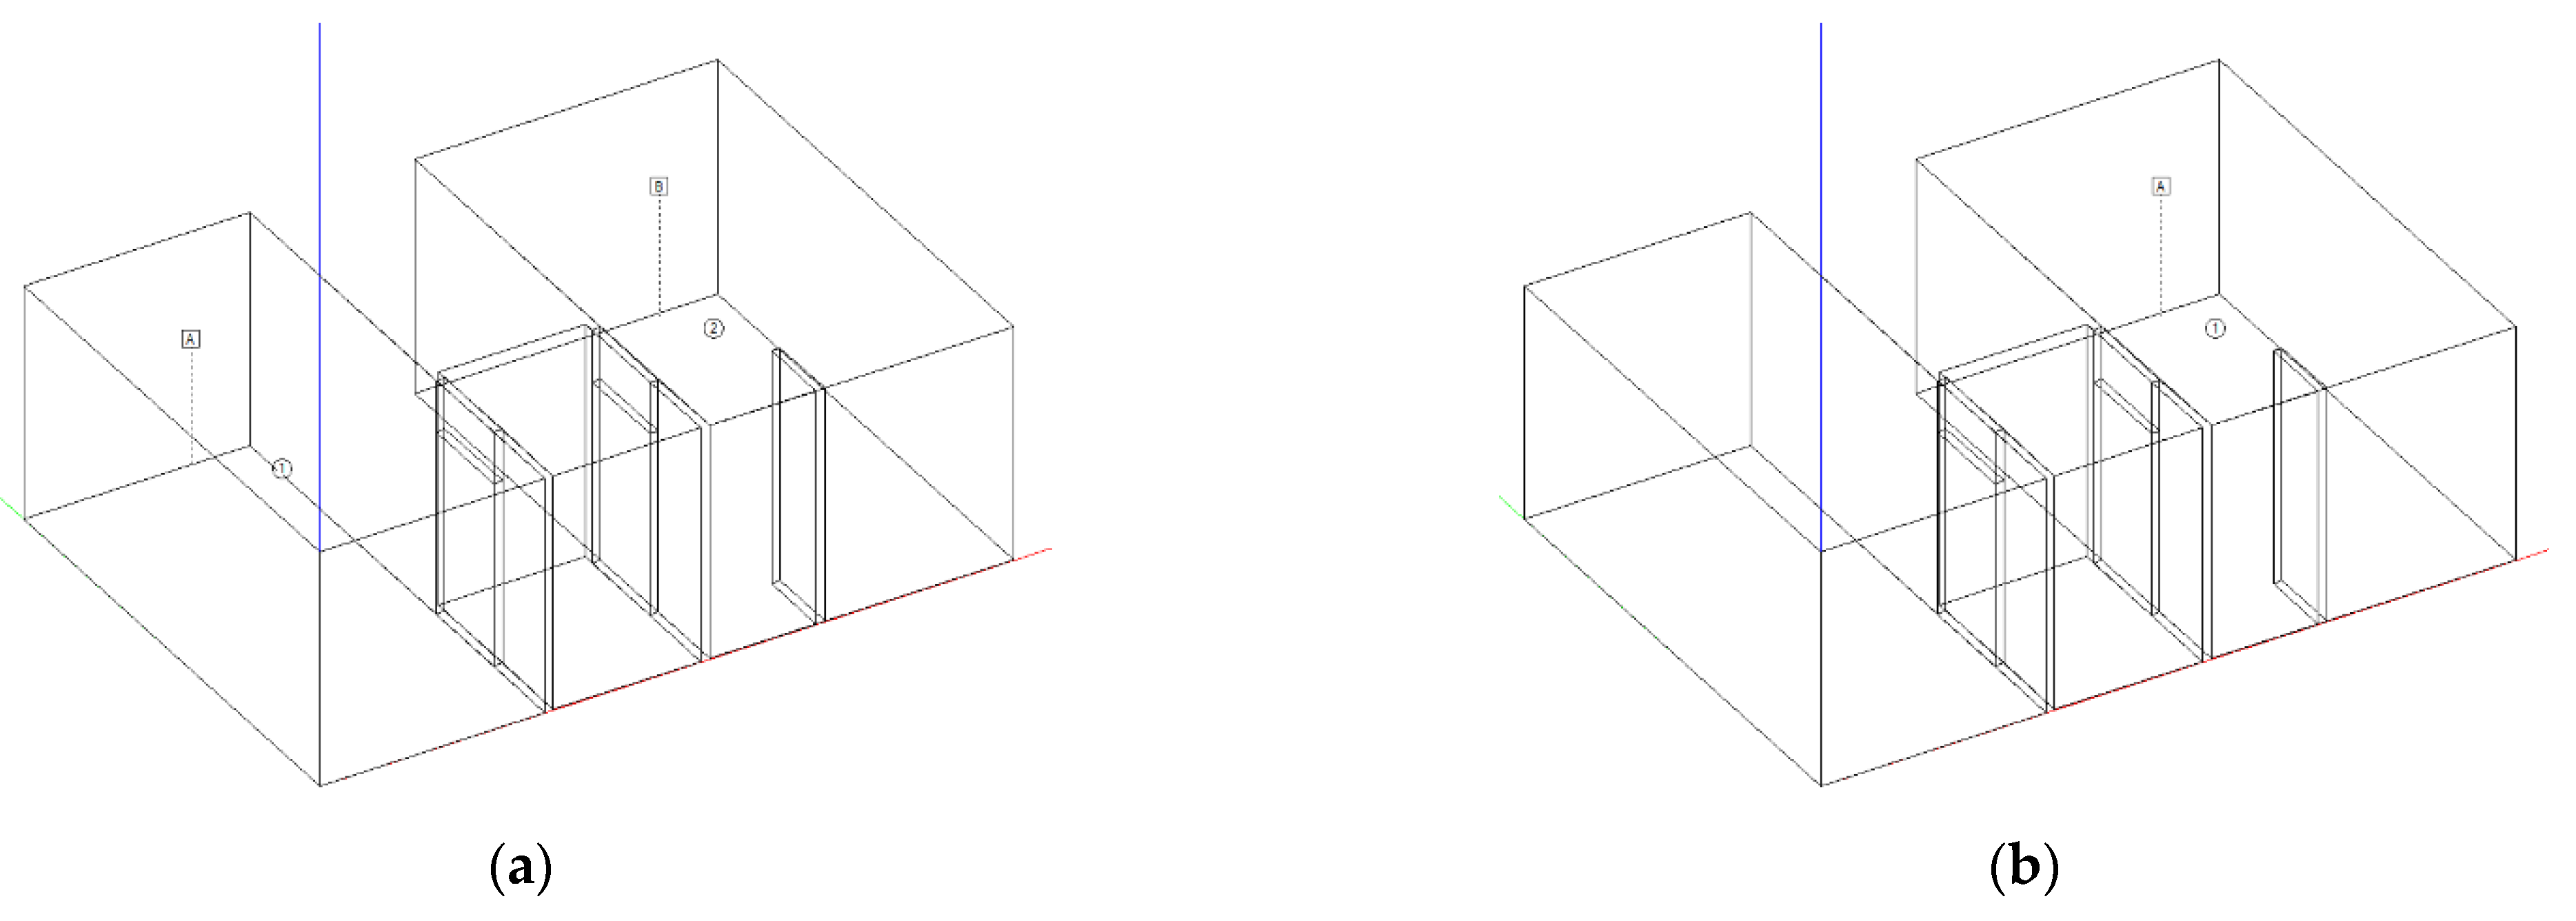
Figure 16.
Three-room apartment. “Day” configuration: (a) all CVM on, (b) only kitchen CVM on, (c) only living room CVM on.
Figure 16.
Three-room apartment. “Day” configuration: (a) all CVM on, (b) only kitchen CVM on, (c) only living room CVM on.

Figure 17.
Three-room apartment. (a) “Night” configuration A-weighted sound pressure levels. (b) “Day” configuration A-weighted sound pressure levels.
Figure 17.
Three-room apartment. (a) “Night” configuration A-weighted sound pressure levels. (b) “Day” configuration A-weighted sound pressure levels.

Figure 18.
Four-room apartment. Night configuration: (a) all CVM on, (b) only bedroom 1 CVM on, (c) only bedroom 2 CVM on, (d) only bedroom 3 CVM on.
Figure 18.
Four-room apartment. Night configuration: (a) all CVM on, (b) only bedroom 1 CVM on, (c) only bedroom 2 CVM on, (d) only bedroom 3 CVM on.

Figure 19.
Four-room apartment. Day configuration: (a) all CVM on, (b) only living room-kitchen CVM on.
Figure 19.
Four-room apartment. Day configuration: (a) all CVM on, (b) only living room-kitchen CVM on.

Figure 20.
Four-room apartment. (a) “Night” configuration A-weighted sound pressure levels. (b) “Day” configuration A-weighted sound pressure levels.
Figure 20.
Four-room apartment. (a) “Night” configuration A-weighted sound pressure levels. (b) “Day” configuration A-weighted sound pressure levels.


Table 1.
Equivalent continuous sound pressure level standardized to a reference reverberation time, LAeq,nT, for continuous sources (EN 16798-1).
Table 1.
Equivalent continuous sound pressure level standardized to a reference reverberation time, LAeq,nT, for continuous sources (EN 16798-1).
| Building | Type of Room | Equivalent Continuous Sound Pressure Level LAeq,nT (dB(A)) | ||
|---|---|---|---|---|
| I | II | III | ||
| Residential | Living room | LAeq,nT ≤ 30 | 30 < LAeq,nT ≤ 35 | 35 < LAeq,nT ≤ 40 |
| Bedrooms | LAeq,nT ≤ 25 | 25 < LAeq,nT ≤ 30 | 30 < LAeq,nT ≤ 35 | |
Table 2.
Air flow rates at different factory speeds setting.
| Air Flow Rate | ||||
|---|---|---|---|---|
| CMV Type | Speed 1 (m3/h) | Speed 2 (m3/h) | Speed 3 (m3/h) | Speed 4 (m3/h) |
| CM | 10 | 17 | 26 | 37 |
| SM | 15 | 25 | 30 | 40 |
Table 3.
“Night” configuration.
| Apartment | Room | Vol. (m3) | Target Air Exchange (m3/h) | CMV Model | CMV n. | Speed Setup | CMV Air Flow (m3/h) | CMV Air Exchange (1/h) |
|---|---|---|---|---|---|---|---|---|
| Two-room apartment | Bedroom | 34.79 | 17.4 | SM | 1 | 1 | 15 | 0.43 |
| Liv./Kitch. | 46.61 | 23.3 | SMt | 1 | 4 | 40 | 0.86 | |
| Total | 55 | 0.55 | ||||||
| Three-room apartment | Bedroom | 24.09 | 12.0 | SM | 1 | 1 | 15 | 0.62 |
| Bedroom | 33.22 | 16.6 | SM | 1 | 1 | 15 | 0.45 | |
| Kitchen | 23.93 | 12.0 | CM | 1 | 3 | 26 | 1.09 | |
| Living room | 58.49 | 29.2 | SM | 1 | 4 | 40 | 0.68 | |
| Total | 96 | 0.55 | ||||||
| Four-room apartment | Bedroom 1 | 34.84 | 17.4 | SM | 1 | 1 | 15 | 0.43 |
| Liv./Kitch. | 100.51 | 50.3 | SM | 2 | 4 | 80 | 0.80 | |
| Bedroom 2 | 34.84 | 17.4 | SM | 1 | 1 | 15 | 0.43 | |
| Bedroom 3 | 36.82 | 18.4 | SM | 1 | 1 | 15 | 0.41 | |
| Total | 125 | 0.52 |
Table 4.
“Day” configuration.
| Apartment | Room | Vol. (m3) | Target Air Exchange (m3/h) | CMV Model | CMV n. | Speed Setup | CMV Air Flow (m3/h) | CMV Air Exchange (1/h) |
|---|---|---|---|---|---|---|---|---|
| Two-room apartment | Bedroom | 34.79 | 17.4 | SM | 1 | 2 | 25 | 0.72 |
| Liv./Kitch. | 46.61 | 23.3 | SM | 1 | 2 | 25 | 0.54 | |
| Total | 55 | 0.50 | ||||||
| Three-room apartment | Bedroom | 24.09 | 12.0 | SM | 1 | 2 | 25 | 1.04 |
| Bedroom | 33.22 | 16.6 | SM | 1 | 2 | 25 | 0.75 | |
| Kitchen | 23.93 | 12.0 | CM | 1 | 2 | 17 | 0.71 | |
| Living room | 58.49 | 29.2 | SM | 1 | 2 | 25 | 0.43 | |
| Total | 173.94 | 87.0 | 92 | 0.53 | ||||
| Four-room apartment | Bedroom 1 | 34.84 | 17.4 | SM | 1 | 2 | 25 | 0.72 |
| Liv./Kitch. | 100.51 | 50.3 | SM | 2 | 2 | 50 | 0.50 | |
| Bedroom 2 | 34.84 | 17.4 | SM | 1 | 2 | 25 | 0.72 | |
| Bedroom 3 | 36.82 | 18.4 | SM | 1 | 2 | 25 | 0.68 | |
| Total | 125 | 0.52 |
Table 5.
Measured sound pressure levels.
| Config. 1 | Config. 2 | Config. 3 | |
|---|---|---|---|
| Bedroom 1 | Speed 1 | off | off |
| Bedroom 2 | Speed 1 | Speed 1 | Speed 2 |
| Living room | Speed 3 | off | off |
| LAeq (dB(A)) | 28.7 | 24.9 | 32.7 |
| LAeq,nT (dB(A)) | 22.7 | 18.9 | 26.8 |
Table 6.
Two-room apartment reverberation time T20 considered in the simulation.
| Room | 125 | 250 | 500 | 1000 | 2000 | 4000 |
|---|---|---|---|---|---|---|
| Bedroom | 0.64 | 0.46 | 0.46 | 0.49 | 0.55 | 0.54 |
| Living room/Kitchen | 0.99 | 0.60 | 0.56 | 0.55 | 0.59 | 0.56 |
Table 7.
Three-room apartment reverberation time T20 considered in the simulation.
| Room | 125 | 250 | 500 | 1000 | 2000 | 4000 |
|---|---|---|---|---|---|---|
| Room 8.76 m2 | 0.89 | 0.54 | 0.49 | 0.49 | 0.53 | 0.50 |
| Room 12.08 m2 | 0.93 | 0.60 | 0.54 | 0.53 | 0.57 | 0.55 |
| Kitchen | 0.83 | 0.52 | 0.48 | 0.48 | 0.52 | 0.49 |
| Living room | 1.08 | 0.60 | 0.55 | 0.56 | 0.61 | 0.56 |
Table 8.
Four-room apartment reverberation time T20 considered in the simulation.
| Room | 125 | 250 | 500 | 1000 | 2000 | 4000 |
|---|---|---|---|---|---|---|
| Bedroom 1 | 0.97 | 0.57 | 0.52 | 0.52 | 0.57 | 0.53 |
| Bedroom 2 | 0.54 | 0.40 | 0.39 | 0.39 | 0.40 | 0.39 |
| Bedroom 3 | 0.63 | 0.46 | 0.42 | 0.42 | 0.45 | 0.42 |
| Living room | 0.83 | 0.55 | 0.51 | 0.51 | 0.55 | 0.51 |
Table 9.
Two-room apartment. Night and day configurations (in blue font 0.5 1/h single CMV speed).
| Night Configuration | Day Configuration | ||||||||
|---|---|---|---|---|---|---|---|---|---|
| Room | CMV ID | Speed | LAeq (dB(A)) | Speed | LAeq (dB(A)) | Speed | LAeq (dB(A)) | Speed | LAeq (dB(A)) |
| Bedroom | SM A | 1 | 25.0 | 1/2 | 22.3/28.2 | 2 | 28.5 | 0 | - |
| Living room-kitchen | SM B | 4 | 33.7 | 0 | - | 2 | 27.4 | 2 | 26.4 |
Table 10.
Three-room apartment. Night and day configurations (in blue 0.5 1/h single operation CMV speed).
Table 10.
Three-room apartment. Night and day configurations (in blue 0.5 1/h single operation CMV speed).
| Night Configuration | Day Configuration | ||||||||
|---|---|---|---|---|---|---|---|---|---|
| Room | CMV ID | Speed | LAeq (dB(A)) | Speed | LAeq (dB(A)) | Speed | LAeq (dB(A)) | Speed | LAeq (dB(A)) |
| Bedroom 8.76 m2 | SM C | 1 | 26.2 | 1 * | 23.8 | 2 | 30.4 | 0 | - |
| Bedroom 12.08 m2 | SM D | 1 | 24.6 | 1 */2 * | 21.9/28.3 | 2 | 29.5 | 0 | - |
| Kitchen | CM B | 3 | 36.0 | 0 | - | 2 | 29.1 | 2 * | 26.5 |
| Living room | SM A | 4 | 33.4 | 0 | - | 2 | 26.7 | 2 */3 * | 24.2/27.7 |
* CMV operating only in the analyzed room.
Table 11.
Four-room apartment. Night and day configurations (in blue 0.5 1/h single CMV speed).
| Night Configuration | Day Configuration | ||||||||
|---|---|---|---|---|---|---|---|---|---|
| Room | CMV ID | Speed | LAeq (dB(A)) | Speed | LAeq (dB(A)) | Speed | LAeq (dB(A)) | Speed | LAeq (dB(A)) |
| Room 1 | SM A | 1 | 27.3 | 1 */2 * | 22.4/28.6 | 2 | 29.3 | 0 | - |
| Room 2 | SM D | 1 | 25.1 | 1 */2 * | 22.7/27.8 | 2 | 29.2 | 0 | - |
| Room 3 | SM E | 1 | 25.6 | 1 */2 * | 21.4/28.9 | 2 | 29.0 | 0 | - |
| Living room-kitchen | 2xSM B, C | 4 | 35.3 | 0 | - | 2 | 28.2 | 2/3 | 27.1/30.5 |
* CMV operating only in the analyzed room.
Publisher’s Note: MDPI stays neutral with regard to jurisdictional claims in published maps and institutional affiliations. |
© 2021 by the author. Licensee MDPI, Basel, Switzerland. This article is an open access article distributed under the terms and conditions of the Creative Commons Attribution (CC BY) license (https://creativecommons.org/licenses/by/4.0/).
Share and Cite
MDPI and ACS Style
Granzotto, N. Optimization of Controlled Mechanical Ventilation Systems for Indoor Acoustic Comfort. Designs 2021, 5, 48. https://0-doi-org.brum.beds.ac.uk/10.3390/designs5030048
AMA Style
Granzotto N. Optimization of Controlled Mechanical Ventilation Systems for Indoor Acoustic Comfort. Designs. 2021; 5(3):48. https://0-doi-org.brum.beds.ac.uk/10.3390/designs5030048
Chicago/Turabian StyleGranzotto, Nicola. 2021. "Optimization of Controlled Mechanical Ventilation Systems for Indoor Acoustic Comfort" Designs 5, no. 3: 48. https://0-doi-org.brum.beds.ac.uk/10.3390/designs5030048