Article

Exploring Performances of Electric Micro-Mobility Vehicles and Behavioural Patterns of Riders for In-Depth Accident Analysis

by
Michelangelo-Santo Gulino
1,*,
Giovanni Zonfrillo
1,
Krzysztof Damaziak
2 and
Dario Vangi
1
1
Department of Industrial Engineering of Florence, Università degli Studi di Firenze, Via di Santa Marta 3, 50139 Florence, Italy
2
Faculty of Mechanical Engineering, Institute of Mechanics and Computational Engineering, Military University of Technology, Gen. Sylwestra Kaliskiego Street 2, 00-908 Warsaw, Poland
*
Author to whom correspondence should be addressed.
Submission received: 13 September 2021 / Revised: 4 October 2021 / Accepted: 10 October 2021 / Published: 14 October 2021
(This article belongs to the Section Vehicle Engineering Design)

Abstract

:
(1) Background: Electric micro-mobility vehicles (i.e., e-bikes and e-scooters) represent a fast-growing portion of the circulating fleet, leading to a multiplication of accident cases also attributable to risky behaviours adopted by the riders. Still, data on vehicle performance and rider behaviour are sparse and difficult to interpret (if not unavailable). Information regarding the overall accident dynamics can, however, aid in identifying users’ risky riding behaviour that actually led to a harmful event, allowing one to propose efficient strategies and policies to reduce the occurrence of road criticalities. (2) Methods: Speed and acceleration data of six cyclists of traditional and electric bikes were extracted from six closed-circuit experiments and real road tests performed in the city of Florence (Italy) to derive their behavioural patterns in diverse road contexts. (3) Results: The application of analysis of variance and linear regression procedures to such data highlights differences between men and women in terms of performance/behaviour in standing start; additionally, the use of e-bikes favours a higher speed ride in correspondence to roundabouts and roads with/without the right of way. To thoroughly assess the rider’s responsibilities in an eventual accident, an ancillary procedure was highlighted to evaluate whether a micro-mobility vehicle complies with the applicable regulations. (4) Conclusion: With these results, the prospective recognition of rider behaviour was facilitated during the investigation process, and the abilities to extract such relevant information from in-depth accident data wereconsequently enhanced.

1. Introduction

The overall boost in the use of micro-mobility electric vehicles such as e-bikes and e-scooters is a direct consequence of several factors, such as a general reduction in purchasing costs, as well as an increase in motor efficiency and lightness (ease of transportation); sales are also driven by a growing interest in both health and environmental sustainability. From this last perspective, the use of e-bikes is undoubtedly characterized by the greatest advantages: requiring pedalling by the user for the activation of the electric motor, e-bikes allow the users to achieve beneficial effort conditions without entailing physical overload [1]; moreover, unlike e-bikes [2,3], the eco-friendliness of e-scooters is frequently questioned, as they are mostly used to cover routes otherwise travelled by walking [4,5].
The most recent data publicly provided by the Confederation of the European Bicycle Industry highlight that, in 2016, more than twelve million bicycles and one million e-bikes were produced in the whole continent (EUROPEAN BICYCLE MARKET 2017 edition—Industry and Market Profile (2016 statistics) by CONEBI, Confederation of the European Bicycle Industry). Referring to the Italian market only, one of the EU’s leading producers of bicycles, in 2019, almost 200 thousand e-bikes were sold compared to total bicycle sales of 1.7 million (2019 Annual Report on Bicycle Sales by CONFINDUSTRIA ANCMA, Associazione Nazionale Ciclo Motociclo Accessori); annual e-bike sales are constantly augmenting (+12% compared to 2018) so that e-bikes constitute an increasingly relevant portion of the circulating fleet. The growth in the total number of bicycles is reflected in an increase in the number of accidents involving cyclists (+3.3% between 2018 and 2019 (2019 Annual Report on Accidents in Italy by ISTAT, Istituto Nazionale di Statistica)): this shows that fatal events involving cyclists represent approximately 8.5% of the total accidents; the replacement of traditional bikes with the electric alternative inevitably leads to a multiplication of accident cases in which the latter type of vehicle is involved. Nevertheless, specific data on e-bikes-related accidents are limited: in Italy, as an adaptation to the European Regulation 168/2013 (REGULATION (EU) No 168/2013 OF THE EUROPEAN PARLIAMENT AND OF THE COUNCIL on the approval and market surveillance of two- or three-wheel vehicles and quadricycles), there is a strong tendency to equate e-bikes with traditional bicycles; however, the scientific literature has shown that several elements distinguish these vehicles in terms of accident involvement and also in terms of the obvious differences in travel speed, which emphasize the incorrect and risky behaviour of riders [6,7,8]. From other countries such as China, more specific information has been collected, indicating that 10% of accidents involving e-bike cyclists are associated with fatal outcomes [9]. As far as e-scooters are concerned, accident and market penetration data are not currently available in Europe because of a traffic regulation activated in 2019 (and only in specific countries such as Italy, Germany and France). Nevertheless, it is clear the introduction of this type of vehicle on the market has transformed the road landscape and promoted the generation of new accident scenarios.
Currently available studies on micro-mobility electric vehicles aim in particular at highlighting how they affect urban transportation as a whole and at analysing riders’ habits for the tuning of traffic regulation policies [10] and business models for sharing services [11,12,13,14,15,16,17,18]. While they represent a precious resource for enhancing road safety [19,20,21,22,23,24], the available works do not specifically address the analysis of related accidents. As a first consequence, certain interesting data are sometimes unavailable during the event analysis, e.g., speed or accelerations on a hypothetical trajectory travelled by the vehicle; conversely, when available from the literature, the data must sustain interpretation and contextualization, making them difficult to employ. For instance, Huertas-Leyva et al. [25] highlighted the distribution of the braking force on the rear and front wheels activated by six riders of traditional and electric bikes in case of routine cycling or unexpected emergencies; however, no information was available regarding the speed at the beginning of such braking action, nor the associated type of road (e.g., with/without right of way, roundabouts), which are fundamental to hypothesize the accident dynamics and hence reconstruct the pre-impact scenario. Analogously, Otte et al. [26] reported the distribution of accidents involving riders of traditional bikes and e-bikes in terms of road typology and speed separately, but not considering both at the same time. Such information obtained from in-depth investigations could still represent an extremely valuable tool to prospectively assess the riders’ risky behaviour in extremely critical events: combined with analyses focused on the frequency of different impact typologies [26] and injury outcomes for the riders [27], these elements could aid in promoting targeted policies to reduce the involvement of micro-mobility users in potentially harmful events. For instance, up-to-date training schemes could be efficiently devised to increase the rider awareness towards high-risk situations [28]. This is a fundamental priority, especially when considering that healthier (and more expert) bike riders are more prone to be involved in traffic crashes [29].
In accident investigations involving micro-mobility electric vehicles, three primary tasks should be accomplished:
  • To draw up a precise picture regarding the accident dynamics, depending on the evidence collected in situ.
  • Formulate theses on collision evitability starting from typical travel times of riders for some road sections; for instance, starting from the point of impact and the assistance level, the position of the vehicle at the beginning of the critical scenario can be deduced, as well as its visibility from the opponent’s perspective.
  • Assess the compliance of the vehicle motor-assistance system assembly to current regulations (e.g., Regulation 168/2013 by the European Community); this operation is often complicated by the vehicle seizing conditions, which conflict with the operator’s need to access the key elements for verification.
The first two instances provide fundamental highlights regarding the appropriateness of the rider’s choices in critical road scenarios; knowledge regarding the typical speed and/or acceleration with which the rider tackles specific conditions (roads with the right of way, roundabouts, etc.) could effectively aid in assessing their behaviour during the criticality, as well as the suitability of the infrastructure for this category of vulnerable road users. The third instance allows practitioners to assess whether the blame for a crash with an opponent, at fault or not, is to be put also on the micro-mobility vehicle rather than on the users alone; verification of this possibility is an additional priority, since it can significantly affect conclusions regarding the risky riding behaviour of the rider. Based on these assumptions, fundamental elements to facilitate the in-depth accident analysis are: (a) the collection of data relating to riders in conditions which are representative of road traffic; (b) developing guidelines to assess vehicle compliance to current regulations.
The scope of the present work is to provide the background for the analysis of a road accident involving electric micro-mobility vehicles, with a view to achieving the identification of the riders’ behavioural pattern. For this purpose, real road and closed-circuit tests were performed to obtain behaviour/performance data on micro-mobility vehicle riders in specific road scenarios. As an ancillary tool, a procedure is proposed to verify the aptness of a vehicle for circulation, fundamental to confirm the investigation results regarding the rider’s adopted behaviour in correspondence to road criticality.

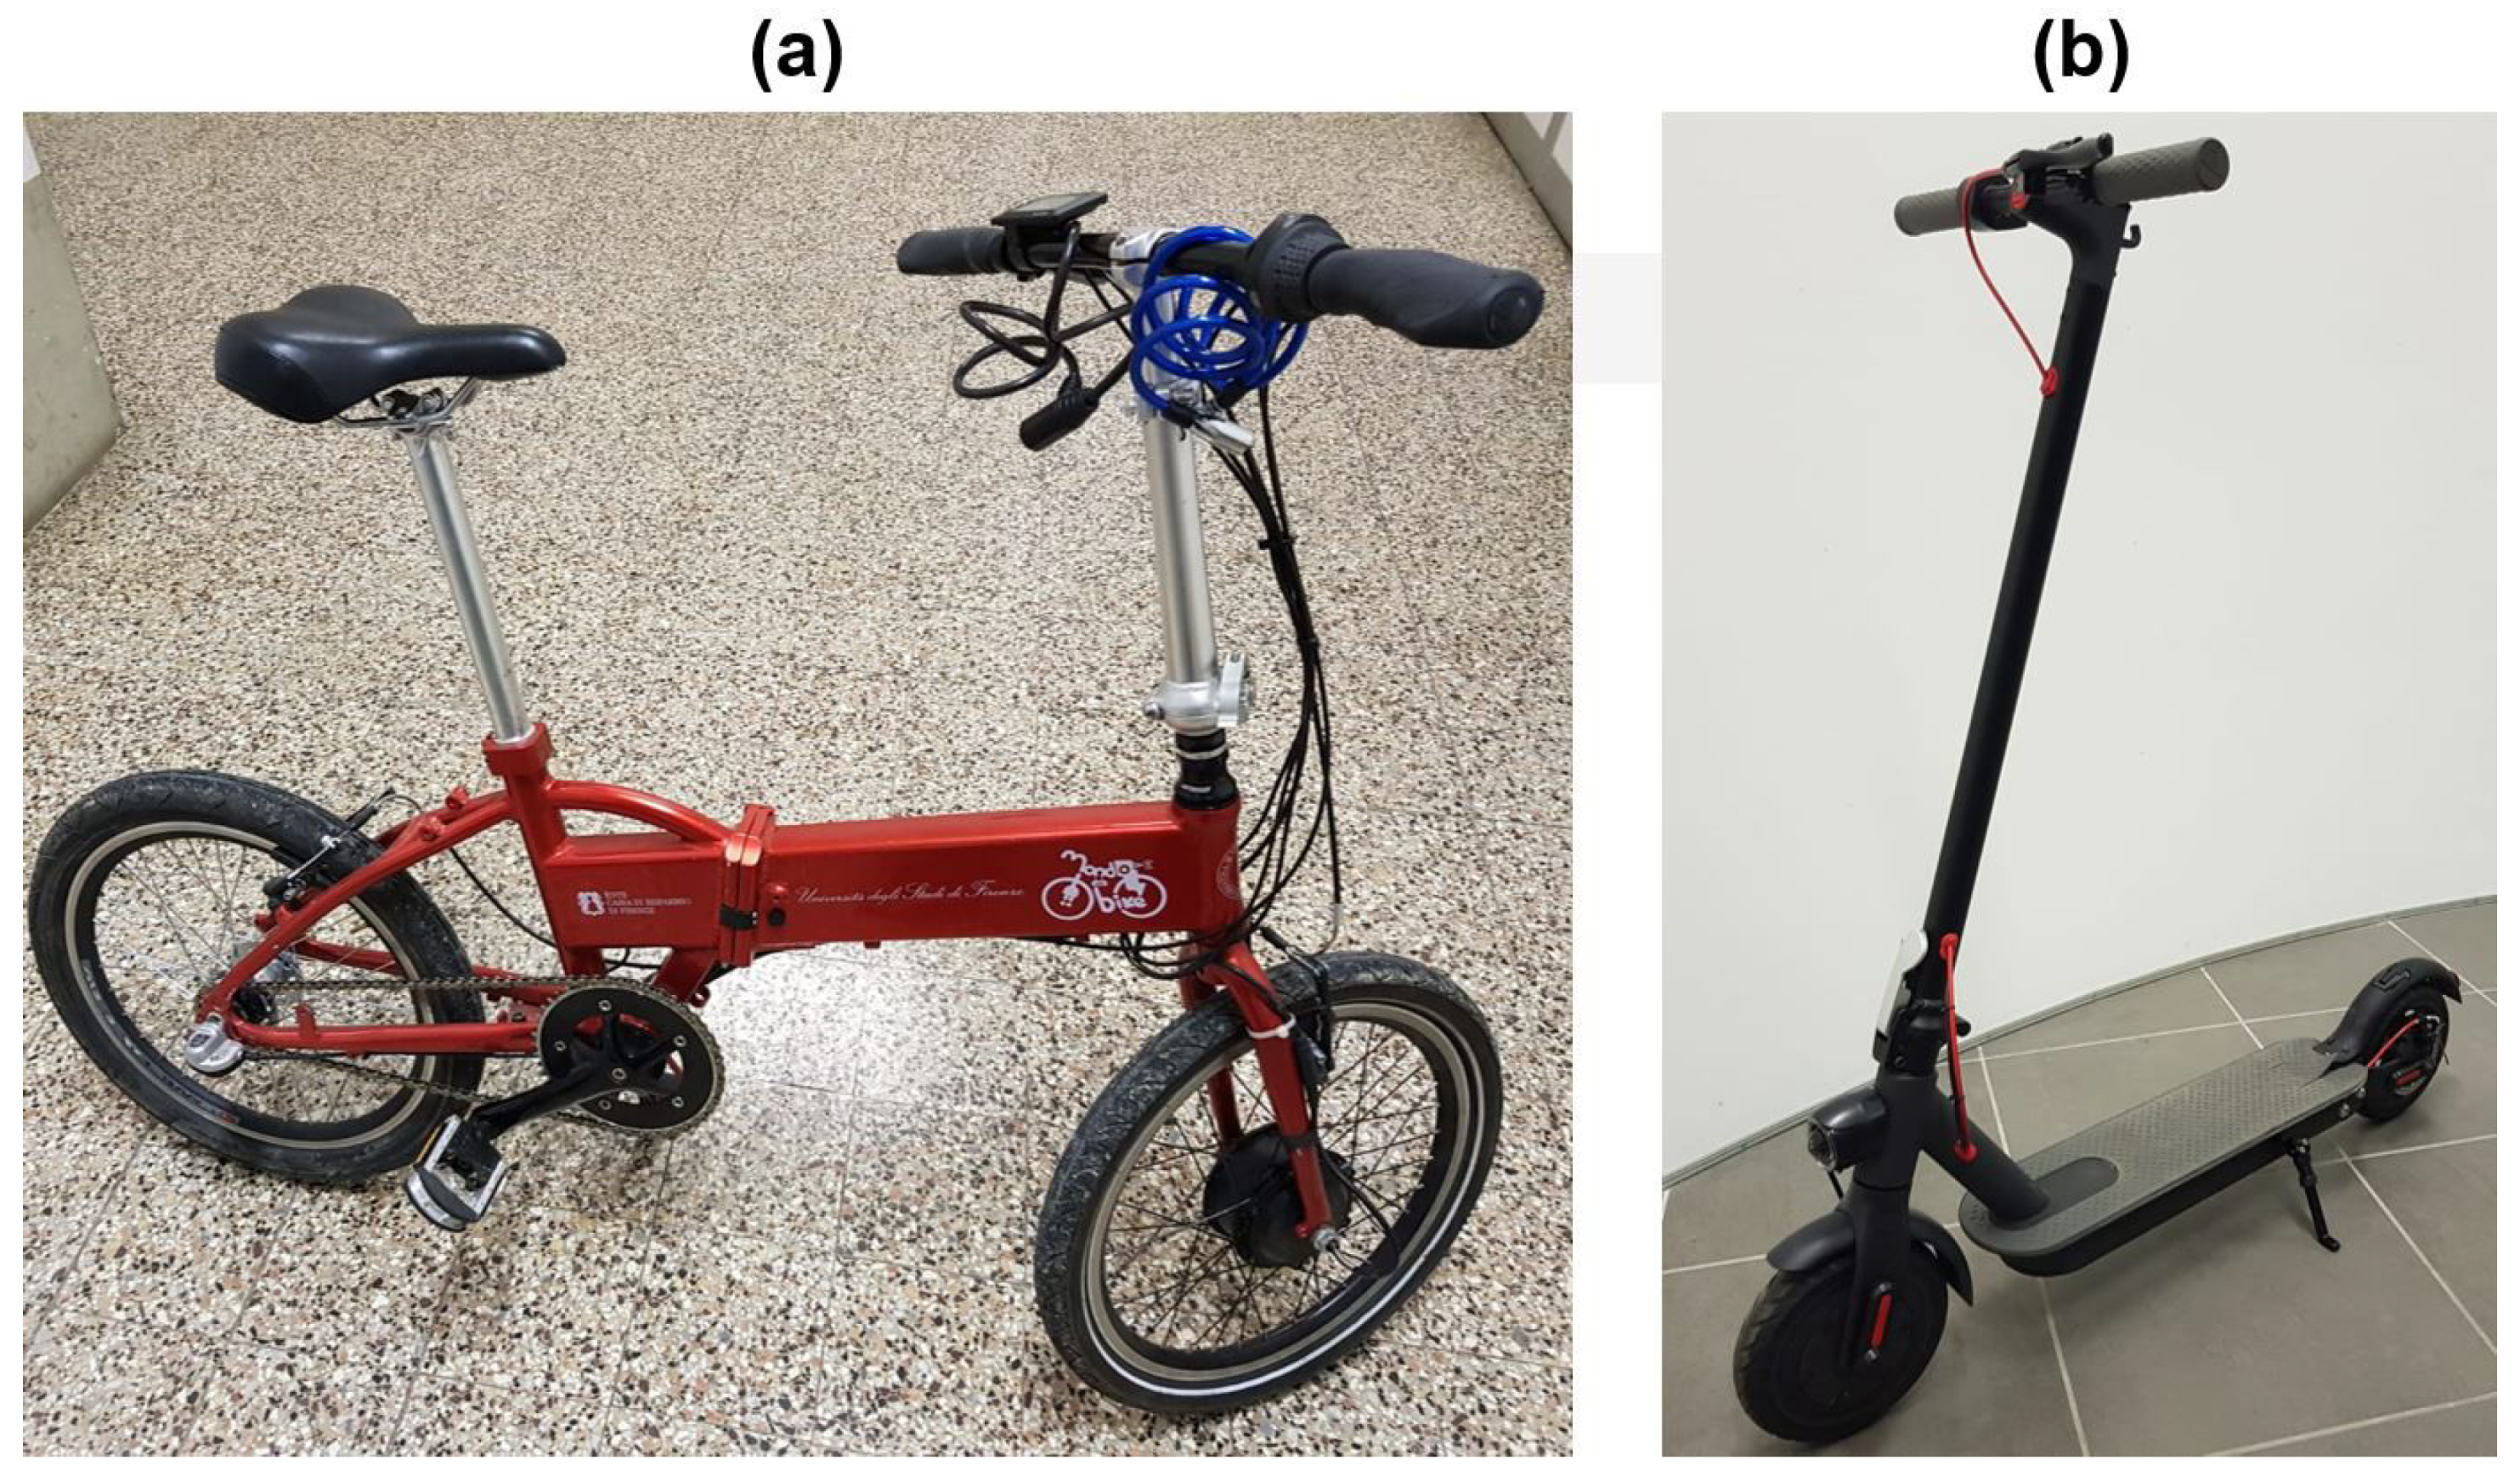
2. Testing Campaigns

Testing activities are highlighted and commented on, allowing one to obtain behavioural data on e-bike cyclists in certain road sections, as well as results useful in the analysis of accidents with the involvement of both e-bikes and e-scooters. Real road and closed-circuit tests are reported, which refer to a total of six riders, daily users of traditional bikes, equally divided based on their gender and aged between 25 and 55; such a number of subjects is sufficient to extrapolate interesting information in terms of performance and typical behaviours of riders [25]. The subjects were part of the University of Florence, ranging from students and internal personnel. The six subjects volunteered in response to an announcement regarding the testing campaigns and signed an informed consent form. Collected data were anonymized before processing; the period of testing was approximately 10 min for the closed-circuit campaign, and the time of two rides (with and without assistance) for real road tests. The circuit on the real road tests matched the needs of all users in terms of home-to-work trips.
Specific experiments were carried out by setting an assistance level equal to zero: this is functional both to analyse the case of a discharged battery and to obtain data which are highly similar to those from a traditional vehicle, its shape/frame and mechanisms being the same; such a solution allows one to observe differences in the operation with or without an auxiliary motor. The parameters extracted concern speed, acceleration and travel times: knowledge of these elements is valuable for investigations in case video footages related to the event are unavailable; otherwise, it is possible to refer to well-established speed derivation procedures for the involved subjects, such as those illustrated by Han [30], Vangi et al. [31], and Costa et al. [32].

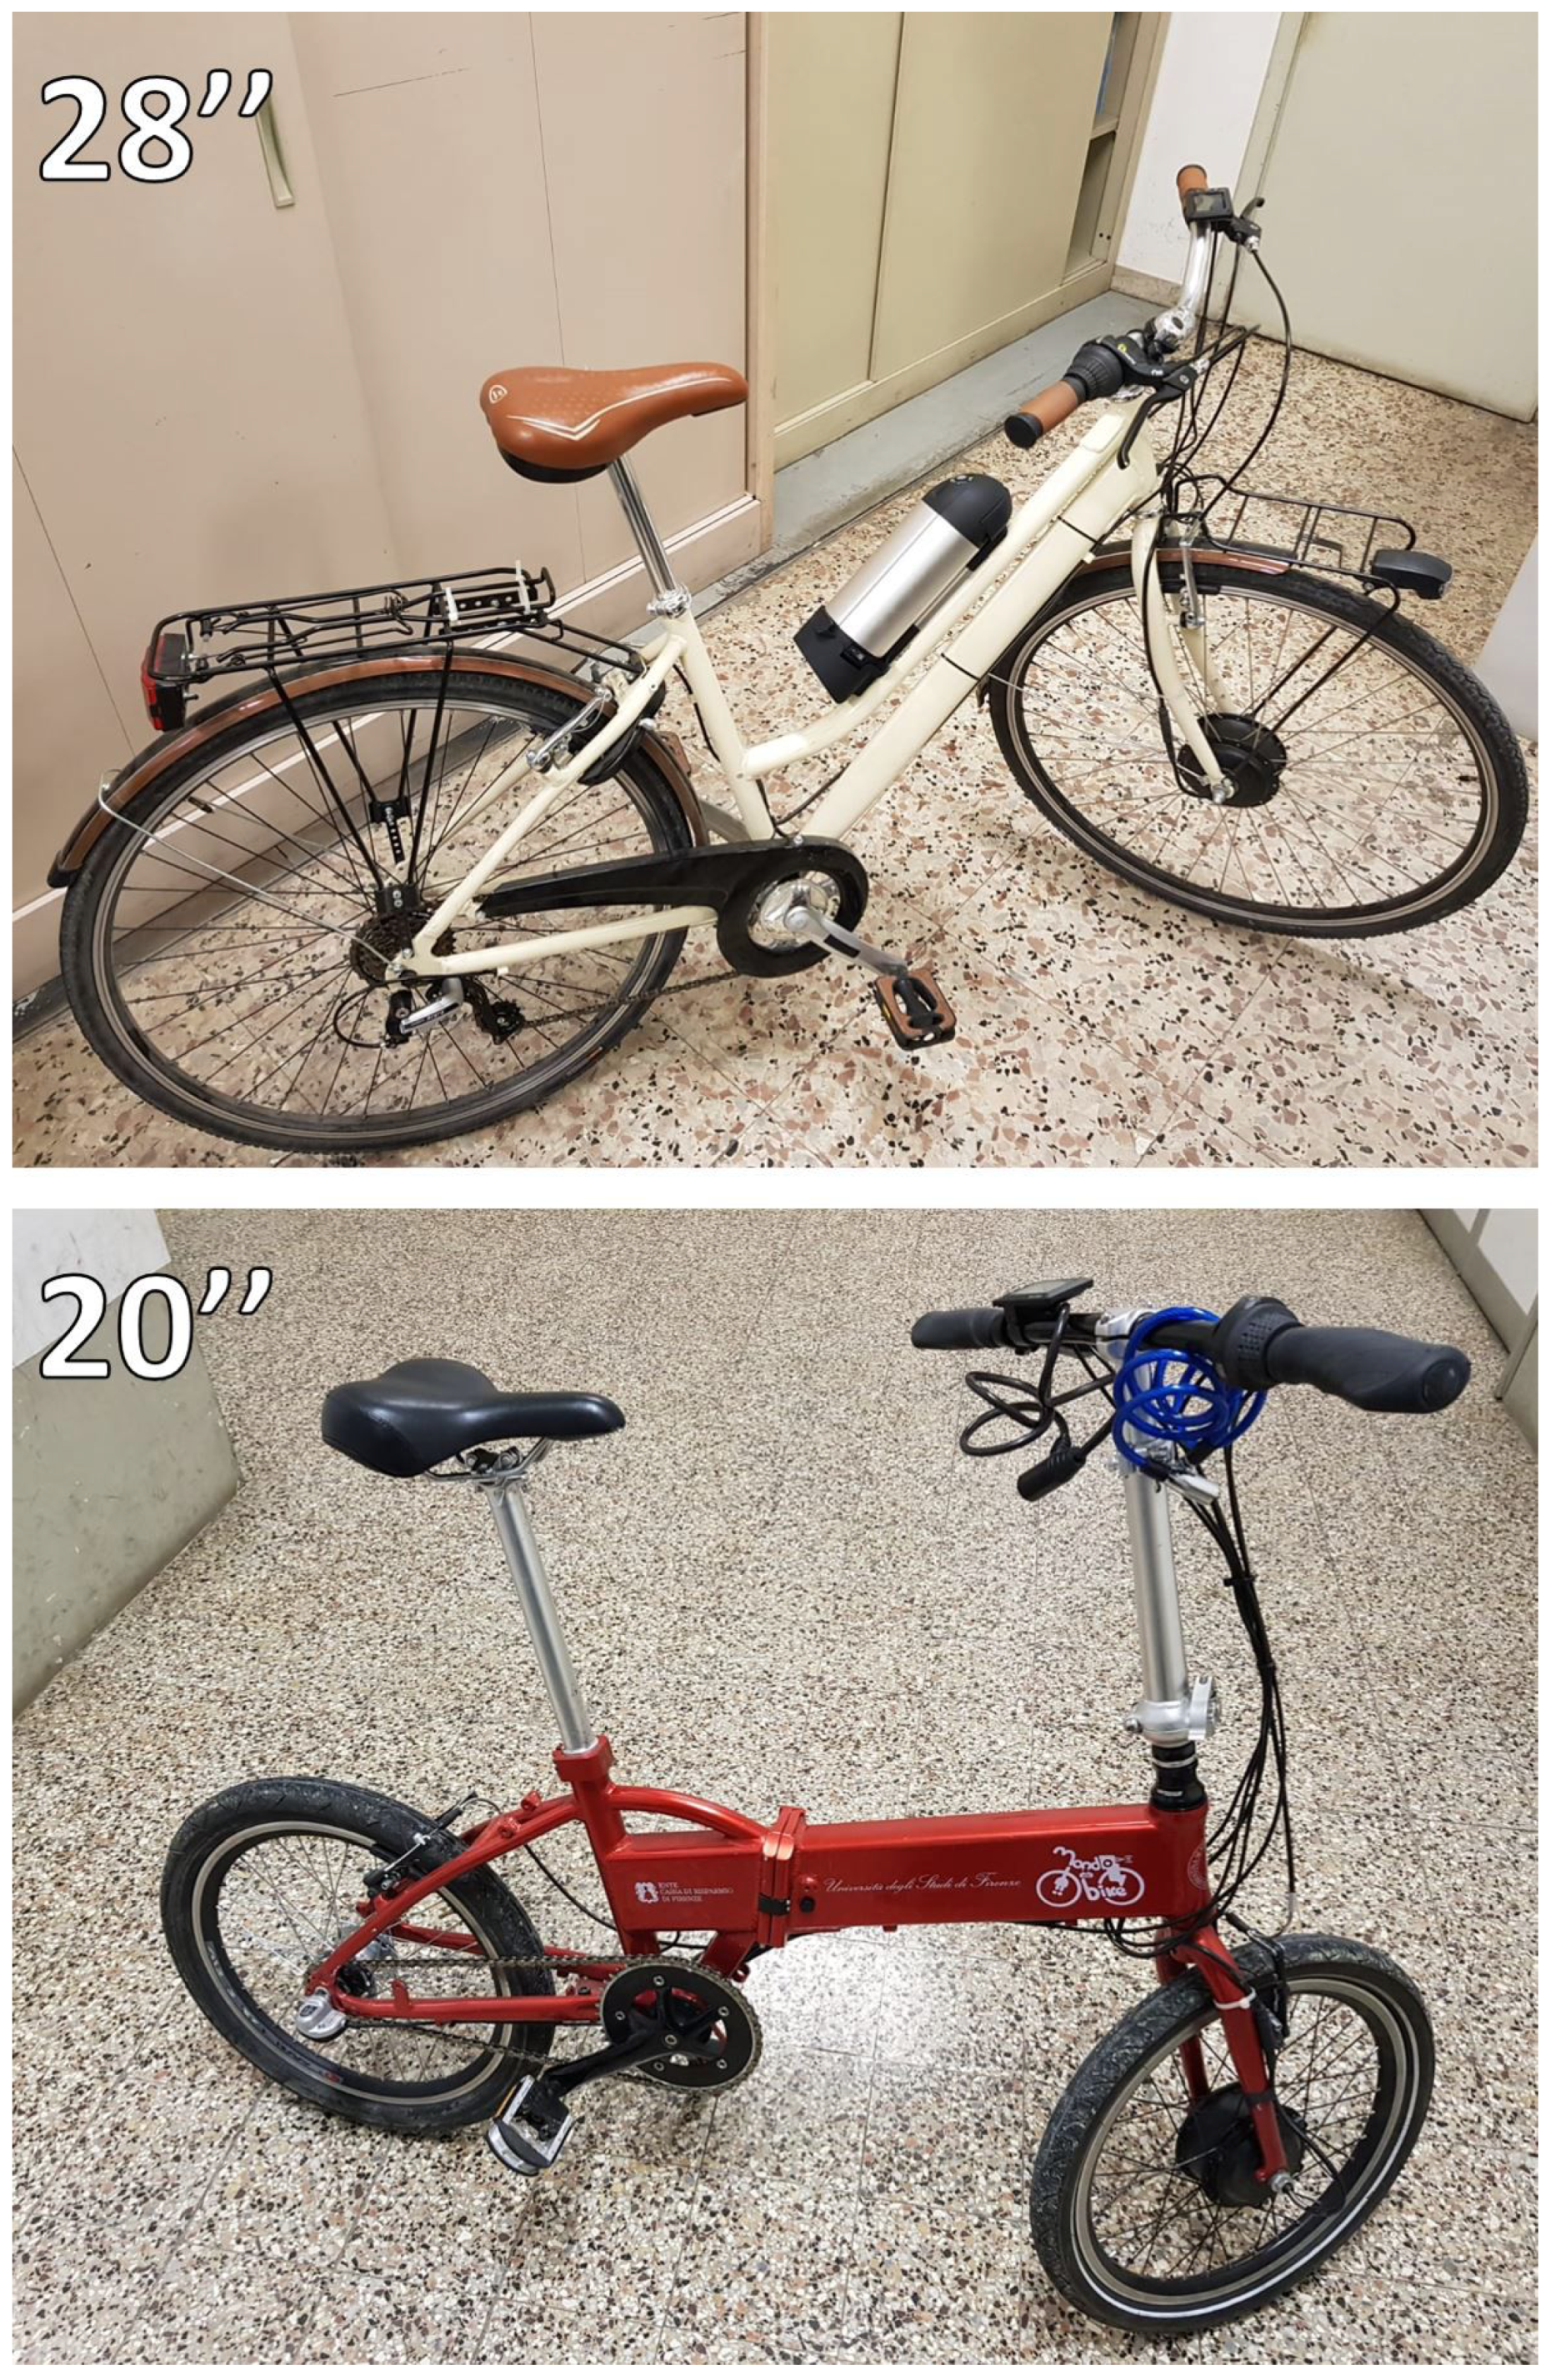
2.1. Closed-Circuit Tests

The six volunteers first performed closed-circuit tests. Closed-circuit tests are designed to simulate typical standing start and braking conditions, such as stops and restarts in correspondence to traffic lights, prescription signs (e.g., ‘STOP’ sign) or roundabouts. The aim is to develop reliable models that, on the basis of a series of parameters related to the characteristics of the rider and the vehicle, can provide information on the vehicle’s motion at different times for the specific event. For the monitoring of accelerations, speeds and travelled spaces, to be subsequently approximated by models, a smartphone equipped with accelerometers was employed. The tests were performed using two diverse types of e-bike with an equal number of assistance levels (five), but different in terms of wheel diameter (20 versus 28 ) and number of gears (three versus six). Assistance of the motor was, in both bikes, controlled by the movement of the wheel and not by the torque on the pedals and was supplied with a different intensity for each selected assistance level, up to a maximum speed of 25 km/h. This provides the basis with which one can derive results that are applicable to a broad range of e-bikes on the market. In fact, while no in-depth information is available in terms of the market penetration rate for these types of city bikes, wheels with a 28 diameter typically suit a bike frame for a person whose height ranges between 165 cm and 178 cm (https://www.feltracing.com/26-inch-bike-for-what-size-person/, 13 October 2021); since these lower and upper bounds correspond to the average heights for European women and men, respectively, it can be derived that these city bikes are extremely popular in Europe. The 20 diameter conversely corresponds to the typical wheel size of a folding bike, a compromise between compactness of the folded configuration and bike agility in the road environment [33]. The two e-bikes used for experimentation can be seen in Figure 1. The tests were carried out using e-bikes as they are exhaustive with respect to the case of e-scooters [7]: they do not require pedalling, and in these latter vehicles, the contribution related to the physical abilities of the user is missing; their gender becomes, for example, a less-relevant factor in the performance of the vehicle-rider assembly. In addition, e-bikes are characterized by methods of shifting/transmission of motion which can significantly affect their performance (as already noted, wheel size and selected gear). For this reason, it is unnecessary to investigate the behaviour of e-scooter riders in detail: referring to a generic e-scooter (refer to Section 3 for an example), it was measured that a speed value from 0 to 25 km/h was reached in about 40 m with the maximum assistance level (constant acceleration close to 0.6 m/s2).
The closed circuit consisted of a plane and straight road segment, closed to the road traffic. The test protocol was structured as follows:
  • At the beginning of the test, the personnel activated the G-sensor Logger© application on the smartphone rigidly connected to the e-bike;
  • The participant set the assistance level to ‘0’ and the first gear for the e-bike;
  • From the application home, the personnel activated the acquisition of the accelerometer data;
  • The participant accelerated as he/she would typically do up to a point 12 m away from the start, briefly maintained a constant speed and then hard braked, stopping at a point 20 m away from the start (these distance values are sufficient to clearly identify the different portions of an acquired signal that correspond to acceleration, constant speed and deceleration);
  • The personnel interrupted the acquisition of the accelerometer data, causing the automatic saving of the acquired signal;
  • The participant set the upper gear without changing the assistance level;
  • Steps 3–6 were repeated until the participant used the last available gear;
  • The assistance level was increased by a unit, repeating steps 3–7 until all gears and assistance levels were used.
The assistance level equal to ‘0’ accounts for the possibility that the battery state of charge is very low, so that the situation in which the bike is unelectrified can be simulated.
The collected acceleration data, outputted by the accelerometers inside the smartphone, were digitally filtered between 20 Hz and 100 Hz and integrated backwards to obtain speed and distance trends over time. The dependent variables of interest that, once known, provide an overall understanding of e-bike motion during the pre-impact phase, are in fact represented by:
  • Time required to reach the maximum speed (t);
  • Maximum reached speed ( V m a x );
  • Distance travelled to reach the maximum speed (s);
  • Average acceleration of the test ( a a v e );
  • Speed reached after 2, 4, 6, 8, 10 and 12 m from the start (V2m, V4m, V6m, V8m, V10m, V12m;
  • Acceleration at 2, 4, 6, 8, 10 and 12 m from the start (a2m, a4m, a6m, a8m, a10m, a12m).
In the present study, the influence of certain parameters on the variables defined above is analysed. Specifically, the parameters are represented by the number of gears, N m a x , of the e-bike, the selected gear, N, the assistance level employed, A, and the participant’s gender: the employed gear, as well as the assistance level, directly affects the acceleration of the vehicle (and its stability [34,35]); influence of the total number of gears, representing an indicator of the maximum performance achievable by the vehicle, cannot be neglected because the tested e-bikes differ in terms of N m a x value. Moreover, a variation of results was expected based on the cyclist’s gender, caused by differences in physical strength and weight. Finally, to make the results comparable between the two e-bikes, an additional parameter, S r e v , was introduced, indicating the distance the bike travels when the cyclist rotates the pedals of a complete reversal: this value depends both on the gear employed and on the wheel diameter.
Table 1 provides an overview of the statistical influence of distinct parameters on the variables of interest, which were obtained by means of the Minitab© statistical software: an analysis of variance (ANOVA) was performed on the data, with responses represented by the identified variables and factors given by G e n d e r (categorical factor), N, N m a x , A and S r e v (continuous factors); in the ANOVA, the variation between sample means and the variation between the samples were calculated for multiple response samples, namely those discriminated by a specific factor (e.g., response in the case of male riders and response for female riders). The ratio between these two variations (F-value) could be used to derive the p-value metrics, i.e., the probability that no significant difference exists among the considered samples. Overall, the statistical analysis tests show the hypothesis that each of the parameters has null influence on the variables holds: in the context of road safety-related studies [36], a p-value lower than 0.05 is considered sufficient to reject the hypothesis that the parameter (factor) has no influence on the variable (response). Hence, as can be seen from Table 1 and apart from a few isolated cases, all parameters are statistically influential on the variables of interest; that is, the performances of the rider–vehicle system depend on the characteristics of both elements. In particular, the S r e v parameter has a significant impact on the majority of variables: it is suitable for application during accident analysis and can be obtained for any type of e-bike on the market. Parameter A is one of major interest, since it significantly influences all variables which can be relevant for the investigation. Conversely, the influence of the user’s gender and N m a x is significant on all dependent variables except V m a x and s. As a whole, N represents the parameter that influences the minimum number of interesting variables.
Although statistical significance is functional for excluding from the analysis parameters which are uninfluential on the variables of interest, it does not provide information on the quality of the model that best approximates the variables’ experimental values; for this purpose, it is convenient to refer to the R2 of the best-fitting model for each variable. In the present work, linear regression models are obtained via the Minitab© statistical software which are based on the parameters G e n d e r , A, N m a x , N and S r e v (all statistically influential on the variables of interest). Unlike other types of modelling, the linear model features a high simplicity in the phases of both derivation and actual use during investigation; nevertheless, for the description of the variables of interest, the use of complex models is equally possible, which can more effectively and accurately capture the individual parameters’ contribution. Based on the assumption of a linear model, the relation between the input parameters and a generic output variable Y is hence expressed by the following law:
Y = C 0 + C 1 · N m a x + C 2 · N + C 3 · A + C 4 · S r e v
Table 2 lists the coefficients C 0 , C 1 , C 2 , C 3 , C 4 for the models, which can be directly employed when analysing the accident dynamics; C 0 is different according to the cyclist’s gender. R2 for each model of the variables of interest is also provided: since a value lower than 60% indicates insufficient fitting quality, the use of certain models in Table 2 is inadvisable. In particular, it is suggested not to use the models inherent to t, V m a x and s, as they are characterized by particularly low R2 values; the models of a a v e and a2m, with R2 slightly below 60%, can be used with caution. In all other cases, the variable is well described by a linear model, which can then be used as a reference during the analyses. As an example, the V12m model provides a difference of 6.70 km/h (6 × 0.31 = 1.86 m/s) between the degree of assistance ‘0’ and ‘6’; based on the same model, the speed is lower for women than for men by approximately 1.22 km/h (3.46 − 3.12 = 0.34 m/s). Overall, data regarding standing starts indicate that female behavioural and performance patterns are more oriented towards lower acceleration and speed, regardless of the analysed vehicle features.

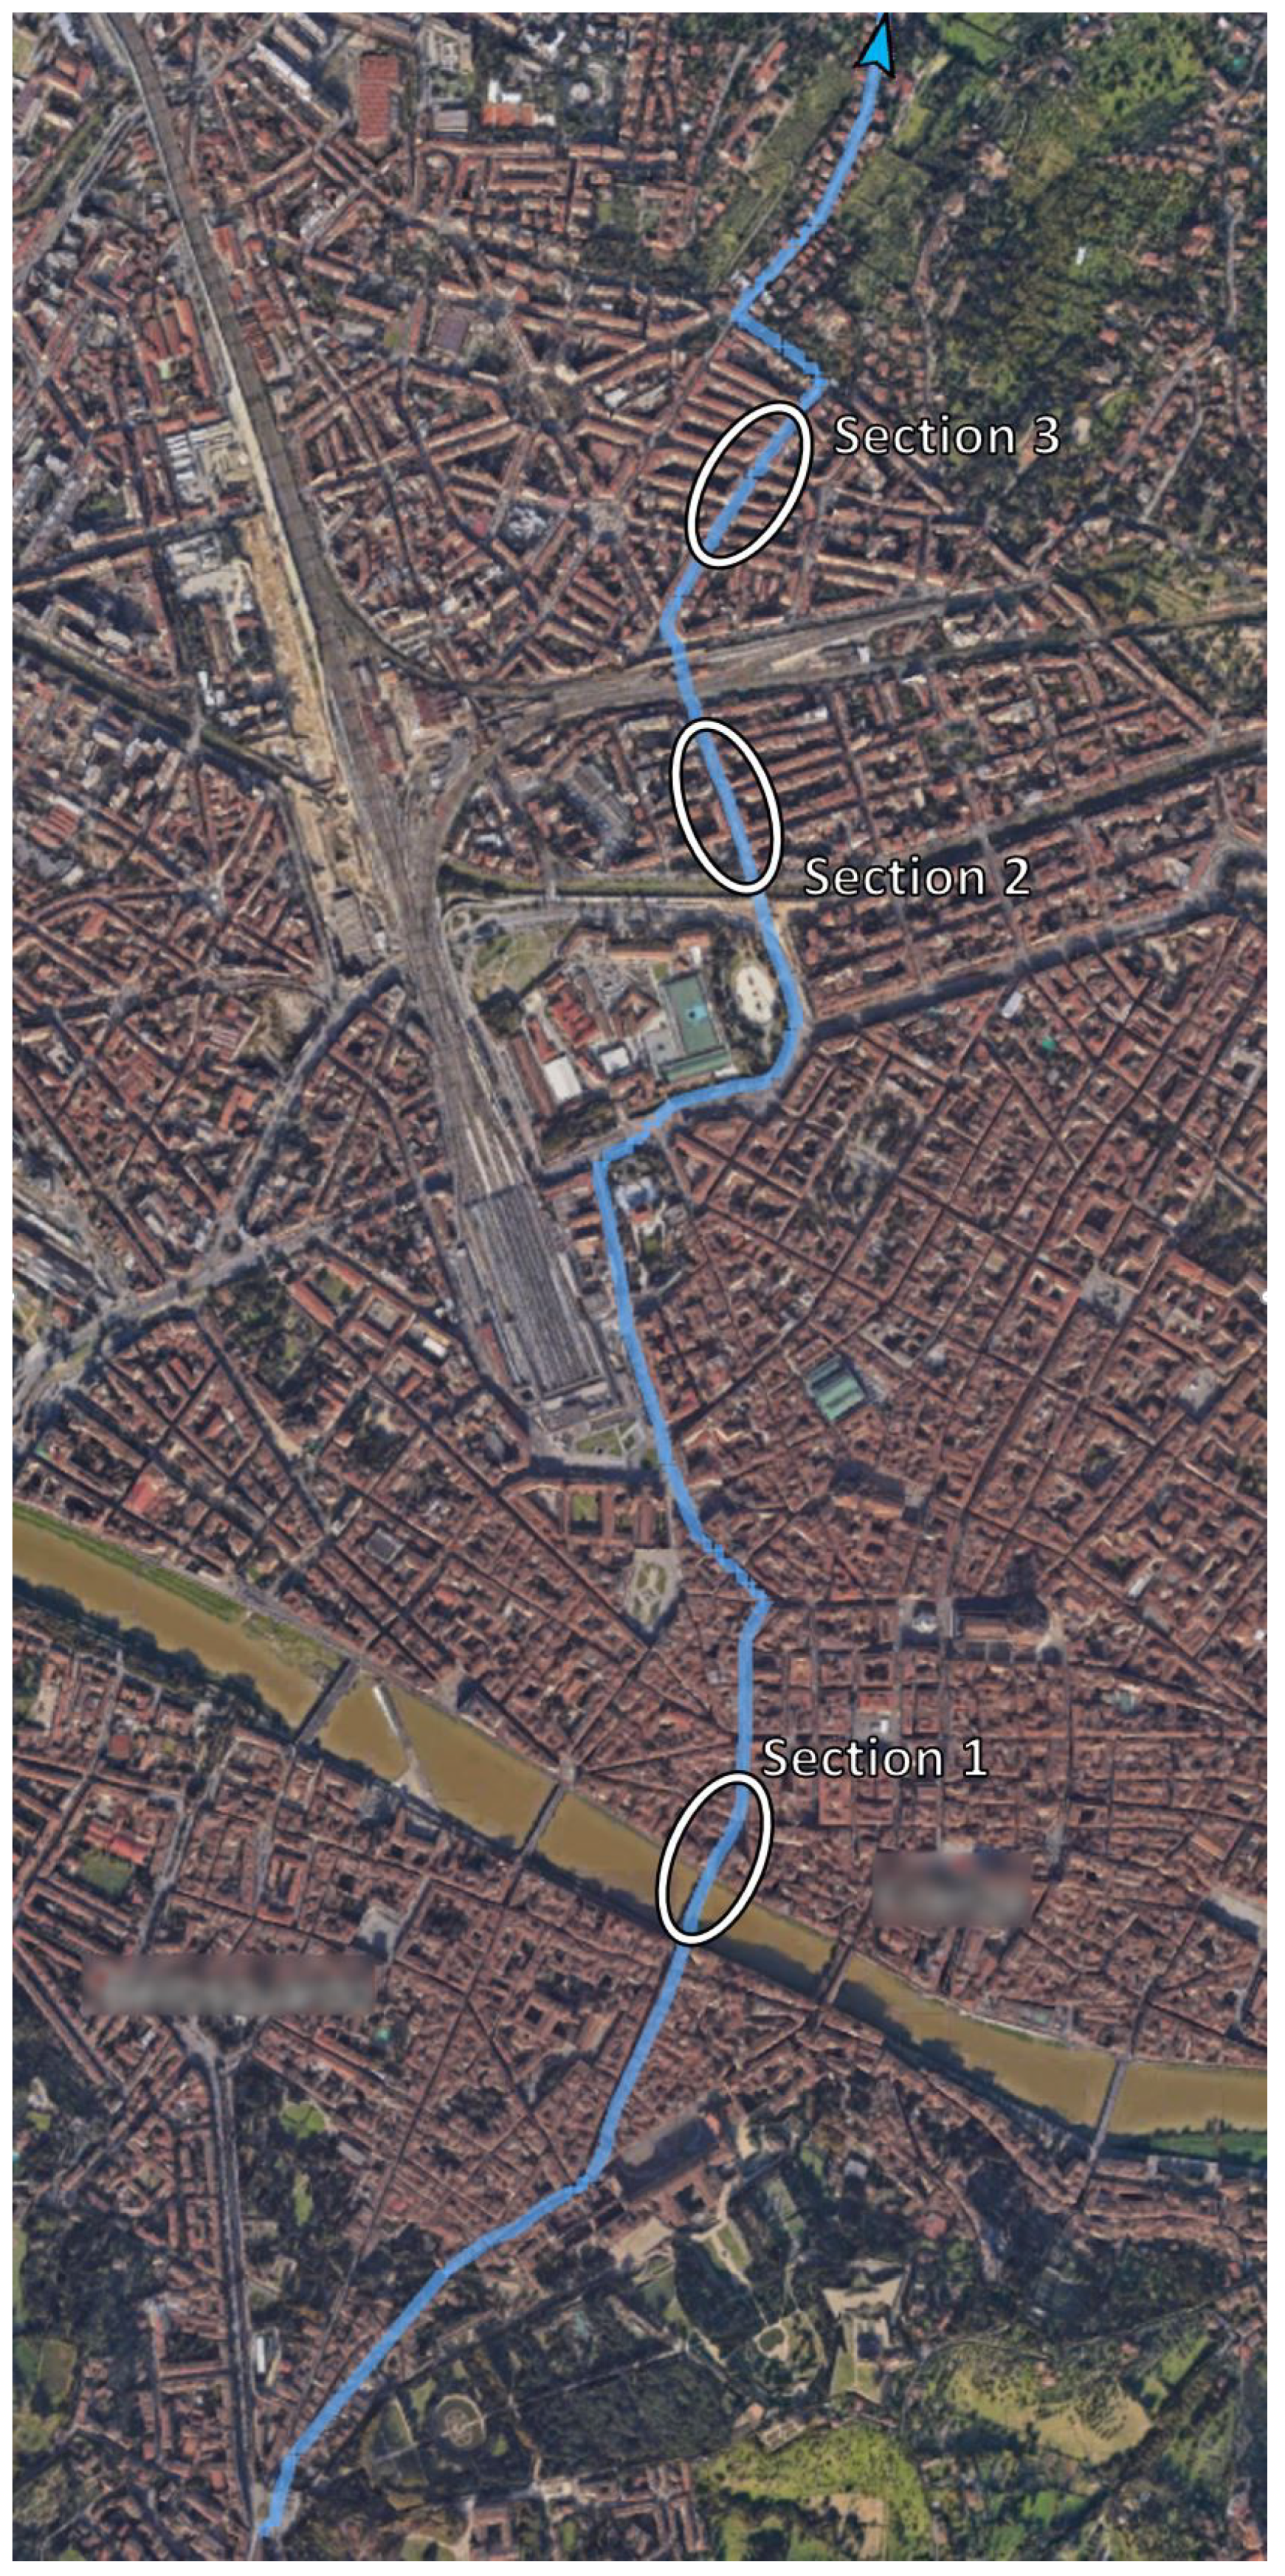
2.2. Real Road Tests

In this type of test, the same six participants for the closed-circuit campaign were asked to travel an urban route with intersections and roundabouts; there were no limitations in terms of travelling speed, and the route was about 5 km long. The participants, daily users of traditional bikes, replaced their usual vehicle with the 28 wheel e-bike of Figure 1; the results of behavioural tests on real roads are extendable to the use of e-scooters, thanks to significant similarities in the riding practices of such electric vehicles [7]. Figure 2 shows the considered track, as well as the sections in which the variables of interest are collected; these sections, about 200 m long each, include:
  • Section 1: road where the cyclist does not have the right of way (following European regulations);
  • Section 2: road where the cyclist has the right of way (following European regulations);
  • Section 3: road characterized by two consecutive roundabouts.
In a first test, the participant could select the degree of assistance to be used by varying it at will along the track; in a second test, the participant was required to set the assistance level to ‘0’ to simulate the use of a traditional bike. The participant, at the time of departure, started the acquisition of the GPS data through an app (Geo Tracker©) installed on the smartphone mounted on the vehicle.
The variables of interest are in this case represented by the average speed, V a v e , and the maximum speed, V M , in the considered sections. These values allow one to hypothesize a range of variation for the speed of the vehicle; they can be useful for the investigation of accidents that occur on roads where the rider is required to modulate the gait based on the encountered criticalities, rather than to stop (for this latter condition, results from closed-circuit tests apply). Table 3 summarizes the test results in terms of V a v e and V M in case assistance is employed or excluded, highlighting how the practice of equating a traditional bike with an electric bike is inadequate when analysing the accident dynamics. In fact, for various sections, V a v e becomes higher if an e-bike is employed instead of a traditional bike, with an increase from 19% in Section 1 to 36% in Section 3. This result is compatible with the literature, as can be deduced, for example, from a comparison with the data by Langford et al. [37] or by Schleinitz et al. [38]; the added contribution of the present work consists of a more granular view of the adopted speed, which is a given value according to the type of road scenario tackled by the rider. Specifically, the cyclist tends to travel at a higher average speed on a road where they have right of way than in other sections. V M , conversely, only significantly varies between e-bikes and traditional bikes in Section 3: the higher acceleration offered by the electric motor allows the cyclist, once assured the intersection is clear from additional vehicles, to easily recover speed. It must be also considered that accidents in some road scenarios are more frequent in the case of an e-bike, such as those where the rider has the right of way [26]. The G e n d e r parameter is not included in this latter analysis, as its influence on V a v e and V M results as statistically non-significant for all sections via Minitab© analysis (p-value > 0.05). From the safety policy perspective, independently of the power supply implementation onboard the vehicle, Table 3 clearly highlights that the introduction of roundabouts in a road with right of way favours a relevant decrease in both the average and maximum speed of riders. This solution could help in minimizing the risk of microvehicle-related serious accidents in dangerous road scenarios, mostly for unelectrified vehicles but also for electric alternatives.

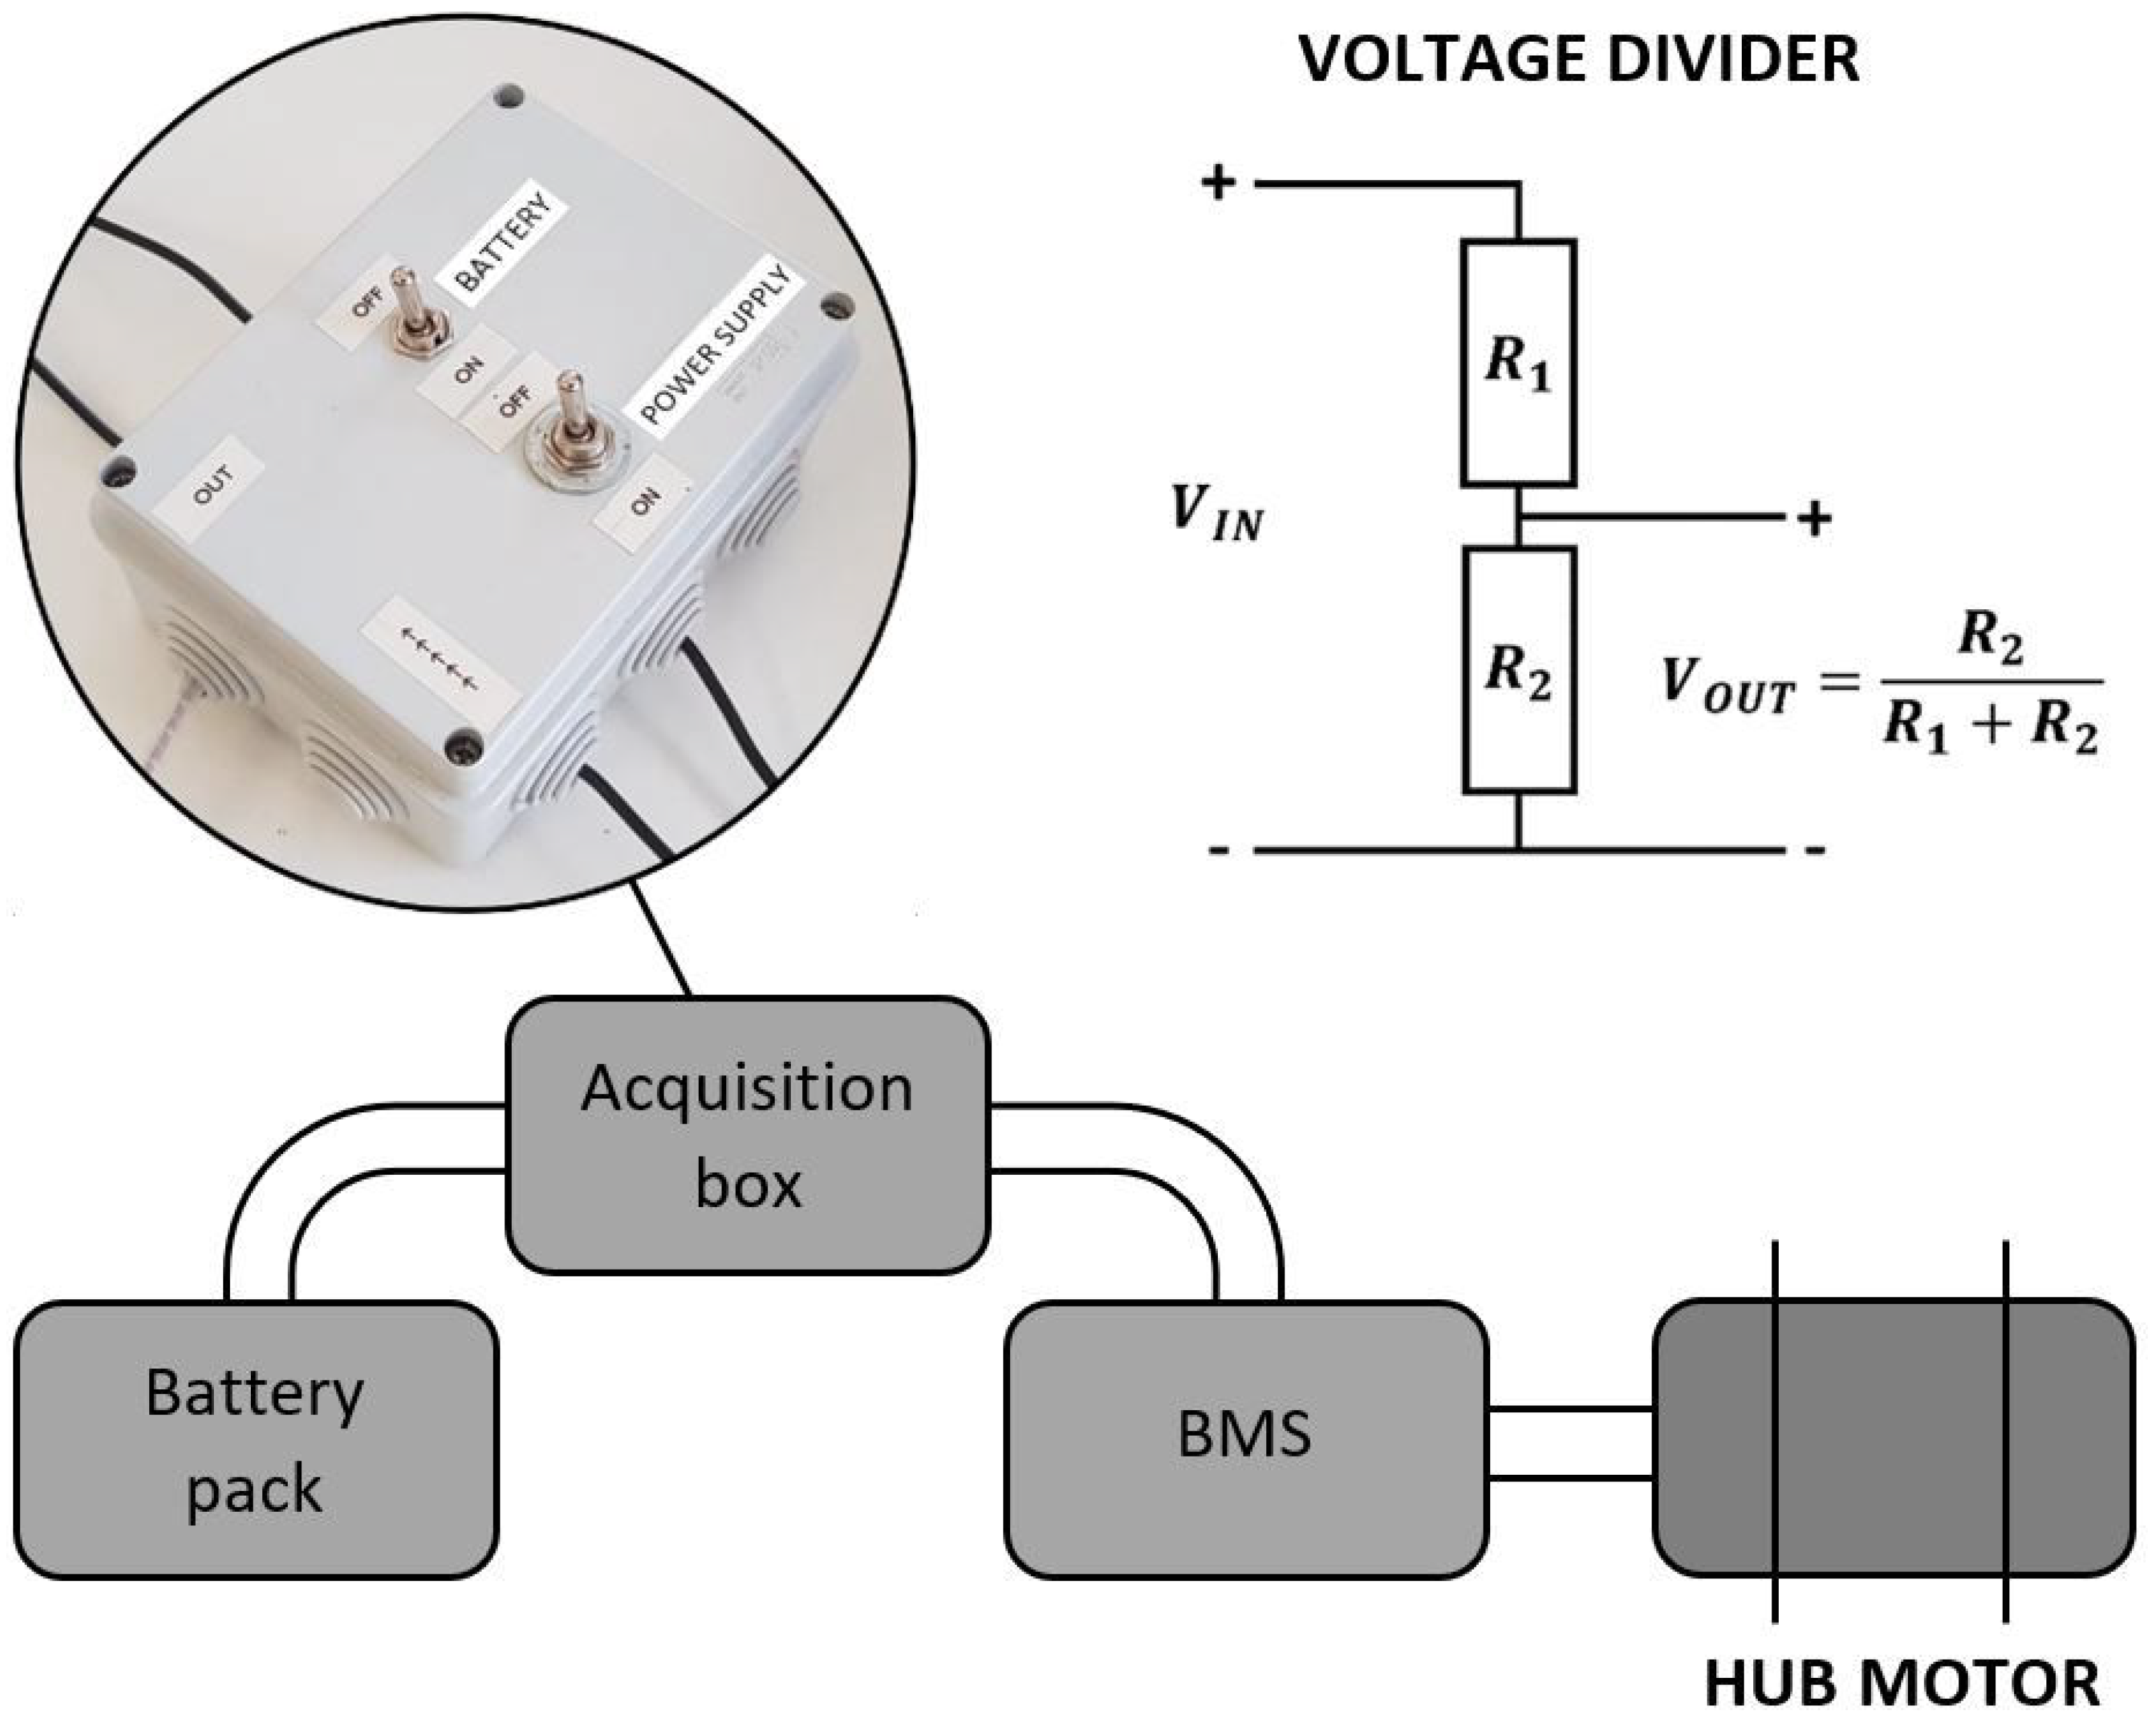
3. Verification of Electric Microvehicles’ Compliance to International Regulations

The highlighted results represent a fundamental contribution to the state of the art, but only as long as vehicles fulfilling current regulations are considered. If the vehicle does not comply with such regulations, the performance of the rider–vehicle system could significantly vary. This may lead to inconsistent and incoherent conclusions regarding the behaviour adopted by the rider in correspondence to a critical road scenario.
According to Regulation 168/2013 of the European Commission, the type-approval process of two-wheeled vehicles does not apply to ‘… pedal cycles with pedal assistance which are equipped with an auxiliary electric motor having a maximum continuous rated power of less than or equal to 250 W, where the output of the motor is cut off when the cyclist stops pedalling and is otherwise progressively reduced and finally cut off before the vehicle speed reaches 25 km/h’. This gave rise to a category of e-bikes (Figure 3a), with maximum continuous power of 250 W and interruption of assistance after 25 km/h; if the motor exceeds this power limit, if it is activated for speeds higher than 25 km/h or when the cyclist is not pedalling, the vehicle does not fall into the category of e-bikes: as it is similar to a moped, vehicle insurance, license holding, and helmet wearing for the rider are mandatory. Similar rules apply in Israel [22], the United States (although there are no federal laws on the topic [3,39]) and China [23]. With regard to e-scooters (Figure 3b), the regulation of each country aims at performing pilot studies on road traffic and safety, although there are no globally recognized guidelines; for example, in Italy, the rules are inspired by those on e-bikes, where the key difference lies in the maximum assistance power that can be delivered by the motor: 500 W instead of 250 W. Conversely, in Denmark, the same rules of e-bike riding apply to e-scooters [21]. These differences in how e-scooters or e-bikes are treated internationally is also the chief reason why a non-negligible portion of the circulating fleet is constituted of non-compliant vehicles, introduced on a national market but produced and type-approved abroad.
An investigation to verify compliance to regulations relating to electric micro-mobility vehicles must, hence, generally provide: (a) evidence of the interruption in the assistance by the electric motor when a speed of 25 km/h is exceeded (or the interruption of pedalling in the case of e-bikes), (b) verification of the maximum continuous nominal power delivered by the motor. Explicitly, the motor of an electric micro-mobility vehicle can therefore deliver a peak power above the maximum allowed, but only for a short time period. Regarding point (a), derivation of the speed at which the motor interrupts the assistance is not particularly critical: when pedalling an e-bike, the user easily notices the power cut off because of an increase in resistance to movement; for an e-scooter, using maximum assistance, the rider surely reaches a maximum and constant speed beyond which the vehicle cannot be pushed. The speed associated with a reduction in assistance can be assessed in both types of vehicle without modifications to the apparatus, for example, using traditional GPS devices whose degree of accuracy is sufficient for data retrieval.
The main criticalities are related to point (b), i.e., the measurement of the rated power delivered by the motor, P m o t o r : monitoring output signals from the motor would be the most convenient way to verify compliance in terms of rated power; this, however, involves the partial disassembly of the seized vehicle. It is therefore easier to measure the power absorbed by the battery which, because of the performance of both the motor and the transmission, is different from the motor power.
The power absorbed by the battery, P b a t t e r y , can be estimated by measuring the voltage, V, and current, I, outputted by the battery pack ( P b a t t e r y = V·I) at the charging port. Figure 4 represents a scheme of the measurement apparatus required to monitor these quantities; specifically, the ‘acquisition box’ element must consist of a current meter and a voltage divider. The latter is required since tools such as data acquisition cards do not typically exceed 10 V of range; based on the maximum voltage associated with the batteries V I N that is expected to be measured (usually tens of volts), R 1 and R 2 resistors can be selected to read a V O U T output voltage compatible with the range of the card. The current meter can be employed as-is, without further modification.
As an example, the acquisition box shown in Figure 4 was specially developed; the current meter is fed by an external power supply connected to the lower cables (‘POWER SUPPLY’). The current meter is a 50 A HAIS 50 LEM (powered by an external 12 V and 1.2 Ah battery), while the voltage divider is composed of R 1 and R 2 resistors of 2 k Ω and 10 k Ω , respectively. This apparatus allows for the measuring in output (side cable ‘OUT’) the evolution of voltage and current over time provided by the battery (connected to the upper cables—‘BATTERY’); because of the decrease in voltage (switching from V I N to V O U T ) required to enable the reading process through an NI DAQ card (range 0 ÷ 10 V), the acquired voltage must then be multiplied by the reduction factor used to obtain the actual voltage value. Figure 5 illustrates an example of voltage and current evolution for a moving e-bike, monitored by the acquisition box in Figure 4.
Once the trends of V and I over time are known (and of P b a t t e r y as a consequence), the following rule provides the value of P m o t o r :
P m o t o r = P b a t t e r y · μ 1 · μ 2
The coefficients μ 1 and μ 2 take into account the efficiency of the Battery Monitoring System (BMS or control unit) and the motor, respectively, which are depicted in the scheme of Figure 4. Assuming precautionary values for μ 1 and μ 2 of 0.95 and 0.7, respectively, (values of 0.8 are more realistic for μ 2 ), the value of P m o t o r can be indirectly retrieved from the battery charging port. If the derived value of P m o t o r exceeds the threshold of 250 W for the e-bike ‘continuously’, even considering the precautionary efficiency values reported, it is possible to state the non-compliance to the electric micro-mobility vehicle class. In the case of e-scooters, Equation (2) still applies but the admissible value for P m o t o r can also be higher (up to 500 W in Italy). In particular, it is suggested to monitor the power in the most stressful conditions for the battery, for example along uphill routes.

4. Limitations

While several interesting highlights emerge from the closed-circuit and real road tests, the number of participants considered in the experiments is limited. While it has been observed that a campaign involving six volunteers is sufficient to determine behavioural patterns of a population [25], future studies should increase this number to fully assess the effects on the user’s behaviour caused by age category, gender and riding experience. Additionally, experiments were performed on European roads, with specific traffic rules that do not necessarily extend outside of the continent; as a consequence, rider speed and acceleration habits in non-European countries could significantly differ from those previously reported and would be worthy of investigation in future analyses.
In terms of the compliance of microvehicles to international regulations, the literature survey reported in the present work demonstrates that a common direction has been undertaken by different countries. However, the growing interest towards the issue of microvehicle-related accidents is leading to a fast evolution of such phenomena. For instance, the German government has recently established that electric-kick scooters should implement two independent braking mechanisms, capable of together providing a maximum deceleration of at least 3.5 m/s2. This shows that, in some countries, additional tools will be required in the near future to verify a vehicle’s aptness for circulation; however, the validity and usefulness of the approach highlighted in Section 3 will still hold.

5. Conclusions

The three performed studies provide data from which relevant information can be derived for analyses and reporting activities in accidents involving electric micro-mobility vehicles; to be specific, it will be possible to:
  • Outline a precise scenario regarding accident dynamics: real road tests carried out by e-bikes were performed to define the speed and behaviours with which a rider tackles specific conditions (roads with/without right of way, roundabouts, standing start and stop); such in-depth highlights can be used to increase road safety in a ‘what if’ approach: hypothesizing appropriate modifications to vehicles, infrastructure, and viability, alternatives can be proposed to lower the users’ involvement in critical scenarios. Since campaigns with null assistance for the e-bike were performed, these considerations also apply to traditional bike-related accidents. Analytical relations have been provided, which allow for calculation of acceleration and speed in specific points of a trajectory; this enables one to observe the event dynamics from the user’s perspective, as a function of their gender, employed assistance level and gear, etc. In standing start conditions, data show that women tend to adopt speeds and accelerations which are significantly lower compared to men. In real-road scenarios, the cyclist tends to travel at a higher speed in correspondence to roads with the right of way; additionally, the highest differences between a traditional bike and an e-bike are observed in correspondence to roundabouts where the rider is required to modulate their gait rather than stopping, based on the occurring hazards. Conversely, because of the greater simplicity of e-scooters, no specific testing campaign has been carried out for the performance identification of this type of vehicle: the behaviour of riders on real roads is comparable to the case of e-bike employment; it is also worth noting that, in cases of standing start and the maximum degree of assistance, a constant acceleration close to 0.6 m/s2 can be reasonably assumed for e-scooters.
  • Assess the compliance of the motor assistance system assembly to the various regulations on the topic (European or not), without the need to directly access the motor. This enables one to highlight the possible inadequacy of the vehicle that would prevent its circulation by a simple, effective system which can be used regardless of the seizing conditions of the vehicle; in particular, it is suggested to monitor the power in the most stressful conditions for the battery, for example, along uphill roads. If the vehicle does not comply with the applicable regulations, the rider’s risky behaviour alone cannot be indicated as the main factor contributing to the accident; up to now, no recognized method was available to identify non-compliant vehicles. Because of regulation differences among nations, a declaration by the manufacturer is not always a sufficiently reliable datum.
The results highlighted in the present work are meant to represent a guideline for the prospective assessment of riders’ behaviour in accident events, based on typically observed behavioural patterns; these outcomes consequently widen the possibilities of information retrieval regarding risky behaviours, to the end of piloting and strengthening safety policies that target electric micro-mobility vehicles (e.g., better road design in terms of infrastructure, signals, and viability). As a complement, the proposed procedure for the a posteriori assessment of vehicles’ type approval state can aid in properly recognizing the scale of the non-compliance phenomenon, far too often underestimated.

Author Contributions

Conceptualization, M.-S.G. and D.V.; methodology, G.Z.; software, M.-S.G.; formal analysis, D.V. and K.D.; investigation, G.Z. and M.-S.G.; resources, D.V.; data curation, M.-S.G.; writing—original draft preparation, M.-S.G. and D.V.; writing—review and editing, K.D. and G.Z.; visualization, M.-S.G.; supervision, D.V.; project administration, D.V.; funding acquisition, D.V. All authors have read and agreed to the published version of the manuscript.

Funding

This research was funded by the Italian EVU Country Group (http://www.evuonline.org/, 13 October 2021).

Institutional Review Board Statement

Ethical review and approval were waived for this study because the participants were not exposed to additional risk compared to routine activities.

Informed Consent Statement

Informed consent was obtained from all subjects involved in the study.

Conflicts of Interest

The authors declare no conflict of interest.

References

  1. Stenner, H.T.; Boyen, J.; Hein, M.; Protte, G.; Kück, M.; Finkel, A.; Hanke, A.A.; Tegtbur, U. Everyday Pedelec Use and Its Effect on Meeting Physical Activity Guidelines. Int. J. Environ. Res. Public Health 2020, 17, 4807. [Google Scholar] [CrossRef]
  2. Fyhri, A.; Beate Sundfør, H. Do People Who Buy E-Bikes Cycle More? Transp. Res. Part D Transp. Environ. 2020, 86, 102422. [Google Scholar] [CrossRef]
  3. McQueen, M.; MacArthur, J.; Cherry, C. The E-Bike Potential: Estimating Regional e-Bike Impacts on Greenhouse Gas Emissions. Transp. Res. Part D Transp. Environ. 2020, 87, 102482. [Google Scholar] [CrossRef]
  4. Laa, B.; Leth, U. Survey of E-Scooter Users in Vienna: Who They Are and How They Ride. J. Transp. Geogr. 2020, 89, 102874. [Google Scholar] [CrossRef]
  5. Sanders, R.L.; Branion-Calles, M.; Nelson, T.A. To Scoot or Not to Scoot: Findings from a Recent Survey about the Benefits and Barriers of Using E-Scooters for Riders and Non-Riders. Transp. Res. Part A Policy Pract. 2020, 139, 217–227. [Google Scholar] [CrossRef]
  6. Petzoldt, T.; Schleinitz, K.; Heilmann, S.; Gehlert, T. Traffic Conflicts and Their Contextual Factors When Riding Conventional vs. Electric Bicycles. Transp. Res. Part F Traffic Psychol. Behav. 2017, 46, 477–490. [Google Scholar] [CrossRef]
  7. Rodon, C.; Ragot-Court, I. Assessment of Risky Behaviours among E-Bike Users: A Comparative Study in Shanghai. Transp. Res. Interdiscip. Perspect. 2019, 2, 100042. [Google Scholar] [CrossRef]
  8. Haustein, S.; Møller, M. E-Bike Safety: Individual-Level Factors and Incident Characteristics. J. Transp. Health 2016, 3, 386–394. [Google Scholar] [CrossRef]
  9. Ma, C.; Yang, D.; Zhou, J.; Feng, Z.; Yuan, Q. Risk Riding Behaviors of Urban E-Bikes: A Literature Review. Int. J. Environ. Res. Public Health 2019, 16, 2308. [Google Scholar] [CrossRef]
  10. Zagorskas, J.; Burinskienė, M. Challenges Caused by Increased Use of E-Powered Personal Mobility Vehicles in European Cities. Sustainability 2019, 12, 273. [Google Scholar] [CrossRef]
  11. Dozza, M.; Bianchi Piccinini, G.F.; Werneke, J. Using Naturalistic Data to Assess E-Cyclist Behavior. Transp. Res. Part F Traffic Psychol. Behav. 2016, 41, 217–226. [Google Scholar] [CrossRef]
  12. Cherry, C.R.; Yang, H.; Jones, L.R.; He, M. Dynamics of Electric Bike Ownership and Use in Kunming, China. Transp. Policy 2016, 45, 127–135. [Google Scholar] [CrossRef]
  13. Bai, L.; Liu, P.; Chen, Y.; Zhang, X.; Wang, W. Comparative Analysis of the Safety Effects of Electric Bikes at Signalized Intersections. Transp. Res. Part D Transp. Environ. 2013, 20, 48–54. [Google Scholar] [CrossRef]
  14. Cairns, S.; Behrendt, F.; Raffo, D.; Beaumont, C.; Kiefer, C. Electrically-Assisted Bikes: Potential Impacts on Travel Behaviour. Transp. Res. Part A Policy Pract. 2017, 103, 327–342. [Google Scholar] [CrossRef]
  15. Liu, L.; Suzuki, T. Quantifying E-Bike Applicability by Comparing Travel Time and Physical Energy Expenditure: A Case Study of Japanese Cities. J. Transp. Health 2019, 13, 150–163. [Google Scholar] [CrossRef]
  16. Langford, B.C.; Cherry, C.R.; Bassett, D.R.; Fitzhugh, E.C.; Dhakal, N. Comparing Physical Activity of Pedal-Assist Electric Bikes with Walking and Conventional Bicycles. J. Transp. Health 2017, 6, 463–473. [Google Scholar] [CrossRef]
  17. Eccarius, T.; Lu, C.C. Adoption Intentions for Micro-Mobility—Insights from Electric Scooter Sharing in Taiwan. Transp. Res. Part D Transp. Environ. 2020, 84, 102327. [Google Scholar] [CrossRef]
  18. Ruhrort, L. Reassessing the Role of Shared Mobility Services in a Transport Transition: Can They Contribute the Rise of an Alternative Socio-Technical Regime of Mobility? Sustainability 2020, 12, 8253. [Google Scholar] [CrossRef]
  19. Schleinitz, K.; Petzoldt, T.; Krems, J.F.; Gehlert, T. The Influence of Speed, Cyclists’ Age, Pedaling Frequency, and Observer Age on Observers’ Time to Arrival Judgments of Approaching Bicycles and e-Bikes. Accid. Anal. Prev. 2016, 92, 113–121. [Google Scholar] [CrossRef] [PubMed]
  20. Vlakveld, W.P.; Twisk, D.; Christoph, M.; Boele, M.; Sikkema, R.; Remy, R.; Schwab, A.L. Speed Choice and Mental Workload of Elderly Cyclists on E-Bikes in Simple and Complex Traffic Situations: A Field Experiment. Accid. Anal. Prev. 2015, 74, 97–106. [Google Scholar] [CrossRef] [PubMed]
  21. Blomberg, S.N.F.; Rosenkrantz, O.C.M.; Lippert, F.; Collatz Christensen, H. Injury from Electric Scooters in Copenhagen: A Retrospective Cohort Study. BMJ Open 2019, 9, e033988. [Google Scholar] [CrossRef]
  22. Siman-Tov, M.; Radomislensky, I.; Israel Trauma Group; Peleg, K. The Casualties from Electric Bike and Motorized Scooter Road Accidents. Traffic Inj. Prev. 2017, 18, 318–323. [Google Scholar] [CrossRef] [PubMed]
  23. Wang, Z.; Neitzel, R.L.; Xue, X.; Zheng, W.; Jiang, G. Awareness, Riding Behaviors, and Legislative Attitudes toward Electric Bikes among Two Types of Road Users: An Investigation in Tianjin, a Municipality in China. Traffic Inj. Prev. 2019, 20, 72–78. [Google Scholar] [CrossRef] [PubMed]
  24. Wang, T.; Xie, S.; Ye, X.; Yan, X.; Chen, J.; Li, W. Analyzing E-Bikers’ Risky Riding Behaviors, Safety Attitudes, Risk Perception, and Riding Confidence with the Structural Equation Model. Int. J. Environ. Res. Public Health 2020, 17, 4763. [Google Scholar] [CrossRef] [PubMed]
  25. Huertas-Leyva, P.; Dozza, M.; Baldanzini, N. E-Bikers’ Braking Behavior: Results from a Naturalistic Cycling Study. Traffic Inj. Prev. 2019, 20, 62–67. [Google Scholar] [CrossRef]
  26. Otte, D.; Facius, T. Accident Typology Comparisons between Pedelecs and Conventional Bicycles. J. Transp. Saf. Secur. 2020, 12, 116–135. [Google Scholar] [CrossRef]
  27. Lin, Z.; Fan, W.D. Cyclist Injury Severity Analysis with Mixed-Logit Models at Intersections and Nonintersection Locations. J. Transp. Saf. Secur. 2021, 13, 223–245. [Google Scholar] [CrossRef]
  28. Kovácsová, N.; Vlakveld, W.; de Winter, J.; Hagenzieker, M. PC-Based Hazard Anticipation Training for Experienced Cyclists: Design and Evaluation. Saf. Sci. 2020, 123, 104561. [Google Scholar] [CrossRef]
  29. Serge, A.; Quiroz Montoya, J.; Alonso, F.; Montoro, L. Socioeconomic status, health and lifestyle settings as psychosocial risk factors for road crashes in young people: Assessing the Colombian case. Int. J. Environ. Res. Public Health 2021, 18, 886. [Google Scholar] [CrossRef]
  30. Han, I. Car Speed Estimation Based on Cross-Ratio Using Video Data of Car-Mounted Camera (Black Box). Forensic Sci. Int. 2016, 269, 89–96. [Google Scholar] [CrossRef]
  31. Vangi, D.; Cialdai, C.; Gulino, M.S. Vehicle Stiffness Assessment for Energy Loss Evaluation in Vehicle Impacts. Forensic Sci. Int. 2019, 300, 136–144. [Google Scholar] [CrossRef] [PubMed]
  32. Costa, L.R.; Rauen, M.S.; Fronza, A.B. Car Speed Estimation Based on Image Scale Factor. Forensic Sci. Int. 2020, 310, 110229. [Google Scholar] [CrossRef] [PubMed]
  33. Vervisch, T.; Christiaens, Y.; Detand, J. The design of a composite folding bike to improve the user experience of commuters. In MATEC Web of Conferences; EDP Sciences: Les Ulis, France, 2018; Volume 167, p. 01001. [Google Scholar]
  34. Doria, A.; Tognazzo, M. The Influence of the Dynamic Response of the Rider’s Body on the Open-Loop Stability of a Bicycle. Proc. Inst. Mech. Eng. Part C J. Mech. Eng. Sci. 2014, 228, 3116–3132. [Google Scholar] [CrossRef]
  35. Sharp, R.S. Optimal Stabilization and Path-Following Controls for a Bicycle. Proc. Inst. Mech. Eng. Part C J. Mech. Eng. Sci. 2007, 221, 415–427. [Google Scholar] [CrossRef]
  36. Gulino, M.S.; Gangi, L.D.; Sortino, A.; Vangi, D. Injury risk assessment based on pre-crash variables: The role of closing velocity and impact eccentricity. Accid. Anal. Prev. 2021, 150, 105864. [Google Scholar] [CrossRef]
  37. Langford, B.C.; Chen, J.; Cherry, C.R. Risky Riding: Naturalistic Methods Comparing Safety Behavior from Conventional Bicycle Riders and Electric Bike Riders. Accid. Anal. Prev. 2015, 82, 220–226. [Google Scholar] [CrossRef]
  38. Schleinitz, K.; Petzoldt, T.; Franke-Bartholdt, L.; Krems, J.; Gehlert, T. The German Naturalistic Cycling Study—Comparing Cycling Speed of Riders of Different e-Bikes and Conventional Bicycles. Saf. Sci. 2017, 92, 290–297. [Google Scholar] [CrossRef]
  39. Todd, J.; Krauss, D.; Zimmermann, J.; Dunning, A. Behavior of Electric Scooter Operators in Naturalistic Environments. In Proceedings of the WCX SAE World Congress Experience, Detroit, MI, USA, 9–11 April 2019. No. 2019-01-1007. [Google Scholar] [CrossRef]
Figure 1. The e-bikes employed for the experimental campaigns.
Designs 05 00066 g001
Figure 2. Considered track and associated sections of acquisition for the variables of interest (visualization on Google Earth©).
Designs 05 00066 g002
Figure 3. Examples of an e-bike (a) and e-scooter (b) which can be tested by the proposed procedure.
Designs 05 00066 g003
Figure 4. Developed acquisition box and instrumentation scheme for monitoring voltage/current outputted by the battery pack.
Designs 05 00066 g004
Figure 5. Monitoring example of voltage (above) and current (below) provided by the battery pack of an e-bike compliant to the European Regulation No. 168/2013.
Designs 05 00066 g005
Table 1. Statistical influence of the parameters, expressed by the p-value, on the variables of interest (* indicates non-significance of the parameter).
Parameterp-Value
GenderNmaxNASrev
t0.000.000.23 *0.000.08 *
Vmax0.90 *0.21 *0.13 *0.000.10 *
s0.35 *0.50 *0.73 *0.000.73 *
aave0.000.000.010.000.00
V2m0.010.000.010.000.00
V4m0.000.000.000.000.00
V6m0.000.000.000.000.00
V8m0.000.000.000.000.00
V10m0.000.000.000.000.00
V12m0.000.000.16 *0.000.06 *
a2m0.020.000.35 *0.000.03
a4m0.000.000.010.000.00
a6m0.000.000.000.000.00
a8m0.000.000.000.000.00
a10m0.000.000.010.000.00
a12m0.000.000.050.000.01
Table 2. Coefficients C 0 , C 1 , C 2 , C 3 and C 4 of the linear models associated with the parameters considered to describe the variables of interest: the R2 value provides an indication on the quality of the resulting model (* limited quality, ** insufficient quality).
ParameterGenderNmaxNASrevR2
C0 (Woman)C0 (Man)C1C2C3C4
t(s)5.535.10−0.40−0.57−0.231.0130.6% **
Vmax (m/s)6.376.400.231.160.24−1.517.3% **
s (m)13.6013.860.150.300.24−0.383.5% **
aave (m/s2)0.900.960.070.180.07−0.2757.7% *
V2m (m/s)2.272.340.180.220.05−0.4467.8%
V4m (m/s)3.233.400.270.510.12−0.8171.6%
V6m (m/s)3.633.830.290.570.18−0.8872.7%
V8m (m/s)3.603.860.250.520.22−0.7973.3%
V10m (m/s)3.443.740.220.430.27−0.6573.1%
V12m (m/s)3.123.460.190.290.31−0.4768.2%
a2m (m/s2)1.101.160.120.080.03−0.2253.4% *
a4m (m/s2)1.161.250.130.190.06−0.3562.9%
a6m (m/s2)1.061.150.120.190.07−0.3467.0%
a8m (m/s2)0.931.020.110.180.08−0.3069.3%
a10m (m/s2)0.800.890.090.150.08−0.2570.7%
a12m (m/s2)0.660.760.080.120.08−0.2068.8%
Table 3. Average/maximum values of speed for the considered sections, based on assistance employment.
Road without Right of Way—Section 1
AssistanceVaveVariation VaveVMVariation VM
Yes17.219%24.78%
No14.022.8
Road with Right of Way—Section 2
AssistanceVaveVariation VaveVMVariation VM
Yes22.222%27.47%
No17.325.4
Double Roundabout—Section 3
AssistanceVaveVariation VaveVMVariation VM
Yes19.736%25.131%
No12.617.3
Publisher’s Note: MDPI stays neutral with regard to jurisdictional claims in published maps and institutional affiliations.

