Article

Factors Contributing to the Hydrologic Effectiveness of a Rain Garden Network (Cincinnati OH USA)

by
William D. Shuster
1,*,
Robert A. Darner
2,
Laura A. Schifman
3 and
Dustin L. Herrmann
4
1
Research Hydrologist, United States Environmental Protection Agency, Office of Research and Development, National Risk Management Research Laboratory, ML443, 26 W. Martin Luther King Drive, Cincinnati, OH 45268, USA
2
Hydrologist, United States Geological Survey, Michigan-Ohio Water Science Center, 6460 Busch Blvd. Suite 100, Columbus, OH 43229-1753, USA
3
National Research Council Postdoctoral Research Associate, United States Environmental Protection Agency, Office of Research and Development, National Risk Management research Laboratory, ML443, 26 W. Martin Luther King Drive, Cincinnati, OH 45268, USA
4
Oak Ridge Institute for Science and Education Postdoctoral Research Associate, Oak Ridge, TN 37831, USA
*
Author to whom correspondence should be addressed.
Submission received: 3 August 2017 / Revised: 31 August 2017 / Accepted: 4 September 2017 / Published: 6 September 2017
(This article belongs to the Special Issue Green Infrastructure for Sustainable Stormwater Management)

Abstract

:
Infiltrative rain gardens can add retention capacity to sewersheds, yet factors contributing to their capacity for detention and redistribution of stormwater runoff are dynamic and often unverified. Over a four-year period, we tracked whole-system water fluxes in a two-tier rain garden network and assessed near-surface hydrology and soil development across construction and operational phases. The monitoring data provided a quantitative basis for determining effectiveness of this stormwater control measure. Based on 233 monitored warm-season rainfall events, nearly half of total inflow volume was detained, with 90 percent of all events producing no flow to the combined sewer. For the events that did result in flow to the combined sewer system, the rain garden delayed flows for an average of 5.5 h. Multivariate analysis of hydrologic fluxes indicated that total event rainfall depth was a predominant hydrologic driver for network outflow during both phases, with average event intensity and daily evapotranspiration as additional, independent factors in regulating retention in the operational phase. Despite sediment loads that can clog the rooting zone, and overall lower-than-design infiltration rates, tradeoffs among soil profile development and hydrology apparently maintained relatively high overall retention effectiveness. Overall, our study identified factors relevant to regulation of retention capacity of a rain garden network. These factors may be generalizable, and guide improvement of new or existing rain garden designs.

Highlights

  • Infiltration-type retention practices can aid in managing stormwater volume.
  • We monitored a newly-installed rain garden’s hydrology over a four-year period.
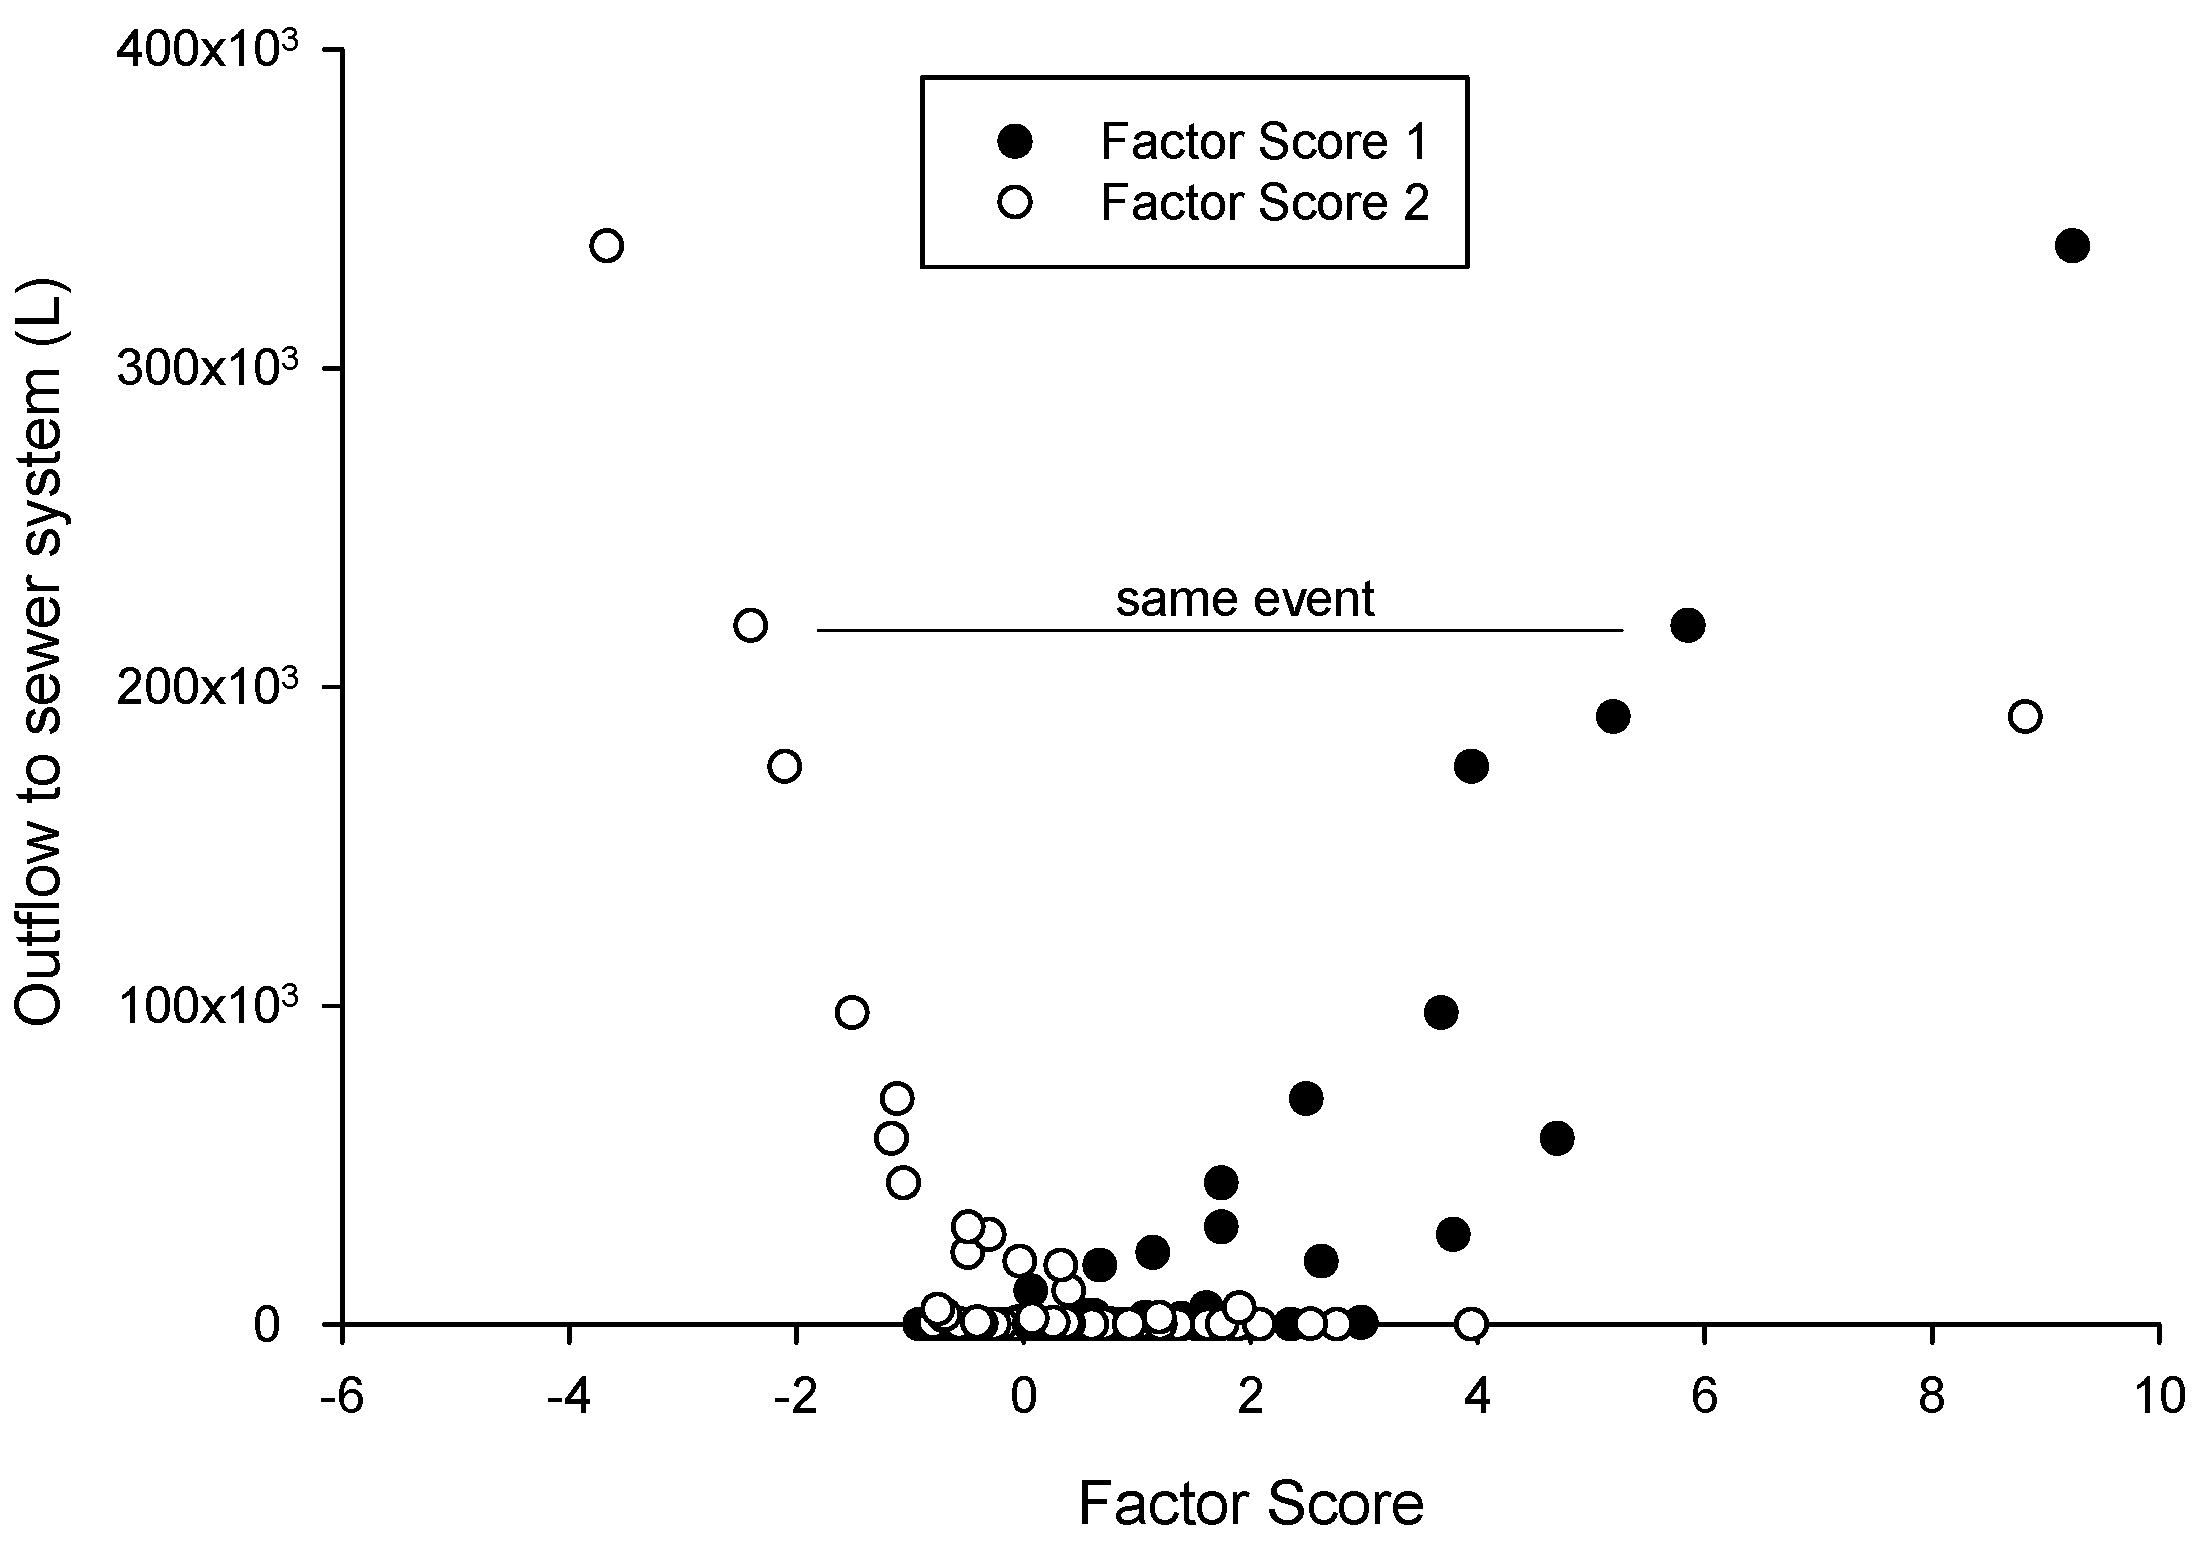
  • Rain garden detained 50% of total inflow and delayed overflow to sewer system by ~5 h.
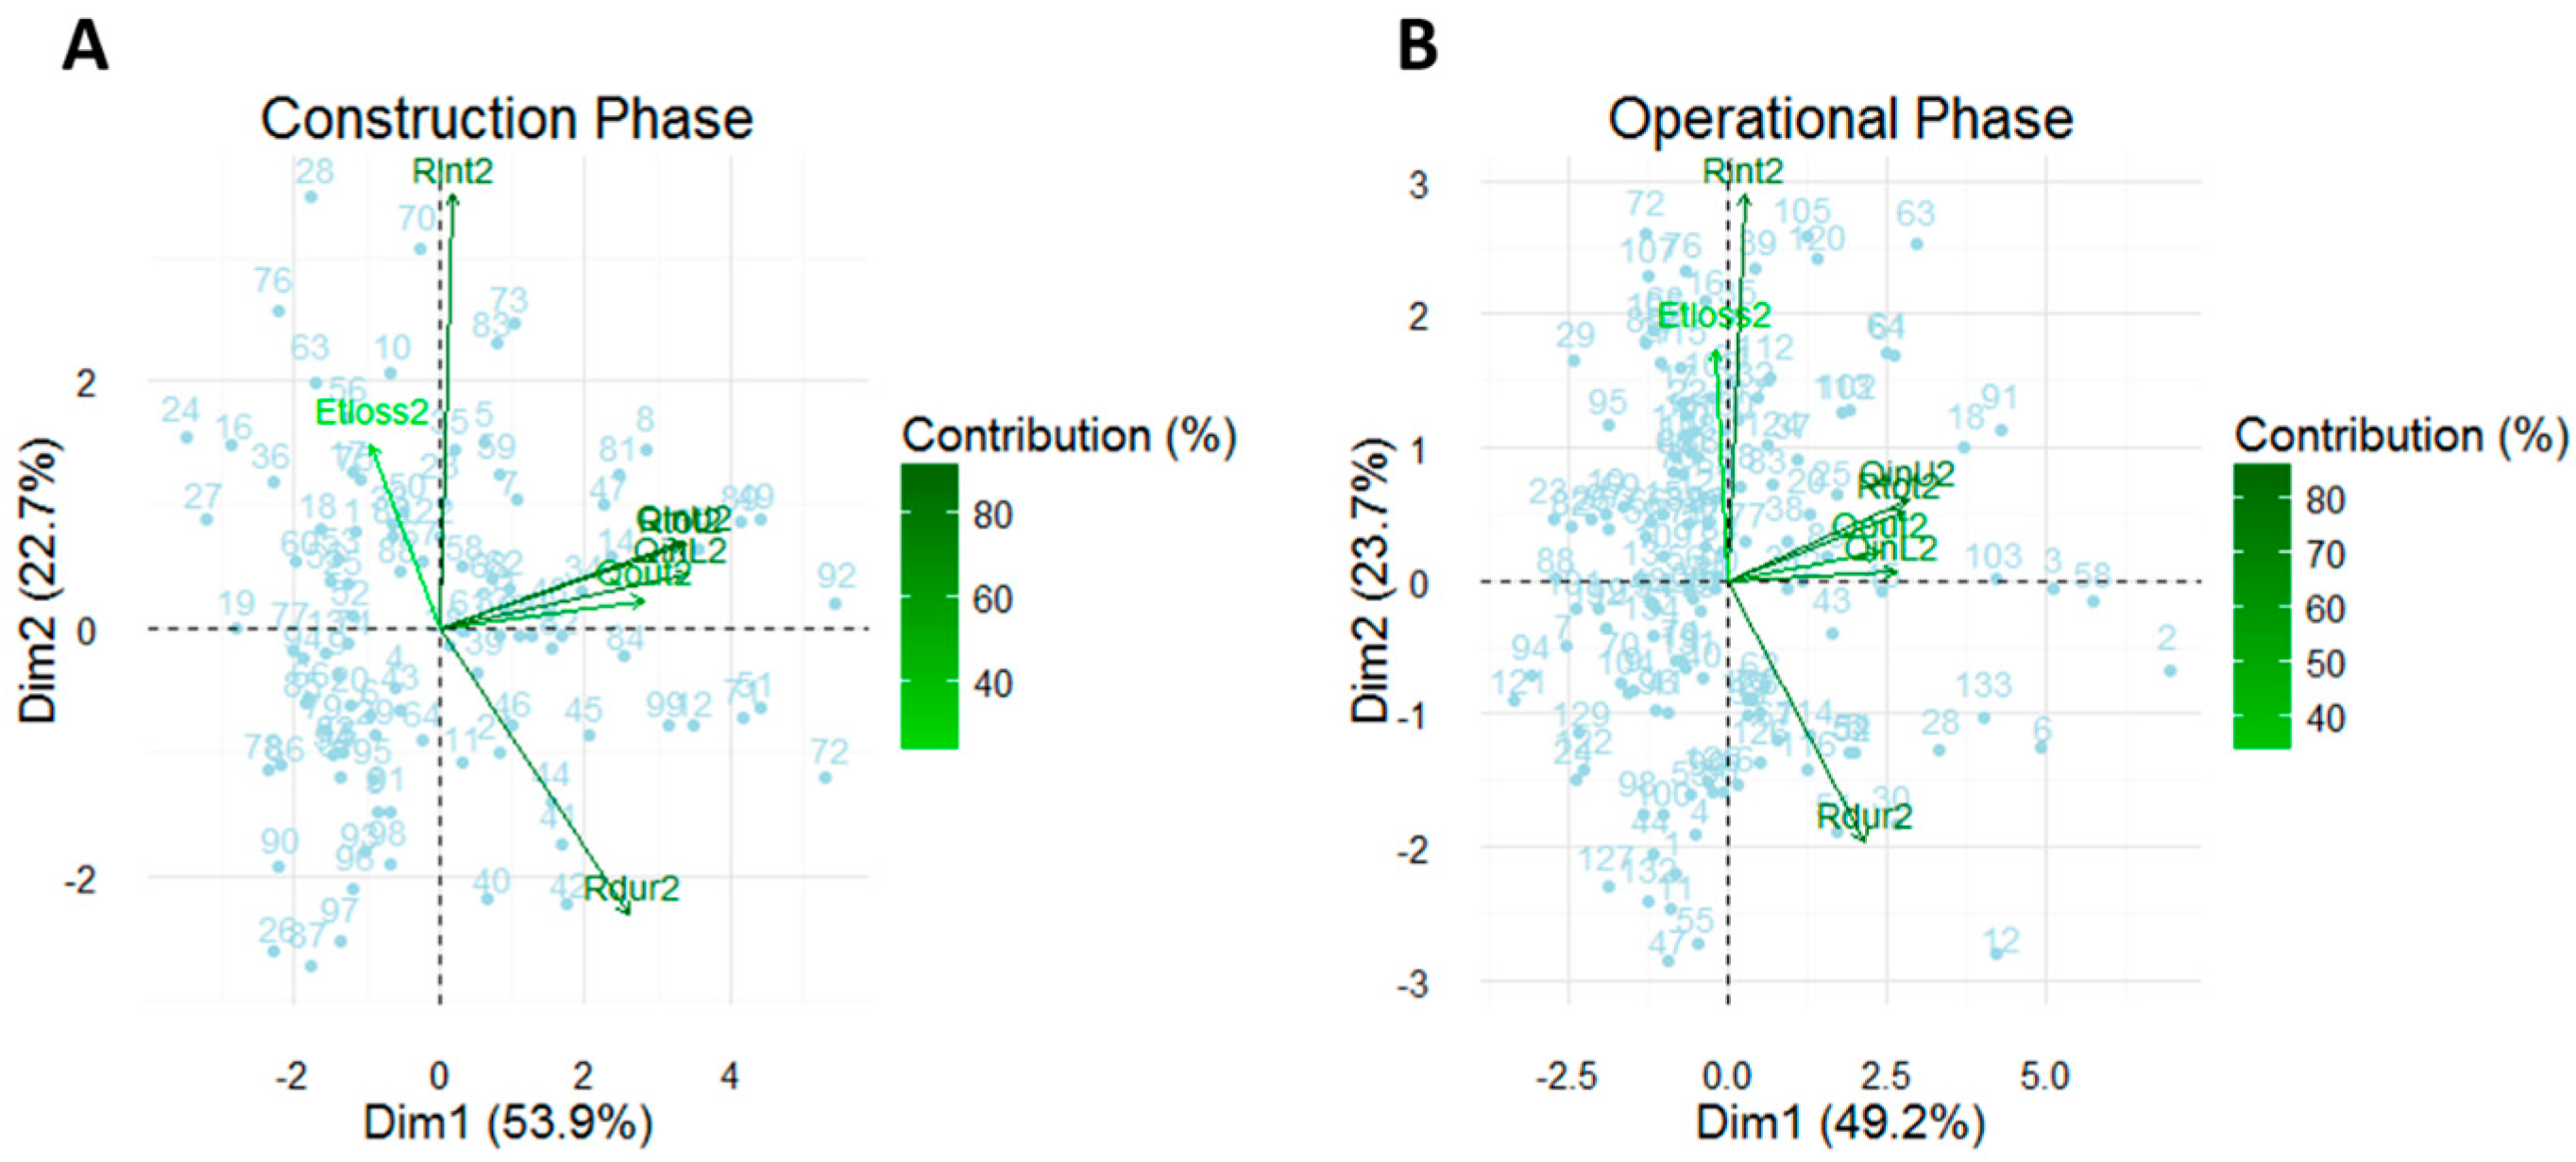
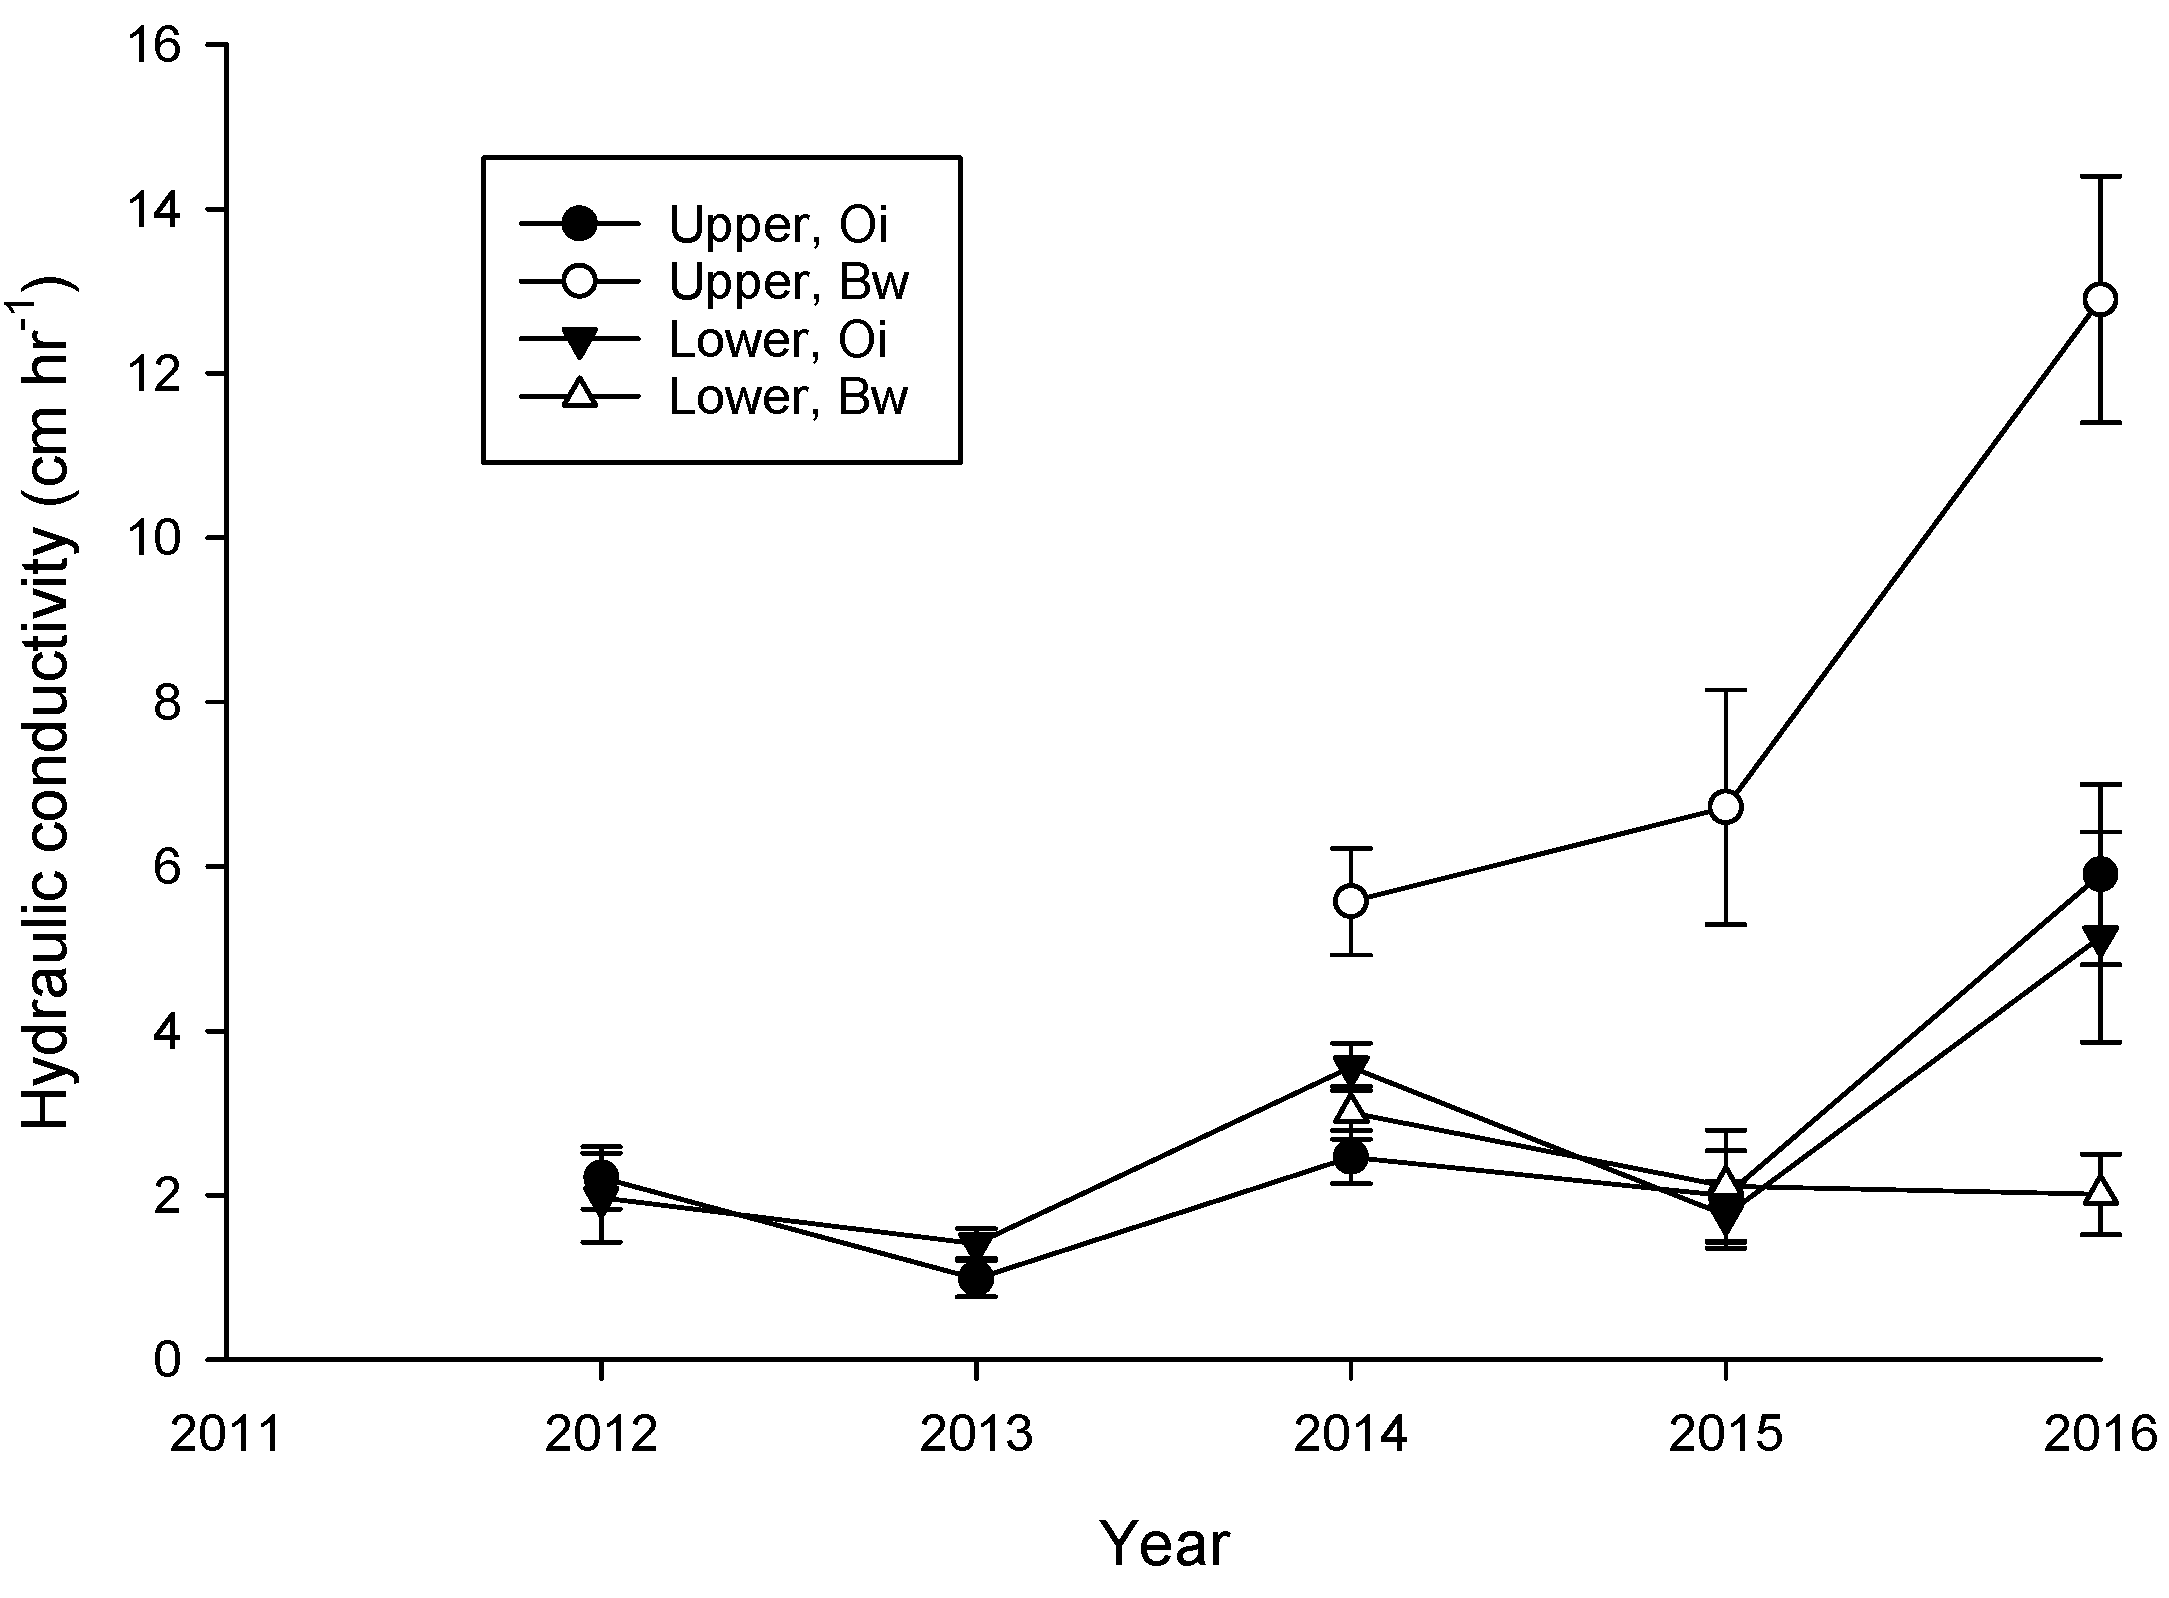
  • Retention effectiveness was related to total inflow volume and intensity, evapotranspiration losses, and soil formation.

1. Introduction

Cities have used the constellation of green infrastructure (GI) technologies as a governing concept and flexible management technique to transform and connect landscapes, with an emphasis on stormwater management [1,2,3,4,5,6]. As pointed out by Green et al. [2], a great deal of urban vacant land area is available (e.g., via land banks), especially in post-industrial cities, and this land mass can be leveraged toward implementation of GI, and rendering an expanded suite of ecosystem services. These services to humans include not only stormwater management and reducing loads on ageing wastewater infrastructure, but also providing recreational spaces, expanded patches of habitat, increasing biodiversity and pollination services, and contributing to mitigation of urban heat island impacts, among other services. In this way, GI practices can re-integrate the urban landscape, and render ecosystem services that link social equity, economic stabilization, and environmental quality in areas historically lacking in these attributes [2,3,6].
Rain gardens, a type of GI, are constructed plant-soil systems that combine infiltration and storage processes to maximize retention capacity for at least the smallest and most-frequent storms, with some emphasis on improving the aesthetics of the urban landscape [1,3,5]. These stormwater control measures provide hydrologic losses through redistribution of soil moisture in the rooting zone, enhanced transpiration via vegetation, and temporary storage of infiltrated runoff volume in engineered rooting zone soils and gravel-filled underlayers [5,6]. Each hydrologic loss contributes to the effectiveness of the rain garden in achieving the objective of managing stormwater runoff volume. For example, the selection of rooting zone soil is a key part of the rain garden design process, as it regulates the movement of runoff volume into the gravel drainage layer. If the material is too permeable, retention time is short, possibly leading to immediate outflow conditions and adding to the stormflow burden in the combined sewer system (CSS). Alternately, if the soil profile has low permeability, then drawdown times are increased, predisposing the rain garden to an overflow condition.
In the design process, best-known estimates of engineered soil hydraulic conductivity are used to create a rain garden that meets the situational, site-specific expectations for overall capacity, infiltration, and complete draw-down of storm volume within 24–48 h [3,5,7]. Underdrains are often employed to ensure drainage of the plant rooting zone and timely drawdown [3,5]. Due to mulching and washing through of organic matter and soil particles, and development of soil biotic communities, the soil profile is in a constant state of development, influencing soil hydraulics. Each of these sub-systems or processes are interactive factors contributing to the overall goal of maintaining retention functions, and minimizing risk of rain garden failure as overflow to the sewer system. After a rain garden is implemented, the nature and relative importance of these factors can change with time, affect rain garden effectiveness, and may require maintenance and adaptation [7,8,9,10]. Numerous studies have evaluated their effectiveness at sediment removal and other benefits to water quality [6,11]. However, few studies have examined the hydrologic trajectory of managed rain gardens over time. These studies are needed to identify principal factors that control effectiveness in regulating hydrologic losses once rain gardens are operational [2,3,10].
Here, we present an in-depth 4-year study of a single two-tiered rain garden. The overall objective of this study was to monitor the water cycle of this rain garden network. In addition, we track hydrology-related development of the plant and soil components that comprise the rain garden systems. We linked hydrologic outcomes and system properties to evaluate the overall effectiveness of the rain garden network insofar as preventing or retaining stormflow volume from entering the local combined sewer collection system. We correlate retention and loss outcomes with rain garden and precipitation variables to identify which factors are likely strong controls on rain garden effectiveness in regulating flows to the sewer system.

2. Methods

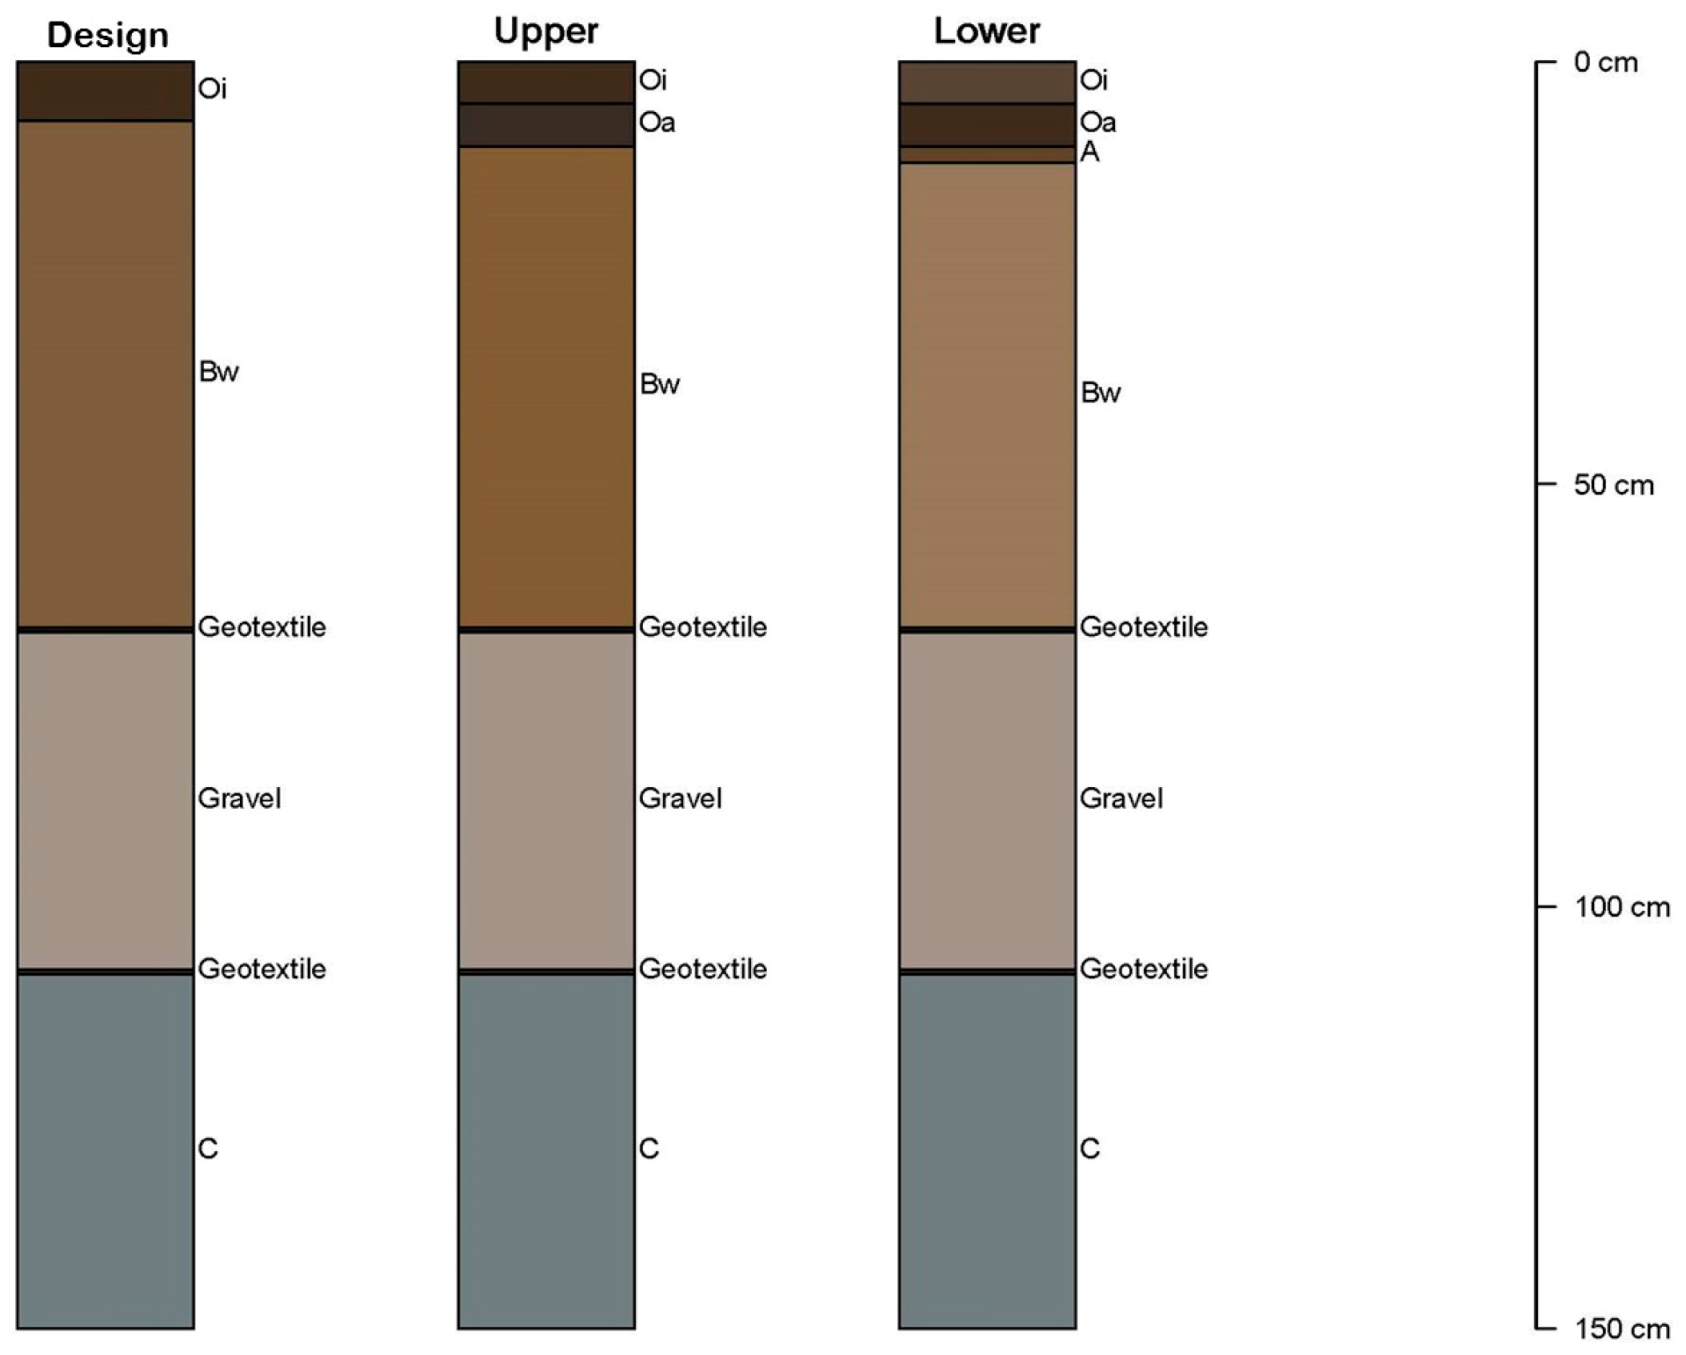
2.1. Site and Garden Description

This study examines the monitoring of and modifications to a two-tiered rain garden system in Cincinnati, Ohio, USA, (latitude, longitude: 39.126331, −84.559185) initially constructed in fall 2010. The previous land cover was asphalt used as a car storage-parking lot associated with a residential apartment complex. The greater Cincinnati area has a humid continental climate pattern with approximately 1000 mm precipitation annually and average daily high temperatures of −2 °C in January to 24 °C in July.
The rain garden system was built fall 2010 to spring 2011 and consists of an upper rain garden (400 m2) and a lower rain garden (300 m2), and drains an area approximately 9000 m2 in extent. Each garden is bermed at its borders with the perimeter in turf slopes. This creates a bowl shape that has considerable surface storage capacity of ~267 m3 and ~240 m3, for upper and lower gardens, respectively. The fraction of total impervious surface is estimated at 19 percent with directly-connected impervious surface (sidewalks, parking lot) accounting for 12 percent of the catchment area. The rain garden system receives runoff from a hillslope, wherein the catchment starts at the northern end with connected impervious surface as a roadway (Figure 1). Under storm conditions, the forested hillslope accepts direct runoff from the roadway drainage system, runoff produced by the forested area itself, additional direct runoff generated from the asphalt parking lot at the southern end of the catchment, where all of these flows combine and are piped to an inlet to the upper rain garden. As runoff volume fills the upper rain garden, ifstorage capacity in the upper rain garden is filled, the excess drainage volume is conveyed to the lower rain garden (Figure 1). If the capacity of the lower rain garden is exceeded, excess drainage volume is conveyed to the centralized combined sewer collection system that runs along the adjacent street (bottom, Figure 1).
The rain garden soil profile is composed of a 5–10 cm surface layer of chipped hardwood mulch placed over a 45–60 cm layer of engineered soil (texture: loamy sand in the upper garden, sandy loam in the lower garden) overlaying a 35 cm thick drainage layer of #57 gravel aggregate that is wrapped with a geotextile fabric (Figure 2). The drainage layer is underlain by a very-slowly permeable, cohesive silty clay subsoil with trace shale parent material and limestone fragments. Each garden is drained with perforated polyvinyl chloride underdrain pipe laterals that are wrapped in geotextile fabric and bedded into the gravel layer, and routed to drop box junctions. The upper garden drainage is conveyed along a pipe to the lower garden inlet. Lower garden underdrains are routed to its own drop box, and flows from this box are conveyed to the city combined sewer collection system (CSS; Figure 1). Each garden was planted with generalist (drought- and flood-tolerant) perennials and grasses (Table 1). In order to address insufficient retention times and force a more thorough filling of available capacity for inflows, standpipes were installed (Fall 2014) in the drop-boxes for each garden. The standpipes as originally installed resulted in excessive ponding, and were shortened in spring 2015 to remedy this condition.

2.2. Monitoring the Rain Garden Water Cycle

Full water cycle monitoring was initiated April 2012 and continued through October 2015. We used a total of 233 warm-season (April–October) storm events to study rain garden effectiveness in the period where CSO activations are most prevalent (Metropolitan Sewer District of Greater Cincinnati, personal communication), and where off-line retention capacity is potentially most important. The monitoring system included a weather station (ET107; Campbell Sci., Logan, UT, USA), which measured precipitation as cumulative 5-min totals at 0.025 cm resolution using a tipping bucket, relative humidity, wind speed and direction, solar radiation, and air temperature which contributed to calculated hourly reference evapotranspiration (ETO) using the ASCE Standardized Reference Evapotranspiration equation (Penman-Monteith method) [12]. Precipitation and ETO data is accessible at: http://waterdata.usgs.gov/oh/nwis/uv?site_no=390735084333300.
Wetting front in the lower garden soil profile was characterized every 30 min [13] with three fixed (wired) soil moisture sensors installed in the proximity of the inlet: one at the engineered soil and geotextile liner interface, one-half way between the soil-geotextile interface and the surface, and one at the surface.
We measured flow into the upper rain garden, between the upper rain garden and the lower rain garden, and out of the rain garden into the combined sewer system. Flow into the upper rain garden was measured as stage in an H-flume, with a bubbler and sensor system to measure stage, specific conductance, and water temperature. The standardized flume rating curve converted stage to discharge data. Flume bubbler and sensor data were measured every 2 min, and stored as data only if stage changed by at least 0.01 ft.; or at least every 30 min at the top and bottom of the hour, regardless of stage changes. Storm event stage data was confirmed with crest-stage gages that passively record maximum event depth as a line of powdered cork on a benchmarked cedar stick. This discharge data is available for the time period 5/13/2011 through 10/31/2015 at: http://waterdata.usgs.gov/oh/nwis/uv?site_no=390735084333300.
We used a similar configuration to monitor fluxes from the upper to lower garden, and discharge data is archived at: http://waterdata.usgs.gov/oh/nwis/uv?site_no=390735084333301.
Outflow from the lower rain garden to the combined sewer collection system was measured by an in-pipe Thel-mar weir with a bubbler to measure stage, which is archived at: http://waterdata.usgs.gov/oh/nwis/uv?site_no=390735084333302.

2.3. Soil Hydrologic and Profile Assessment

In the warm-season period from 2012 through 2015, near-saturated hydraulic conductivity (hereon infiltration rate) at 2 cm suction head was determined (Minidisk tension infiltrometer; Decagon Devices, Pullman, WA, USA) at each of organic soil (2012–2015) and engineered subsoil (2014–2015) surfaces along points on a radial transect emanating from the upper and lower rain garden inlet locations. In 2015, infiltration measurements were made on the surrounding turf borders as an analogue for local urban soils and land cover. The hydraulic parameters for organic surface soils were estimated by determination of the soil water retention curve (HYPROP, Decagon Inc. Pullman, WA, USA) for a typical organic potting soil mix. Soil texture was qualitatively assessed by feel [14]. Internal drainage rate of the rain garden soil profiles and turf soils was determined in 2012 and 2015 as subsoil saturated hydraulic conductivity (Ksat) at two randomly-selected points in both upper and lower gardens at approx. 30 cm (12 in.) depth with a compact, constant-head borehole permeameter (Amoozemeter; ksatinc.com). The Ksat estimate is calculated via Equation (1):
Ksat = AQ
where Ksat is the internal drainage rate at saturation, A is a constant based on the radius and head of water in the borehole, and Q is the measured steady-state rate of water flow into the borehole. Mulch and soil horizon thicknesses were measured throughout each of the gardens, and at points corresponding with bulk density measurements. Bulk density in upper and lower rain garden organic and soil horizons was determined on 7.5 cm (diameter) × 5 cm (height) soil cores taken at five equal distances along each radial transect, and in each of organic soil and the engineered subsoil layers. Another five bulk density measurements were taken from soils in the turfgrass area that separated the upper from lower rain garden. Soil cores were weighed wet and soil material was then oven dried at 105 °C to constant weight. Prior to soil drying, soil cores were inspected for burrowing activity and then broken apart to check for presence or absence of soil macroinvertebrates. Macroinvertebrates were categorized as present if individuals or burrows from their activity were found in the soil sorting.

2.4. Data Analysis

A spreadsheet macro was used to plot storm hyetograph and analyze the event hydrograph. The start and end times for a precipitation event were used to determine start and end time for discharge from each flow monitoring point, and to determine total flow and centroid for both precipitation and flow. Effectiveness is defined as the proportion of flow into the rain garden system (upper garden inlet, direct rainfall onto each garden, runoff from perimeter slopes adjacent to each garden) that is prevented from flowing into the local combined sewer system. For storms that were not completely detained in the network, the time lag was determined as difference between precipitation and discharge centroids. Based on a histogram including all warm-season events, these were broken out into three levels based on magnitude: complete retention of an event (0 L flow to CSS), threshold events with nominal overflow volume (<5500 L), and events driving large-volume (>5500 L) flows into the combined sewer system. Change in percent vegetative cover (2010 to 2016) was determined by comparing annual aerial images from Google Earth using ImageJ [15] as a proportion of total rain garden area.
To determine if soil physical properties changed with distance from garden inlets, multiple regressions on log-transformed infiltration data and arcsin (square root)—transformed bulk density data, each as a function of distance from inlet and its squared term were carried out in R (https://www.r-project.org/). For statistical analysis, the threshold of significance was set at an alpha level of 0.10. In order to screen monitored variables for their contribution to total variance in rain garden hydrologic fluxes, multivariate exploratory data analysis was performed on the flow monitoring dataset. The dataset was split into construction (2012–2013, 99 events) and operational (2014–2015, 134 events) periods. A Spearman correlation matrix was developed from rank-transformed data, which satisfied assumptions of linear statistical models (e.g., normal sampling distribution, equalize sample variance, etc.). Principal components were extracted from this matrix using the FactoMineR package in R [16]. Factor scores were calculated for the first two principal components, and plotted against event outflow volumes (SigmaPlot 13.0; Systat Software, San Jose, CA, USA).

3. Results and Discussion

3.1. Rain Garden Network Response to Storm Events

The rain garden network buffered more than half of the inputs of stormwater volume from the combined sewer system (Table 2). Our measured effectiveness compared well with that determined by other workers in different infiltration-type stormwater control measures (e.g., 52% in a monitored rain garden [17] and 49% for a grass filter strip treating highway runoff [18]). Our results also fall into the range of effectiveness determined by Hatt et al. [19], which was 15–83% for three biofiltration installations with soil and mulch profiles similar to the present study; and the higher end of the range (13 to 62%) determined by Autixier et al. in a hydrologic simulation study [20].
Precipitation in 2012 was the lowest study-wide at 500 mm, with greater average number dry days between events (5.2 days) longer than the four-year average (3.7 days). The frequency and volume of flows to the CSS were correspondingly lowest in 2012 with 95% effectiveness. During this time unmonitored bypass flow moved through the rain garden network subsurface drainage plumbing, which would have otherwise registered as high network effectiveness to (Table 2). There was nearly twice the depth of rainfall in 2013 (940 mm) than 2012, but spread out over a much longer period (409 h). Flow volumes to the CSS was higher in 2013 due to bypass of upper rain garden flows to the CSS via the activation of the original parking lot drainage system, which remained unsealed through the 2013 warm season. By 2014, repairs and modifications to infrastructure were complete. The rainfall depth in 2014 was moderate at 680 mm, and distributed over the longest study-wide duration of 552 h (Table 2), and we observed that 48% of the total volume inputs (inlet flow, direct rainfall, and runoff from adjacent turf landscapes into the gardens) did not enter the MSDGC CSS (Table 3). Finally, the more intense rainfall pattern in 2015 had the same total rainfall depth as in 2013 (940 mm), though delivered in approximately half the time (238 compared to 409 h), with the shortest average number of days between storms (2.7 compared to an average of 3.7 days).
Analysis of storm hydrographs showed that any flow into the combined sewer systems was delayed by 4.5 h in the construction phase (2012–2013), and by 5.5 h in the operational phase (2014–2015). This rain garden function is a benefit to maintaining capacity in the combined sewer conveyance system. Based on the typology of events driving flows to the CSS, and accounting for 2012 and 2013 overestimation of retention, the frequency of events was similar across years (Table 3). Large flows to the CSS were more variable in the construction phase, as much lower (2012), or higher (2013), compared to the overall 4-year average (Table 3). As the system stabilized in the 2014–2015 operational phase, the volume retention of the rain garden network averaged slightly greater than 50%, with nearly 90% of all warm-season events fully retained. Approximately 5% (averaged over the four-year monitoring period) of all events produced either threshold or large flows to the combined sewer system (Table 3).
The hydrologic effectiveness of a rain garden is dependent on the amounts and timing of runoff volume delivered, transmitted, and stored in the different layers of each rain garden. We expect that stormwater volumes conveyed to the sewer system are most strongly correlated with the primary precipitation and rain garden hydrologic processes regulating them. Since we did not control for variables experimentally, we cannot make firm claims of a causal relationship between the correlated variables and stormwater regulation. We used multivariate analysis (principal components analysis, PCA) to qualify the potentially interactive role of measured fluxes to assess the hydrology of this network in the construction and operational phases. The PCA approach equally weights individual observations, and simultaneously places and scales the different hydrologic fluxes along independent, explanatory principal components, delineating fluxes that operate either in concert or independently of each other. The first two principal components explain 77 percent (Figure 3A; construction phase 2012–2013) and 73 percent (Figure 3B; operational phase 2014–2015) of total variance in the dataset, with re-scaled data evenly distributed around the space formed by the components. PCA Factor 1 (x-axis; Figure 3A) shows that for both construction and operational phases, total event rainfall depth was coincident with flows into, through, and out of the network. PCA Factor 2 shows the expected, inverse relationship between average event rainfall intensity (Rint2) and duration (Rdur2), with these metrics ordinated independent of Factor 1 hydrologic processes. Evapotranspiration losses (Etloss2, Factor 2) are indicated to play a more predominant role in the operational than construction phase. With the exception of areas immediately around the inlets, the initial plantings quickly established in the construction phase from 2011–2012, with canopy coverage in 2016 (4 years in to the operational phase) estimated at 97%. Although the thick surface mulch layer likely restricted evaporative loss, the amount of transpiration may have increased due to increased vegetative cover and presumably increased removal of soil moisture through likewise expanded root systems. Our analysis suggests that total event rainfall depth (an input) and evapotranspiration (a loss) are primary factors regulating flows through the rain garden network.
We found that events with the largest flows to the combined sewer system had high total rainfall depth delivered over longer durations (i.e., 24 h). This suggested that average event intensity was not as important as total event rainfall depth. We note here that the network retained higher-intensity events (~0.7 cm h−1), which for a different study, was a threshold intensity for driving a rain garden into overflow [17]. Overall, the frequency of the largest outflow events was minimized and retention efficiency maximized by ongoing improvements to the network conveyances. These served to push the threshold for outflow higher; for example, flow into the CSS would occur only after the water surface exceeded the lower garden standpipe invert.
We next analyzed how these different factors synthesize to create conditions for overflow to the CSS. In Figure 4, factor scores for events are plotted pairwise (Factor 1, Factor 2) against event outflow volume. For events when system capacity is never exceeded and stormwater volume inputs are stored, factor scores for both Factor 1 and Factor 2 are small. This is related to overall low values of total event rainfall depth, low inflow volume, and an absence of flow moving through the network (Figure 4). As Factor 1 scores (as rain event depth) increase, flow through the network is initiated, which activates threshold or larger categories of outflow volume to the CSS (Figure 4), and evapotranspiration losses are proportionally less important in the regulation of these outflows. For the largest rainfall events (some of which may also have high intensity), outflow volumes are considerable, ranging from 10,400 to 338,300 L (Figure 4), and differences between Factors 1 and 2 are maximized. The only significant loss from the network under the largest stormflows is outflow to the CSS. Factor 2 scores are highly variable, which we attribute to event-wise differences in evapotranspiration losses, which remove soil moisture from the rooting zone over the course of days, whereas an increase Factor 1 values indicates rapid influx of stormwater volume occurring at the scale of minutes or hours.
An anomaly in this otherwise consistent set of relationships summarized by the PCA factors is that both factor scores are both highly positive for two extreme storm events, namely, 1 September 2012 (0.7 cm in 0.2 h, average intensity 4.1 cm h−1, 5 days between storms, flow into upper garden only, no flow out to the CSS); then 5 May 2013 (6.3 cm in 25.2 h, average intensity 0.2 cm h−1, 10 days between storms, flow into upper garden and lower garden, ~190, 600 L outflow to the CSS). Monitoring data for each event showed that inlet volume (2012 event) and then outflow volumes (2013 event) exceeded measured volumes in the rain garden network. Both events occurred prior to any modification or repair of the network drainage system. Although rare in the study record (2 out of 233 events over a four-year period), the impacts of each event are considerable in different ways, and tested the operational capacities of the network under drier antecedent conditions. Additional flow sources may have been initiated by early-term infiltration-excess runoff production due to high rainfall intensity in the 2012 event; and by possible expansion of source areas and overall complete saturation and inundation of the network for the longer-duration 2013 event.

3.2. Soil Hydrology

Compared with high runoff potential in the surrounding turf areas, the rain garden system offered four-times greater infiltration rate, and 100 times greater internal drainage rate. The infiltration rate of the surrounding turf areas (clay loam soils) is 0.6 ± 0.1 cm h−1, which falls into the lower end of the range determined on residential lawns in central Pennsylvania [21]. The design infiltration rate of engineered soil fill material for this network is 5 cm h−1. Infiltration rates measured at the mulch layer surface were consistently (2012–2015), which is about half of the assumed design value at 2.2 ± 0.4 cm h−1, and 2.0 ± 0.5 cm h−1 for upper and lower gardens, respectively (Figure 5). In the period 2014–2016, the upper garden loamy sand exhibited a mean infiltration rate that was overall highest and most variable (in 2016 at 12.9 ± 1.7 cm h−1); whereas the lower garden sandy loam had a mean infiltration rate of approximately 2 cm h−1 that did not vary considerably over the study period (Figure 5). Although measured infiltration was less than design rates, it compares well to the lower-permeability biofilter soils modeled by Le Coustumer et al. [22], which found that when biofilter infiltration rates were initially low (approx. 2 cm h−1), these rates tended to not change over time. In addition, our near-saturated measurement condition eliminated the flow contribution of macropores exceeding about 0.5 mm in diameter (e.g., space between mulch particles), and so would likely register conductivity less than measurements made under saturated conditions.
Once water saturates the Oi and Bw layers, drainage rate regulates drawdown and movement of water into the gravel layer. At the inception of the study in 2012 the average drainage rate at saturation (Ksat) was unrestricted in the upper rain garden (due to a highly-permeable unstructured loamy sand), and 20.3 ± 1.3 cm h−1 for the lower rain garden. By 2015, drainage rate was both higher and more variable in the upper rain garden (75.8 ± 28.3 cm h−1) than the lower garden, which had declined to 4.2 ± 0.3 cm h−1. Clay loam soils under turf areas were slightly more compact at an average of 1.35 ± 0.05 g cm−3 compared to rain garden soils. For both the upper and lower rain gardens, the organic and mineral layers were, on average, less compact in 2016 than 2015 (Table 4). Bulk density values are in agreement with those for samples with correspondent soil textural classes (loamy sand, sandy loam), as measured by Asleson et al. [7] in their survey of 12 Minnesota (USA) rain gardens. There was no significant regression relationship between bulk density and sampling distance from the inlets for either garden in the 2015–16 period (p > 0.10).
Soil profiles developed over time, and the stratification of the surface mulch layer was similar for both gardens. Serial, bi-annual mulching (2012, 2014) led to the development of a pronounced organic horizon in both gardens, which we attributed to the hardwood-chip mulch composting in place (Figure 2). Over the ensuing six years since construction, the surface horizons in both gardens stratified into the coarse, newer mulch layer that comprises the Oi horizon, which transitioned to the finer, older layer of organic matter that define an Oa horizon (Figure 2). By 2016, the total organic layer thickness ranged from 4 to 13 cm, and 7 to 25 cm in the upper, and lower gardens, respectively. Due to inlet stormflow, mulch was redistributed in each garden, and especially in the upper garden so that combined depth of the Oi, Oa horizons varied widely; ranging from about 8 cm (closer to the inlets) to 25 cm (farther from the inlets), indicating that mulch was pushed outwards from points nearest the flow outlet that communicated flow into the rain garden. Further profile development occurred in the mineral horizons, but only for the lower rain garden. By 2014, a thin A horizon had developed in the lower rain garden (Figure 2), which may have contributed to keeping infiltration rates consistent in the lower garden mineral soil layer. The development of new soil layers—and the accompanying flow discontinuities—may have further regulated the infiltration process in the lower rain garden, which may explain observed ponding nearest the inlets, where soil formation is most active and layering is most pronounced. The coarser sands (larger particle size) in the upper rain garden had high infiltration and throughflow rates due to its overall weak structure, and a high degree of structural macroporosity. Although limited to observations on bulk density soil cores, soil macroinvertebrate presence was observed in the upper, but not the lower rain garden. Macroinvertebrate activity (e.g., ant and earthworm burrowing) creates macropores that—when soils are saturated—can rapidly channel flow to the gravel storage sub-layer. Therefore, a combination of both soil development and biogenic processes may have furthermore maintained high infiltration rates in the upper garden, and regulated the same in the lower rain garden [22,23,24,25,26].
Coincident sediment deposition and post-event ponding was noted in the upper garden starting August 2012. We hypothesized that sediment suspended in inflow would settle, clog surface-connected pores, and thereby degrade infiltration rates [7,8,27,28,29]. Although we expected that soils closest to the inlets to have decreased infiltration rate and become denser with time, neither of these relationships were significant for either garden. We were particularly surprised that there was no evidence of degradation in upper garden infiltration rates, where the mass of sediment delivered ranged between 0.1 to 56 kg with a median of 8 kg per event [30].
Overall, the upper rain garden acted as a fine sediment filter, protecting the lower garden from sedimentation, such that the study-wide, event-wise maximum suspended sediment load into the lower garden was only 2 kg [30]. This 75% decrease in fine sediment loading is in agreement with other field studies which reported 68 [29] to 90% [19] reductions in suspended sediment loads in networked rain gardens. Jenkins et al. [31] observed that although the texture of rain garden surface soils was changed by settling of fine sediments over an eight-year study period, infiltration rates did not change. Taken in the context of the present study, the specific composition and thickness of the surface mulch layer may regulate the impact of sediment load on rain garden hydrology. Based on our data, we speculate that sediments were well-dispersed in the vicinity of the inlet, and ultimately incorporated into the thick organic surface soil, where their impact on infiltration rate was minimized.
The absence of clogging effects over a four-year monitoring period in this study may also suggest that the amount of fines in the engineered soil mixes were initially low, and that excess capacity due to oversized garden areas may have provided more surface area over which fine sediment was distributed [8,26]. Dumouchelle and Darner [13] observed nearly vertical infiltration in soils near the lower garden inlet wherein water percolated though this finer soil to the gravel layer, stopped at the underlying restrictive clayey subsoil, at which point flow was lateral, and the gravel layer filled from the bottom upwards. We assume that this same pattern holds for the upper garden where soils are coarser. From a practical standpoint, the event peak depth (via crest stage gages) was always lower than the maximum freeboard depth in either rain garden; total inflow volume for any event was insufficient to fill either rain garden. This suggests that a smaller proportion of each rain garden was active in infiltration and drainage processes. Given the amount of unused surface area (and hence retention capacity) in both rain gardens, future outflow events in this network may be better mitigated by increasing the usable area. Some practical approaches that may be generalizable to other rain gardens include: engaging the unused network storage volume via flow-spreaders; facilitate movement of water to the perimeter by re-grading the gardens to create a slight slope toward the outer perimeter of each garden; and limiting the drainage area of underdrains to a close proximity near the inlet, forcing lateral water flow (fully leveraging subsurface storage) once the maximum vertical flow rate is attained.

4. Conclusions

We monitored stormwater runoff volume moved through a rain garden network over construction and operational phases to identify factors contributing to the hydrologic effectiveness of a rain garden network as a stormwater control measure. The network achieved more than 50% overall volume retention capacity, and 90% of all rainfall events were fully detained in the gardens. For a storm event that drove the rain gardens to release flow to the CSS (10% of all events), we found that the flows into the local combined sewer system were delayed off-peak for an average of 5.5 h. The factors of total event depth, event average intensity duration, and evapotranspiration losses jointly regulated observed rain garden performance. Despite lower-than-design infiltration rates, tradeoffs among soil profile development and hydrology, and resilience to sediment loading (via a thick organic surface layer) contributed to maintaining hydrologic effectiveness of this rain garden network. Although monitoring of volume reduction ended in fall 2015, ongoing 2016 measurements of soil structural and hydrologic characteristics indicate that soils were overall less compact, and had maintained or increased hydraulic conductivity. Given no other changes in the network, these measurements indicated that retention capacity and the overall operational dynamic of this rain garden network is stable. Retention of half of total inflow volume across four years of contrasting rainfall patterns is encouraging news for wastewater management with infiltration-type stormwater control measures.

Acknowledgments

A. Knerl, K. Gilkey, and J. Mullane collected field data and assisted in the development of figures. The manuscript was greatly improved based on comments of reviewers. L. A. Schifman held a NRC Research Associateship appointment at the National Risk Management Research Laboratory within the Office of Research and Development of the U.S. Environmental Protection Agency. Herrmann, D.L. was supported an appointment to the Postdoctoral Research Program at the U.S. Environmental Protection Agency’s National Risk Management Research Laboratory administered by the Oak Ridge Institute for Science and Education through Interagency Agreement No. (DW-8992433001) between the U.S. Department of Energy and the U.S. Environmental Protection Agency. The views expressed in this article are those of the authors and do not necessarily represent the views or policies of the U.S. Environmental Protection Agency.

Author Contributions

W.D. Shuster coordinated the study, made soil hydrologic measurements, analyzed data, created figures, and took lead on writing the manuscript; R.A. Darner carried out rainfall, evapotranspiration, and rain garden network flow and measurements, developed hydrograph separation algorithm and analyzed storm event data, and wrote methods, collaborated on discussion; L.A. Schifman contributed with image analysis, assistance with R code development and related drafting of figures, and writing results; D.L. Herrmann contributed with R code development and related drafting of figures, and writing results.

Conflicts of Interest

There are no known conflicts of interest affecting the course of this study, nor reporting on the same.

References

  1. Holman-Dodds, J.K.; Bradley, A.A.; Potter, K.W. Evaluation of hydrologic benefits of infiltration based urban storm water management. J. Am. Water Resour. Assoc. 2003, 39, 205–215. [Google Scholar] [CrossRef]
  2. Green, O.O.; Garmestani, A.S.; Albro, S.; Ban, N.C.; Berland, A.; Burkman, C.E.; Gardiner, M.M.; Gunderson, L.; Hopton, M.E.; Schoon, M.L.; et al. Adaptive governance to promote ecosystem services in urban green spaces. Urban Ecosyst. 2016, 19, 77–93. [Google Scholar] [CrossRef]
  3. Jarden, K.M.; Jefferson, A.J.; Grieser, J.M. Assessing the effects of catchment-scale urban green infrastructure retrofits on hydrograph characteristics. Hydrol. Proc. 2016, 30, 1536–1550. [Google Scholar] [CrossRef]
  4. Emerson, C.H.; Welty, C.; Traver, R.G. Watershed-scale evaluation of a system of storm water detention basins. J. Hydrol. Eng. 2005, 10, 237–242. [Google Scholar] [CrossRef]
  5. Davis, A.P. Field performance of bioretention: Hydrology impacts. J. Hydrol. Eng. 2008, 13, 90–95. [Google Scholar] [CrossRef]
  6. Barbosa, A.E.; Fernandes, J.N.; David, L.M. Key issues for sustainable urban stormwater management. Water Res. 2012, 46, 6787–6798. [Google Scholar] [CrossRef] [PubMed]
  7. Asleson, B.C.; Nestingen, R.S.; Gulliver, J.S.; Hozalski, R.M.; Nieber, J.L. Performance Assessment of Rain Gardens. J. Am. Water Resourc. Assoc. 2009, 45, 1019–1031. [Google Scholar] [CrossRef]
  8. Brown, R.A.; Hunt, W.F. Improving bioretention/biofiltration performance with restorative maintenance. Water Sci. Technol. 2012, 65, 361–367. [Google Scholar] [CrossRef] [PubMed]
  9. Chaffin, B.; Shuster, W.; Garmestani, A.; Furio, B.; Albro, S.; Gardiner, M.; Spring, M.; Green, O. A tale of two rain gardens: Barriers and bridges to adaptive management of urban stormwater in Cleveland, Ohio. J. Envion. Mgnag. 2016, 183, 431–441. [Google Scholar] [CrossRef] [PubMed]
  10. Chaffin, B.C.; Gosnell, H.; Cosens, B.A. A decade of adaptive governance scholarship: Synthesis and future directions. Ecol. Soc. 2014, 19, 56. [Google Scholar] [CrossRef]
  11. Grebel, J.E.; Mohanty, S.K.; Torkelson, A.A.; Boehm, A.B.; Higgins, C.P.; Maxwell, R.M.; Nelson, K.L.; Sedlak, D.L. Engineered infiltration systems for urban stormwater reclamation. Environ. Eng. Sci. 2013, 30, 437–454. [Google Scholar] [CrossRef]
  12. Monteith, J.L. Evaporation and environment. Symp. Soc. Exp. Biol. 1964, 19, 205–234. [Google Scholar]
  13. Dumouchelle, D.H.; Darner, R.A. Visualization of Soil-Moisture Change in Response to Precipitation within Two Rain Gardens in Ohio; Geological Survey Data Series 837; US Geological Survey: Columbus, OH, USA, 2014.
  14. Thien, S.J. A flow diagram for teaching texture-by-feel analysis. J. Agron. Educ. 1979, 8, 54–55. [Google Scholar]
  15. Schneider, C.A.; Rasband, W.S.; Eliceiri, K.W. NIH Image to ImageJ: 25 years of image Analysis. Nat. Methods 2012, 9, 671–675. [Google Scholar] [CrossRef] [PubMed]
  16. Lê, S.; Josse, J.; Husson, F. FactoMineR: An R package for multivariate analysis. J. Stat. Softw. 2008, 25, 1–18. [Google Scholar] [CrossRef]
  17. Page, J.L.; Winston, R.J.; Mayes, D.B.; Perrin, C.; Hunt, W.F. Retrofitting with innovative stormwater control measures: Hydrologic mitigation of impervious cover in the municipal right-of-way. J. Hydrol. 2015, 527, 923–932. [Google Scholar] [CrossRef]
  18. Line, D.E.; Hunt, W.F. Performance of a bioretention area and a level spreader-grass filter strip at two highway sites in North Carolina. J. Irrig. Drain. Eng. 2009, 135, 217–224. [Google Scholar] [CrossRef]
  19. Hatt, B.E.; Fletcher, T.D.; Deletic, A. Hydrologic and pollutant removal performance of stormwater biofiltration systems at the field scale. J. Hydrol. 2009, 365, 310–321. [Google Scholar] [CrossRef]
  20. Autixier, L.; Mailhot, A.; Bolduc, S.; Madoux-Humery, A.-S.; Galarneau, M.; Prévost, M.; Dorner, S. Evaluating rain gardens as a method to reduce the impact of sewer overflows in sources of drinking water. Sci. Total Environ. 2014, 499, 238–247. [Google Scholar] [CrossRef] [PubMed]
  21. Hamilton, G.; Waddington, D. Infiltration rates on residential lawns in central Pennsylvania. J. Soil Water Conserv. 1999, 54, 564–568. [Google Scholar]
  22. Le Coustumer, S.; Fletcher, T.D.; Deletic, A.; Barraud, S.; Lewis, J.F. Hydraulic performance of biofilter systems for stormwater management: Influences of design and operation. J. Hydrol. 2009, 376, 16–23. [Google Scholar] [CrossRef]
  23. Beven, K.; Germann, P. Macropores and water flow in soils revisited. Water Resour. Res. 2013, 49, 3071–3092. [Google Scholar] [CrossRef] [Green Version]
  24. Francis, G.; Fraser, P. The effects of three earthworm species on soil macroporosity and hydraulic conductivity. Appl. Soil Ecol. 1998, 10, 11–19. [Google Scholar] [CrossRef]
  25. Frouz, J.; Jilková, V. The effect of ants on soil properties and processes (Hymenoptera: Formicidae). Myrmecol. News 2008, 11, 191–199. [Google Scholar]
  26. Le Coustumer, S.; Fletcher, T.D.; Deletic, A.; Barraud, S.; Poelsma, P. The influence of design parameters on clogging of stormwater biofilters: A large-scale column study. Water Res. 2012, 46, 6743–6752. [Google Scholar] [CrossRef] [PubMed]
  27. Li, H.; Davis, A.P. Urban Particle Capture in Bioretention Media I: Laboratory and Field Studies. J. Environ. Eng. 2008, 134, 409–418. [Google Scholar] [CrossRef]
  28. Lassabatere, L.; Angulo-Jaramillo, R.; Goutaland, D.; Letellier, L.; Gaudet, J.P.; Winiarski, T.; Delolme, C. Effect of the settlement of sediments on water infiltration in two urban infiltration basins. Geoderma 2010, 156, 316–325. [Google Scholar] [CrossRef]
  29. Lloyd, S.; Wong, T. Paired Catchment Storm Event Monitoring: Assessing the Performance of a Bioretention System (Rain Garden). Australas. J. Water Resour. 2008, 12, 133–141. [Google Scholar]
  30. Jacobs, S.A.; Schubauer-Berigan, J.; Shuster, W.D.; Butler, B.; Mullane, J.; Balz, A.; Martin, E. Francis Rain Gardens in Cincinnati, Ohio: Monitoring the Performance of Green Infrastructure, EPA/600/R-15/xxx; Unpublished report. 2017.
  31. Jenkins, J.K.; Wadzuk, B.M.; Welker, A.L. Fines accumulation and distribution in a storm-water rain garden nine years postconstruction. J. Irrig. Drain. Eng. 2010, 136, 862–869. [Google Scholar] [CrossRef]
Figure 1. Site details for St. Francis rain garden network, drainage area, and conveyance infrastructure.
Infrastructures 02 00011 g001
Figure 2. Profile plots indicate Munsell color, horizon, and depth of horizon for design that the 2011 install was based on and the observed field soil profiles for the upper and lower sections of the rain garden network in 2015.
Infrastructures 02 00011 g002
Figure 3. Principal components explain 77 (A) and 73 (B) percent of total variance in the dataset, with scaled data evenly distributed around the space formed by the components. Note that the roles of F1 and F2 are complimentary, with total rainfall playing a major role in driving flows into, through, and out of the network. Average event rainfall intensity (Rint2), duration (Rdur2) loading along F2 appear to be largely independent of F1 hydrologic processes, with evapotranspiration losses (Etloss2) playing a more predominant role in the operational than construction phase along F2.
Infrastructures 02 00011 g003
Figure 4. Storm event factor scores are plotted pairwise (black line illustrates the respective factor scores for same event) against flow volume.
Infrastructures 02 00011 g004
Figure 5. Infiltration for organic, mineral soil layers in each of upper and lower rain gardens at St. Francis Apartments (Cincinnati OH), 2012–2016. For reference, the infiltration rate of surrounding turf areas is 0.6 ± 0.1 cm h−1.
Infrastructures 02 00011 g005
Table 1. Plant type and species, St. Francis rain garden, Cincinnati OH.
Type/SpeciesTarget Quantity or Coverage (m2)
SHRUBS
Viburnum lantana ‘Mohican’86 ea. potted starts
Mohican Viburnum
Itea virginica ‘Little Henry’77 ea. potted starts
‘Little Henry’ Sweetspire
GRASSES
Panicum virgatum ‘Shenandoah’80
‘Shenandoah’ Switch Grass
PERENNIALS
Asclepias tuberosa30
Butterfly Milkweed
Echinacea pupurea65
Purple Coneflower
Heliopsis helianthoides20
False Sunflower
Leucanthemum x superbum ‘Becky‘10
‘Becky’ Shasta Daisy’
Liatris spicata50
Blazing Star
Nepeta racemosa ‘Walker’s Low’30
‘Walker’s Low’ Catmint
Rudbeckia fulgida40
Black Eyed Susan
Salvia nemerosa ‘Marcus’35
Sage
Table 2. Monitoring data tracked annual warm season precipitation events’ total duration and total rainfall and flows into (Upper Event Q), from upper to lower (Lower Event Q), and out (Flow Q) of the two-tier rain garden. Flow as total percent is percent of Upper Event Q that Flow Q represents. Detention is the percent of Upper Event Q that Flow Q does not represent.
Duration
(h)
Total Rainfall
(mm)
Upper Event
Q (m3)
Lower Event
Q (m3)
Flow
Q (m3)
Flow as
Total (%)
Detention
(%)
Total 14623070366720351345..
Annual201226350041721521595
201340994018527696283466
20145526807967344165248
20152389406023172804753
Table 3. The number and percent of total events separated into different categories of flow severity, which is based on quantity.
Year# EventsComplete Retention (count, %)Threshold Flow (count, %)Large Flow (count, %)
Overall233198, 8517, 718, 8
20135745, 795, 97, 11
20145549, 903, 53, 5
20157968, 866, 85, 6
Table 4. Bulk density for different soil horizons in rain garden and turf areas, and a qualitative observation of macroinvertebrate activity.
LocationYearHorizonBulk Density (g cm−3; Mean ± S.E.)Macroinvertebrate Presence?
Upper2015Oi0.38 ± 0.02Y
Bw1.31 ± 0.04Y
2016Oi0.30 ± 0.02Y
Bw1.18 ± 0.04Y
Lower2015Oi0.32 ± 0.04N
Bw1.30 ± 0.05N
2016Oi0.29 ± 0.02N
Bw1.16 ± 0.05N
Turf A1.35 ± 0.05Y

