Performance of Two Bioswales on Urban Runoff Management


1
Department Land, Air, and Water Resources, University of California Davis, Davis, CA 95616, USA
2
USDA Forest Service, Urban Ecosystems and Social Dynamics Program, PSW Research Station, Albany, CA 95618, USA
3
Department of Environmental Toxicology, University of California Davis, Davis, CA 95616, USA
*
Author to whom correspondence should be addressed.
Infrastructures 2017, 2(4), 12; https://0-doi-org.brum.beds.ac.uk/10.3390/infrastructures2040012
Submission received: 22 July 2017
/
Revised: 15 September 2017
/
Accepted: 24 September 2017
/
Published: 27 September 2017
(This article belongs to the Special Issue Green Infrastructure for Sustainable Stormwater Management)
Abstract
:This study evaluated the effectiveness of two bioswales eight years after construction in Davis, California. The treatment bioswale measured 9 m × 1 m × 1 m (L × W × D). Engineered soil mix (75% native lava rock and 25% loam soil) replaced the native loam soil. Four Red Tip Photinia (Photinia × fraseri Dress) trees and two Blueberry Muffin Hawthorn (Rhaphiolepis umbellata (Thunb.) Makino) shrubs were planted in the bioswale. Runoff flowed into the bioswale from an adjacent 171 m2 panel of turf grass. An identically sized control bioswale consisting of non-disturbed native soil was located adjacent to the treatment bioswale. Surface runoff quantity and quality were measured during three experiments with different pollutant loads. When compared to the control, the treatment bioswale reduced surface runoff by 99.4%, and reduced nitrogen, phosphate, and total organic carbon loading by 99.1%, 99.5%, and 99.4%, respectively. After eight years, tree growth characteristics were similar across both sites.
1. Introduction
Managing urban runoff and its associated pollutants is one of the most challenging environmental issues facing urban landscape management. The conversion of naturally pervious land surfaces to buildings, roads, parking lots, and other impervious surfaces results in a rapid surface runoff response for both time of concentration and peak flow [1]. Impervious land surfaces adversely impact the quantity and quality of surface runoff because of their effects on surface water retention, infiltration, and contaminant fate and transport [2]. Large volumes of storm runoff from urbanized areas cause flooding, sewer system overflows, water pollution, groundwater recharge deficits, habitat destruction, beach closures, toxicity to aquatic organisms, and groundwater contamination [3,4,5]. Traditional urban runoff management focuses on removing the surface runoff from urban areas as soon as possible to protect public safety. However, as excess surface water is quickly drained from urban areas, it is no longer available for recharging groundwater, irrigating urban landscapes, sustaining wildlife habitat and other uses [6].
Green infrastructure uses natural or engineered systems that mimic natural processes to control stormwater runoff [7]. For example, traditional detention ponds have been widely used to treat storm runoff [8] and permeable paving promotes infiltration of rain where it falls. Importantly, decentralized green infrastructure strategies control runoff and contaminants at their source [9,10]. Vegetation is a green infrastructure strategy that can play an important role in surface runoff management [11,12,13]. Large-scale tree planting programs have been established in many cities to mitigate the urban heat island effect, improve urban air quality, and reduce and treat urban runoff [14]. There are municipal stormwater credit programs in a growing number of cities that promote retaining existing tree canopy, as well as planting new trees [15]. Although these programs encourage planning and management of urban forests to reduce runoff impacts [16], fertilizer (e.g., nitrogen, phosphorus) is required to promote plant growth, and these added nutrients may contribute to contamination of surface runoff [17,18]. Thus, reducing nutrients in storm runoff is a challenging task for landscape and water managers.
Bioswales are shallow drainage courses that are filled with vegetation, compost, and/or riprap. As a part of the surface runoff flow path, they are designed to maximize the time water spends in the swale, which aids in the trapping and breakdown of certain pollutants. Bioswales have been widely recognized as an effective decentralized stormwater BMP to control urban runoff [19]. Their effects are threefold; (1) vegetation intercepts rainfall reducing net precipitation [20]; (2) plant uptake of water via transpiration reduces soil moisture, thereby increasing subsurface water storage capacity, and (3) root channels improve infiltration [21,22].
Traditional bioswales are designed to remove silt and other pollutants from surface runoff waters. New bioswales are being developed for harvesting surface runoff and supporting urban tree growth [23]. Bioswales that integrate engineered soil mixes (ESM) and vegetation are being used to enhance treatment and storage of surface runoff [24]. The composition of ESMs varies widely, from simple mixtures of stones and native soil [23] to patented commercial products [25]. Highly porous ESM mixes provide ample infiltration and pore space for temporary storage of surface runoff. Also, they support tree growth by providing more water and aeration to roots than compacted native soil alone [13]. ESMs can reduce conflicts between surface roots and sidewalks by promoting deeper rooting systems [25,26]. In California alone, over $70 million is spent annually to remediate damage by shallow tree roots to sidewalks, curbs and gutters, and street pavement [27].
In Davis, California, a bioswale installed next to a parking lot reduced runoff from the parking lot by 88.8% and the total pollutant loading by 95.4% during the nearly two year monitoring period [23]. Furthermore, a bioswale installed next to a turf grass patch at the University of California-Davis campus eliminated dry weather runoff from an irrigated urban landscape [28]. The ESM used in these studies offered several advantages over other ESMs because the main structural element was locally quarried and relatively inexpensive lava rock (75% lava rock and 25% loam soil by volume). This ESM had a high porosity, high infiltration rate, and a high water storage capacity (porosity 45.3%, field capacity 20.0%, saturated hydraulic conductivity >58.4 cm h−1). The lava rock had many interstitial pores and a high surface area to volume ratio. It effectively fostered the growth of biofilms that retain nutrients and degrade organic pollutants [29]. Because vegetated bioswale research is in its infancy, very few studies have monitored vegetation growth and its impacts on bioswale performance. Moreover, evaluation of system performance is generally conducted before vegetation is fully established [23,30]. In contrast, this study evaluated the effectiveness of two bioswales on surface runoff reduction, pollutant reduction, and tree growth eight years after construction. The control bioswale contained native soil and the treatment contained an ESM. At the time of this study, the trees in the control and treatment bioswales were fully established and approaching mature size. Measurements recorded the differences in surface runoff dynamics and pollutant reduction rates, as well as tree and shrub growth. This study provides new information on the long-term effectiveness of engineered bioswales in a region with a Mediterranean climate.
2. Methods
2.1. Study Site
The field experiments were conducted at the University of California Davis campus (121°46′32″ W, 38°32′09″ N). Davis is located in the heart of the Central Valley of California, between the Coastal Range and the Sierra Nevada Mountains. The topography is relatively flat (<2% slope). The climate is Mediterranean with hot, dry summers and cool, wet winters (it rarely snows). On average, 90% of the annual precipitation (446 mm) occurs between November and April. Prior to urban development, the land cover of this region was farm land, dirt roads, wetlands, and scattered groundwater-utilizing oak trees. After a century of development, the primary land cover is buildings, parking lots, impervious roads and paths, and residential trees and grass. The experimental site was near the Buehler Alumni/Visitor Center on the University of California Davis campus (Figure 1). The site is fully accessible to the public. The 341.1 m2 experimental site was first used for turf grass research and configured as a rectangular turf grass patch (southwest side, 20.7 m × 14.6 m) with an adjacent bare soil strip (northeast side, 20.7 m × 1.8 m). The site was slightly elevated and gently sloped (~3%) to the northeast for drainage. Surface runoff from the turf grass area passed through the bare soil strip before discharging to an adjacent storm drainage ditch. The soil at the experimental site was a Yolo loam (fine-silty, mixed, superactive, nonacid, thermic Mollic Xerofluvents, porosity 46.0%, field capacity 36.0%, saturated hydraulic conductivity 2.0 cm h−1), and is considered one of the best agricultural soils in California [31,32].
2.2. Experimental Design
The turf grass patch and bare soil strip were divided into equal-sized (16.5 m × 10.4 m) control and treatment plots (Figure 1). To separate surface runoff, a 16.5 m long, 5.1 cm wide, and 20.3 cm high redwood board with 2.5 cm exposed above ground divided the plots. The bioswalewas were constructed on the bare soil strip (next to the turf grass patch) for each plot. The control and treatment plots drained into their adjacent bioswales along the northeast edge of the experimental site. The two bioswales were identical except the control plot had undisturbed native soil.
The treatment plot bioswale was created by digging a 0.6 m wide, 0.9 m deep, and 9.1 m long trench in the middle of the bare soil patch that was refilled with ESM (0.6 m deep). During installation, the ESM was packed with a lawn roller (Model PRC-24BH, Brinly-Hardy Company, Jeffersonville, IN, USA). A sheet of geotextile (Tencate Mirafi® 180N, TenCate Corporation, Overijssel, The Netherlands) was layered over the ESM to prevent fine soil and sediment from entering the ESM system and reducing its porosity. Native soil was placed on top of the geotextile fabric (0.3 m deep). Four Red Tip Photinia (Photinia × fraseri Dress) trees and two Blueberry Muffin Hawthorn (Rhaphiolepis umbellate ‘Blueberry Muffin’) shrubs were planted in each of the bioswales. All of these shrubs were selected from a local retail nursery. Individual plants of the same species were selected to be of similar size (i.e., height and crown diameter) and appearance.
Collection of surface runoff is described in detail in Xiao and McPherson [23]. In brief, surface runoff from the bioswale was directed into an underground storage tank via a PVC pipe. A submergible water pump located inside the storage tank was used to measure and transfer the runoff to the adjacent drainage ditch. A flow-proportional sampling design was used to collect composite samples for water quality analysis. Landscape management was performed on a regular basis following standard practices.
Bioswale construction and field measurements were conducted during summer 2007. The treatment plot bioswale was designed to eliminate runoff from a 100-year storm event, or a 10-year, 24-h storm event equivalent to 8.6 cm rainfall. This 8.6 cm of rainfall is 97% of all annual rainfall events [33].
2.3. Synthetic Pollutants and Rainfall
To evaluate bioswale effectiveness, synthetic pollutants and irrigation water were used. Water soluble fertilizer (Nutra-Builder 20-20-20, Custom Ag Formulators, Inc., Fresno, CA, USA) was applied to both sites at 2, 3, and 4 times the manufacturer’s recommended application rate (1.12 g m−2) before irrigation commenced. These concentrations represented low (LPL), medium (MPL), and high (HPL) pollutant loadings, respectively. Irrigation was applied to simulate rainfall and generate surface runoff. The irrigation system included 12 sprinklers (2045A-SAM rotor, Rain Bird Corporation, Azusa, CA, USA) with an application rate of 3.2 cm h−1. The irrigation water source was the local municipal water supply system.
2.4. Field Data Collection
2.4.1. Sampling and Experiment Duration
The water collection system was installed in 2007 to collect composited samples from natural runoff (i.e., runoff from precipitation and regular irrigation). In this study, surface runoff samples from the control site were collected at a high frequency using grab samples to better observe pollutant concentration dynamics for each experiment throughout a storm hydrograph.
A test run was conducted on 10 October 2013 to determine the optimal runoff sampling time intervals and the number of samples needed to capture the peak and total loadings. For the test run, the water soluble fertilizer was applied to both of the sites at a rate of 2.24 g m−2. Grab samples were collected at a 10-min frequency over a two hour irrigation period from the control site. Water samples were collected immediately before the runoff was directed to the underground tank. The water samples were coarse filtered during sample collection with coffee filters (BUNN Quality Paper Filter 20100.0000, Bunn-O-Matic Corporation, Moonachie, NJ, USA) to remove large tree leaves, grass clippings and large soil particles. Based on the results of the test run, the water sampling frequency for subsequent trials was extended to six hours with a variable sampling interval (increasing sample collection interval with increasing time) to better characterize the runoff pollutant pattern.
The composite water sample from the treatment site was used for calculating the total loading of the treatment site where little surface runoff occurred in this study. A 5.1 cm diameter and 0.9 m long PVC drainage pipe (made of from 5.1 cm PVC smooth-wall pipe, 1.59 cm diameter holes were drilled on the pipe at 60 degree and 5.1 cm intervals) was vertically installed into the middle of the treatment bioswale to collect a representative water sample for monitoring pollutants concentration dynamics in the bioswale.
The treatment site water samples were not affected by successive flow from the control site because the treatment site was located upslope of the control site. The water sample collected from the control site was surface runoff, which was not affected by subsurface flow of the treatment site because of the site’s relatively flat surface.
2.4.2. Data Collection
Three types of data were collected: surface runoff quantity, surface runoff quality, and tree size. The field experiments were conducted from 6 April 2014 through 14 April 2014. They began with LPL, followed by MPL, and concluded with HPL. Each experiment was separated by three days to restore the plots to their baseline conditions [34]. Runoff quantity was automatically collected based on the amount of water pumped out from the underground storage tank. At the control site, surface runoff grab sampling (at the same location as the test run) intensity was relatively high to effectively capture temporal changes in pollutant loading.
Tree size measurements were collected prior to the start of this field experiment and included tree height (TH, measured with a fiberglass measuring stick), crown diameter (CD), and diameter at breast height (DBH) (1.37 m, measured with a DBH tape).
2.5. Water Quality Analysis
Water quality parameters were analyzed using standard analytical methods. Conventional physical properties such as pH and electrical conductivity (EC) were analyzed using laboratory meters. The samples for dissolved nutrient analysis were filtered into acid-washed and pre-rinsed 30 mL HDPE bottles using a 0.2 μm polycarbonate membrane filter. Filtered water samples were analyzed for nitrate (NO3-N) using the vanadium chloride spectroscopic method (method detection limits (MDL) = 0.01 mg L−1) [35], and ammonia (NH4-N) by the spectroscopic Berthelot reaction using a salicylate analog of indophenol blue (MDL = 0.01 mg L−1). Determination of soluble-reactive PO4 (SRP) was made using the ammonium molybdate method (MDL = 0.005 mg L−1) [36]. Spectroscopic quantification of total nitrogen (TN) and total phosphorus (TP) was conducted following oxidation with 1% persulfate using the methods described above for NO3− and SRP, respectively. Total organic nitrogen (TON) was calculated by subtracting dissolved inorganic nitrogen from TN. Dissolved organic carbon (DOC), total organic carbon (TOC), and total carbon (TC) measurements were performed using a UV enhanced-persulfate TOC analyzer (Phoenix 8000, Teledyne Tekmar, Mason, Ohio; MDL ~0.1 mg L−1). Total inorganic carbon (TIC) was determined as the difference between TC and TOC. Two Metrohm ion chromatographs (881 Compact IC Pro) equipped with conductivity detectors and a shared autosampler were utilized for the analysis of major anions (chloride (Cl−) and sulfate (SO42−)) and cations (sodium (Na+), potassium (K+), calcium (Ca2+), and magnesium (Mg2+)). Details on the analysis of these ions are given in Ge et al. [37]. The instrument detection limits were determined as follows (mg L−1): Cl− (0.02), SO42− (0.05), Na+ (0.05), K+ (0.05), Ca2+ (0.08), and Mg2+ (0.08). Laboratory quality-assurance and quality-control followed the Surface Water Ambient Monitoring Program protocols (http://www.waterboards.ca.gov/water_issues/programs/swamp/qamp.shtml). For each sample collection, 10% of the samples were replicated and analyzed with a laboratory blank, two matrix spikes, as well as a laboratory control standard.
The pollutant concentrations measured for each sample were assumed to represent the mean concentration for each sample interval. The total loading from each experiment was calculated as
where TL is total loading, i is sample sequence, ci is pollutant concentration of sample i, and qi is total surface runoff volume measured between sample (i − 1) and sample i.
For the treatment plot, the composited water sample collected in each experiment was used to calculate the loading, because only a small amount of surface runoff occurred from the treatment bioswale.
Pollutant reductions (R) were estimated as the ratio of the loading difference between control site loading (C) and treatment site loading (T) to the control site loading: R = (C − T)/C.
3. Results and Discussion
3.1. Sampling and Experiment Duration
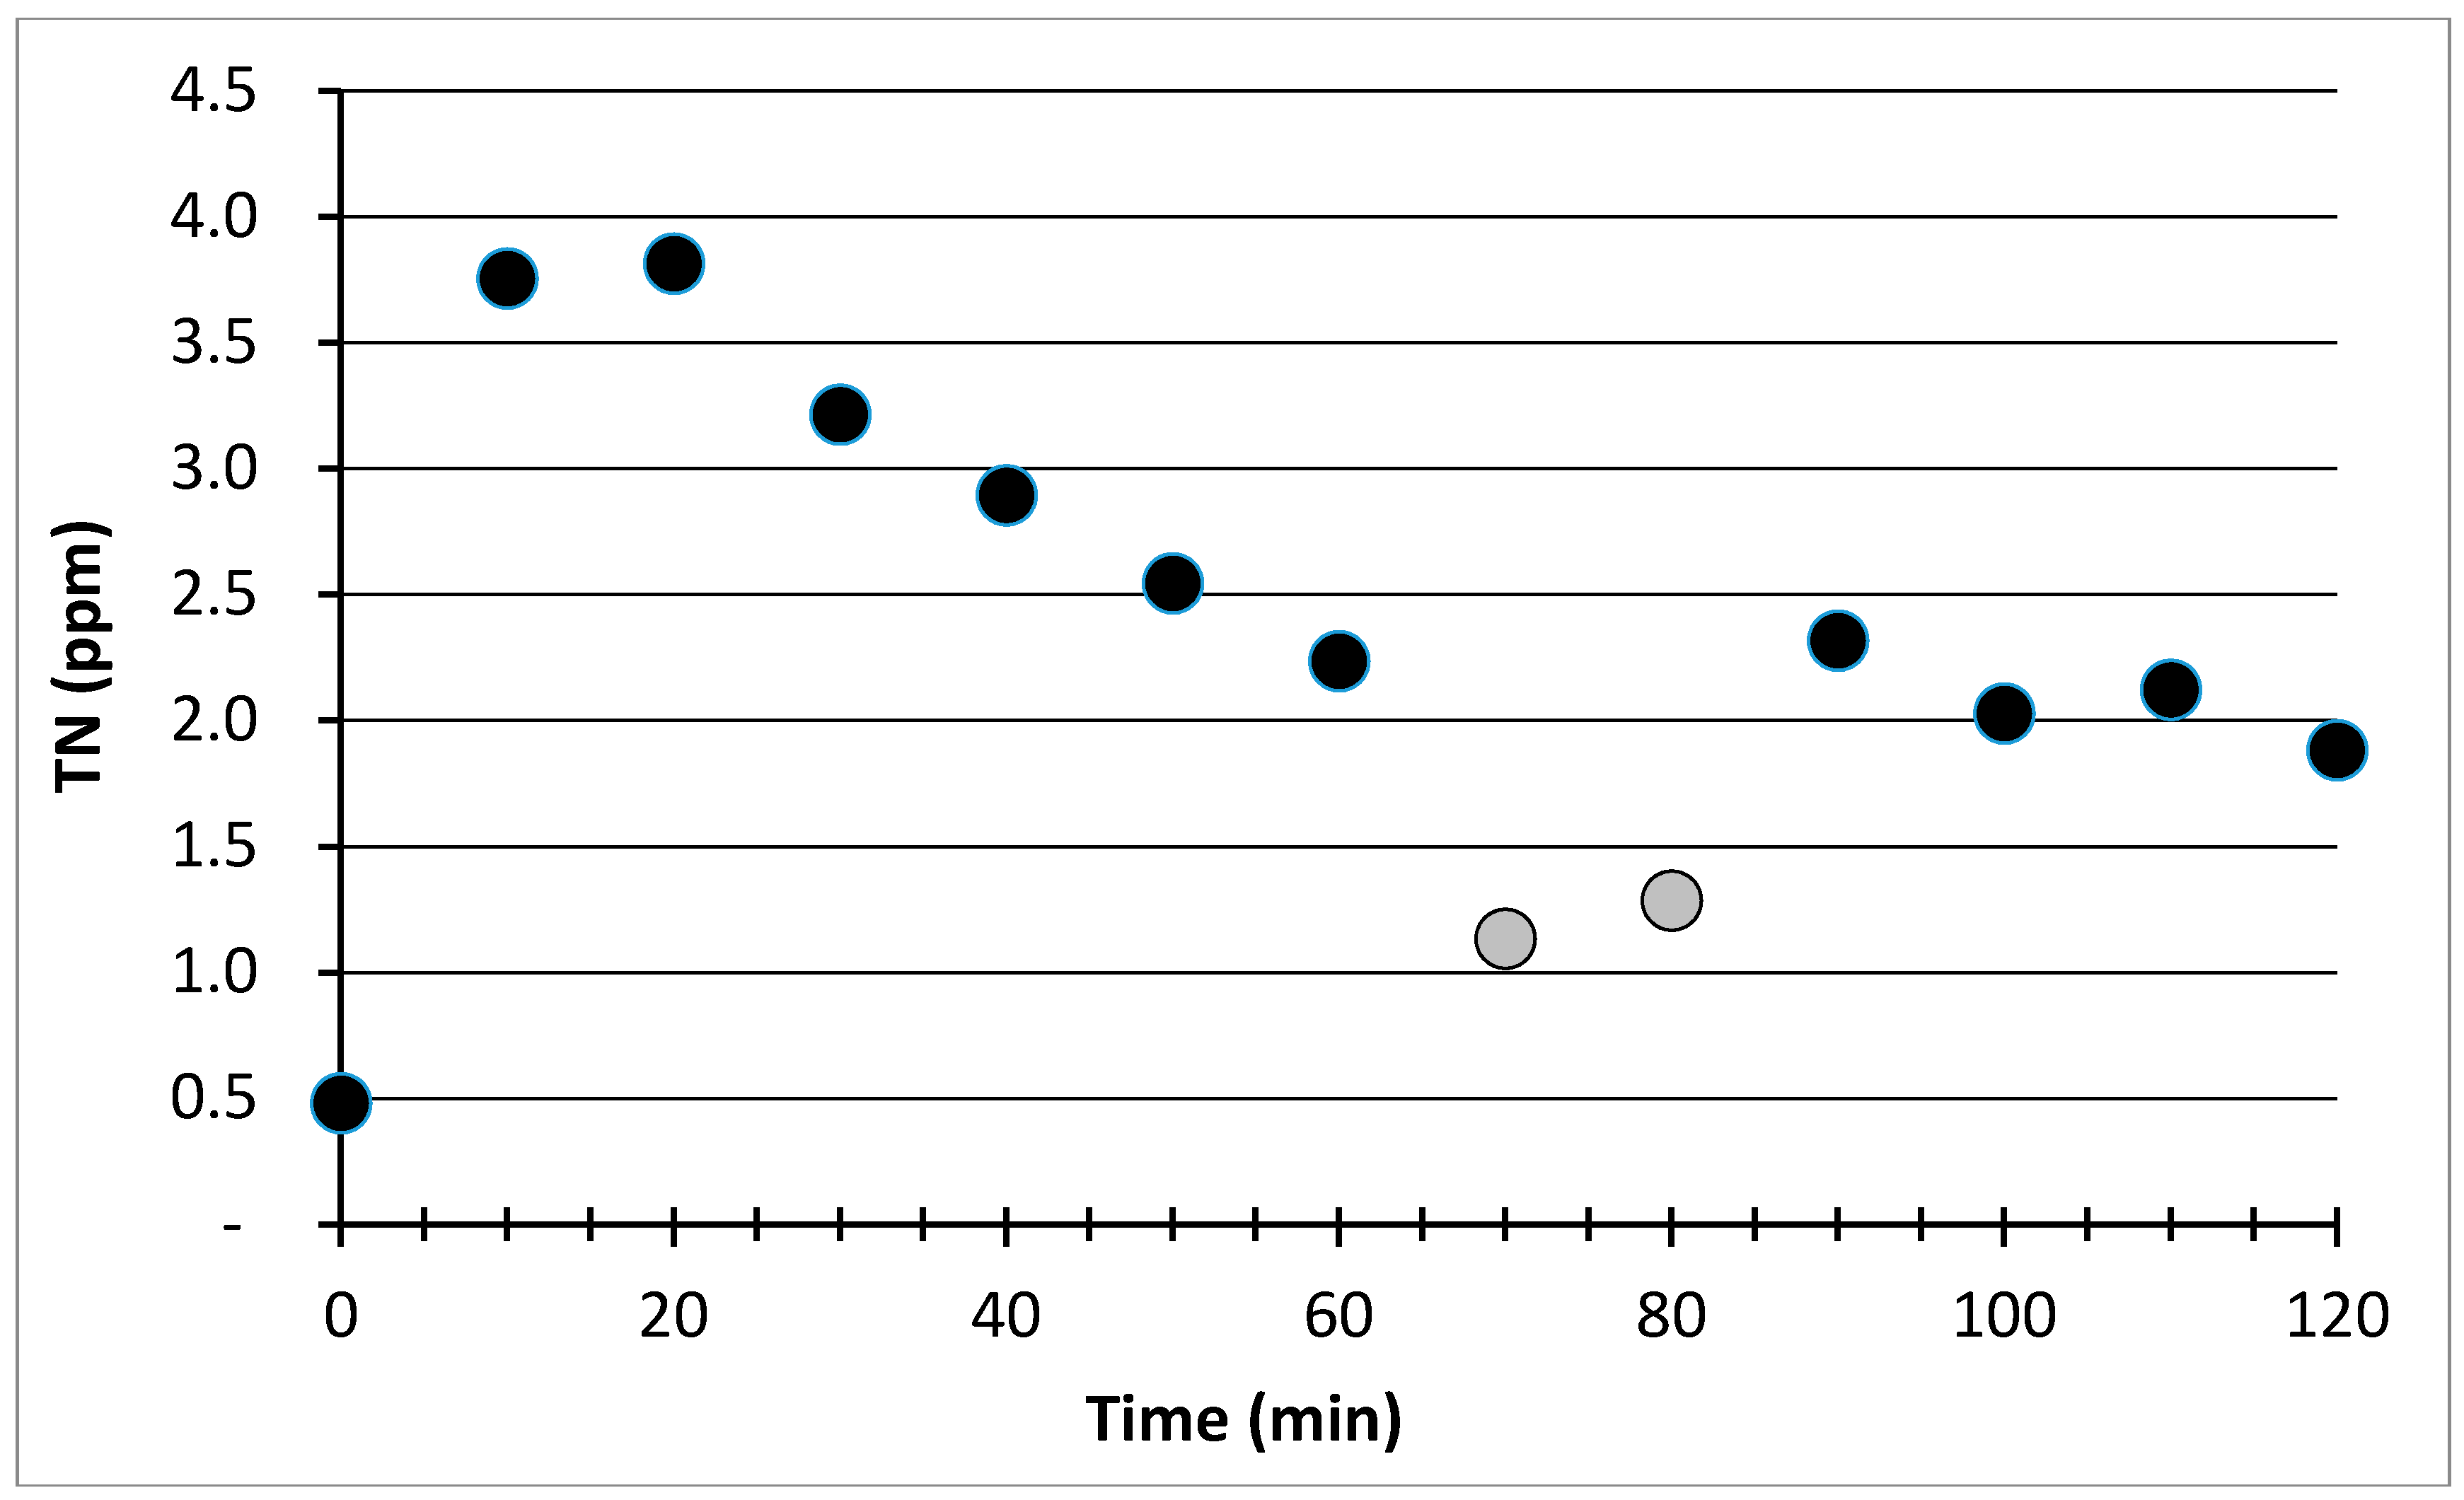
TN concentration (0.5 mg L−1) at time zero reflects the background concentration of the irrigation water source (Figure 2). A portion of water samples 8 and 9 (gray color dots in Figure 2) were collected directly from the irrigation water supply because the sprinkler near the sampling location failed. The broken sprinkler was repaired prior to collection of the 10th water sample. The peak TN concentration in the test run occurred about 20 min after the start of irrigation and gradually decreased to a relatively steady concentration after 60 min (Figure 2). The TN concentration at 120 min was 3–4 times higher than the background level.
3.2. Runoff Reduction
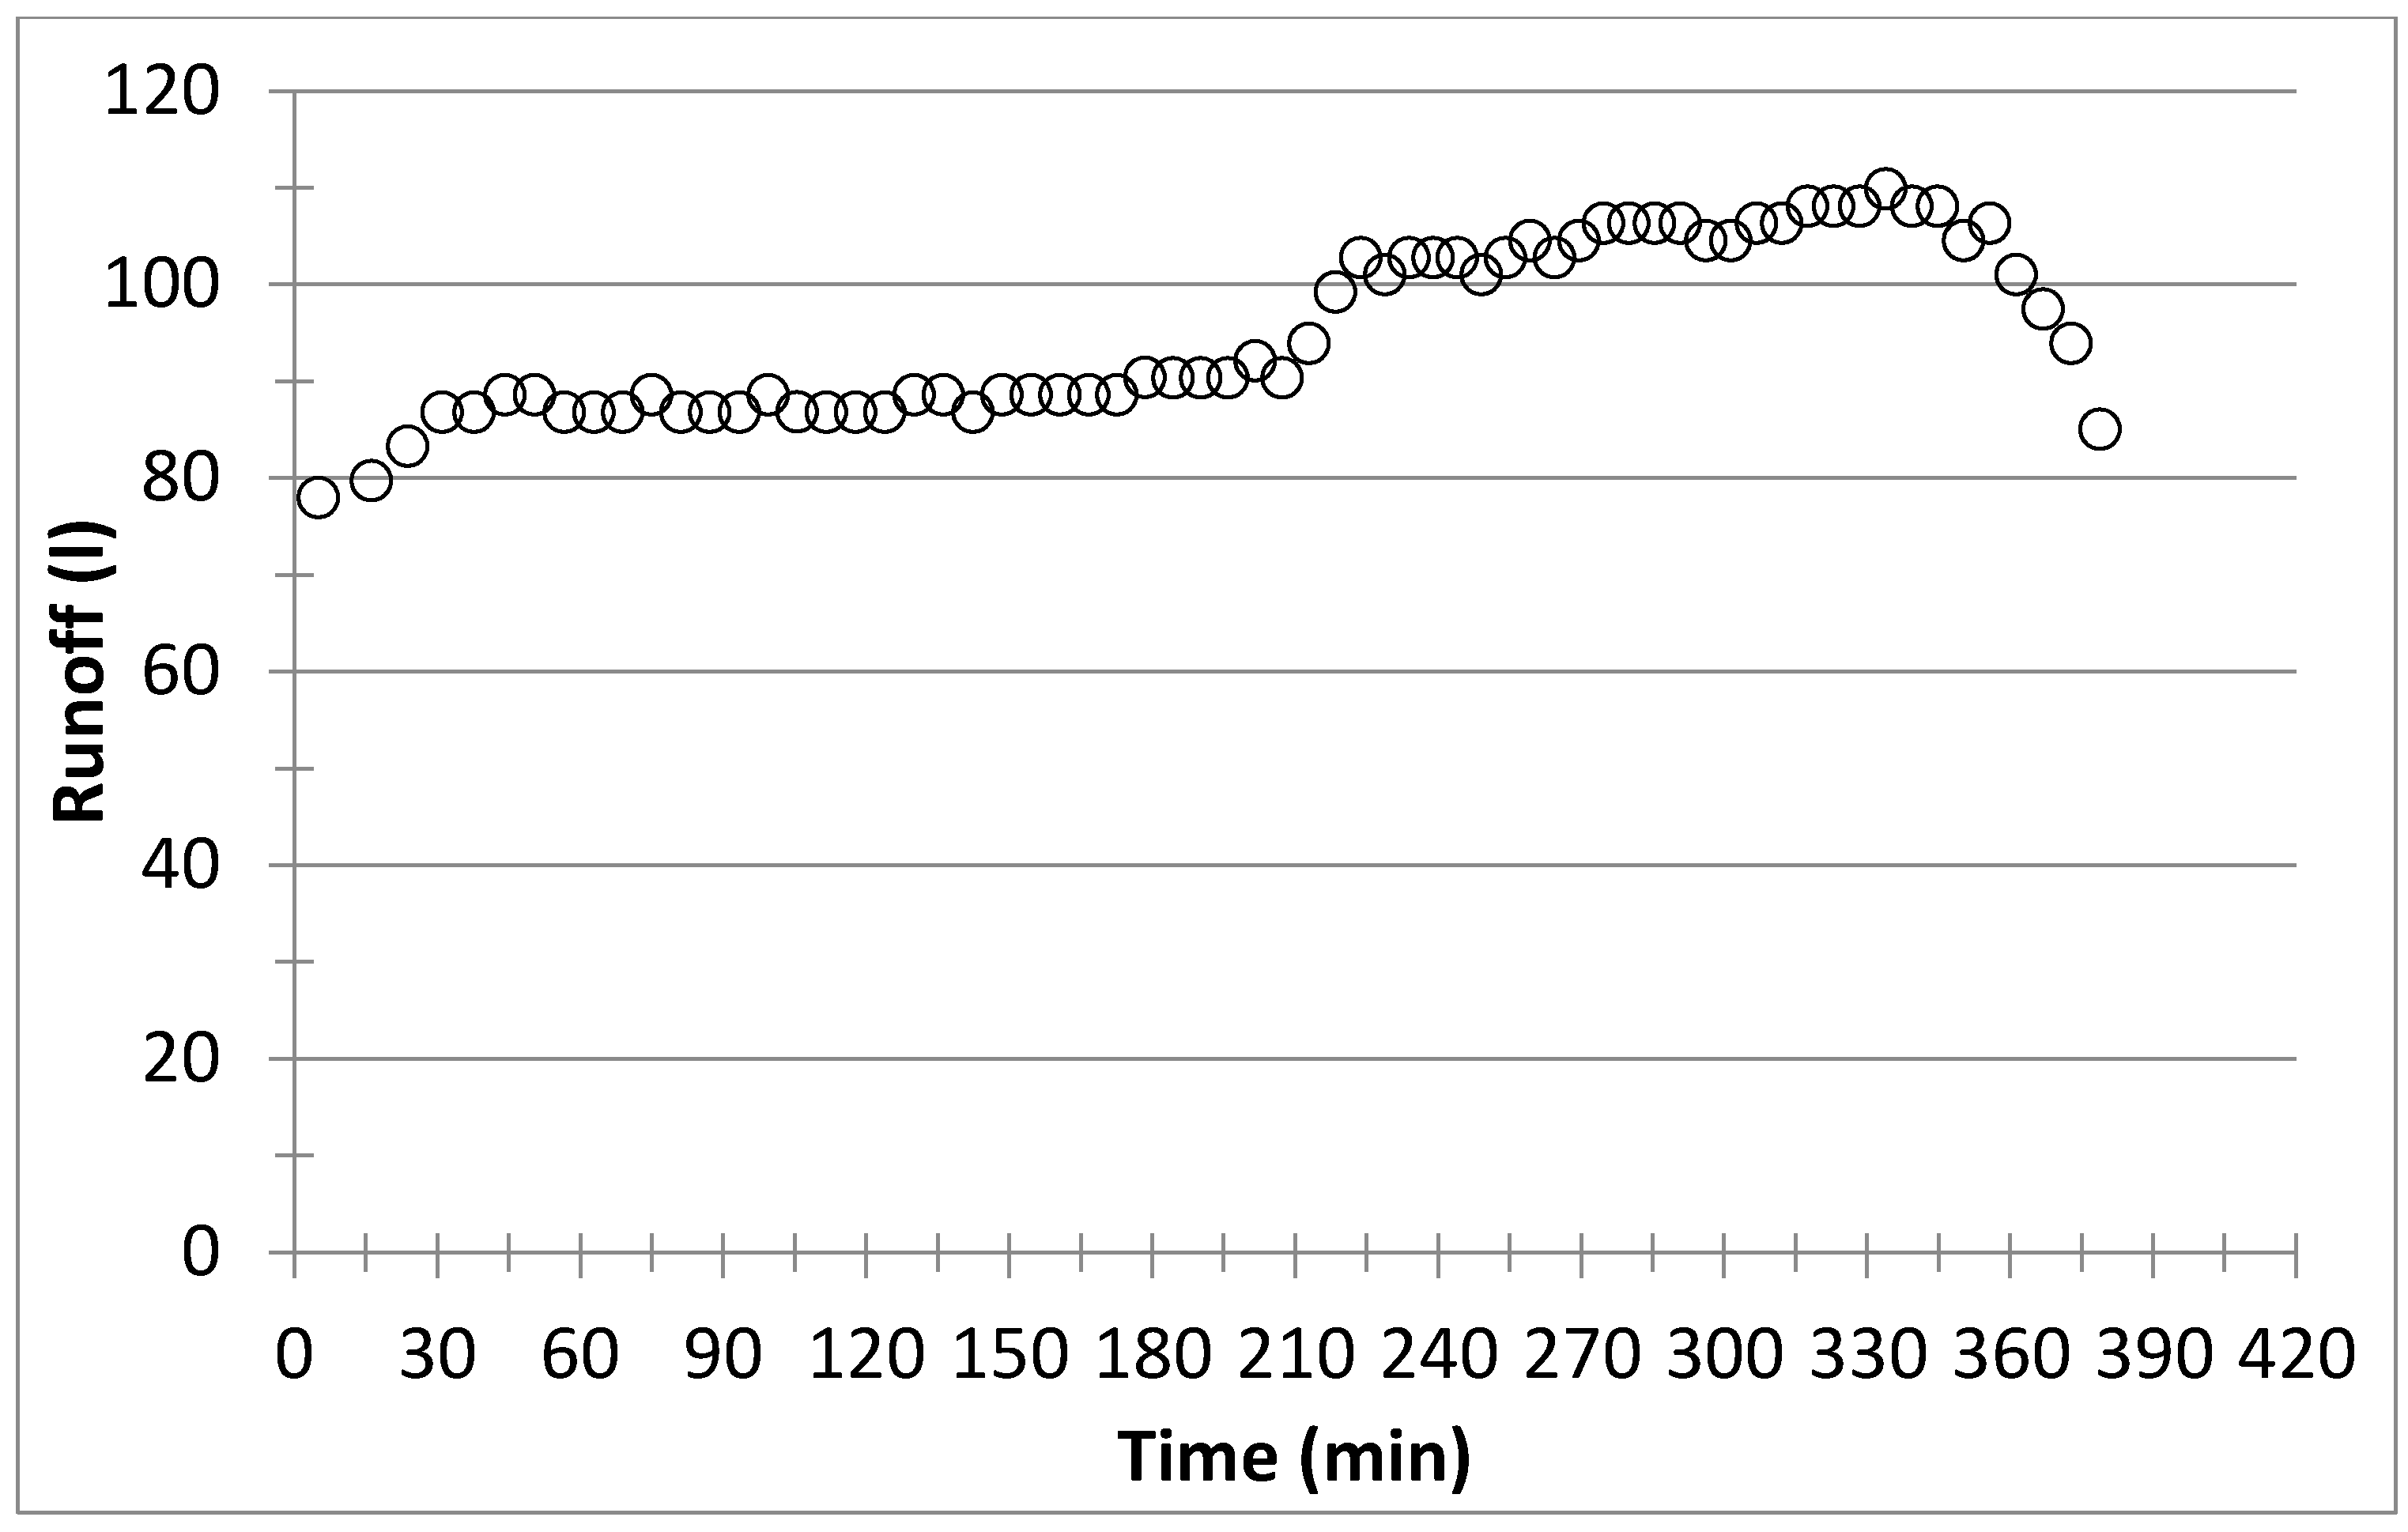
The control site yielded a measurable surface runoff within 5 to 15 min after irrigation commenced across the three pollutant loading experiments. In contrast, only a little runoff was observed from the treatment bioswale near the end of each experiment. The treatment bioswale eliminated more than 99.4% of the surface runoff across all three experiments (Table 1). The runoff hydrograph for the control site of the LPL experiment plateaued after 60 min, corresponding to saturation of both the turf grass surface and top soil layer (Figure 3). After four hours of irrigation, surface runoff reached a second plateau, indicating that the infiltration of moisture into the soil profile reached an equilibrium status. Similar surface runoff patterns were found for the MPL and HPL experiments.
The treatment plot had an exceptionally high infiltration rate and storm runoff storage capacity (i.e., the pore space difference between total porosity and field capacity). During this field trial, the amount of irrigation applied was more than two times that of a 100-year storm event. The treatment bioswale functioned at design capacity to reduce more than 99% of the potential surface runoff. The infiltration rate of the treatment bioswale was restricted only by the underlying native soil layer. The ability of this bioswale to retain runoff gradually decreased with successive rainfall events as the underlying soil layer became saturated. Once the soil became saturated, infiltration was regulated by the least permeable soil layer. Therefore, in regions where local soils have low infiltration/permeability rates, bioswales may become saturated rather quickly, limiting their capacity to retain runoff during long rainfall events.
3.3. Pollutant Reduction
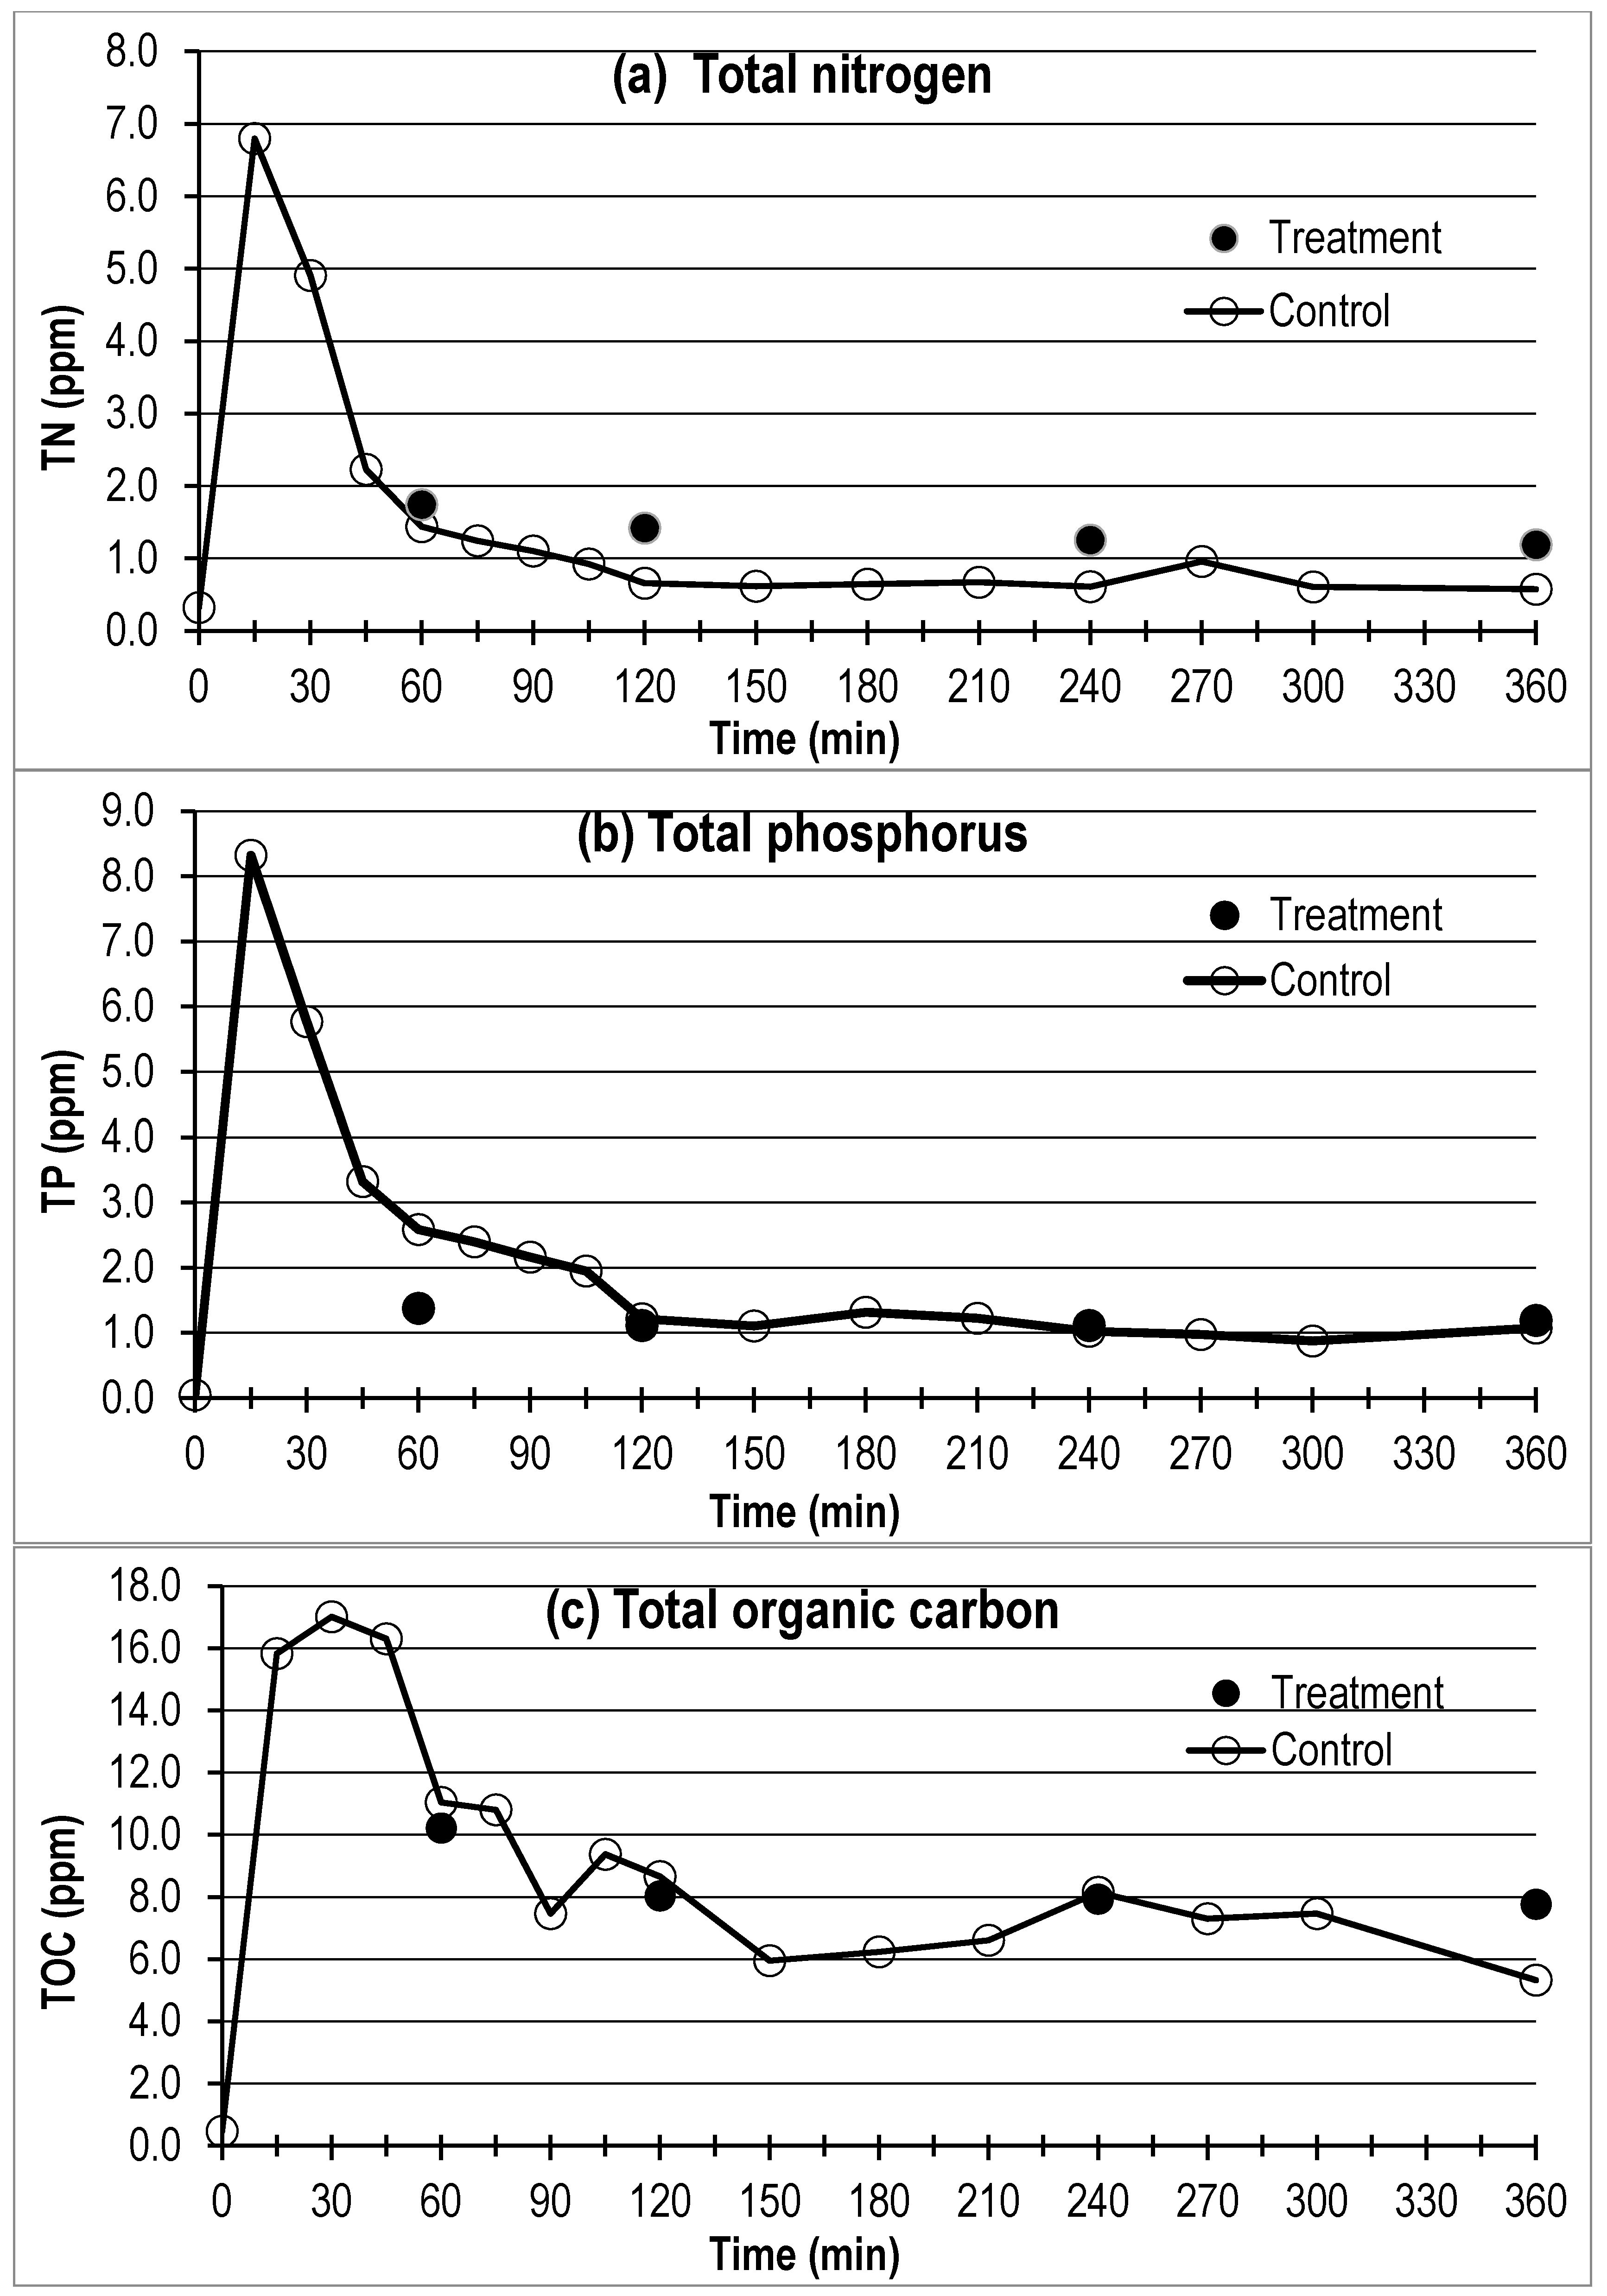
In the control site, nutrient (i.e., N, P, and K) concentrations from the HPL experiment were consistently higher than concentrations from the LPL and MPL experiments. In contrast, the highest concentrations of TOC and DOC were found in the LPL experiment (Table 2). Because the nutrients analyzed in this study were from the application of soluble fertilizer, it was not surprising that concentrations were related to the application rates. However, because organic carbon originates primarily from decomposed grass clippings and tree leaves, water samples from the first experiment (i.e., LPL experiment) had the highest organic carbon concentrations. Peak TN and TP concentrations for the HPL experiment occurred about 15 min after initiation of irrigation (i.e., time zero) and the concentration gradient diminished after 45 min in the control site (Figure 4a,b). The low concentrations of TN and TP at time zero reflect the quality of the irrigation water source. The concentrations showed relatively little change over time in the ESM treatment bioswale because water samples were taken from water stored in the bioswale soils rather than surface runoff. The ESM treatment bioswale detained runoff and limited surface runoff from the bioswale system, thereby functioning like a water quality buffer by diluting the pollutant concentration in the system. The TOC concentration increased during the first 30 min and then began to decrease (Figure 4c). Increased irrigation duration resulted in depletion of available organic carbon that could be mobilized by surface runoff.
The pH ranged from 7.90 to 8.24 for the control site and 8.07 to 8.20 for the treatment site. The relatively high pH values indicate that alkalinity was not elevated by the ESM used in this bioswale [13]. The high pH and alkalinity results from the relatively poor quality of the irrigation water originating from groundwater. The groundwater sources are from marine sedimentary rocks of the Coastal Range, which have high salt and carbonate levels. The irrigation water supply had an average pH value of 8.79, and its hardness was as high as 890 ppm [38]. Another factor that contributed to the accumulation of salts in the soil was the 2013–2014 drought, which resulted in very little soil leaching in the year prior to this study [39]. Without leaching from winter precipitation, the salts accumulated in the surface soil layer. The cations were mainly Na+, Ca2+, and Mg2+, and the anions were mainly Cl−, SO42−, and HCO3−. Concentrations of these major cations and anions did not show significant variation from sample to sample, indicating that their dominant source is the irrigation water. The high TIC (primarily as HCO3−) in all water samples reflects the high carbonate concentrations of the groundwater used for irrigation.
On average, the bioswale with ESM reduced pollutants carried in surface runoff by more than 99.5%. The average pollutant loading reduction rate was 99.6% (range from 96.4 to 99.7%), 99.5% (range from 98.8 to 99.5%), and 99.4% (range from 98.4% to 99.7%) for the LPL, MPL, and HPL experiments, respectively (Table 3).
This treatment bioswale had slightly higher pollutant reduction rates as compared to the bioswale with ESM installed adjacent to a parking lot in a previous study [23]. The parking lot bioswale reduced the nutrients by 95.3% and organic carbon by 95.5%. The peak pollutant concentration reduction rates found in this study were a minimum of 53% higher than those reported in the parking lot study. One possible explanation for this difference is that the trees and shrubs in the bioswale were more extensive and older than the tree in the parking lot site. Tree and shrub roots can function as a biofilter, where pollutants are immobilized, transformed, or degraded [40,41]. Although data were not available for belowground biomass, a more extensive rooting system and associated microorganisms in this study’s bioswale could be partially responsible for its improved performance. Another possible explanation is the difference in pollutant inflows. The primary pollutant source in the parking lot study was from atmospheric deposition, with lower concentrations when compared to the fertilizer rates applied in this study. Stormwater BMPs, such as bioswales, are reported to have higher removal rates when treating stormwater with high inflow concentrations [42].
Concentration of Zn, Cd, Ni, Cu, and Pb are key water quality concern parameters. They were excluded from this analysis because their concentrations were below detection levels in the irrigation source waters and these metals are not identified as impairments in the study area [23].
3.4. Tree Growth
In this study, tree size was measured for the four Red Tip Photinia trees on the control and treatment sites and mean sizes were similar across sites (Table 4). Trees on the control site had a slightly larger mean DBH and height (HT), but the difference was less than 2%. The average tree crown projection area (CPA) (area under the crown based on measured crown diameter) was 4% larger for trees in the treatment bioswale than the control. Because the trees were of comparable size it can be inferred that the ESM did not change vegetative growth relative to the native soil under this study’s maintenance regime. The trees in this experiment were planted adjacent to the turf and did not receive direct irrigation. Rather, their roots scavenged water and nutrients from the upslope irrigated turf runoff. To the extent that the ESM in bioswales become moisture supplies for tree roots, they may reduce irrigation demand.
In contrast to the rapid growth of the Red Tip Photinia trees, the four Blueberry Muffin Hawthorn shrubs (two plants in each bioswale, planting size (i.e., nursery stock size): HT: 0.46 ± 0.03 m, and CD: 0.46 ± 0.03 m.) exhibited little growth. Their growth was stunted by heavy shade cast by the photinia above them.
3.5. Study Limitations
The interpretation of results from this study is subject to some limitations. Pollutants can leave the system via infiltration deeper into the soil and potentially enter the groundwater. Deep leaching can be an important flow path affecting the fate of pollutants, and was not included in the scope of this study. Caution should be taken regarding the potential for groundwater contamination when considering the use of ESM in bioswale projects. In this experiment, the trees were eight years old and their root systems were well established. Trees received excess surface irrigation runoff during the hot/dry summer. Because the ESM in this study was 75% lava rock it may not retain enough moisture for tree roots during long dry periods. Trees in bioswales with ESM may require more irrigation than trees in native soils, especially for establishment.
In this study, the pollutants were artificially added to the system by using dissolved fertilizer. Actual storm runoff includes pollutants from atmospheric deposition and has a more complex mixture of pollutants. These factors introduce uncertainty in extrapolating the pollutant reduction efficiency of the bioswale to other sites. It is unclear whether all of the pollutants retained by the bioswale were fully retained by the vegetation and soil, or if a portion of these pollutants were only temporarily immobilized in the system by the soil-tree root system.
The bioswale system tested in this study was eight years old, relatively young when compared to its 20 to 30 year life expectancy. Long-term monitoring of system performance is needed to document bioswale performance over longer time periods typical of urban green infrastructure. Additional research is needed that follows the fate and transport of pollutants after infiltration. In particular, chemical analyses of soil and tree samples are needed to understand the fate and transport of the pollutants in the bioswale system.
4. Conclusions
This study demonstrated the effectiveness of using bioswales to reduce surface runoff, remove pollutants from surface runoff, and support tree growth in an urban landscape. After eight years, the bioswale using ESM was functioning at the designed capacity. The bioswale with ESM reduced much more runoff and pollutants when compared with a traditional control plot bioswale using native soil. The study confirms that bioswales with ESM can be a highly effective stormwater BMP in the suite of green infrastructure strategies. Trees planted in the ESM grew as well as the trees planted in the native productive agricultural soil, even though they did not receive direct irrigation. By planting drought tolerant tree species in bioswales, managers can achieve both dry and wet weather runoff management, while increasing the extent of urban tree canopy.
Acknowledgments
We would like to express our appreciation to Jianguo Chen, Ron E. Lane, Scott Sennello, and Xien Wang of University of California-Davis for their assistance in site selection, field installation, and water quality analysis. This research was supported in part by funds provided by the USDA Forest Service Pacific Southwest Research Station and by the California Landscape Contractors Association.
Author Contributions
Qingfu Xiao and Gregory McPherson conceived and designed the experiments; Qingfu Xiao performed the experiments; Qi Zhang, Xinlei Ge and Randy Dahlgren analyzed the data and contributed reagents/materials/analysis tools; Qingfu Xiao and Gregory McPherson wrote the paper.
Conflicts of Interest
This research was supported in part by funds provided by the Pacific Southwest Research Station, Forest Service, U.S. Department of Agriculture. The founding sponsors had no role in the design of the study; in the collection, analyses, or interpretation of data; in the writing of the manuscript, and in the decision to publish the results.
References
- Arnold, C.L.; Gibbons, C.J. Impervious surface coverage: The emergence of a key environmental indicator. J. Am. Plan. Assoc. 1996, 62, 243–258. [Google Scholar] [CrossRef]
- Miller, J.D.; Kim, H.; Kjeldsen, T.R.; Packman, J.; Grebby, S.; Dearden, R. Assessing the impact of urbanization on storm runoff in a pen-urban catchment using historical change in impervious cover. J. Hydrol. 2014, 515, 59–70. [Google Scholar] [CrossRef] [Green Version]
- Mikkelsen, P.S.; Hafliger, M.; Ochs, M.; Jacobsen, P.; Tjell, J.C.; Boller, M. Pollution of soil and groundwater from infiltration of highly contaminated stormwater—A case study. Water Sci. Technol. 1997, 36, 325–330. [Google Scholar]
- Xiao, Q.; McPherson, E.G. Rainfall interception by santa monica’s municipal urban forest. Urban Ecosyst. 2002, 6, 291–302. [Google Scholar] [CrossRef]
- USEPA. National Management Measures to Control Nonpoint Source Pollution from Urban Areas; Office of Water, U.S. Environmental Protection Agency: Washington, DC, USA, 2005; p. 518.
- Xiao, Q.; McPherson, E.G.; Simpson, J.R.; Ustin, S.L. Hydrologic processes at the urban residential scale. Hydrol. Process. 2007, 21, 2174–2188. [Google Scholar] [CrossRef]
- Foster, J.; Lowe, A.; Winkelman, S. The Value of Green Infrastructure for Urban Climate Adaptation; Center for Clean Air Policy: Washington, DC, USA, 2011. [Google Scholar]
- Martin, E.H. Effectiveness of an urban runoff detention pond-wetlands system. J. Environ. Eng. 1988, 114, 810–827. [Google Scholar] [CrossRef]
- Cutter, W.B.; Baerenklau, K.A.; DeWoody, A.; Sharma, R.; Lee, J.G. Costs and benefits of capturing urban runoff with competitive bidding for decentralized best management practices. Water Resour. Res. 2008, 44, 542–547. [Google Scholar] [CrossRef]
- Stephens, D.B.; Miller, M.; Moore, S.J.; Umstot, T.; Salvato, D.J. Decentralized groundwater recharge systems using roof water and storm water runoff. J. Am. Water Resour. Assoc. 2012, 48, 134–144. [Google Scholar] [CrossRef]
- Mazer, G.; Booth, D.; Ewing, K. Limitations to vegetation establishment and growth in biofiltration swales. Ecol. Eng. 2001, 17, 429–443. [Google Scholar] [CrossRef]
- Wong, T.H.F.; Fletcher, T.D.; Duncan, H.P.; Jenkins, G.A. Modelling urban stormwater treatment—A unified approach. Ecol. Eng. 2006, 27, 58–70. [Google Scholar] [CrossRef]
- Day, S.D.; Dickinson, S.B. Managing Stormwater for Urban Sustainability Using Trees and Structural Soils; Virginia Polytechnic Institute and State University: Blacksburg, VA, USA, 2008. [Google Scholar]
- Young, R.F.; McPherson, E.G. Governing metropolitan green infrastructure in the united states. Landsc. Urban Plan. 2013, 109, 67–75. [Google Scholar] [CrossRef]
- USEPA. Managing Wet Weather With Green Infrastructure Municipal Handbook; Office of Water, U.S. Environmental Protection Agency: Washington, DC, USA, 2009; p. 35.
- Sanders, R.A. Urban vegetation impacts on the hydrology of dayton, ohio. Urban Ecol. 1986, 9, 361–376. [Google Scholar] [CrossRef]
- Haith, D.A.; Duffany, M.W. Pesticide runoff loads from lawns and golf courses. J. Environ. Eng. 2007, 133, 435–446. [Google Scholar] [CrossRef]
- Shuman, L.M. Phosphorus and nitrate nitrogen in runoff following fertilizer application to turfgrass. J. Environ. Qual. 2002, 31, 1710–1715. [Google Scholar] [CrossRef] [PubMed]
- Kramer, M.G. Enhancing Sustainable Communities with Green Infrastructure; Office of Sustainable Communities, U.S. Environmental Protection Agency: Washington, DC, USA, 2014; p. 66.
- Xiao, Q.F.; McPherson, E.G.; Ustin, S.L.; Grismer, M.E.; Simpson, J.R. Winter rainfall interception by two mature open-grown trees in davis, california. Hydrol. Process. 2000, 14, 763–784. [Google Scholar] [CrossRef]
- Bartens, J.; Day, S.D.; Harris, J.R.; Dove, J.E.; Wynn, T.M. Can urban tree roots improve infiltration through compacted subsoils for stromwater management? J. Environ. Qual. 2008, 37, 2048–2057. [Google Scholar] [CrossRef] [PubMed]
- Scharenbroch, B.C.; Morgenroth, J.; Maule, B. Tree species suitability to bioswales and impact on the urban water budget. J. Environ. Qual. 2016, 45, 199–206. [Google Scholar] [CrossRef] [PubMed]
- Xiao, Q.F.; McPherson, E.G. Performance of engineered soil and trees in a parking lot bioswale. Urban Water J. 2011, 8, 241–253. [Google Scholar] [CrossRef]
- Hatt, B.E.; Fletcher, T.D.; Deletic, A. Hydrologic and pollutant removal performance of stormwater biofiltration systems at the field scale. J. Hydrol. 2009, 365, 310–321. [Google Scholar] [CrossRef]
- Costello, L.R.; Jones, K.S. Reducing Infrastructure Damage by Tree Roots: A Compendium of Strategies; Western Chapter of the International Society of Arboriculture (WCISA): Porterville, CA, USA, 2003. [Google Scholar]
- Smiley, E.T.; Calfee, L.; Fraedrich, B.R.; Smiley, E.J. Comparison of structural and noncompacted soils for trees surrounded by pavement. Arboric. Urban For. 2006, 32, 164–169. [Google Scholar]
- McPherson, E.G. Expenditures associated with conflicts between street tree root growth and hardscape in california, united states. J. Arboric. 2000, 26, 9. [Google Scholar]
- Xiao, Q. Effectiveness of Bio-Retention-Infiltration System on Eliminating Dry Weather Runoff from Irrigated Urban Landscape; Department of Land, Air, and Water Resources, University of California Davis: Davis, CA, USA, 2007; p. 18. [Google Scholar]
- Xiao, Q.; McPherson, G.; Jiang, A. Pollutant removal and runoff storage testing of three engineered soils. In Proceedings of the 4th Biennial CALFED Science Conference: Making Sense of Complexity: Science for a Changing Environment, Sacramento, CA, USA, 23–25 October 2006. [Google Scholar]
- Knight, E.M.P.; Hunt, W.F.I.; Winston, R.J. Side-by-side evaluation of four level spreader-vegetated filter strips and a swale in eastern north carolina. J. Soil Water Conserv. 2013, 68, 60–72. [Google Scholar] [CrossRef]
- Andrews, W.F. Soil Survey of Yolo County, California; Soil Conservation Service: Washington, DC, USA, 1972.
- Carpenter, E.J. Soil Survey of the Clear Lake Area, California; U.S. Department of Agriculture: Washington, DC, USA, 1931; p. 45.
- Karoly, M. Design Standards; Department of Public Works: Davis, CA, USA, 1991.
- Brady, N.C.; Weil, R.R. The Nature and Properties of Soils, 13th ed.; Prentice Hall: Upper Saddle River, NJ, USA, 2002; Volume 16, p. 960. [Google Scholar]
- Doane, T.A.; Horwath, W.R. Spectrophotometric determination of nitrate with a single reagent. Anal. Lett. 2003, 36, 2713–2722. [Google Scholar] [CrossRef]
- Eaton, A.D.; Clesceri, L.S.; Greenberg, A.E.; Franson, M.A.H. Standard Methods for the Examination of Water and Wastewater, 20th ed.; American Public Health Association: Washington, DC, USA, 1998. [Google Scholar]
- Ge, X.; Shaw, S.L.; Zhang, Q. Toward understanding amines and their degradation products from postcombustion CO2 capture processes with aerosol mass spectrometry. Environ. Sci. Technol. 2014, 48, 5066–5075. [Google Scholar] [CrossRef] [PubMed]
- Graham, M.; Wells, G.; Gryczko, S. City of Davis (Public Water System #5710001) Water Quality Report for Year 2014; Department of Public Works, City of Davis: Davis, CA, USA, 2014; p. 5.
- Cayan, D. The California Drought of 2014: Record Hot, Record Dry. 2015. Available online: https://www.drought.gov/drought/sites/drought.gov.drought/files/media/regions/rdews/California/rpt_CNAP-Drought-Newsletter-Aug-2014.pdf (accessed on 27 September 2017).
- Cheng, S.P. Heavy metals in plants and phytoremediation—A state-of-the-art report with special reference to literature published in chinese journals. Environ. Sci. Pollut. Res. 2003, 10, 335–340. [Google Scholar] [CrossRef]
- Phieler, R.; Voit, A.; Kothe, E. Microbially supported phytoremediation of heavy metal contaminated soils: Strategies and applications. Adv. Biochem. Eng. Biotechnol. 2014, 144, 211–235. [Google Scholar]
- Park, M.H.; Ridgeway, I.K.; Swamikannu, X.; Stenstrom, M.K. Evaluation of stormwater bmps for implementing industrial stormwater permitting strategy. Water Sci. Technol. 2010, 62, 2558–2563. [Google Scholar] [CrossRef] [PubMed]
Figure 1.
Study site and experimental design. The map on the left shows relative geographic location within the state of California. The map on the right shows the experimental setup.
Figure 1.
Study site and experimental design. The map on the left shows relative geographic location within the state of California. The map on the right shows the experimental setup.

Figure 2.
The relationship between total nitrogen (TN) concentration and irrigation time in the test run. A portion of the water from sample 8 and 9 (gray color dots) was directly collected from the irrigation water supply because the sprinkler near the sampling location failed.
Figure 2.
The relationship between total nitrogen (TN) concentration and irrigation time in the test run. A portion of the water from sample 8 and 9 (gray color dots) was directly collected from the irrigation water supply because the sprinkler near the sampling location failed.

Figure 3.
Surface runoff hydrograph of the low pollutant loadings (LPL) experiment. The time in the horizontal axis began when the irrigation system was turned on and ended six hours later when the system was turned off.
Figure 3.
Surface runoff hydrograph of the low pollutant loadings (LPL) experiment. The time in the horizontal axis began when the irrigation system was turned on and ended six hours later when the system was turned off.

Figure 4.
Temporal distribution of pollutant concentrations in the high pollutant loading experiment ((a) Total nitrogen, (b) Total phosphorus, and (c) Total organic carbon). The concentration values at time zero are the background levels from the irrigation water source.
Figure 4.
Temporal distribution of pollutant concentrations in the high pollutant loading experiment ((a) Total nitrogen, (b) Total phosphorus, and (c) Total organic carbon). The concentration values at time zero are the background levels from the irrigation water source.


Table 1.
Summary of Surface Runoff Measurement.
| Experiment | Surface Runoff (L) | Runoff Reduction (%) | |
|---|---|---|---|
| Control | Treatment | ||
| LPL | 6195.8 | 32.4 | 99.5 |
| MPL | 6438.6 | 37.0 | 99.4 |
| HPL | 6989.8 | 50.9 | 99.3 |
| Total | 19,624.3 | 120.3 | 99.4 |
Table 2.
Summary of Runoff Quality Measurement.
| Site | Experiment | Value | Constituent | |||||||||||||
|---|---|---|---|---|---|---|---|---|---|---|---|---|---|---|---|---|
| EC (μs/cm) | pH | TP (ppm) | PO4-P (ppm) | K (ppm) | NO3-N (ppm) | NH4-N (ppm) | TN (ppm) | IN (ppm) | ON (ppm) | DOC (ppm) | TOC (ppm) | TIC (ppm) | TC (ppm) | |||
| Control | HPL | Mean | 537.4 | 8.1 | 2.4 | 2.3 | 7.5 | 0.4 | 0.4 | 1.6 | 1.2 | 0.5 | 6.4 | 9.6 | 49.6 | 59.2 |
| Min | 519.4 | 7.9 | 0.9 | 0.9 | 5.2 | 0.1 | 0.0 | 0.6 | 0.2 | 0.2 | 4.2 | 5.3 | 46.7 | 55.0 | ||
| Max | 581.7 | 8.2 | 8.3 | 8.1 | 13.9 | 1.8 | 2.2 | 6.8 | 5.5 | 1.3 | 17.1 | 17.0 | 52.4 | 65.5 | ||
| SD † | 18.1 | 0.1 | 2.1 | 2.0 | 2.7 | 0.5 | 0.6 | 1.8 | 1.5 | 0.3 | 3.6 | 3.9 | 1.5 | 3.8 | ||
| MPL | Mean | 524.1 | 8.1 | 1.0 | 1.0 | 7.2 | 0.2 | 0.1 | 1.0 | 0.6 | 0.4 | 5.8 | 9.2 | 49.0 | 58.3 | |
| Min | 514.9 | 8.0 | 0.7 | 0.6 | 2.1 | 0.1 | 0.1 | 0.6 | 0.4 | 0.1 | 3.3 | 5.3 | 44.1 | 51.5 | ||
| Max | 530.4 | 8.2 | 1.7 | 1.6 | 8.9 | 0.4 | 0.2 | 2.1 | 1.4 | 0.9 | 8.7 | 13.4 | 52.0 | 64.0 | ||
| SD | 5.3 | 0.0 | 0.3 | 0.3 | 2.1 | 0.1 | 0.0 | 0.5 | 0.3 | 0.3 | 1.8 | 3.2 | 2.8 | 4.2 | ||
| LPL | Mean | 524.5 | 8.1 | 0.9 | 0.8 | 6.3 | 0.1 | 0.2 | 1.4 | 0.9 | 0.5 | 10.3 | 14.6 | 46.4 | 61.1 | |
| Min | 495.2 | 7.9 | 0.6 | 0.6 | 5.0 | 0.0 | 0.1 | 0.9 | 0.6 | 0.1 | 6.0 | 10.7 | 43.9 | 56.3 | ||
| Max | 545.8 | 8.2 | 1.2 | 1.1 | 9.0 | 0.1 | 0.3 | 2.4 | 1.3 | 1.2 | 17.5 | 23.3 | 49.0 | 67.2 | ||
| SD | 17.46 | 0.1 | 0.2 | 0.2 | 1.4 | 0.0 | 0.1 | 0.4 | 0.2 | 0.4 | 3.6 | 4.0 | 1.5 | 3.2 | ||
| Treatment †† | HPL | 552.4 | 8.2 | 1.0 | 0.8 | 6.0 | 0.2 | 0.1 | 1.6 | 0.8 | 0.8 | 8.3 | 10.9 | 36.8 | 47.7 | |
| MPL | 536.3 | 8.2 | 1.0 | 0.9 | 6.0 | 0.2 | 0.1 | 1.2 | 0.6 | 0.6 | 6.1 | 7.0 | 39.8 | 46.8 | ||
| LPL | 519.8 | 8.2 | 0.9 | 0.5 | 4.2 | 0.4 | 0.1 | 1.5 | 1.2 | 0.3 | 5.3 | 7.9 | 44.6 | 52.5 | ||
| Irrigation Water | Mean | 537.7 | 8.8 | 0.0 | 0.0 | 1.5 | 0.8 | 0.2 | 0.3 | 0.0 | 0.0 | 0.3 | 0.5 | 47.4 | 47.8 | |
† SD = Standard deviation; †† Surface runoff quality of the treatment site was based on a composited sample of each test.
Table 3.
Runoff Pollutant Loading Reduction.
| Constituent | Control Site Loading (g) | Treatment Site | |||||||
|---|---|---|---|---|---|---|---|---|---|
| Loading(g) | Loading Reduction † (%) | ||||||||
| LPL | MPL | HPL | LPL | MPL | HPL | LPL | MPL | HPL | |
| TN | 7.02 | 4.70 | 8.00 | 0.05 | 0.04 | 0.08 | 99.30 | 99.05 | 99.00 |
| NO3-N | 0.35 | 0.68 | 1.96 | 0.01 | 0.01 | 0.01 | 96.43 | 98.98 | 99.41 |
| NH4-N | 0.81 | 0.48 | 1.68 | 0.00 | 0.00 | 0.01 | 99.54 | 99.08 | 99.60 |
| ON | 1.32 | 1.77 | 2.58 | 0.01 | 0.02 | 0.04 | 99.27 | 98.81 | 98.36 |
| IN | 5.71 | 2.94 | 5.42 | 0.04 | 0.02 | 0.04 | 99.30 | 99.19 | 99.29 |
| TP | 4.54 | 5.00 | 12.45 | 0.03 | 0.04 | 0.05 | 99.35 | 99.30 | 99.59 |
| PO4-P | 4.36 | 4.83 | 12.09 | 0.02 | 0.03 | 0.04 | 99.64 | 99.33 | 99.65 |
| K | 35.67 | 40.07 | 46.54 | 0.14 | 0.22 | 0.30 | 99.62 | 99.45 | 99.35 |
| TC | 371.08 | 367.32 | 407.30 | 1.70 | 1.73 | 2.42 | 99.54 | 99.53 | 99.40 |
| DOC | 49.64 | 32.92 | 38.18 | 0.17 | 0.23 | 0.42 | 99.65 | 99.31 | 98.90 |
| TOC | 76.74 | 45.85 | 59.53 | 0.26 | 0.26 | 0.55 | 99.67 | 99.44 | 99.07 |
| TIC | 294.34 | 321.48 | 347.77 | 1.44 | 1.47 | 1.87 | 99.51 | 99.54 | 99.46 |
† Reductions were referenced to surface runoff loadings from the control site.
Table 4.
Summary of Tree Growth.
| Site | † Tree ID | CD (m) | CPA (m2) | DBH (cm) | HT (m) |
|---|---|---|---|---|---|
| Treatment | N1 | 2.4 | 3.7 | 8.0 | 3.4 |
| N2 | 2.3 | 3.7 | 8.1 | 2.9 | |
| N3 | 2.3 | 3.7 | 11.6 | 3.2 | |
| N4 | 3.0 | 4.8 | 11.1 | 3.8 | |
| Average | 2.5 | 3.9 | 9.7 | 3.3 | |
| Min | 2.3 | 3.6 | 8.0 | 2.9 | |
| Max | 3.0 | 4.8 | 11.6 | 3.8 | |
| Std Dev | 0.3 | 0.5 | 1.9 | 0.4 | |
| Control | N5 | 3.0 | 4.8 | 11.3 | 3.2 |
| N6 | 2.3 | 3.6 | 11.5 | 3.4 | |
| N7 | 2.2 | 3.4 | 8.1 | 3.7 | |
| N8 | 2.2 | 3.5 | 8.2 | 3.3 | |
| Average | 2.4 | 3.8 | 9.8 | 3.4 | |
| Min | 2.2 | 3.4 | 8.1 | 3.2 | |
| Max | 3.0 | 4.8 | 11.5 | 3.7 | |
| Std Dev | 0.4 | 0.7 | 1.9 | 0.2 |
† Trees were counted from north toward south. Planting size (i.e., Nursery stock size): HT: 0.61 ± 0.03 m, CD: 0.46 ± 0.03 m.
© 2017 by the authors. Licensee MDPI, Basel, Switzerland. This article is an open access article distributed under the terms and conditions of the Creative Commons Attribution (CC BY) license (http://creativecommons.org/licenses/by/4.0/).
Share and Cite
MDPI and ACS Style
Xiao, Q.; McPherson, E.G.; Zhang, Q.; Ge, X.; Dahlgren, R. Performance of Two Bioswales on Urban Runoff Management. Infrastructures 2017, 2, 12. https://0-doi-org.brum.beds.ac.uk/10.3390/infrastructures2040012
AMA Style
Xiao Q, McPherson EG, Zhang Q, Ge X, Dahlgren R. Performance of Two Bioswales on Urban Runoff Management. Infrastructures. 2017; 2(4):12. https://0-doi-org.brum.beds.ac.uk/10.3390/infrastructures2040012
Chicago/Turabian StyleXiao, Qingfu, E. Gregory McPherson, Qi Zhang, Xinlei Ge, and Randy Dahlgren. 2017. "Performance of Two Bioswales on Urban Runoff Management" Infrastructures 2, no. 4: 12. https://0-doi-org.brum.beds.ac.uk/10.3390/infrastructures2040012