1. Introduction
The expression ‘shell structures with free shapes’ refers to curved structures of reduced thickness that do not result from any mathematical expression, although exhibiting optimized structural efficiency. The name has its origin in the procedure adopted to generate the shape of these shells, which is based on the antifunicular of their deadweight, being therefore independent of geometric concepts [
1].
In these structures, with reduced thickness compared to the other dimensions, the best shape leads only to internal forces of compression [
2]. In this scope, the ‘free shape’ can be seen as a ‘natural shape’ in the sense that it results from the deformation of a membrane (with tension stiffness only), with the same geometry in plan view as the shell, loaded with the reverse deadweight of the latter. Thus, the shape results only from the application of that action, without any direct human intervention.
The importance of ‘free shape’ projects and their potential applications results clearly from the creation of the task-group ‘Free-Form Design’ of the International Association for Shell and Spatial Structures (IASS) [
3]. However, free-form shells can imply a highly complex construction procedure and thus require sophisticated form work, which represent a considerable share of the building costs [
4].
On the other hand, the interest in 3D printing technology applied to buildings and construction has considerably increased in the last 20 years. As stressed by Tay et al. [
5], for conventional design/construction processes, 2D drawings and simple scale models seems to be enough. However, free-form structures are much more demanding either in their design evaluation or in the cumbersome formwork and skilled labour required to build them. Three-dimensional printing technology has the capacity to satisfy such requirements, allowing the creation of highly customized building components and enhancing complex and sophisticated design. The survey conducted by Tay et al. [
5], from 1997 to 2016, based on conference papers and journal articles with a direct relation to 3D printing in building construction applications, showed the development trends of research in this area. After ‘printing techniques analysis’ and ‘material analysis’, ‘architectural design’ was the third development trend, which highlights the potential of the 3D printing in the exploration of complex structures. The direct relationship between the improvement of the printing technique and material characteristics, and the ability to create unexpected structures is evidenced by this analysis. Still, it is worthy to note that the keyword ‘concrete‘ only recently started appearing frequently in publications due to this material’s increase in use for 3D printing. Probably, for that reason, printed concrete lacks the presence of reinforcement and certified standards [
6]. Sustainability concerns also guide material research in 3D printing. The effect of adding short glass fibre (GF) to the geopolymer matrix for large scale concrete printing applications [
6] and the evaluation of the potential of fly-ash-based geopolymer cement for large scale additive manufacturing of construction elements [
7] are examples of the most recent research in that trend.
Framed by these issues, a research project entitled ‘Design and Performance of Ultra-Thin Concrete Shells‘ is in progress aiming to develop an innovative method to build and erect, without formwork, this type of structure.
Herein, the first part of the above mentioned project is described, namely the shape generation and the 3D-printing of a reduced-scale model. The latter is relevant since the study of the aerodynamic behaviour of these structures has been identified as fundamental [
8]. Therefore, a scale model is required to measure all relevant parameters in the wind tunnel. This allows us to calibrate and validate the numerical model, built using the commercial software ANSYS [
9]—based on the Finite Element Method (FEM), for further analysis.
The paper is organized into six sections. After this introductory section, the shape generation method is described. Secondly, the requirements of the scale model for the aerodynamic studying wind tunnel are listed. Associated advantages and constraints of the approach adopted are also identified. Then, guidelines of the main procedures, concerning the different steps for shape generation and for the production of the scale model, are presented. This starts from the geometry of the shell, follows to the 3D digital modelling and to the production of the final object, using different technologies, including its instrumentation for the wind tunnel test. In
Section 5, the validation of the printed geometry is performed by photogrammetry. Finally, the main conclusions are reported and commented in the last section.
2. Shape Generation Method and Project Assumptions
The stages of the project ‘Design and Performance of Ultra-Thin Concrete Shells’ go from the shape generation to the erection of the shell, including the production of the scale model and prototype needed at different stages. In this scope, shape generation follows a path completely different from traditional design, according to which the shape is fully defined and controlled by the designer. On the contrary, in the case of ultra-thin concrete shells, the shape results from a membrane deformation, being indirectly determined through options assumed on key parameters, such as area, fixed points or supports, maximum height, and height of free edges [
10,
11]. These apply the action of their dead weight to reveal the final shape of the shell.
The origin of the shell design was conditioned by assumptions in order to adapt their formal complexity to the goal of the project. Free-form shell structures allow the covering of large spans without intermediate supports. Spread over the void, these structures can define wide and continuous spaces. In its basic essence, a shell is just a roof protecting a space. This capacity creates a high functional flexibility, including the criteria of (i) extensibility, i.e., the possibility of expansion; (ii) convertibility, i.e., the capacity of changing the internal organization; and (iii) versatility, i.e., the adaptability of the space [
12], which can accommodate a wide set of programs. This option benefits from a minimum number of supports, releasing the shell as much as possible from the ground, and determining its triangular shape.
The computational numerical model applied to generate free-form shell structures was developed by Vizotto [
10] for both the architectural and structural design of domes. The numerical methods used are based on membrane theory, applying mathematical programming combined with FEM to design roof structures. In the computational simulation, a flexible membrane is adopted, lying from a horizontal plane in its initial configuration. The geometry is defined by both the contour and location of the structure’s supports. By performing a geometrically nonlinear structural analysis, assuming linear elastic material behaviour, the antifunicular of the shell’s deadweight is computed. More specifically, the deadweight of the shell is applied in an inverted manner, i.e., bottom-up, and the elastic membrane deforms, experiencing large displacements and large deformations through a steady equilibrium configuration. Since the membrane can only be submitted to tensile stresses (null bending stiffness is assumed), generated shapes can only be submitted to compression stresses once the deadweight is applied. This enables the adoption of the same support conditions for the shells. The method’s formulation, including the adopted constitutive relationship, finite element definition, interpolation equations, strain components, potential strain energy, and loading and boundary conditions, is described in detail by Vizotto [
10].
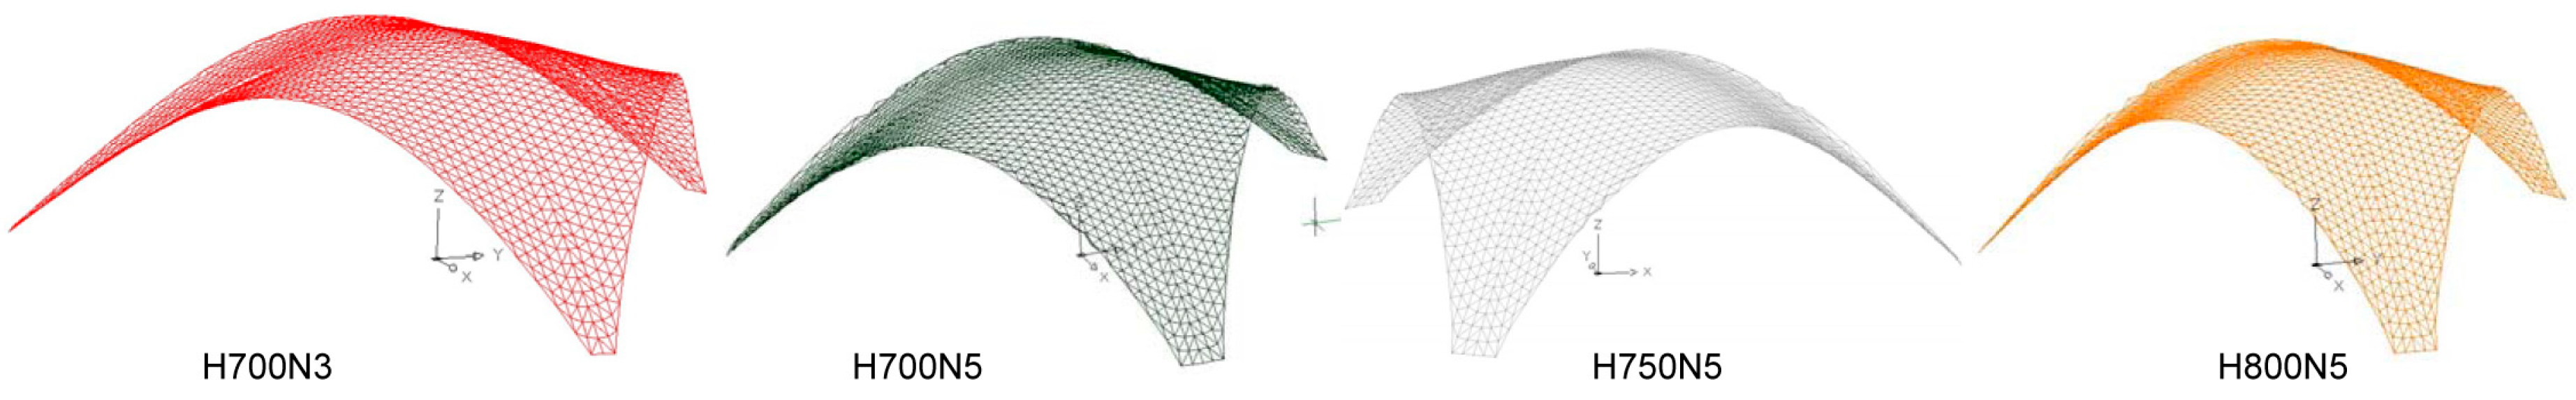
For the current study, the weighting of the shell dimensions took into account the compatibility of the following conditions: (i) its division into a minimum number of elements transportable on a semi-trail; (ii) coverage of a large span, thus justifying the choice of this type of structures; and (iii) assurance of the largest spatial extensibility. A membrane with a diameter of 25.0 m, in plan view, and maximum height of 8.0 m satisfies those conditions and, compared to other options (e.g., height of 5.0, 7.0, or 7.5 m), is the one that best meets the required spatial extensibility. In fact, this value allows a vertical division of the span into two floors, simultaneously ensuring the largest area with a minimum of 3.0 m height at the upper floor, as an administrative zone. The width of the supports was also considered. Initially, three alternatives were tested: 0.8 m, 1.6 m and 2.5 m. The thinner support option prevailed, with a width adjusted to 1.0 m, since it provides the shell with its lightest expression.
Figure 1 evidences some of the several iterations considered before the final shape was settled.
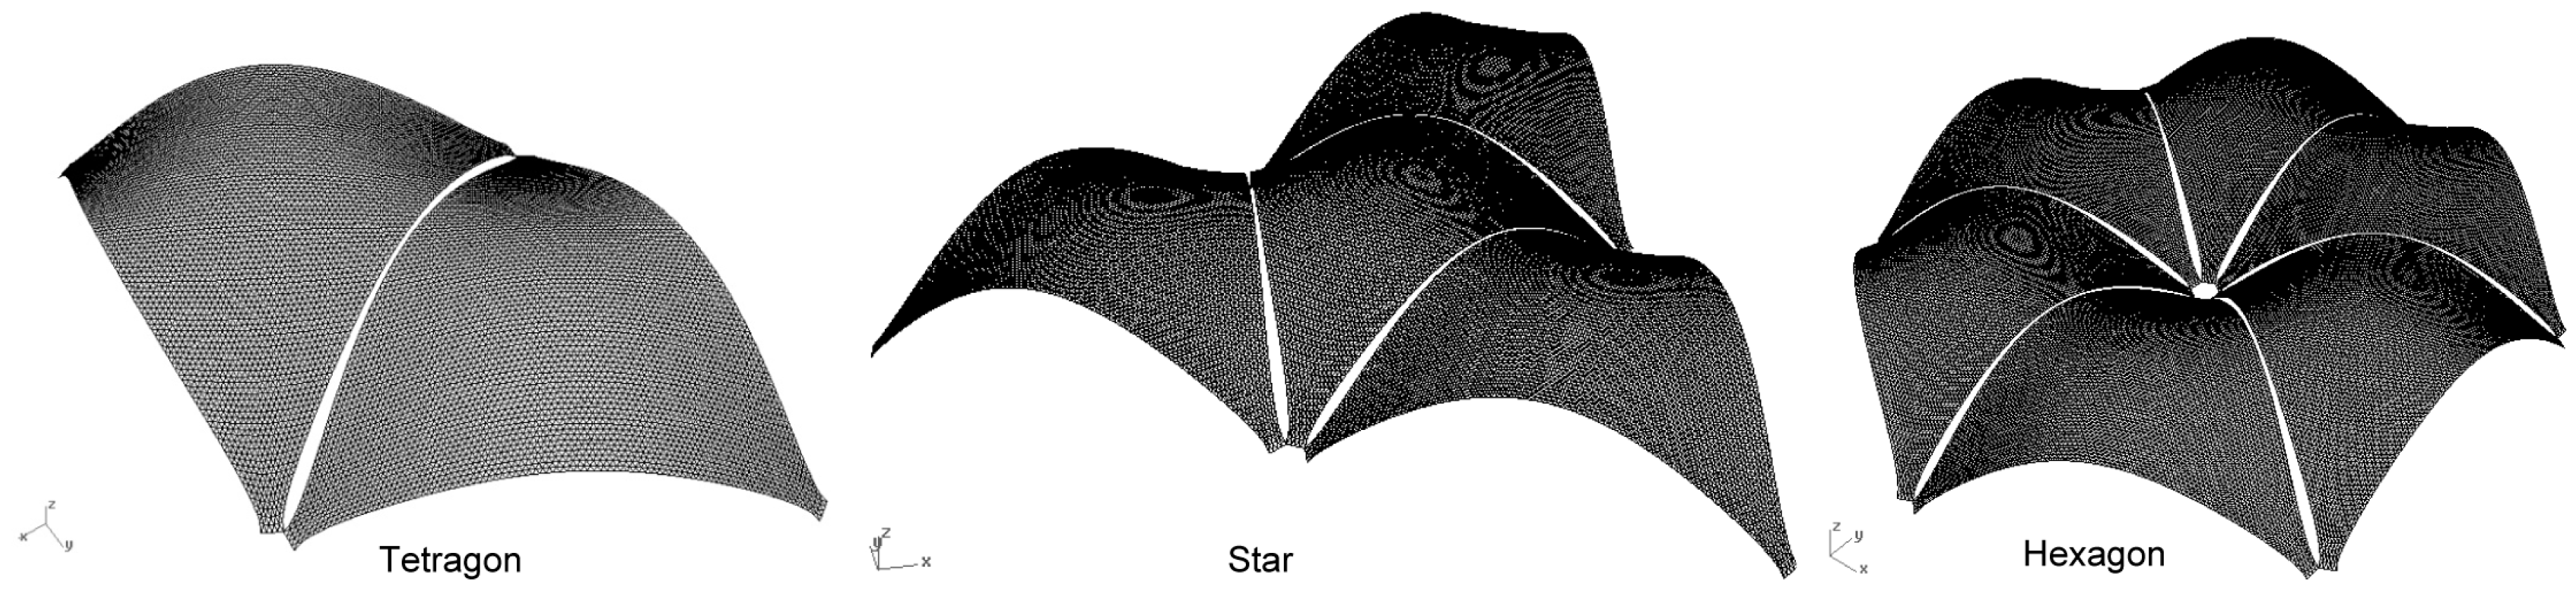
The goal of the prefabrication and division of the shell into parts, and the absence of a predefined occupation program, led the authors to consider the shell as a modular element. The ‘shell module’ concept allows expanding the covered area (circa 270 m
2) using different combinations aiming at reaching the diversity of uses. Thus, prefabrication of the shell and space-functional flexibility converge in the genesis of the pilot-shell. Its configuration (an equilateral triangle in plan view) motivated the combinations shown in
Figure 2. The shape of the shell, named H800N3, was conditioned by the design options previously mentioned.
3. Scale Model: Requirements, Constraints and Technologies
Dimensional analysis is a powerful tool for multiple domains of knowledge. In the study of wind effects on scale models of structures, important aspects of dimensional analysis and scale factors applicable to similar physically systems are presented by Pankhurst [
13] for fluid dynamic problems. The geometrically similar systems constitute the basis of the whole field of scale model testing in physically similar systems. The scale model represents a geometrically similar shape to the prototype by using concepts as geometrical scale factor, velocity scale factor, time scale factor, among others, in physically similar systems [
13].
According to Barlow et al. [
14], the type and the corresponding construction of the model are dictated by the purposes of the experiment, and the wind tunnel in which the experiment will be conducted with suitable accuracy, accessibility and maintenance. The choice of construction methods and materials to be used is very important and depends on the scale model experiments. The construction methods can vary from manual to Computer-Aided Design and Computer-Aided Manufacturing systems (CAD/CAM). Several factors can be taking into account such as dimensions, materials, roughness of the surfaces, accuracy required, dimensional tolerances, and possible interferences on the experiments. The selection of materials can be in accordance with the speed criteria (wind velocity), rigidity of the model, costs of the experiment, and time of execution. In general, models are made with wood laminates, metal (steel, aluminum), plastics, epoxy resins, fibreglass, carbon filter or Styrofoam.
In the present case, the planned aerodynamic analysis in a wind tunnel imposes clear and simple requirements: (1) rigorous reproduction of the geometry of the shape; (2) smoothing surface(s) to be tested; and (3) positioning of the pressure sensors on the surface of the model. The analysis includes testing both (internal and external) surfaces of the shell. The optimization of recourses, short deadlines and the formal complexity of the model led to adopting pressure sensors that could be easily adapted to the surfaces. The specificity of shape generation is directly related to the production procedures of the model for aerodynamic tests, mainly if the scale of the model is subjected to problems associated with the ability to reproduce the curves of the shape in both the soffit and the extrados of the model. The restraints for the production are related to the scale definition, namely, the appropriate thickness and, particularly, the control of the shape in the transition from the virtual to the physical object.
3.1. Scale
The adopted scale was defined according to the model’s objective. Lower reduction scales are obviously favourable to more detailed analyses, but it was decided to take other variables into account, allowing to reach a balanced solution in terms of scale, deadlines, and production costs, and aiming at ensuring conclusive and accurate results. The 1:50 scale allows the reproduction of a distinctness geometry of the curves of the shape, that is compatible with the size of the wind tunnel where tests were planned to be performed, i.e., a closed circuit aerodynamic tunnel with a testing chamber of 1.2 m × 1.0 m × 3.0 m.
3.2. Thickness
The thickness of the shell in the scale model can be considered a less demanding requirement for the wind tunnel tests, since it does not interfere with the pressure measurements at the model’s surface. In fact, it is the geometry of both the inner and outer surfaces that plays an important role in this scope. It should also be mentioned that, in the real structure, the thickness is supposed to be circa 100 mm, leading to 2 mm thickness for a 1:50 scale model. However, if this value was adopted, the production of the scale model would show several difficulties due to its fragility—a vast but thin surface—having at the same time to exhibit robustness in order to stand the wind tests and all the manipulation typical of laboratorial environments. Therefore, to avoid the drawbacks referred to and without compromising the geometry, it was decided to increase the thickness of the scale model to 4 mm, corresponding to 200 mm in real scale.
3.3. Shape Control
In a free shape there is no geometrical or mathematical rule allowing its reconstitution. This was the principal challenge of the model’s production, namely the control of its shape. In this sense, the CAD/CAM [
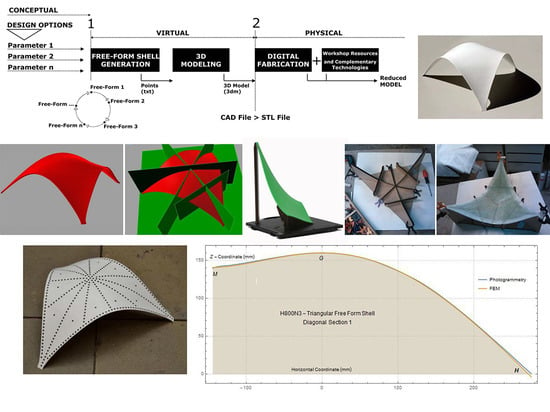
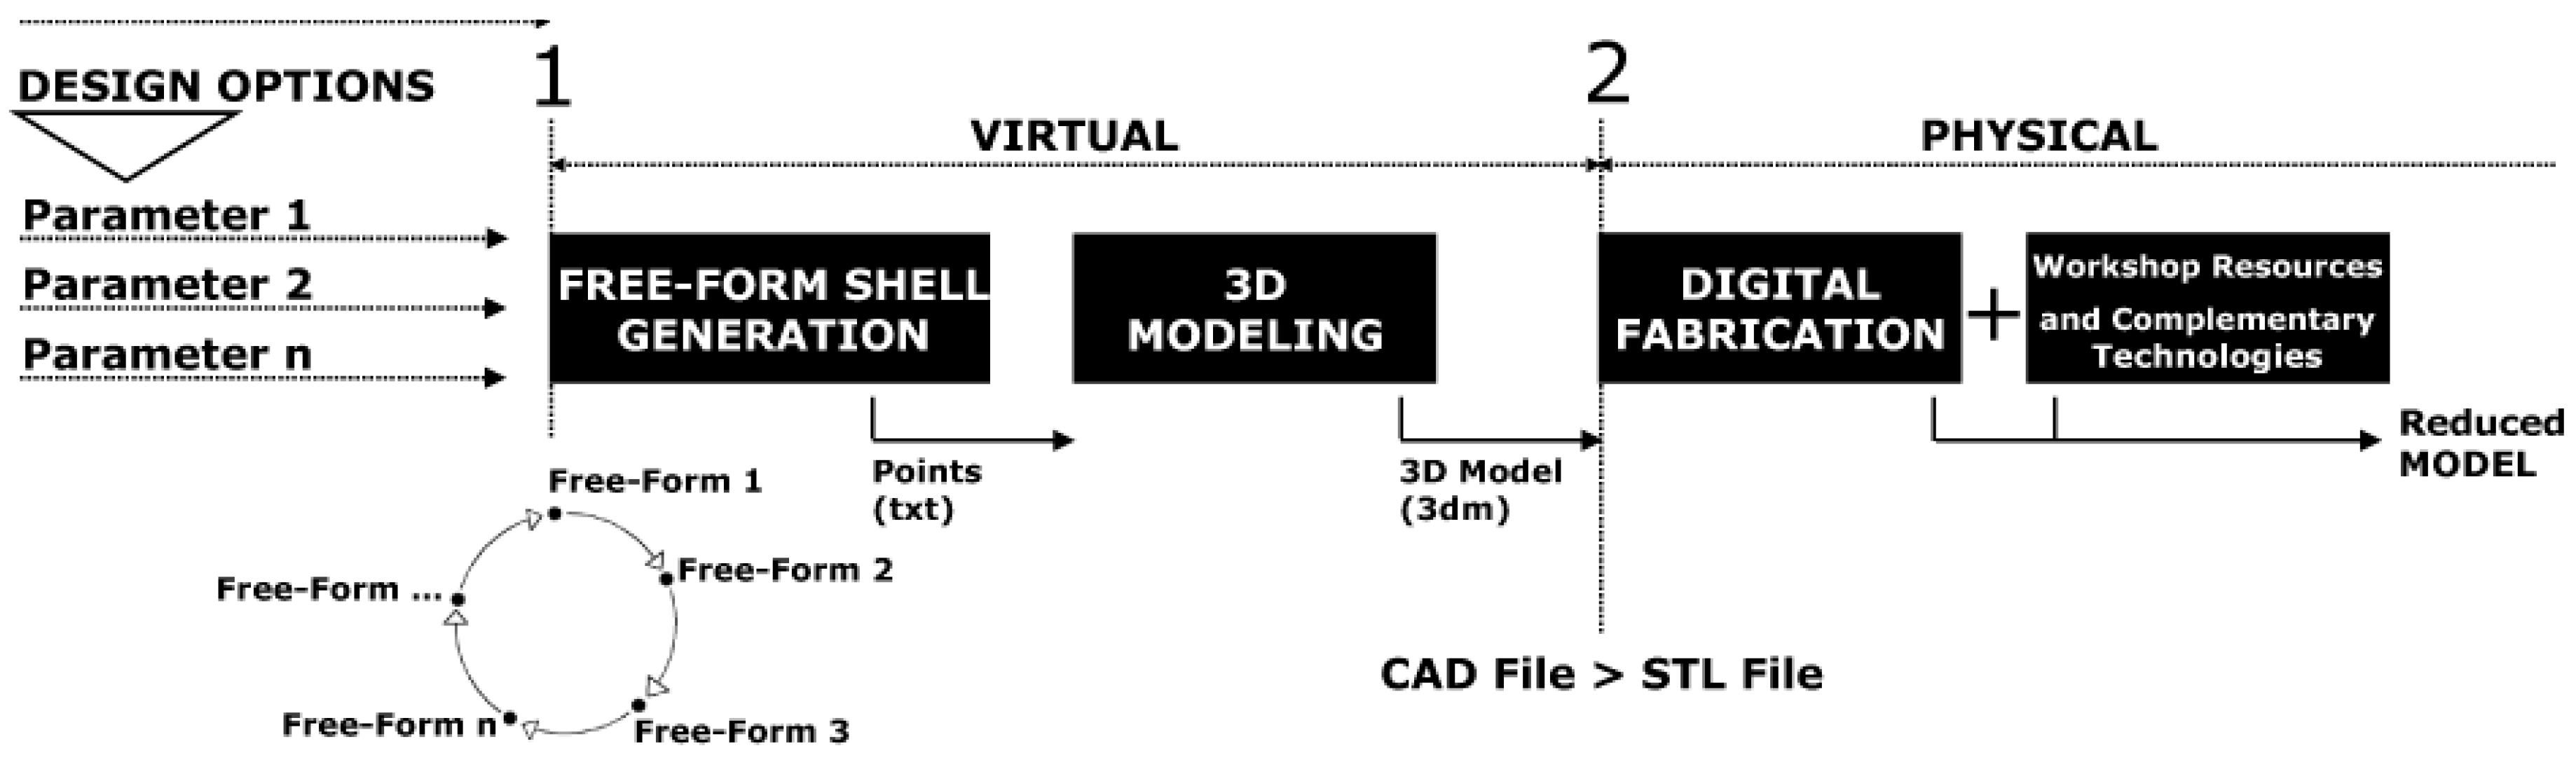
15] technologies allow us to ensure a ‘natural’ migration of data from the computational generation of the shape, including model analysis in a virtual environment, to scale model production using digital means. The flowchart in
Figure 3 aims at synthesizing the main stages and corresponding outputs of the global process, which evolved from the shell conception to the production of the corresponding scale model. This sequence ensures that the geometry initially defined (in the shape generation process) is present in the physical model. Instant 1 in
Figure 3 illustrates the transition from conceptual to virtual: through successive iterations—depending on the project’s options—the shape was continuously modelled. The most sensitive moment is precisely the transition from the virtual to the physical environment, Instant 2 in
Figure 3, since the integrity of the free shape geometry has to be faithfully ensured in the physical object. Normally, this transition is guaranteed by conversion of the CAD file (of the 3D model) into a standard triangulation or stereolithography language (STL) file, performed from the CAD environment itself [
16]. The STL file defines, by triangulation, the coordinates of the object surfaces whose edges must be perfectly coincident. The software of the machines used in digital production generally processes this file type. Although this type of conversion process has possible error associated (a slight deviation between edges is enough to compromise the printing), it is generally adopted since it presents some advantages, such as being a user-friendly method to represent 3D data and, for certain shapes, it allows obtaining small files, thus simplifying the data transfer [
17]. The use of traditional or manual methods to build a shell 3D model would imply a bigger effort, in time and resources (including human ones), to ensure the surface’s shape control. The gap between the free-form shell generation phase and the reduced model phase would not be so ‘naturally’ transposed.
3.4. 3D Printing
In digital production methods, the mechanical devices are computationally controlled, which is the case for 3D printing [
18]. The 3D printing allows obtaining a facsimile of the virtual model [
19], independently of the complexity of the shape. For this reason, this was the production technology selected to execute the scale model. It is an adding-based production process: after the software of the printer translates the STL model into 2D layers, the head of the latter starts printing these, one after the other, by dropping the material, e.g., Acrylonitrile Butadiene Styrene (ABS), PolyLactic Acid (PLA), polyamide, epoxy resin, silver, or steel, on a tray, until the object is complete. A clear flowchart of the process by Buswell et al. can be found in [
19]. The technology of 3D printing is relevant for different domains, e.g., medicine, aeronautics, and chemistry, among others. In the context of civil engineering and architecture it has been used to explore the formal freedom it allows, including the production of objects in real scale [
20,
21,
22,
23,
24].
3.5. Costs
The 3D printers for domestic use (or desktop) have generalized the access to this technology. Several researchers and computer programmers have developed 3D open-source printers with high socio-economic impact [
25], making it possible to easily print daily use objects. The project 3D Hubs [
26] refers to a 3D printers network that connects users of these printers worldwide. The Hubs community offers 3D printing services, being the budget function of the STL file. Currently, costs are approximately one Euro per gram of material. In the case of reduced models of complex forms such as shells, 3D printing allows obtaining geometrically accurate models with a low cost. The only disadvantage is the possible constraint actually still imposed by the printing working volume of the 3D printers. Depending on the scale of the models, its printing in several parts could be necessary. In this case, the time and costs of the assembly of the parts must be considered.
4. Scale Models: Guidelines
The production process of the scale model was organized according to eight consecutive steps. The transition between shape generation and the execution of the scale model of the shell, using the 3D printing technology, implies the previous production of the three-dimensional model. The selection of the most adequate CAD environment in this context is conditioned by the nature of the curved geometry, continuous and smooth, of the object.
Among the graphic computation software available, the one with the commercial name Rhinoceros
® produced by Robert McNeel & Associates [
27] was selected. This software is based on the non-uniform rational basis spline (NURBS) geometry, a mathematical model currently used in graphic computation software to represent both curves and surfaces with accuracy and flexibility. It allows the description of any type of shape, from the most simple (2D curves) to the most organic and complex, such as three-dimensional free shapes [
28].
4.1. Step 1: Input of the Point Cloud to the CAD Environment
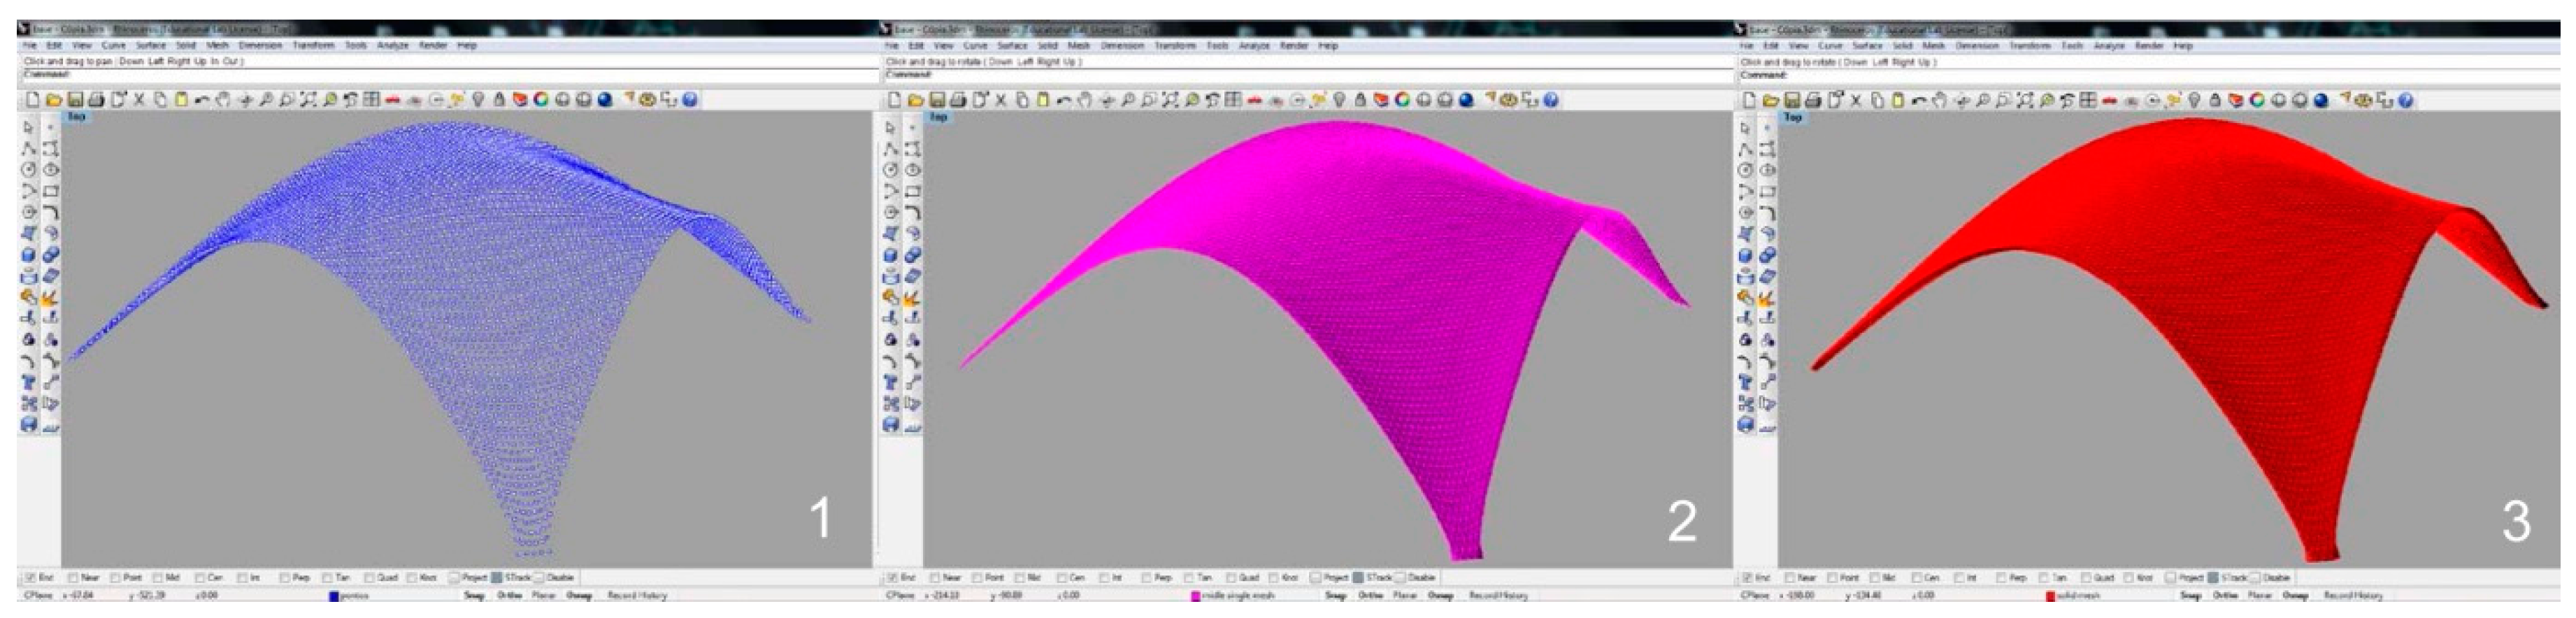
The software for shape generation provides an output list of the coordinates of an adequate number of points to describe the shell with the required detail for realistic modelling. The .txt file imported to the Rhinoceros
® environment allows the visualization of the point cloud that represents the object (
Figure 4(1)). Using the plug-in Resurf (function ‘PointCloudToMesh’), a regular mesh is generated, i.e., a surface discretized in triangular faces, creating a surface of curves, which is smoother the higher the number of points (
Figure 4(2)). The solid is generated from this mesh. The Rhinoceros
® software operates with mesh objects. A solid is interpreted as a closed volume, made of meshes, and is called a ‘solid mesh’. The mesh is generated starting from the mid-plan mesh by adding 2 mm layers each time (
Figure 4(3)).
4.2. Step 2: Preparation of the Three-Dimensional Model for Printing
ANSYS [
9], or other commercial software for structural analysis, allows checking that a free-form shell only exhibits compression stresses when submitted to its deadweight. Moreover, the directions of the principal stresses are either parallel or normal to the symmetry axes. Taking this into account, the shell model was divided into the lowest number of modules, using symmetry axes whenever possible, and bearing in mind the 3D printer capacity.
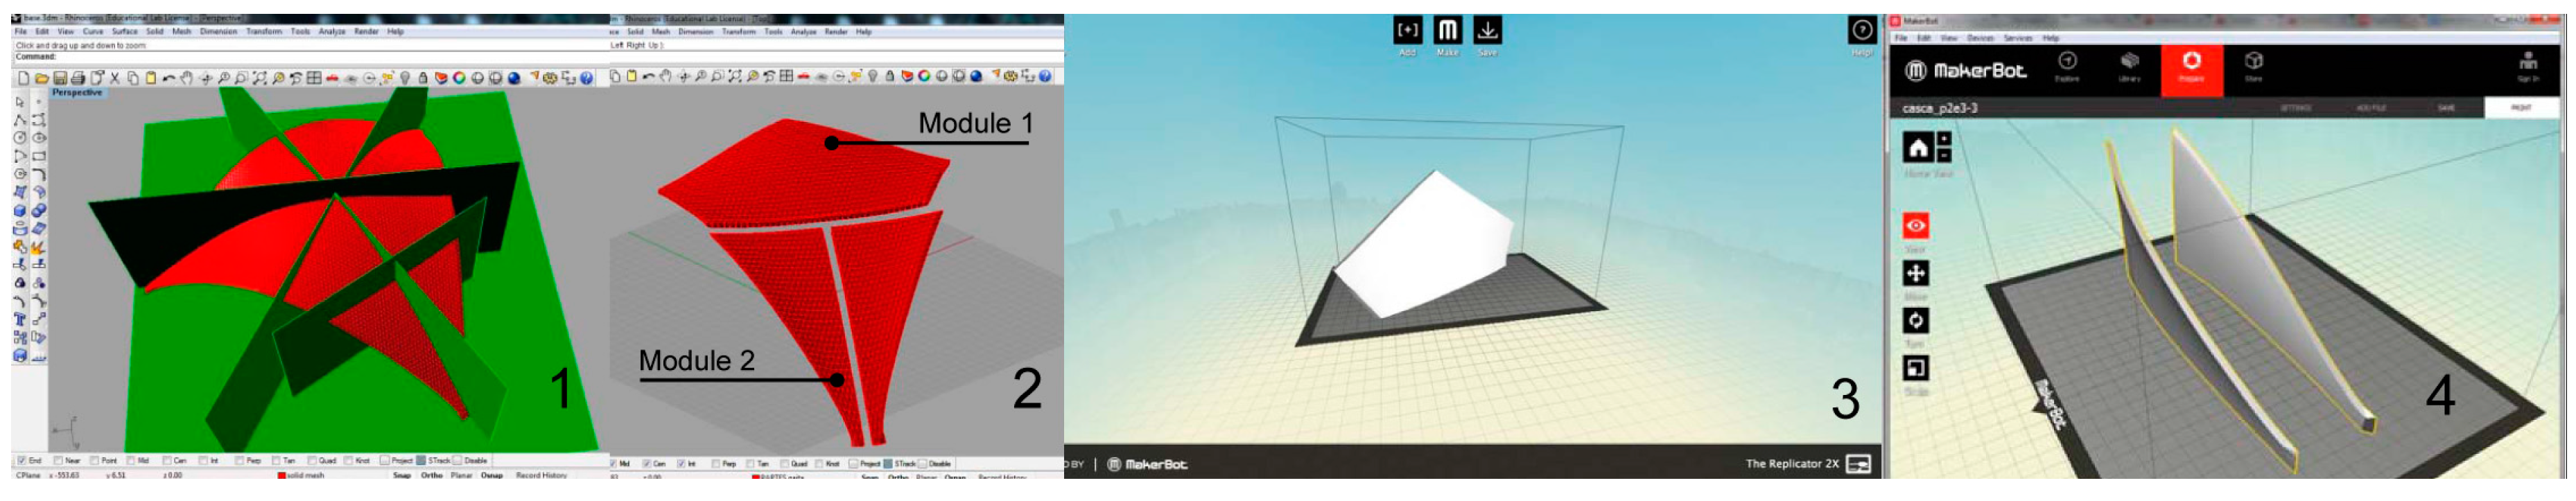
When the dimensions of the scale model (e.g., 1:50) do not make it possible to print it as a single piece, it has to be subdivided into modules and only then can each of these be printed (
Figure 5(1,2)). Usually the 3D printers, both industrial and domestic, have a limited printing volume. In the study conducted, and therefore in the present guidelines, a desktop printer (Replicator 2X, by MakerBot Industries) is considered with a printing volume of 240 mm × 150 mm × 150 mm (
Figure 5(3)). The virtual model is subdivided into the smallest number of modules possible, nine in the example (
Figure 5(1,2)), which have to be positioned for printing, as illustrated in
Figure 5(3,4).
The following possibilities are highlighted: (i) printing more than one piece simultaneously; and (ii) positioning the pieces inside the printing volume with a certain degree of freedom, e.g., printing the pieces almost vertically (
Figure 5(3,4)). When the slope is lower, e.g., 45°, the piece can be sustained through a small vertical support that can be added to the model to be printed and easily removed afterwards.
4.3. Step 3: Model Printing
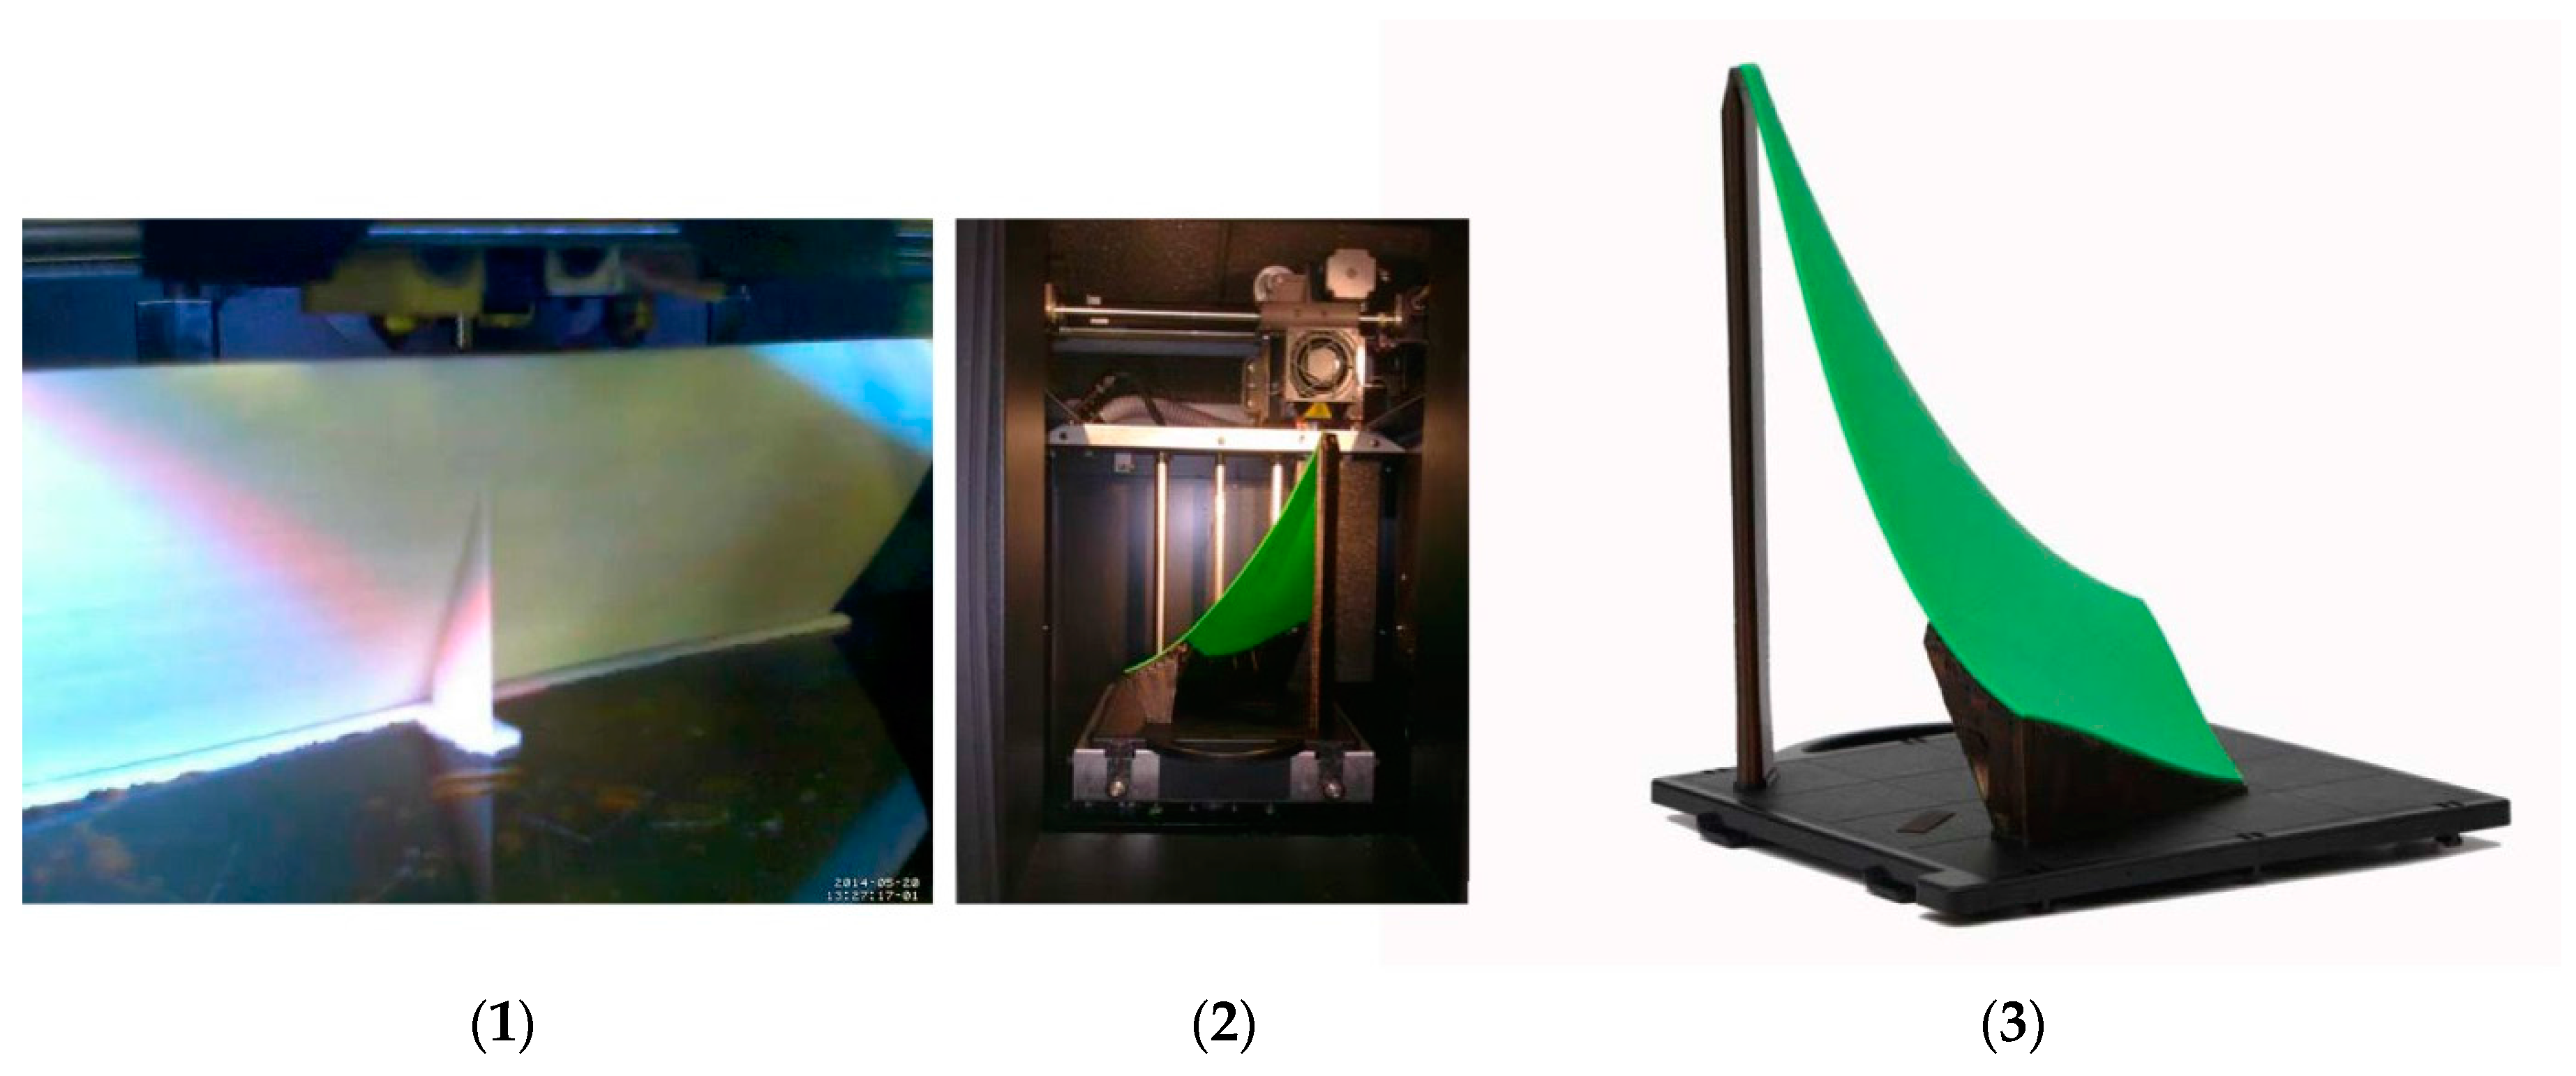
The vertical positioning of the pieces to be printed presents the advantage, compared to horizontal or near-horizontal positioning, of saving the support filament.
Figure 6(1) presents, as an example, the printing of the largest piece of the scale model used (see
Figure 5(2,3) for part 1). The support filaments used are the minimum and necessary to avoid the collapse of the model parts during the printing process.
This criterion of positioning the pieces to be printed was compared with a different printing process. The 1:50 scale model was produced using an industrial printer (Dimension SST760, Stratasys) with a higher printing volume: 203 mm × 203 mm × 305 mm (
Figure 6(2,3)). In this alternative procedure, the model was divided only into three pieces, printed with a thickness of 2 mm (corresponding to 0.10 m in real scale). The pieces were print reversed, relative to their normal position, ensuring this way the higher stability of the shape during printing. The supports (brown colour thread) are automatically determined by the printers’ software. Both printers use the fused deposition modelling (FDM) [
16] printing technique, and use ABS threads for model printing. The thermal isolation of the industrial printer ensures the stability of the shape avoiding warp phenomena, which are particularly relevant in the case of long and thin pieces, as in the case of this second model printing (
Figure 6(2,3)).
The resolution is an important printing definition. Basically, the resolution concept in 3D printing refers to the thickness and density of the extruded filament layers. Buswel et al. [
19] have explored the meaning of the term ‘resolution’ applied to 3D printing, as well as the relation between the representation of the virtual model and the resolution of the physical object. Likewise, for 2D printing the resolution and printing time are directly related: the higher the resolution, the higher the printing time. For the Replicator 2X, the standard resolution (0.2 mm by layer) was selected in the study described and the same is proposed in these guidelines. For this example, the printing times range between 9 and 12 h, depending on the dimensions of the piece. The total printing time was estimated in 73 h. In the case of the Dimension SST760, each piece, printed in the highest resolution mode (0.254 mm by layer), consumed 15 h. The total printing time of the model was approximately 45 h.
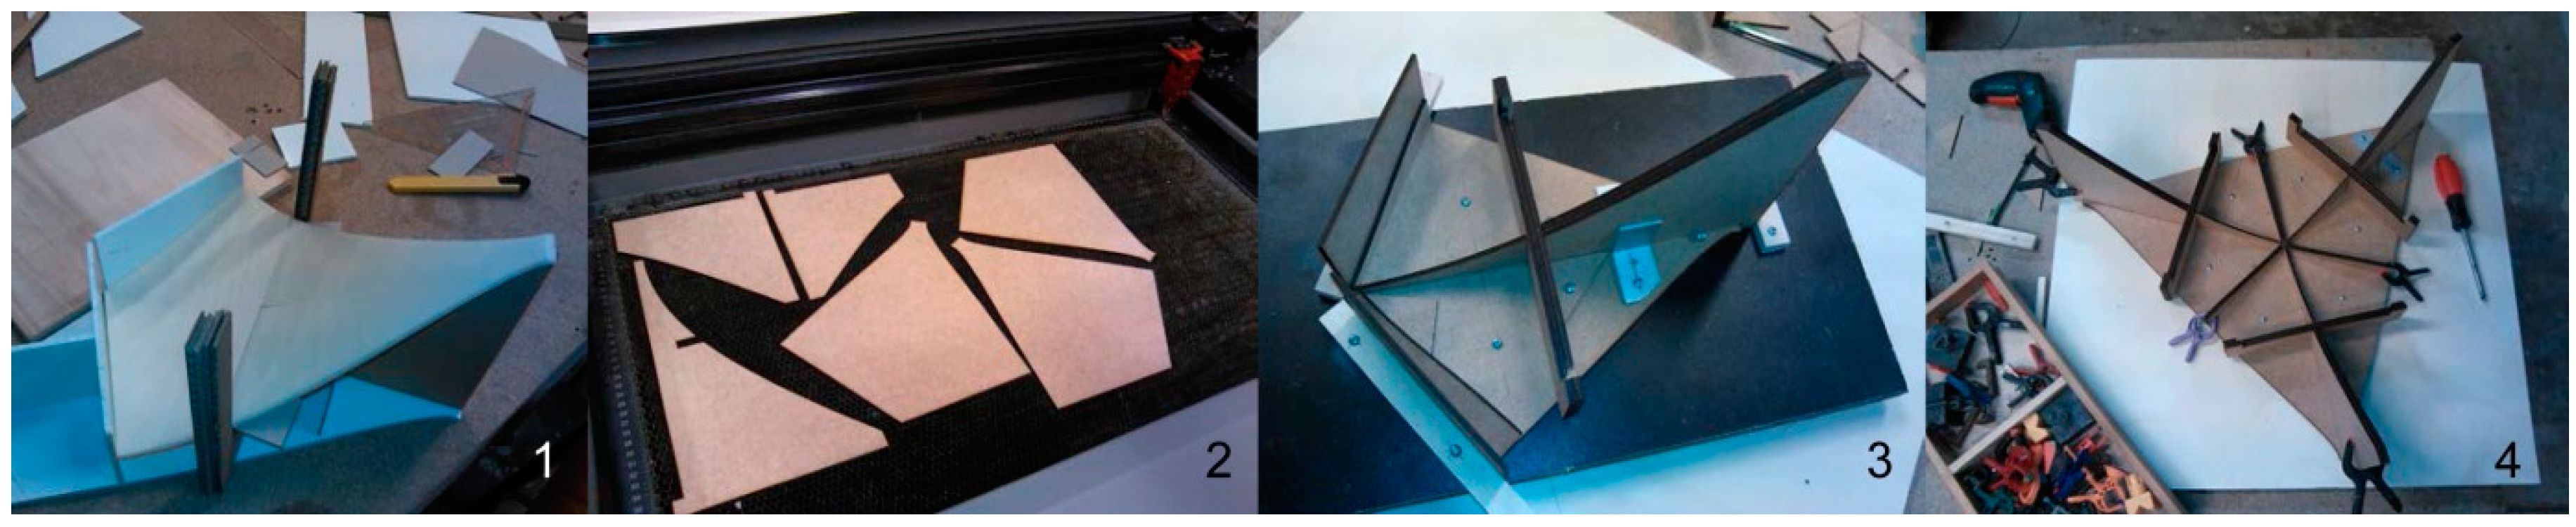
4.4. Step 4: Preparation of Moulds
The subdivision of the model implies the definition of procedures for the reconstitution of the global shape. This goal is reachable by conceiving moulds with the purpose of enabling the connection of all the pieces in the right position. The moulds (mould and sub-mould) correspond to the extrados of the object, the easiest way of positioning the pieces and rebuilding the profiles of the subdivision lines (
Figure 7).
In the study, the profiles for the moulds were designed based on the 3D model. A previous mould had been produced for validation, using corrugated cardboard and foam board (
Figure 7(1)). The final moulds were produced in Medium-Density Fiberboard (MDF) plates with a 3 mm, laser cut (
Figure 7(2)) to ensure the maximum precision in the resulting profiles. The option for lower thicknesses has the advantage of reducing the cutting time. In the study conducted, the average time estimated based on the power of the adopted equipment (1100 W) was circa of 15 min per plate. In the joint zones, where it is advisable to increase the support area of the pieces, 3 mm profiles were added. Cutting several profiles also allowed a better adjustment of the mould to the curvilinear shape of the pieces. The profiles were assembled and the connections were further consolidated through screwing and gluing.
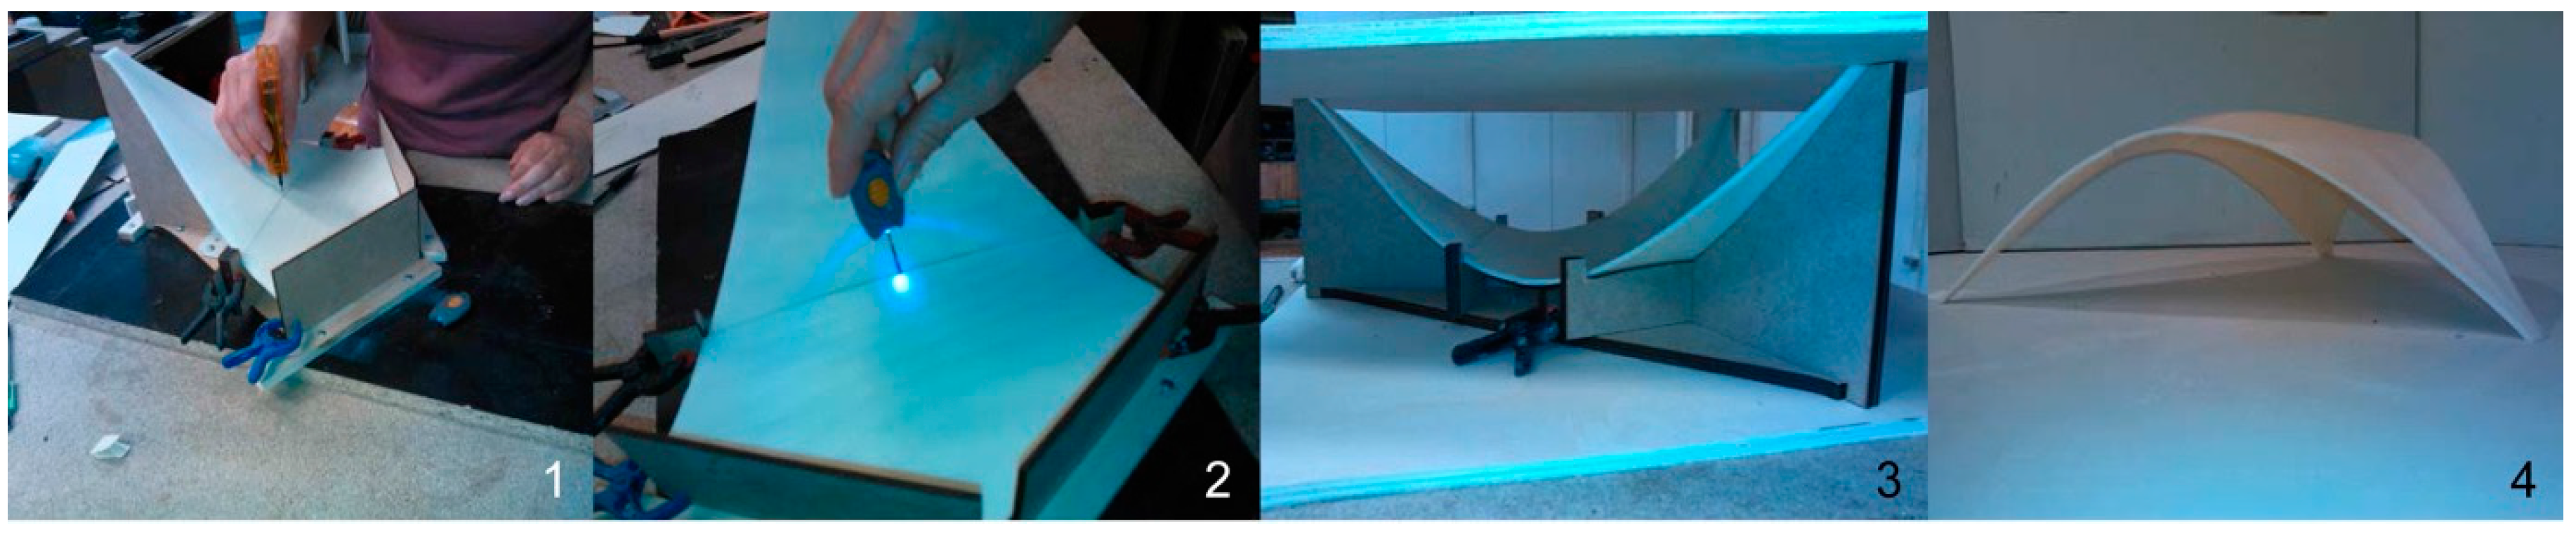
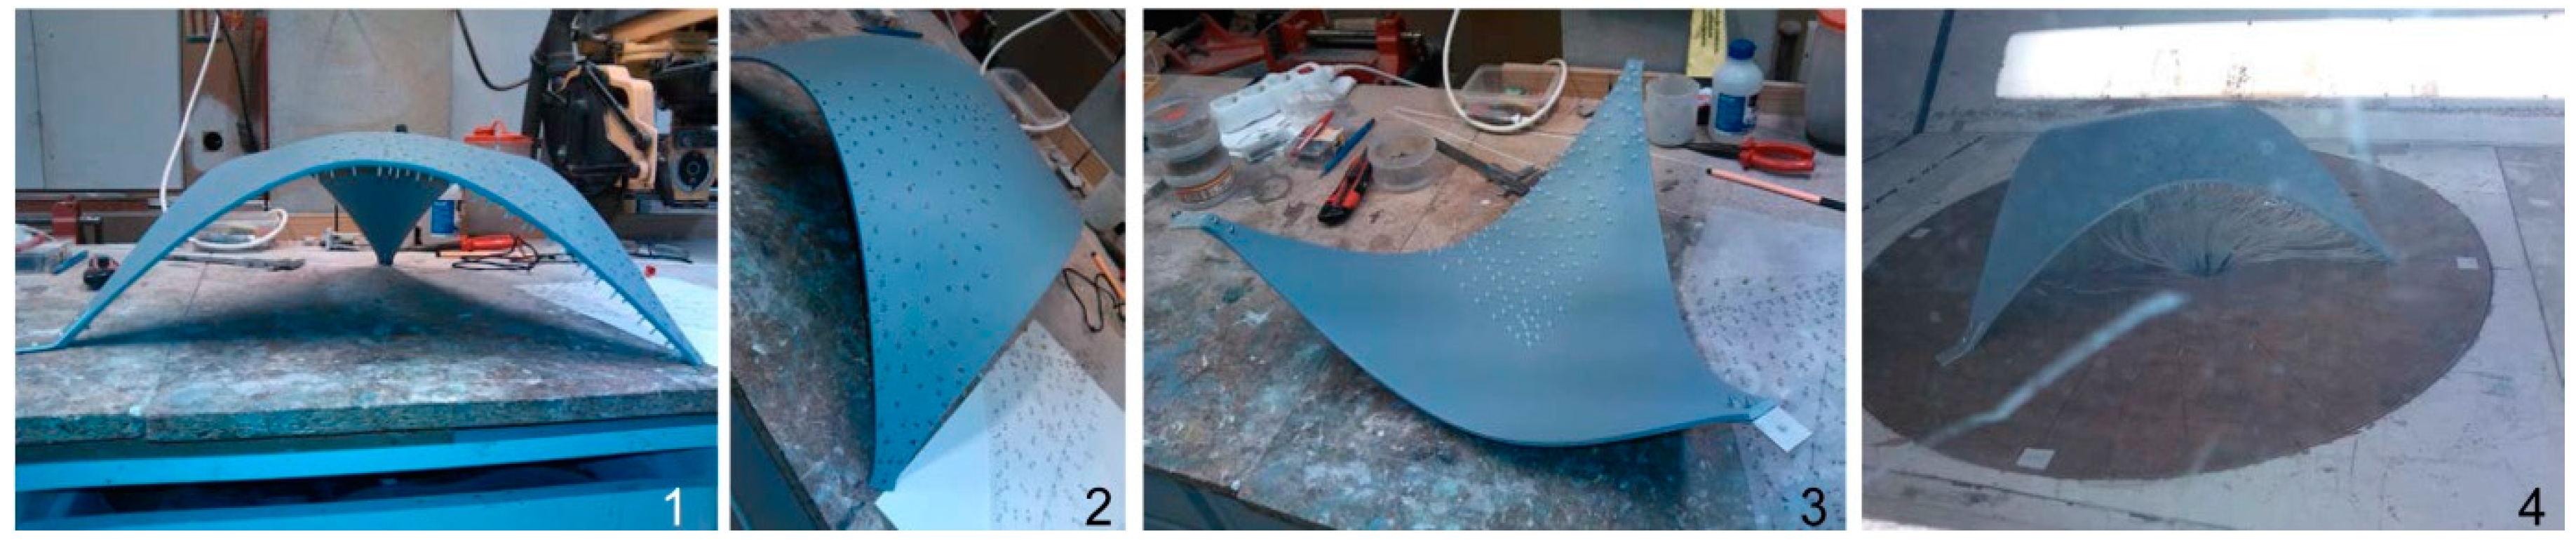
4.5. Step 5: Assembly of Pieces
The phased connection of the pieces allows the easy correction of eventual faults. First, using the sub-mould, all parts of the same third of the object are connected (
Figure 8(1,2)); next, using the mould, the connection of the three thirds allows building the complete object (
Figure 8(3)). The adopted bonding agent is fundamental in this process. It must allow the reversibility of the linking process if needed. In the study herein presented a transparent, acrylic-urethane-based liquid glue was used. The thin end of the glue container made it possible to control the liquid dosage and apply glue points to the pieces’ joints. With the help of an Ultra-Violet (UV) Light-Emitting Diode (LED), the glue is dried easily (
Figure 8(2)). The joints obtained are robust enough to immediately check the achieved shape (
Figure 8(4)). If the result is unsatisfactory, it is possible to easily break the glue points, remove the waste, and reinitiate the procedure.
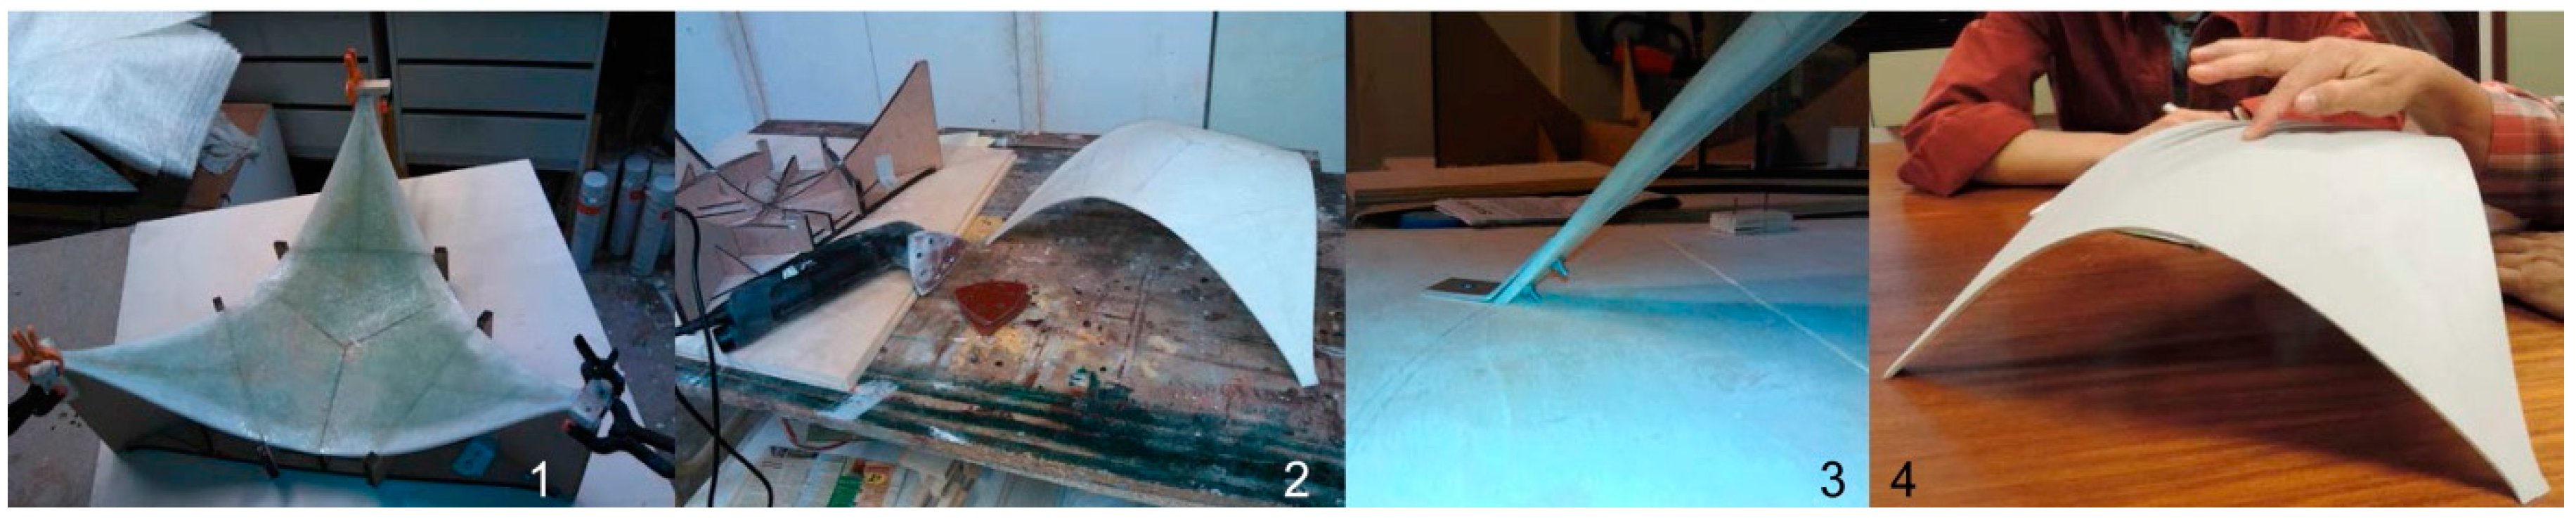
4.6. Step 6: Model Strengthening, Connections and Pre-Finishing
After checking the shape correction, it is necessary to strengthen the model. The contact area of the joints, due to their reduced thickness, was insufficient to ensure the needed strength. Thus, a fibreglass fabric was applied to its soffit (300 gr/m
2) providing the object with the required robustness (
Figure 9(1)). The pre-accelerated polyester resin, used to apply the fibreglass fabric, also filled in and definitely consolidated the joints. The average drying time was circa half an hour with an average ambient temperature of approximately 22 °C.
The points where the pressure sensors are applied need to be located in the pre-finishing of the object, requiring both mechanical and manual sanding of the surfaces, and also pre-painting with acrylic coating. The support of the pressure sensors, being only one third of the instrumented shell, was bonded and thus stayed free of obstruction. The interfaces for fastening were executed in aluminum flat bar of 2 mm (
Figure 9(3)). The final object was adequately resistant for the desired end (
Figure 9(4)).
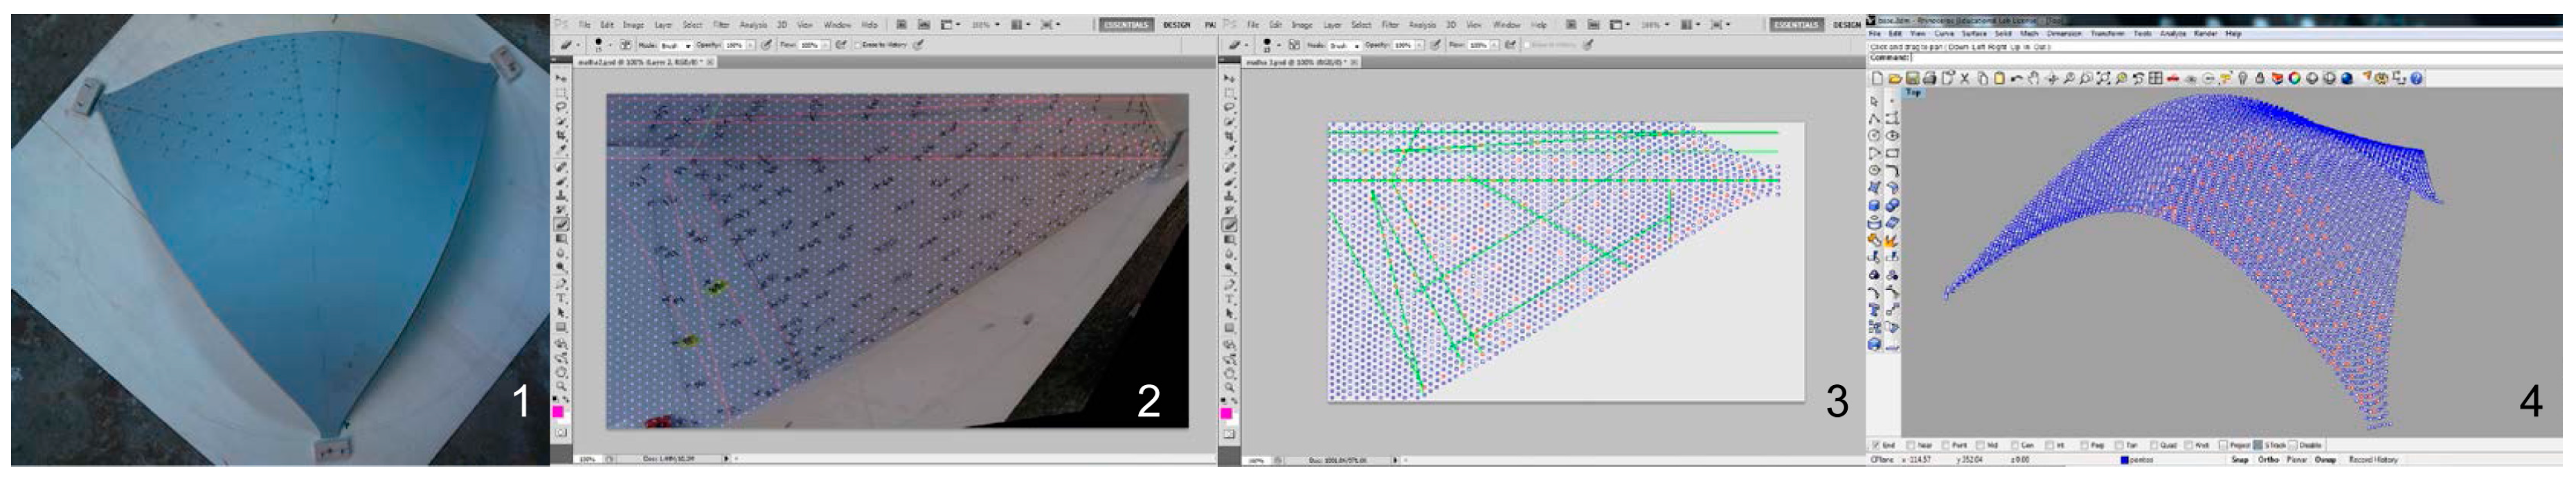
4.7. Step 7: Identification of Coordinates of Pressure Sensors
The position of the pressure sensors was manually marked (119 points) in the aerodynamic sector of the National Laboratory of Civil Engineering (LNEC). Tests in a wind tunnel demand the identification of the points’ coordinates. This procedure involves: (i) photographing the scale model according to a plan view (
Figure 10(1)); (ii) importing this image to Rhinoceros
®; and (iii) superimposing it on the virtual point cloud, also in plan view (
Figure 10(2,3)). The coincident points were identified and marked on the virtual point cloud. The sub-cloud of points is shown in
Figure 10(4) (red points isolated in a single layer). The script RhinoToExcel.rvb, available online, and imported to the Rhinoceros
® environment, allowed the obtaining of the list of their coordinates.
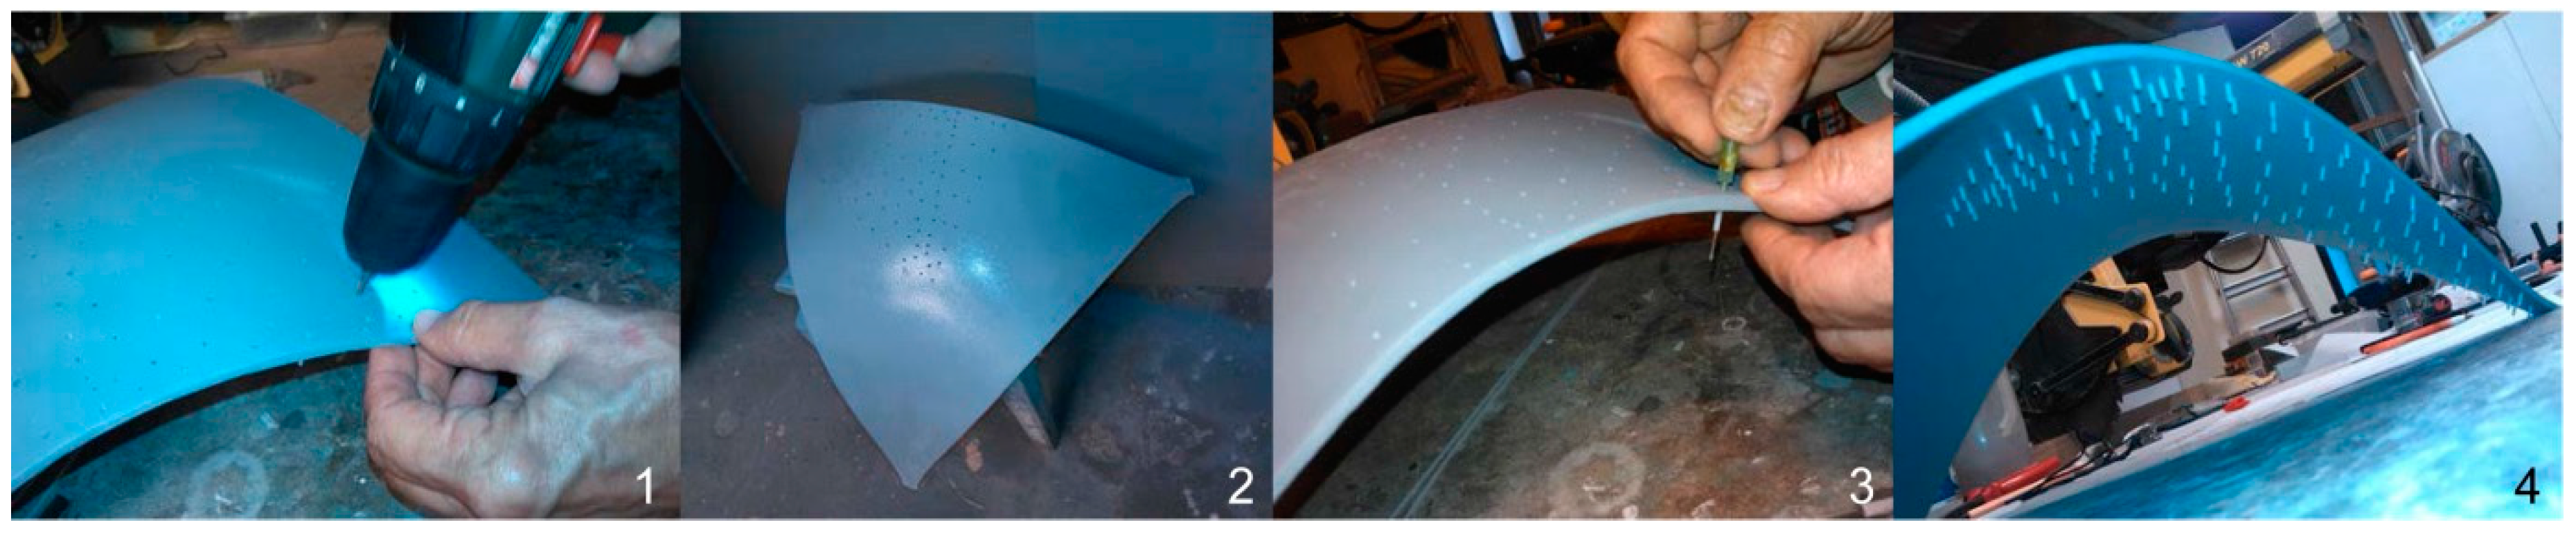
4.8. Step 8: Drilling, (Model) Painting, Installation of Pressure Sensors
For the pressure sensors, Poly Vinyl Chloride (PVC) pipes with a 2 mm exterior diameter were adopted. A length of 10 mm was enough since the assembly to the silicone pipes that connect to the data-logger only demands a free end of 5 mm. Drilling was performed (
Figure 11(1,2)), making it possible to fix the PVC pipes by pressing (
Figure 11(3)) and adjusting them easily to each of the (internal or external) surfaces (
Figure 11(4)). The painting with the coating resulted in a polished final finishing of the surfaces (
Figure 11(2)) required for the wind tunnel tests. In
Figure 12, aspects of the concluded scale model are documented. The pressure sensors were manually numbered at the outer surface of the model (
Figure 12(2)). In
Figure 12(4) an instant during the preliminary tests in the closed circuit aerodynamic tunnel at LNEC is illustrated.
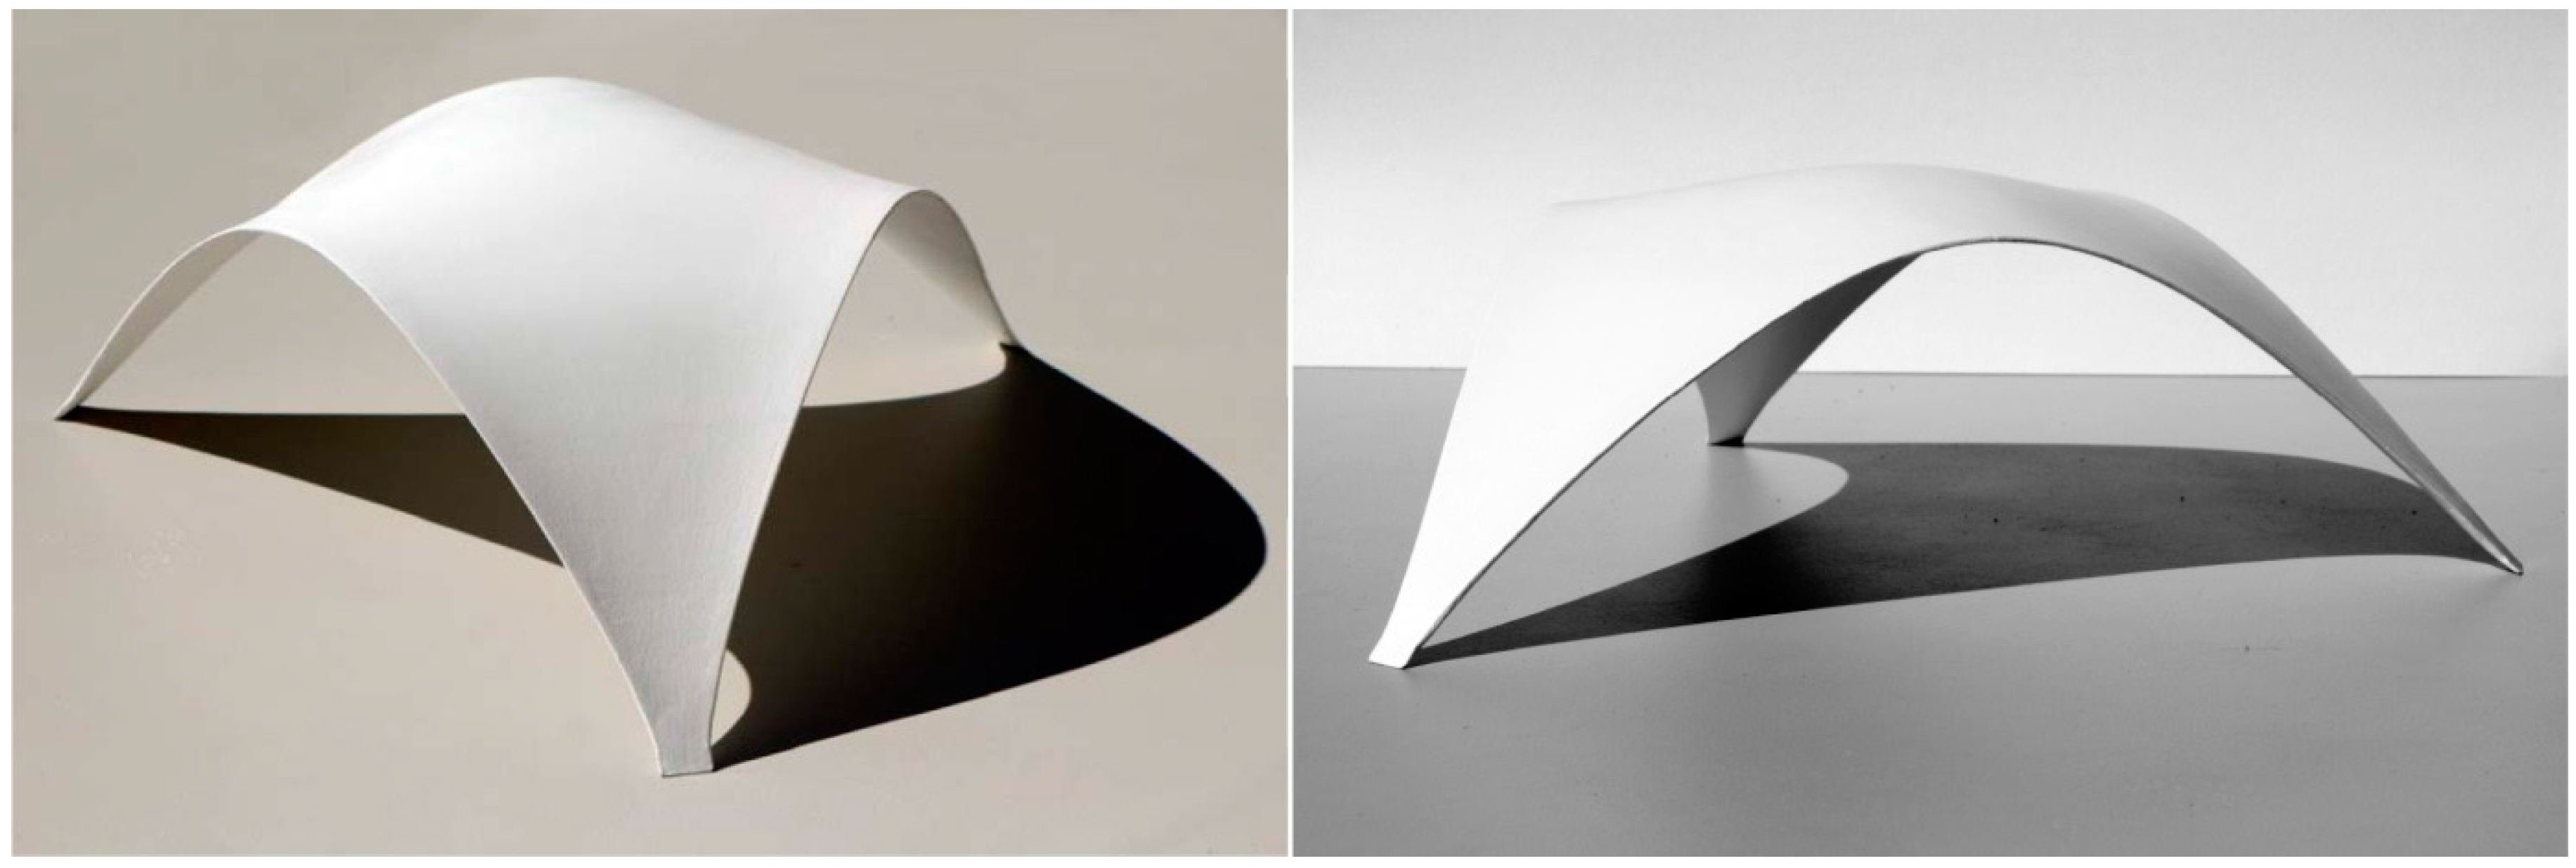
Besides the characteristics associated with their structural behaviour, free-form shells hold potential values of a plastic nature arising from their ‘natural’ geometry. The second model referred to (
Figure 13) tries to explore this dimension of the expression and shape values.
5. Validation of the Printed Geometry
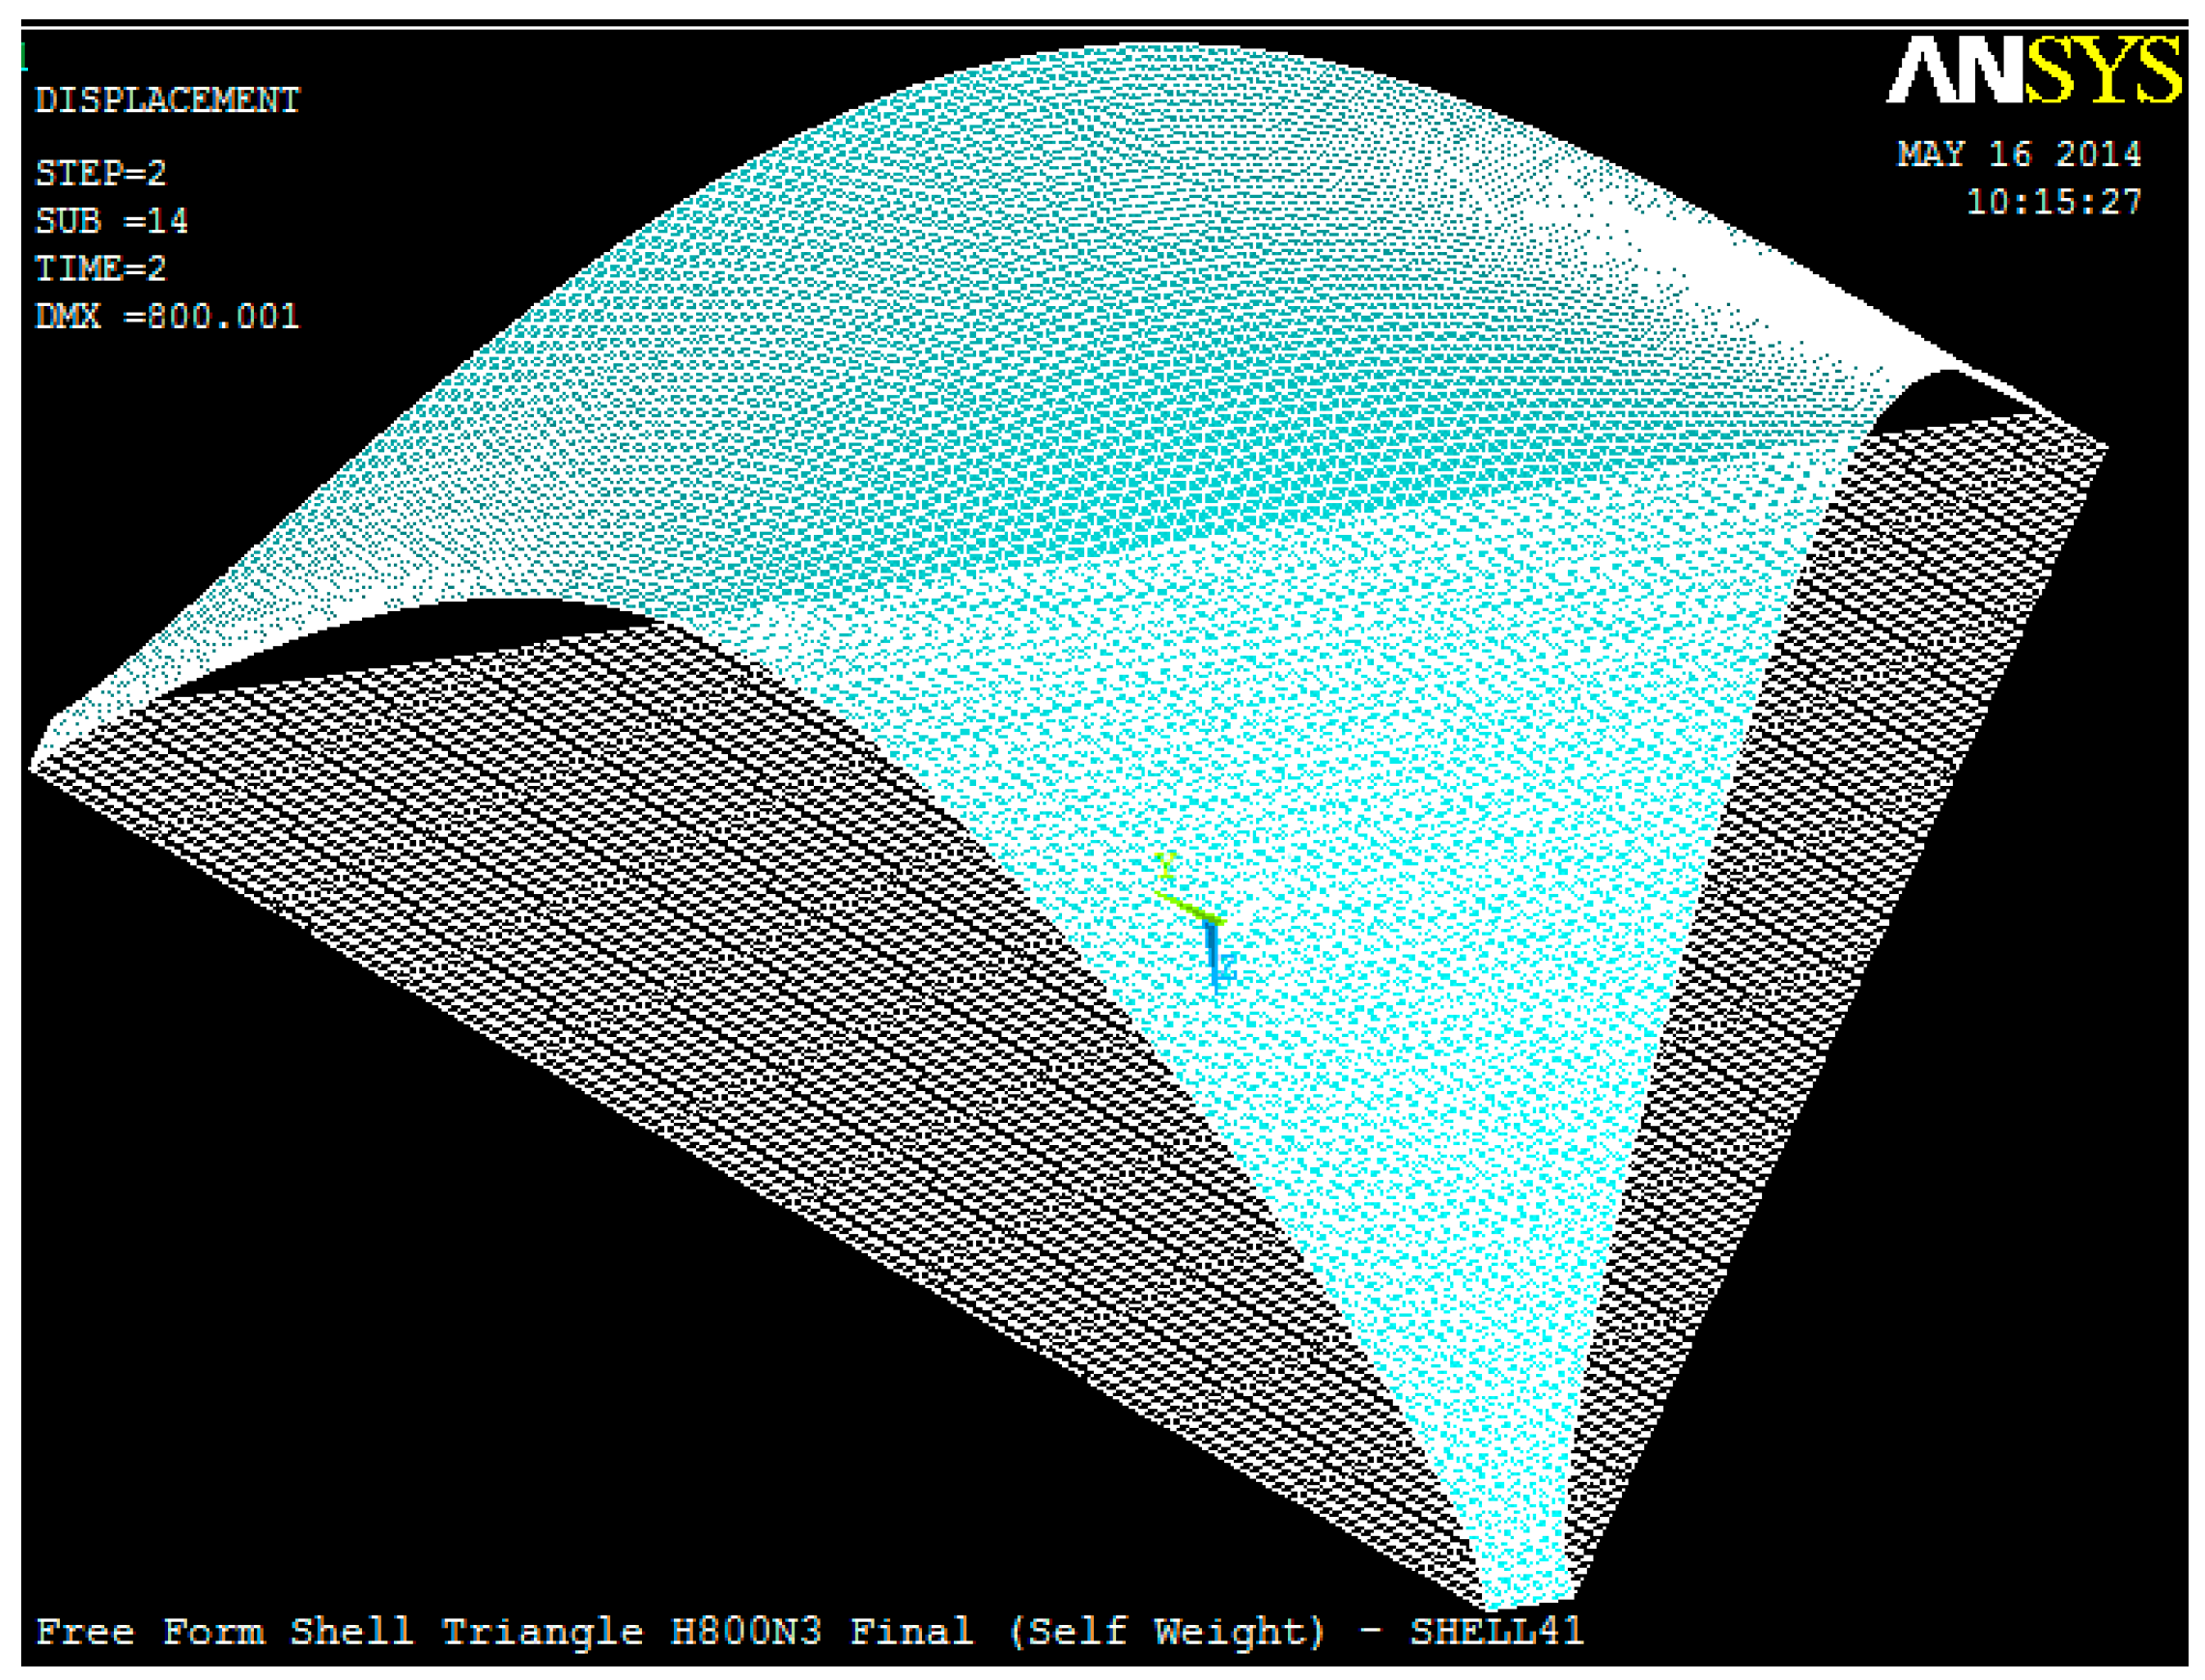
The triangular free-form shell (
Figure 14) presented in this paper was generated using a geometrically nonlinear analysis with the computational numerical model developed by Vizotto [
10].
In the next step, 3D printing technology was applied to build a scale model of the shell from its numerically generated free shape. The accuracy of the process was evaluated using terrestrial photogrammetry. A multi-station approach [
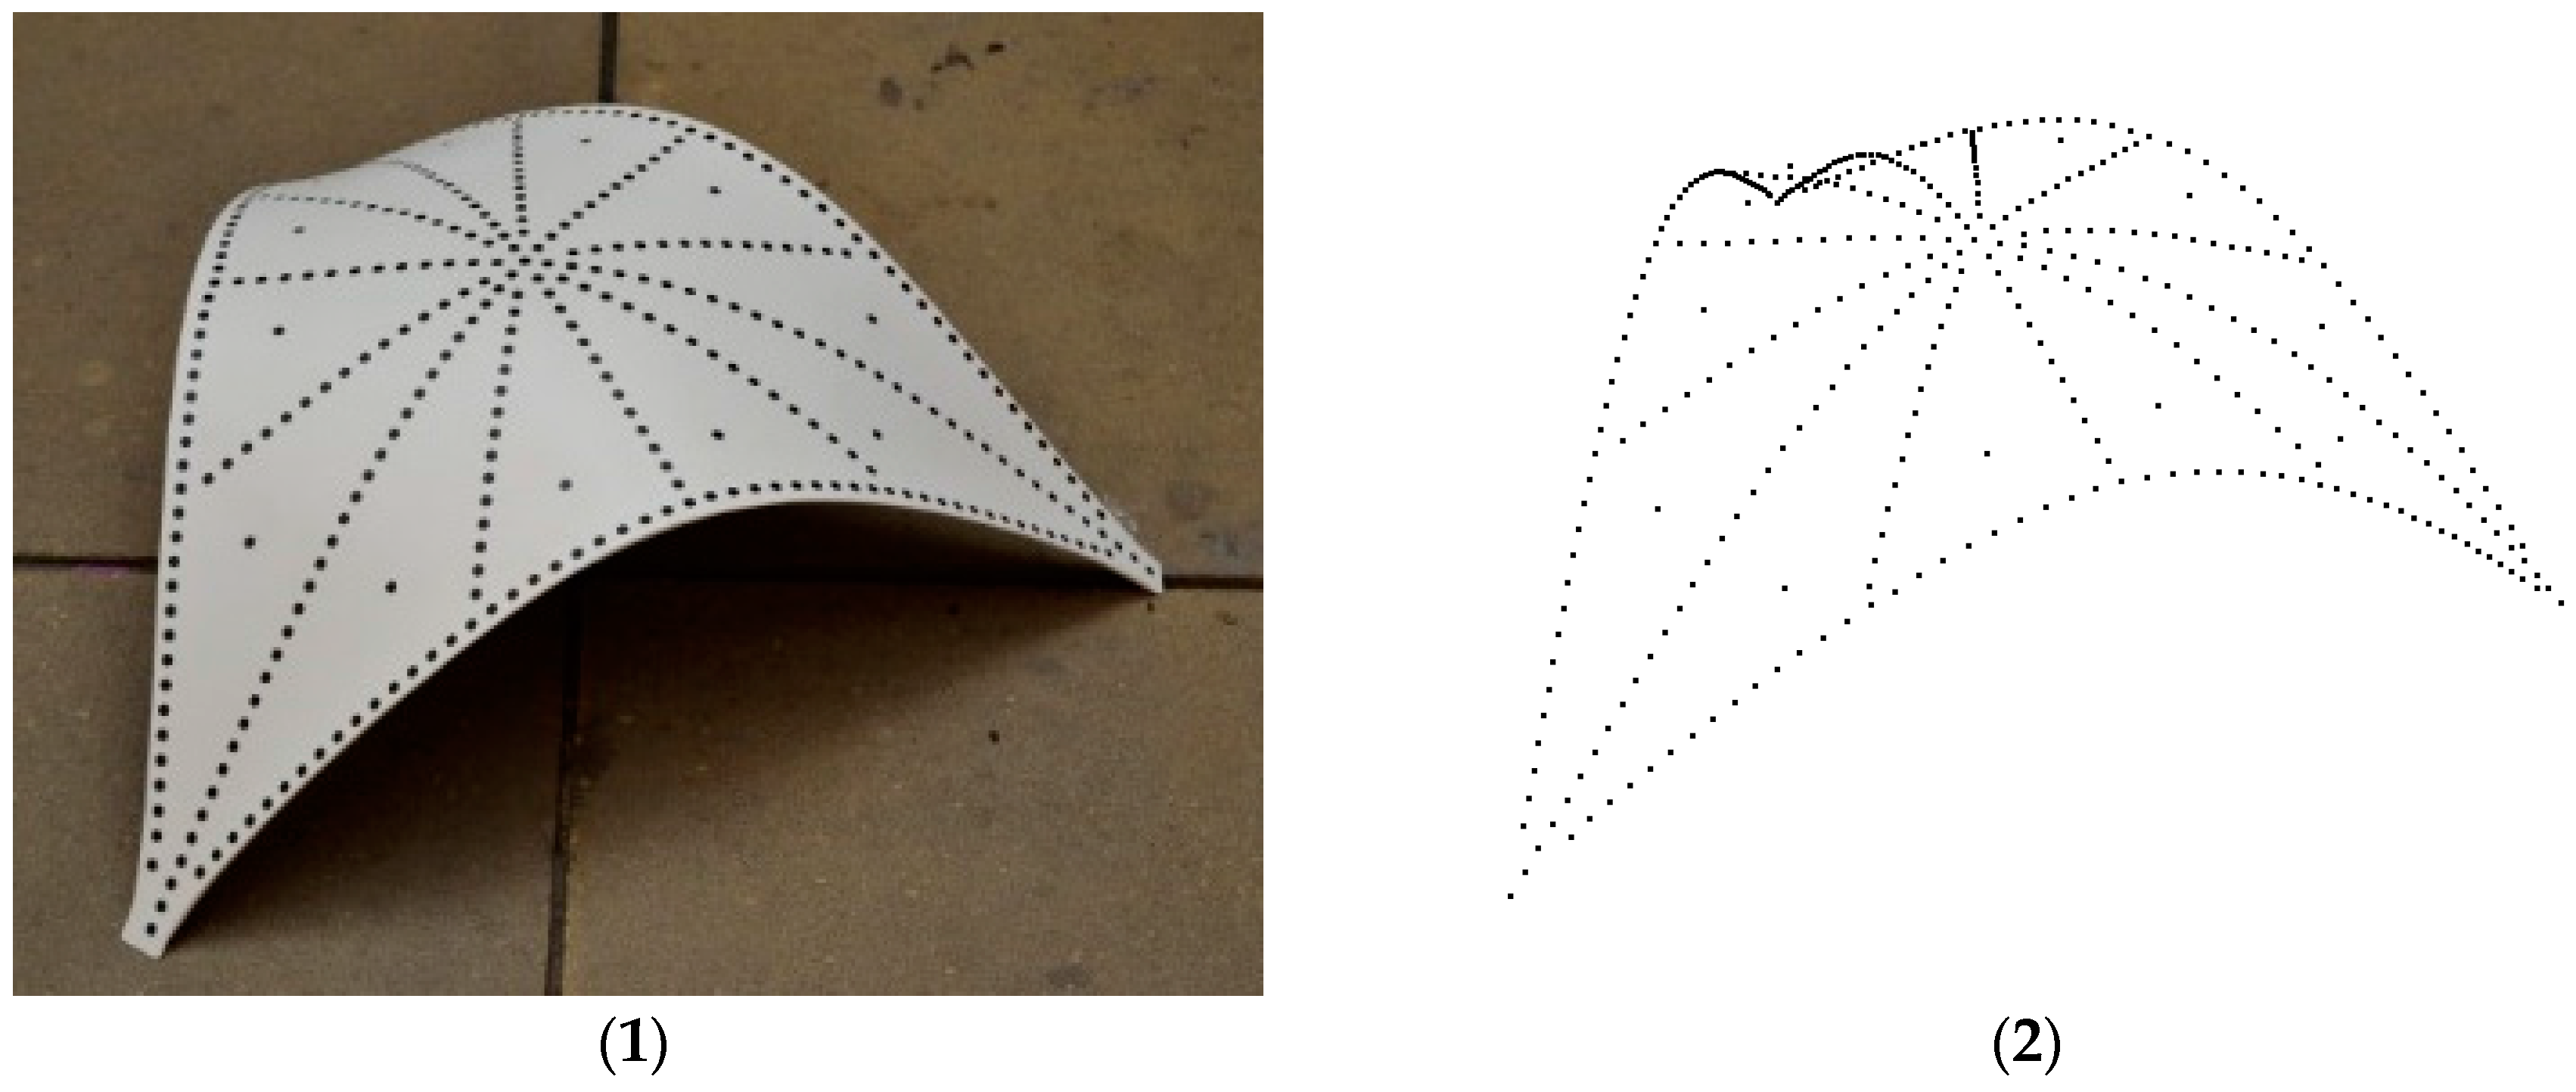
29], aiming at the full reconstruction of the scale model, was applied. The adopted procedure required high precision circular targets to be glued to the upper surface of the scale model (
Figure 15(1)). This enabled referencing the 384 high precision targets in all images processed (
Figure 15(2)). According to the acquisition protocol, multiple convergent shots of eight images around the object were sequentially obtained.
The comparison between the numerical (
Figure 14) and the physical (
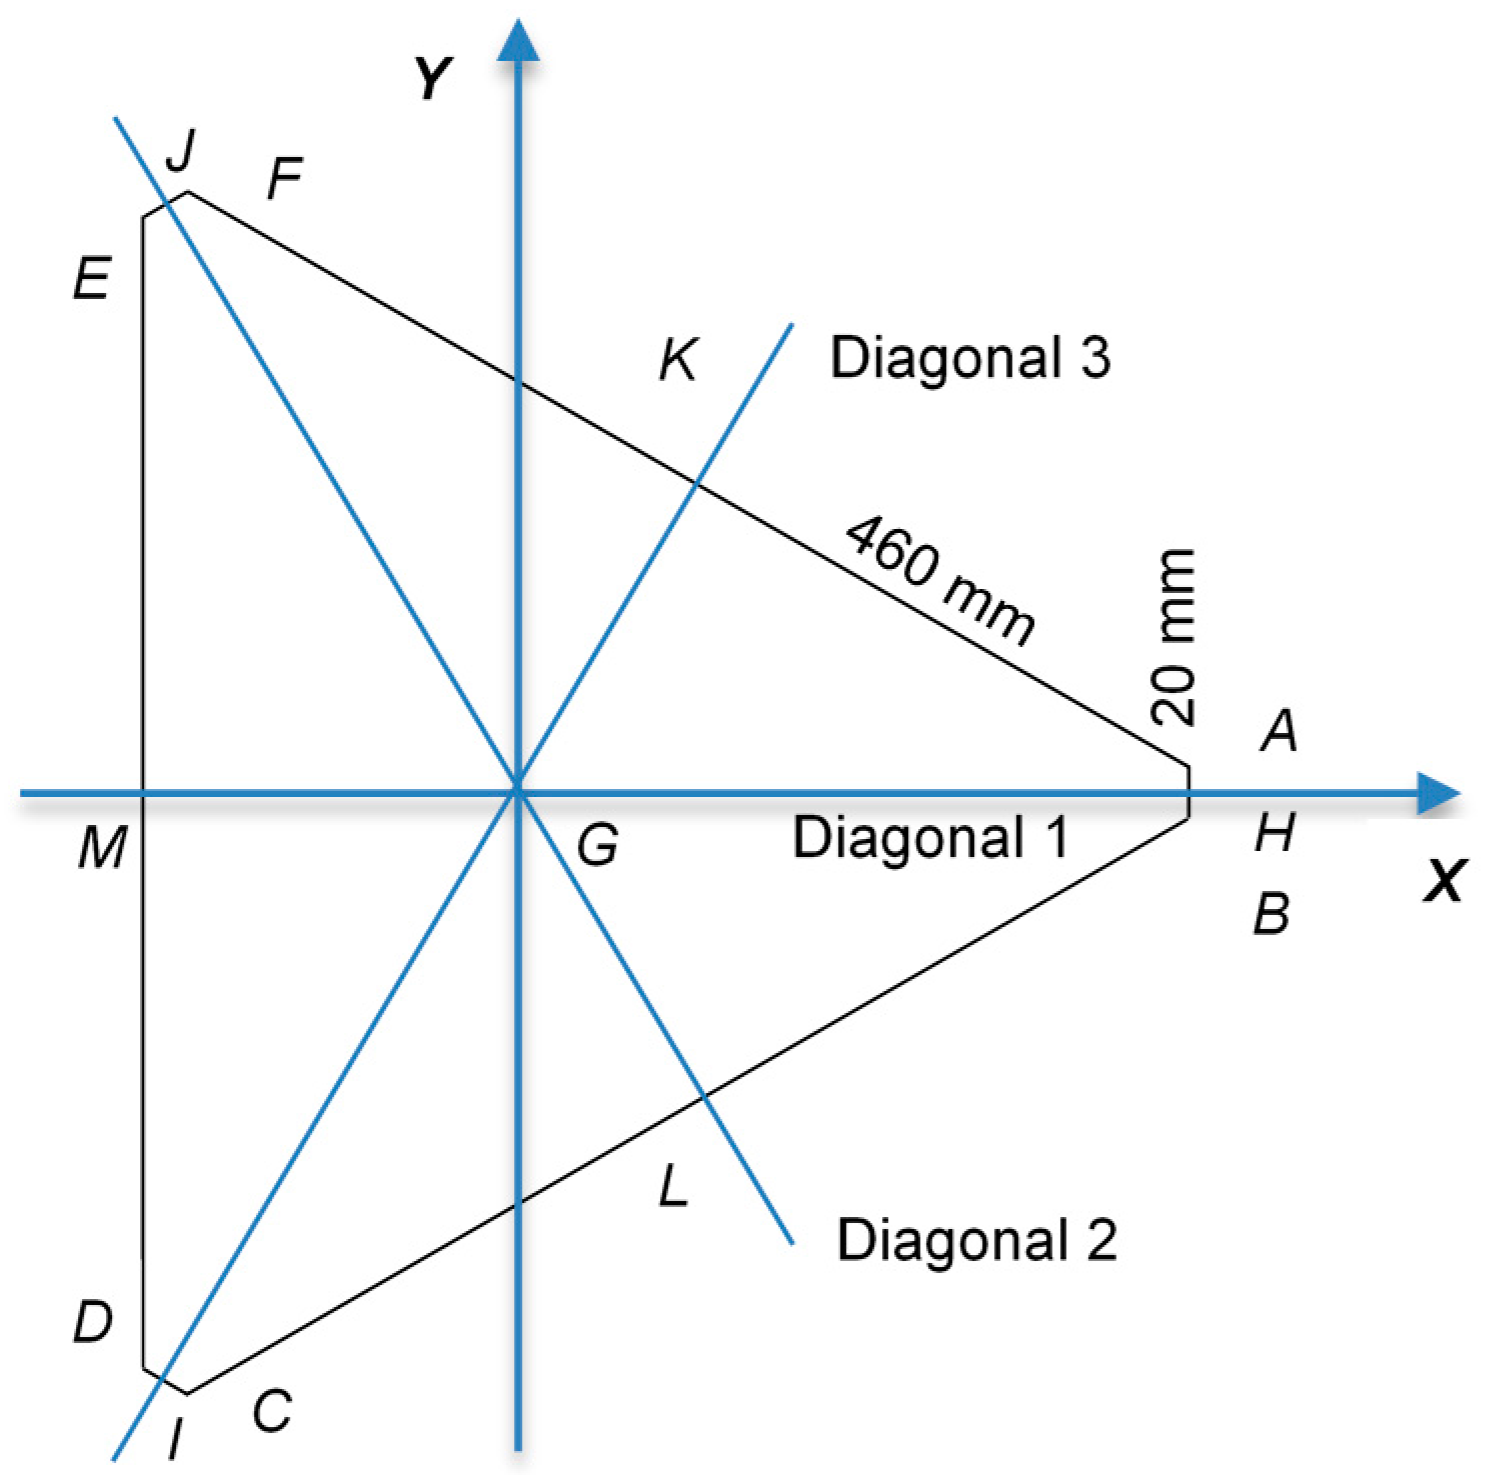
Figure 15) models was performed at the vertical symmetry planes that cross the diagonals of the shell. This ensured that exactly the same cross sections of the shell were considered in each model. Nonetheless, the 3D coordinates computed by both methods refer to different points. For this reason, it was not possible to carry out direct point-to-point checking. Instead, three cross-sections of the models, defined by the diagonal planes
MGH,
JGL, and
IGK (
Figure 16), were considered to perform the comparison. The geometry of each cross-section was defined through interpolation curves surveyed by Mathematica software [
30]. For that propose, the nodes in the mesh for the numerical model, and the high precision targets for the photogrammetric model, were considered.
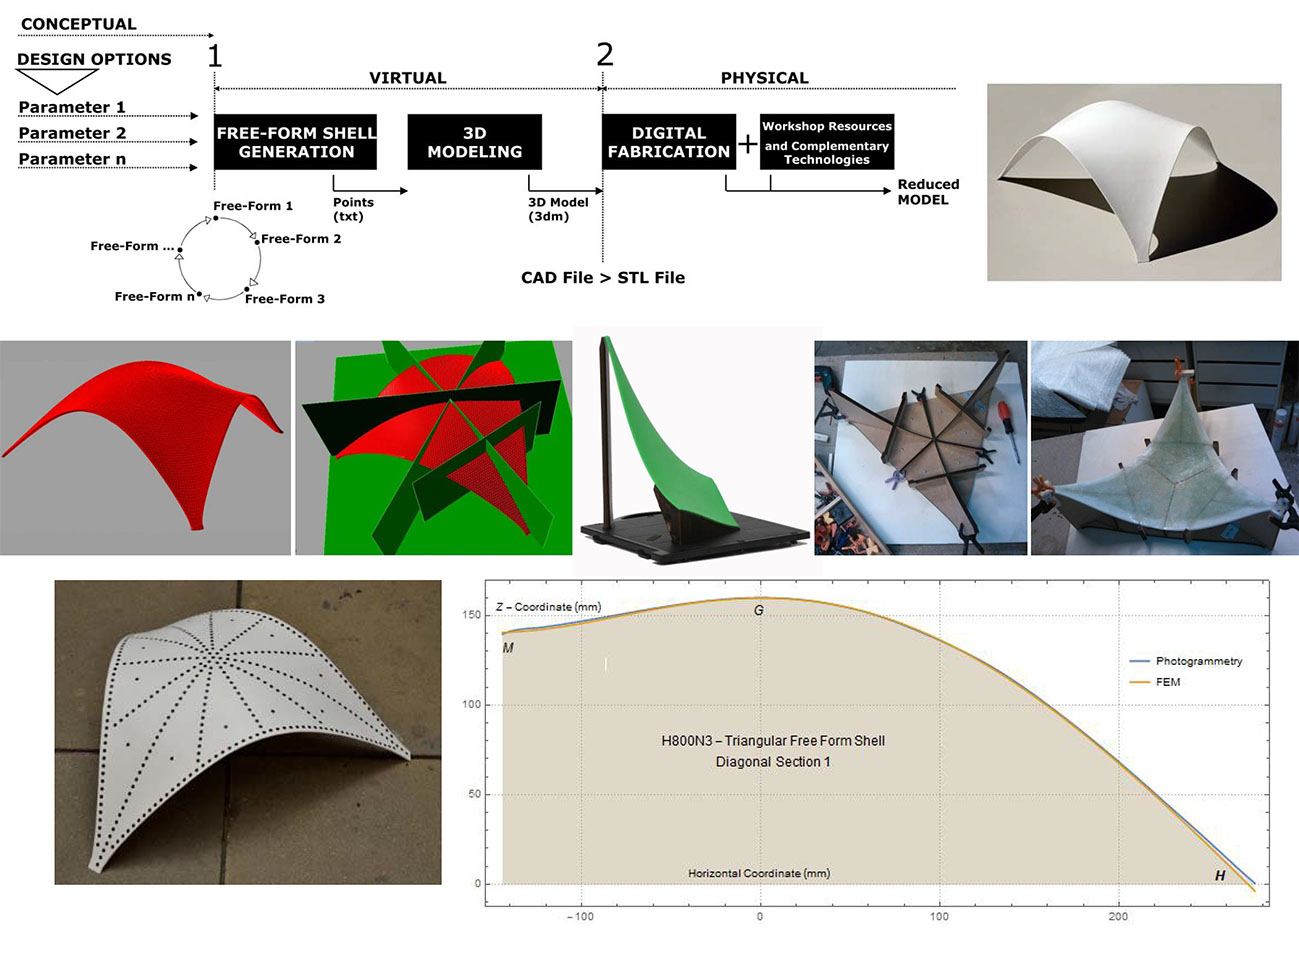
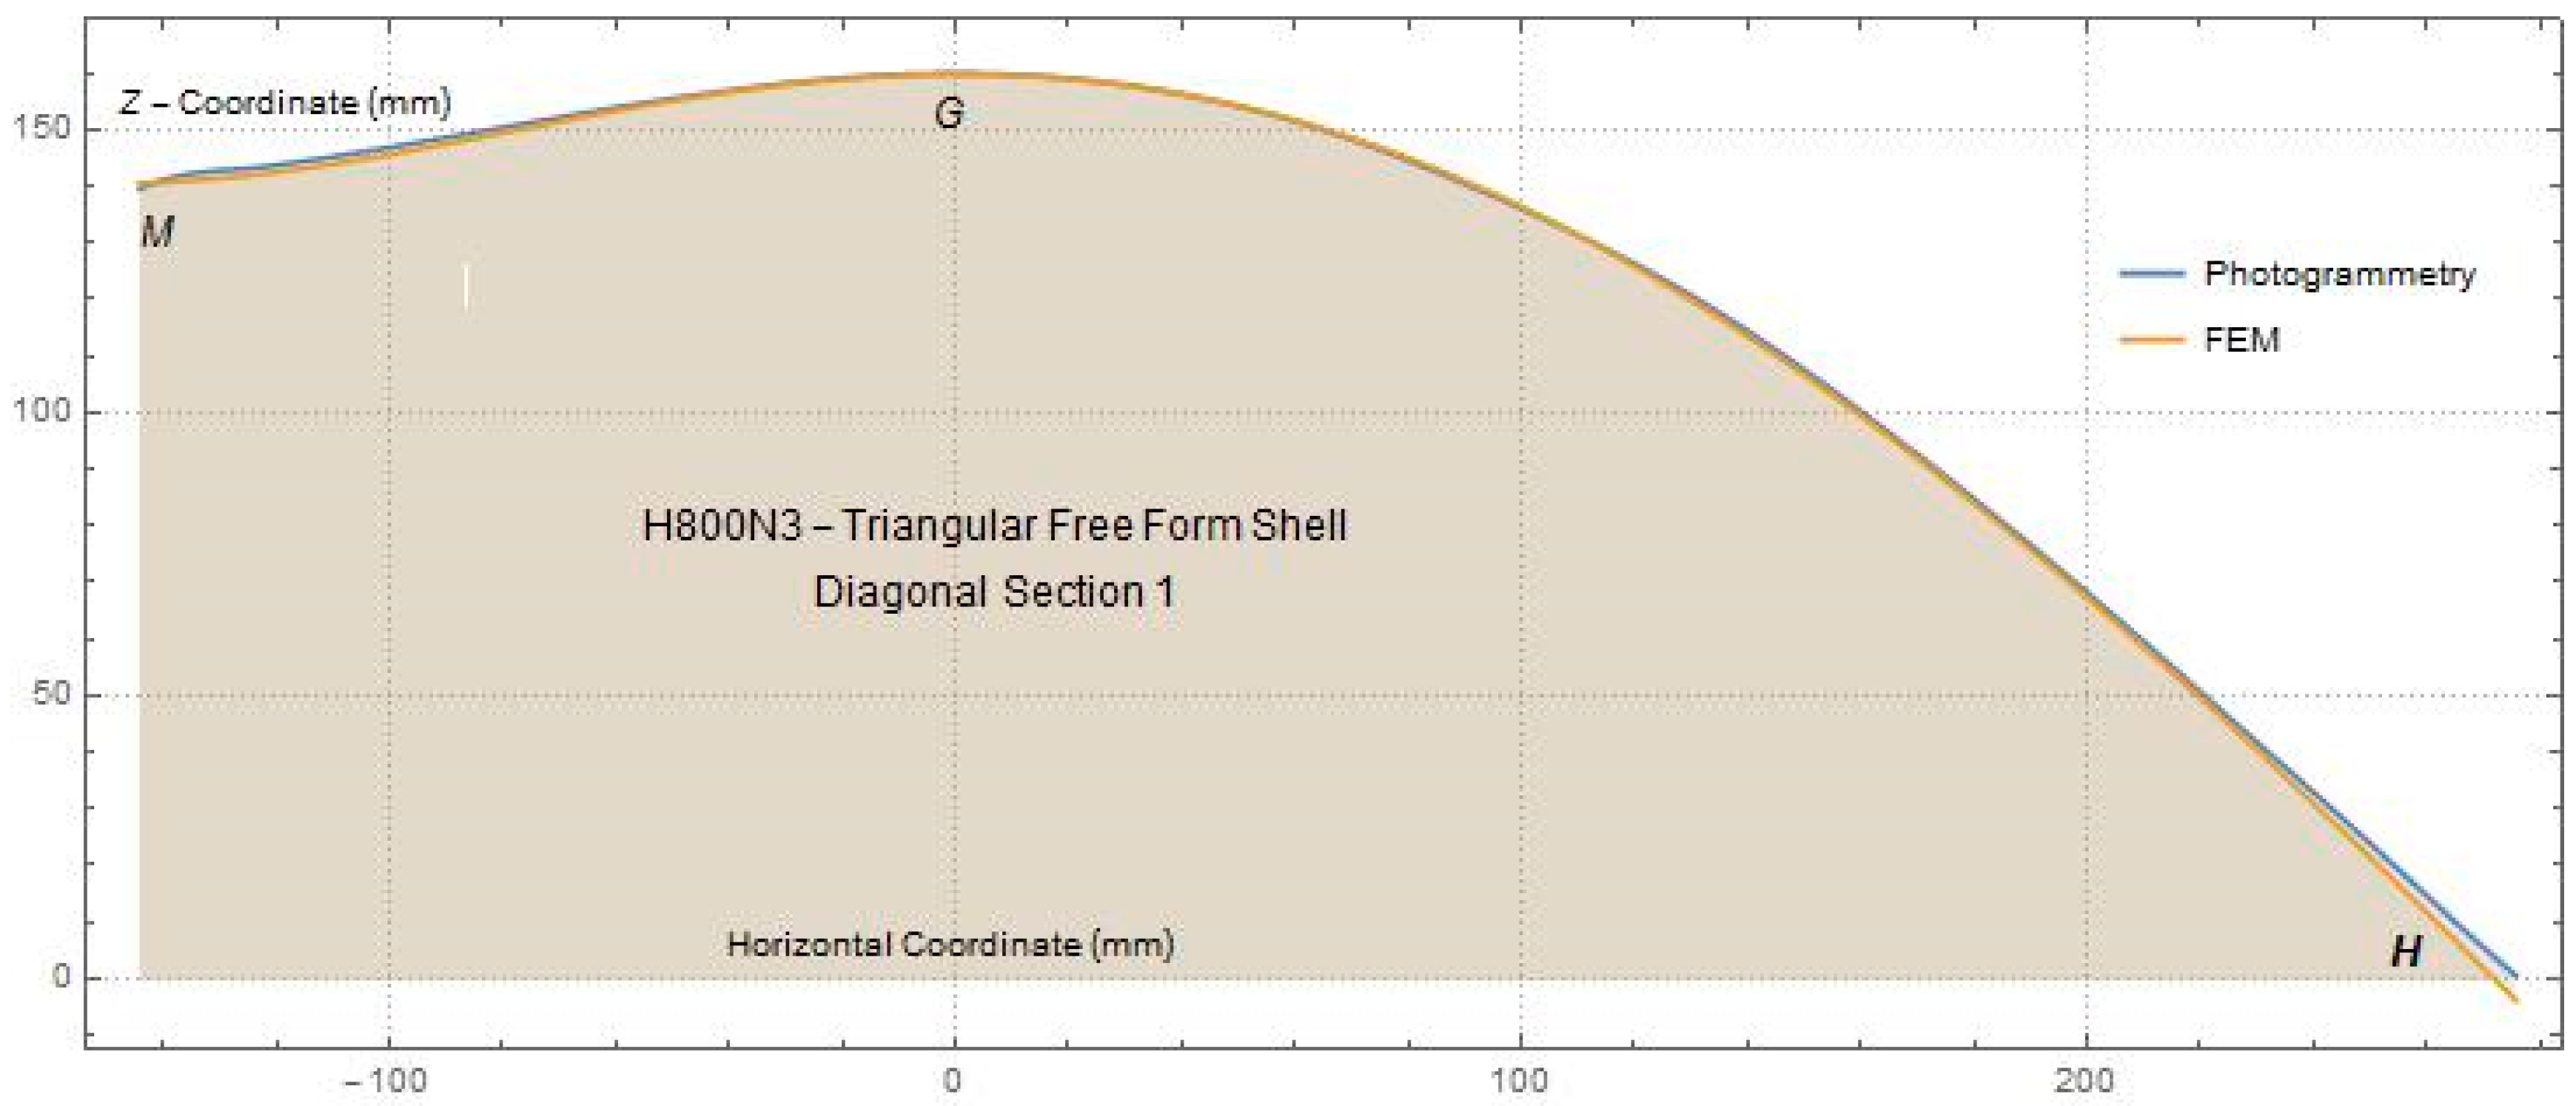
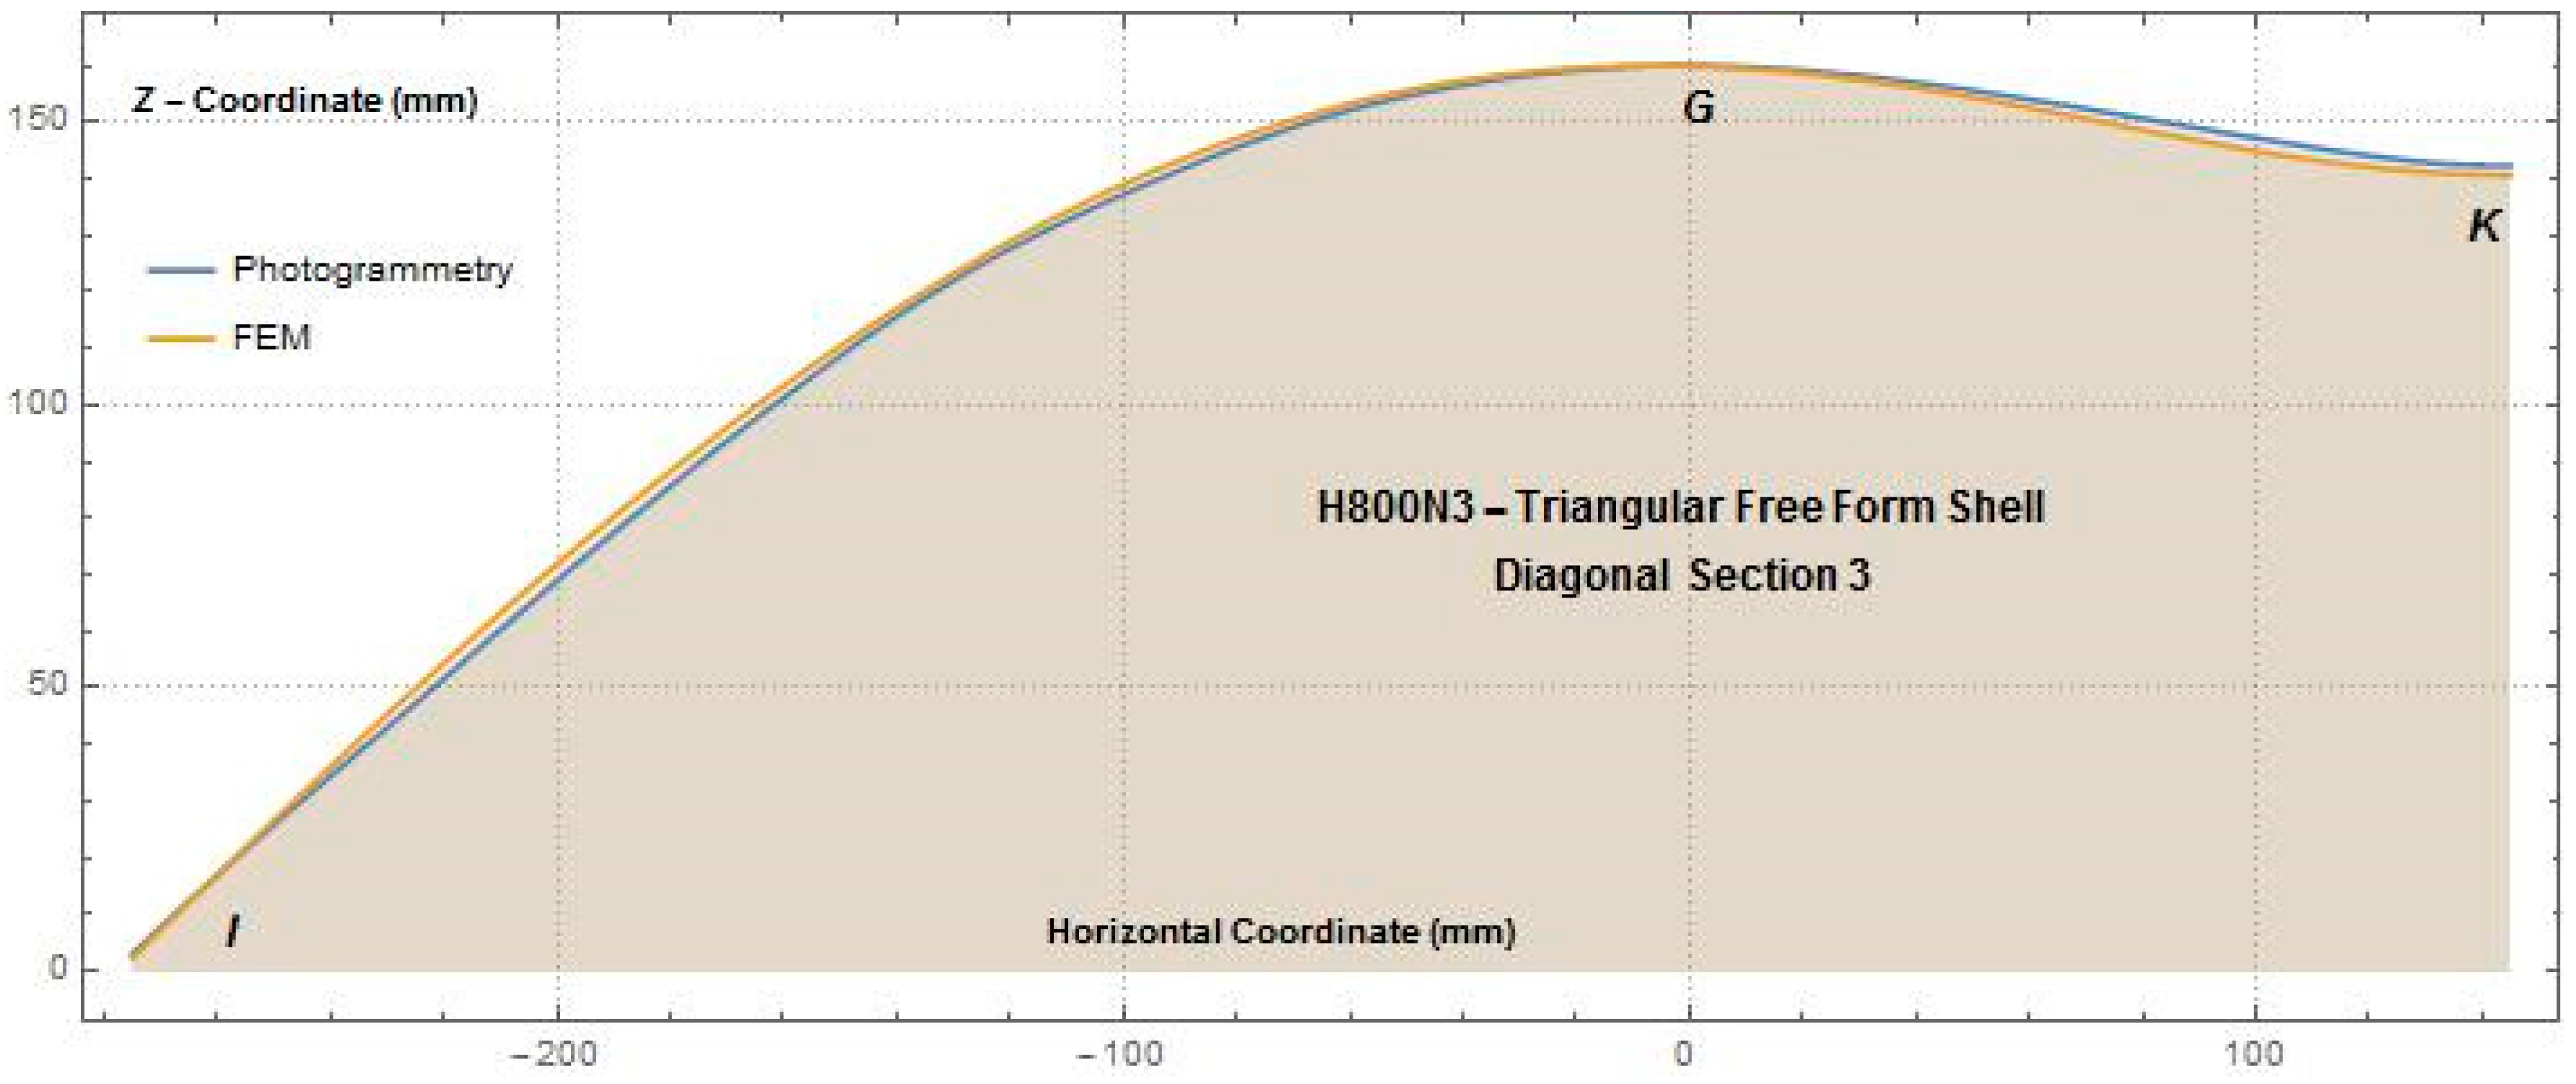
The geometric configuration obtained for each of the three diagonal cross sections of the shell are presented in
Figure 17,
Figure 18 and
Figure 19. It can be seen that the geometrycorresponding to the numerical model and to the scale model do not present significant differences.
The almost perfect geometric coincidence demonstrates the viability and reliability of the method herein proposed for generating a 3D scale model of free shape shells numerically generated according to the procedure described in [
10]. It represents an important tool for studying the aerodynamic behaviour of shells in the wind tunnel, namely to obtain pressure coefficients, aiming at adequately performing the calibration and validation of the numerical models.
6. Conclusions
An innovative method for the automatic shape generation and production of reduced-scale models of ultra-thin concrete shells, built with a geometrically nonlinear finite-element-based software and 3D-printing, was presented herein. Guidelines for the method have been defined, aiming to serve as reference in future research studies.
The means of digital production ensured reliable data transfer from the virtual to the physical environment, respecting the formal integrity of this type of non-conventional object. In this scope, it can be stated that the 3D printing technology constitutes the adequate production process since it allows the faithful reproduction of the model. Nevertheless, the volumetric limitation of the operational capacity of such equipment makes the subdivision of the model inevitable. The use of complementary technologies and workmanship means allowing rigorous rebuilding of the shape of the shell.
As a final conclusion, it can be stated that the innovative method herein presented, developed to generate the shape of shells and produce scale models for wind tunnel testing, is a powerful tool, having as limitation only the current constraints of the 3D printing technology. In addition, with the envisaged developments of this technology, the method is expected to become in the near future the most adequate for the production of scale models as well as for other applications.
The data collected from this experiment (and the development of more models) will support a systematic method of production of reduced models of free-form shells for wind tunnel tests.


