Structural Performances of Bridge Types in the U.S. National Bridge Inventory


Cincinnati, OH 45231, USA
Infrastructures 2018, 3(1), 6; https://0-doi-org.brum.beds.ac.uk/10.3390/infrastructures3010006
Submission received: 5 December 2017
/
Revised: 5 February 2018
/
Accepted: 1 March 2018
/
Published: 4 March 2018
Abstract
:This paper demonstrates a comprehensive national network-level analysis to determine the relative deteriorations and operational structural performances of the various types of bridge structural design and/or construction. The study analyzes the entire database of the U.S. National Bridge Inventory for the year 2013 and considers bridge counts along with bridge deck areas that provide more significant results. Analysis of the proportional distribution of structural deficiency reveals issues of deterioration. Considering the structural deficiency, service life cycle and deterioration trends of bridge types over time, the multi-criteria equivalent structural performances incorporate the condition, durability, longevity, rate and pattern performances. The results provide support for more sustainable engineering and management decisions. Stringer/multi beam or girder (type 02) bridges are the most common bridge type, 40.75% by counts and 61.88% by areas. The structural performance of type 02 bridges seems comparable to the average of all bridges, yet they have lower durability and longevity performances, revealing a relative service life cycle vulnerability. The lowest structural performances are orthotropic (type 08) and segmental box girder (type 21) bridges; while their condition performances are rather high, their durability, longevity, rate and pattern performances are essentially low. The slight improvement of structural performance from 2006 to 2013 for most bridge types is not significant over seven years. Also, certain bridge types worsened.
1. Introduction
To sustain a practical ideal of a healthier bridge transportation system, under the conditions of material aging, structural deterioration, weather and environmental effects, increasing operational demands, need for improvement of existing bridges, quest for modernization of future bridges, drive for higher efficiency and tight financial limitations constitutes a complex professional challenge in engineering and management for transportation agencies. Studies suggest quantitative evaluations of probabilistic satisfactory performance of bridge inventories, to support professional efforts [1,2,3,4,5,6,7]. Comparative analysis of large populations of bridge categories enables more objective decision-making in bridge design, construction, maintenance, renewal and management [8,9,10,11,12,13,14]. Risk-based lifecycle engineering approaches also support structural performance analysis of deteriorating civil infrastructure systems under uncertainty [15,16,17,18].
The Transportation Research Board’s (TRB) Long-Term Bridge Performance (LTBP) Program is designed to collect research-quality quantifiable field performance data on a large representative sample of in-service highway bridges in the U.S. and to analyze these data to improve understanding of the mechanisms and timing of bridge deterioration due to the effects of age, materials, traffic and weather [19,20,21,22,23,24]. The LTBP Committee’s report to the U.S. Federal Highway Administration (FHWA) recommends a business plan with deterioration and life-cycle cost modeling methodologies for state agencies and LTBP Bridge Portal with non-destructive evaluation (NDE) and inspection data as a source of information [25]. Yet, cost modeling methodologies must consider the structural performances of bridges based on structural deficiency, service life cycle and deterioration trends. Also, it is essential to record and include cost data of bridge design, construction, maintenance, renewal and work zone road user for each bridge separately. The LTBP report also recommends focusing on steel girder bridge type as the next step in research.
The initial phase in bridge design is to determine qualitatively the most suitable bridge type(s) based on the specific needs and conditions. To support this process with a quantitative approach, it is important to study the relative operational dependabilities of structural bridge type categories. The U.S. National Bridge Inventory (NBI) is the largest bridge database comprising detailed information on more than 600,000 bridges. The NBI’s condition rating data and structurally deficient (SD) status are based on visual inspections. Analysis of 10 routine inspections at seven bridges reported inconsistencies between 49 bridge inspectors, raising concerns [26]. Nevertheless, the reporting of a SD bridge requires comprehensive and more reliable inspections, rather than one single routine inspection. Also, advanced structural evaluation methods for rating all the components of all bridges are still not consistent and practical.
A comprehensive study of the NBI for the year 2006 analyzed the comparative structural performances of bridge materials [27,28,29,30] and types [31,32,33,34], using a multi-criteria diagnostic approach. This study was further extended to evaluate and compare with the NBI 2013 [35] for bridge materials [36]. To improve performance in the management of the transportation system, it is necessary to support the FHWA’s concept of implementation of a national bridge structural performance evaluation and reporting [23,24].
This comprehensive study of bridges by structural type categories enables exploring bridge types with potential issues under the actual practices and circumstances. This study analyzes the relative deteriorations, service life cycle and operational structural performances of all the 23 types of bridge structural design and/or construction in the NBI for the year 2013 and also compares results with the NBI for the year 2006. The study considers inventory record averages of structural deficiency for condition performance and service life cycle for durability and longevity performances and also the distinct deterioration trends of bridge types over time for the rate and pattern performances. A multi-criteria diagnostic approach determines the overall equivalent structural performances from the condition, durability, longevity, rate and pattern performances. The results provide support for more sustainable engineering and management decisions.
2. Bridge Inventory
The NBI is the most extensive source of detailed bridge data. The annual report contains formatted data records of 432 characters for each bridge [37]. The study uses the entire NBI database from 6 October 2014, for the year 2013 [35] that includes the 50 states, Washington, D.C. and Puerto Rico, considering all the bridges (including non-highway and routes under bridges) with a complete record of year built, predominant type of structural design and/or construction of main span(s), roadway structure length, out-to-out deck width and evaluated structural status. This database contains 606,014 bridges with 361,774,744 m2 of deck area (Table 1 and Table 2). To analyze structural performance at the serviceability limit states, this study considers the structural status of SD or structurally adequate (SA—not SD), ignoring the traffic status of functionally obsolete. The study considers bridges with an SD status even within their first 10 years, ignoring the “10 Year Rule” [37]. Transportation agencies manage bridges by counts, yet bridge deck areas reflect the essential capacity of bridges and reveal more significantly the various aspects needed for better asset management. This analysis considers and compares bridge counts as well as bridge deck areas calculated from roadway structure length by out-to-out deck width.
3. Inventory Averages
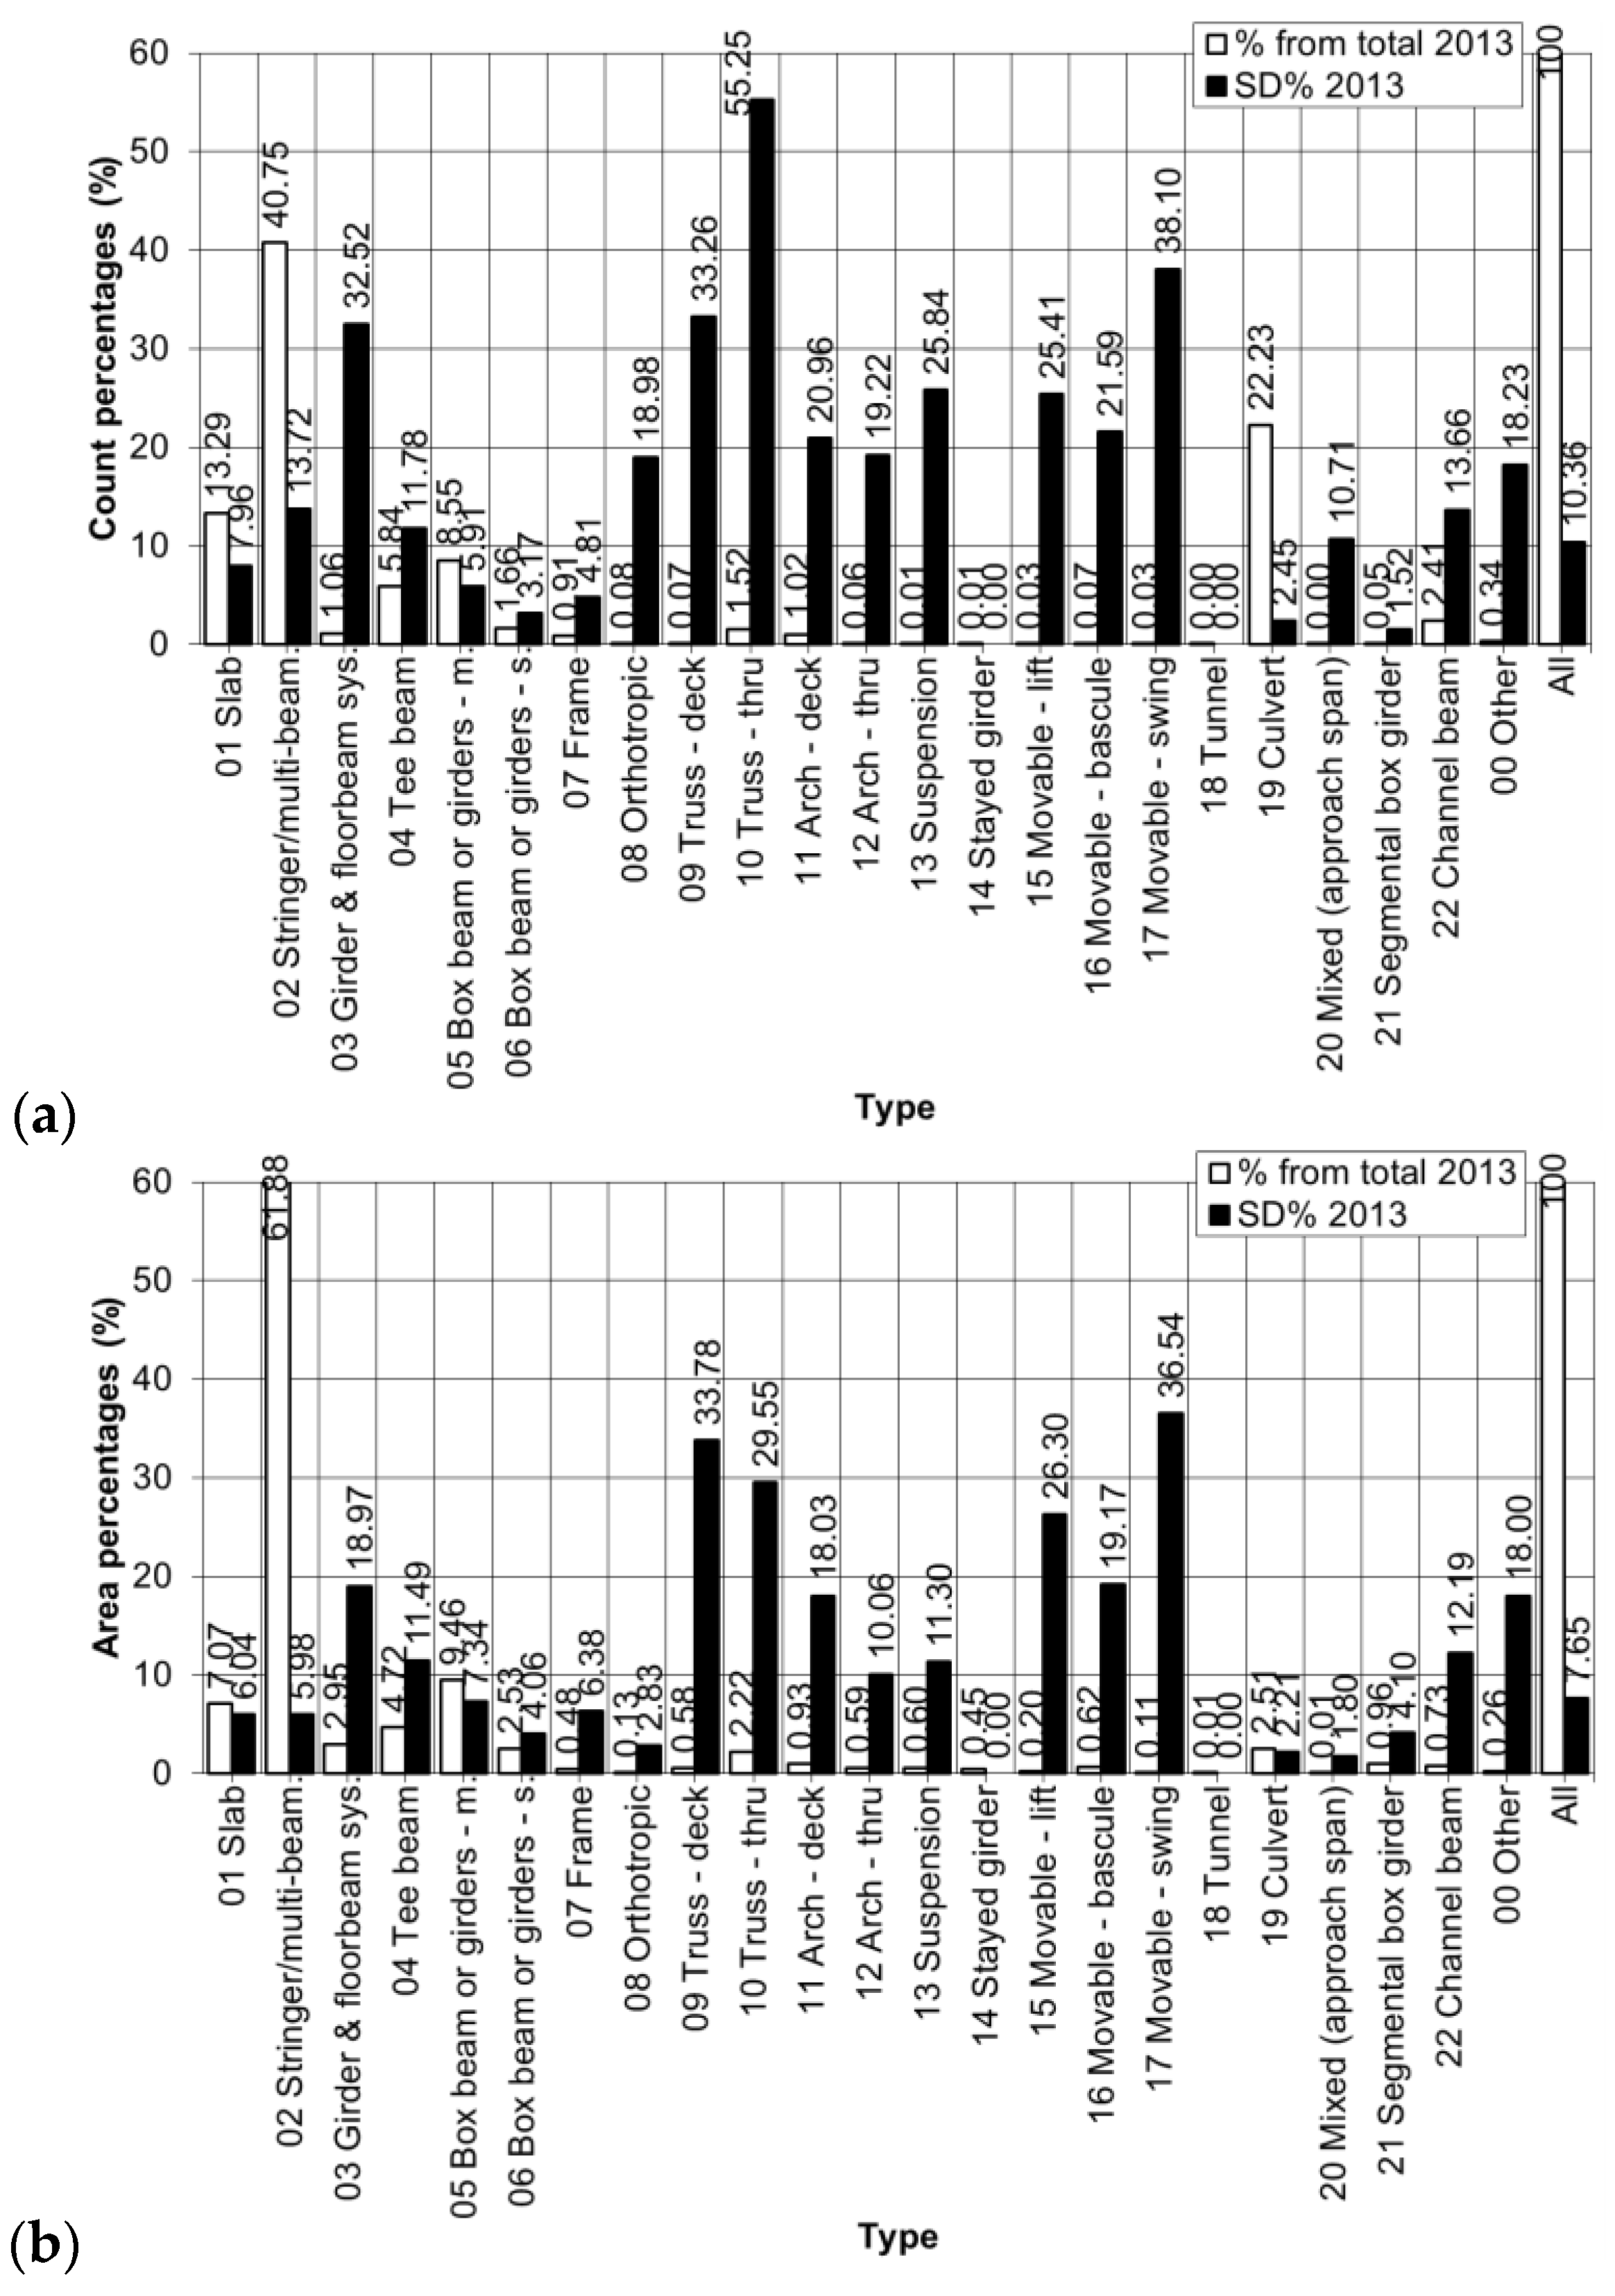
Along with the NBI coding for the various types of structural design and/or construction of bridge main span(s) [37], Table 1 summarizes the counts and Table 2 the areas of bridges by type, their percentage from the total (in square brackets), SD bridges and their percentage from the respective totals (in square brackets). Figure 1a,b compare the prevalence of the various bridge types in percentages from the total in the inventory and their average structural deficiency levels in percentages by counts and areas, respectively.
Stringer/multi beam or girder (type 02) bridges are the most common bridge type by counts (40.75%) and by areas (61.88%). By counts, the 13.72% structural deficiency of type 02 bridges is slightly above the average of 10.36% of all bridges. By areas on the other hand, the 5.98% structural deficiency of type 02 bridges is slightly below the average of 7.65% of all bridges. The highest structural deficiency levels are for truss—thru (type 10) bridges 55.25% by counts and movable—swing (type 17) bridges 36.54% by areas.
Comparing the year 2013 (Figure 1a,b) with 2006 (Figure 1c,d) shows a relative decrease of structural deficiency for most bridge types, while some have a slight increase. For all bridges, the structural deficiency decreased from 12.35% to 10.36% by counts and from 9.38% to 7.65% by areas.
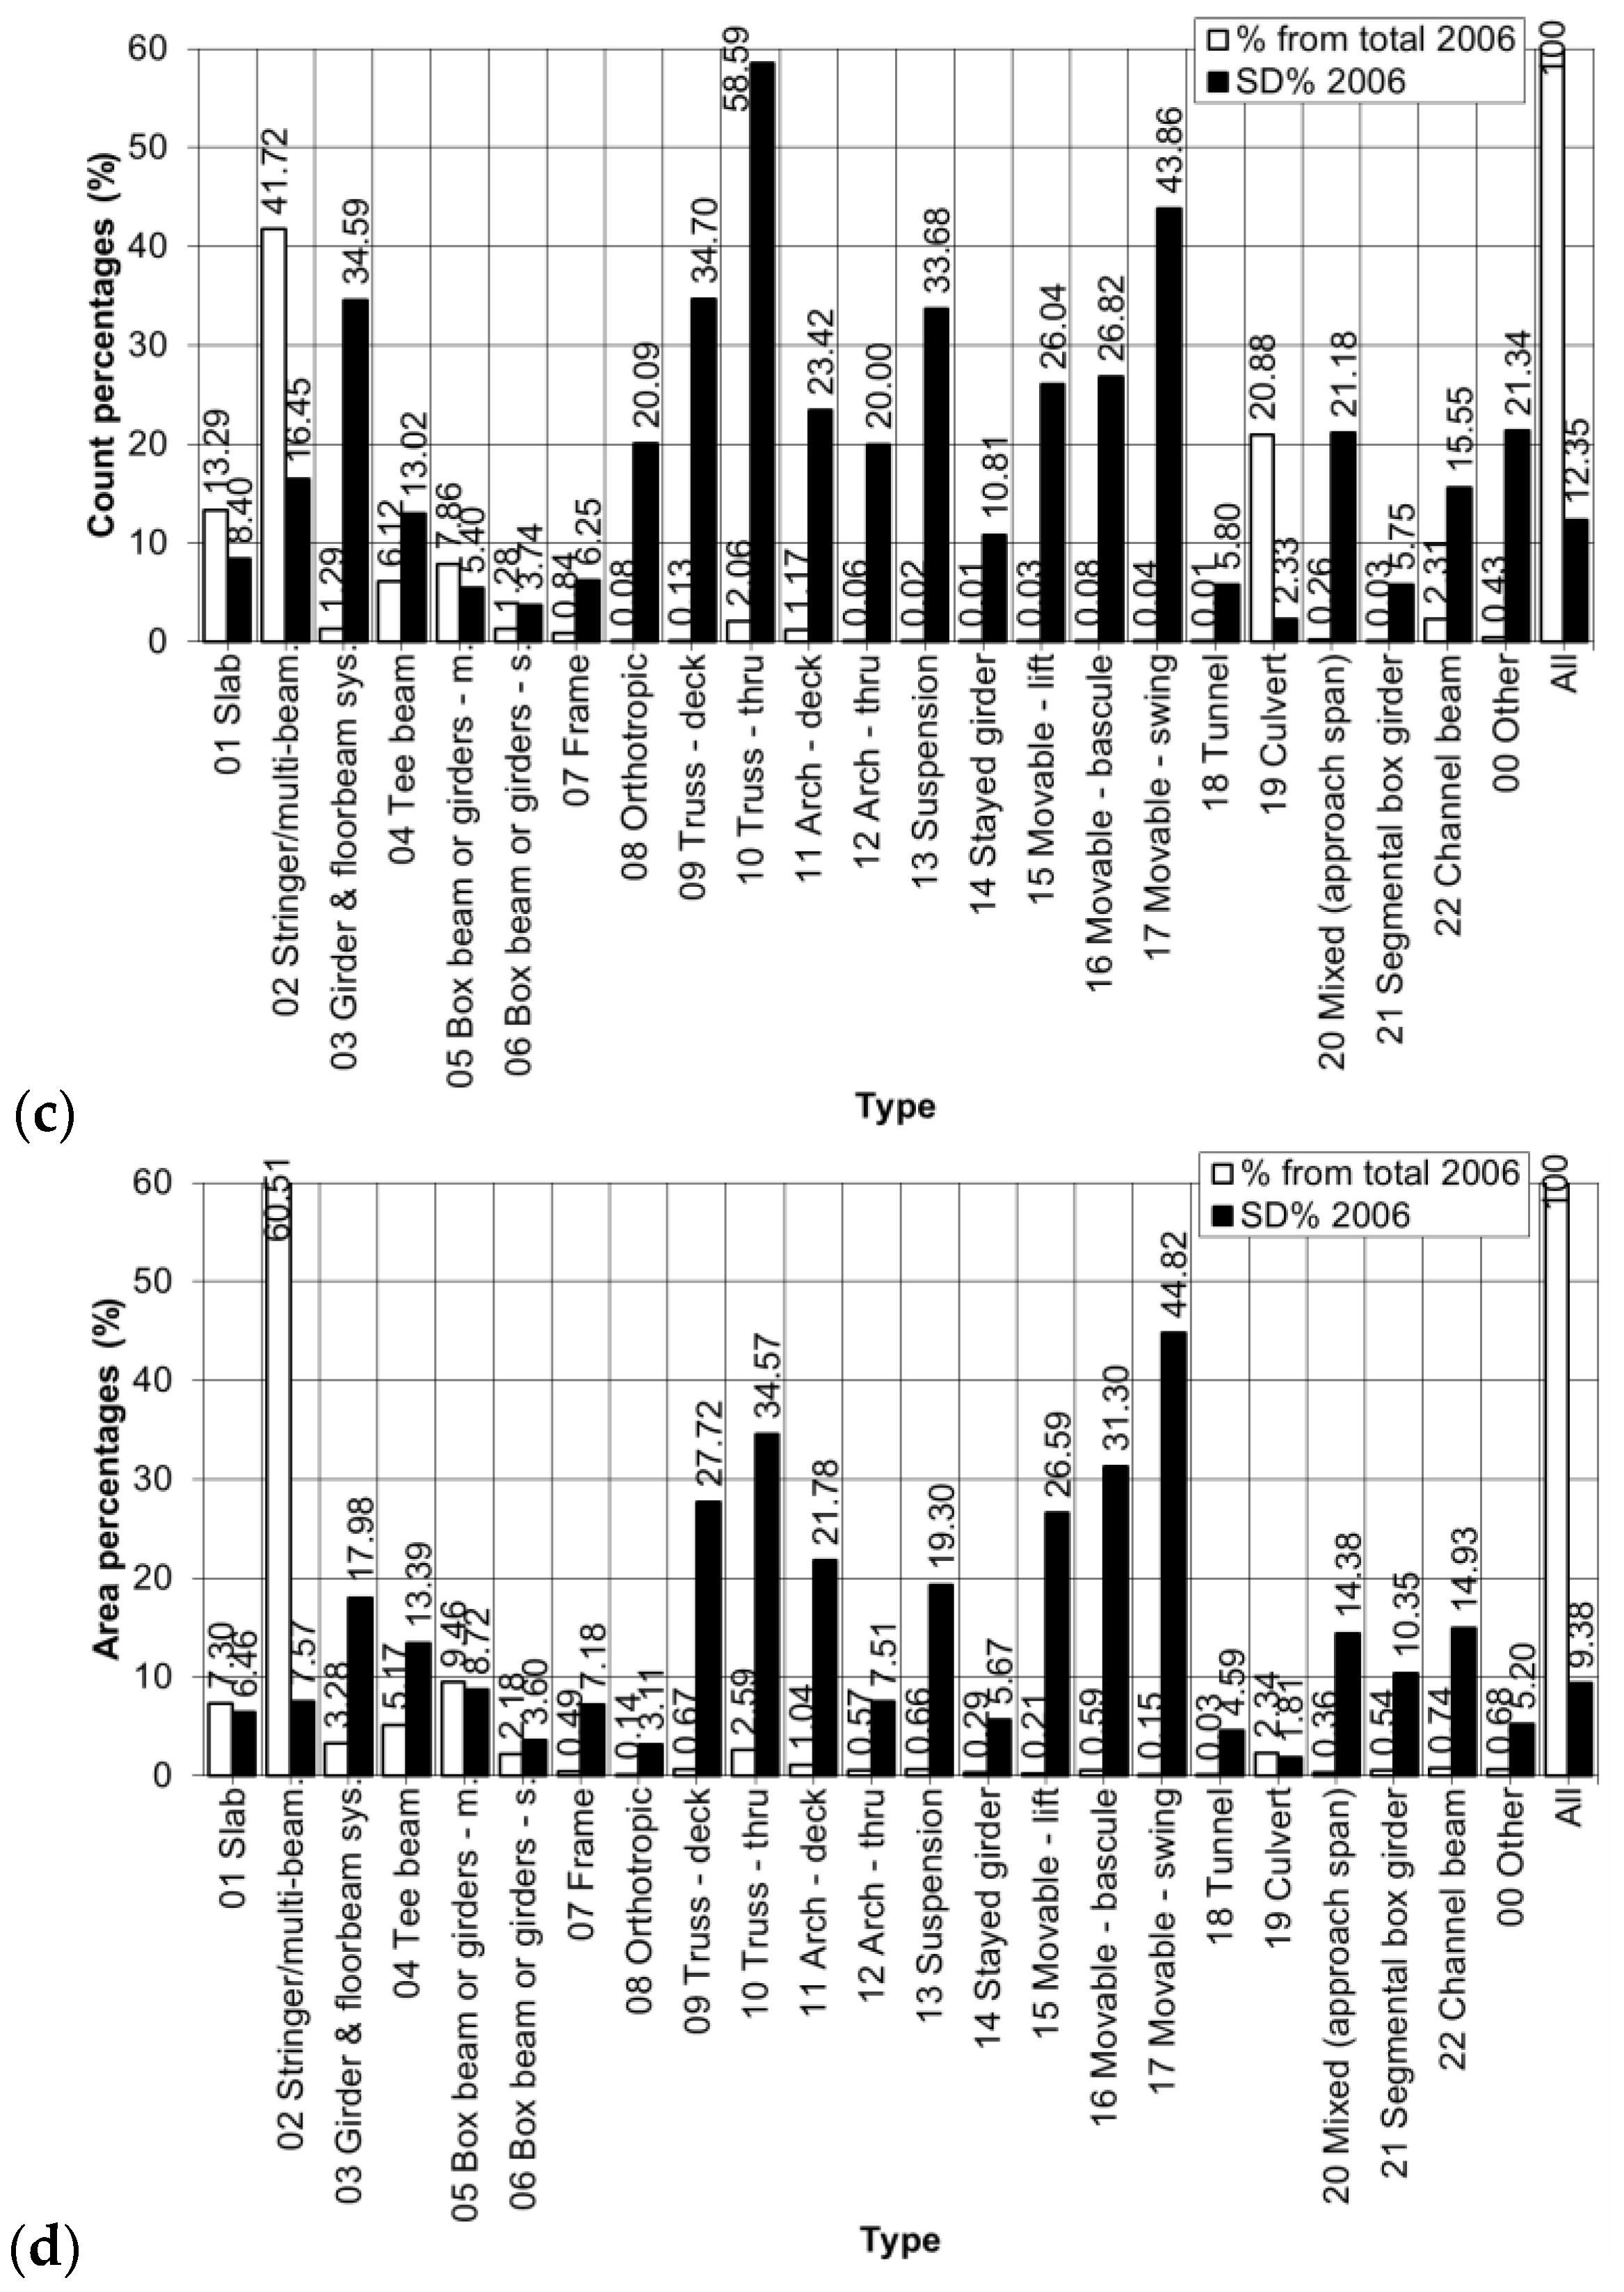
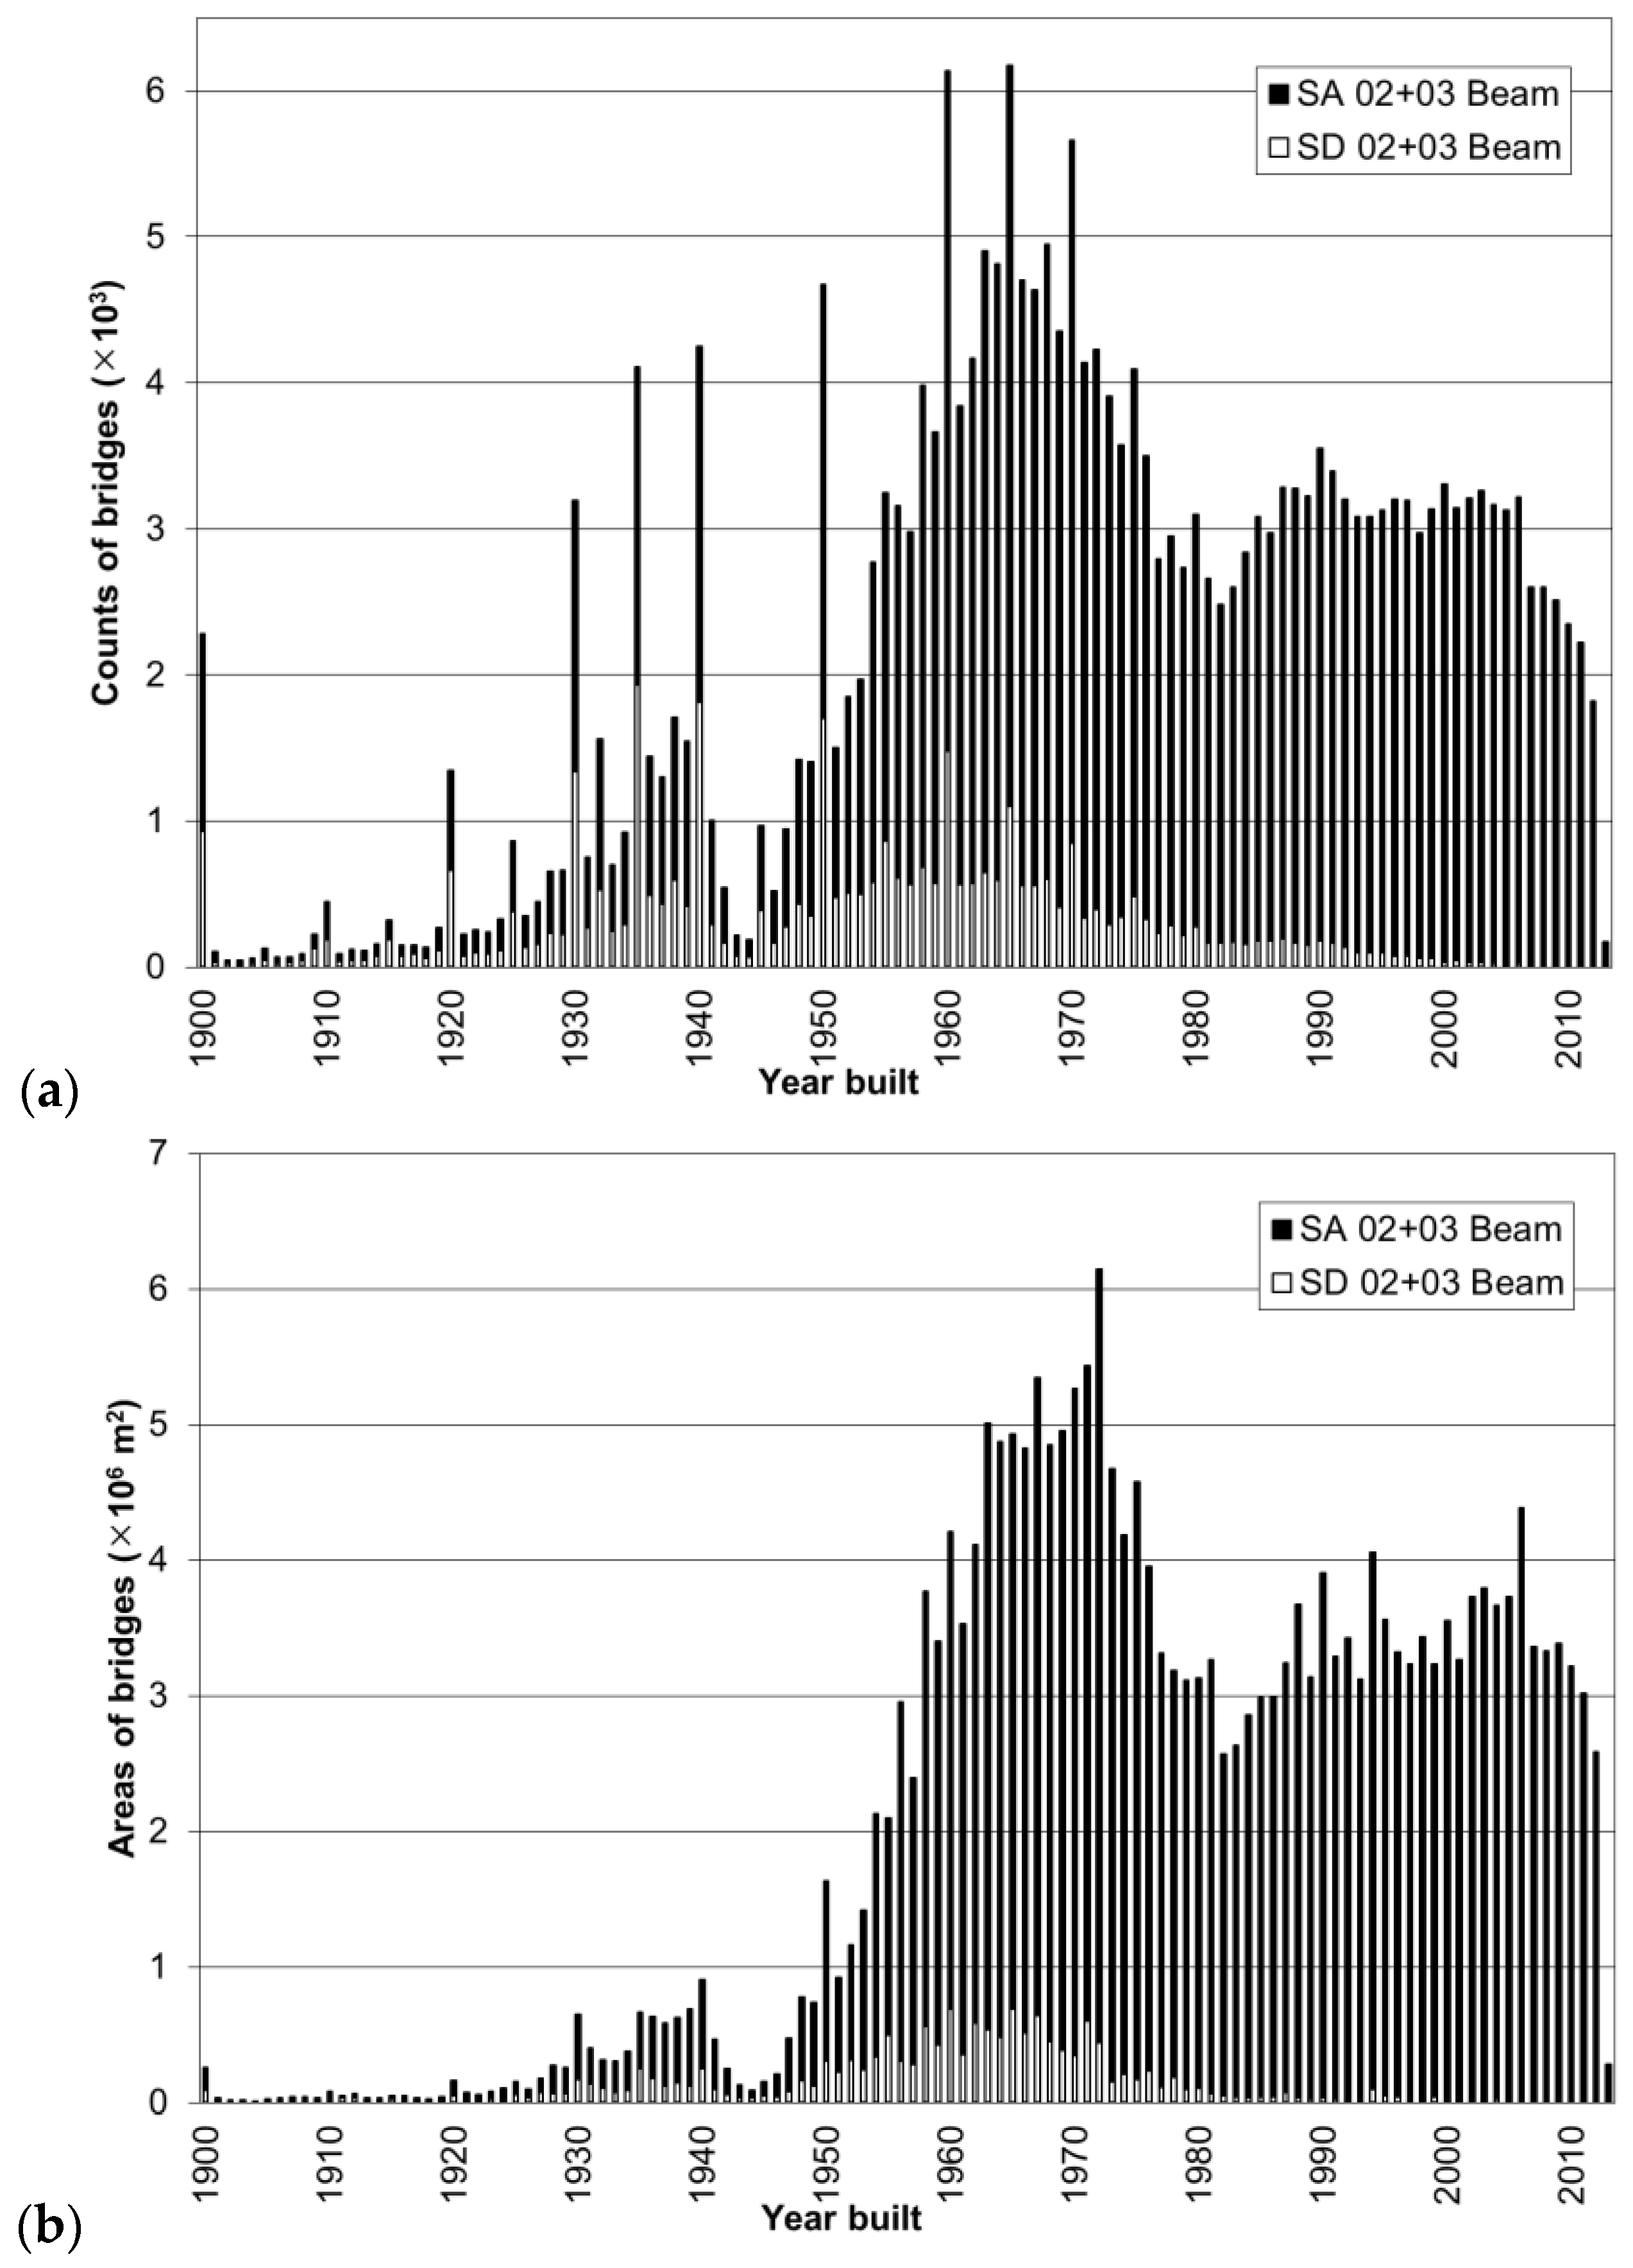
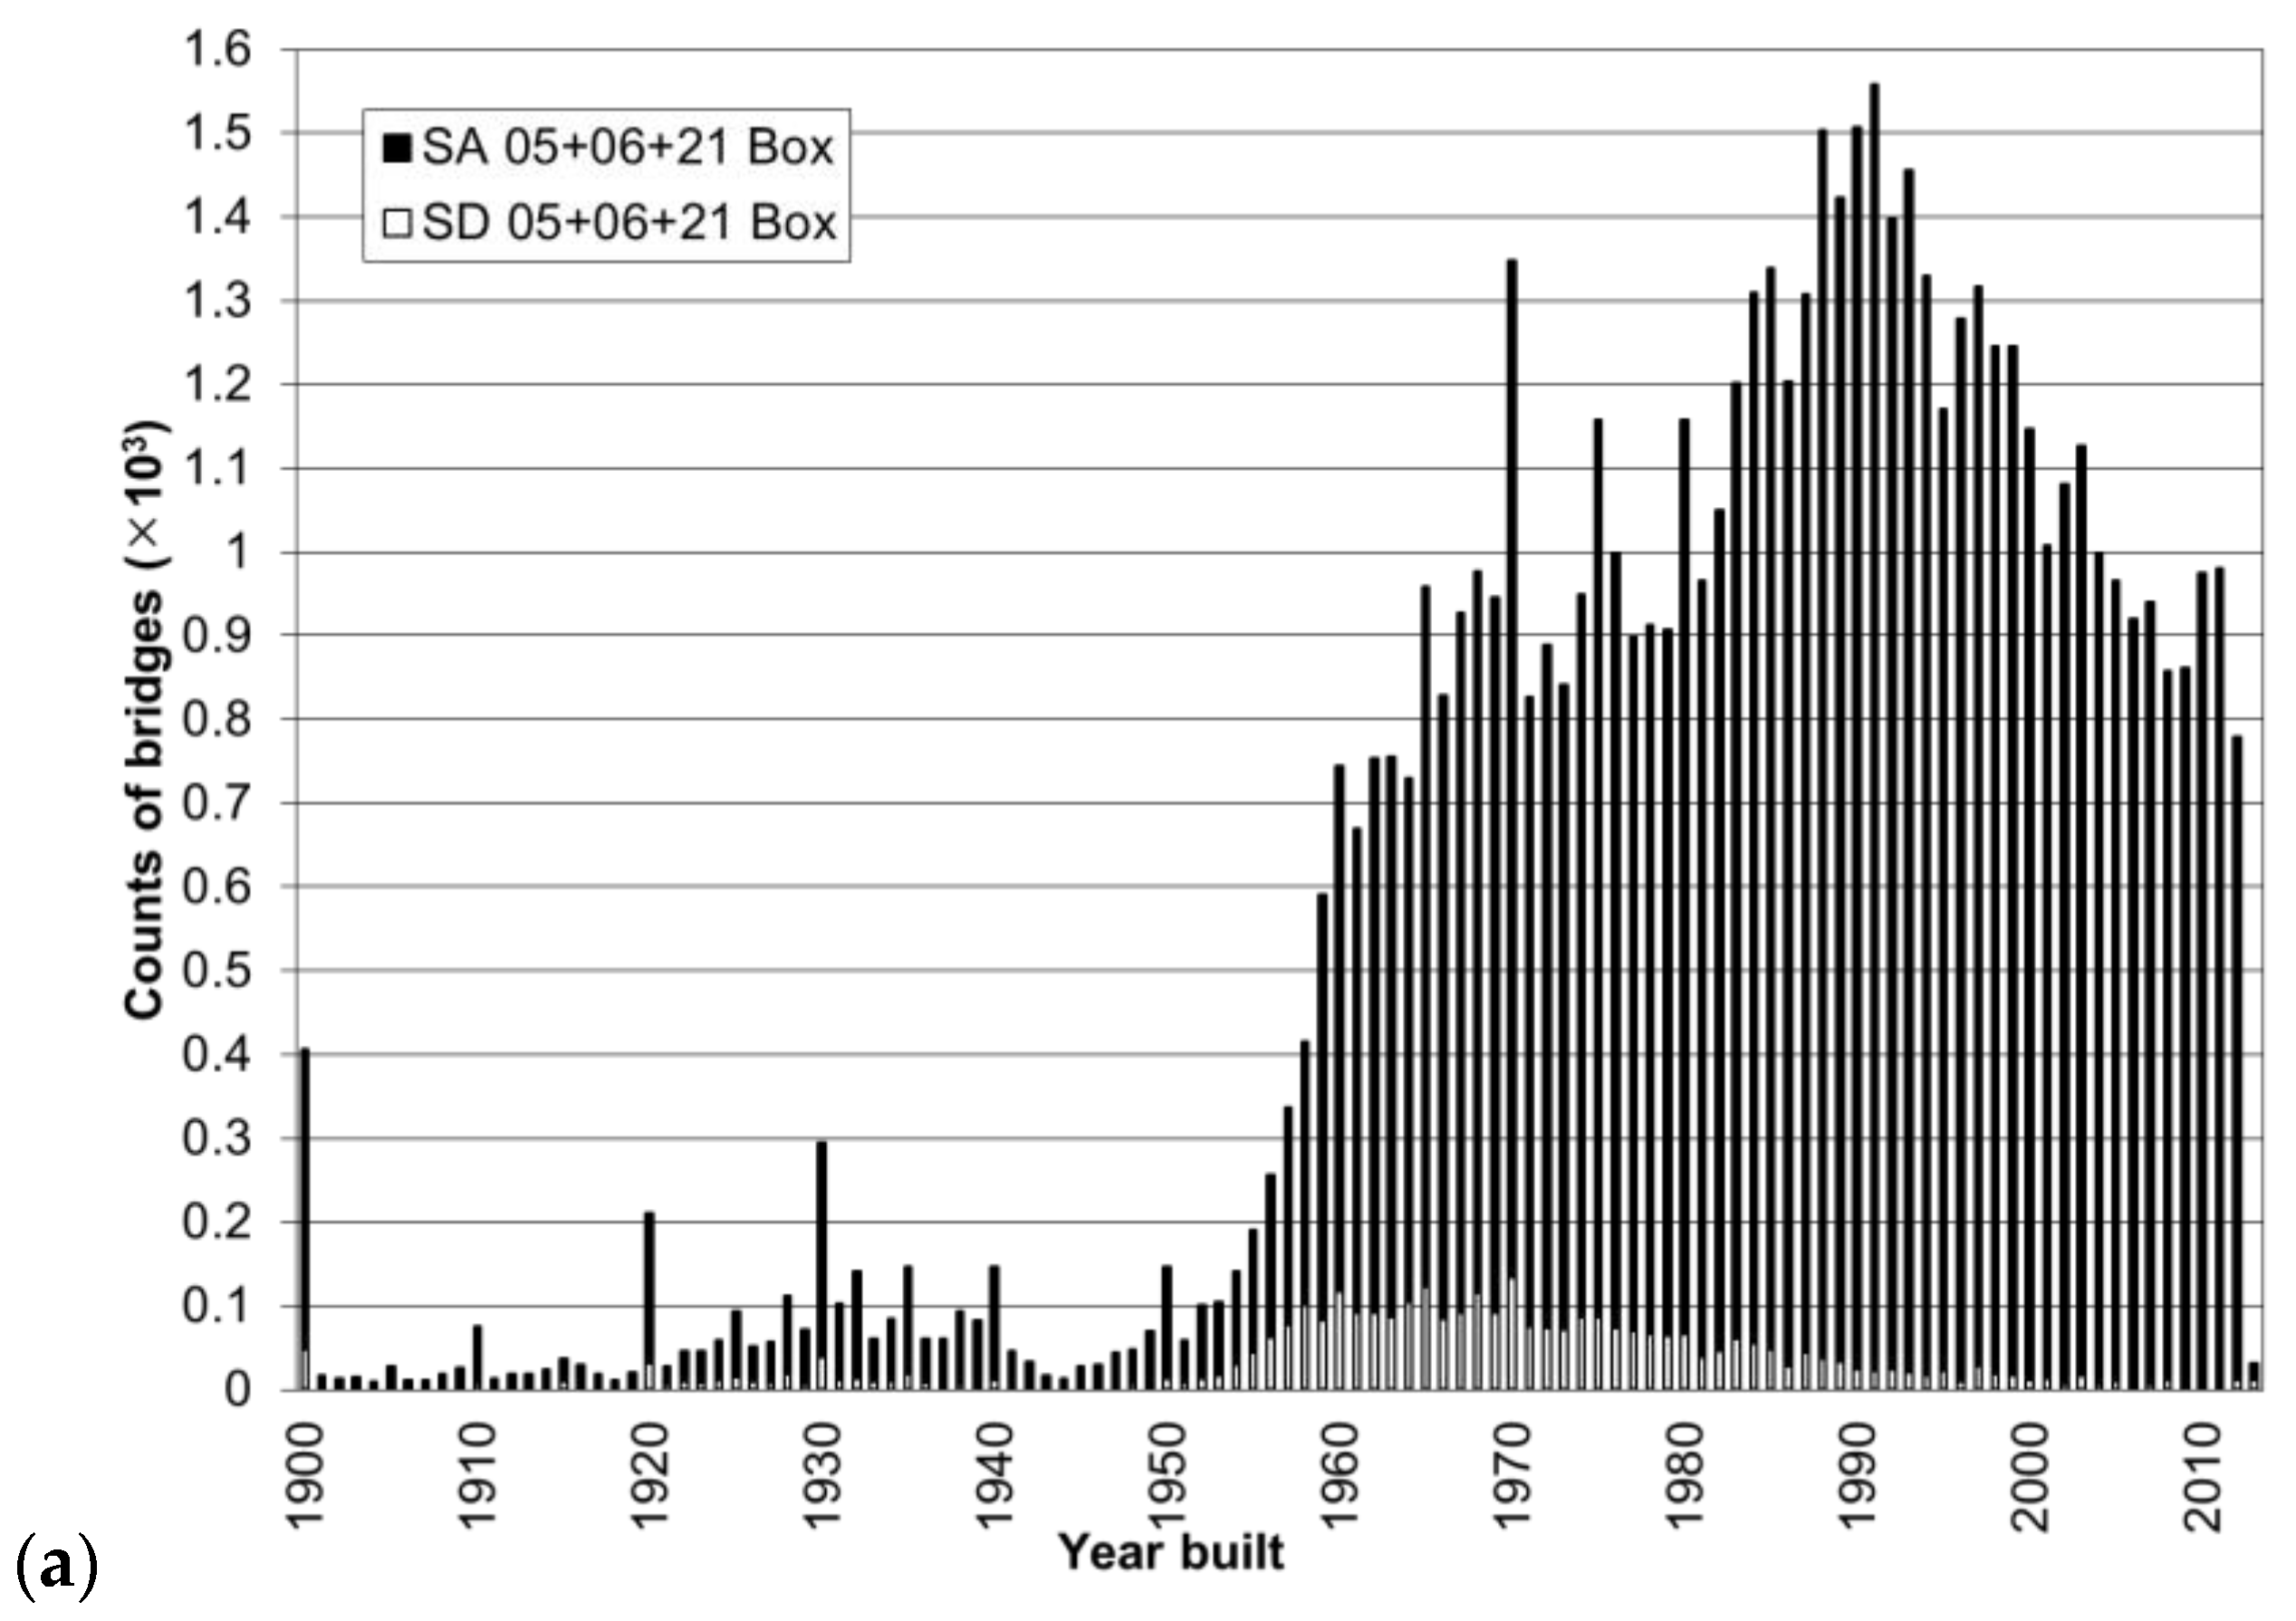
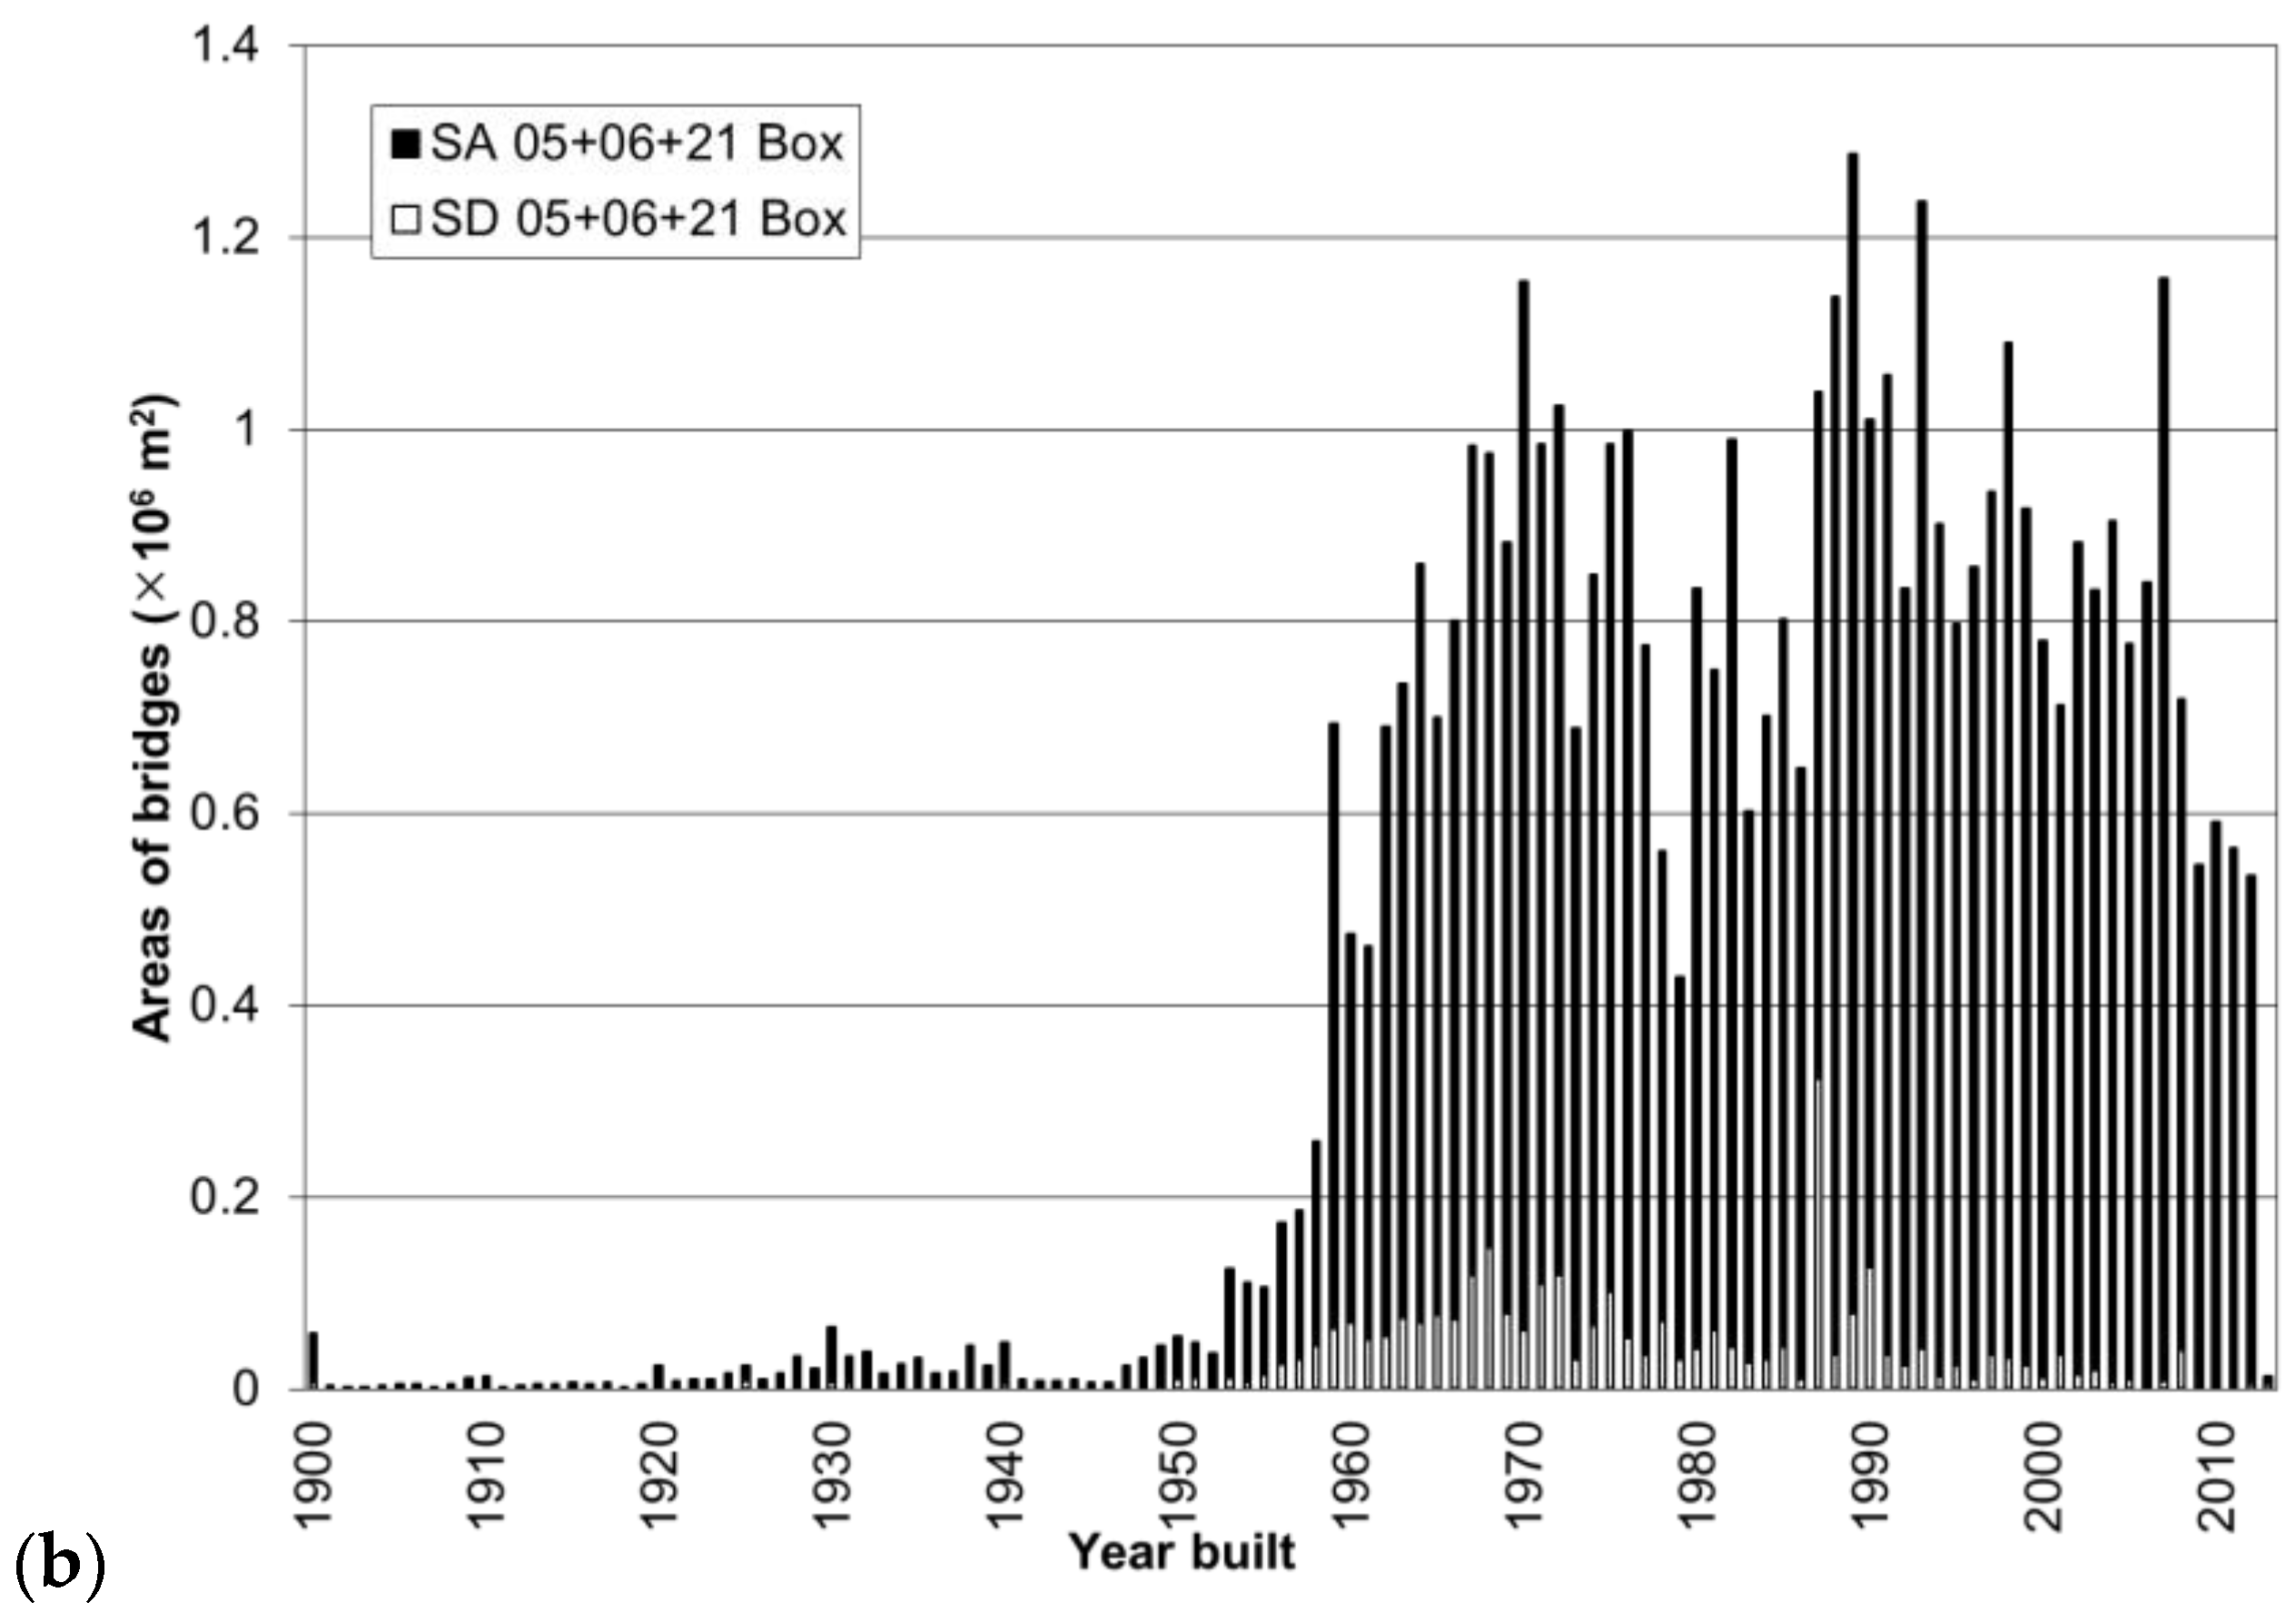
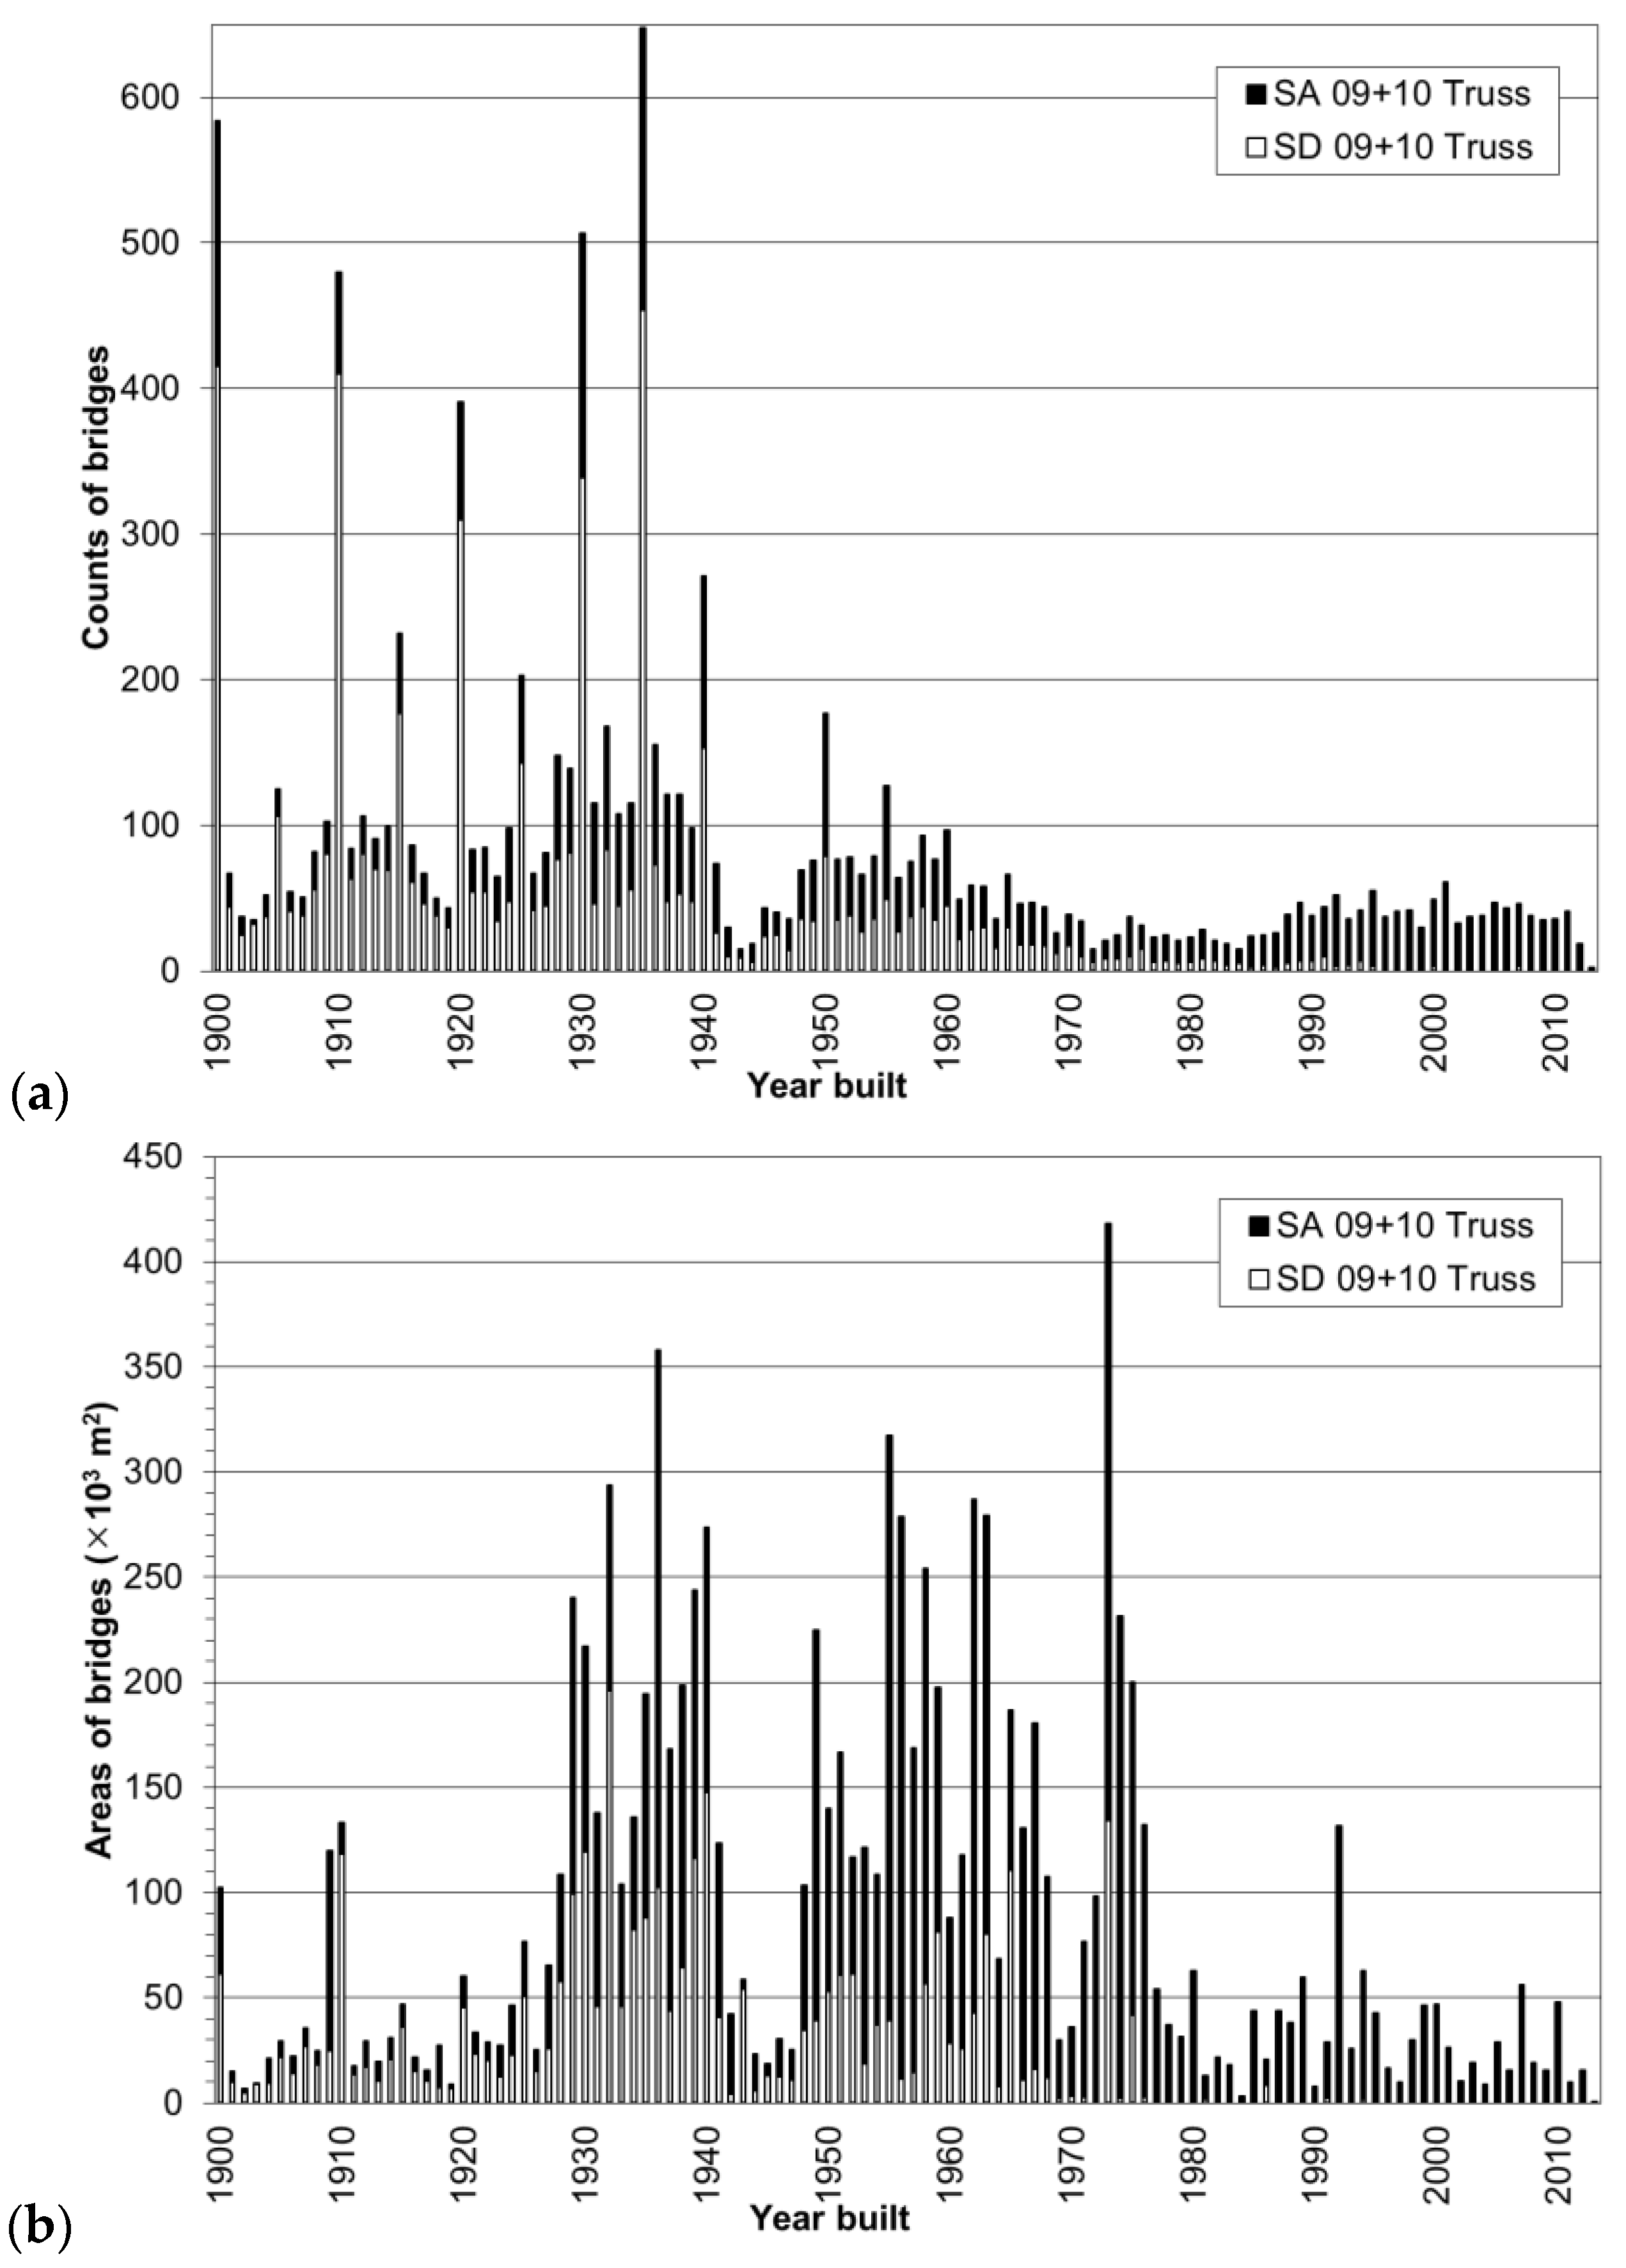
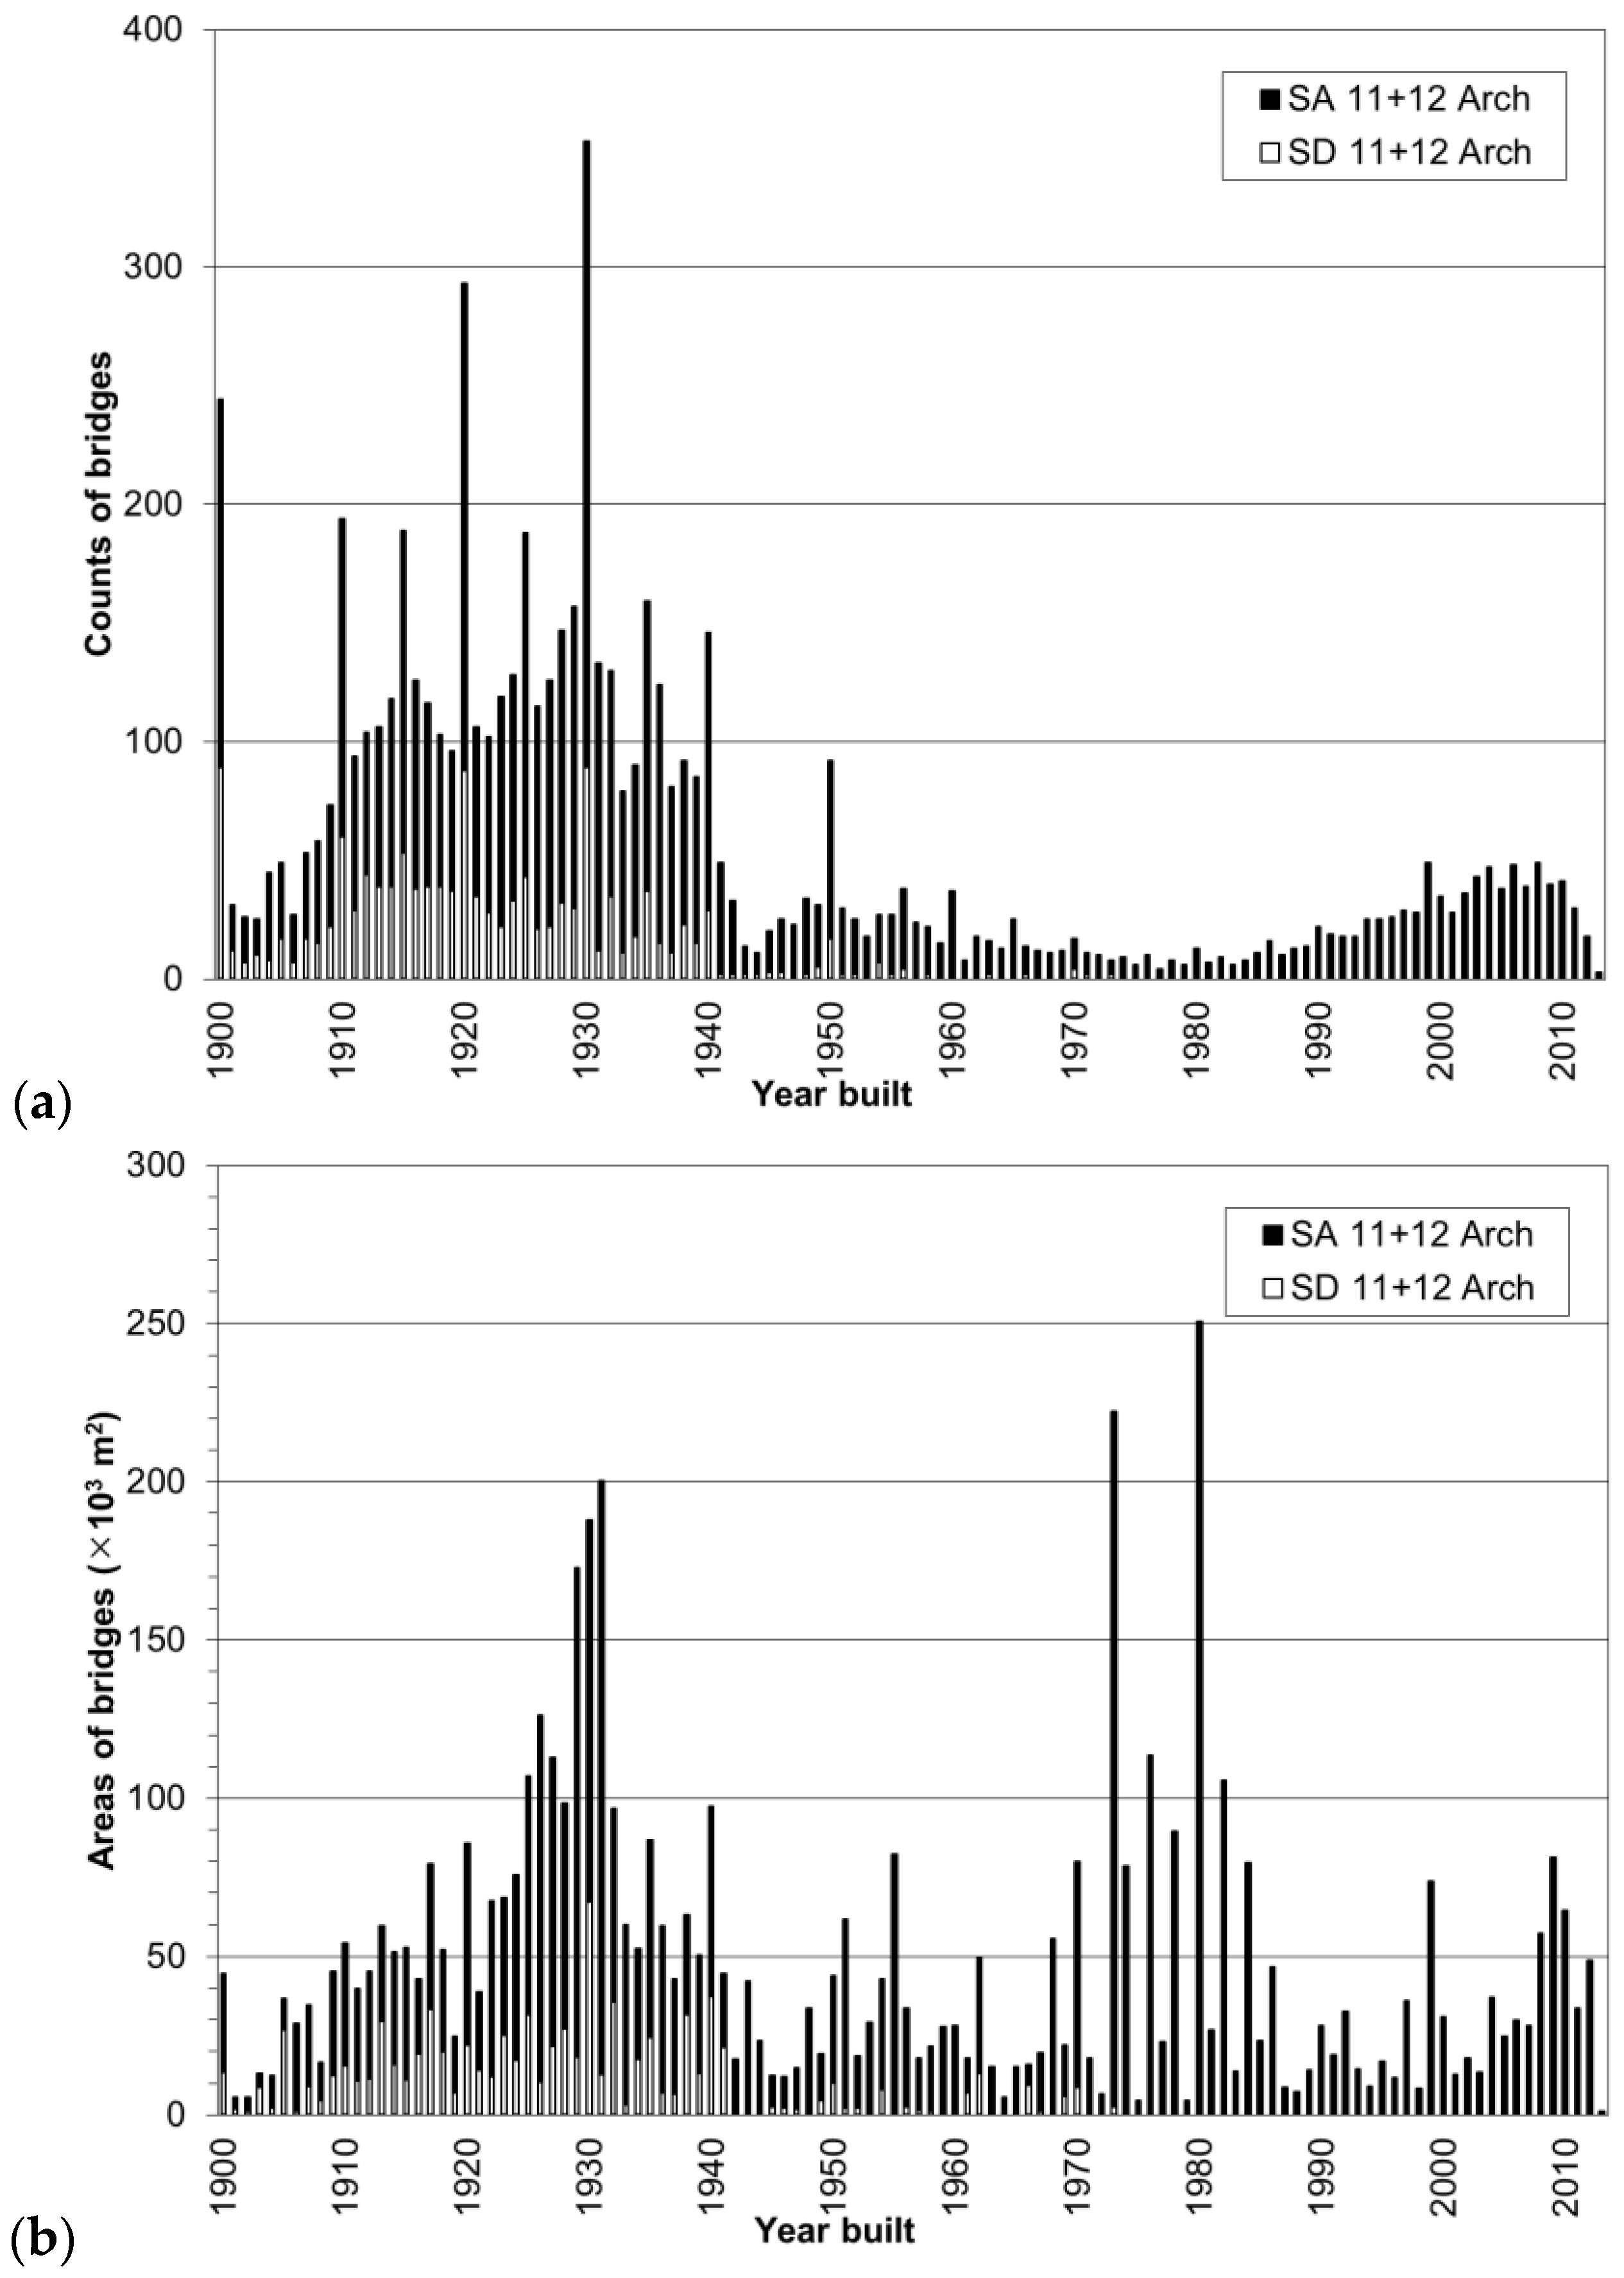
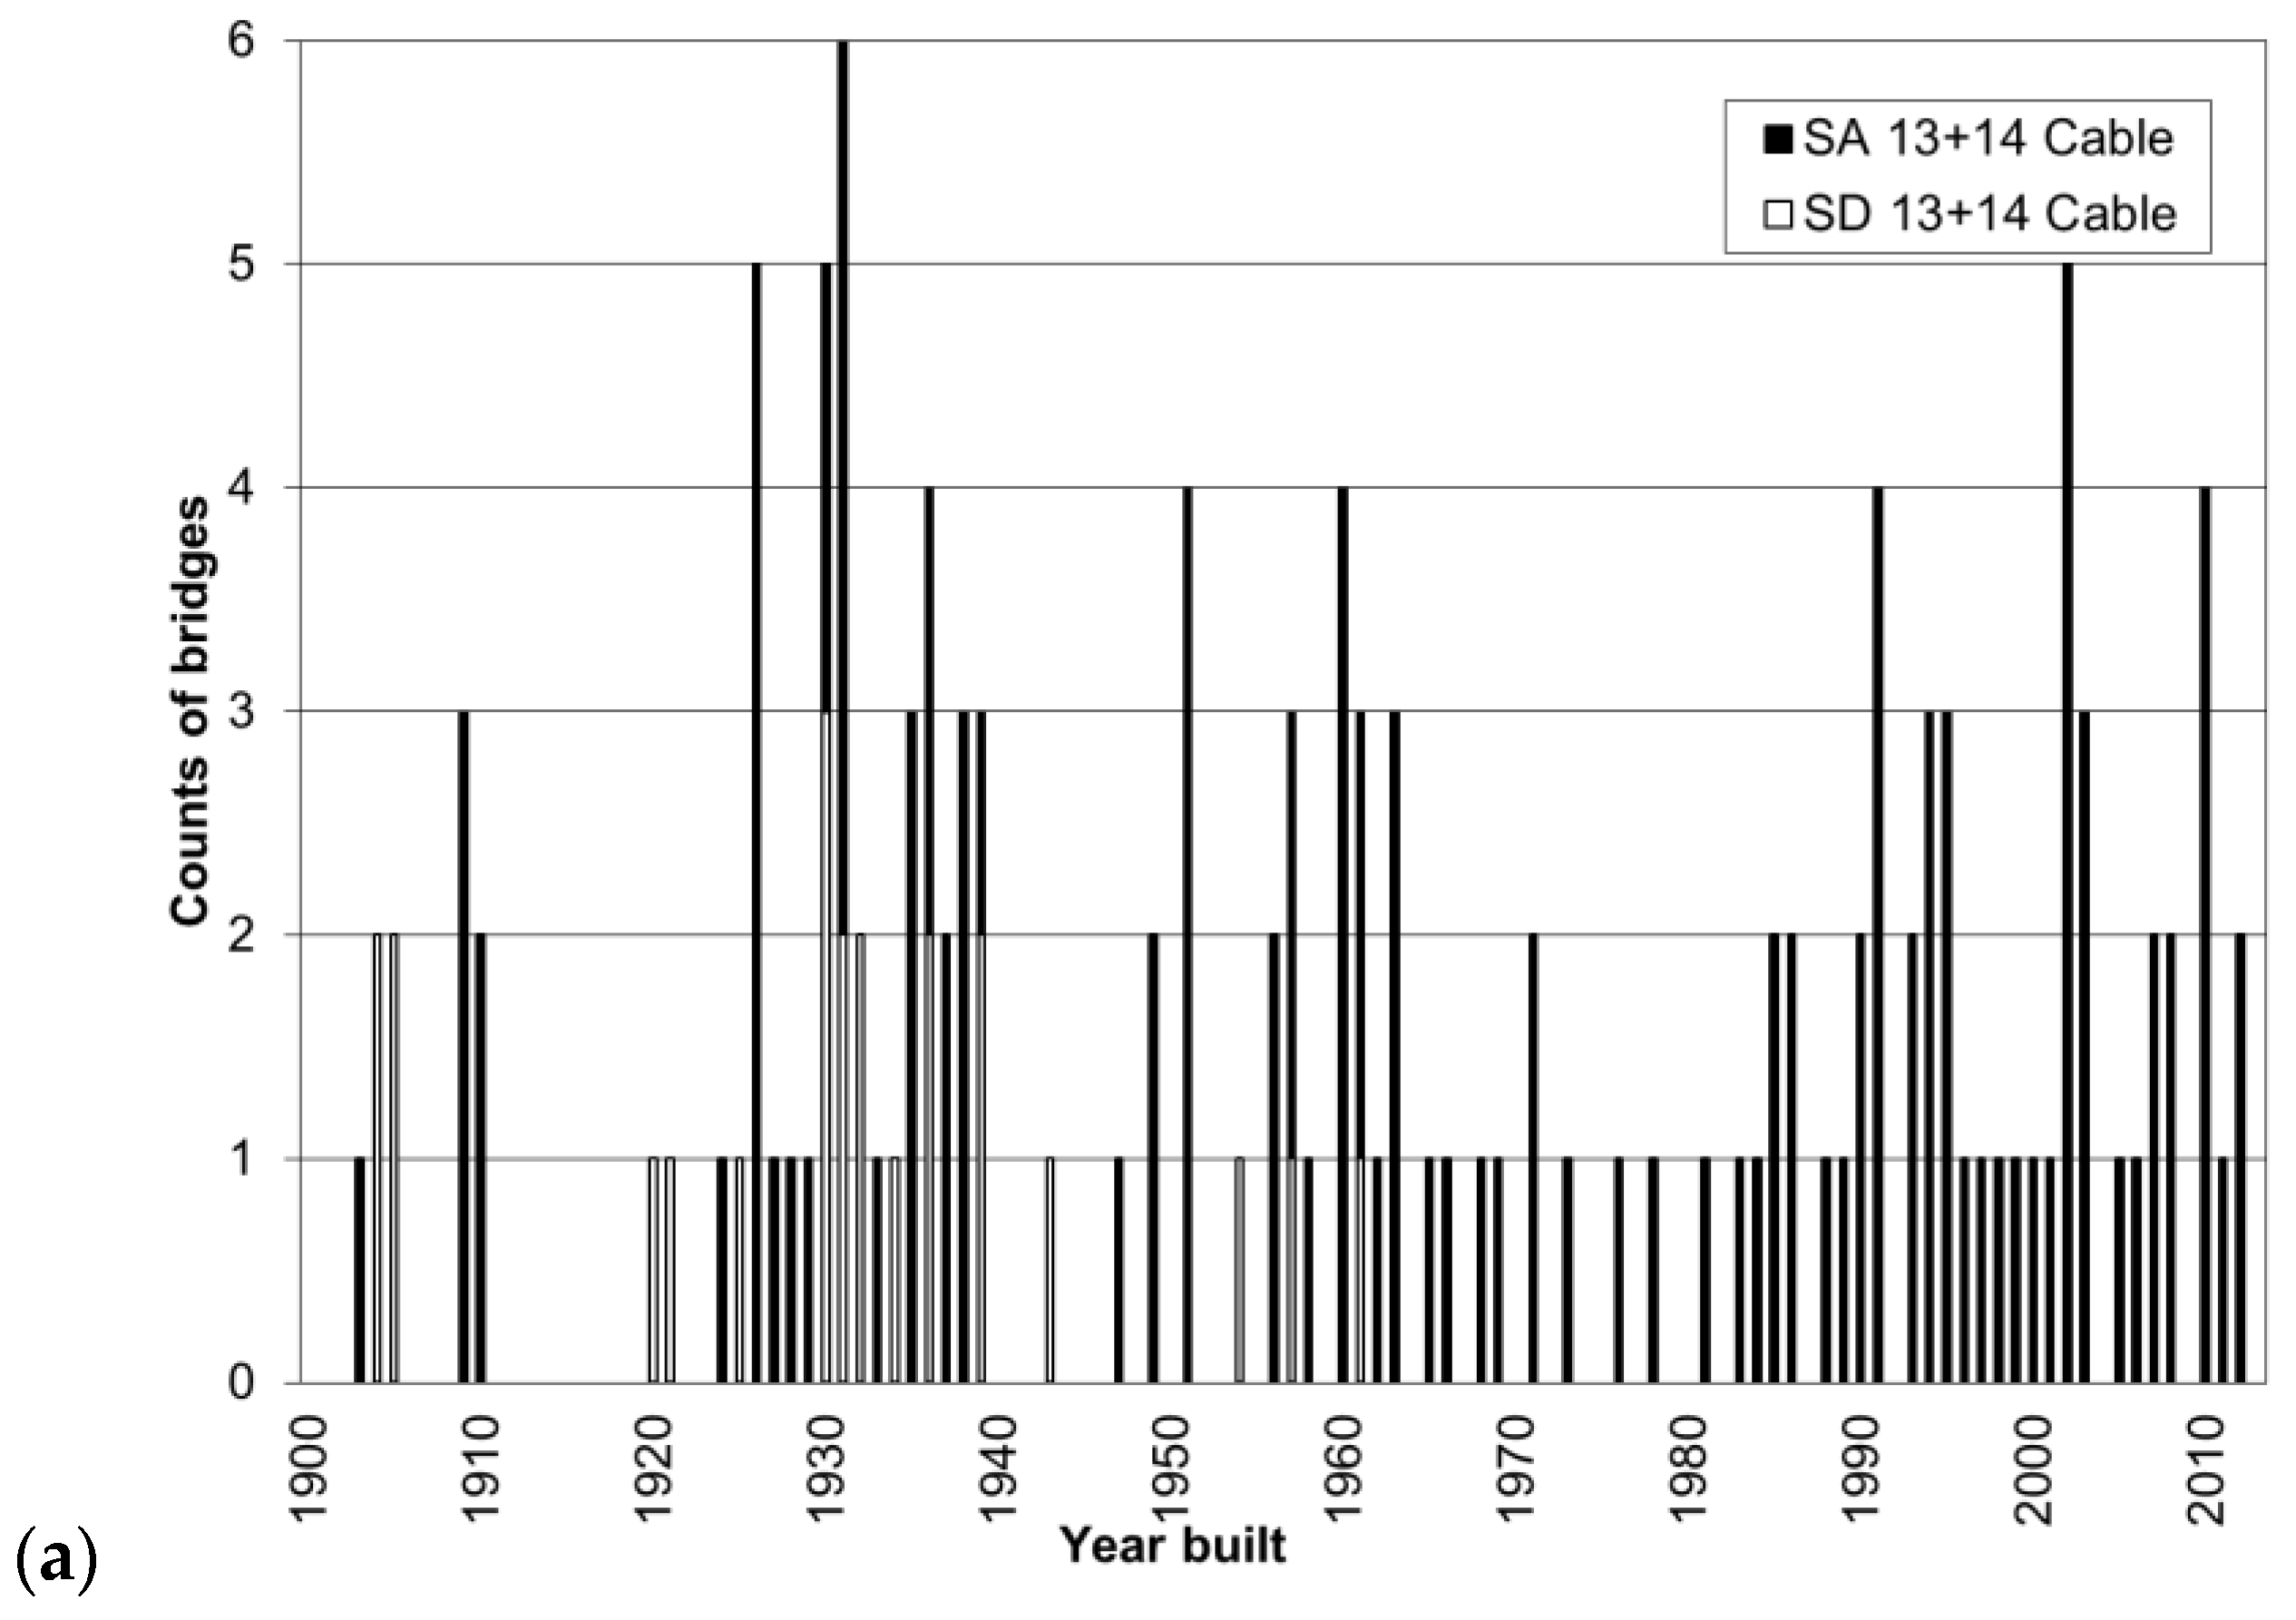
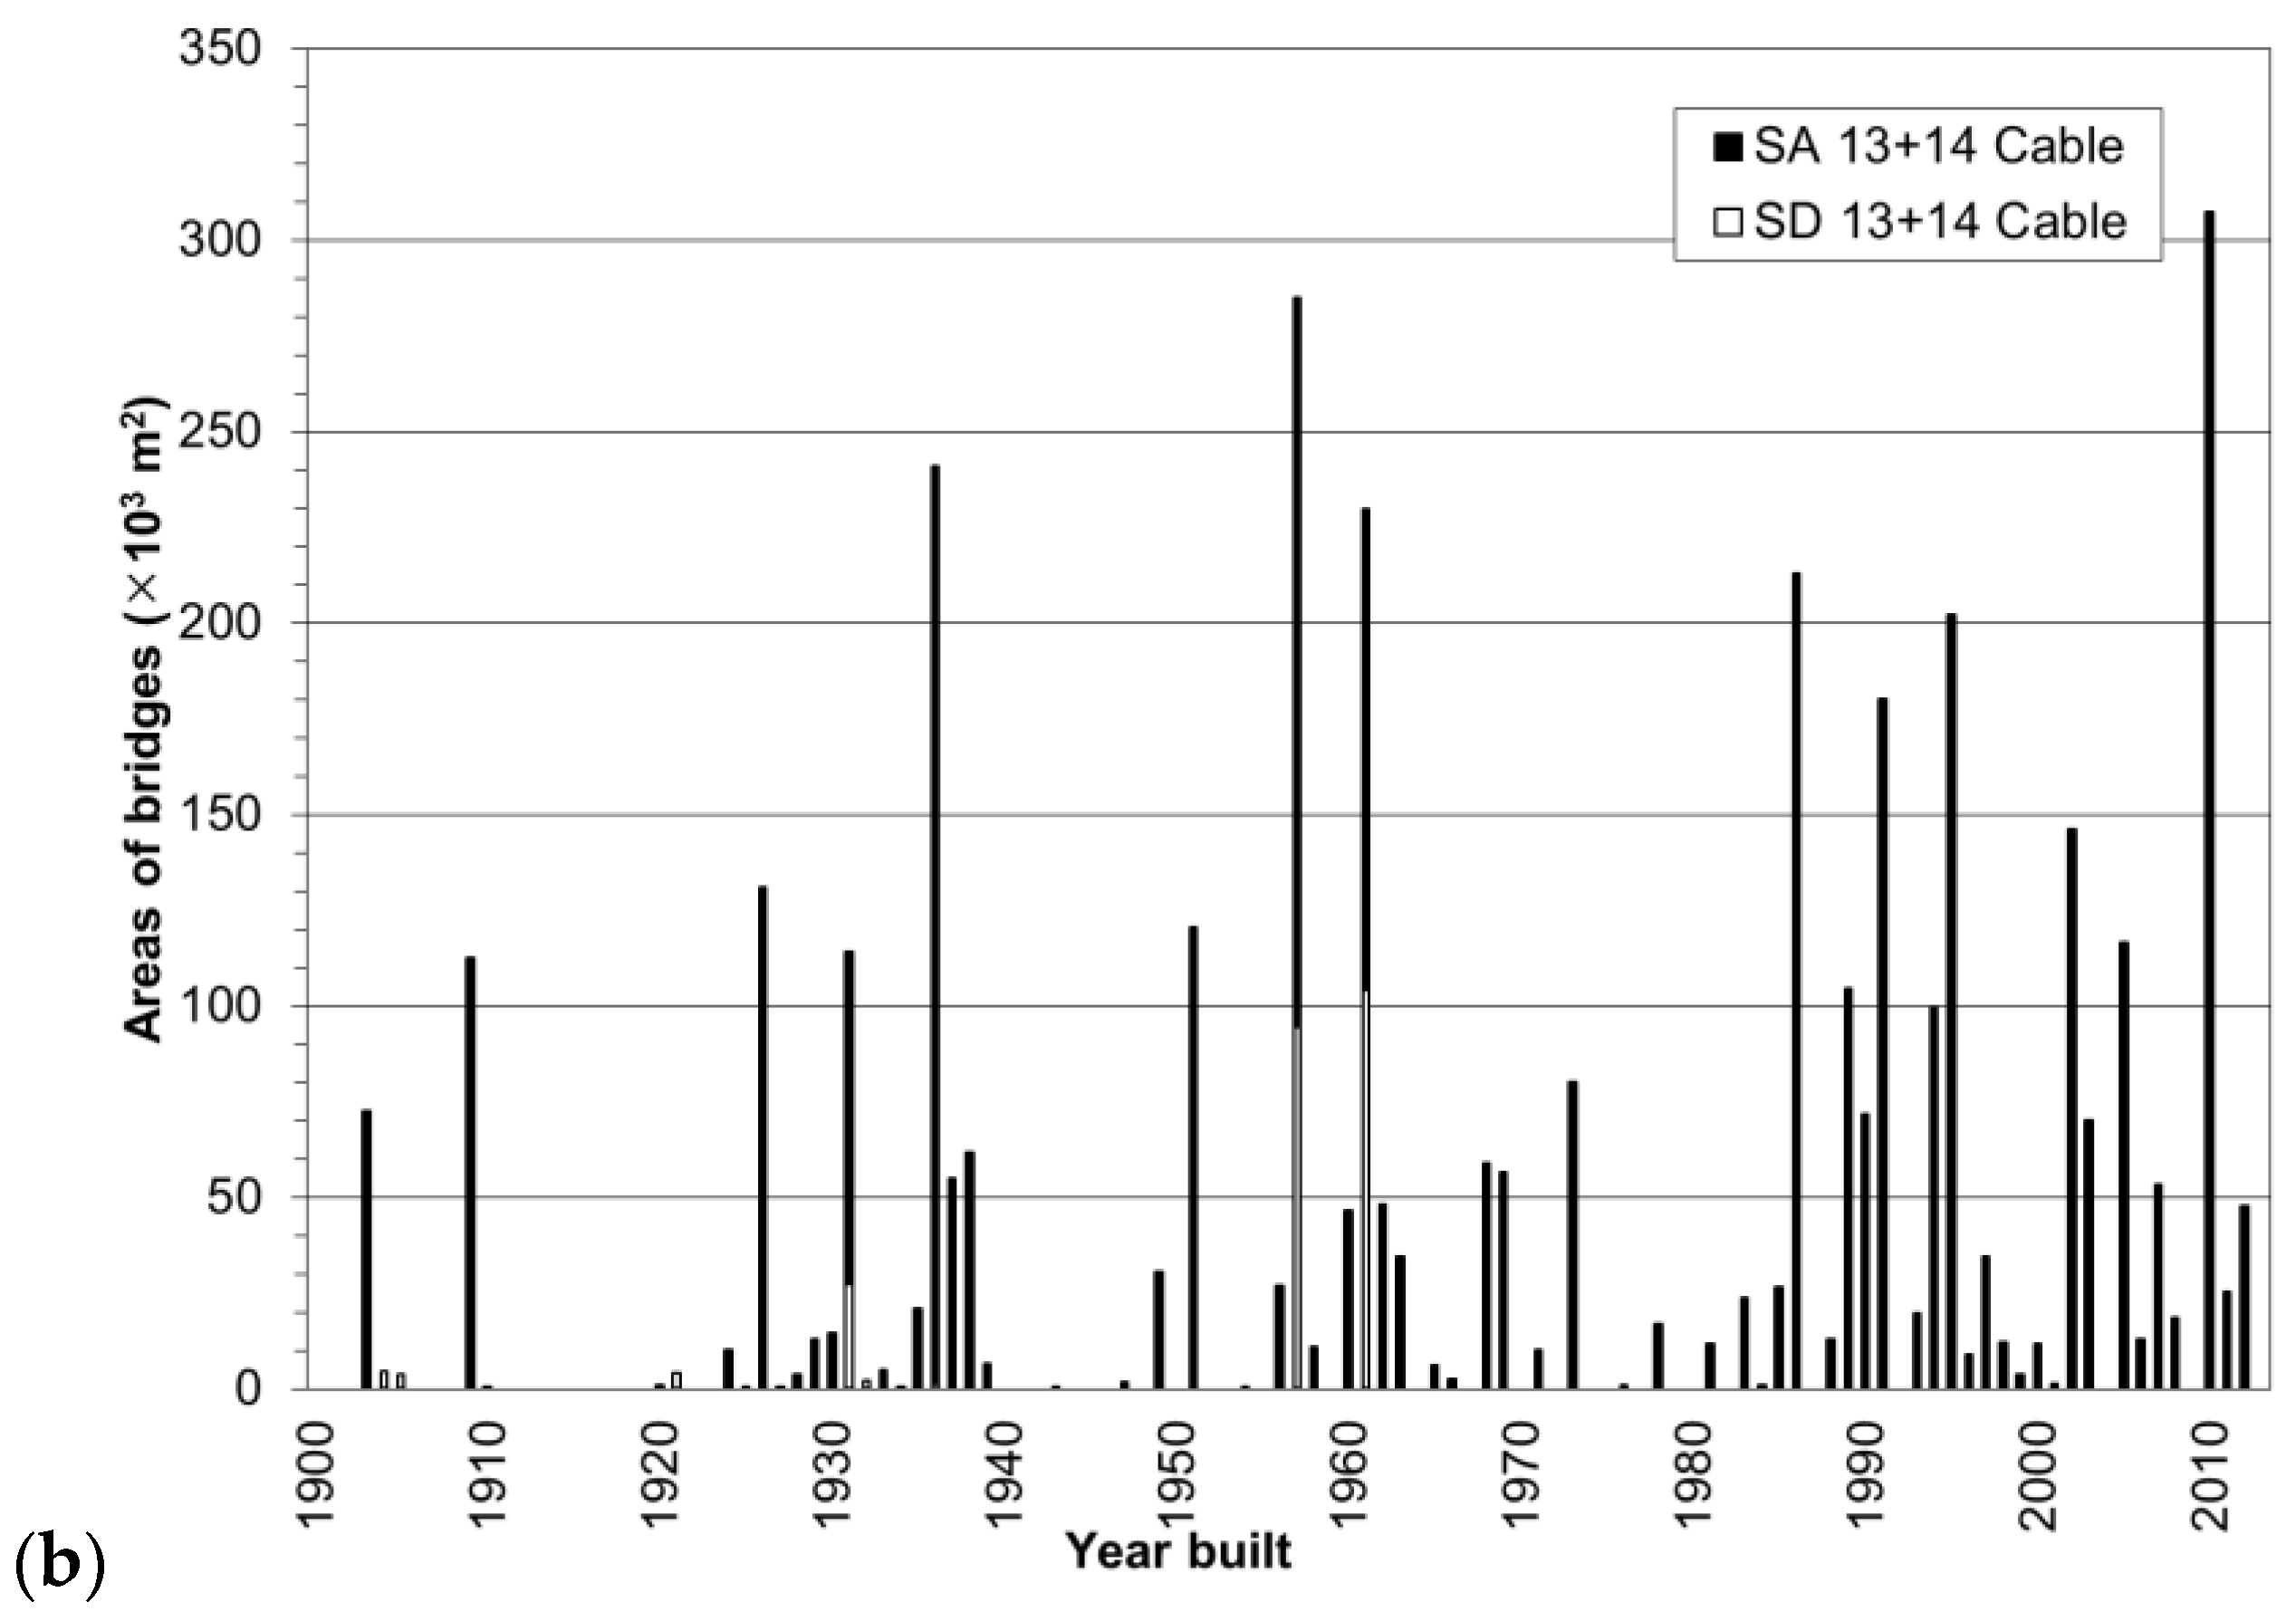
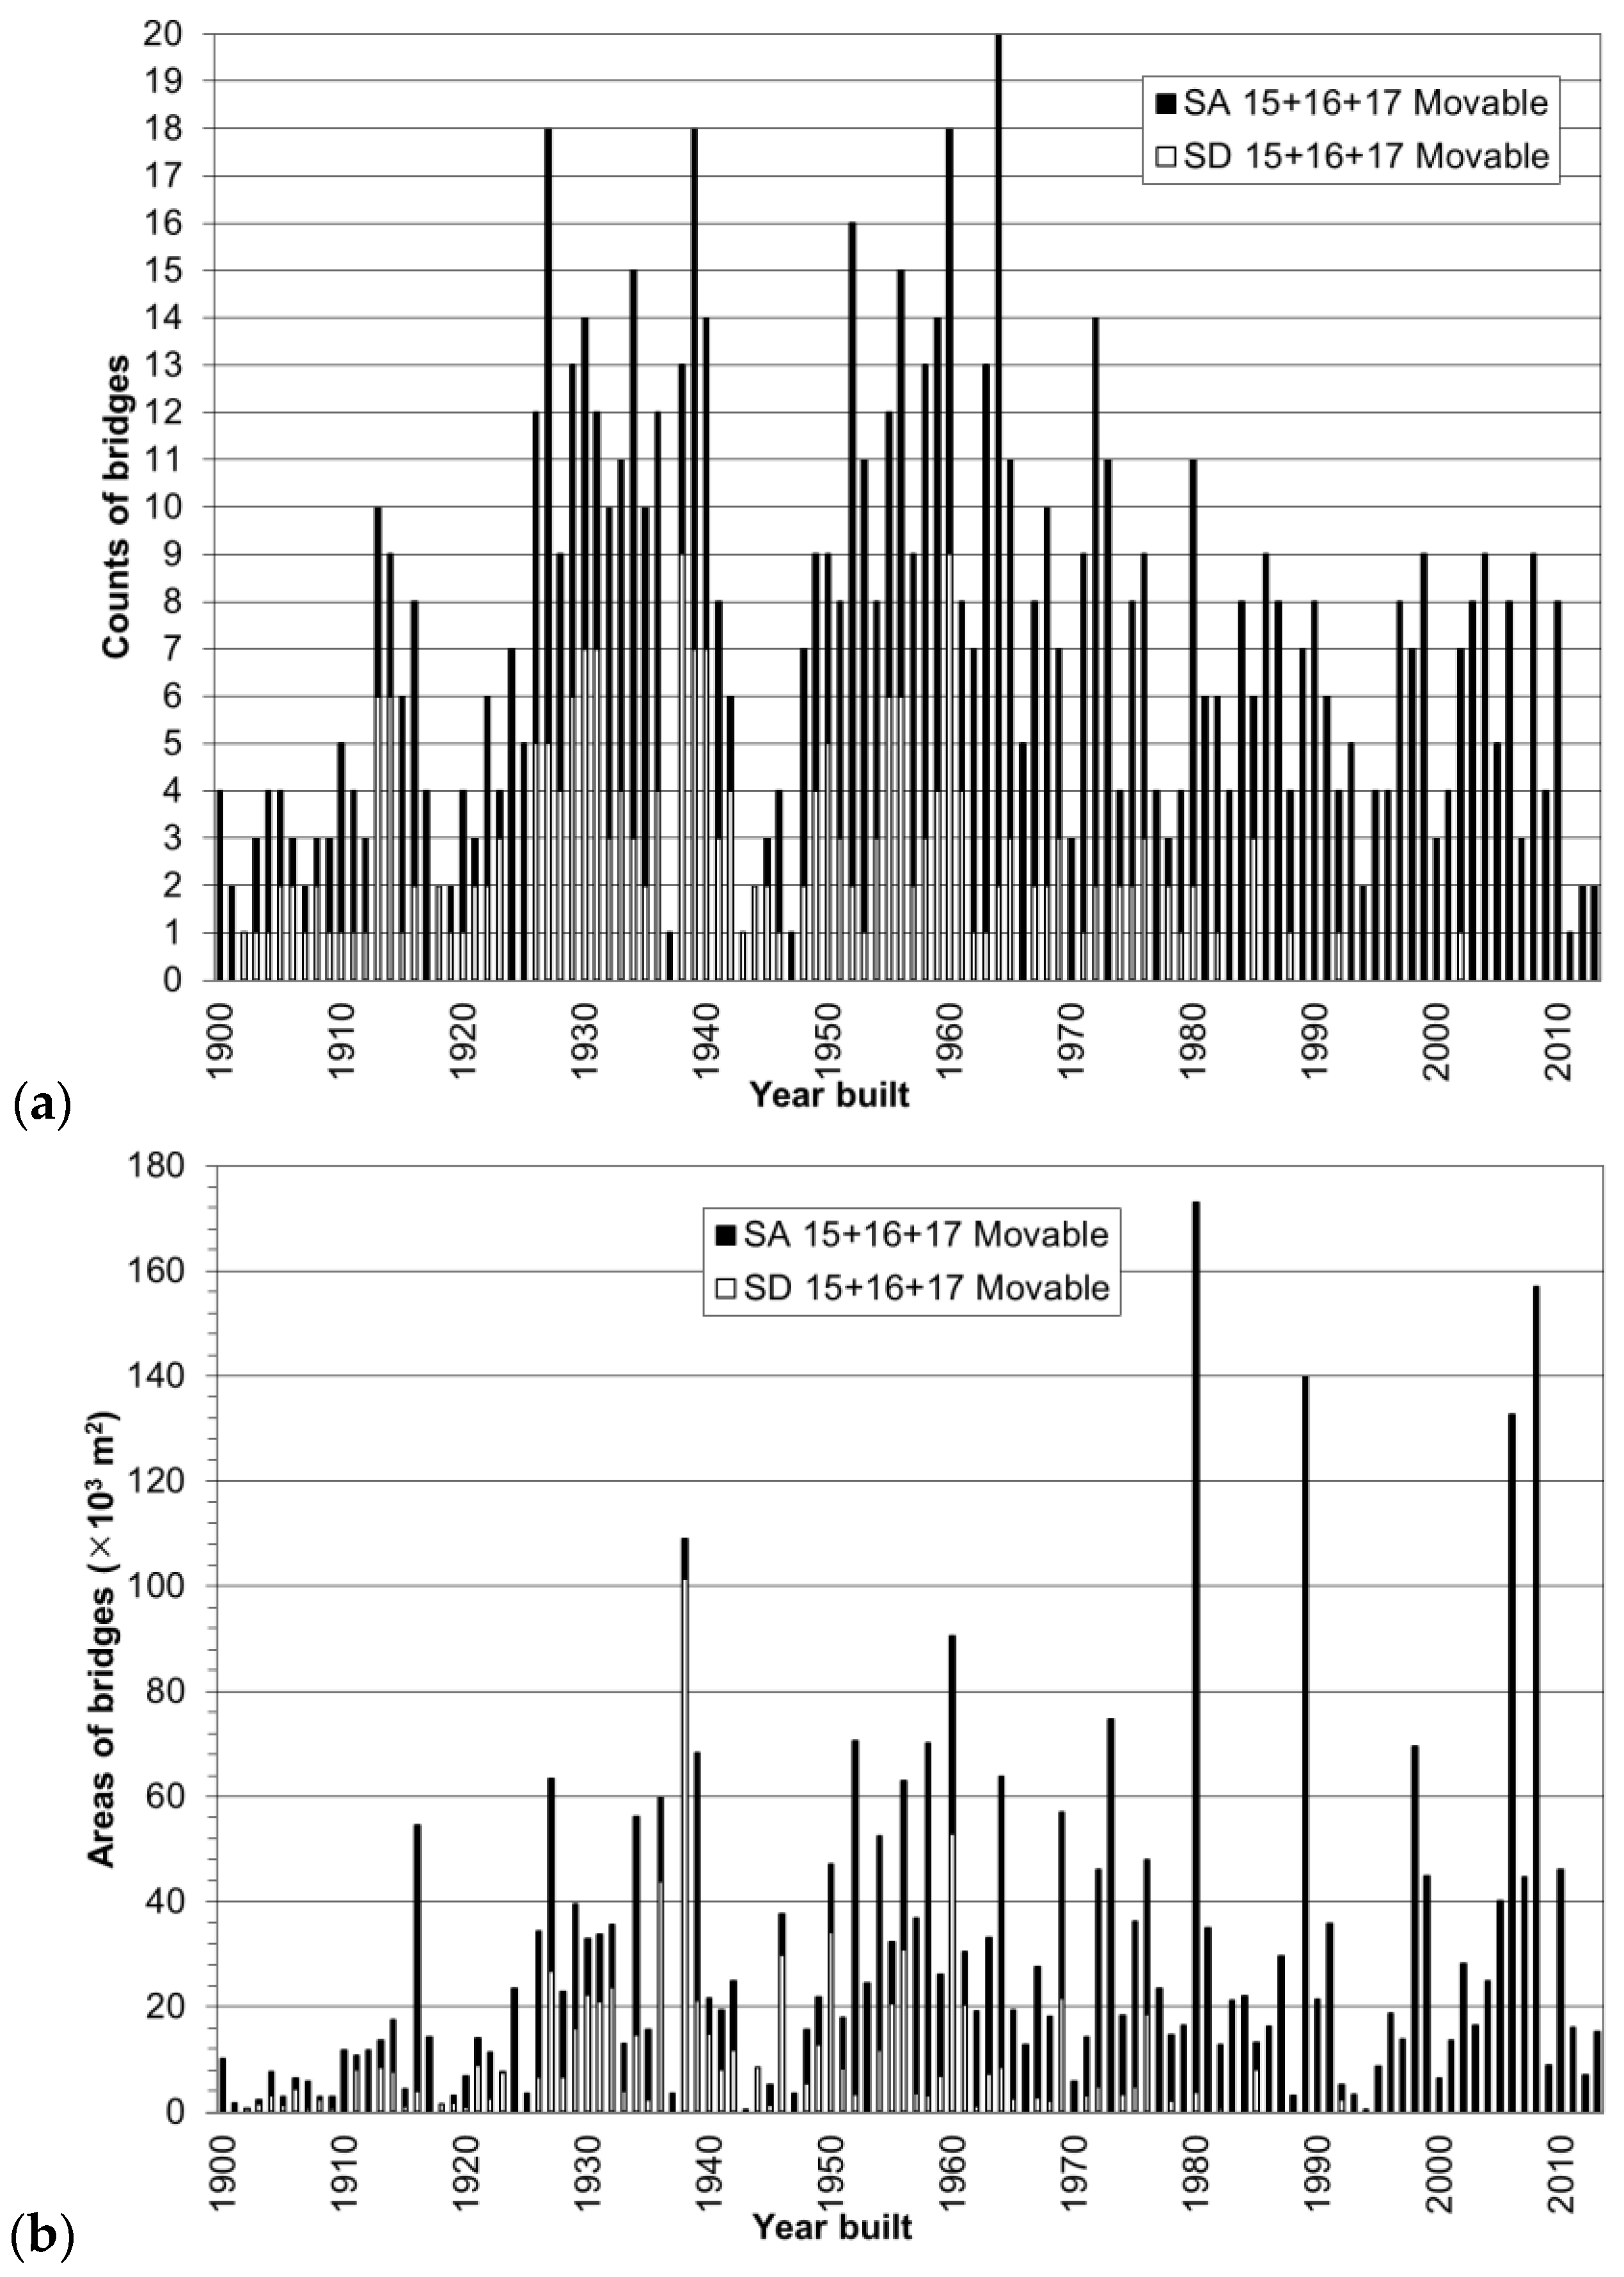
Figure 2, Figure 3, Figure 4, Figure 5, Figure 6 and Figure 7 show the SA and SD distributions of common bridge types versus year built by counts and areas. Related bridge types are combined into the following groups:
Figure 2: Stringer/multi beam or girder (type 02) and girder and floorbeam system (type 03) bridges.
Figure 3: Box beam or girders—multiple (type 05), box beam or girders—single or spread (type 06) and segmental box girder (type 21) bridges.
Figure 4: Truss—deck (type 09) and truss—thru (type 10) bridges.
Figure 5: Arch—deck (type 11) and arch—thru (type 12) bridges.
Figure 6: Suspension (type 13) and stayed girder (type 14) bridges.
Figure 7: Movable—lift (type 15), movable—bascule (type 16) and movable—swing (type 17) bridges.
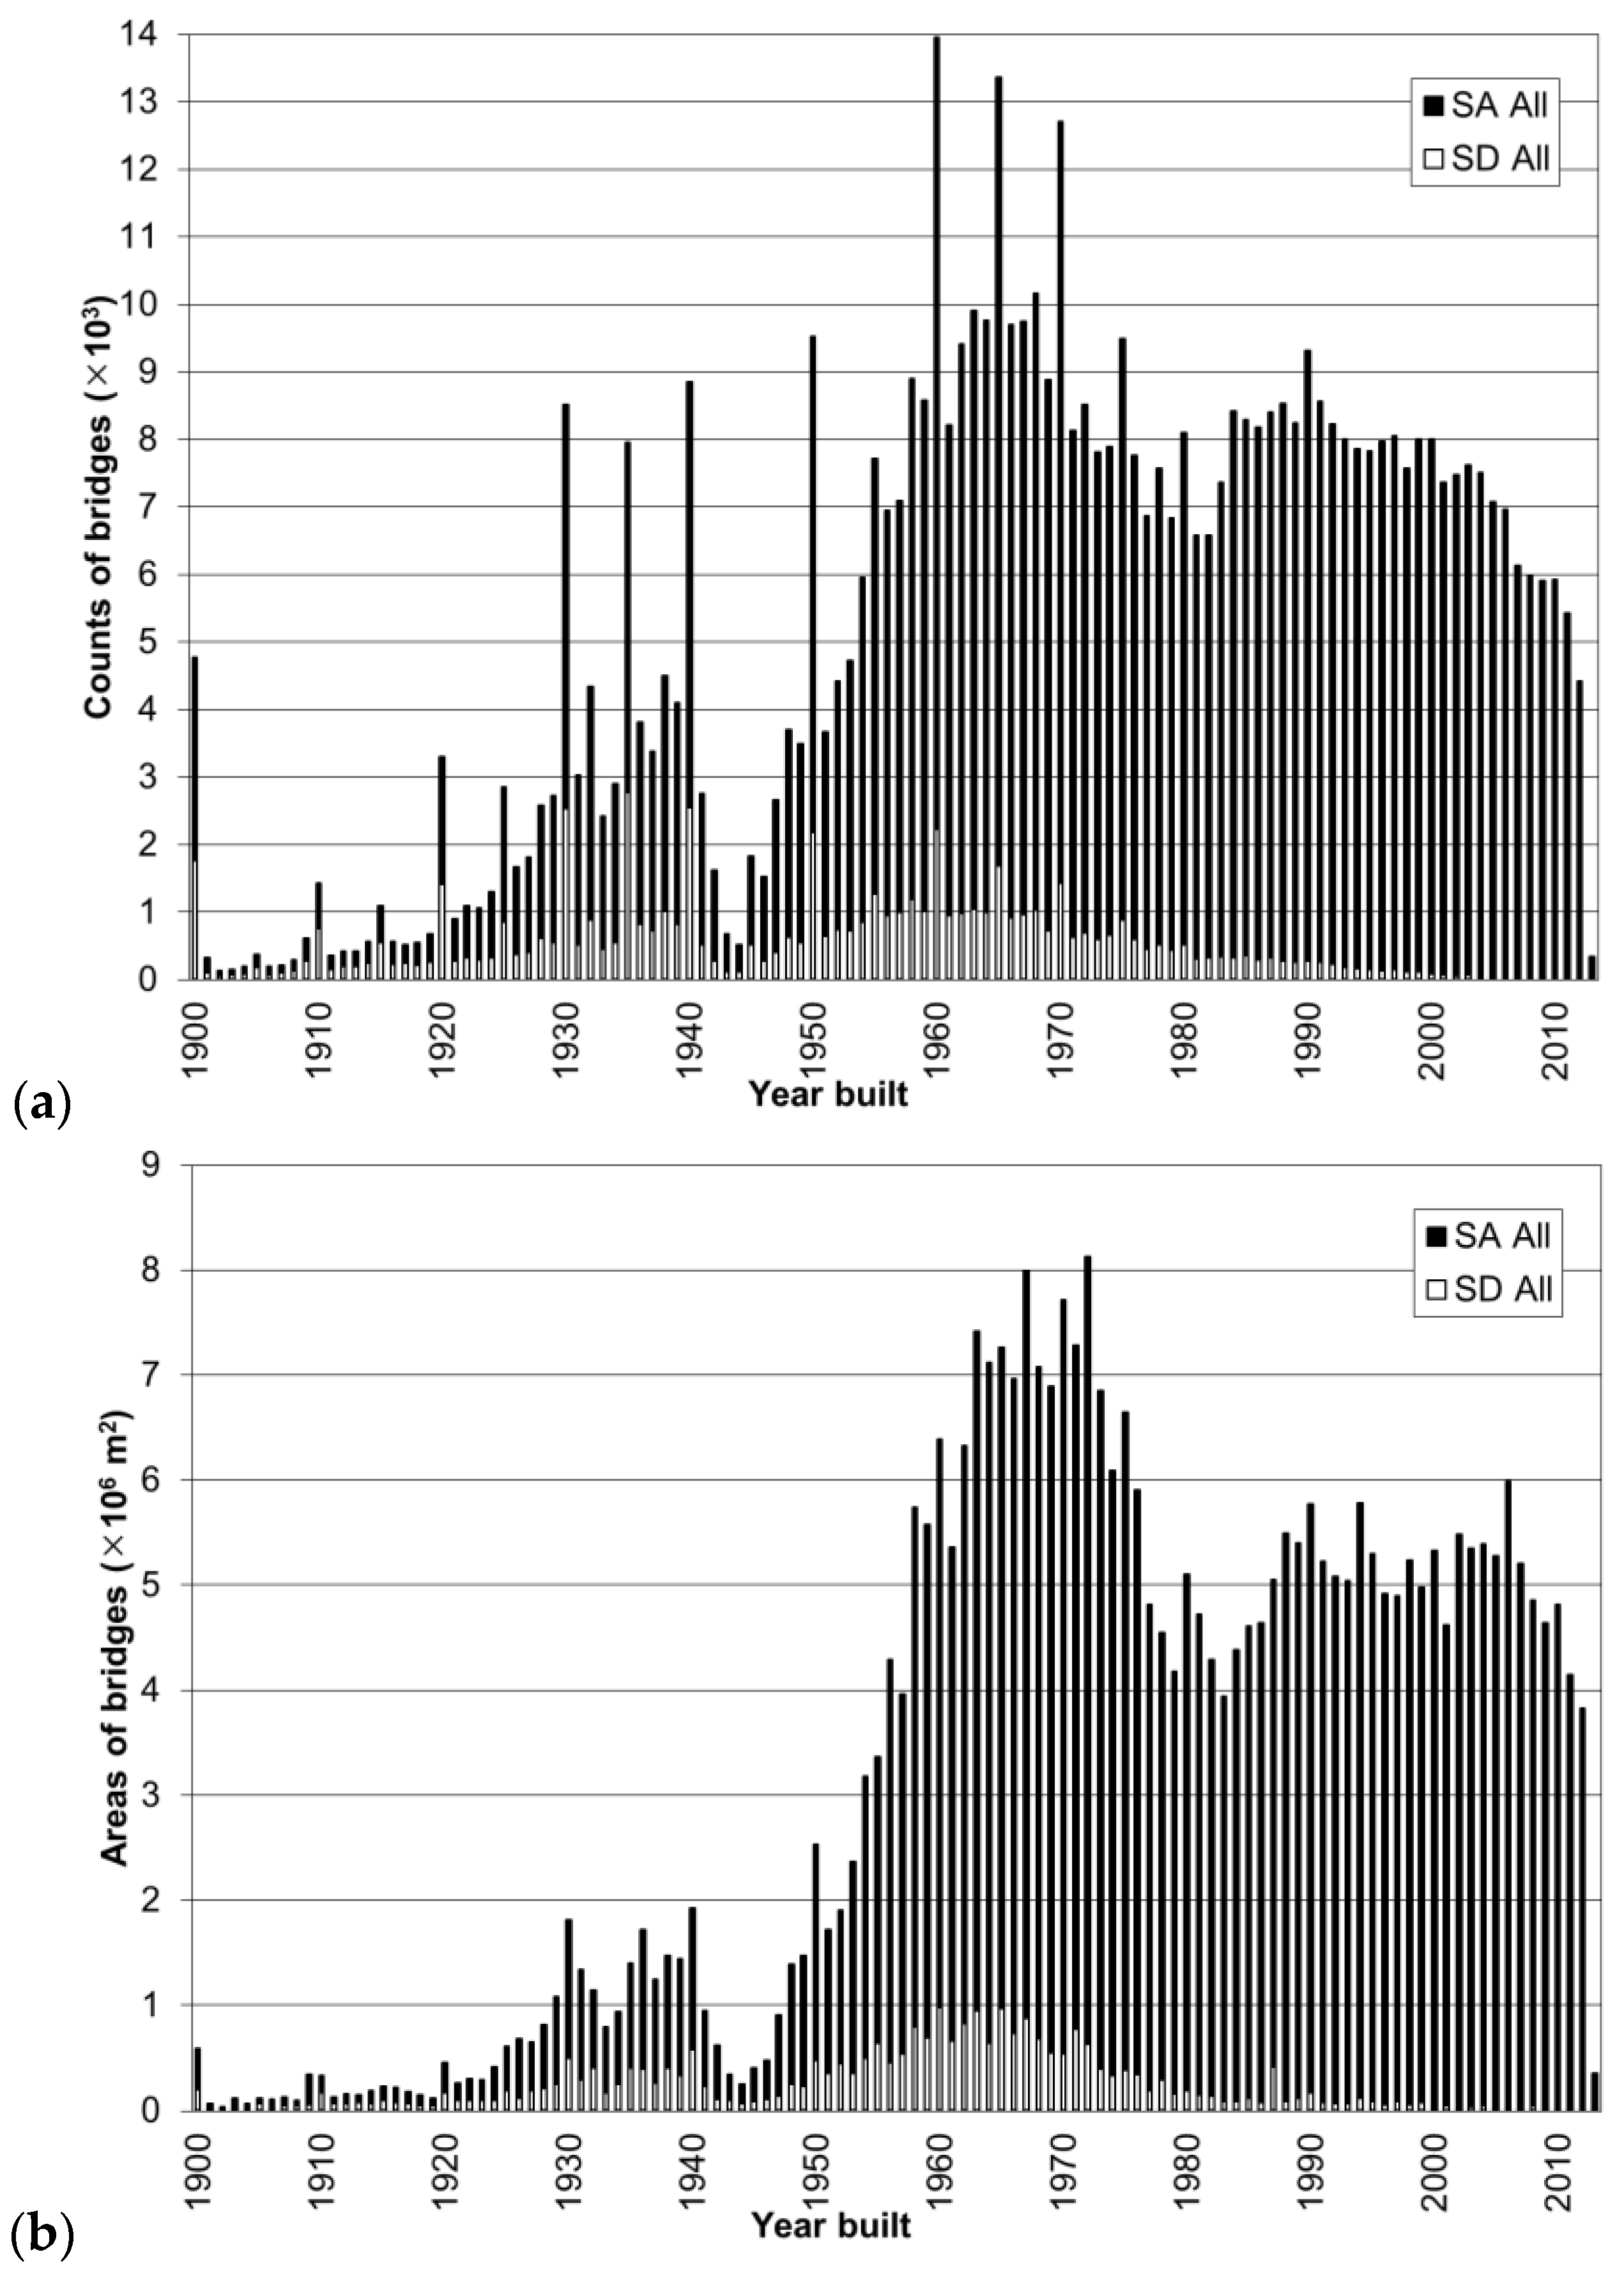
Observation of the location of the peaks along the time scale and their changing intensities provides comparison of bridge type groups. The separation into SA and SD bridges shows the ratio of accumulation of structural deficiency over time, as bridges get older. This also helps to identify the years of critically higher structural deficiency that require further investigation of potential issues. Figure 8 summarizes the distribution of all bridge types.
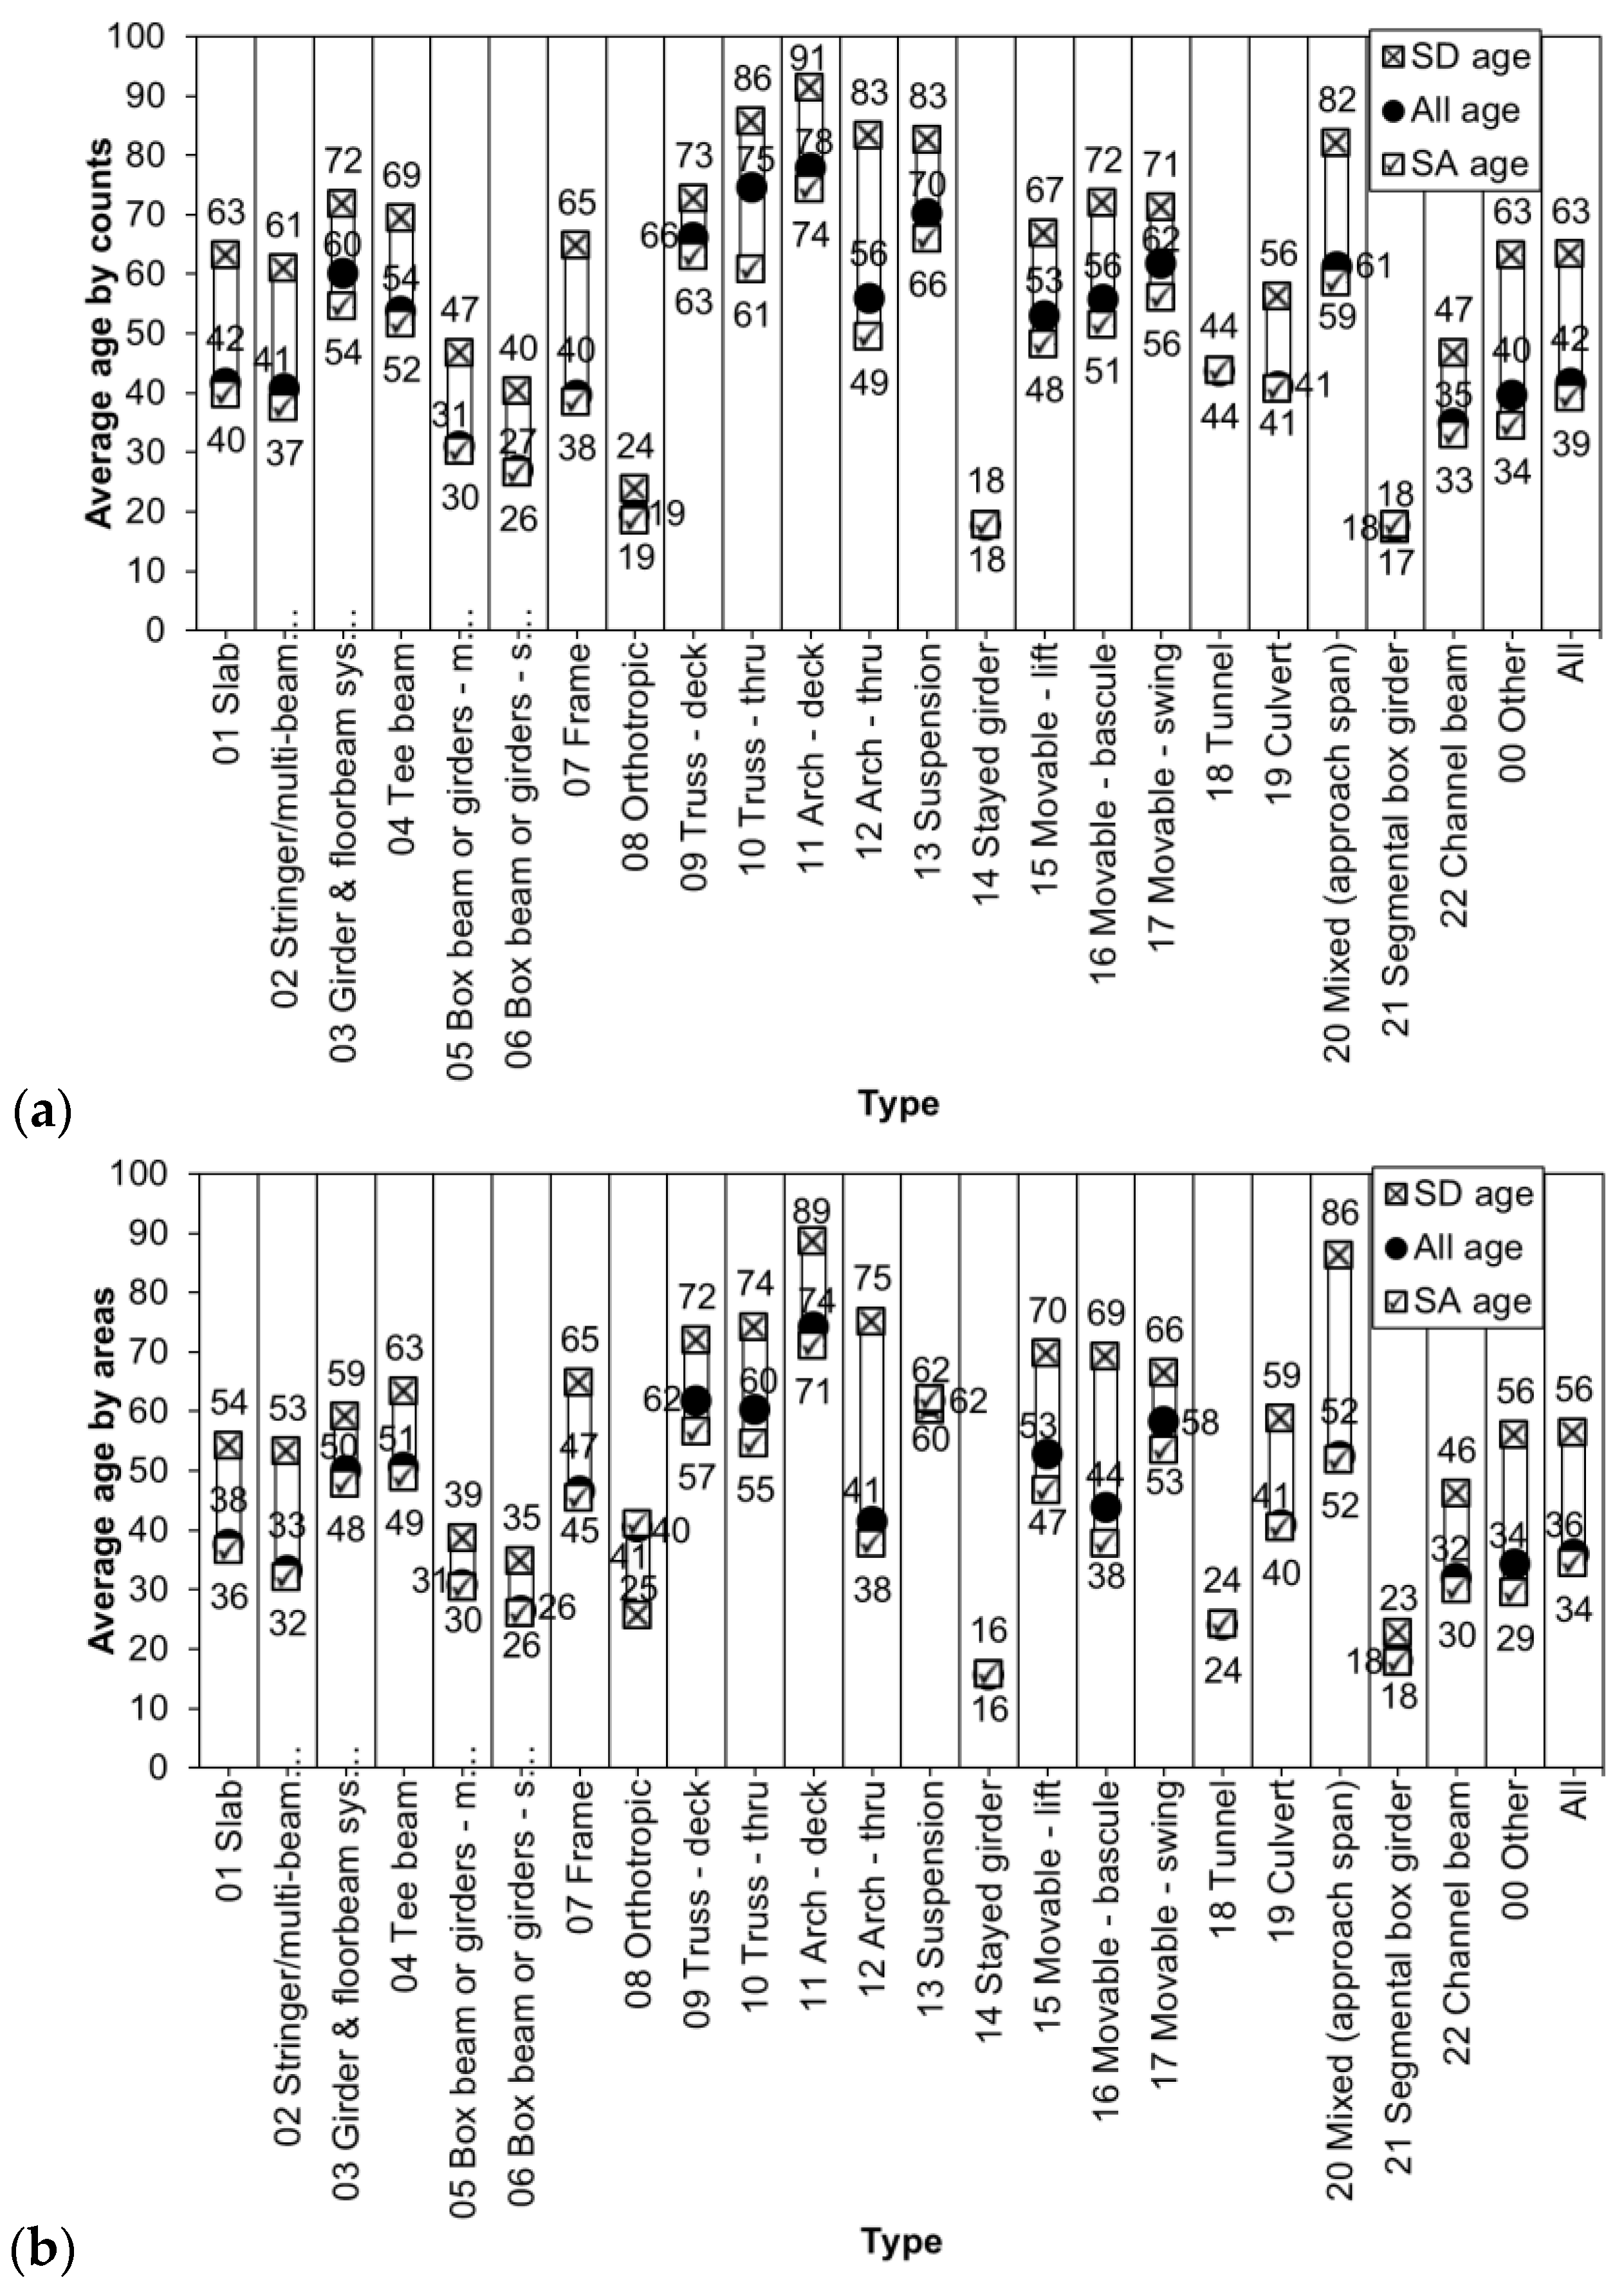
To enable analysis of average service life cycle dependability of bridge types, Figure 9 summarizes the average ages of all, SA and SD bridges by counts and areas. The average SD age of all bridges is 63 years by counts and 56 years by areas, which are lower than the official objective of service life cycle of 75 years for uninterrupted service life before structural deficiency [38,39]. The average SD age of the most common stringer/multi beam or girder (type 02) bridges is even lower, 61 years by counts and only 53 years by areas. By areas, arch—deck (type 11) bridges have the highest SD age of 89 (Figure 9b). It is important to note that stayed girder (type 14) bridges and tunnels (type 18) do not have recorded SD bridges and thus do not have SD age. The up-down bar spans between the SD, all and SA ages offer relative indications of operational service life [36]. It can be observed that by areas (Figure 9b) orthotropic (type 08) bridges have an SD age lower than the average and SA ages, requiring further examination of the etiology. Interestingly, this is not observable by counts (Figure 9a).
4. Deterioration Trends
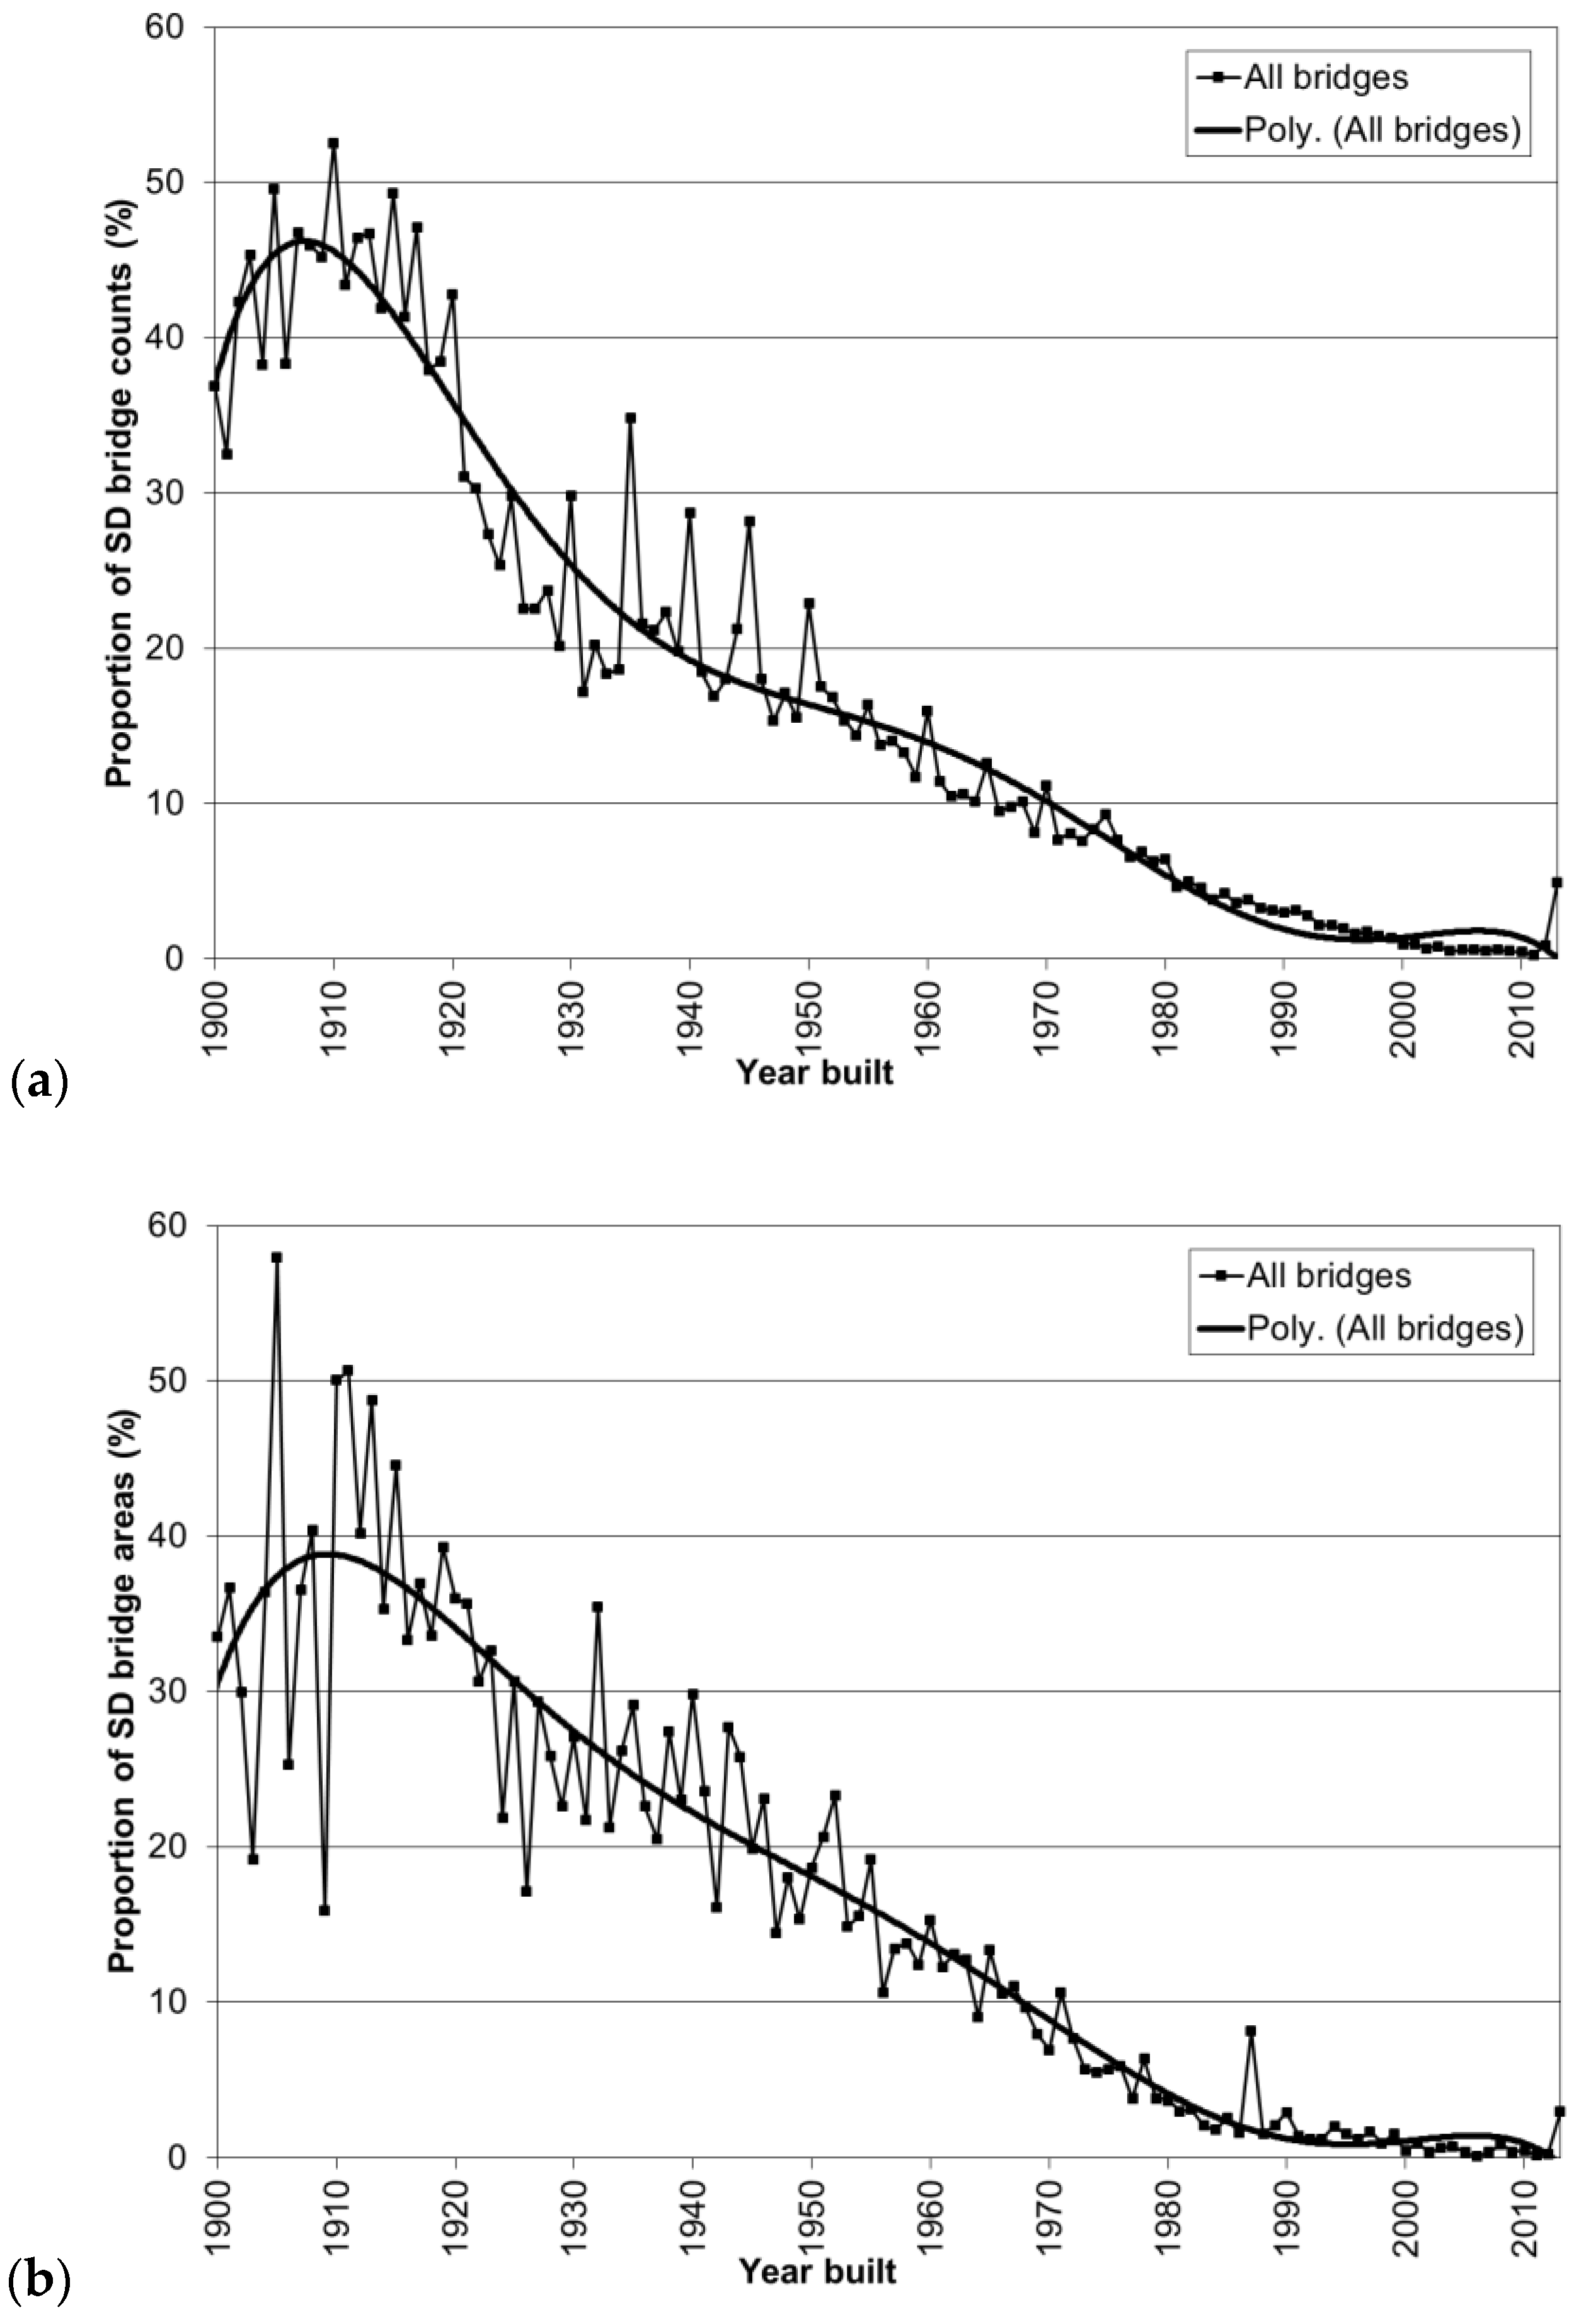
Further analysis of the ratio of accumulation of structural deficiency (Figure 2, Figure 3, Figure 4, Figure 5, Figure 6, Figure 7 and Figure 8) enables to evaluate the relative deterioration. The proportional distribution of SD bridge percentages relative to the respective annual totals versus the time scale of service life (age) reflected by year built for all bridges is shown in Figure 10 by counts and areas. A polynomial trendline of the sixth order averages the annual fluctuations of the proportional distribution of structural deficiency [31,32,33,34]. The maximum average accumulation of structural deficiency of all bridges is 46.20% at 105.50 years by counts and 38.90% at 104.00 years by areas.
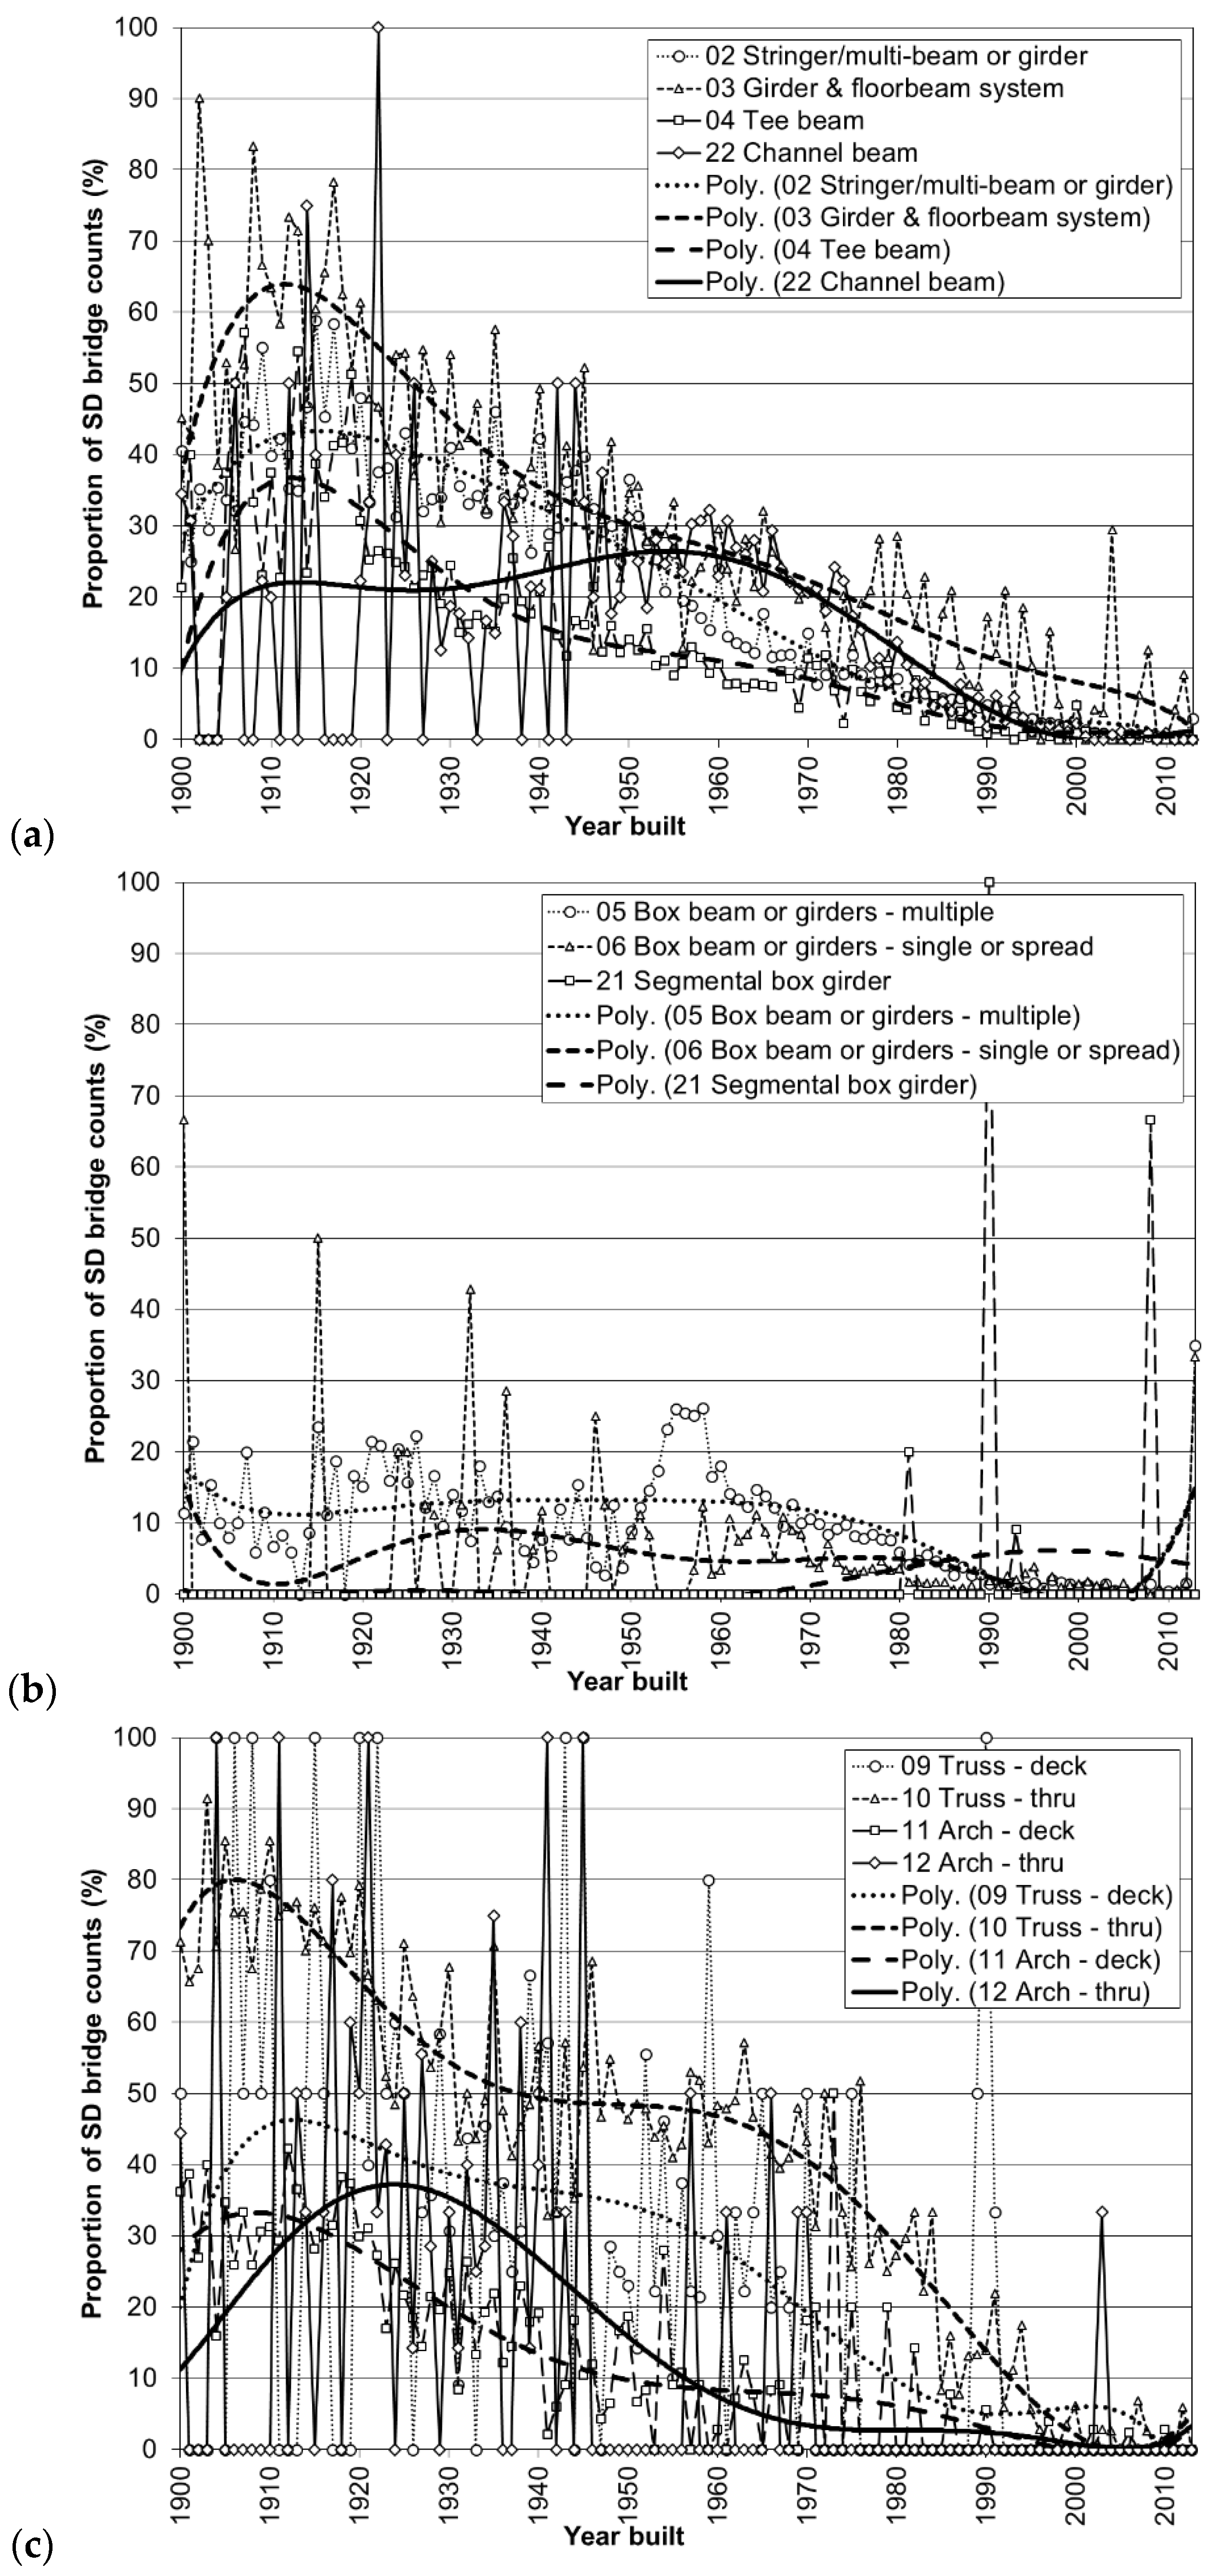
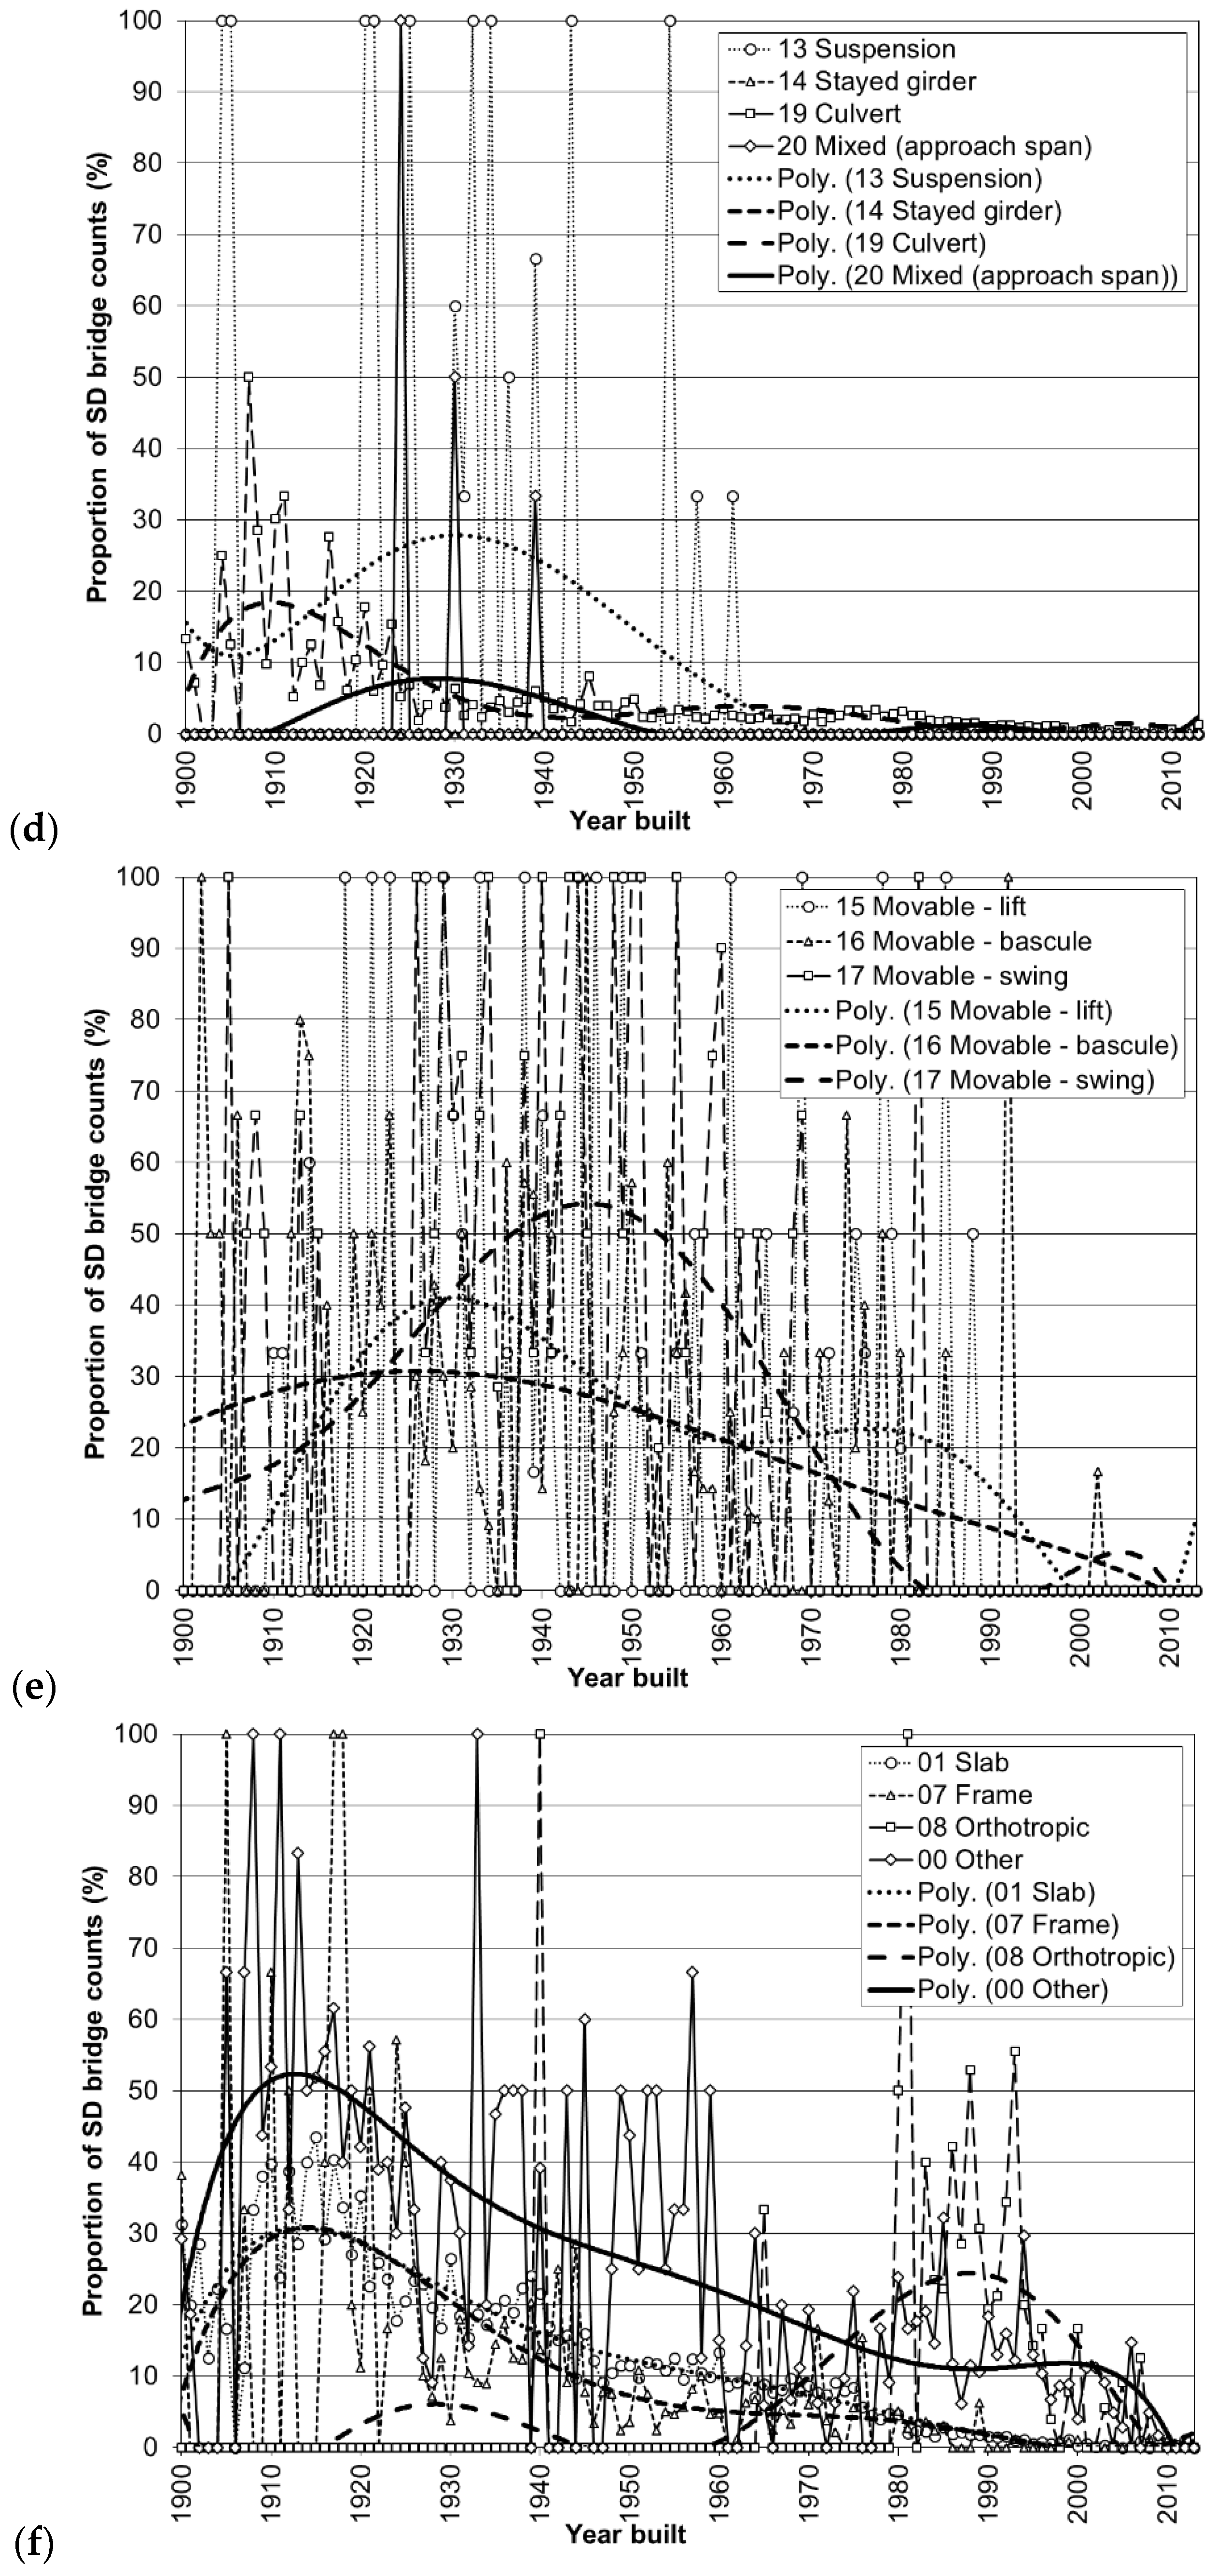
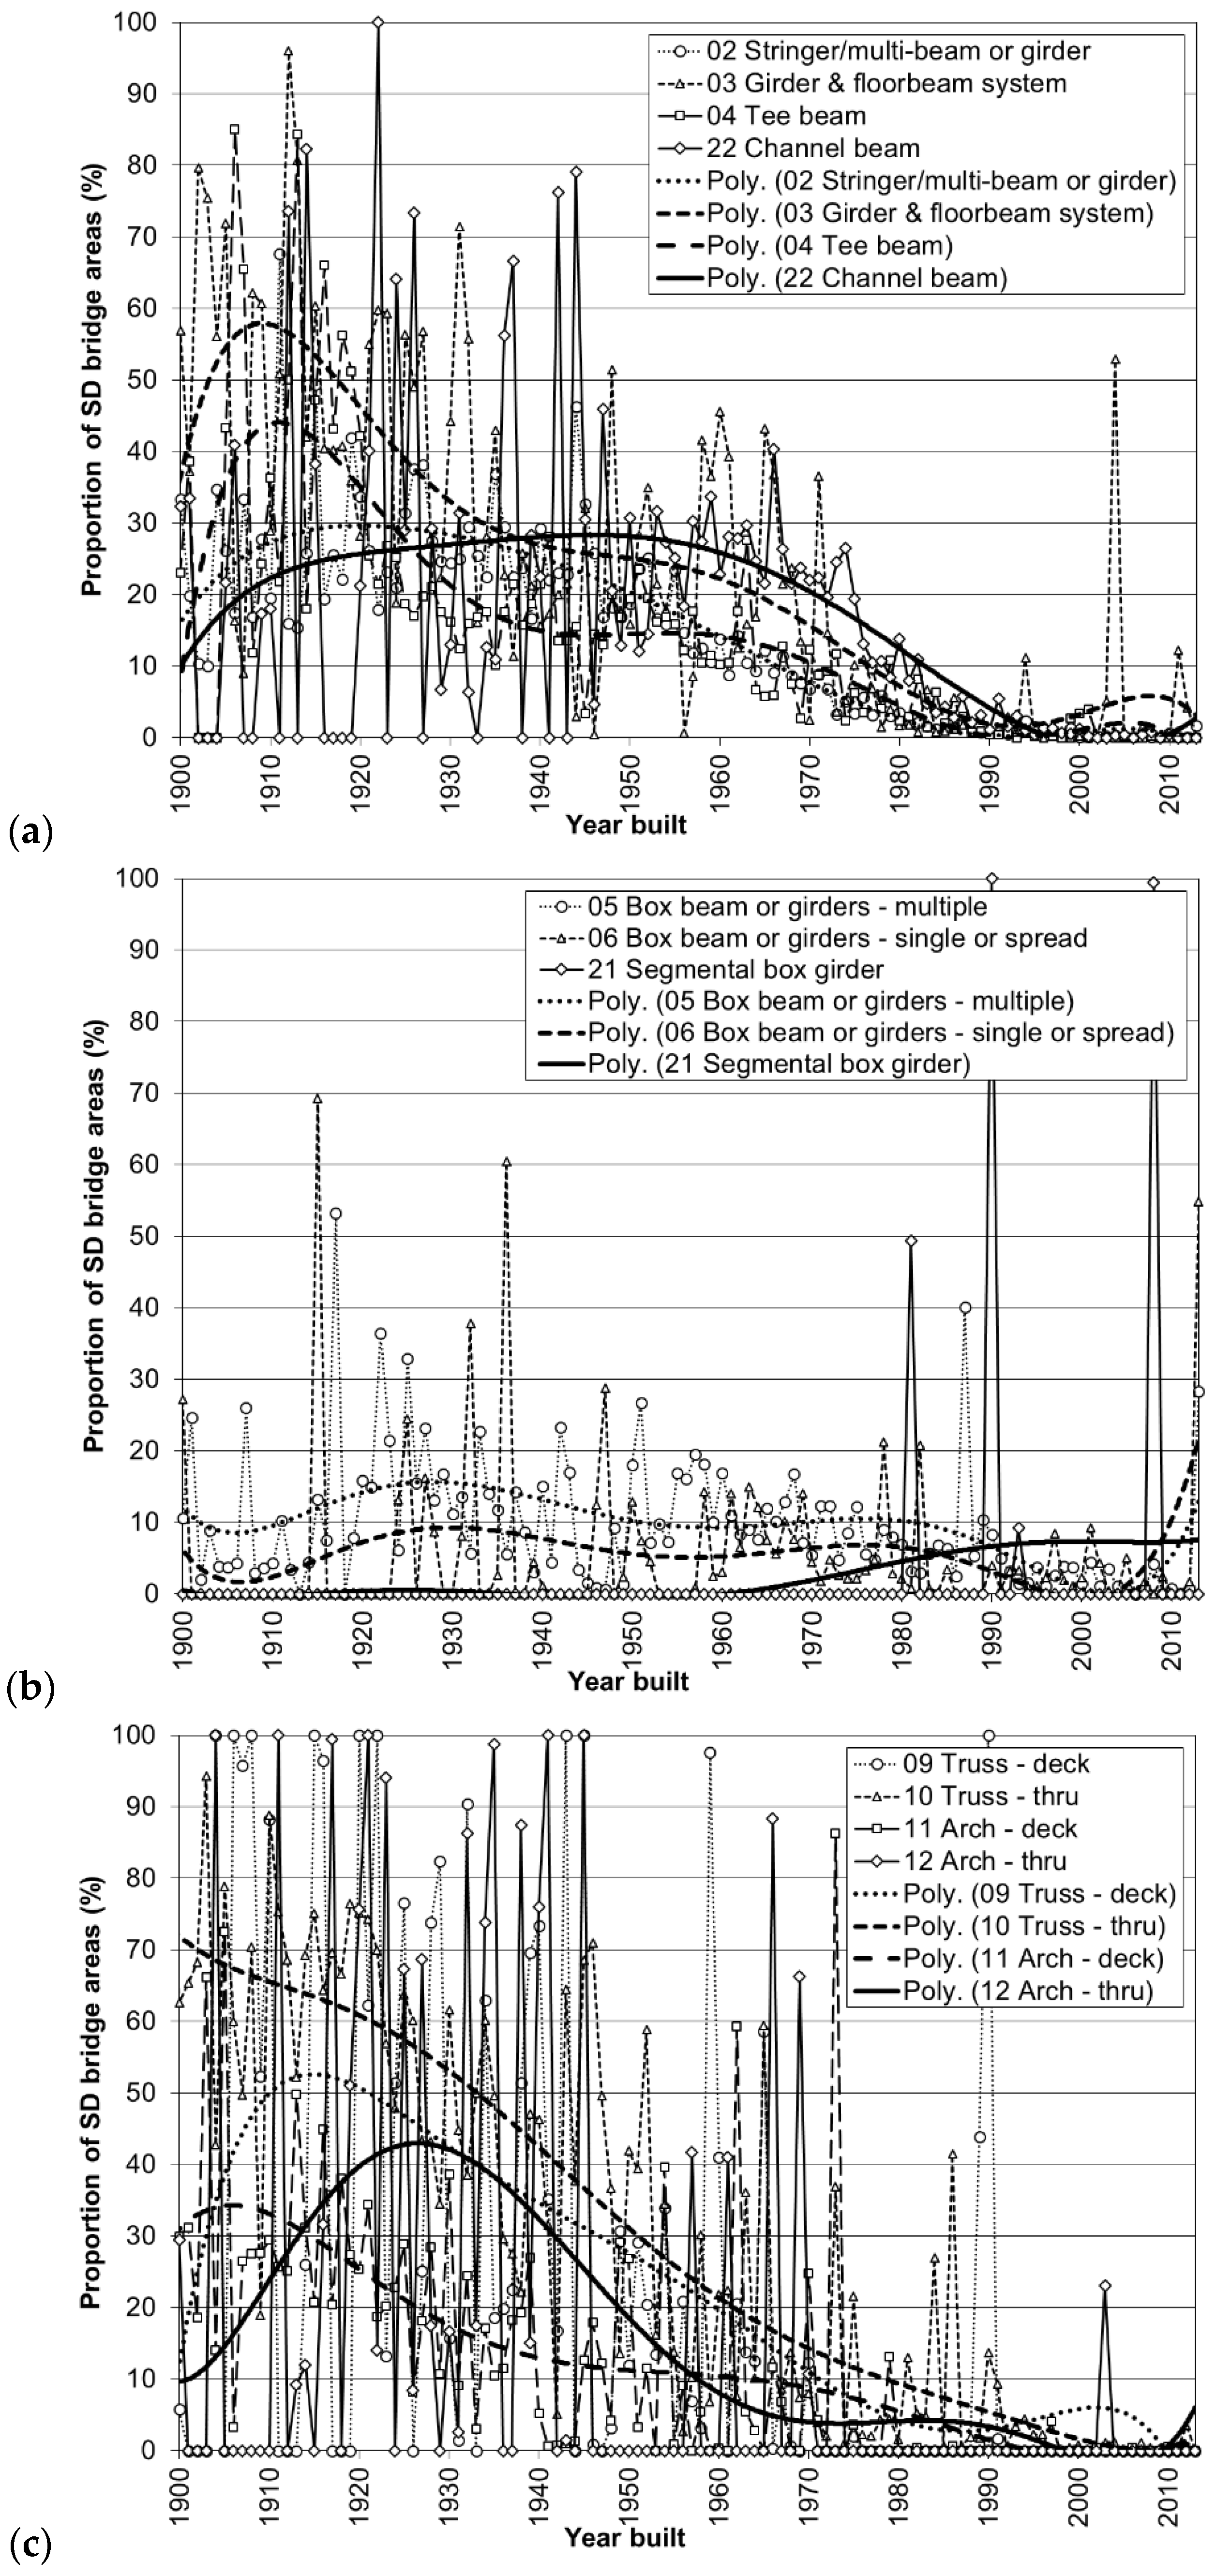
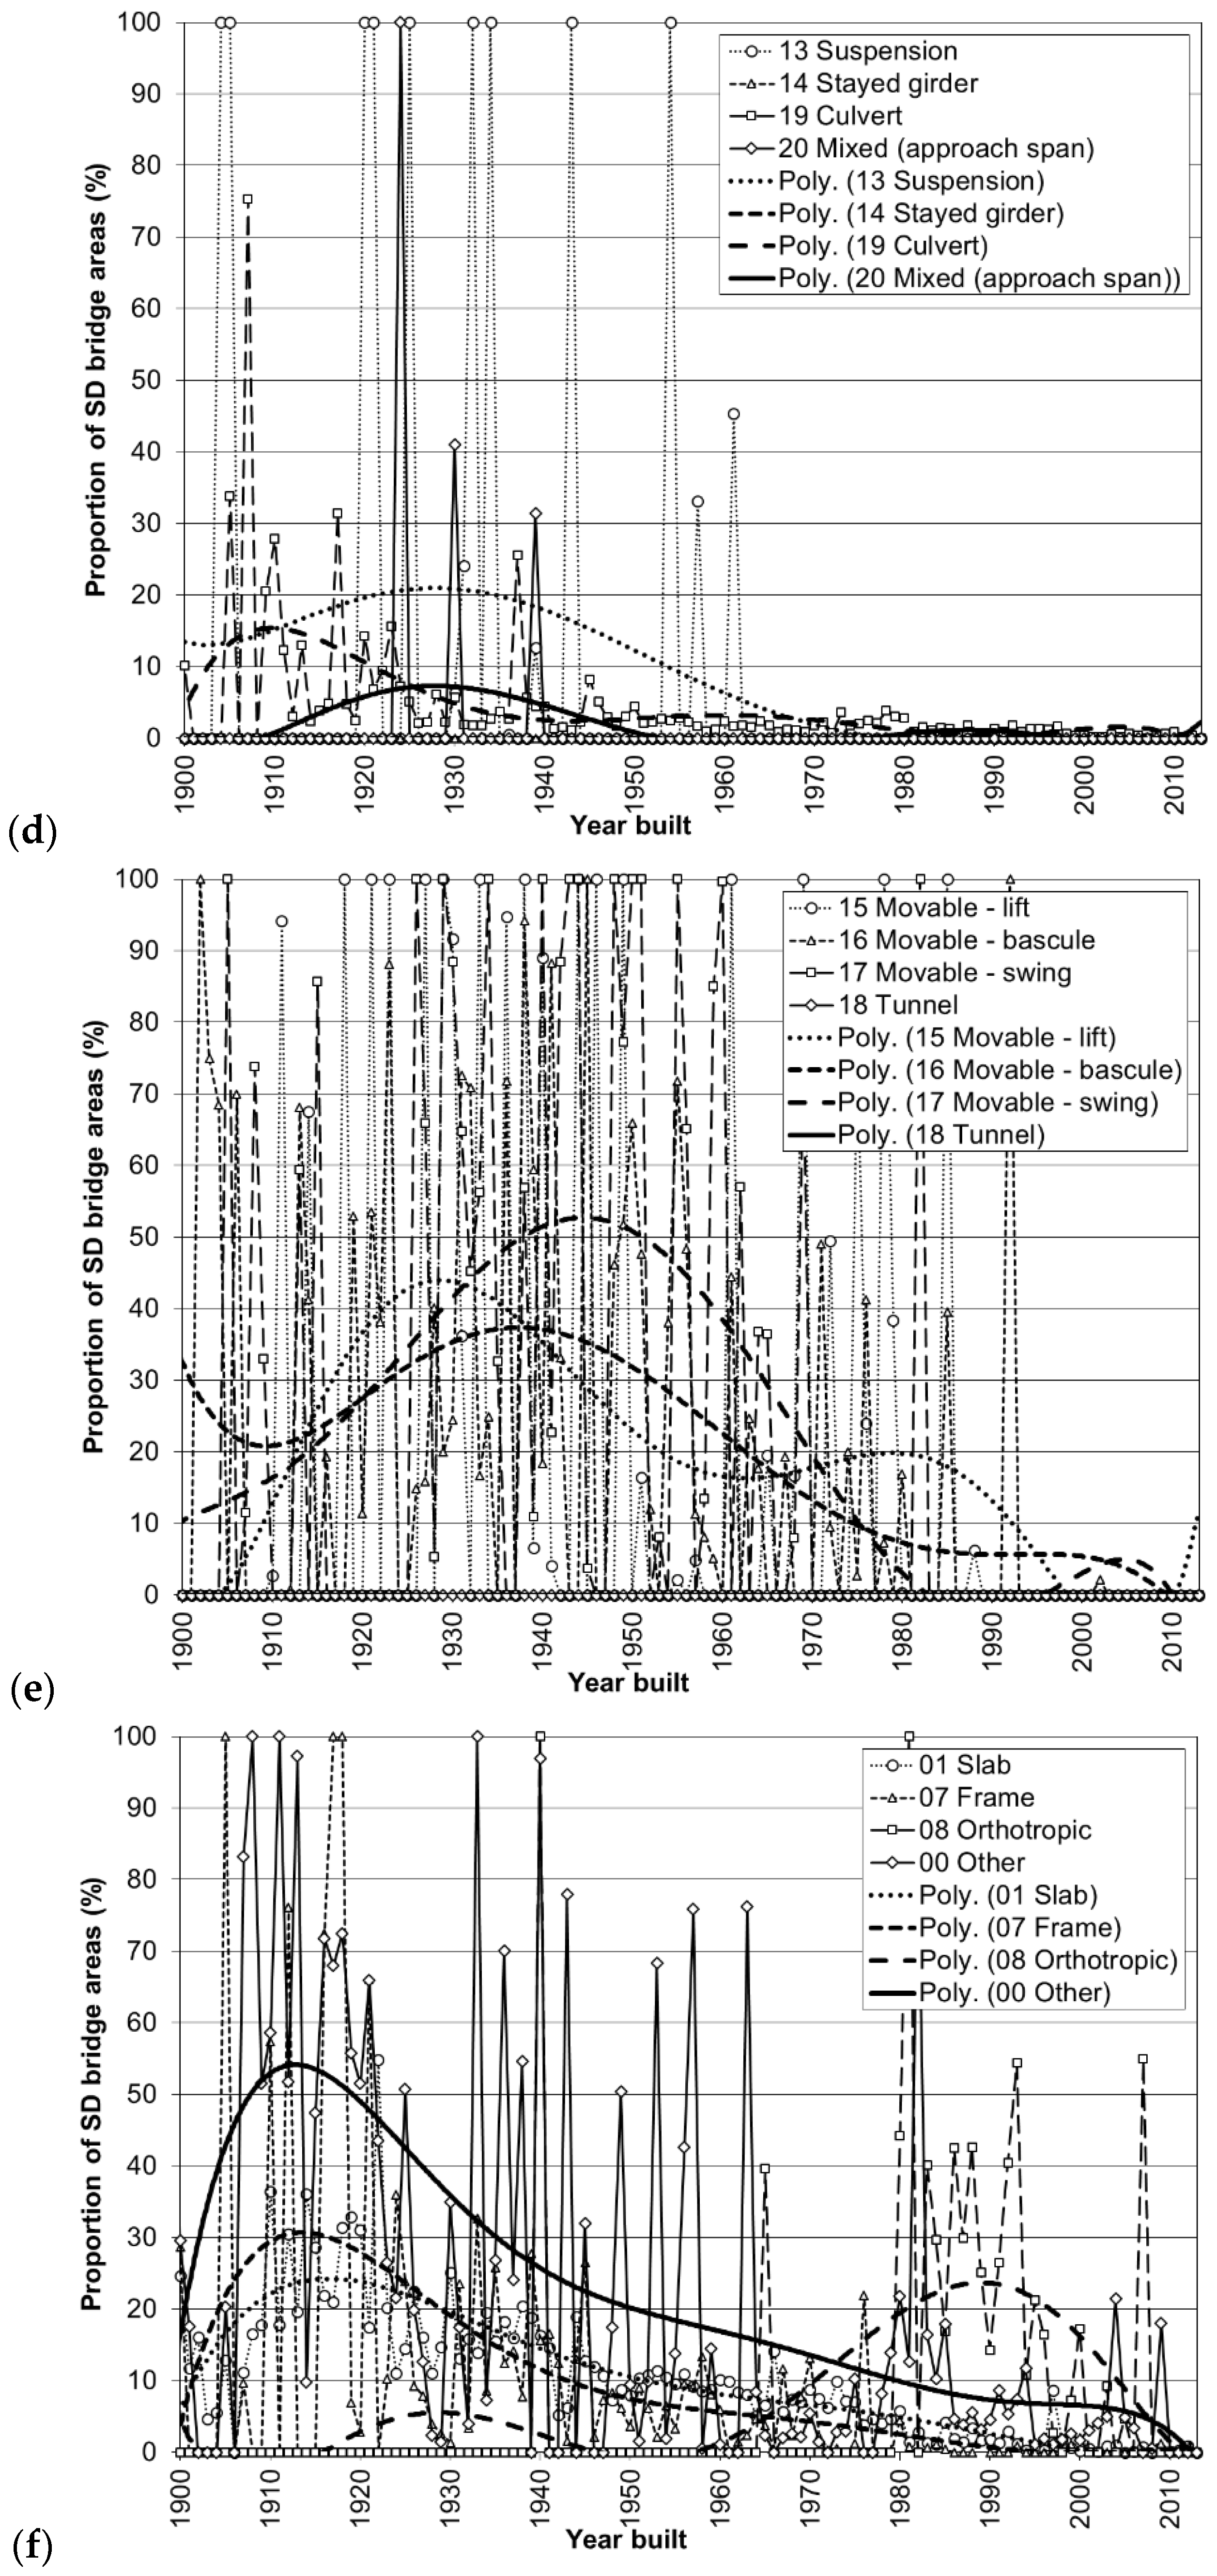
Figure 11 and Figure 12 show the proportional distribution of SD bridges for the various bridge types by counts and areas, respectively. Observation of the proportional distribution of structural deficiency enables identifying early accumulation of deterioration. Further examination of orthotropic (type 08) bridges in Figure 11f shows a critical age group with high premature deterioration between around 1980 to mid-1990’s, revealing the reason of the low SD age (Figure 9b). The outline of the trendline enables to determine and compare the rate and pattern of the accumulation of deterioration, using the maximum SD percentage, pmax, its backwards time span (age), tmax and the pattern of its backwards gradient of accumulation at the median, pm (Table 1 and Table 2) [31,32,33,34]. The average annual increase of structural deficiency is also given in Table 1 and Table 2.
5. Structural Performance
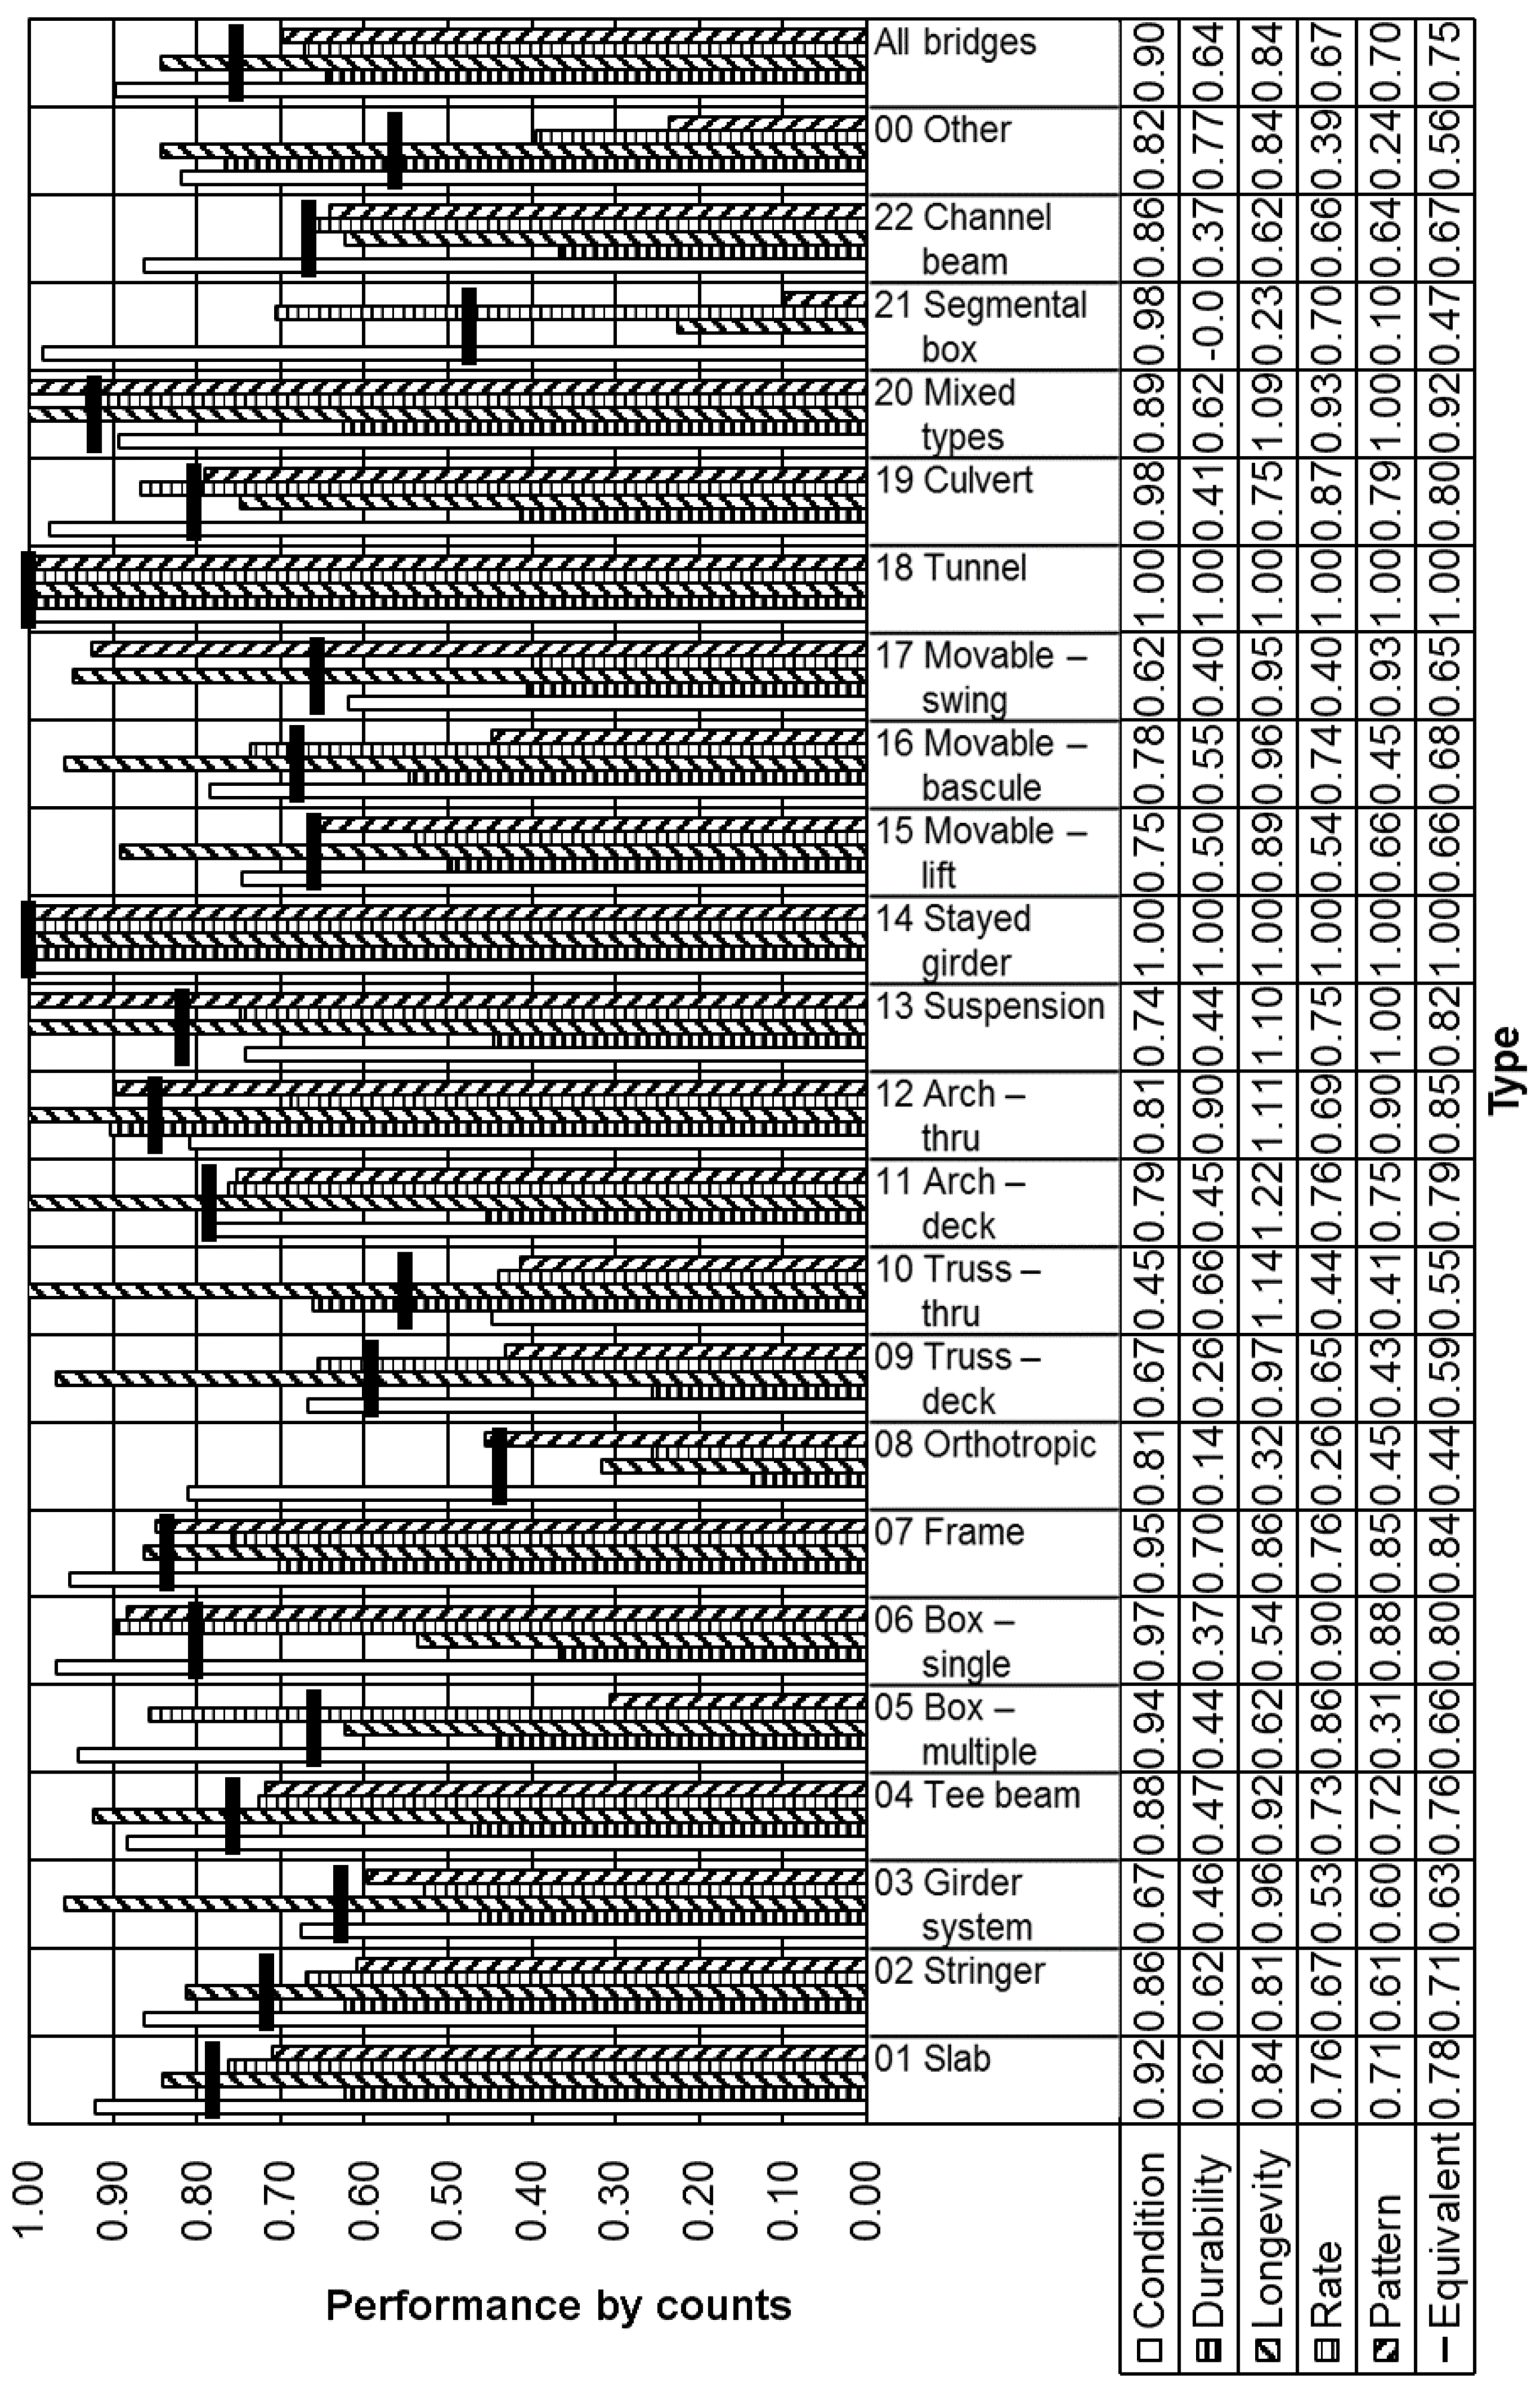
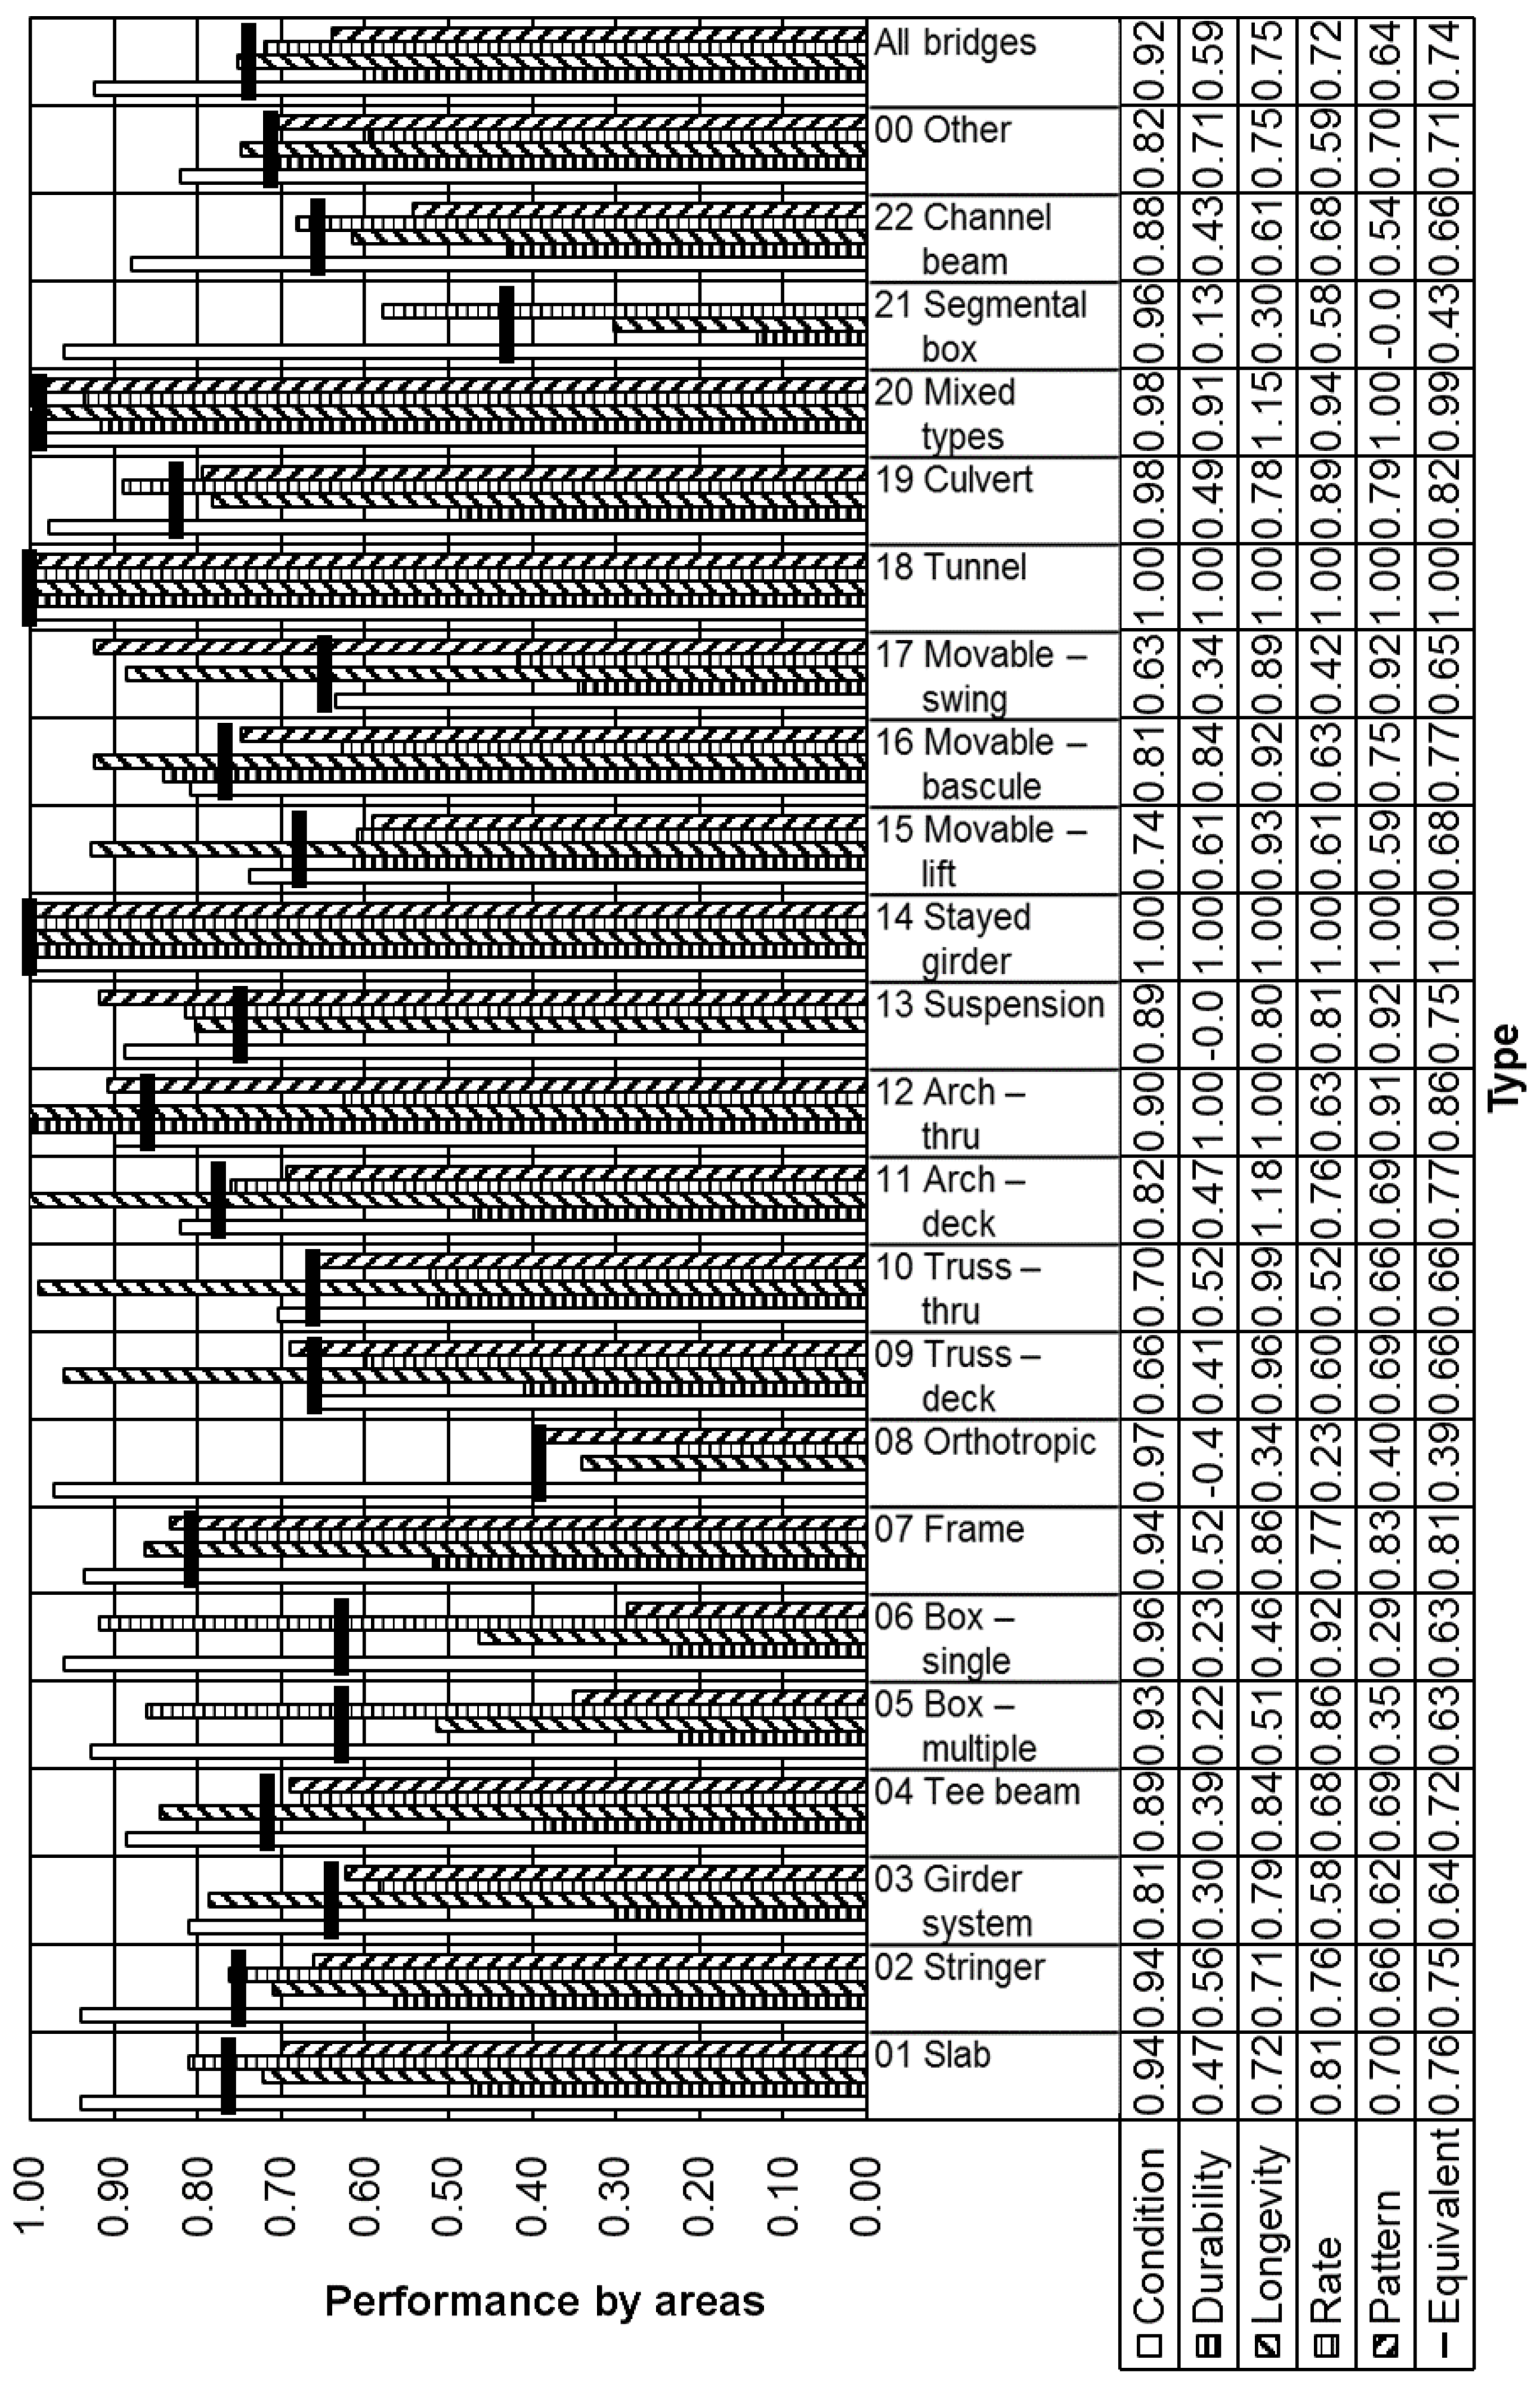
Considering inventory averages and deterioration trends of bridge types, the multi-criteria diagnostic approach integrates the respectively weighted performances of condition, durability, longevity, rate and pattern, into the equivalent structural performance [27,29]. Figure 13 and Figure 14 show the structural performance criteria for the various bridge types by counts and areas, respectively. Reflecting the essential capacity of bridges, performances by areas are somehow different from counts. All bridge types have performances of condition 0.90, durability 0.64, longevity 0.84, rate 0.67, pattern 0.70 and equivalent 0.75, by counts (Figure 13) and condition 0.92, durability 0.59, longevity 0.75, rate 0.72, pattern 0.64 and equivalent 0.74, by areas (Figure 14).
The most common stringer/multi-beam or girder (type 02) bridges have performances of condition 0.86, durability 0.62, longevity 0.81, rate 0.67, pattern 0.61 and equivalent 0.71, by counts (Figure 13) and condition 0.94, durability 0.56, longevity 0.71, rate 0.76, pattern 0.66 and equivalent 0.75, by areas (Figure 14). By counts, the equivalent structural performance of 0.71 is slightly lower than 0.75 of all bridges (Figure 13). By areas on the other hand, the equivalent structural performance of 0.75 is negligibly higher than 0.74 of all bridges (Figure 14). It is important to note that by areas the lower durability (0.56) and longevity (0.71) performances compared to all bridges (0.59 and 0.75, respectively) reveal a relative service life cycle vulnerability that requires attention.
Orthotropic (type 08) bridges have the lowest structural performance (0.44) by counts (Figure 13) and (0.39) by areas (Figure 14). Segmental box girder (type 21) bridges have the second lowest structural performance (0.47) by counts (Figure 13) and (0.43) by areas (Figure 14). Interestingly, from the point of view of structural condition alone, the condition performances of types 08 and 21 bridges are rather high, while their durability and longevity performances are essentially low, revealing a relative service life cycle vulnerability. Moreover, their deterioration trends over time produce low rate and pattern performances, eventually resulting in low equivalent structural performances.
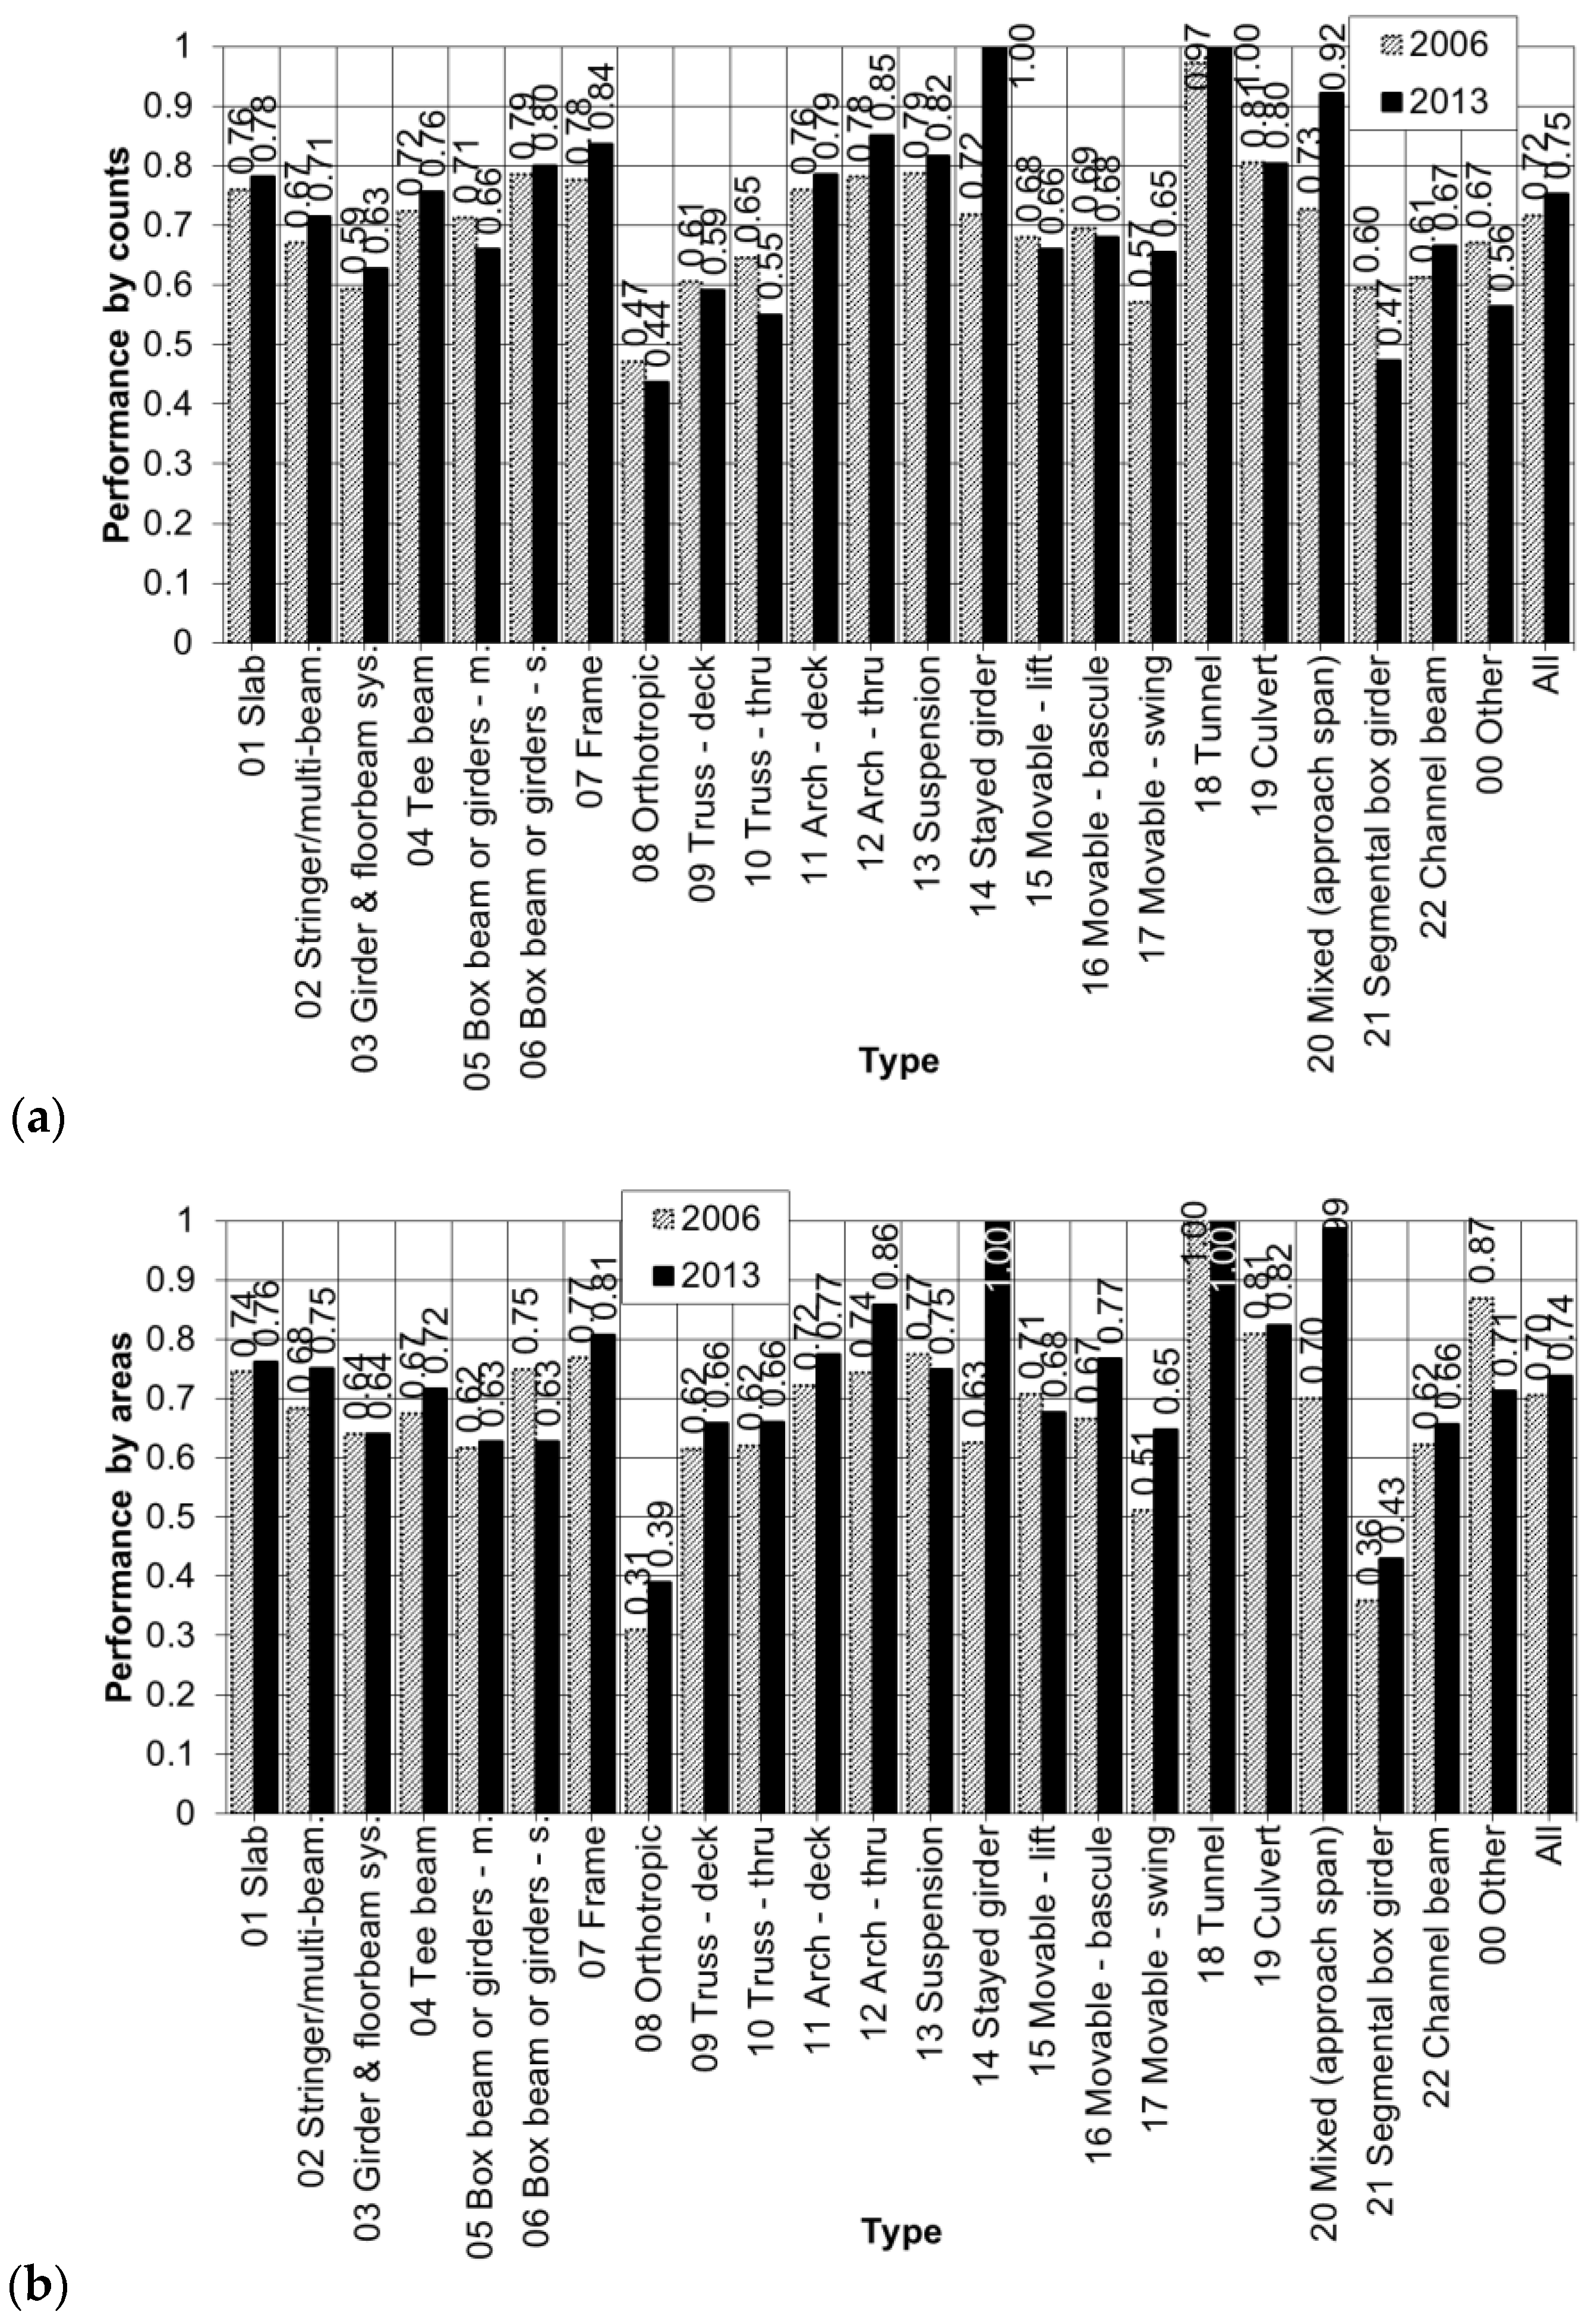
Figure 15 summarizes the equivalent structural performances of all bridge types and compares the years 2006 [33,34] and 2013 by counts and areas. The comparison shows a slight increase of structural performance for some bridge types, leading to a general increase from 0.72 to 0.75 by counts and from 0.70 to 0.74 by areas. It is important to note that while this shows some improvement efforts, it is not significant over seven years. Also, the structural performance of certain bridge types worsened.
6. Conclusions
This comprehensive national network-level comparative study analyzes the NBI 2013 to determine the relative operational structural performances of the various types of bridge structural design and/or construction under the actual practices and circumstances. Analysis of the proportional distribution of structural deficiency reveals issues of deterioration. Considering structural deficiency, service life cycle and deterioration trends of bridge types over time, the equivalent structural performances incorporate the condition, durability, longevity, rate and pattern performances. This enables identifying performance criteria with critical issues. For bridge management comparison purposes, the study also offers results by bridge counts in addition to bridge deck areas that provide more significant results. The results provide support for more sustainable engineering and management decisions.
Stringer/multi-beam or girder (type 02) bridges are the most common bridge type by counts (40.75%) and by areas (61.88%). The structural deficiency of type 02 bridges by counts (13.72%) is above the average of 10.36% for all bridges, while by areas (5.98%) it is actually below (7.65%). The highest structural deficiency levels for truss—thru (type 10) bridges 55.25% by counts and movable—swing (type 17) bridges 36.54% by areas are critical.
The average SD age of all bridges (63 by counts and 56 by areas) is critically lower than the official service life-cycle target of 75 years. The average SD age of the most common stringer/multi-beam or girder (type 02) bridges is even more critical (61 by counts and 53 by areas) for service life cycle.
All bridge types have an equivalent structural performance of 0.75 by counts and 0.74 by areas. The most common stringer/multi-beam or girder (type 02) bridges have an equivalent structural performance of 0.71 by counts and 0.75 by areas. Although this seems comparable by areas, type 02 bridges have lower durability (0.56) and longevity (0.71) performances as compared to all bridges (0.59 and 0.75, respectively). This reveals a relative service life cycle vulnerability that requires attention.
The lowest structural performances are orthotropic (type 08) bridges 0.44 by counts and 0.39 by areas and segmental box girder (type 21) bridges 0.47 by counts and 0.43 by areas. While their condition performances are rather high, they have essentially low durability, longevity, rate and pattern performances.
The comparison from 2006 to 2013 shows that for all bridges, the structural deficiency decreased from 12.35% to 10.36% by counts and from 9.38% to 7.65% by areas. The slight increase of structural performance for some bridge types leads to a general increase for all bridge types from 0.72 to 0.75 by counts and from 0.70 to 0.74 by areas. Yet this improvement is not significant over seven years. The worsening for certain bridge types requires immediate examination of the etiology.
Conflicts of Interest
The author declares no conflict of interest.
Notation
| pm | median value of the trendline’s range of backwards increase |
| pmax | maximum value of the trendline’s range of backwards increase |
| SA | structurally adequate—not structurally deficient |
| SD | structurally deficient |
| tmax | backwards time span in years of the trendline’s maximum |
References
- Ben-Akiva, M.; Humplick, F.; Madanat, S.; Ramaswamy, R. Infrastructure management under uncertainty: Latent performance approach. J. Transp. Eng. 1993, 119, 43–58. [Google Scholar] [CrossRef]
- Mishalani, R.G.; Koutsopoulos, H.N. Uniform infrastructure fields: Definition and identification. J. Infrastruct. Syst. 1995, 1, 44–55. [Google Scholar] [CrossRef]
- Aktan, A.E.; Dalal, V.; Farhey, D.N.; Hunt, V.J. Bridge reliability evaluation in the 21st century. In Research Transformed into Practice—Implementation of NSF Research; Colville, J., Amde, A.M., Eds.; ASCE: Reston, VA, USA, 1995; pp. 493–505. [Google Scholar]
- Aktan, A.E.; Farhey, D.N.; Brown, D.L.; Dalal, V.; Helmicki, A.J.; Hunt, V.J.; Shelley, S.J. Condition assessment for bridge management. J. Infrastruct. Syst. 1996, 2, 108–117. [Google Scholar] [CrossRef]
- Stewart, M.G. Reliability-based assessment of ageing bridges using risk ranking and life cycle cost decision analyses. In Reliability Engineering and System Safety; Elsevier Science: Amsterdam, The Netherlands, 2001; Volume 74, pp. 263–273. [Google Scholar]
- Kong, J.S.; Frangopol, D.M. System reliability modeling in bridge management. In Proceedings of the 9th International Bridge Management Conference (IBMC03), Orlando, FL, USA, 28–30 April 2003; Transportation Research Board of the National Academies: Washington, DC, USA, 2003; pp. 361–372. [Google Scholar]
- Furuta, H.; Kameda, T.; Frangopol, D.M. Balance of structural performance measures. In Proceedings of the 2004 Structures Congress—Building on the Past: Securing the Future, Nashville, TE, USA, 22–26 May 2004; Blandford, G.E., Ed.; ASCE: Reston, VA, USA, 2004; pp. 19–23. [Google Scholar]
- Ellingwood, B.R. Risk-informed condition assessment of civil infrastructure: State of practice and research issues. Struct. Infrastruct. Eng. 2005, 1, 7–18. [Google Scholar] [CrossRef]
- Darbani, B.M.; Hammad, A. Critical review of new directions in bridge management systems. In Proceedings of the ASCE International Workshop on Computing in Civil Engineering, Pittsburgh, PA, USA, 24–27 July 2007; Soibelman, L., Akinci, B., Eds.; ASCE: Reston, VA, USA, 2007; pp. 330–337. [Google Scholar]
- Frangopol, D.M.; Strauss, A.; Kim, S. Bridge reliability assessment based on monitoring. J. Bridge Eng. 2008, 13, 258–270. [Google Scholar] [CrossRef]
- Liu, M.; Frangopol, D.M.; Kim, S. Bridge system performance assessment from structural health monitoring: A case study. J. Struct. Eng. 2009, 135, 733–742. [Google Scholar] [CrossRef]
- Moon, F.L.; Laning, J.; Lowdermilk, D.S.; Chase, S.; Hooks, J.; Aktan, A.E. A pragmatic risk-based approach to prioritizing bridges. In Proceedings of the SPIE—Nondestructive Characterization for Composite Materials, Aerospace Engineering, Civil Infrastructure, and Homeland Security, San Diego, CA, USA, 9–11 March 2009; Wu, H.F., Diaz, A.A., Shull, P.J., Vogel, D.W., Eds.; SPIE: Bellingham, WA, USA, 2009; Volume 7294. [Google Scholar]
- Weidner, J.; Prader, J.; Dubbs, N.; Moon, F.; Aktan, A.E. Structural identification of bridges to assess safety and performance. In Proceedings of the Structures Congress, Austin, TX, USA, 30 April–2 May 2009; Griffis, L., Helwig, T., Waggoner, M., Hoit, M., Eds.; ASCE: Reston, VA, USA, 2009; Volume 341, pp. 119–124. [Google Scholar]
- Hooks, J.M. FHWA Long-Term Bridge Performance Program. In Aspire—The Concrete Bridge Magazine; Precast/Prestressed Concrete Institute (PCI): Chicago, IL, USA, 2011; Available online: aspirebridge.com/resources/ASPIRE_3000_Word_LTBP_Article_PUBLISH.pdf (accessed on 24 January 2013).
- American Society of Civil Engineers (ASCE). Civil Engineering Body of Knowledge for the 21st Century: Preparing the Civil Engineer for the Future; Body of Knowledge Committee of the Committee on Academic Prerequisites for Professional Practice: Reston, VA, USA, 2008. [Google Scholar]
- Biondini, F.; Frangopol, D.M. Life-cycle performance of deteriorating structural systems under uncertainty: Review. J. Struct. Eng. 2016, 142, F4016001. [Google Scholar] [CrossRef]
- Ghosn, M.; Dueñas-Osorio, L.; Frangopol, D.M.; McAllister, T.; Bocchini, P.; Manuel, L.; Ellingwood, B.; Arangio, S.; Bontempi, F.; Shah, M.; et al. Performance indicators for structural systems and infrastructure networks. J. Struct. Eng. 2016, 142, F4016003. [Google Scholar] [CrossRef]
- Ellingwood, B.; Frangopol, D.M. Introduction to the State of the Art Collection: Risk-Based Lifecycle Performance of Structural Systems. J. Struct. Eng. 2016, 142, F2016001. [Google Scholar] [CrossRef]
- Federal Highway Administration (FHWA). LTBP: Long-Term Bridge Performance Program. 2011. Available online: www.fhwa.dot.gov/research/tfhrc/programs/infrastructure/structures/ltbp/ (accessed on 28 June 2011).
- Federal Highway Administration (FHWA). Advancing Steel and Concrete Bridge Technology to Improve Infrastructure Performance. DTFH61-11-RA-00010; 2011. Available online: www.grants.gov/search/search.do?mode=VIEW&oppId=95953 (accessed on 20 May 2011).
- Federal Highway Administration (FHWA). Achieving the Bridges of Tomorrow: The Long-Term Bridge Performance Program. Focus, Accelerating Infrastructure Innovations. FHWA-HRT-12-017; 2012. Available online: www.fhwa.dot.gov/publications/focus/12sep/12sep03.cfm (accessed on 12 September 2012).
- Federal Highway Administration (FHWA). Transportation Performance Management. 2013. Available online: www.fhwa.dot.gov/tpm/ (accessed on 21 August 2013).
- Federal Highway Administration (FHWA). Federal Highway Administration (FHWA). FHWA Performance Reporting—Part One of Two—Final report. FHWA-HIF-13-043; 2013. Available online: www.fhwa.dot.gov/tpm/resources/docs/hif13043.pdf (accessed on 21 August 2013).
- Federal Highway Administration (FHWA). FHWA Performance Reporting—Part Two of Two—Final Report. FHWA-HIF-13-044; 2013. Available online: www.fhwa.dot.gov/tpm/resources/docs/hif13044.pdf (accessed on 21 August 2013).
- Transportation Research Board (TRB). Long-Term Bridge Performance Committee Letter Report: July 5, 2016; The National Academies Press: Washington, DC, USA, 2016. [Google Scholar]
- Moore, M.; Phares, B.; Graybeal, B.; Rolander, D.; Washer, G. Reliability of Visual Inspection for Highway Bridges, Volume I: Final Report. FHWA-RD-01-020; 2001. Available online: www.fhwa.dot.gov/publications/research/nde/pdfs/01020a.pdf (accessed on 5 February 2018).
- Farhey, D.N. Performance of bridge materials by structural deficiency analysis. J. Perform. Constr. Facil. 2010, 24, 345–352. [Google Scholar] [CrossRef]
- Farhey, D.N. Operational structural performances of bridge materials by areas. J. Perform. Constr. Facil. 2012, 26, 453–461. [Google Scholar] [CrossRef]
- Farhey, D.N. Operational structural performances of bridge materials by deterioration trends. J. Perform. Constr. Facil. 2014, 28, 168–177. [Google Scholar] [CrossRef]
- Farhey, D.N. Deterioration trends and structural performances of bridge materials using deck areas. J. Perform. Constr. Facil. 2015, 29, 04014154. [Google Scholar] [CrossRef]
- Farhey, D.N. Operational structural performance of bridge types. J. Perform. Constr. Facil. 2011, 25, 554–563. [Google Scholar] [CrossRef]
- Farhey, D.N. Operational structural performances of bridge types by areas. J. Perform. Constr. Facil. 2013, 27, 303–318. [Google Scholar] [CrossRef]
- Farhey, D.N. Operational structural performances of bridge types by deterioration trends. J. Perform. Constr. Facil. 2015, 29, 4014056. [Google Scholar] [CrossRef]
- Farhey, D.N. Deterioration trends and structural performances of bridge types using deck areas. J. Perform. Constr. Facil. 2015, 30, 04015044. [Google Scholar] [CrossRef]
- Federal Highway Administration (FHWA). National Bridge Inventory (NBI). 2014. Available online: www.fhwa.dot.gov/bridge/nbi.cfm (accessed on 6 October 2014).
- Farhey, D.N. Structural Performances of Bridge Materials in the U.S. National Bridge Inventory 2013. In Structural Engineering International; International Association for Bridge and Structural Engineering (IABSE): Zurich, Switzerland, 2017. [Google Scholar]
- Federal Highway Administration (FHWA). Recording and Coding Guide for the Structure Inventory and Appraisal of the Nation’s Bridges; Report No. FHWA-PD-96-001; FHWA: Washington, DC, USA, 1995.
- American Association of State Highway and Transportation Officials (AASHTO). LRFD Bridge Design Specifications, 6th ed.; AASHTO: Washington, DC, USA, 2012. [Google Scholar]
- Strategic Highway Research Program 2 (SHRP2). Design Guide for Bridges for Service Life; Report No. S2-R19A-RW-2; Transportation Research Board, National Academy of Sciences: Washington, DC, USA, 2014. [Google Scholar]
Figure 1.
Comparison of percentages of bridge types from the total and SD percentages. (a) Counts 2013; (b) Areas 2013; (c) Counts 2006; (d) Areas 2006.
Figure 1.
Comparison of percentages of bridge types from the total and SD percentages. (a) Counts 2013; (b) Areas 2013; (c) Counts 2006; (d) Areas 2006.


Figure 2.
Distribution and SA to SD ratio of beam (types 02 and 03) bridges. (a) Counts and (b) Areas.
Figure 2.
Distribution and SA to SD ratio of beam (types 02 and 03) bridges. (a) Counts and (b) Areas.

Figure 3.
Distribution and SA to SD ratio of box (types 05, 06 and 21) bridges. (a) Counts and (b) Areas.
Figure 3.
Distribution and SA to SD ratio of box (types 05, 06 and 21) bridges. (a) Counts and (b) Areas.


Figure 4.
Distribution and SA to SD ratio of truss (types 09 and 10) bridges. (a) Counts and (b) Areas.
Figure 4.
Distribution and SA to SD ratio of truss (types 09 and 10) bridges. (a) Counts and (b) Areas.

Figure 5.
Distribution and SA to SD ratio of arch (types 11 and 12) bridges. (a) Counts and (b) Areas.
Figure 5.
Distribution and SA to SD ratio of arch (types 11 and 12) bridges. (a) Counts and (b) Areas.

Figure 6.
Distribution and SA to SD ratio of cable (types 13 and 14) bridges. (a) Counts and (b) Areas.
Figure 6.
Distribution and SA to SD ratio of cable (types 13 and 14) bridges. (a) Counts and (b) Areas.


Figure 7.
Distribution and SA to SD ratio of movable (types 15, 16 and 17) bridges. (a) Counts and (b) Areas.
Figure 7.
Distribution and SA to SD ratio of movable (types 15, 16 and 17) bridges. (a) Counts and (b) Areas.

Figure 8.
Distribution and SA to SD ratio of all bridges. (a) Counts and (b) Areas.

Figure 9.
Average ages of bridges. (a) Counts and (b) Areas.

Figure 10.
Distribution of the proportion of all SD bridges. (a) Counts; (b) Areas.

Figure 11.
Distribution of the proportion of SD bridge counts by type. (a) Beam; (b) Box; (c) Truss and arch; (d) Suspension, stayed girder, culvert, and mixed; (e) Movable and tunnels; (f) Slab, frame, orthotropic, and other.
Figure 11.
Distribution of the proportion of SD bridge counts by type. (a) Beam; (b) Box; (c) Truss and arch; (d) Suspension, stayed girder, culvert, and mixed; (e) Movable and tunnels; (f) Slab, frame, orthotropic, and other.


Figure 12.
Distribution of the proportion of SD bridge areas by type. (a) Beam; (b) Box; (c) Truss and arch; (d) Suspension, stayed girder, culvert, and mixed; (e) Movable and tunnels; (f) Slab, frame, orthotropic, and other.
Figure 12.
Distribution of the proportion of SD bridge areas by type. (a) Beam; (b) Box; (c) Truss and arch; (d) Suspension, stayed girder, culvert, and mixed; (e) Movable and tunnels; (f) Slab, frame, orthotropic, and other.


Figure 13.
Comparison of structural performances of bridge types by counts.

Figure 14.
Comparison of structural performances of bridge types by areas.

Figure 15.
Comparison of structural performances with the year 2006. (a) Counts and (b) Areas.


Table 1.
Counts of predominant type of structural design and/or construction for bridge main span(s).
Table 1.
Counts of predominant type of structural design and/or construction for bridge main span(s).
| Type Code | Type of Structural Design and/or Construction | Bridge Counts [from total] | SD Bridge Counts [%] | pmax * (%) | tmax † (years) | pm ‡ (%) | SD Increase pmax/tmax (%/year) |
|---|---|---|---|---|---|---|---|
| 01 | Slab | 80,526 [13.29] | 6407 [7.96] | 31.80 | 100.00 | 9.25 | 0.32 |
| 02 | Stringer/multi-beam or girder | 246,981 [40.75] | 33,893 [13.72] | 43.25 | 98.40 | 16.90 | 0.44 |
| 03 | Girder and floorbeam system | 6405 [1.06] | 2083 [32.52] | 63.95 | 101.50 | 25.80 | 0.63 |
| 04 | Tee beam | 35,396 [5.84] | 4171 [11.78] | 36.80 | 100.50 | 10.40 | 0.37 |
| 05 | Box beam or girders—multiple | 51,843 [8.55] | 3066 [5.91] | 13.25 | 69.85 | 9.20 | 0.19 |
| 06 | Box beam or girders—single or spread | 10,031 [1.66] | 318 [3.17] | 5.10 | 37.00 | 0.60 | 0.14 |
| 07 | Frame (except frame culverts) | 5489 [0.91] | 264 [4.81] | 31.90 | 99.00 | 4.80 | 0.32 |
| 08 | Orthotropic | 469 [0.08] | 89 [18.98] | 24.30 | 24.50 | 13.25 | 0.99 |
| 09 | Truss—deck | 448 [0.07] | 149 [33.26] | 46.25 | 100.50 | 26.30 | 0.46 |
| 10 | Truss—thru | 9213 [1.52] | 5090 [55.25] | 80.00 | 106.85 | 47.00 | 0.75 |
| 11 | Arch—deck | 6165 [1.02] | 1292 [20.96] | 33.30 | 105.00 | 8.25 | 0.32 |
| 12 | Arch—thru | 359 [0.06] | 69 [19.22] | 37.10 | 89.00 | 3.80 | 0.42 |
| 13 | Suspension | 89 [0.01] | 23 [25.84] | 27.85 | 82.70 | 0.00 | 0.34 |
| 14 | Stayed girder | 48 [0.01] | 0 [0.00] | 0.00 | - | 0.00 | 0.00 |
| 15 | Movable—lift | 181 [0.03] | 46 [25.41] | 22.75 | 37.00 | 7.75 | 0.61 |
| 16 | Movable—bascule | 454 [0.07] | 98 [21.59] | 30.80 | 87.50 | 17.00 | 0.35 |
| 17 | Movable—swing | 189 [0.03] | 72 [38.10] | 54.15 | 67.50 | 4.00 | 0.80 |
| 18 | Tunnel | 19 [0.00] | 0 [0.00] | 0.00 | - | 0.00 | 0.00 |
| 19 | Culvert (includes frame culverts) | 134,737 [22.23] | 3299 [2.45] | 18.45 | 103.60 | 3.85 | 0.18 |
| 20 | Mixed types (applicable only to approach spans) | 28 [0.00] | 3 [10.71] | 7.80 | 85.00 | 0.00 | 0.09 |
| 21 | Segmental box girder | 328 [0.05] | 5 [1.52] | 6.10 | 15.50 | 5.50 | 0.39 |
| 22 | Channel beam | 14,581 [2.41] | 1992 [13.66] | 26.40 | 59.00 | 9.50 | 0.45 |
| 00 | Other | 2035 [0.34] | 371 [18.23] | 11.90 | 14.75 | 9.10 | 0.81 |
| All bridges | 606,014 [100.00] | 62,800 [10.36] | 46.20 | 105.50 | 14.00 | 0.44 |
* pmax = maximum value of the trendline’s range of backwards increase; † tmax = backwards time span in years of the trendline’s maximum; ‡ pm = median value of the trendline’s range of backwards increase.
Table 2.
Areas of predominant type of structural design and/or construction for bridge main span(s).
Table 2.
Areas of predominant type of structural design and/or construction for bridge main span(s).
| Type Code | Type of Structural Design and/or Construction | Bridge Areas (m2) [% from total] | SD Bridge Areas (m2) [%] | pmax * (%) | tmax † (years) | pm ‡ (%) | SD Increase pmax/tmax (%/year) |
|---|---|---|---|---|---|---|---|
| 01 | Slab | 25,581,548 [7.07] | 1,545,568 [6.04] | 24.20 | 96.00 | 7.25 | 0.25 |
| 02 | Stringer/multi-beam or girder | 223,850,765 [61.88] | 13,375,449 [5.98] | 29.50 | 93.00 | 10.00 | 0.32 |
| 03 | Girder and floorbeam system | 10,656,892 [2.95] | 2,021,260 [18.97] | 57.80 | 104.00 | 21.75 | 0.56 |
| 04 | Tee beam | 17,058,486 [4.72] | 1,960,389 [11.49] | 43.80 | 101.50 | 13.60 | 0.43 |
| 05 | Box beam or girders—multiple | 34,240,371 [9.46] | 2,512,665 [7.34] | 15.70 | 85.00 | 10.20 | 0.18 |
| 06 | Box beam or girders—single or spread | 9,160,051 [2.53] | 371,968 [4.06] | 9.25 | 83.00 | 6.60 | 0.11 |
| 07 | Frame (except frame culverts) | 1,741,821 [0.48] | 111,096 [6.38] | 30.70 | 99.50 | 5.15 | 0.31 |
| 08 | Orthotropic | 467,356 [0.13] | 13,245 [2.83] | 24.80 | 24.00 | 14.90 | 1.03 |
| 09 | Truss—deck | 2,107,466 [0.58] | 711,839 [33.78] | 52.60 | 98.30 | 16.30 | 0.54 |
| 10 | Truss—thru | 8,033,257 [2.22] | 2,373,843 [29.55] | 72.00 | 113.00 | 24.50 | 0.64 |
| 11 | Arch—deck | 3,381,896 [0.93] | 609,769 [18.03] | 34.30 | 107.00 | 10.50 | 0.32 |
| 12 | Arch—thru | 2,116,869 [0.59] | 212,957 [10.06] | 43.00 | 86.20 | 4.00 | 0.50 |
| 13 | Suspension | 2,166,940 [0.60] | 244,936 [11.30] | 21.00 | 85.00 | 1.75 | 0.25 |
| 14 | Stayed girder | 1,610,130 [0.45] | 0 [0.00] | 0.00 | - | 0.00 | 0.00 |
| 15 | Movable—lift | 722,327 [0.20] | 189,969 [26.30] | 44.00 | 84.20 | 18.00 | 0.52 |
| 16 | Movable—bascule | 2,235,648 [0.62] | 428,509 [19.17] | 37.30 | 75.00 | 9.40 | 0.50 |
| 17 | Movable—swing | 399,369 [0.11] | 145,931 [36.54] | 52.80 | 68.00 | 4.00 | 0.78 |
| 18 | Tunnel | 43,402 [0.01] | 0 [0.00] | 0.00 | - | 0.00 | 0.00 |
| 19 | Culvert (includes frame culverts) | 9,085,912 [2.51] | 200,927 [2.21] | 15.30 | 103.20 | 3.15 | 0.15 |
| 20 | Mixed types (applicable only to approach spans) | 23,822 [0.01] | 429 [1.80] | 7.30 | 85.00 | 0.00 | 0.09 |
| 21 | Segmental box girder | 3,488,268 [0.96] | 143,143 [4.10] | 7.31 | 13.00 | 7.56 | 0.56 |
| 22 | Channel beam | 2,656,802 [0.73] | 323,895 [12.19] | 28.40 | 67.00 | 13.00 | 0.42 |
| 00 | Other | 945,348 [0.26] | 170,164 [18.00] | 54.10 | 100.00 | 16.00 | 0.54 |
| All bridges | 361,774,744 [100.00] | 27,667,950 [7.65] | 38.90 | 104.00 | 14.00 | 0.37 |
* pmax = maximum value of the trendline’s range of backwards increase; † tmax = backwards time span in years of the trendline’s maximum; ‡ pm = median value of the trendline’s range of backwards increase.
© 2018 by the author. Licensee MDPI, Basel, Switzerland. This article is an open access article distributed under the terms and conditions of the Creative Commons Attribution (CC BY) license (http://creativecommons.org/licenses/by/4.0/).
Share and Cite
MDPI and ACS Style
Farhey, D.N. Structural Performances of Bridge Types in the U.S. National Bridge Inventory. Infrastructures 2018, 3, 6. https://0-doi-org.brum.beds.ac.uk/10.3390/infrastructures3010006
AMA Style
Farhey DN. Structural Performances of Bridge Types in the U.S. National Bridge Inventory. Infrastructures. 2018; 3(1):6. https://0-doi-org.brum.beds.ac.uk/10.3390/infrastructures3010006
Chicago/Turabian StyleFarhey, Daniel N. 2018. "Structural Performances of Bridge Types in the U.S. National Bridge Inventory" Infrastructures 3, no. 1: 6. https://0-doi-org.brum.beds.ac.uk/10.3390/infrastructures3010006