1. Introduction
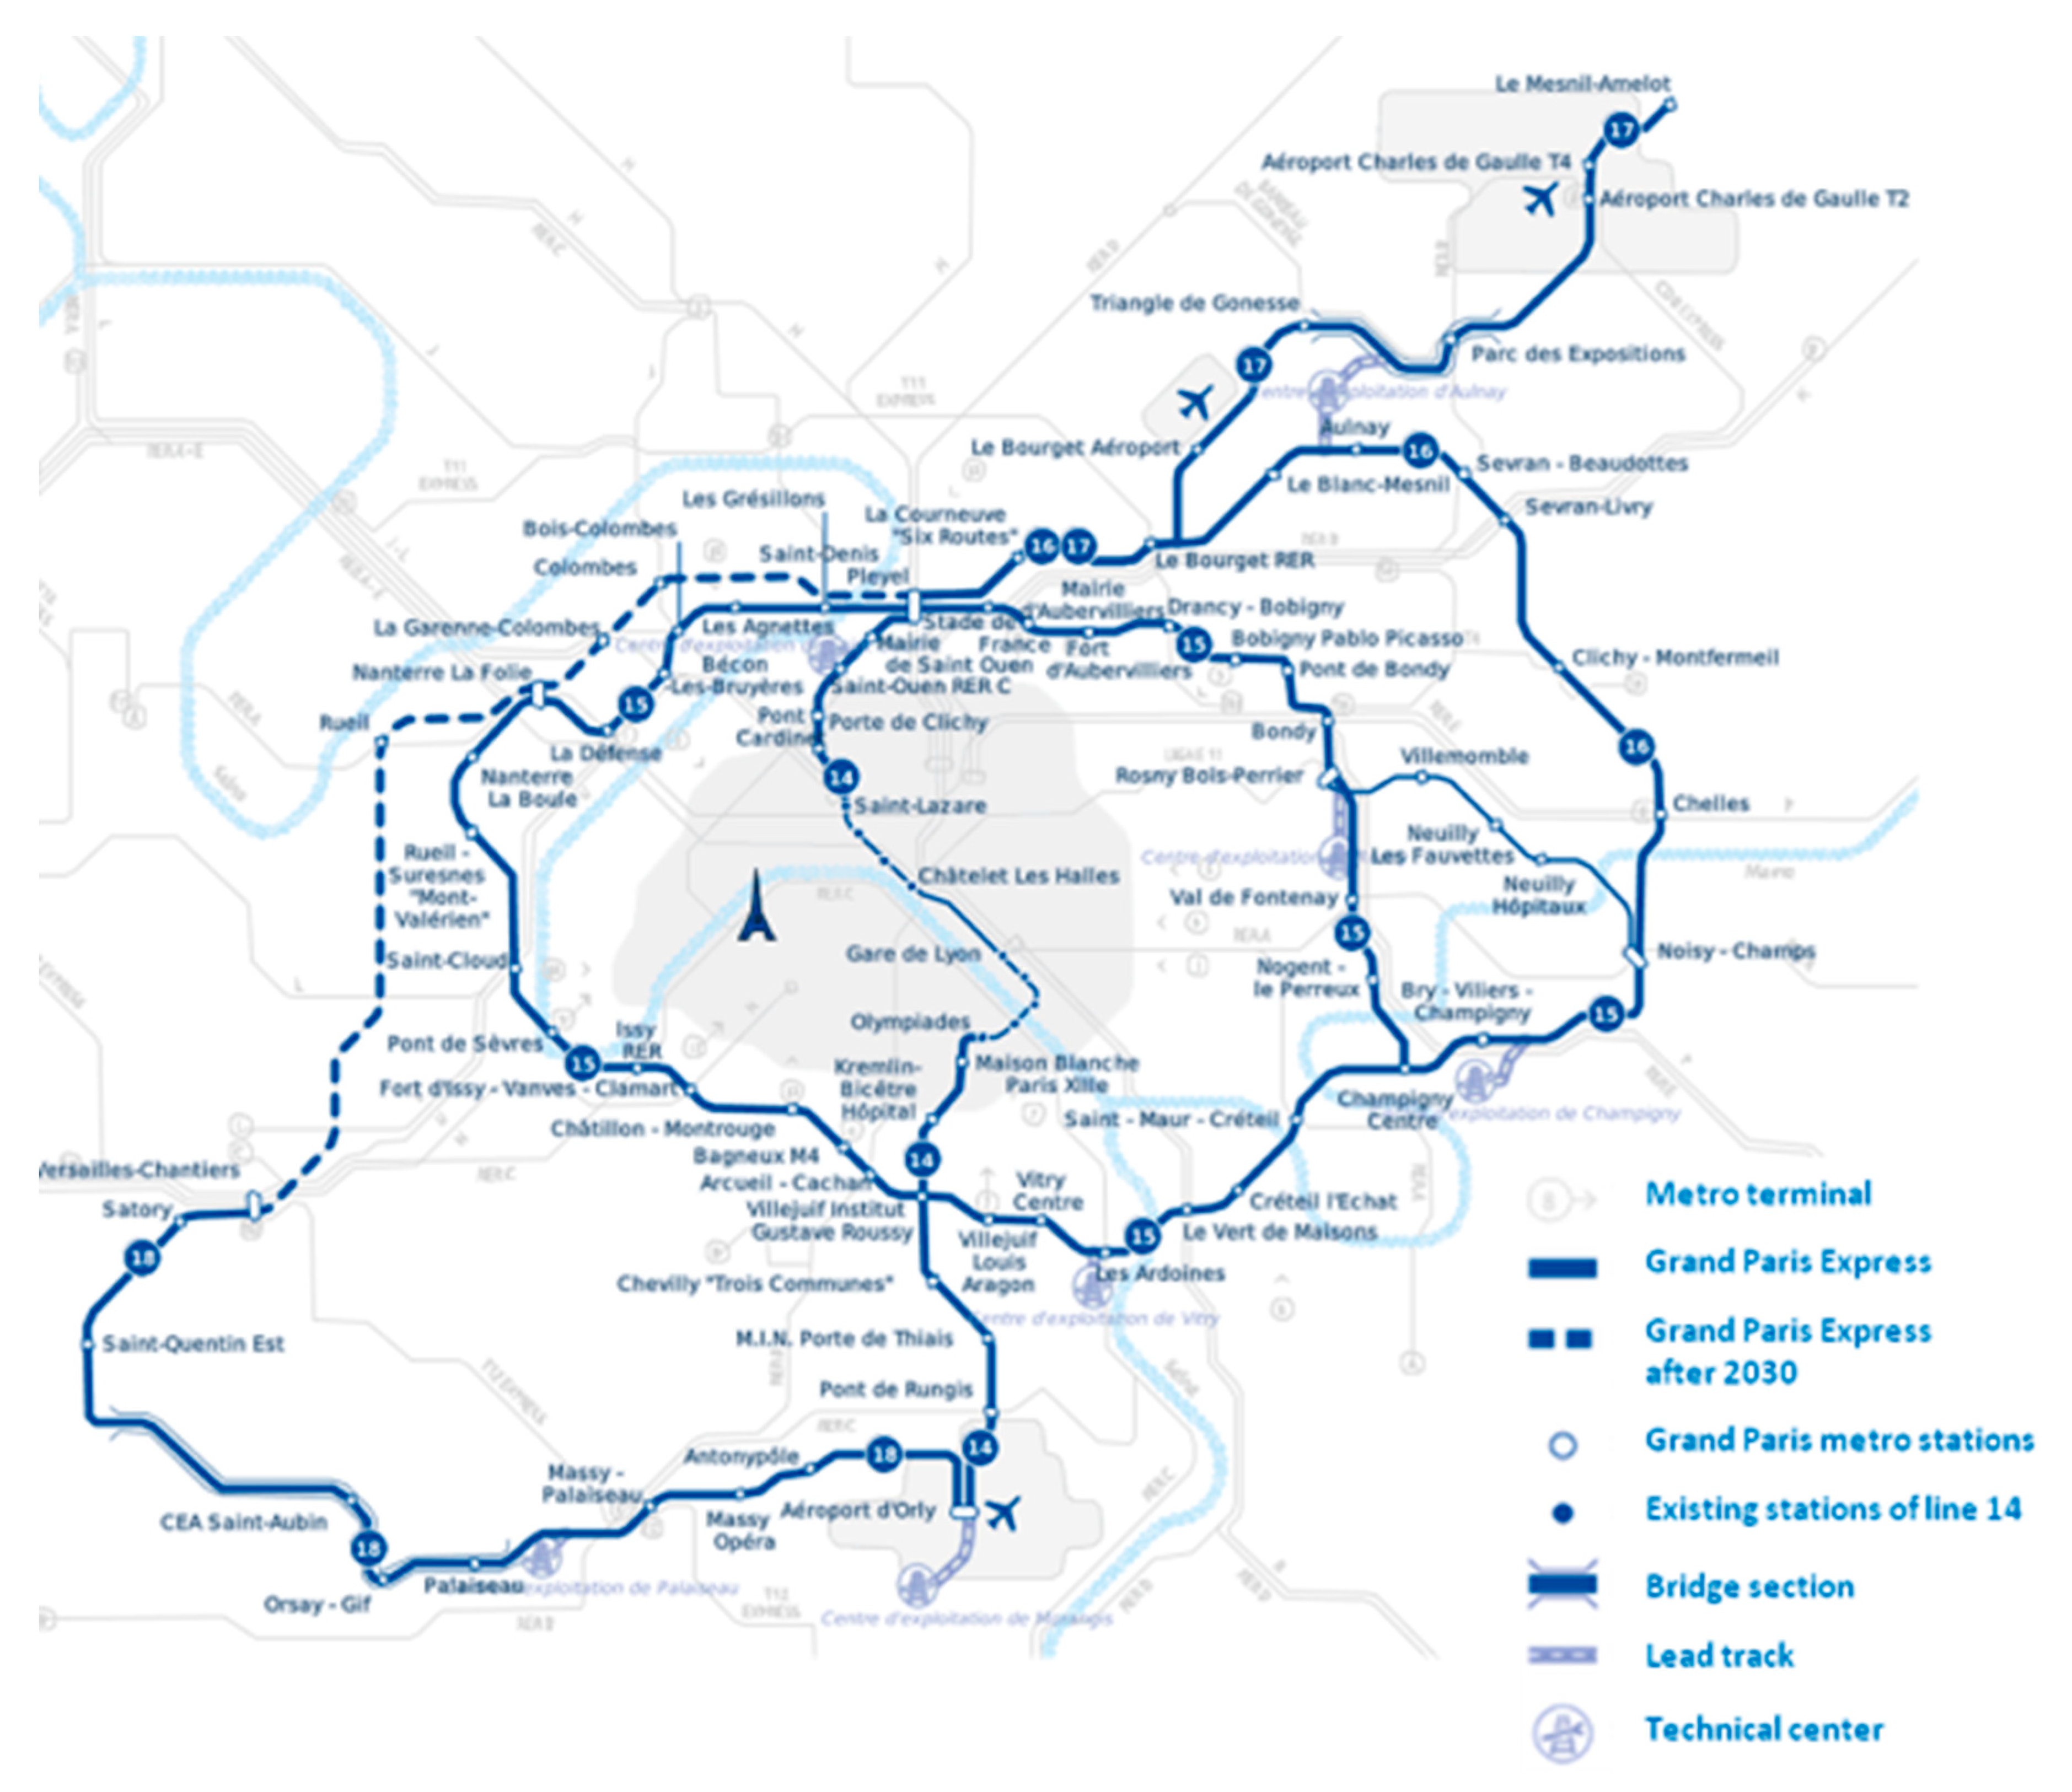
The project “Grand Paris” forecasts the construction of around 200 km of tunnels and 68 new metro stations over the next 15 years. It will lead to an increase of twice the existing length of tunnels and the number of metro stations (
Figure 1, from Société du Grand Paris:
www.societedugrandparis.fr). Within the national strategy to increase the use of renewable energy, the Grand Paris Agency (public entity in charge of the development of new infrastructures) is highly concerned by the development and the use of renewable energy, including the geothermal energy enabled by thermoactive metro stations [
1,
2,
3]. This paper presents some issues related to the integration of this energy in the urban energy system. First, it presents how this integration could be facilitated and optimized using the smart energy technology, and then discusses some geotechnical issues [
4,
5,
6,
7] related to this integration. The assessment of the geothermal potential, the energy demand assessment, the ground investigations, the thermal design and the monitoring are discussed in this paper.
2. Smart Energy System for the Integration of Thermoactive Metro Stations
The thermoactive metro stations provide thermal energy, which could be used for heating and cooling buildings or urban infrastructure. This use requires physical connections, as well as a smart management system.
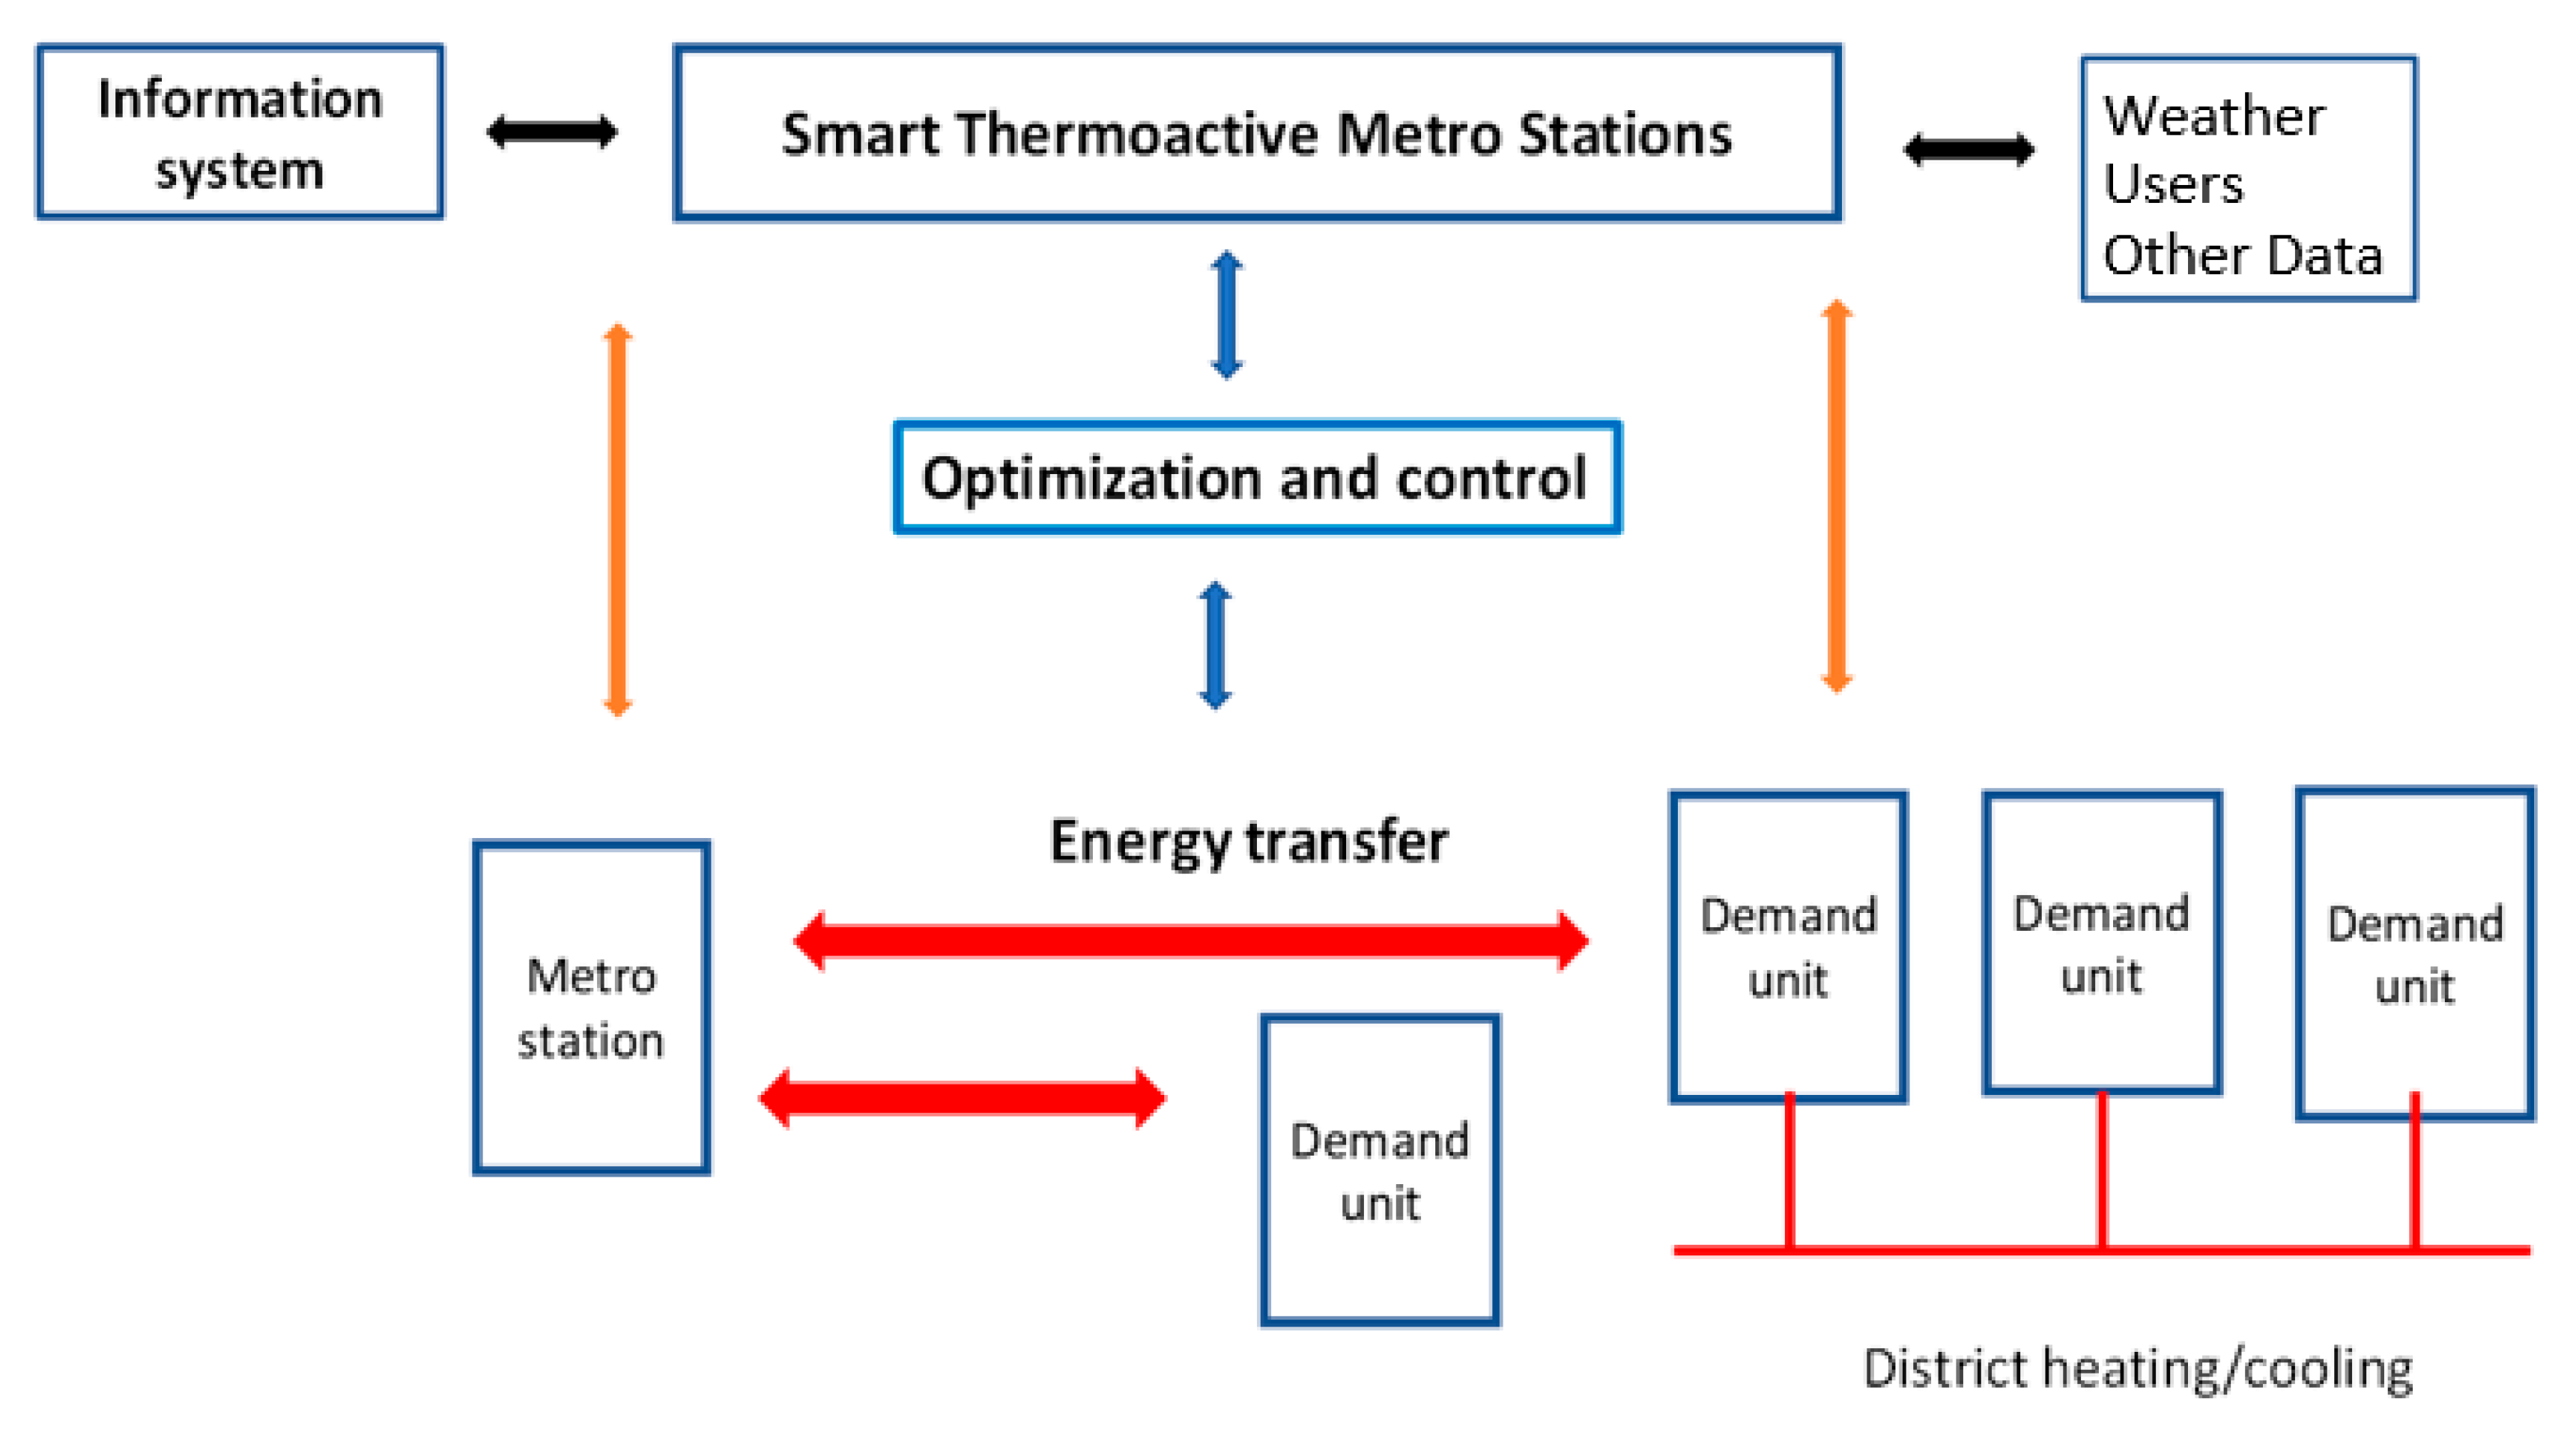
The physical connections are required for the energy transport from the metro station to the demand units (building or infrastructure). For close demand units, a simple heat pump and direct connections can be used. For large-scale use, it is possible to use existing energy infrastructure such as district heating/cooling for the energy transport. In this case, an additional thermal exchanger is installed for the energy transfer between the metro station and the district heating/cooling system.
Figure 2 shows the smart energy system. It controls the energy flux between the metro stations and the demand units. It includes a data communication system, which transfers real-time data of the metro stations (energy source), the demand units, as well as other data such as the weather. The system also collects data from users to improve the quality of the energy supply, as well as the security. The system stores these data in an information system.
Based on real-time and historical data, the system allows for the energy flux to be determined, and controls the technical and regulations process to guarantee this flux. The smart system controls also the operational security of the energy transport.
The optimization of the energy supply is based on the determination of the real-time global demand (heating or cooling), as well as the thermal energy availability, together with the availability of other energy resources. Based on economic criteria as well as environmental impact criteria, the system determines the optimal energy flux.
The system stores all the data concerning the energy demand, the energy availability, and the energy supply, as well as the weather data and the users’ information. These data are used for the development of predictive models that will be used for the preparation of the energy supply program.
The exploitation of thermoactive metro stations raises economic and legal questions, which should first be addressed. The supply of the thermal energy from the metro station to a third party should be authorized by the public authority. In February 2017, the “Grand Paris” Agency has been authorized to exploit or delegate the exploitation of the geothermal energy from underground structures (this is Law No. 2017-257 of 28 February 2017, concerning the status of Paris and metropolitan development). However, this issue is recent, and it still requires economic and political analyses. The installation of this energy innovative system requires huge (around 500 k€) investment in comparison to the expected economic return (around 7–12 years of payback period). This is mainly based on the price of energy, which is still low in France, but the French government grants various subsidies to the investors in renewable energy systems, such as geothermal structures.
3. Thermal Design of Thermoactive Metro Stations
In this section, an example of thermal design for thermoactive metro station step-by-step is presented. Thus, an approach to assess the geothermal potential is described, followed by the energy demand assessment to determine the thermal solicitation of the building. Moreover, some details on ground investigation and thermal design procedure are presented, followed by the application on metro station.
3.1. Assessment of the Geothermal Potential
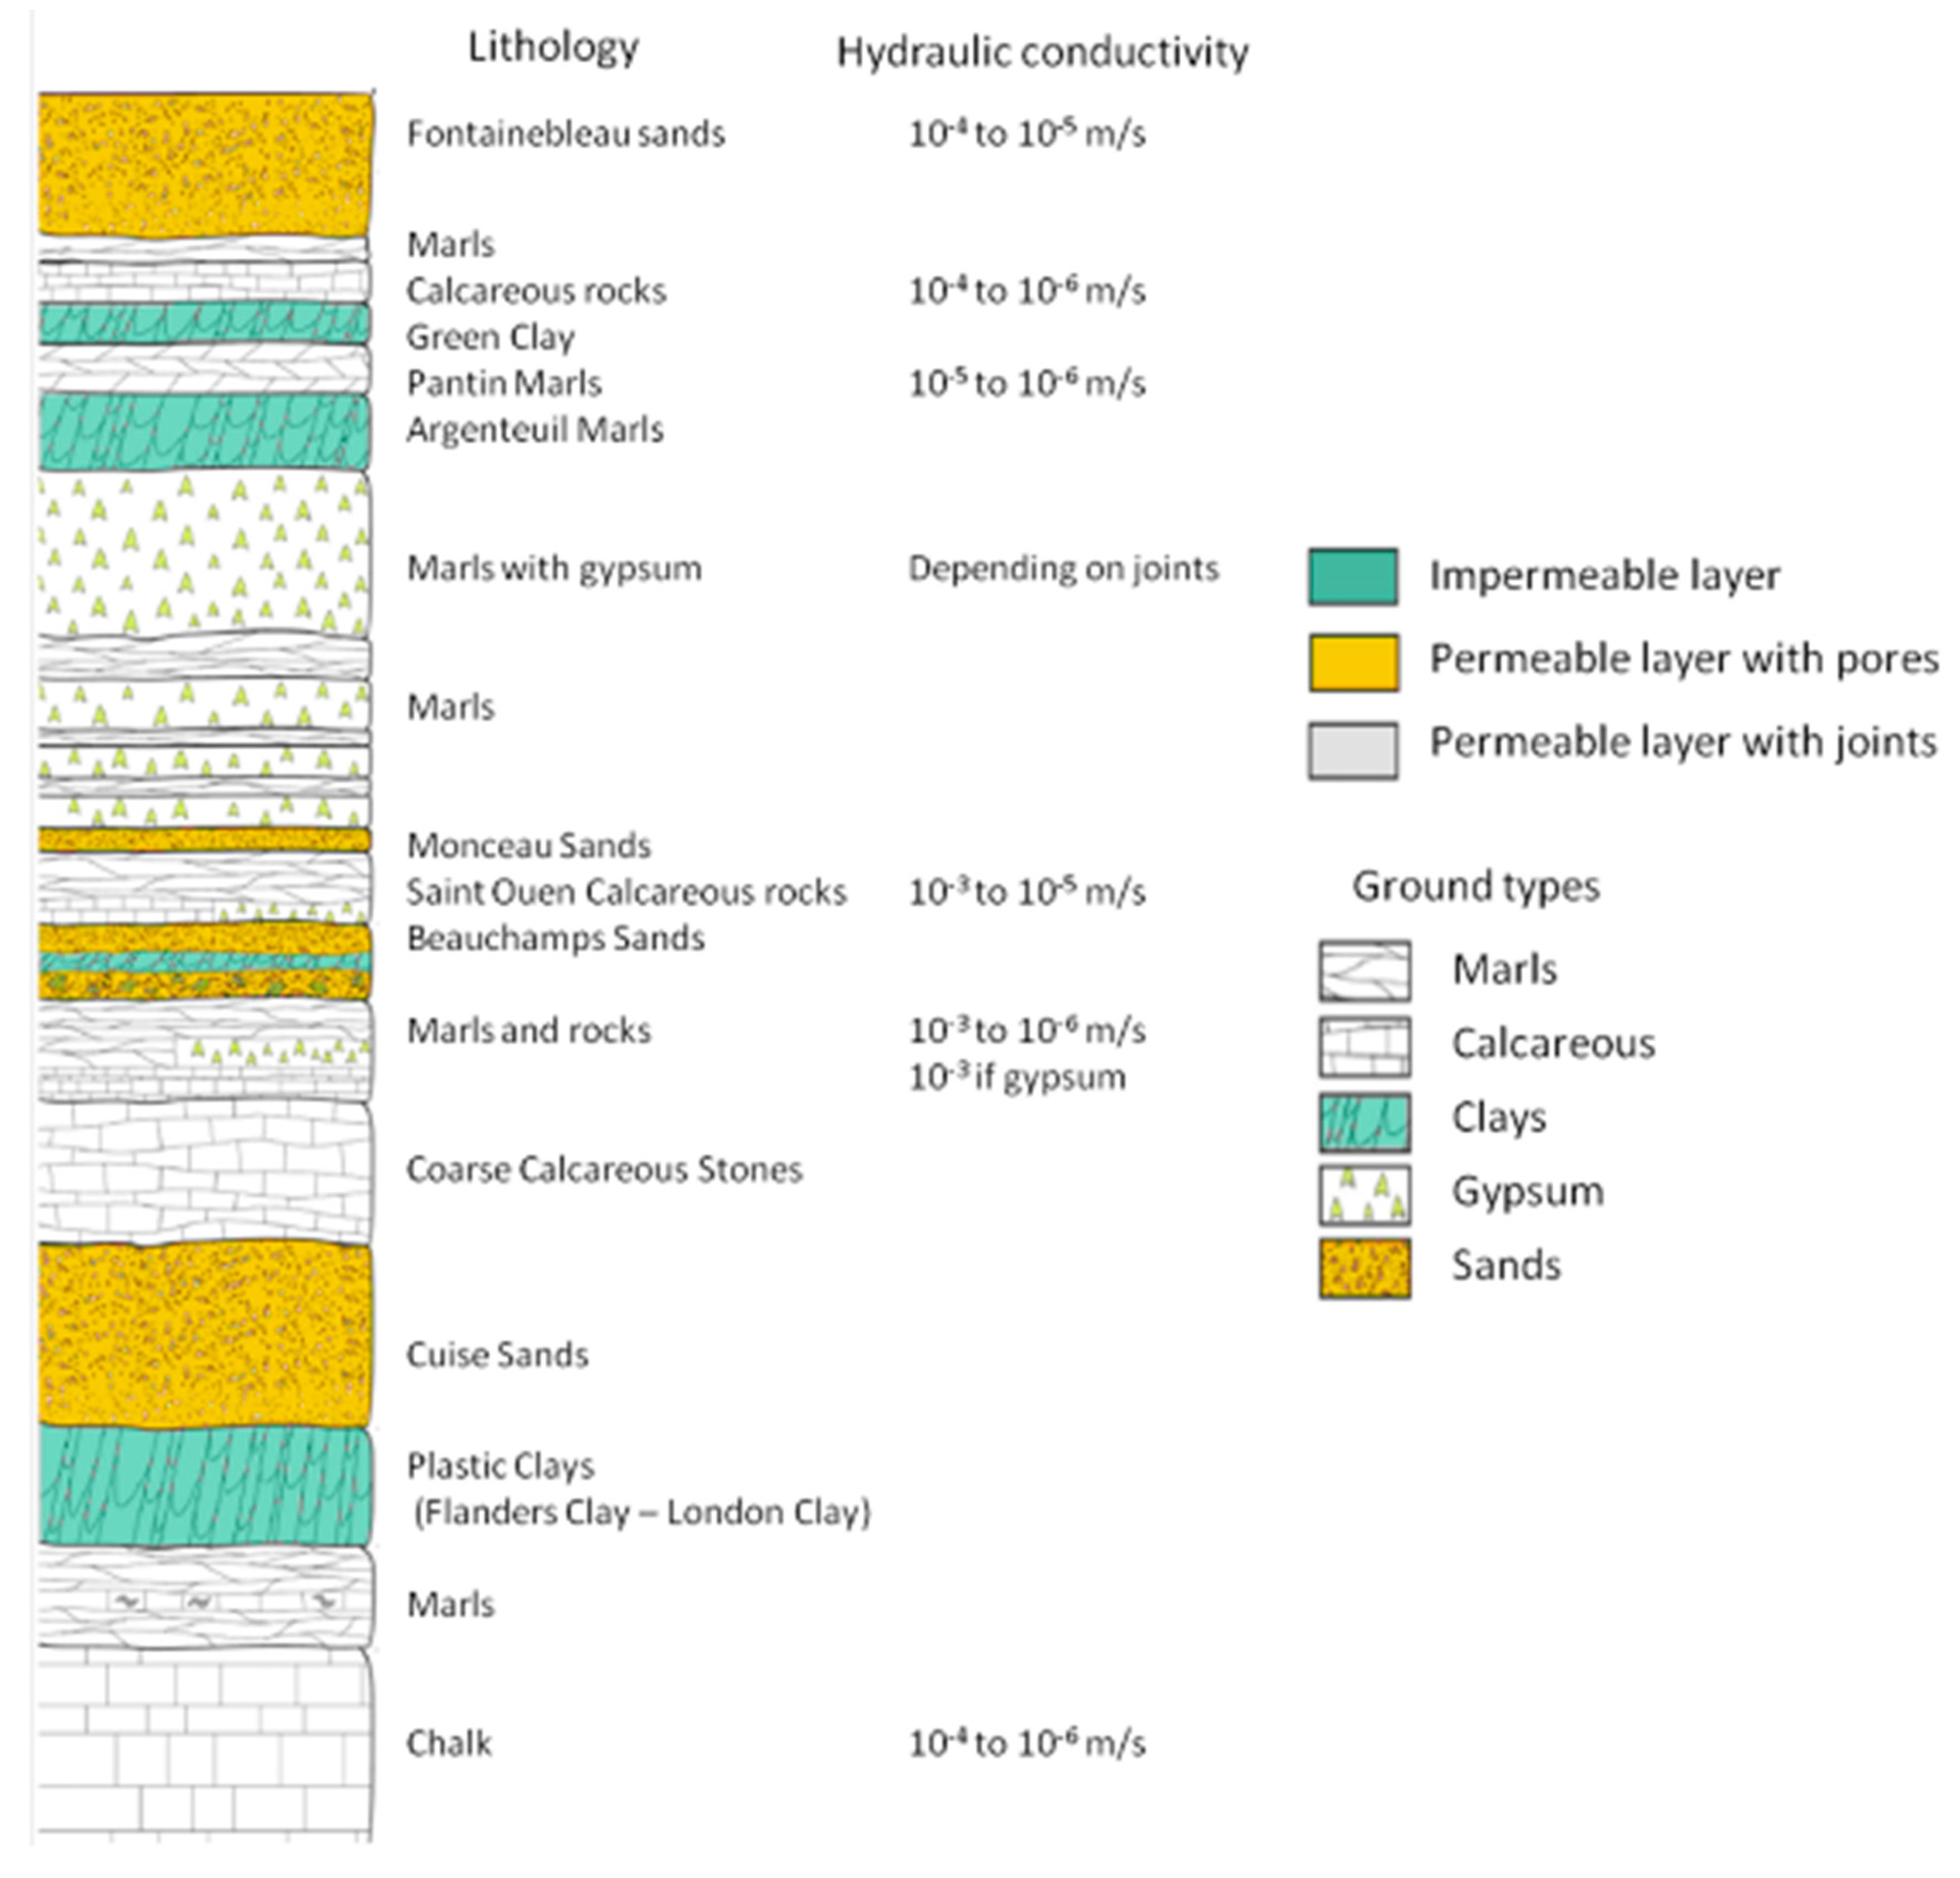
Assessment of the geothermal potential is based on hydrogeological analysis and thermal properties analysis of the different geological materials. Considering the old history of Paris, and its large degree of urbanization, its underground is well known. It includes several sedimentary layers that are set during the Mesozoic and Cenozoic eras with various properties in terms of porosity, water content, hydraulic conductivity, thermal conductivity, deformability, and strength (
Figure 3).
To choose the most appropriate sites for the geothermal exploitation, the dimensions of the metro station, and especially its depth are of importance. Indeed, this kind of structure potentially intersect many layers with different thermal and hydraulic properties, as well as groundwater and rivers (where some of them are now buried with the city expansion). Criteria based on the groundwater flow velocity, the ground thermal conductivity, and the energy balance are available for this selection [
1,
8,
9,
10,
11].
Considering the Paris region, until now, few ground layers have been used for the exploitation of thermoactive geostructures, due to the poor development of reliable thermal design procedures and feedback. Indeed, many layers are marls, clay, or with a lot of fine grains. This kind of material shows poor thermal properties and low hydraulic conductivity. Inversely, there is some calcareous rocks and sand layers with better thermal and hydraulic properties. Due to the hydrogeology of the region, most of these layers are saturated, and some of them include groundwater. Thus, only layers with aquifer are considered as appropriate for geothermal systems: Saint Ouen Calcareous rocks and Beauchamps sands, marls, rocks, and calcareous stones, Cuise sands and chalk. Ground layers such as Pantin marls and Argenteuil marls can be considered as appropriate but the geothermal potential is reduced, because of the lack of aquifer.
3.2. Energy Demand Assessment
Analysis of the exploitation of the geothermal energy should consider both the ground geothermal potential as well as the energy demand [
8,
9,
10,
12,
13]. Indeed, the energy demand has a strong influence on the thermal response of the ground. An absence of balance between heating and cooling on an annual cycle can cause a thermal drift into the ground, which lead to a decrease of the thermal performance after some years of geothermal exploitation. According to the thermal and hydraulic properties, this thermal drift can reach a steady state and keep the system in a good range of temperature and performance. That is why, when only either heating or cooling is needed or in case of high unbalanced energy demand, thermal resources must be well estimated by using appropriate ground investigations.
Heating and cooling demand can be assessed according to the use of buildings, which will be supplied by the geothermal energy (commercial, residential, offices, etc.). As mentioned earlier, the use of smart technology with a smart monitoring system should help the designer to assess the buildings’ energy demand in the next years. In the Paris region, offices require both heating and cooling, whereas residential buildings require only heating. As such, it is straightforward to point out that office buildings may have a relatively balanced energy needs, and they are thus most appropriate to the use of geothermal energy. When only residential buildings are located near metro stations, complementary demand for cooling should be explored. In this case, the cooling demand of the technical installations of the metro stations could be used for the energy global balance. Connections with smart district heating/cooling systems also provide good opportunity to ensure the energy balance.
Regarding the energy demand of buildings, many factors can affect them, such as climate or the thermal regulations of the country or the region [
14,
15,
16], and thus, it appears to be difficult to provide clear conclusions about selection criteria regarding only the type of buildings to which the geothermal energy will be supplied. According to the new French thermal regulations, the heating and cooling demands of office buildings lie between 20 and 50 kWh/m
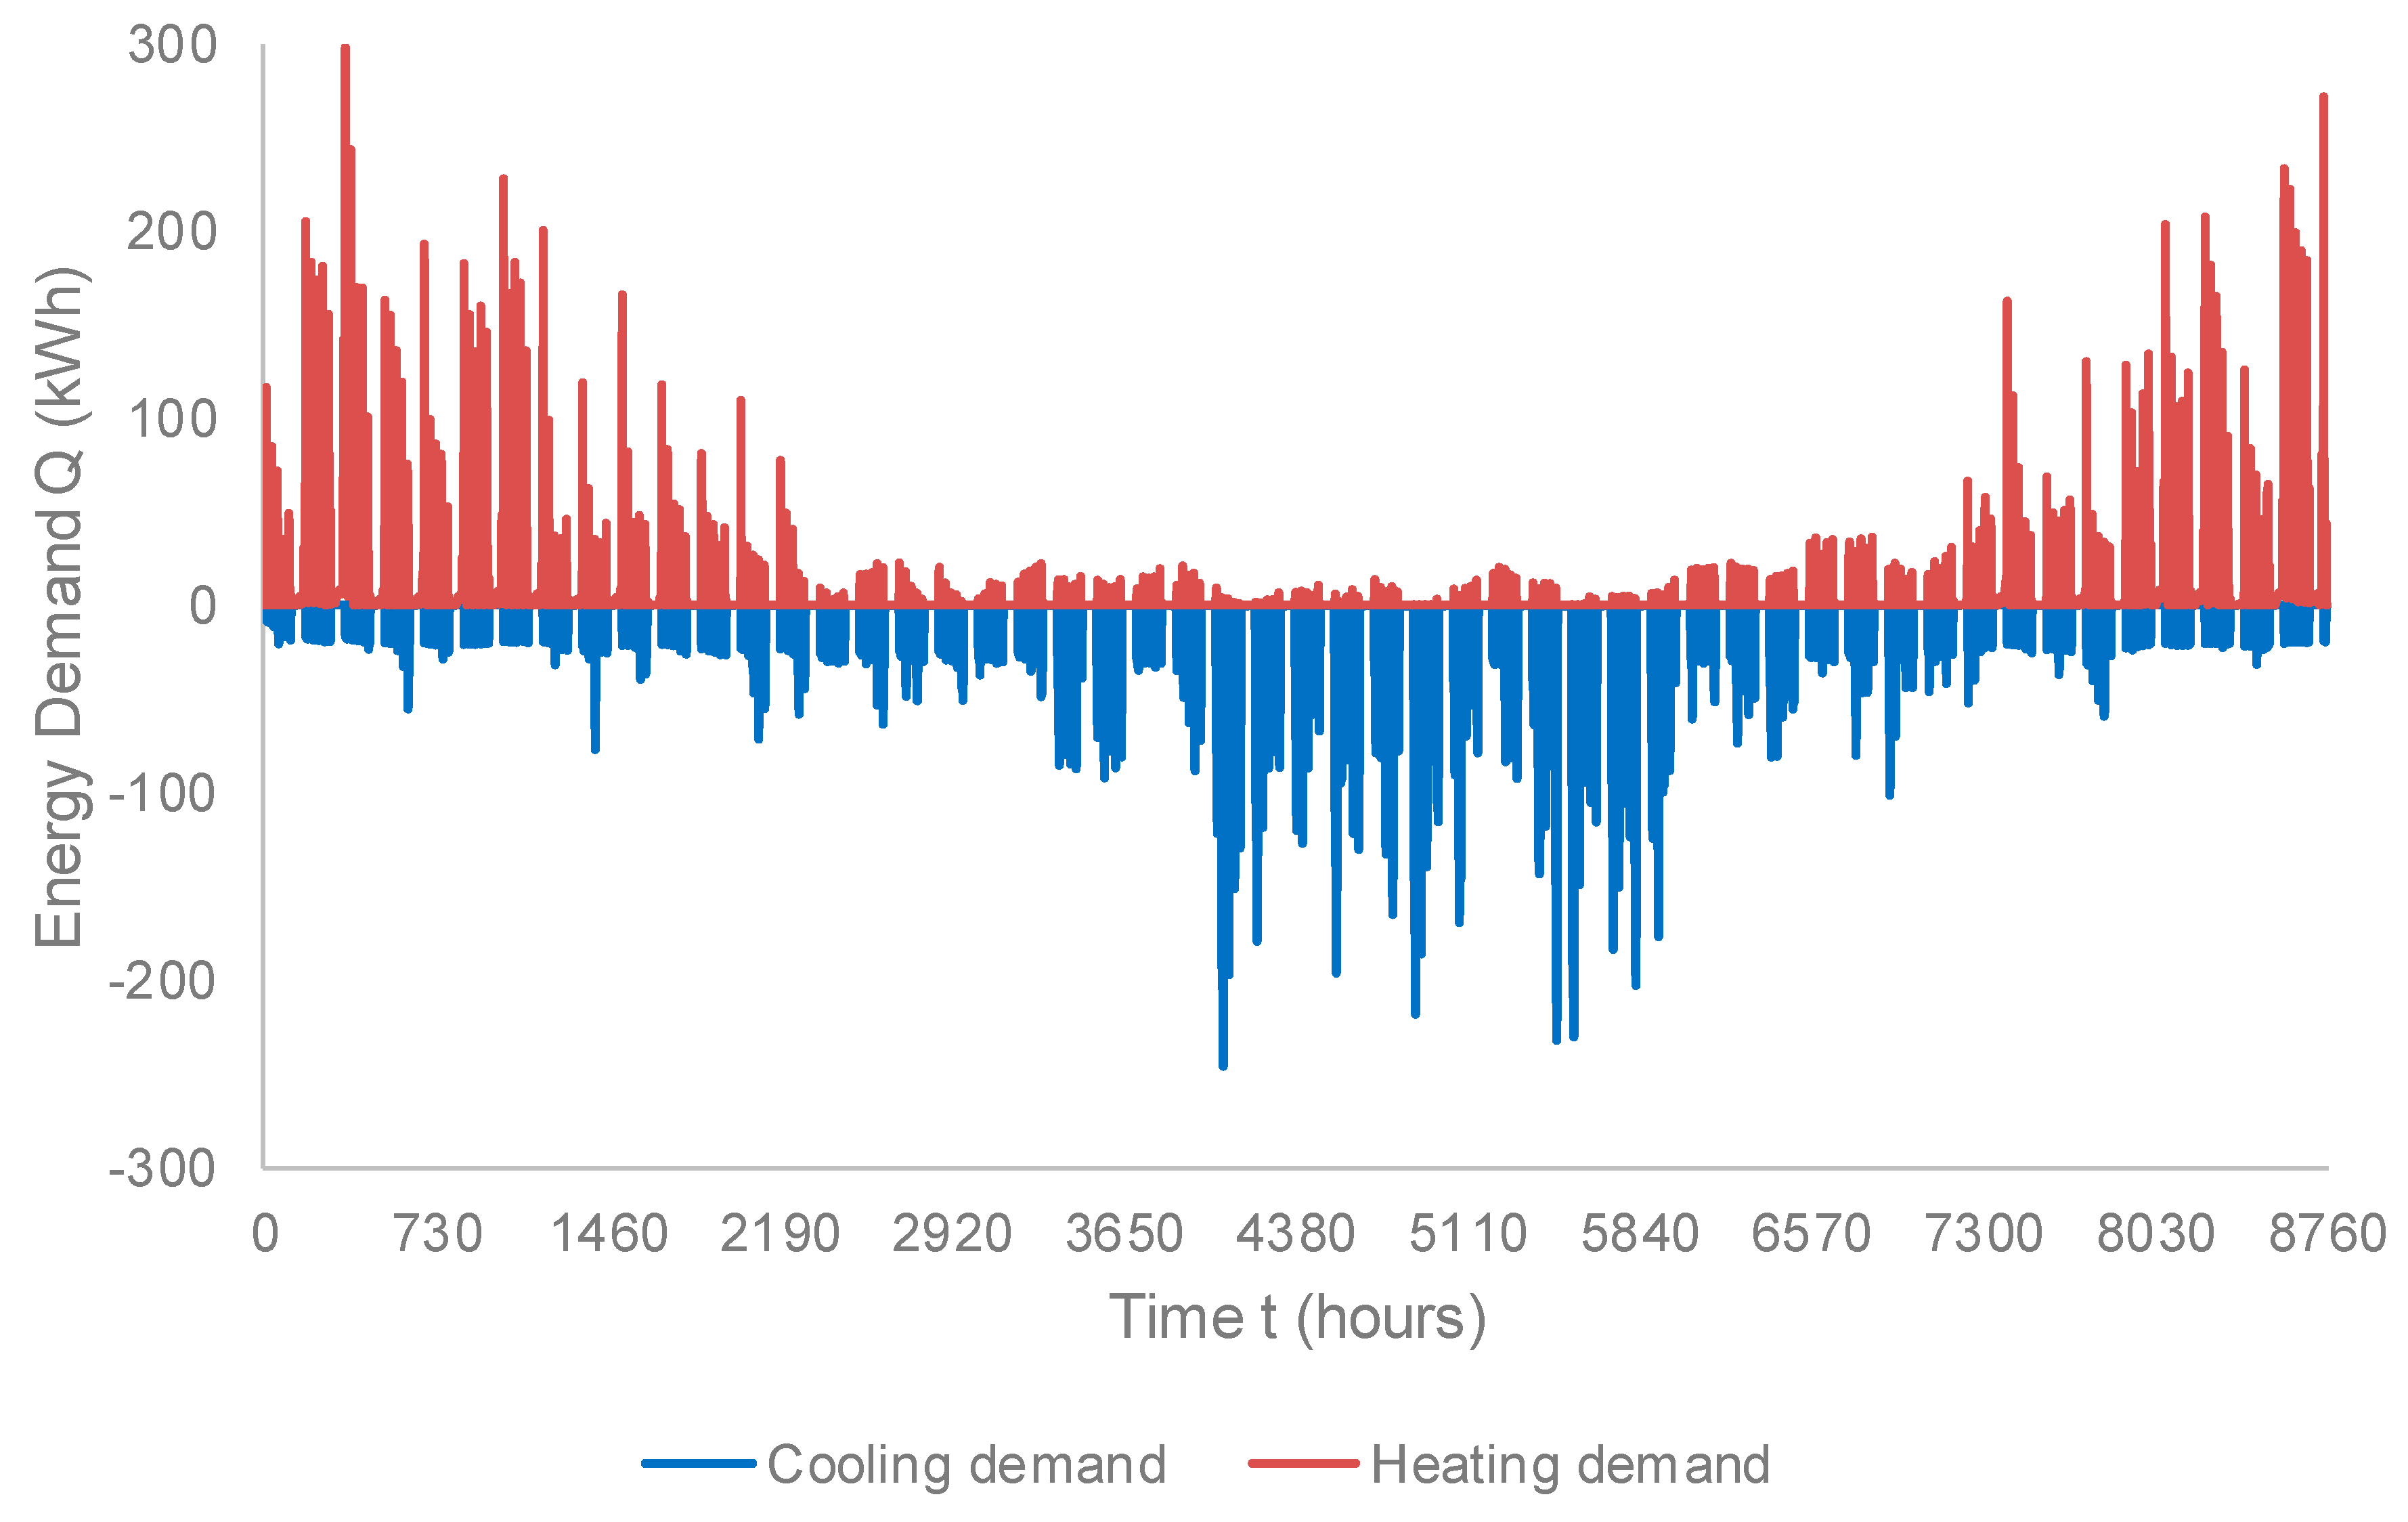
2/year. It is important to note that thermal response of the ground is strongly linked to the thermal solicitations. Several operating alternatives should be defined to consider a wide range of usage, keeping in mind that general knowledge on the energy demands of buildings at shorter time steps (from monthly to daily and hourly steps) are improving during the project. The aim of this stage in the project is to collect data such as that presented in
Figure 4 for a tertiary building in the Paris region, giving hourly energy demand. In this example, the building is for tertiary activities. The offices are distributed on seven floors for a total surface of 8000 m
2. The shape materials are composed of concrete with insulating materials.
3.3. Ground Investigations
In situ and laboratory tests must be performed to characterize the ground thermal properties: the thermal conductivity and the thermal capacity that governs the thermal behaviour. In situ and laboratory tests have their benefits and drawbacks [
17]. Laboratory tests such as thermal needle probe [
18] permit the measurements of thermal properties on many samples that provide a precise image of the spatial distribution of the ground thermal properties. The main problem is related to the quality of the samples and the sounding techniques providing undisturbed samples. As it is always difficult to ensure a sufficient sample quality, in situ tests as thermal response tests are useful [
19]. As these data are measured at a large scale, they must be carefully analysed, and several issues must be addressed, such as the influence of the groundwater flow and the fact that the thermal response tests can interact with different ground layers [
20,
21,
22,
23]. At the ground surface, seasonal variation could also affect the responses of a thermal response test [
24]. Analyses should be performed to provide a reliable comparison between in situ measured values and laboratory values. Moreover, analytical solutions based on the correlation between water content, density, and mineralogy can be used to assess the ground thermal properties [
25,
26,
27,
28,
29,
30]. This kind of analysis cannot be allowed without tests.
The assessment of the hydraulic properties should be considered, especially for pile groups, diaphragm walls, and tunnels, where the interactions between the energy geostructure and the ground are strong. Indeed, these types of underground structures can modify the natural groundwater [
31]. This modification in the groundwater flow could largely influence the geothermal potential and performances [
32]. For hydraulic properties, in situ tests and geological considerations usually permit a good understanding of the groundwater flow, especially the hydraulic gradient and the hydraulic ground properties.
3.4. Thermal Design
3.4.1. Procedure
Thermal design aims at the verification of the efficiency of the geothermal system after some years of exploitation [
33], considering both the conduction and advection between the ground and the thermoactive geostructure. It requires assumptions in terms of boundary conditions (
Table 1). In the case of metro stations, convective boundaries can be used to simulate the interactions between the diaphragm walls and the metro stations indoors. This will be addressed in more detail on
Section 3.4.2, with the description of an application to a Grand Paris metro station.
The contribution of advection is important for the thermal design, because it could be subjected to a high variability depending on the groundwater flow velocity [
34]. Based on the equation of energy conservation, it is possible to exhibit the contribution of conduction and advection. A parametric study on hydraulic conductivity can give some information about the advection contribution. These calculations can be used to identify the zones of high heat exchange and of energy storage. This analysis can lead to assess an optimal position and number of heat exchanger tubes.
Thus, according to the thermal solicitation and to the hydrogeological context, some parts of the metro station are more productive than others.
The thermal solicitation is determined from the energy demand of a building during at least 30 years of its lifecycle. Several kinds of solicitations could be considered, to reproduce the thermal cyclic loading: crenel with or without rest phase, sinusoidal, and real-time history. Regarding the rest period, its impact during the night or the weekend can be simulated, and shows that the performances of the system are highly improved. Several numerical techniques can be performed in order to apply the thermal solicitations: by means of an imposed power or an imposed temperature.
The thermal power exchanged by the system is usually assessed by the following relationship:
, where
is the heat exchange (W),
is the mass flow rate of the heat carrier fluid (kg/s),
is the specific heat of the flowing fluid (J/kg/K), and
and
(K) are the temperatures of the inlet and outlet fluid, respectively. As a first approach, it can be considered appropriate to apply a homogeneous temperature into the diaphragm wall, as the difference between the inlet and outlet temperature is usually less than 5 degrees [
35]. However, this conservative approach leads to approximate the heat exchange and the ground reaction. Indeed, the inlet fluid temperature is controlled by the heat pump to fulfil an energy demand. According to the energy demand, the heat pump increases or decreases this temperature to keep the right difference of temperature between the inlet and outlet. The second approach consists of directly applying heat power in the system (i.e., the geostructure) by considering the energy demand of the building or the thermal power
Qtotal exchanged by the heat exchangers’ tubes. The variation of the exchanged thermal power values may be uniform into the diaphragm walls, or calculated by considering the mass flow rate of the heat carrier fluid (in this case, the exchanged thermal power can vary along the tubes into the diaphragm walls).
3.4.2. Application to a Grand Paris Metro Station
In this section, a typical case of a Grand Paris metro station is presented, and it is related to the thermal sustainability and the long-term performance of the system. The results are based on fully coupled thermo-hydraulic calculations to consider the effect of groundwater flow. Thus, the system is governed by the following equation (Equation (1)):
where
is the effective specific heat (J/m
3·K),
the temperature (K),
the conductive heat flux (W/m²),
the advective heat flux, and
the production of intern volumetric heat (W/m
3), which is usually neglected regarding the low depth of the structures and the geology. This equation represents the energy balance of the system with the contribution of conduction and advection. Moreover, the groundwater flow is governed by the Darcy law (Equation (2)):
where
is the Darcy velocity (m/s),
is the hydraulic conductivity (m/s), and
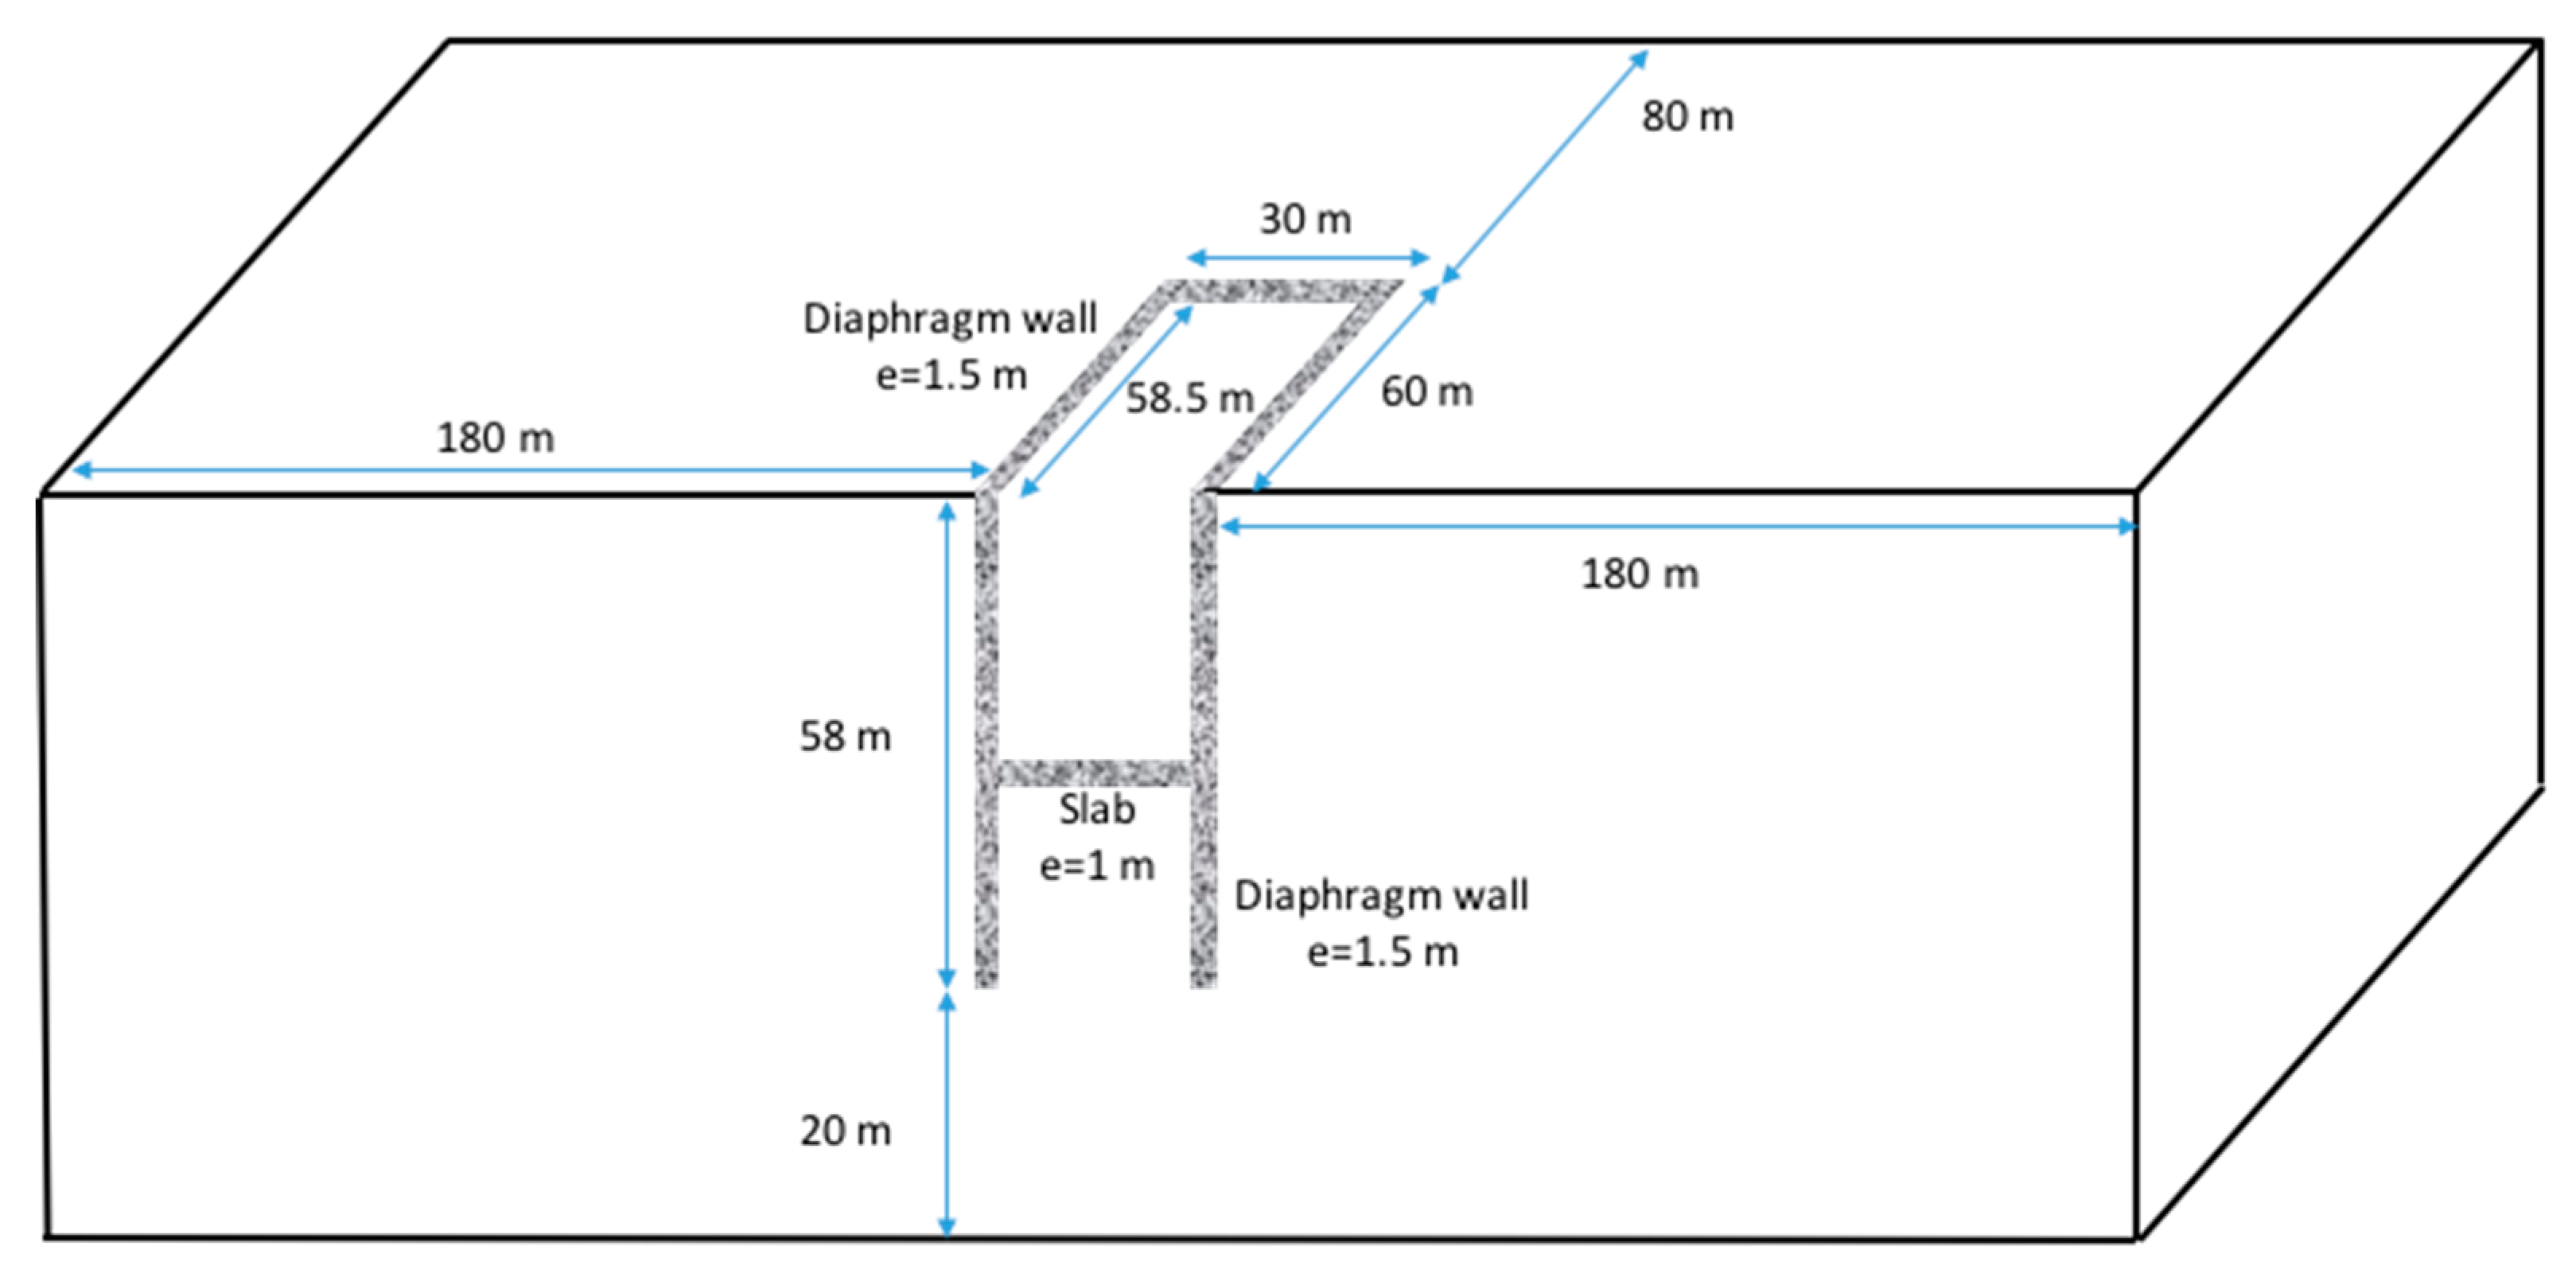
is the hydraulic gradient (m/m). In this model, the concrete is impermeable and the groundwater flow is at a steady state. The geometry and the geology, including the thermo-hydraulic properties of the ground are described in
Table 2 and
Table 3. Owing to the symmetry of the problem, only a half of the geometry is considered (
Figure 5). It is important to note that only diaphragm walls are used as thermoactive geostructures. Moreover, the dimensions and the kinetics of the heat exchanger tubes make the computation time with a model at building scale incompatible for engineering process. That is why the thermal solicitation is directly applied to the nodes where the tubes are theoretically located. It is considered that the heat pump decreases or increases the fluid temperature related to the thermal solicitation.
The calculations are driven with the software FLAC3D [
36]. The finite difference mesh is composed by 201,600 hexahedral zones and 209,329 nodes. The mesh is refined in the vicinity of the diaphragm wall to account for the high heat exchanges at the soil–structure interface, and near the surface, because of the seasonal thermal variations. Before thermal activation, the model must be initialised according to the hydraulic and thermal boundary conditions (especially to consider the seasonal temperature variations in the ground).
The boundary conditions for both thermal and hydraulic aspects are defined in
Table 4. The distances between the boundaries of the numerical model and the diaphragm walls need to be sufficiently large to avoid any interaction. For example, when considering advection effects, the thermal plume around the metro stations shall not interfere with the limits of the model. Moreover, to perform a more realistic calculation a convective heat flux boundary condition between the internal air of the metro station and the diaphragms wall can be added.
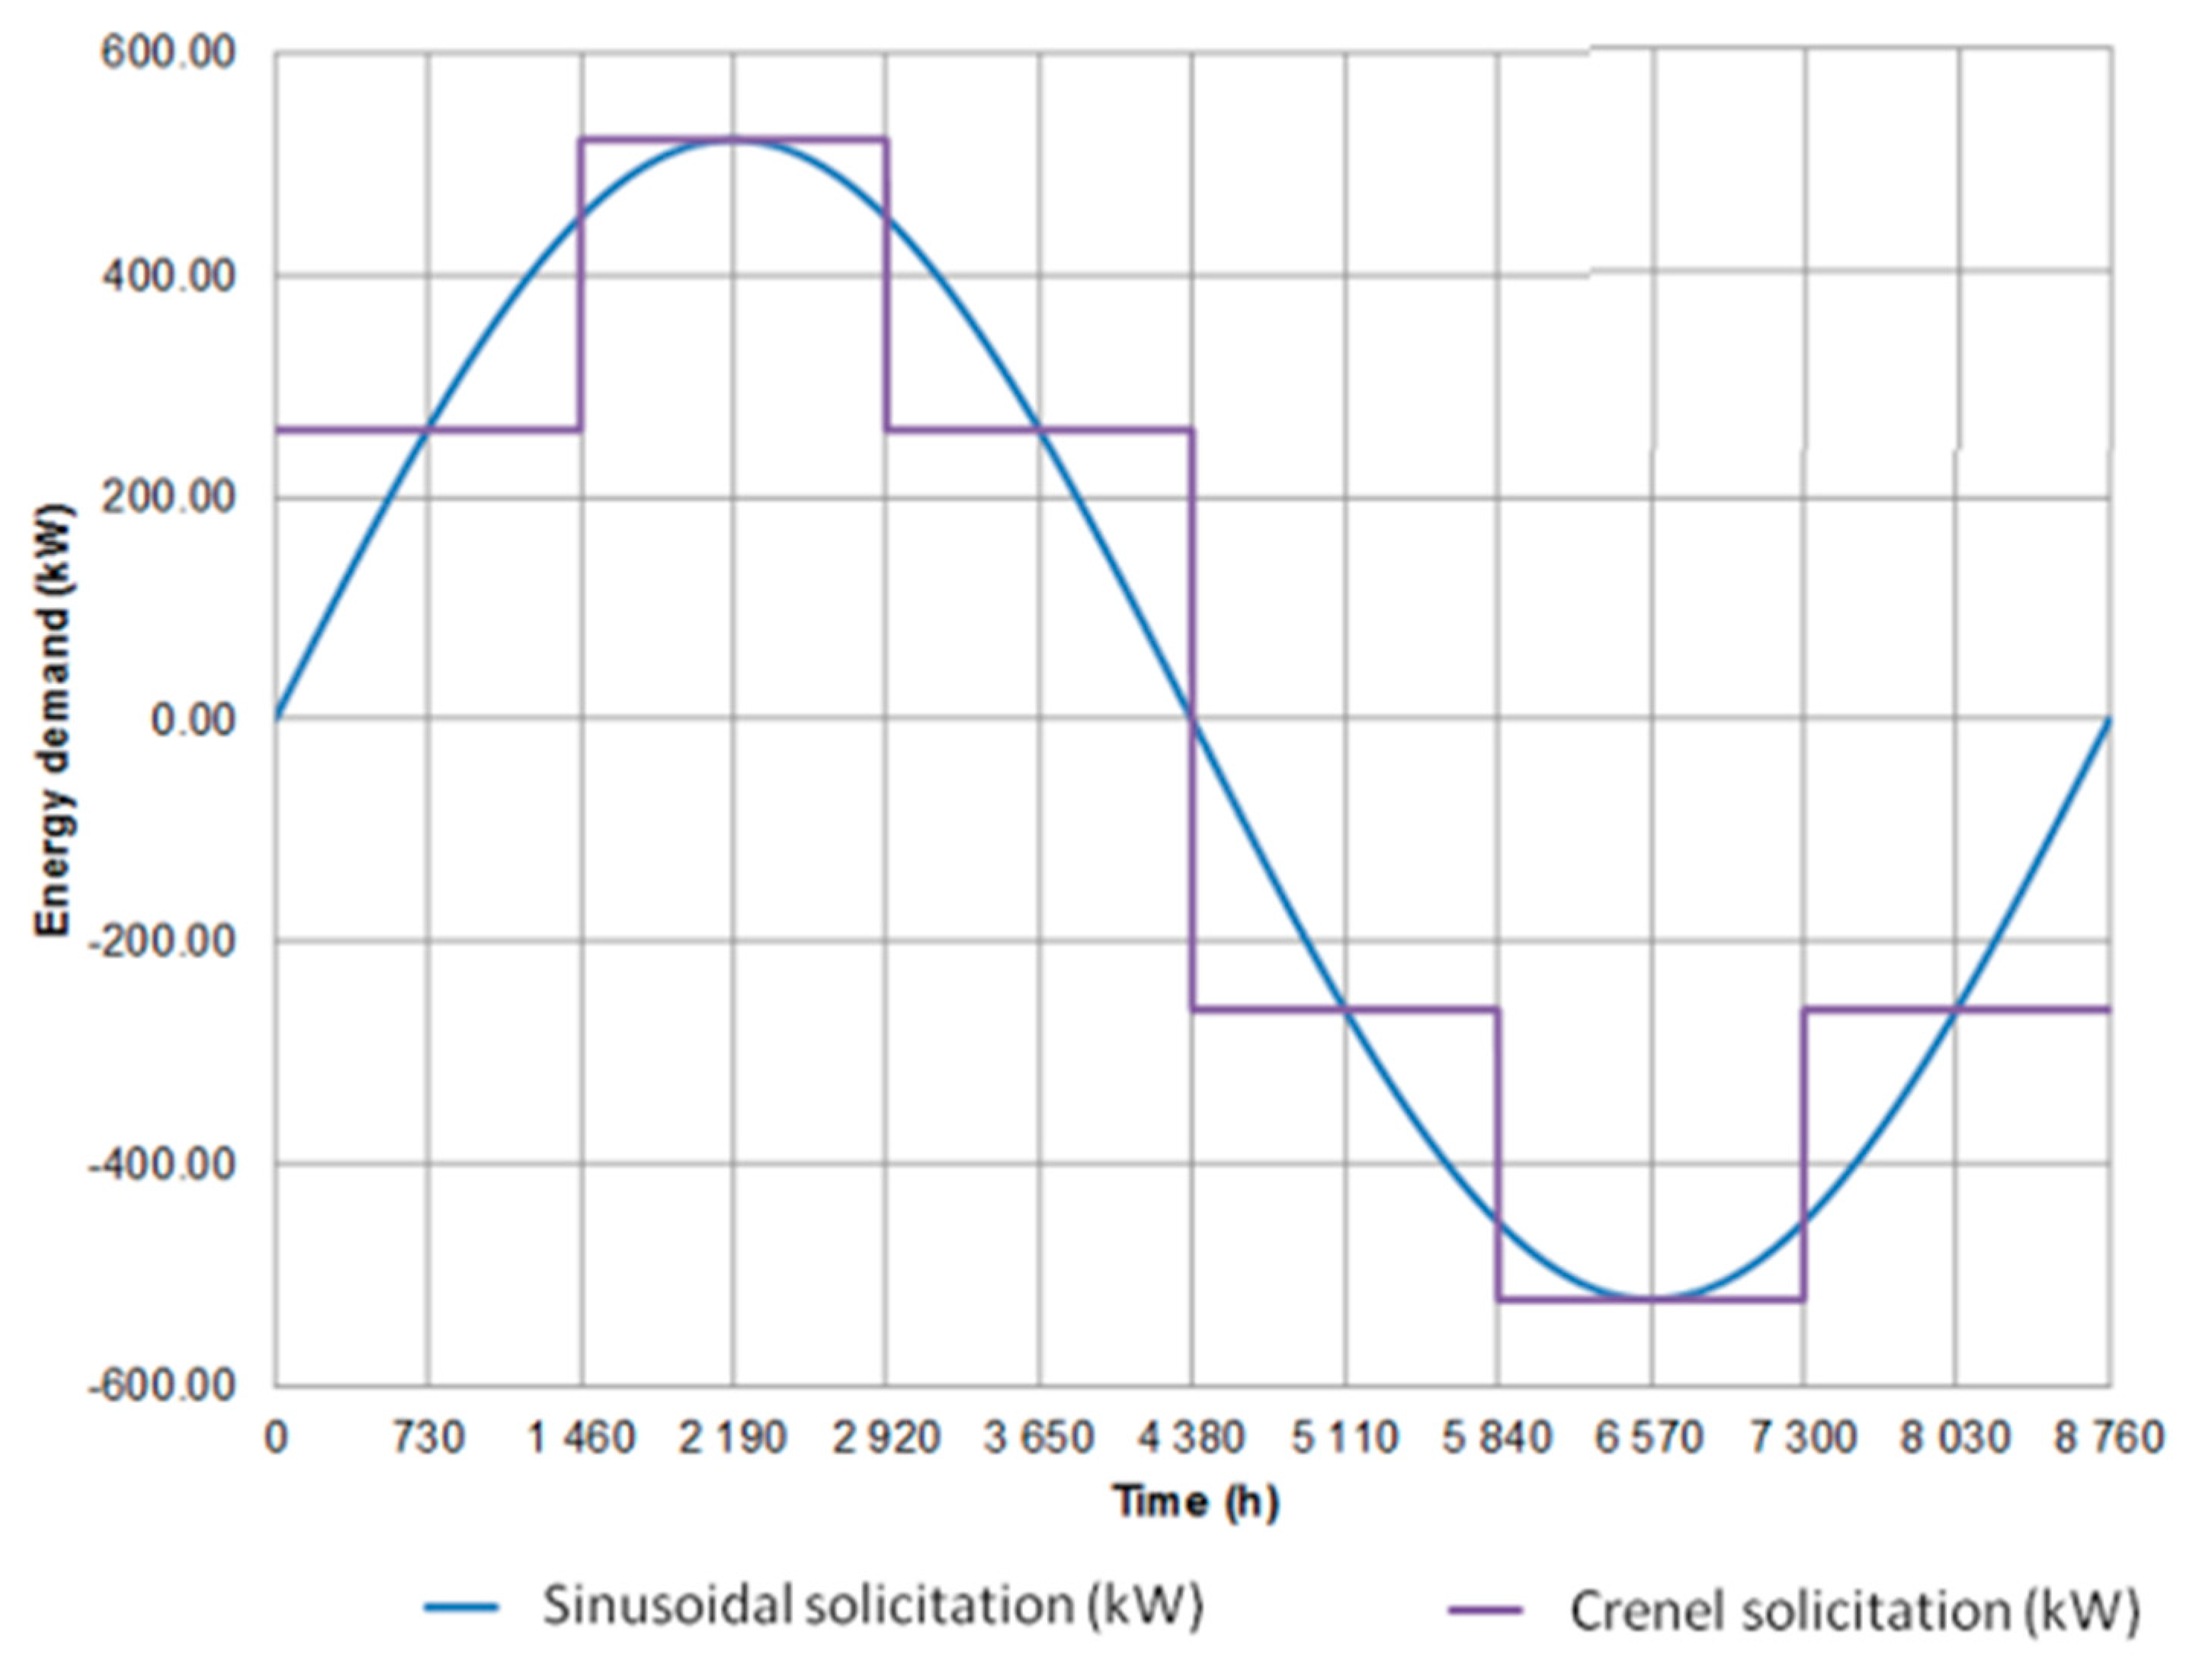
The choice of the most appropriate thermal solicitation depends on the current design stage. For the first stage, the maximum peak of energy demand can be assessed by the means of basic assumptions. For example, some authors [
1,
11] provide preliminary design heat fluxes for thermoactive geostructures. In this study case, the peak is considered to be equal to 522 kW (corresponding to an average of 25 W/m
2 for the metro stations). In a second step, several types of thermal signals of a one-year period must be compared (
Figure 6): a signal as a crenel can be used, but this may lead to conservative results, whereas a sinusoidal signal will provide more optimistic results. This kind of signal accounts for the thermal inertia into the diaphragm wall due to the thermal diffusion and the real-time energy demand of the building. Based on these signals, homogeneous thermal power values are considered at the location of the heat exchanger tubes and the thermal solicitation is repeated year after year.
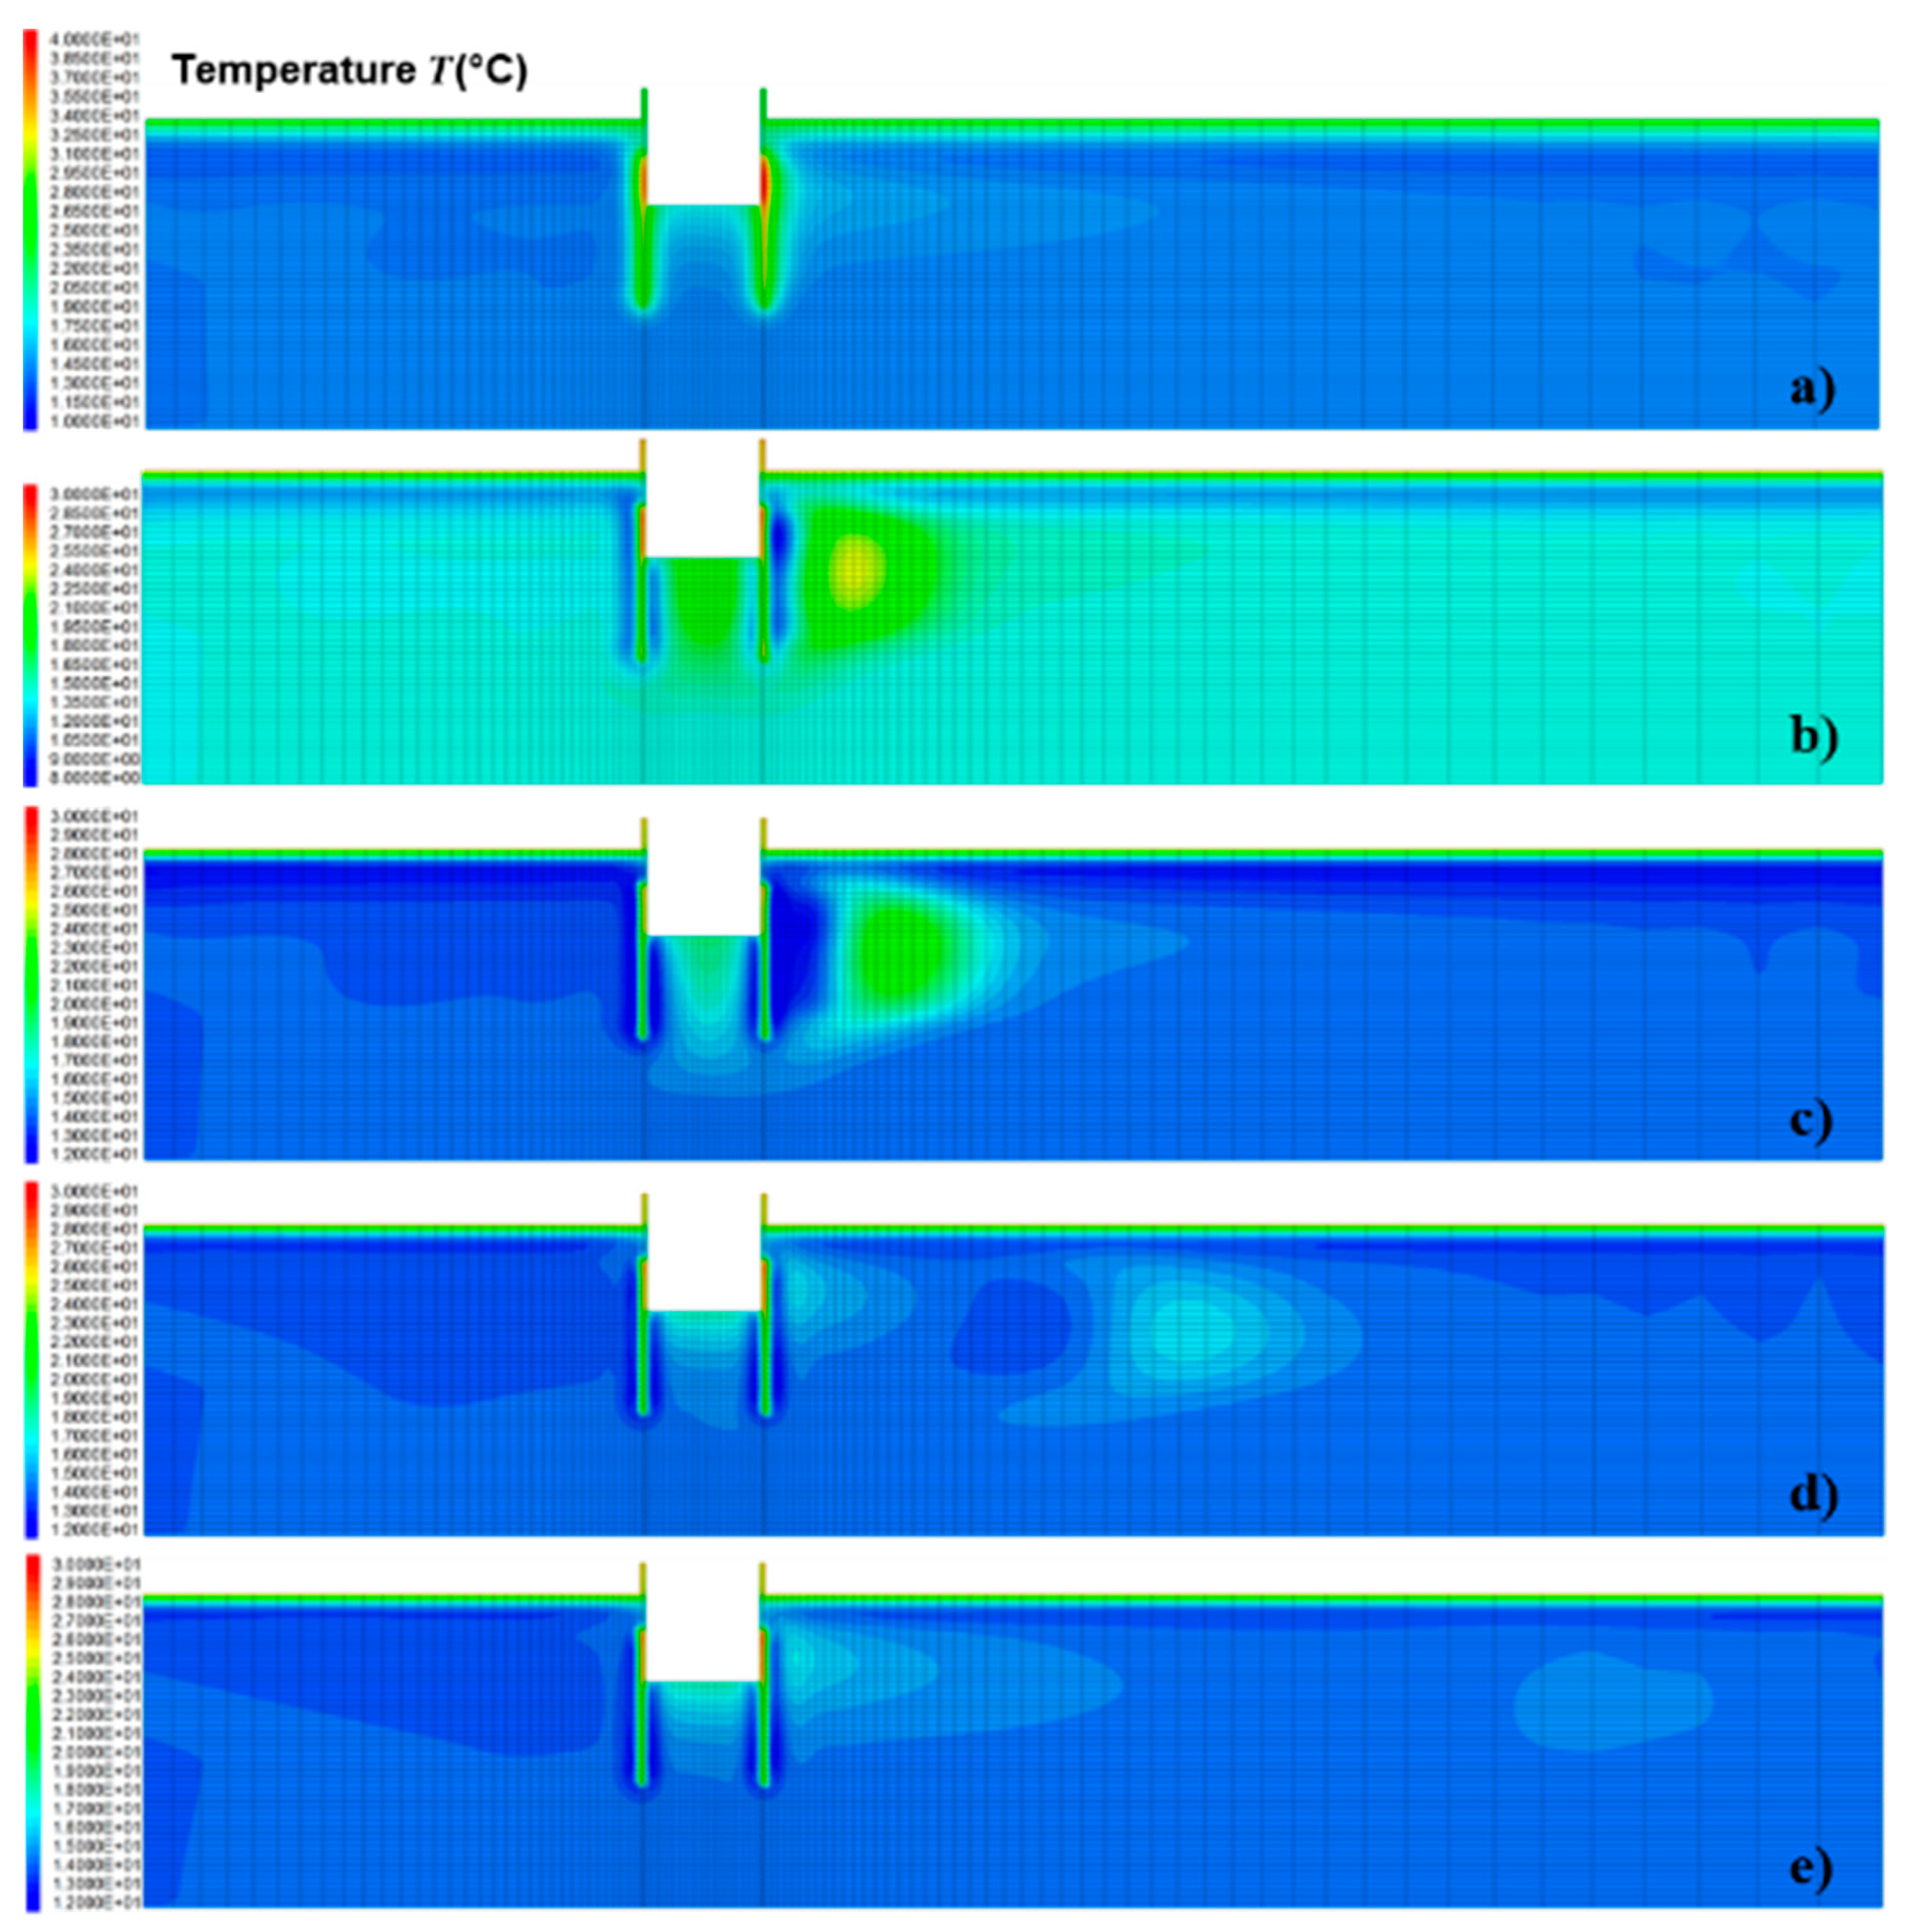
Considering the sinusoidal thermal solicitation of the
Figure 6 for 20 years,
Figure 7 presents the temperature contours, and shows that there is no thermal drift at the structure scale, but also the appearance of a thermal plume. It means that, despite the balanced energy demand, the groundwater flow leads to a lasting variation of the ground temperature. The seasonal variation of energy demand implies the formation of these thermal waves with energy injection during summer and energy absorption during winter.
Figure 8 presents the thermal balance of the system at the soil-structure interface for 20 years. It presents the conduction and the advection contribution year after year. It appears that the first five years, and especially the first two are unbalanced, despite the balanced thermal solicitation. This can be due to the fact that the ground needs to reach a new equilibrium after the thermal activation of the system, which takes several years. After the 10th year, the thermal balance reaches a steady state. It is interesting to note that, for this case, the contribution of the advection is non-negligible.
4. Monitoring
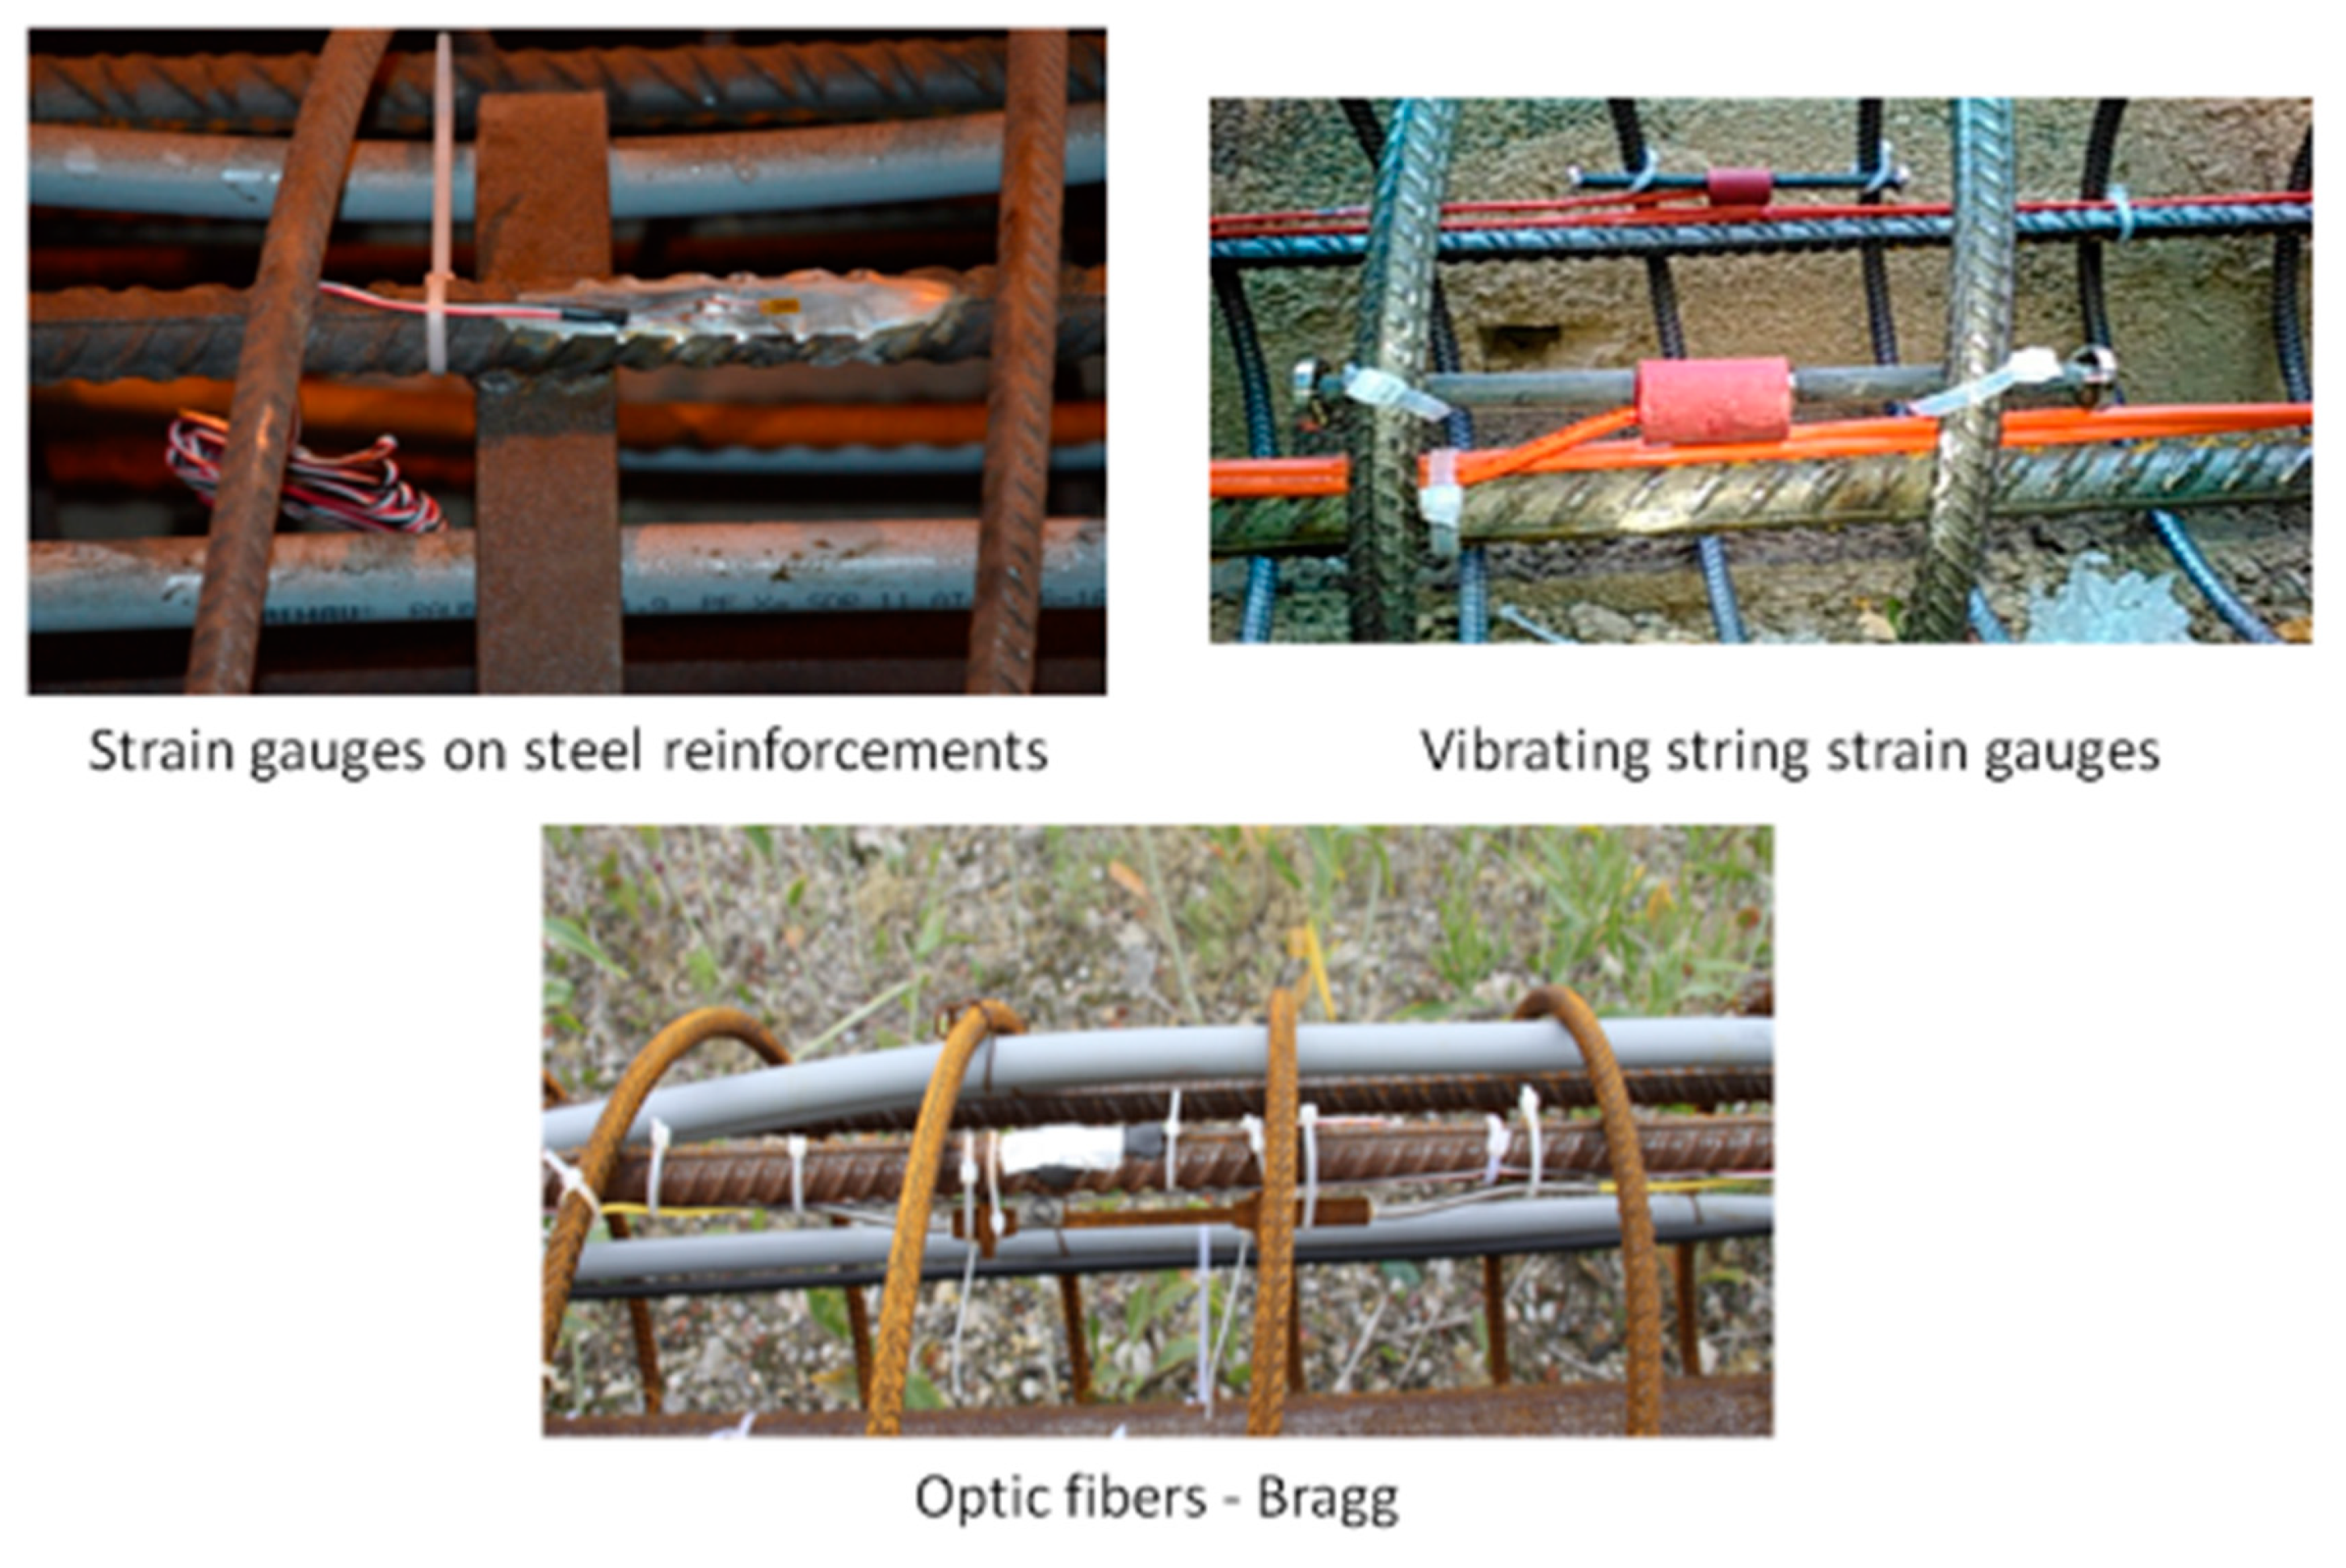
Since the behaviour of thermoactive metro stations is complex, monitoring is required for both assessment and a deep understanding of this complex system. Various types of monitoring could be used to track the thermo-hydro-mechanical behaviour of the stations. In practice, only the thermal and mechanical aspects are monitored. Now, several techniques can be performed: thermal strains, strain gauges, optic fibres, etc. (
Figure 9). The main objective is to correlate the inlet and outlet temperature of the heat exchanger fluid to the thermal variations, the strains, and the displacements into the diaphragm walls. All these data can be stored and analysed in order to improve the design of this kind of technique.
At this stage, the measurements on thermoactive geostructures have not yet started, but other data have been registered on other thermoactive geostructures.
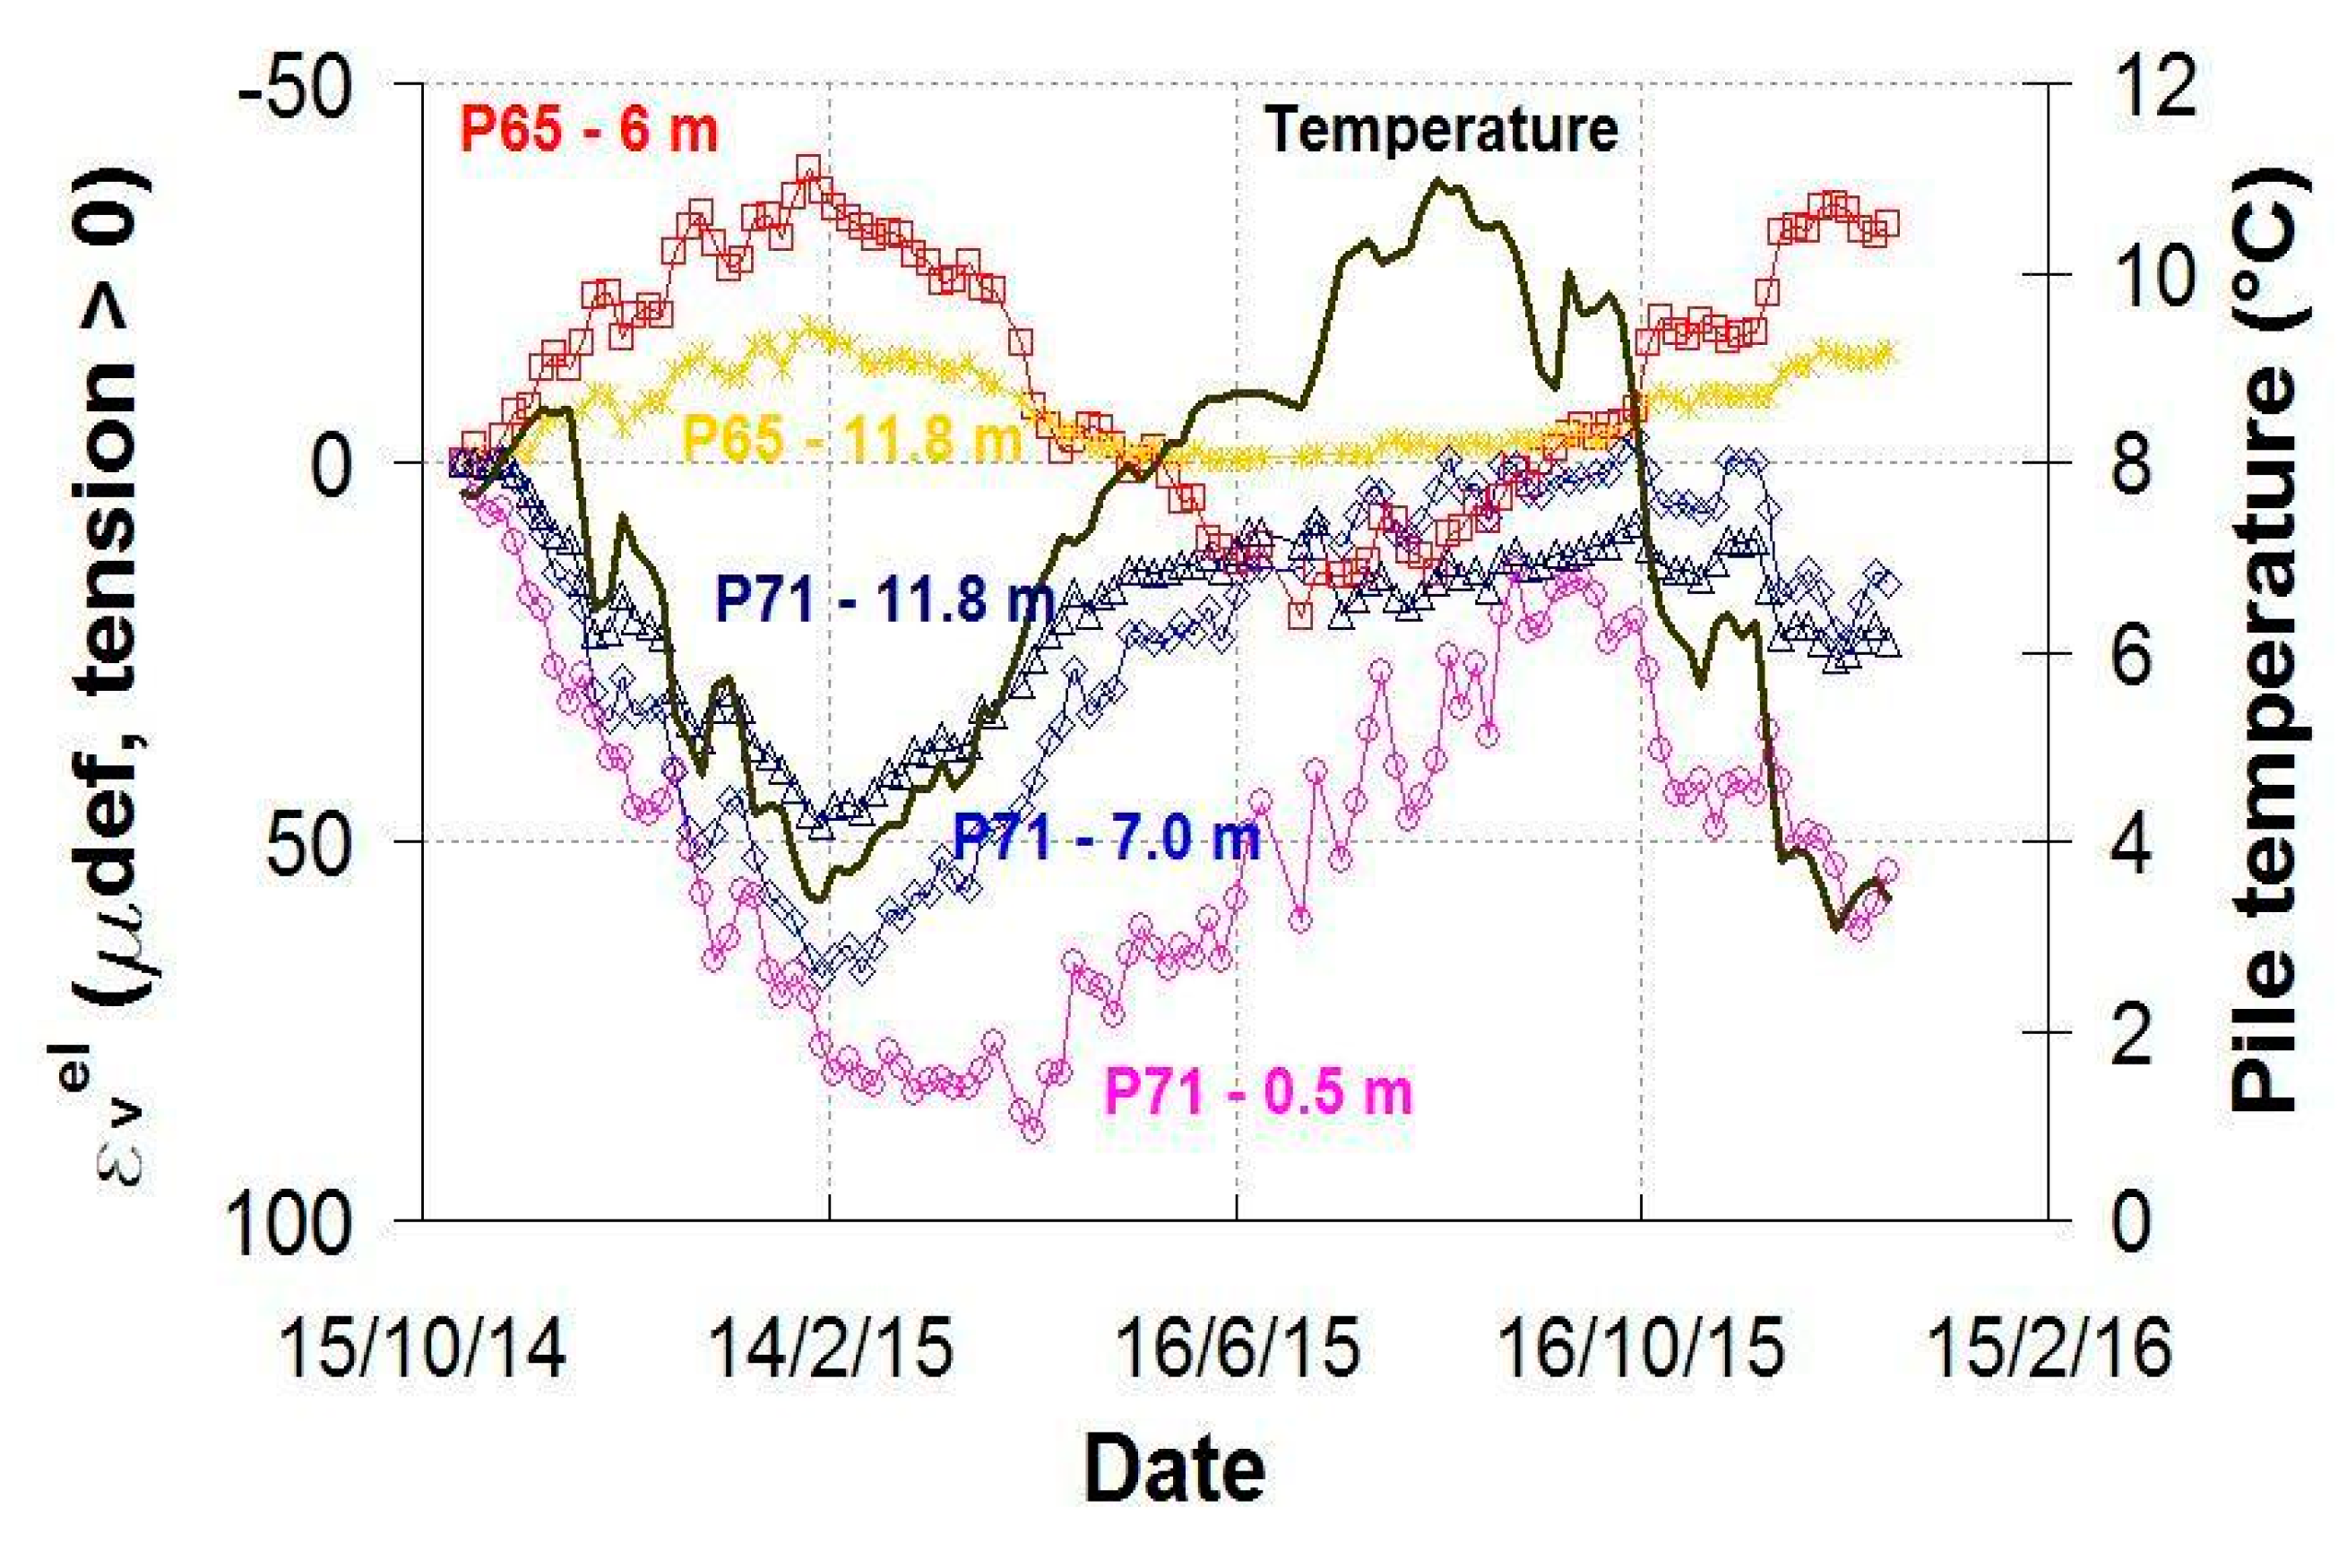
Figure 10 shows that the temperature variations and the strain evolutions are in two piles: pile 65 is a conventional pile, while pile 71 is a thermoactive pile. The temperature decreases in pile 71 induces compressive strains during winter. In summer, slight tensile strains are registered. The strain measured on pile 65 shows opposite trends, which can be explained by a load transfer between the two piles. Additional analysis works are required to really understand the strain mechanism that is involved in this situation.
5. Conclusions
This paper aimed to show the possibility and advantage of integrating thermoactive systems into any geostructures being built, and that the added cost is limited with respect to the overall cost. The thermoactive geostructure is therefore an interesting opportunity that may allow for exploiting the energy stored in the ground with economic and environmental benefit. The extension of the Paris metro system within the Grand Paris project provides a good opportunity to promote the development and the use of underground geothermal structures, as a part of the policy of renewable use. Such projects will give insights to planners and decision makers world-wide who are working in the tunnelling/geoengineering sector.
The use of the underground geothermal energy is related to both the potential of this energy, and the capacity of its integration in the global energy system. The paper showed how smart technology could help with this integration, together with increasing both the energy performers and safety. The paper also discussed geotechnical issues that are related to the construction and exploitation of the underground geothermal structures, such as ground characterization and thermal modelling, and highlighted the importance of smart monitoring for the exploitation of these energy facilities.
Author Contributions
Formal analysis and writing—review, Y.D., and D.R.; Resources and writing—review, J.H.; Supervision, original writing and writing—review, H.M. and S.B.; Visualization, C.F.; Writing—review & editing, H.M. and S.B.
Funding
This research received no external funding.
Acknowledgments
The authors thank all the participants of the European project COST Action GABI TU 1405 for the interesting and fruitful discussions. They also thank Efficacity, the research and development institute for the energy transition of cities and the Société du Grand Paris. They also would like to express their thanks to Isam Shahrour, Professor at Lille University for their very interesting discussions about smart cities.
Conflicts of Interest
The authors declare no conflict of interest.
References
- Brandl, H. Energy foundations and other thermoactive ground structures. Géotechnique 2006, 56, 81–122. [Google Scholar] [CrossRef]
- Adam, D.; Markiewicz, R. Energy from earth-coupled structures, foundations, tunnels and sewers. Géotechnique 2009, 59, 229–236. [Google Scholar] [CrossRef]
- Xia, C.; Sun, M.; Zhang, G.; Xiao, S.; Zou, Y. Experimental study on geothermal heat exchangers buried in diaphragm walls. Energy Build. 2012, 52, 50–55. [Google Scholar] [CrossRef]
- Bourne-Webb, P.J.; Amatya, B.; Soga, K.; Amis, T.; Davidson, C.; Payne, P. Energy pile test at Lambeth College, London: Geotechnical and thermodynamic aspects of pile response to heat cycles. Géotechnique 2009, 59, 237–248. [Google Scholar] [CrossRef]
- Bourne Webb, P.; Burlon, S.; Javid, S.; Kuerten, S.; Loveridge, F. Analysis and design methods for energy geostructures. Renew. Sustain. Energy 2016, 65, 402–419. [Google Scholar] [CrossRef] [Green Version]
- Suryatriyastuti, M.E.; Mroueh, H.; Burlon, S. Understanding the temperature-induced mechanical behavior of energy pile foundations. Renew. Sustain. Energy Rev. 2012, 16, 3344–3354. [Google Scholar] [CrossRef]
- Di Donna, A.; Rotta, A.F.; Laloui, L. Numerical study of the response of a group of energy piles under different combinations of thermo-mechanical loads. Comput. Geotech. 2016, 72, 126–142. [Google Scholar] [CrossRef]
- Hellström, G. Ground Heat Storage. Thermal Analyses of Duct Storage Systems. Theory. Ph.D. Thesis, Department of Mathematical Physics, University of Lund, Lund, Sweden, 1991. [Google Scholar]
- Fromentin, A.; Pahud, D. Recommandations pour la Réalisation D’installations avec Pieux Échangeurs; Rapport final. Rapport d’étude n°120.104; Office fédéral de l’énergie: Lausanne, Suisse, 1997; 79p. [Google Scholar]
- Pahud, D.; Fromentin, A.; Hubbuch, M. Heat Exchanger Pile System of the Dock Midfield at the Zürich Airport. Detailed Simulation and Optimization of the Installation; Rapport final. Rapport d’étude n°120.110; Office fédéral de l’énergie: Lausanne, Suisse, 1999; 49p. [Google Scholar]
- SIA. Utilisation de la Chaleur du sol par des Ouvrages de Fondation et de Soutènement en Béton. Guide Pour la Conception, la Réalisation et la Maintenance; SIA D 0190: Zurich, Suisse, 2005; 104p. [Google Scholar]
- Pahud, D.; Lachal, B. Mesure des Performances Thermiques d’une Pompe à Chaleur Couplée sur des Sondes Géothermiques à Lugano; Rapport final, étude n°40430; Office fédéral de l’énergie: Lausanne, Suisse, 2004; 129p. [Google Scholar]
- Kharseh, M.; Al-Khawaja, M.; Suleiman, M.T. Potential of ground source heat pump systems in cooling-dominated environments: Residential buildings. Geothermics 2015, 57, 104–110. [Google Scholar] [CrossRef]
- Kavanaugh, P.S.; Rafferty, K. Ground-Source Heat Pumps: Design of Geothermal Systems for Commercial and Institutional Buildings; American Society of Heating Refrigeration and Air-Conditioning Engineers, Inc.: Atlanta, GA, USA, 1997; ISBN 1-883413-52-4. [Google Scholar]
- ASHRAE Fundamentals; American Society of Heating Refrigeration and Air-Conditioning Engineers, Inc.: Atlanta, GA, USA, 2009.
- Michopoulos, A.; Papakostas, K.T.; Kyriakis, N. Potential of autonomous ground-coupled heat pump system installations in Greece. Appl. Energy 2011, 88, 2122–2129. [Google Scholar] [CrossRef]
- Low, J.; Loveridge, F.; Powrie, W. A comparison of laboratory and in situ methods to determine soil thermal conductivity for energy foundations and other ground heat exchanger applications. Acta Geotech. 2014, 10, 209–218. [Google Scholar] [CrossRef] [Green Version]
- ASTM. ASTM D5334 Standard Test Method for Determination of Thermal Conductivity of Soil and Soft Rock by Thermal Needle Probe Procedure; ASTM: West Conshohocken, PA, USA, 2014. [Google Scholar]
- CEN. EN ISO 17628 Geotechnical Investigation and Testing—Geothermal Testing—Determination of Thermal Conductivity of Soil and Rock Using a Borehole Heat Exchanger; CEN: Brussels, Belgium, 2015. [Google Scholar]
- Mogensen, P. Fluid to duct wall heat transfer in duct system heat storages. In Proceedings of the International Conference on Subsurface Heat Storage in Theory and Practice, Stockholm, Sweden, 6–8 June 1983; pp. 652–657. [Google Scholar]
- Gehlin, S. Thermal Response Test—Method Development and Evaluation. Ph.D. Thesis, Lulea University of Technology, Lulea, Sweden, 2002; 191p. [Google Scholar]
- Sanner, B.; Hellstrom, G.; Spitler, J.; Gehlin, S.E.A. Thermal response test—Current status and world-wide application. In Proceedings of the World Geothermal Congress, Antalya, Turkey, 24–29 April 2005. [Google Scholar]
- Loveridge, F.; Powrie, W. Temperature response functions (G-functions) for single pile heat exchangers. Energy 2013, 57, 554–564. [Google Scholar] [CrossRef] [Green Version]
- Jensen-Page, L.; Narsilio, G.A.; Bidarmaghz, A.; Johnston, I.W. Investigation of the effect of seasonal variation in ground temperature on thermal response tests. Renew. Energy 2018, 125, 609–619. [Google Scholar] [CrossRef]
- Kersten, M.S. Thermal Properties of Soils; Bulletin #28; University of Minnesota Engineering Experiment Station: St. Paul, MN, USA, 1949. [Google Scholar]
- De Vries, D.A. Thermal properties of soils. In Physics of Plant Environment; Van Wijk, W.R., Ed.; Wiley: New York, NY, USA, 1963; pp. 210–235. [Google Scholar]
- Johansen, O. Thermal Conductivity of Soils. Ph.D. Thesis, University of Trondheim, Trondheim, Norway, 1975; 322p. [Google Scholar]
- Brigaud, F.; Vasseur, G. Mineralogy, porosity and fluid control on thermal conductivity of sedimentary rocks. Geophys. J. 1989, 98, 525–542. [Google Scholar] [CrossRef] [Green Version]
- Tarnawski, V.R.; Leong, W.H. Thermal conductivity of soils at very low moisture content and moderate temperatures. Transp. Porous Media 2000, 41, 137–147. [Google Scholar] [CrossRef]
- Tarnawski, V.R.; Momose, T.; Leong, W.H. Assessing the impact of quartz content on the prediction of soil thermal conductivity. Géotechnique 2009, 59, 331–338. [Google Scholar] [CrossRef]
- Griffith, D.V.; Fenton, G.A. Seepage beneath water retaining structures founded on spatially random soil. Géotechnique 1993, 43, 577–587. [Google Scholar] [CrossRef]
- Di Donna, A.; Barla, M. The role of ground conditions and properties on the efficiency of energy tunnels. Environ. Geotech. 2016, 3, 214–224. [Google Scholar] [CrossRef]
- Pahud, D.; Hubbuch, M. Measured thermal performances of the energy pile system of the dock midfield at Zurich airport. In Proceedings of the European Geothermal Congress 2007, Unterhaching, Germany, 30 May–1 June 2007. [Google Scholar]
- Barla, M.; Di Donna, A.; Perino, A. Application of energy tunnels to an urban environment. Geothermics 2016, 61, 104–113. [Google Scholar] [CrossRef]
- Habert, J.; El Mejahed, M.; Bernard, J.B. Lessons learned from mechanical monitoring of a thermoactive pile. In Proceedings of the 1st International Conference on Energy Geotechnics, Kiel, Germany, 29–31 August 2016. [Google Scholar]
- Itasca Consulting Co. FLAC3D—Fast Lagrangian Analysis of Continua in 3 Dimensions, ver. 5.01 Command Reference Manual; Itasca: Minneapolis, MN, USA, 2013. [Google Scholar]
© 2018 by the authors. Licensee MDPI, Basel, Switzerland. This article is an open access article distributed under the terms and conditions of the Creative Commons Attribution (CC BY) license (http://creativecommons.org/licenses/by/4.0/).

 ,
, 


