Analyzing the Driving Factors Causing Urban Expansion in the Peri-Urban Areas Using Logistic Regression: A Case Study of the Greater Cairo Region


Abstract
:
1. Introduction
2. Materials
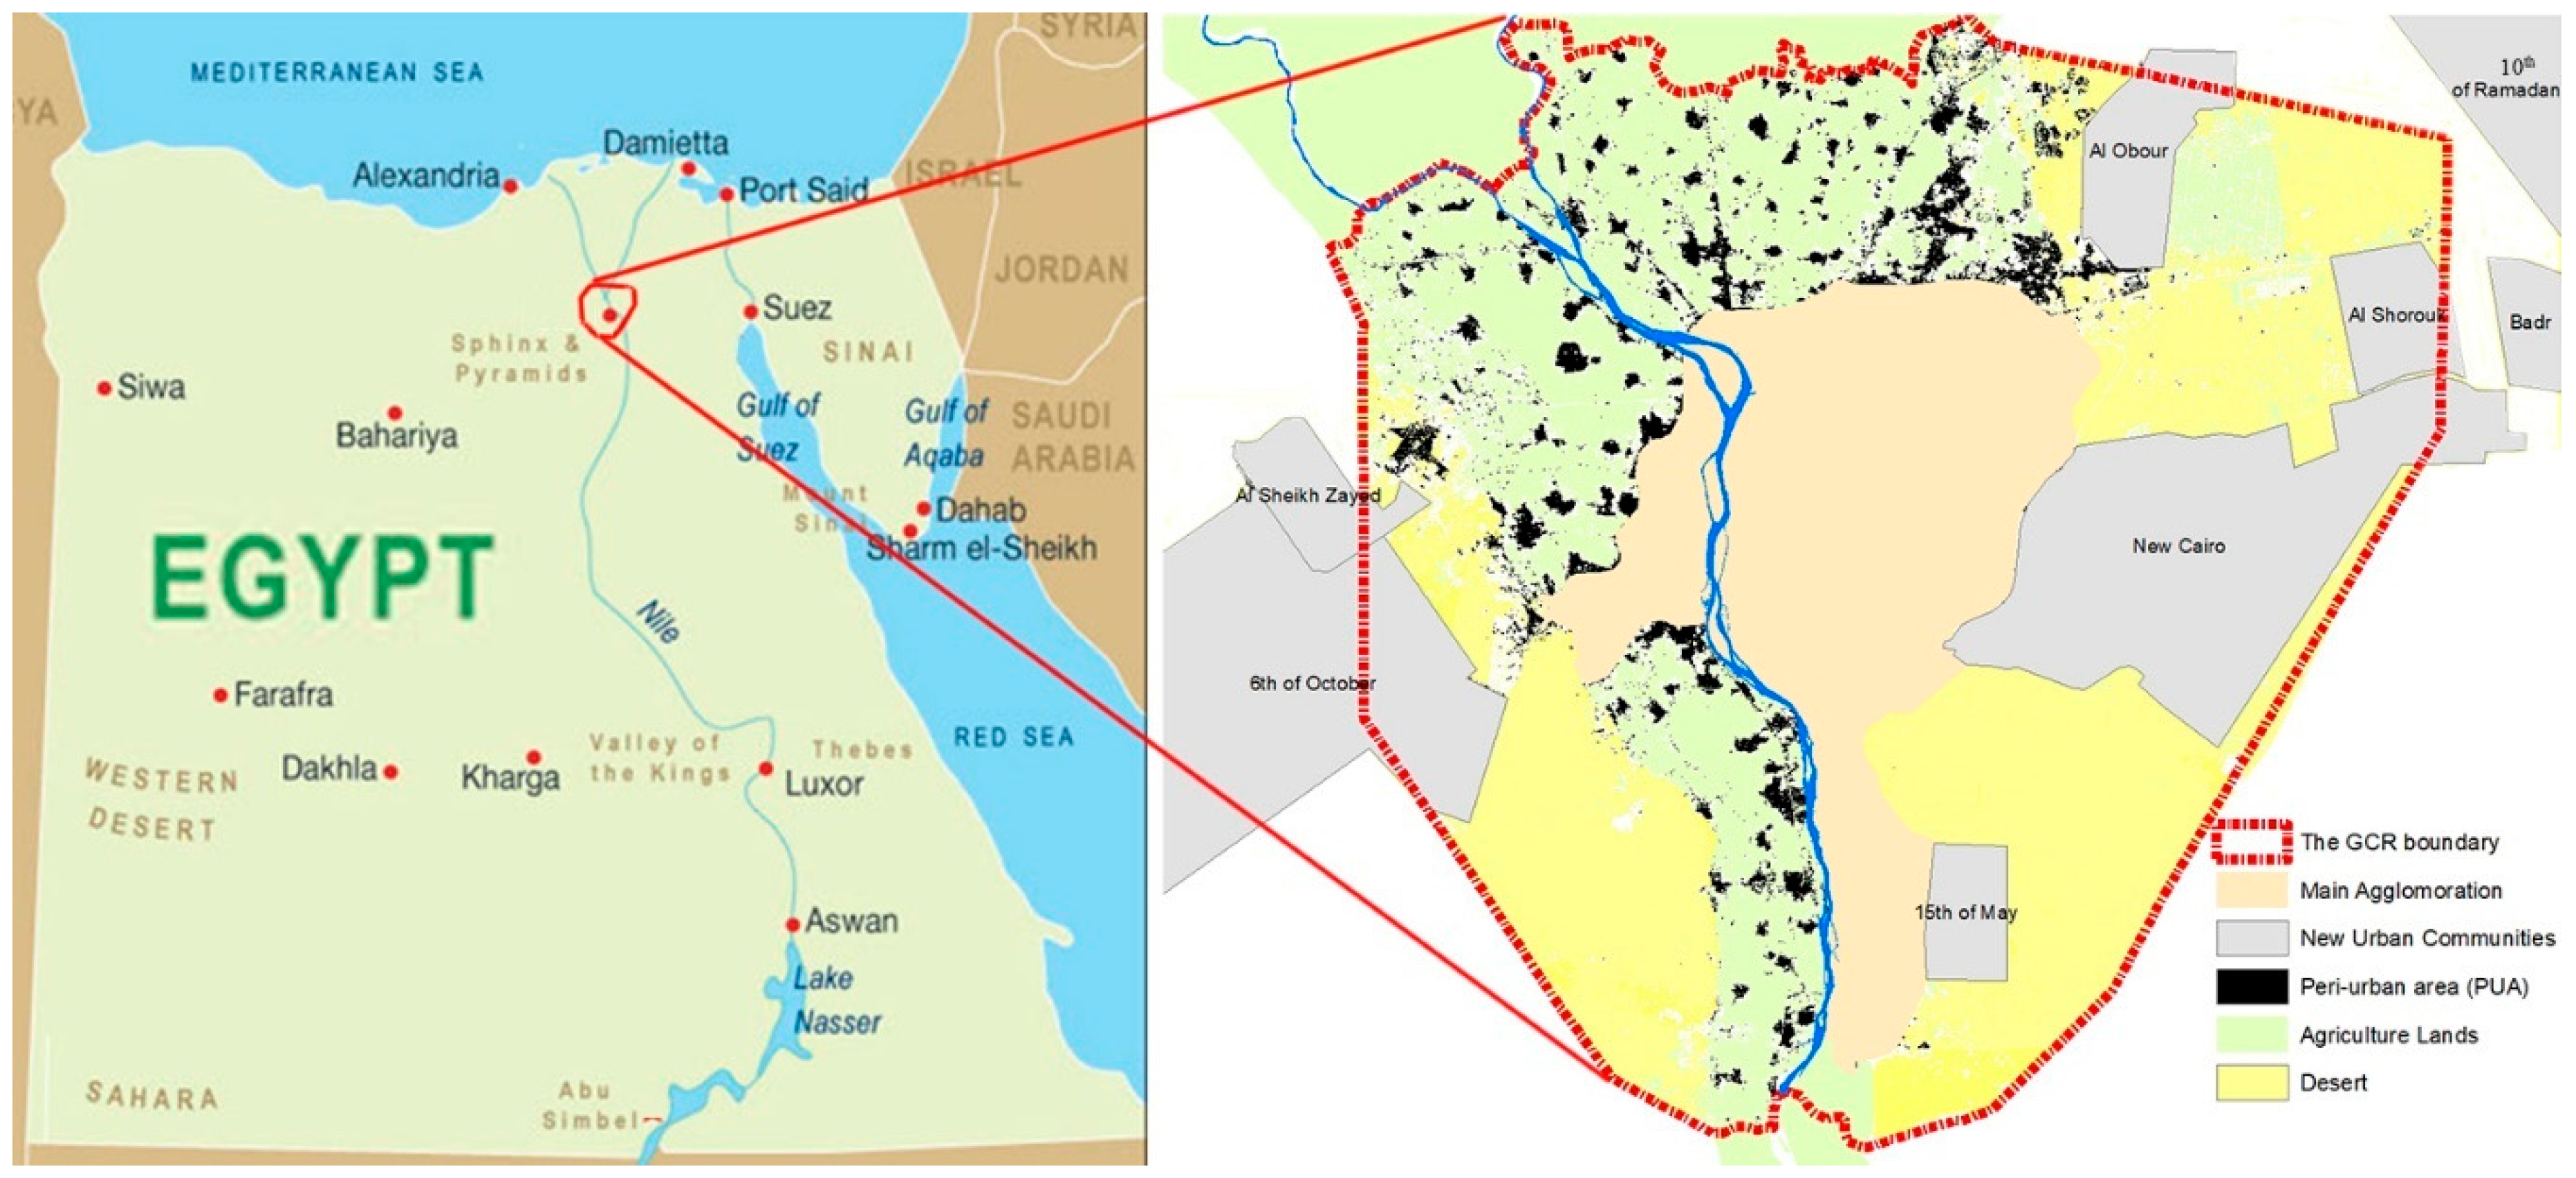
2.1. Study Area
2.2. Data
3. Methodology
3.1. Classification of Satellite Images
3.2. Identifying the Variables of the Logistic Regression Model
3.3. Logistic Regression Model (LRM)
3.3.1. Calibration of the Logistic Regression Model
3.3.2. Goodness of Fit of the Model
4. Results
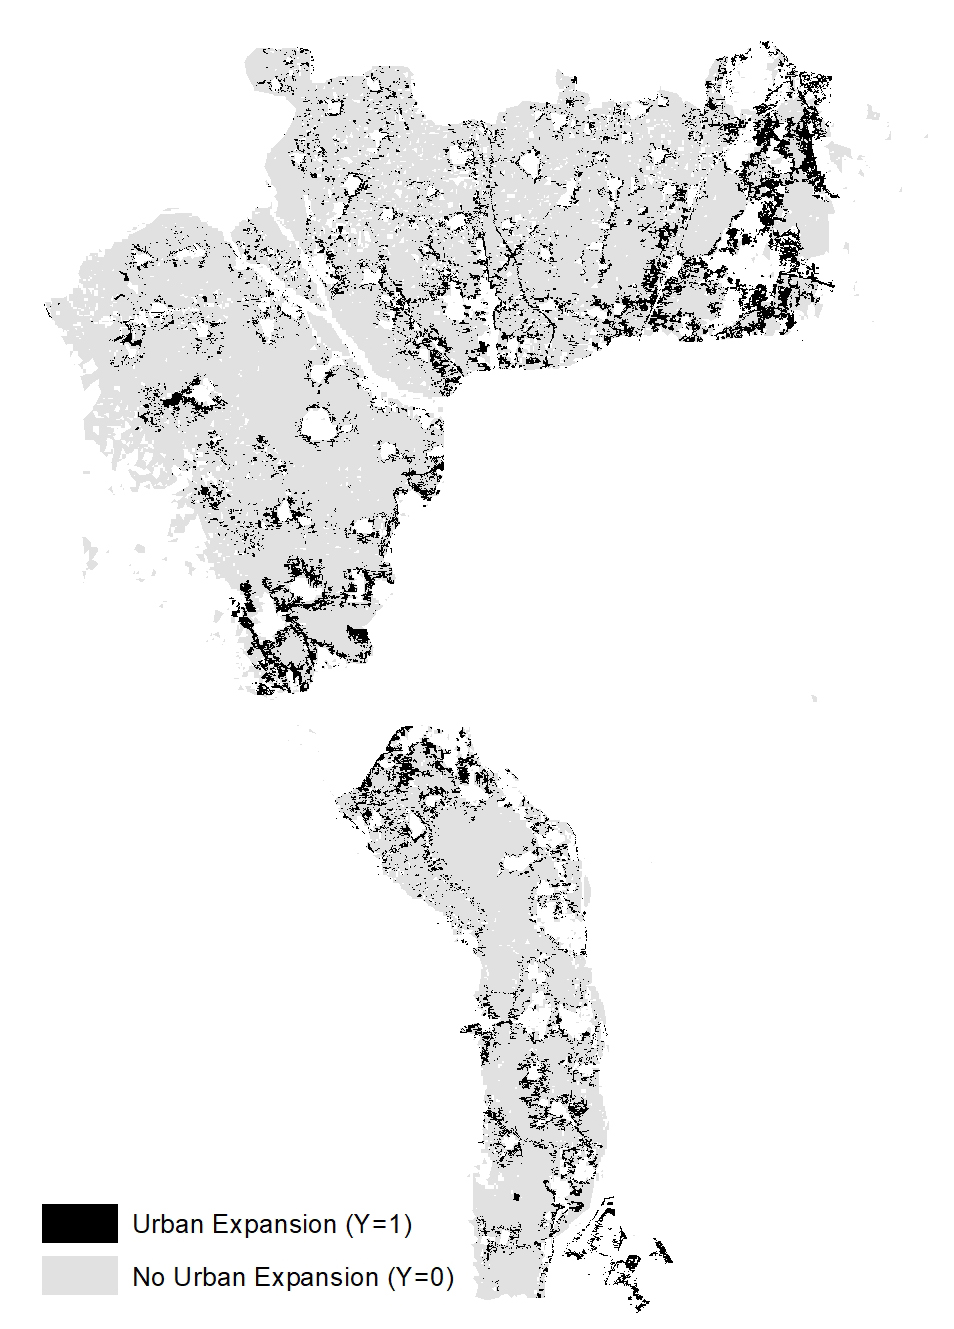
4.1. Urban Expansion
4.2. Driving Factors (Independent Variables)
4.3. Multicollinearity Analysis for Independent Variables
4.4. Influence of Driving Forces on Urban Expansion
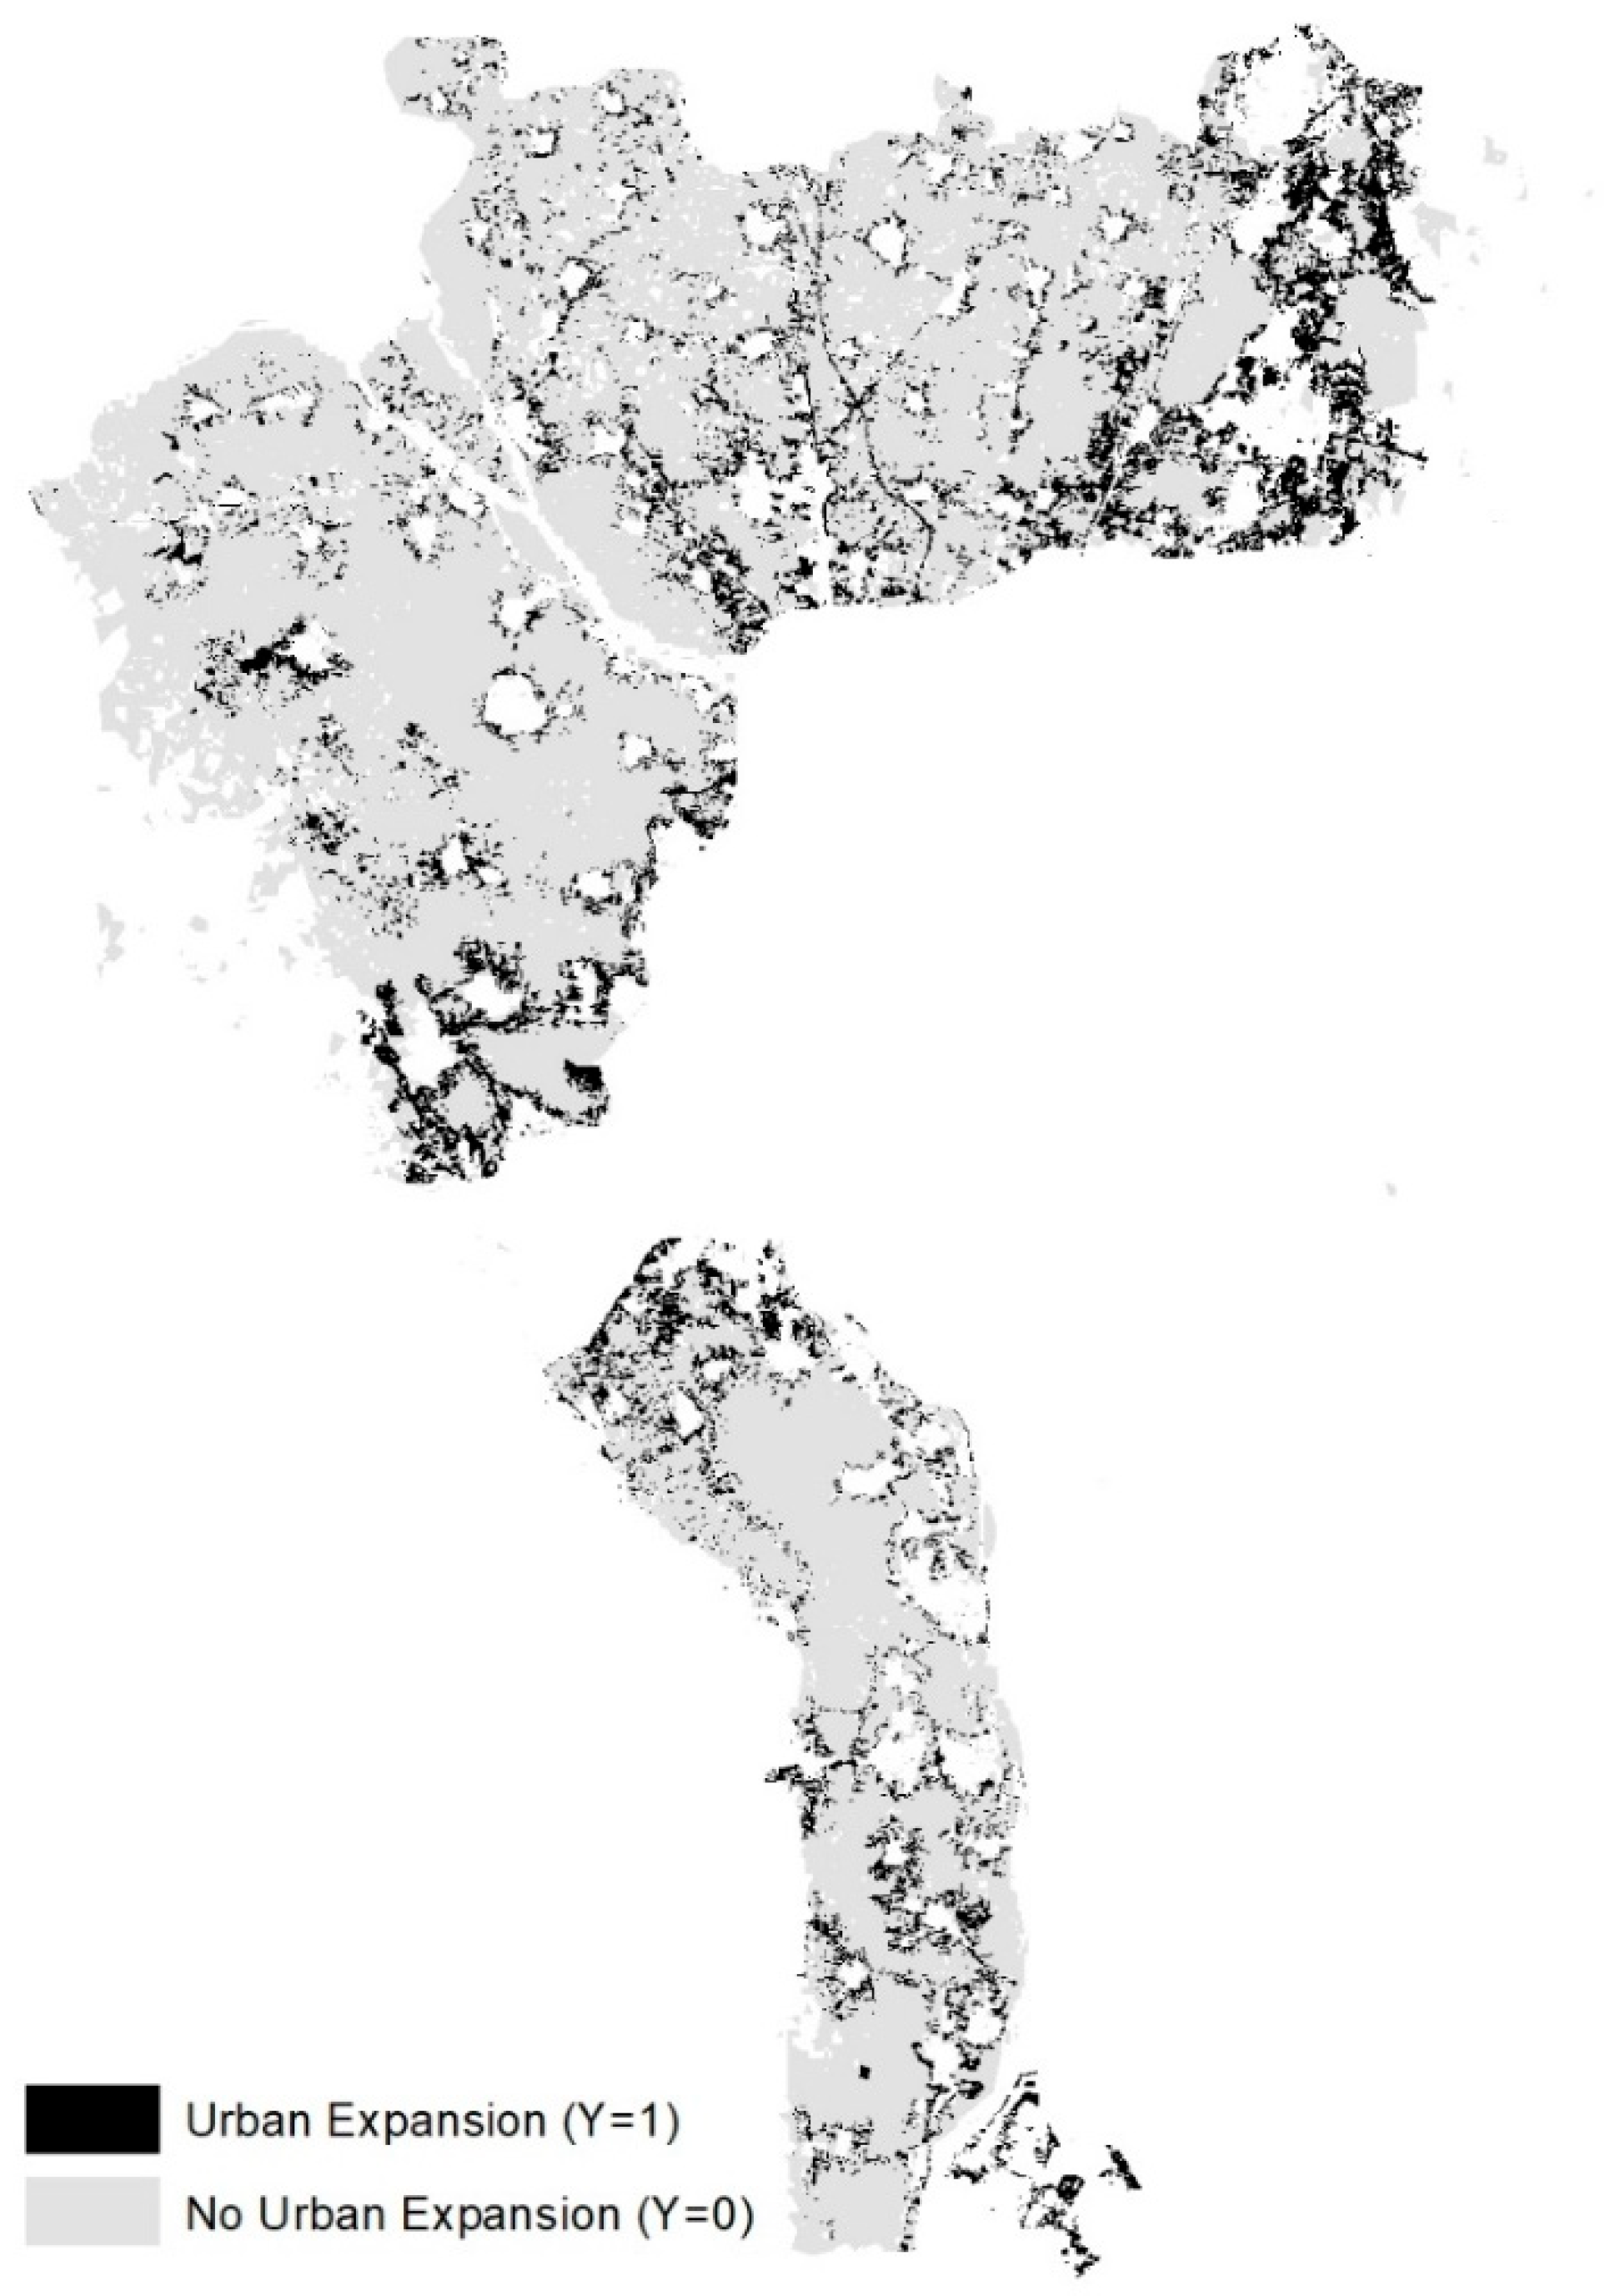
4.5. Prediction of Urban Expansion
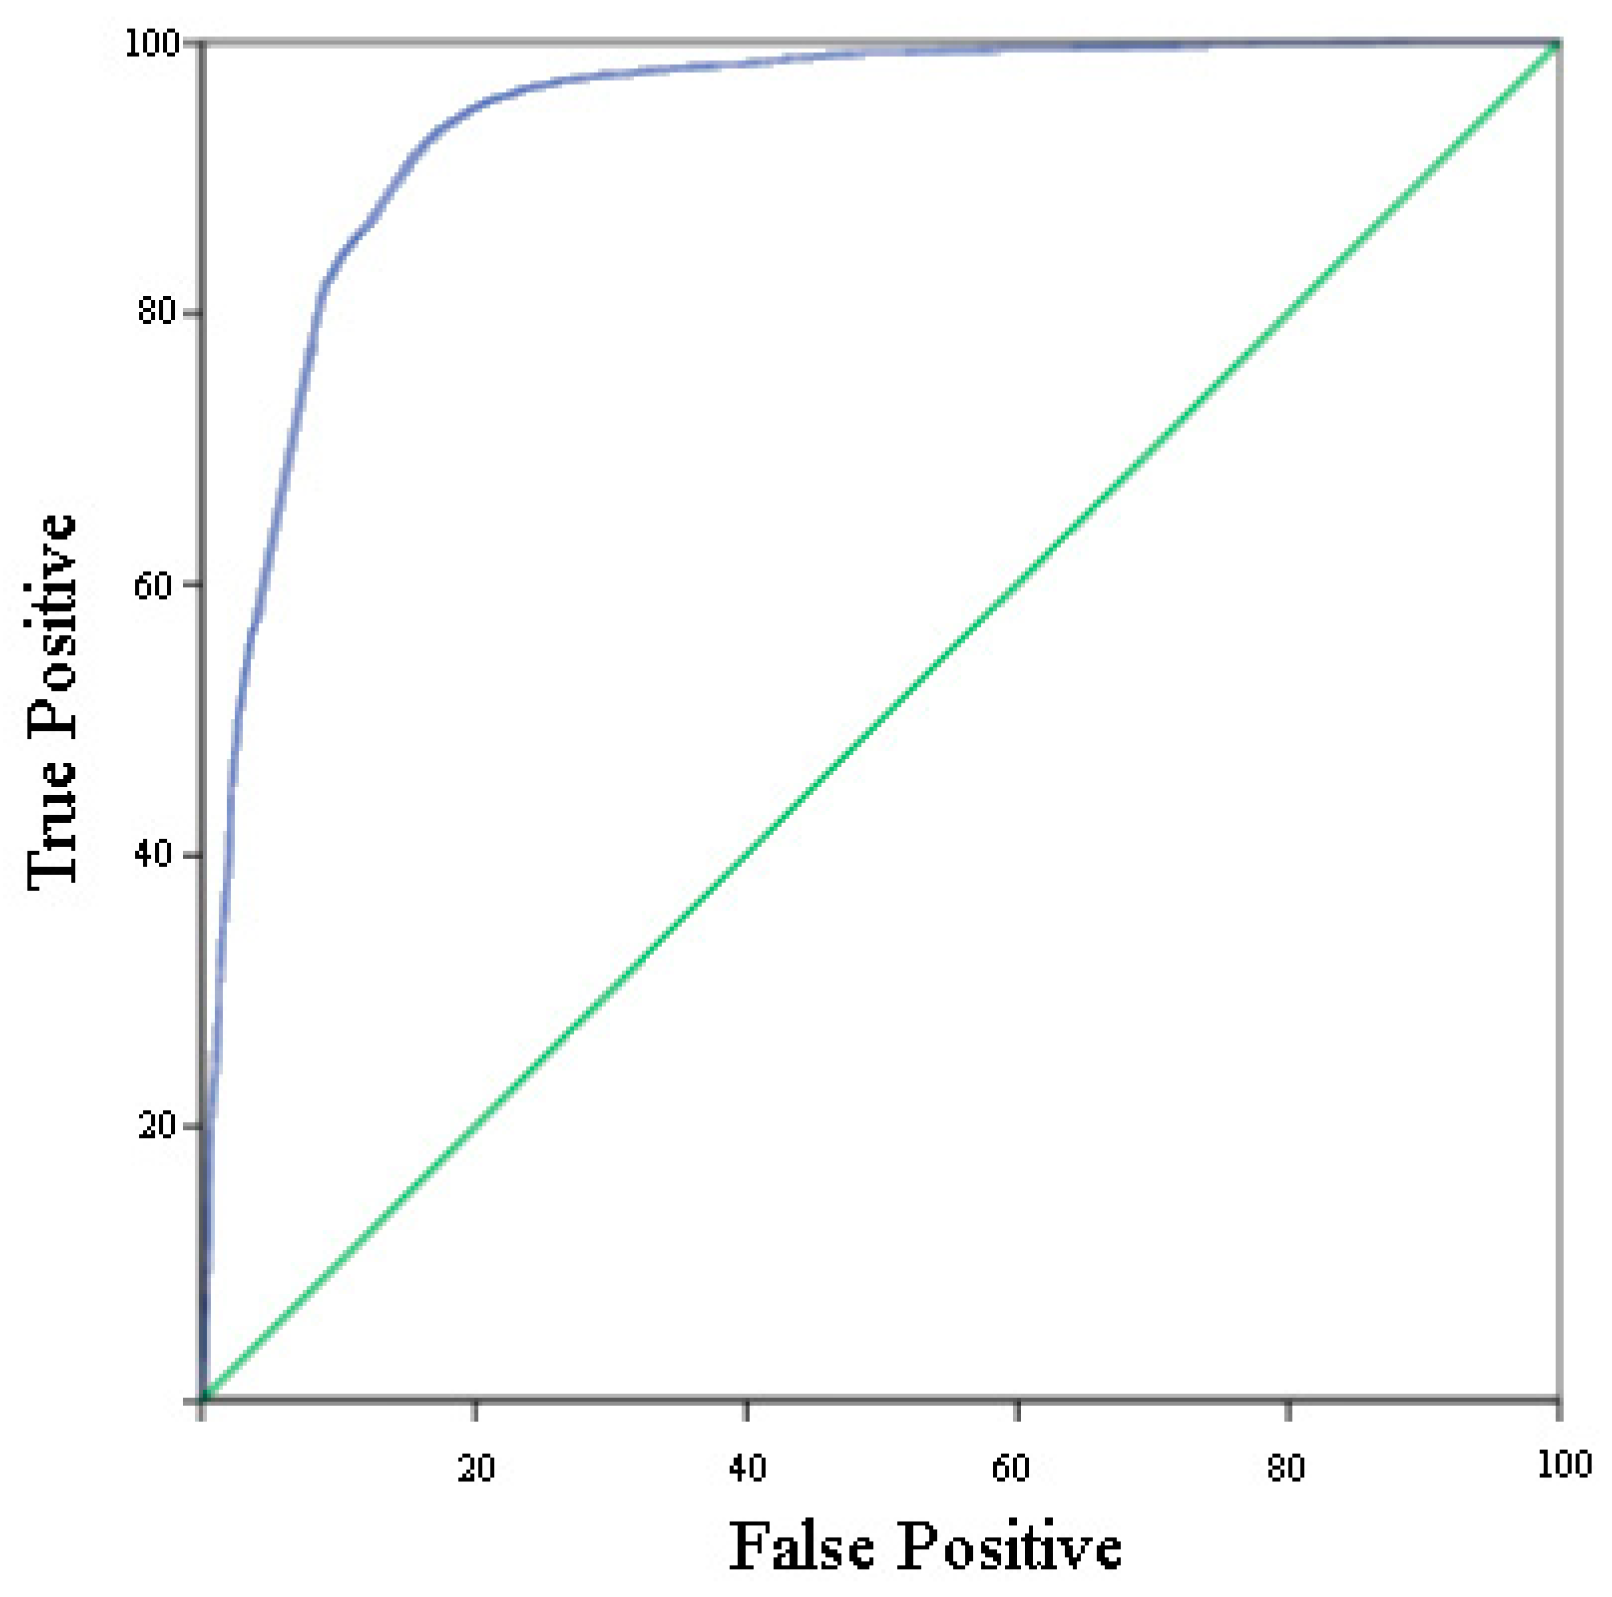
4.6. Model Validation
5. Discussion
6. Conclusions
Author Contributions
Funding
Conflicts of Interest
References
- Bhatta, B. Remote Sensing, GIS, and Urban Analysis. In Analysis of Urban Growth and Sprawl from Remote Sensing; Springer: Berlin/Heidelberg, Germany, 2010; pp. 49–63. [Google Scholar] [CrossRef]
- Dutta, V. Land Use Dynamics and Peri-Urban Growth Characteristics: Reflections on Master Plan and Urban Suitability from a Sprawling North Indian City. Environ. Urban. Asia 2012, 3, 277–301. [Google Scholar] [CrossRef]
- Ramachandra, T.V.; Bharath, A.H.; Sowmyashree, M.V. Monitoring Urbanization and Its Implications in a Mega City from Space: Spatiotemporal Patterns and Its Indicators. J. Environ. Manag. 2015, 148, 67–81. [Google Scholar] [CrossRef] [PubMed]
- McGregor, D.; Simon, D.; Thompson, D. The Peri-Urban Interface: Approaches to Sustainable Natural and Human Resource Use; Earthscan: London, UK, 2012. [Google Scholar] [CrossRef]
- Das, N.D. Land-Use Dynamics of Peri-Urban Areas of Metropolitan Cities with Special Focus on Delhi. In Marginalization in Globalizing Delhi: Issues of Land, Livelihoods and Health; No. Issues of Land, Livelihoods and Health; Springer: New Delhi, India, 2017; pp. 21–42. [Google Scholar] [CrossRef]
- Chirisa, I.; Mazhindu, E.; Bandauko, E. Peri-Urban Developments and Processes in Africa with Special Reference to Zimbabwe; Springer International Publishing: Basel, Switzerland, 2016. [Google Scholar] [CrossRef]
- Allen, A. Environmental Planning and Management of the Peri-Urban Interface: Perspectives on an Emerging Field. Environ. Urban. 2003, 15, 135–148. [Google Scholar] [CrossRef]
- Dupont, V.E.; Centre, D.S.H. Peri—Urban Dynamics: Population, Habitat and Environment on the Peripheries of Large Indian Metropolises. In Population (English Edition); CSH: New Delhi, India, 2006; pp. 1–151. [Google Scholar] [CrossRef]
- Webster, D.; Muller, L. Peri-Urbanization: Zones of Rural-Urban Transition. In Human Settlement Development Volume 1; Sassen, S., Ed.; EOLSS Publications: Paris, France, 2009; Volume 1, pp. 281–290. [Google Scholar]
- Salem, M. Peri-Urban Dynamics and Land-Use Planning for the Greater Cairo Region in Egypt. In WIT Transactions on The Built Environment; WIT Press: Southampton, UK, 2015; Volume 168, pp. 109–119. [Google Scholar] [CrossRef]
- Sarkar, S.; Bandyopadhyay, S. Dynamics of the Peri Urban Interface: Issues and Perspectives for Management. Trans. Inst. Indian Geogr. 2013, 35, 49–62. [Google Scholar]
- Iaquinta, D.L.; Drescher, A.W. Defining the Peri-Urban: Rural-Urban Linkages and Institutional Connections. Land Reform 2000, 2, 8–26. [Google Scholar]
- Miljković, J.Ž.; Crnčević, T.; Marić, I. Land Use Planning for Sustainable Development of Peri-Urban Zones. Spatium 2012, 28, 15–22. [Google Scholar] [CrossRef]
- Aguilar, A.G. Peri-Urbanization, Illegal Settlements and Environmental Impact in Mexico City. Cities 2008, 25, 133–145. [Google Scholar] [CrossRef]
- Fish, B.; Phelan, K.; Buxton, M.; Farrell, S. Peri-Urban Futures: Scenarios for Sustainable Regional Development Report; RMIT University: Melbourne, Australia, 2014. [Google Scholar]
- Bhatta, B. Causes and Consequences of Urban Growth and Sprawl. In Analysis of Urban Growth and Sprawl from Remote Sensing Data; Springer: Berlin/Heidelberg, Germany, 2010; pp. 17–37. [Google Scholar] [CrossRef]
- Ju, H.; Zhang, Z.; Zuo, L.; Wang, J.; Zhang, S.; Wang, X.; Zhao, X. Driving Forces and Their Interactions of Built-up Land Expansion Based on the Geographical Detector—A Case Study of Beijing, China. Int. J. Geogr. Inf. Sci. 2016, 30, 2188–2207. [Google Scholar] [CrossRef]
- Siddiqui, A.; Siddiqui, A.; Maithani, S.; Jha, A.K.; Kumar, P.; Srivastav, S.K. Urban Growth Dynamics of an Indian Metropolitan Using CA Markov and Logistic Regression. Egypt. J. Remote Sens. Space Sci. 2018, 21, 229–236. [Google Scholar] [CrossRef]
- Osman, T.; Divigalpitiya, P.; Arima, T. Driving Factors of Urban Sprawl in Giza Governorate of the Greater Cairo Metropolitan Region Using a Logistic Regression Model. Int. J. Urban Sci. 2016, 20, 206–225. [Google Scholar] [CrossRef]
- Lawanson, T.; Yadua, O.; Salako, I. An Investigation of Rural-Urban Linkages of The Lagos Megacity, Nigeria. J. Constr. Proj. Manag. Innov. 2012, 2, 464–481. [Google Scholar]
- Braimoh, A.K.; Onishi, T. Spatial Determinants of Urban Land Use Change in Lagos, Nigeria. Land Use Policy 2007, 24, 502–515. [Google Scholar] [CrossRef]
- Appiah, D.O.; Bugri, J.T.; Forkuor, E.K.; Boateng, P.K. Determinants of Peri-Urbanization and Land Use Change Patterns in Peri-Urban Ghana. J. Sustain. Dev. 2014, 7, 95–109. [Google Scholar] [CrossRef]
- Mahamud, M.A.; Samat, N.; Mohd Noor, N. Identifying Factors Influencing Urban Spatial Growth for The George Town Conurbation. Plan. Malays. J. 2016, 14. [Google Scholar] [CrossRef]
- Jokar Arsanjani, J.; Helbich, M.; Kainz, W.; Darvishi Boloorani, A. Integration of Logistic Regression, Markov Chain and Cellular Automata Models to Simulate Urban Expansion. Int. J. Appl. Earth Obs. Geoinf. 2013, 21, 265–275. [Google Scholar] [CrossRef]
- Mohamed, H.E. Analysis of Urban Growth at Cairo, Egypt Using Remote Sensing and GIS. Nat. Sci. 2012, 4, 355–361. [Google Scholar] [CrossRef]
- Sims, D. Understanding Cairo: The Logic of a City Out of Control; The American University in Cairo Press: Cairo, Egypt, 2011. [Google Scholar] [CrossRef]
- Salem, M.; Tsurusaki, N.; Divigalpitiya, P.; Osman, T. Driving Factors of Urban Expansion in Peri-Urban Areas of Greater Cairo Region. In REAL CORP 2018–EXPANDING CITIES–DIMINISHING SPACE. Are “Smart Cities” the Solution or Part of the Problem of Continuous Urbanisation Around the Globe? Proceedings of 23rd International Conference on Urban Planning, Regional Development and Information, Vienna, Austria, 4–6 April 2018; REAL CORP: Vienna, Austria, 2018; pp. 191–196. [Google Scholar]
- Sefidi, A.K.B.; Ghalehnoee, M. Analysis of Urban Growth Pattern Using Logistic Regression Modeling, Spatial Autocorrelation and Fractal Analysis Case Study: Ahvaz City; Iran University of Science & Technology: Tehran, Iran, 2016; Volume 26, pp. 183–194. [Google Scholar] [CrossRef]
- Poelmans, L.; Van Rompaey, A. Complexity and Performance of Urban Expansion Models. Comput. Environ. Urban Syst. 2010, 34, 17–27. [Google Scholar] [CrossRef]
- Hamdy, O.; Zhao, S.; Osman, T.; Salheen, M.; Eid, Y. Applying a Hybrid Model of Markov Chain and Logistic Regression to Identify Future Urban Sprawl in Abouelreesh, Aswan: A Case Study. Geosciences 2016, 6, 43. [Google Scholar] [CrossRef]
- Tobergte, D.R.; Curtis, S. Logistic Regression, A Self-Learning Text; Springer Science & Business Media: Berlin, Germany, 2013; Volume 53. [Google Scholar] [CrossRef]
- Clark, W.A.V.; Hosking, P.L. Statistical Methods for Geographers; Wiley: Hoboken, NJ, USA, 1986. [Google Scholar]
- Nong, Y.; Du, Q. Urban Growth Pattern Modeling Using Logistic Regression. Geo-Spat. Inf. Sci. 2011, 14, 62–67. [Google Scholar] [CrossRef]
- Liao, F.H.F.; Wei, Y.H.D. Modeling Determinants of Urban Growth in Dongguan, China: A Spatial Logistic Approach. Stoch. Environ. Res. Risk Assess. 2014, 28, 801–816. [Google Scholar] [CrossRef]
- Japan International Cooperation Agency (JICA). The Strategic Urban Development Master Plan (SDMP) Study For Sustainable Development Of The Greater Cairo Region; Japan International Cooperation Agency: Tokyo, Japan, 2008; Volume 1.
- Shu, B.; Zhang, H.; Li, Y.; Qu, Y.; Chen, L. Spatiotemporal Variation Analysis of Driving Forces of Urban Land Spatial Expansion Using Logistic Regression: A Case Study of Port Towns in Taicang City, China. Habitat Int. 2014, 43, 181–190. [Google Scholar] [CrossRef]
- Chen, L.; Ren, C.; Zhang, B.; Wang, Z.; Liu, M. Quantifying Urban Land Sprawl and Its Driving Forces in Northeast China from 1990 to 2015. Sustainbility 2018, 10, 188. [Google Scholar] [CrossRef]
- Huang, Q.H.; Cai, Y.L.; Peng, J. Modeling the Spatial Pattern of Farmland Using GIS and Multiple Logistic Regression: A Case Study of Maotiao River Basin, Guizhou Province, China. Environ. Model. Assess. 2007, 12, 55–61. [Google Scholar] [CrossRef]
- Hu, Z.; Lo, C.P. Modeling Urban Growth in Atlanta Using Logistic Regression. Comput. Environ. Urban Syst. 2007, 31, 667–688. [Google Scholar] [CrossRef]
- Lam, N.S.N.; Quattrochi, D. On the Issues of Scale, Resolution, and Fractal Analysis in the Mapping Sciences. Prof. Geogr. 1992, 44, 88–98. [Google Scholar] [CrossRef]


| Year | Population of the PUAs | Total Population of the GCR | Percentage of Total Population (%) |
|---|---|---|---|
| 1996 | 2,857,468 | 13,230,496 | 21.6 |
| 2007 | 3,942,262 | 16,292,269 | 24.2 |
| 2017 * | 5,231,400 | 20,500,000 | 25.5 |
| Dataset | Source | Date |
|---|---|---|
| Landsat ETM+ for 2007 and Landsat 8 (OLI/TIRS) for 2017 | U.S. Geological Survey Resolution 30 m | 29 April 2007 1 October 2017 |
| Reference image for Landsat images | Google Earth Pro Resolution 60 m | April 2007 and October 2017 |
| Shapefiles of roads, regional services, water streams, industrial areas and urban centers | GOPP | Produced in 2009 |
| Population density | CAPMAS | 1996, 2007 and 2017 |
| Variable | Meaning | Nature of Variable |
|---|---|---|
| Dependent (Y) | 0: no urban expansion; 1: urban expansion | Dichotomous |
| X1 (dist_Rd) | Distance to nearest road | Continuous |
| X2 (dist_centrs serv.) | Distance to nearest center of regional services | Continuous |
| X3 (dist_wtr str.) | Distance to water streams | Continuous |
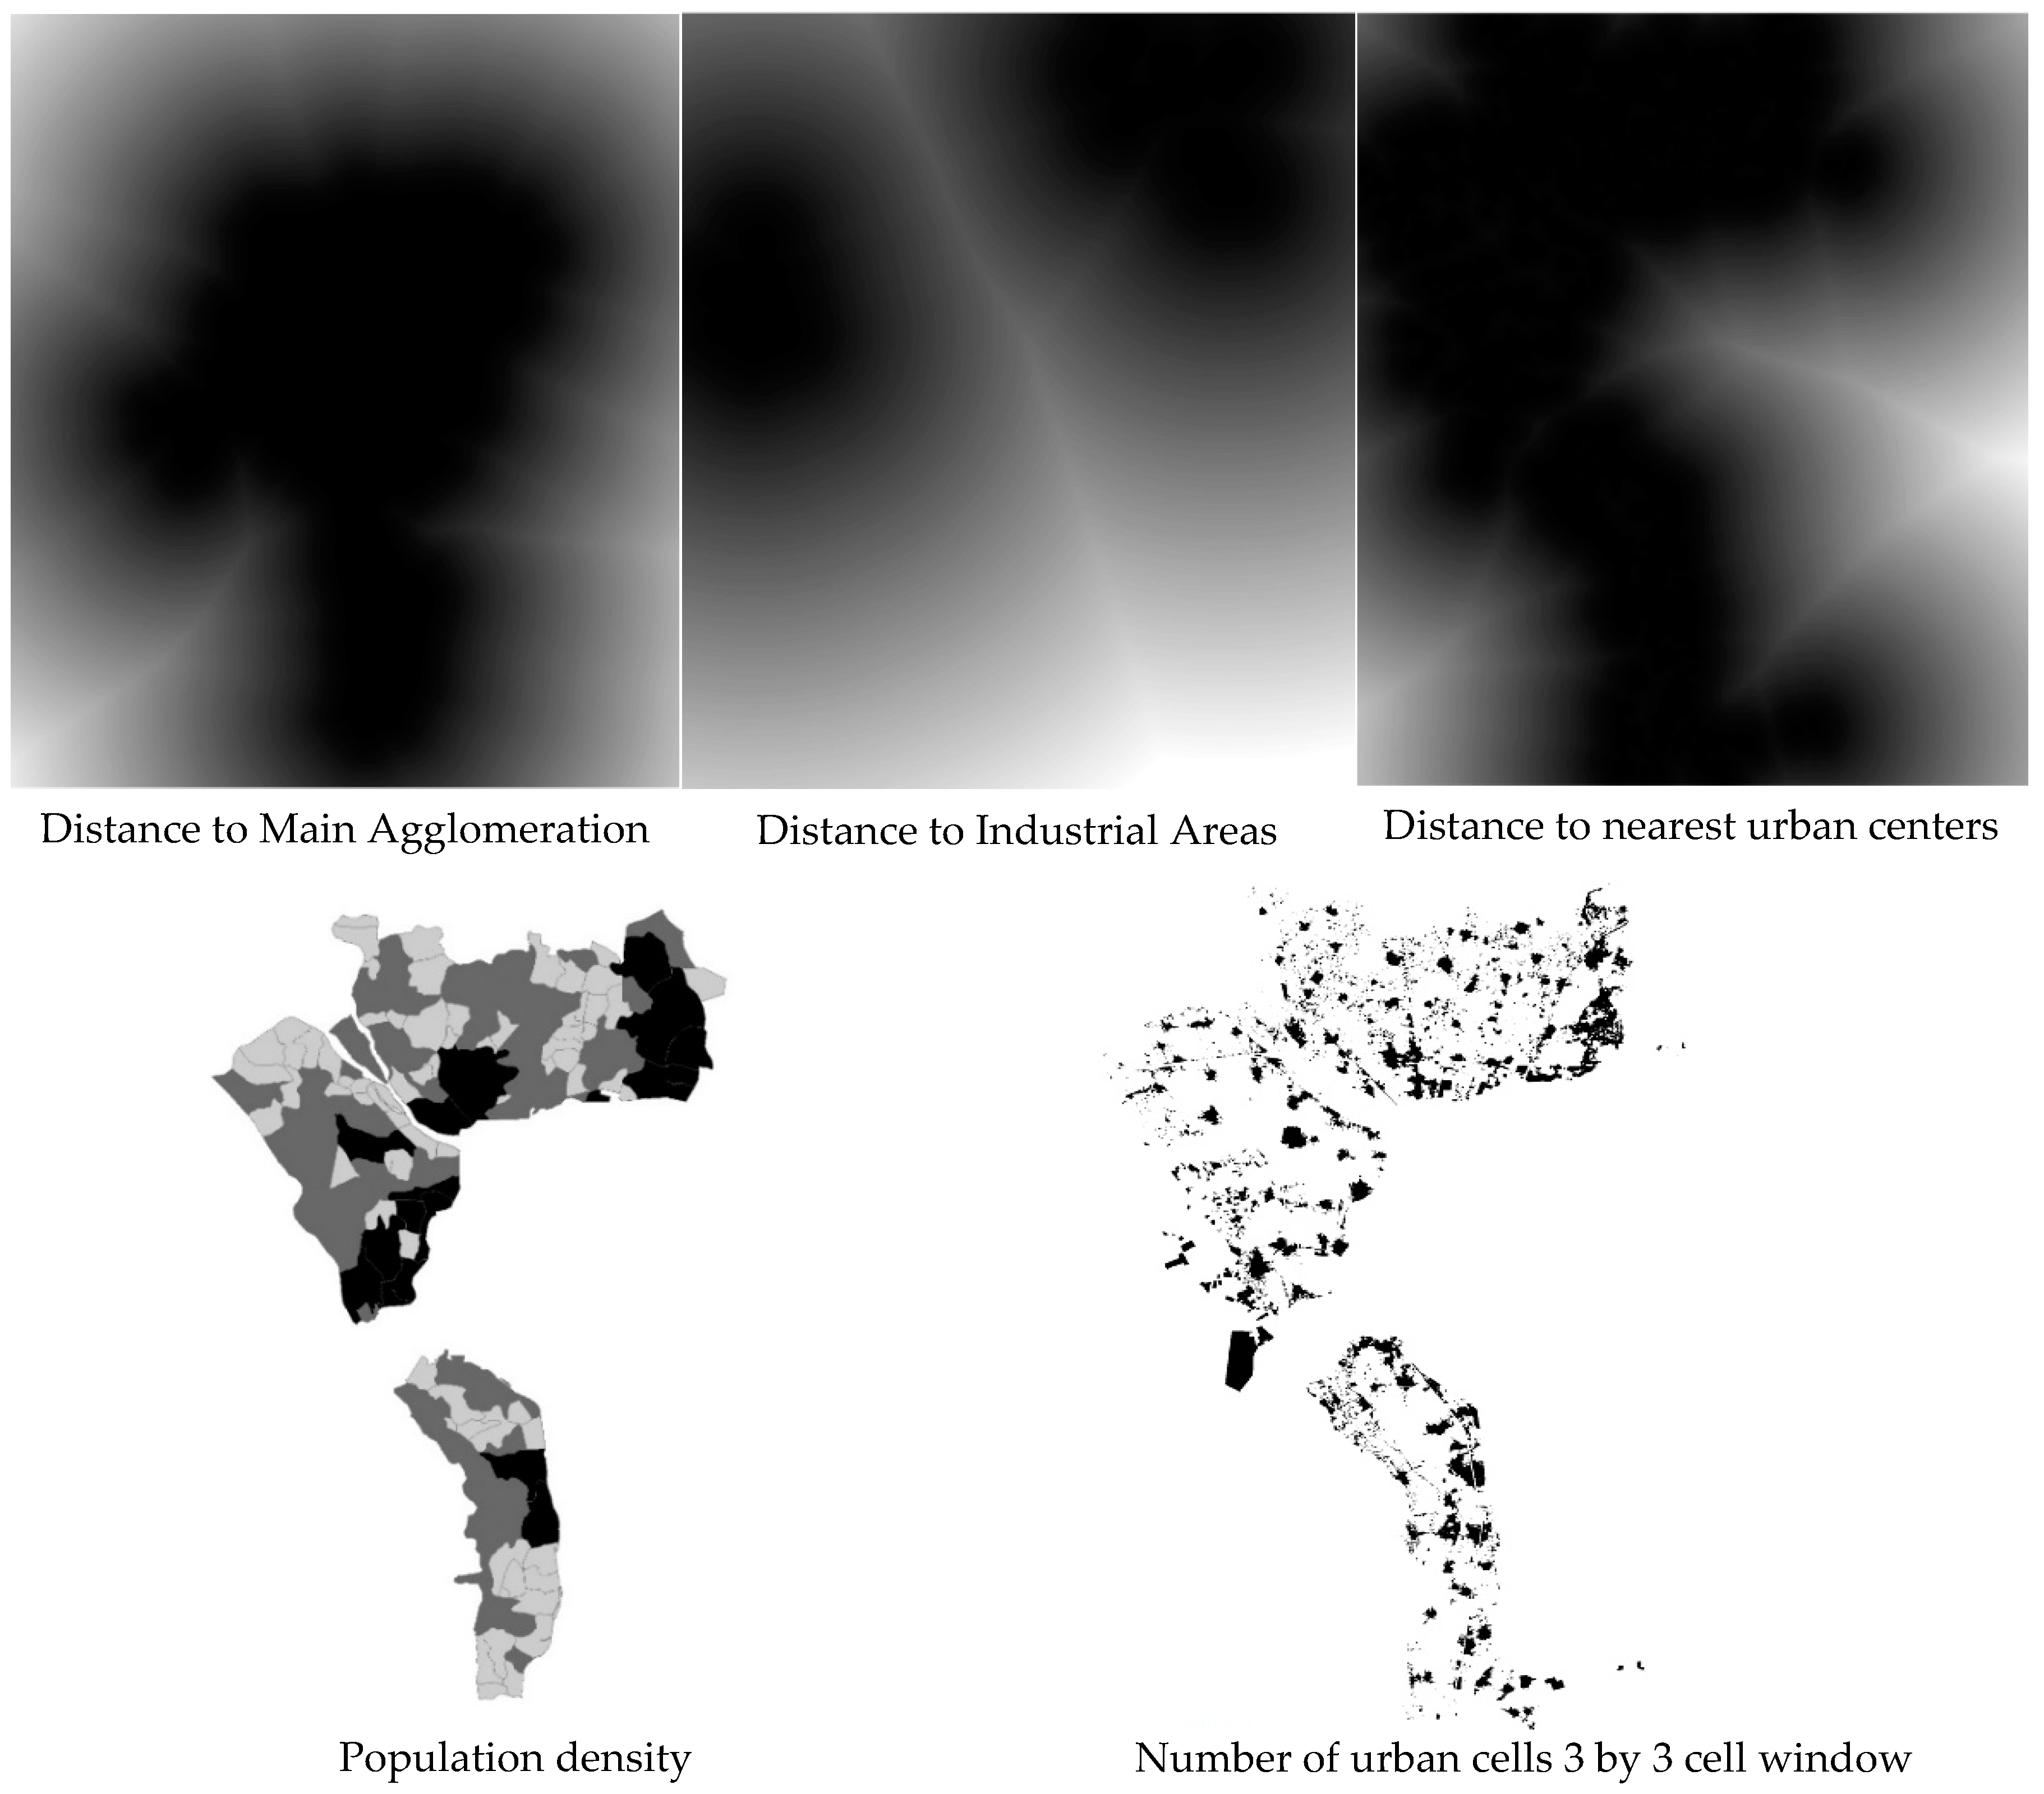
| X4 (dist_M.Agg.) | Distance to Main Agglomeration | Continuous |
| X5 (dist_Indust._Ar) | Distance to Industrial Areas | Continuous |
| X6 (dist_Urb_centrs) | Distance to nearest urban center | Continuous |
| X7 (Pop._Density) | Population density | Continuous |
| X8 (Nmbr_urb_cells3*3) | Number of urban cells within a 3 × 3 cell window | Continuous |
| Step | −2 Log(Likelihood) | Cox and Snell R2 | Nagelkerke R2 |
|---|---|---|---|
| 1 | 1744.354 | 0.76 | 0.90 |
| Model | Collinearity Statistics | |
|---|---|---|
| Tolerance | VIF | |
| X1 (dist_Rd) | 0.971 | 1.030 |
| X2 (dist_centrs serv.) | 0.620 | 1.613 |
| X3 (dist_wtr str.) | 0.908 | 1.101 |
| X4 (dist_M.Agg.) | 0.572 | 1.748 |
| X5 (dist_Indust._Ar) | 0.759 | 1.318 |
| X6 (dist_Urb_centrs) | 0.905 | 1.010 |
| X7 (Pop._Density) | 0.933 | 1.072 |
| X8 (Nmbr_urb_cells3*3) | 0.978 | 1.023 |
| Variable | Coefficient | Standard Error | Sig. | Odds Ratio i |
|---|---|---|---|---|
| X1 (dist_Rd) | −0.114 | 0.190 | 0.431 | 0.861 |
| X2 (dist_centrs serv.) | −0.000 | 0.000 | 0.129 | 1.000 |
| X3 (dist_wtr str.) | −0.000 | 0.000 | 0.281 | 1.000 |
| X4 (dist_M.Agg.) | −0.000 | 0.000 | 0.000 | 1.000 |
| X5 (dist_Indust._Ar) | −0.000 | 0.000 | 0.000 | 1.000 |
| X6 (dist_Urb_centrs) | −0.092 | 0.130 | 0.065 | 1.955 |
| X7 (Pop._Density) | 0.540 | 0.000 | 0.851 | 0.110 |
| X8 (Nmbr_urb_cells3*3) | 0.096 | 0.035 | 0.007 | 1.909 |
| Reality (Reference Image) | |||
|---|---|---|---|
| Urban Expansion (1) | No Urban Expansion (0) | ||
| Predicted Urban Expansion | Urban Expansion (1) | A (true positive) | B (false positive) |
| No Urban Expansion (0) | C (false negative) | D (true negative) | |
© 2019 by the authors. Licensee MDPI, Basel, Switzerland. This article is an open access article distributed under the terms and conditions of the Creative Commons Attribution (CC BY) license (http://creativecommons.org/licenses/by/4.0/).
Share and Cite
Salem, M.; Tsurusaki, N.; Divigalpitiya, P. Analyzing the Driving Factors Causing Urban Expansion in the Peri-Urban Areas Using Logistic Regression: A Case Study of the Greater Cairo Region. Infrastructures 2019, 4, 4. https://0-doi-org.brum.beds.ac.uk/10.3390/infrastructures4010004
Salem M, Tsurusaki N, Divigalpitiya P. Analyzing the Driving Factors Causing Urban Expansion in the Peri-Urban Areas Using Logistic Regression: A Case Study of the Greater Cairo Region. Infrastructures. 2019; 4(1):4. https://0-doi-org.brum.beds.ac.uk/10.3390/infrastructures4010004
Chicago/Turabian StyleSalem, Muhammad, Naoki Tsurusaki, and Prasanna Divigalpitiya. 2019. "Analyzing the Driving Factors Causing Urban Expansion in the Peri-Urban Areas Using Logistic Regression: A Case Study of the Greater Cairo Region" Infrastructures 4, no. 1: 4. https://0-doi-org.brum.beds.ac.uk/10.3390/infrastructures4010004