Consistency between Infrastructure Rating Systems in Measuring Sustainability

Department of Construction Management, Colorado State University, Campus Delivery 1584, Fort Collins, CO 80523-1584, USA
*
Author to whom correspondence should be addressed.
Infrastructures 2019, 4(1), 9; https://0-doi-org.brum.beds.ac.uk/10.3390/infrastructures4010009
Submission received: 14 November 2018
/
Revised: 20 February 2019
/
Accepted: 22 February 2019
/
Published: 28 February 2019
(This article belongs to the Special Issue Sustainable Transportation Infrastructures)
Abstract
:To date, several transportation sustainability rating systems (TSRS) have been developed to measure and promote sustainability. However, studies show that these TSRS have not been developed with a consistent sustainability scope. This raises the question of the consistency of these TSRS in measuring the sustainability of transportation projects. This study assesses how three prominent TSRS (Envision, INVEST, and GreenLITES) rate the sustainability performance of transportation projects with the goal of determining if a consistency exists in the way these three TSRS measure sustainability. These three TSRS are applied to five transportation projects. The results showed that these three rating tools assess and reward sustainability practices differently. Additionally, results suggest that it may be easier for a project to get awarded in GreenLITES compared to the other two TSRS. Notwithstanding all of the above, a consistency was noted in all three rating systems in the quality of life/social performance of projects. This study helps to inform stakeholders in the transportation industry on how transportation projects perform when run through each of these rating systems. This will help stakeholders to make informed decisions with respect to choosing one (or more) TSRS to assess their projects with and evaluating the results obtained from such TSRS.
1. Introduction
In recent years, there has been an increase in the development of transportation sustainability rating systems (TSRS) [1]. Systems such as Envision, Illinois livable and sustainable transportation (I-LAST), the sustainable transportation analysis system (STARS), the infrastructure voluntary evaluation sustainability tool (INVEST), green leadership in transportation and environmental sustainability (GreenLITES), and a few others have been developed to measure a project’s performance with respect to the triple bottom line [2,3,4,5,6]. Some of the TSRS are based solely on self-assessment, while others are based on third-party verification and certification [7]. These systems have been developed with the intent of enhancing sustainability outcomes in the design and construction of transportation projects [8]. However, studies show that these TSRS have not been developed with a consistent sustainability scope [1,7]. Given this, a project run through more than one of these rating systems may be high-performing on one rating system and low-performing on another. This brings about the question of the consistency of these rating systems in measuring sustainability. Thus, there is a need to evaluate multiple TSRS to determine if a consistency exists in the way the systems measure sustainability in transportation projects.
The purpose of this study was to assess how three prominent transportation sustainability rating systems, Envision, INVEST, and GreenLITES, rate the performance of transportation projects with the ultimate goal of determining if a consistency exists in the way these three TSRS measure sustainability. Envision is a third-party rating system developed by Zofnass Institute in alliance with the Institute for Sustainable Infrastructure, INVEST is a self-assessed rating system developed by the Federal Highway Administration, and GreenLITES is a self-assessed rating system developed in-house by the New York State Department of Transportation (NYSDOT) for internal use. These rating systems were chosen because of their unique parameters, i.e., third-party rating system, self-assessed rating system, and self-assessed rating system developed in-house. These classification criteria are important because they identify the differences in how a TSRS is developed and utilized, which may potentially explain the differences in the results obtained when they are used to rate the same projects as discussed in detail later in this paper. It is important to note that while there are other TSRS which also fall under these criteria and could have been used instead of or in addition to the three TSRS included in this study, the ones included in this study were selected due to their prominence and popularity in their respective categories.
This paper is organized as follows: The paper provides a brief review of existing literature on TSRS; discusses the materials and methods used in this study; presents the results of the study; and provides discussion and conclusions. The information and results with respect to only one project are discussed in detail in this paper to serve as an example. The same processes of rating and comparative assessment were used on all five projects.
It is important to note that while the authors have reported on the highlights of this research in an extended abstract [9], this paper provides the full details of the research on the methodology, analysis, and findings.
2. Literature Review
Sustainable development is a concept that has gained much ground all over the world due to the solutions and benefits it provides to the increasing issues faced by our environment. Implementing the use of sustainable rating systems to measure the usefulness and efficiency of projects experienced great growth in the building sector, with the development and use of rating systems such as the leadership in energy and environmental design (LEED) green building-rating system [10], which was developed in 1993 and is the most commonly used green building rating system. A few others are GBTool, the living building challenge net zero housing system, the Building Research Establishment’s environmental assessment method, and green globes [6].
Recent years have seen a notable increase in the development of transportation sustainability rating systems as well [1], with numerous newly developed systems such as Envision, I-LAST, STARS, INVEST, GreenLITES, Greenroads, GreenPave, Green Guide for Roads, BE2ST-in-Highways, and CEEQUAL [6]. While a literature review on each one of these rating systems is beyond the scope of this paper, the reader is referred to References [2,4,6], which provide detailed information on each of these rating systems. Instead, this paper provides a summary of the three TSRS investigated in this research in Table 1.
Given the number of transportation sustainability rating systems that has been developed in the past years, the sustainability scope covered by each of them, and their context sensitivity, a recent study was carried out to provide a framework for selecting transportation sustainability rating systems that are most applicable to different state departments of transportation [2,6,11]. Another study was performed to analyze how four rating systems (infrastructure sustainability (IS); Envision; CEEQUAL; and Greenroads) recognize sustainability performance by applying all four rating systems to a New Zealand highway viaduct project (i.e., a single project) [8]. Additionally, there is research on TSRS which focused on the application of one TSRS to a single project or to multiple projects [8,12,13]. Using these studies as groundwork, this research is set to assess how three rating systems; ENVISION—a third-party rating system—and INVEST—a self-assessed rating system—and GreenLITES—a self-assessed in-house rating system—rate the performance of rehabilitation, reconstruction, and safety improvement projects, with the ultimate purpose of determining if a consistency exists in the way these TSRS measure sustainability.
3. Materials and Methods
Five rehabilitation, reconstruction, and safety improvement projects from the NYSDOT were studied in this research. The project information was downloaded from publicly available information on the NYSDOT website. The research was initially aimed at studying entirely new projects or rehabilitation projects. However, it was discovered from going through the publicly available data on NYSDOT’s website that most of the projects fell under one of the abovementioned three categories. The variation between the selected projects was a result of the constraints with respect to data availability.
The methodology applied in this study involved performing assessments, for the five projects studied, using the three rating systems. The ratings for Envision and INVEST were performed by one of the authors, who is a certified Envision sustainability professional. The ratings were performed using the project information available to the public. The ratings for GreenLITES were readily available at the beginning of this study, and GreenLITES scorecards were received from the NYSDOT. It is important to note that GreenLITES is a self-certification program and that these GreenLITES scorecards have not gone through any verification or review process.
In running the projects through the rating system, an important step was to identify credits/criteria that are applicable to the project based on its context [8]. The location of a project as well as the project type and scope, among other things, were used to determine the credits/criteria that may or may not apply to the project. For instance, for a project located in a rural area with no residents or business around, it may not be required to incorporate high occupancy vehicle (HOV) lanes. The Envision rating system was the only system that gave the option of manually selecting credits that did not apply to the project [14]. The project development module of the INVEST rating system, which was applied in this study, has seven scorecards, one of which can be selected to rate a project depending on the project type [15]. The selected scorecard automatically scopes out credits that are considered irrelevant to the project type. The GreenLITES rating system neither gave the option of selecting applicable credits nor did it automatically scope out any credit. Therefore, all 175 credits contained in the GreenLITES rating system were considered in the rating of the five projects studied in this research. Once the applicable credits/criteria were selected, each project was scored and rated with each rating system. Following the methodology outlined in Reference [8], the rating process involved assessing the project’s sustainability practices against the requirement of the credits/criteria of each rating system and developing normalized scores. The total score for each rating system was identified, and an award level was given to each of the five projects for each rating system. This methodology addresses a limitation identified in Reference [8] in that not just a single but multiple projects (five) are run through each rating system. More data points resulting from this approach are likely to yield to more confidence in identifying consistencies (or lack thereof).
As suggested in Reference [8], the ratings for the project were performed using the spreadsheets, online tools, and manuals/guides for each rating system. The results obtained from the ratings were analyzed based on how the projects performed in each category of the rating system as well as their overall performance on each rating system. The results obtained from running each of the projects through the three rating systems were compared. The results were compared consistently by comparing criteria/credits/categories that fall under each aspect of the triple bottom line (economic, social, and environmental). Consistencies were investigated by looking out for similarities or differences in a project’s performance in each category of the three rating systems being investigated as well as their overall performance on these rating systems. The triple bottom line has been addressed under five categories in this study: Environment, quality of life/social, material, energy, and water quality. This is mainly because the last three categories (material, energy, and water) cover credits/criteria that are related to both the environmental and economic aspects of the triple bottom line. For example, the use of renewable energy as well as managing stormwater have both environmental and economic implications.
4. Results
The information and results with respect to only one project are discussed in detail in this paper to serve as an example. The same processes of rating and comparative assessment were used on all five projects. Discussion of findings at the end of this paper include the results for all five projects run through each of the three TSRS.
4.1. Description of Project 1
Project 1 is a highway reconstruction project carried out on a mile of route 5S in the City of Utica, Oneida County, New York, USA [16]. This project has been identified to have a crash rate higher than the statewide average rate. The project, therefore, aims to address this safety concern along route 5S by reducing the potential for vehicle conflicts, reducing the overall accident rates within the project limits, improving the overall operational conditions of roadway, improving pedestrian and bicyclist safety, access, and mobility using complete street strategies, providing Americans with Disabilities Act (ADA)-compliant facilities supporting projects and initiatives for economic revitalization of the project area and creating an attractive gateway to downtown Utica [17,18].
The work to be carried out consists of reconfiguration and reconstruction of significant portions of route 5S, lane reductions/removal, construction of a roundabout at the intersection with John Street, significant improvements to pedestrian and bicycle accommodations and facilities, pavement markings, new/modified overhead sign structures, new/replacement signals, and the addition of substantial landscaping to enhance the aesthetic of the project corridor [17,18].
4.2. High-Level Results for Project 1
Table 2 shows how Project 1 performed on the three rating systems.
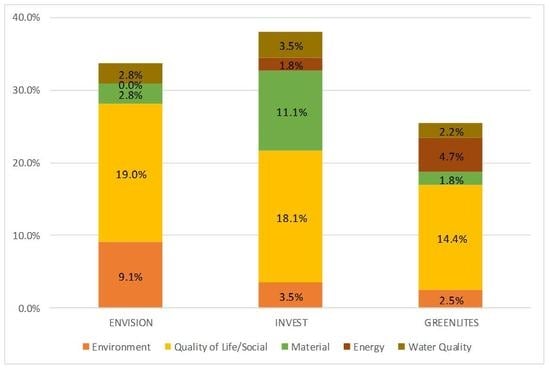
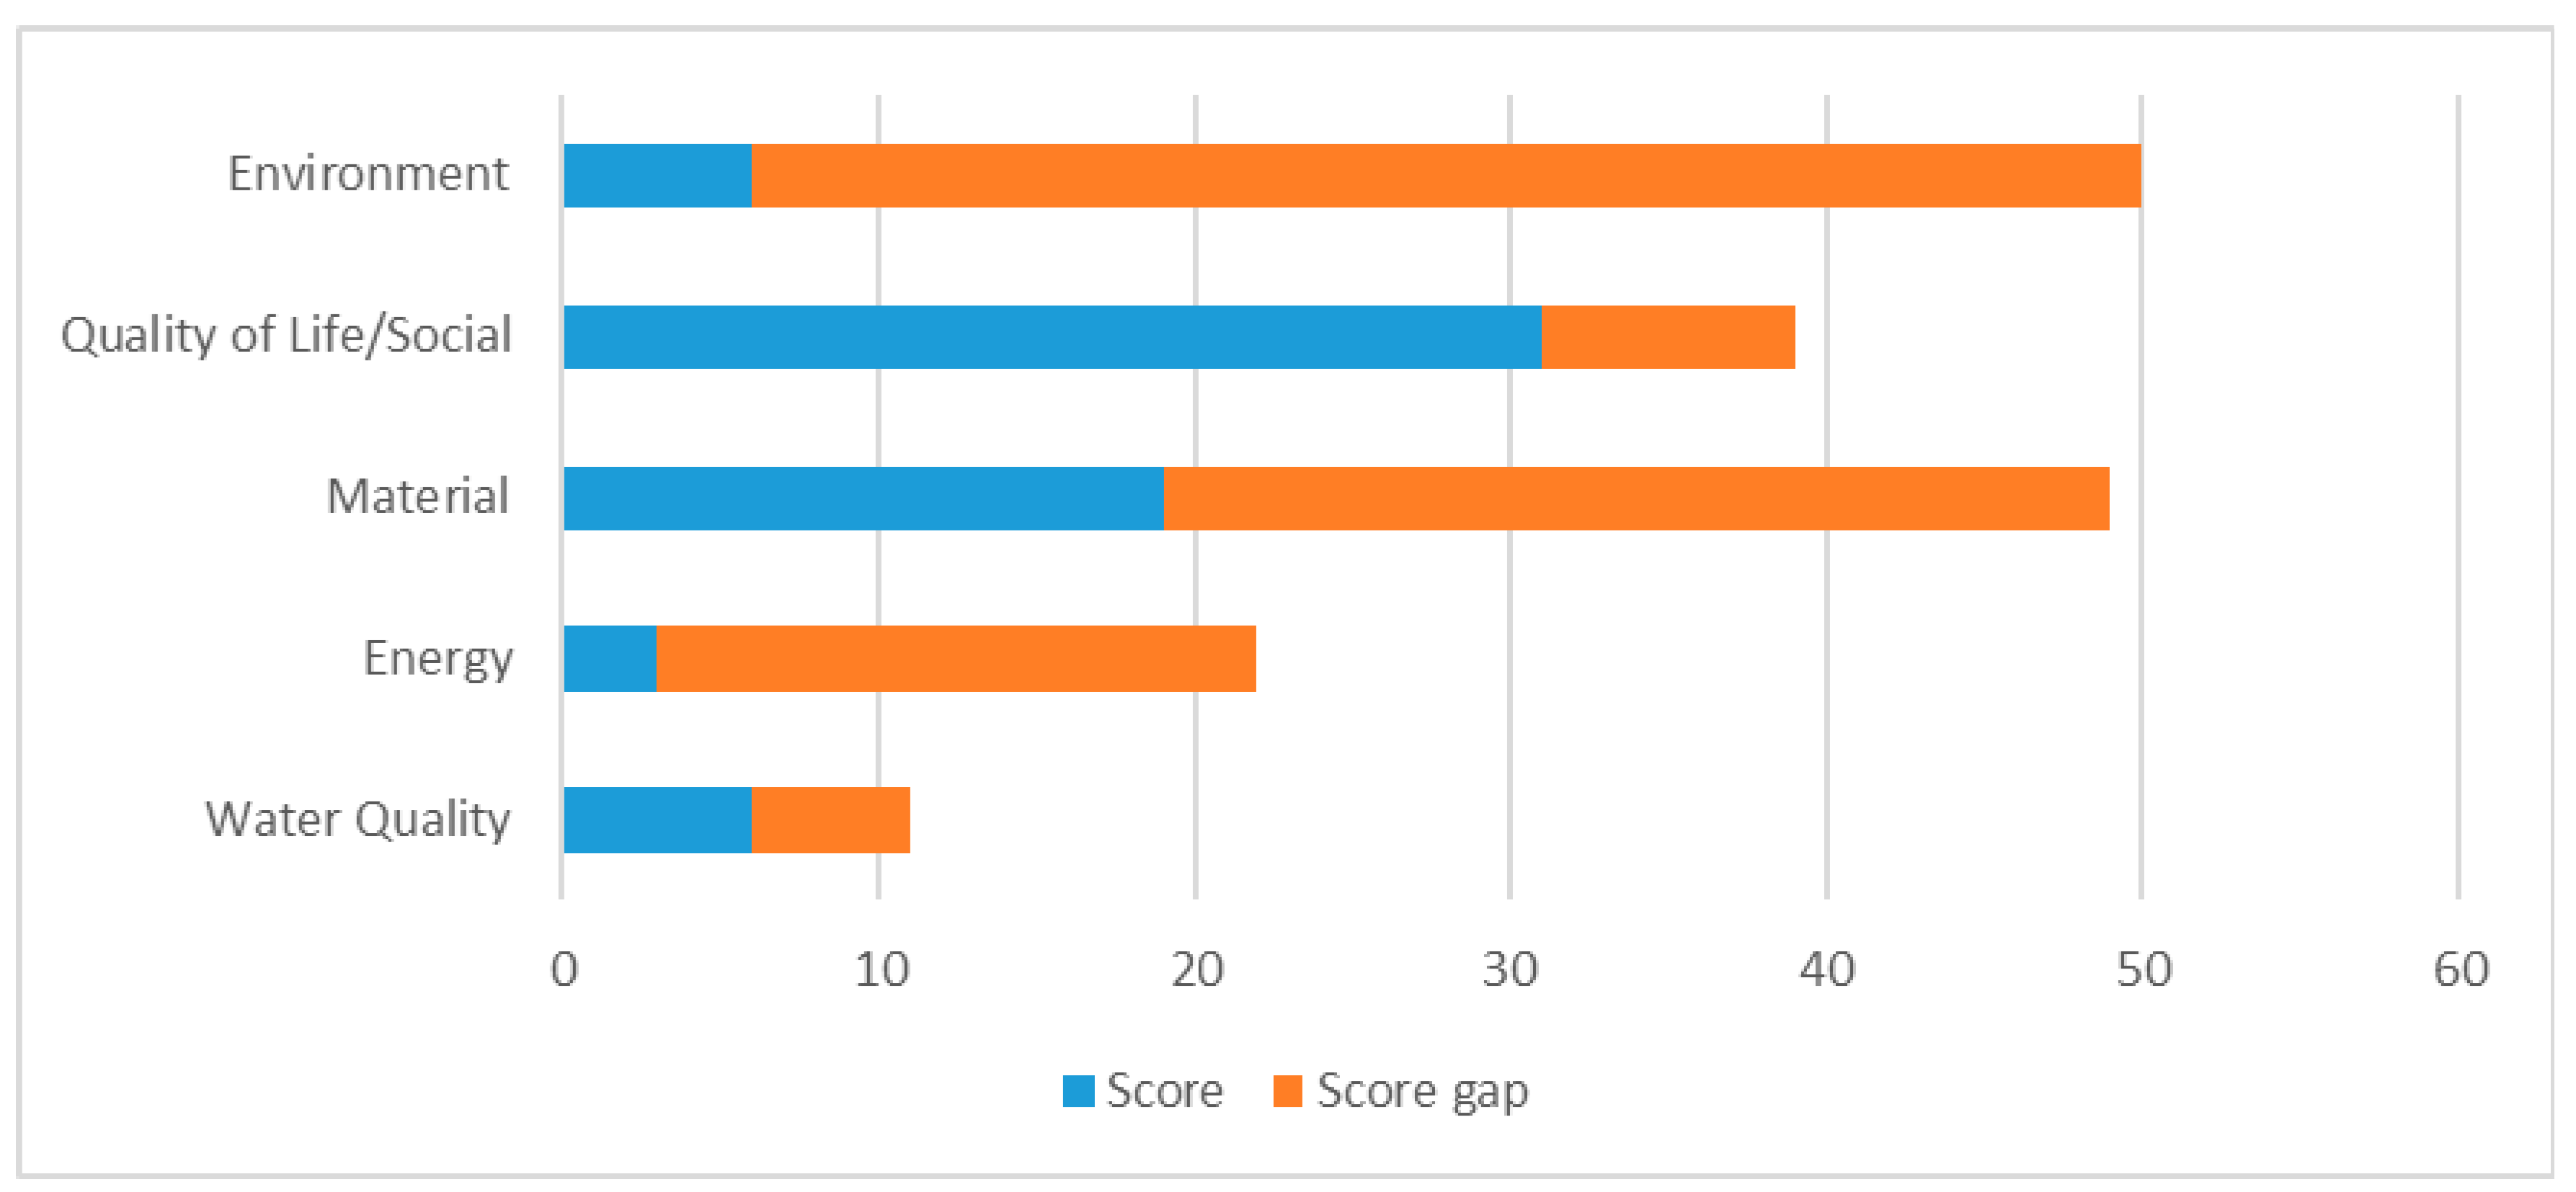
Figure 1 shows the points achieved across the five categories of the triple bottom line used in this research. This project, like the other projects that are in the scope of this study, yielded an uneven distribution of points achieved under the categories of the triple bottom line.
4.3. Detailed Results for Project 1 Using the Envision Rating System
In the Envision rating system, Project 1 had a normalized score of 33.7% resulting from a score of 230 points out of 683 applicable points. Eleven credits were scoped out due to their inapplicability to the project. These credits are: Address conflicting regulations and policies, protect wetlands and surface water, preserve prime farmland, avoid adverse geology, preserve floodplain functions, avoid unsuitable development on steep slope, reduce pesticides and fertilizer impacts, control invasive species, maintain wetland and surface water functions, reduce air pollutant emissions, and manage heat island effects. These credits were scoped out based on information provided in the project documents used to carry out the ratings for this project. The project site has no wetland, public space, and prime farmland around it. No points were given for innovation in all categories. Hence, all five innovation credits were inapplicable to the project.
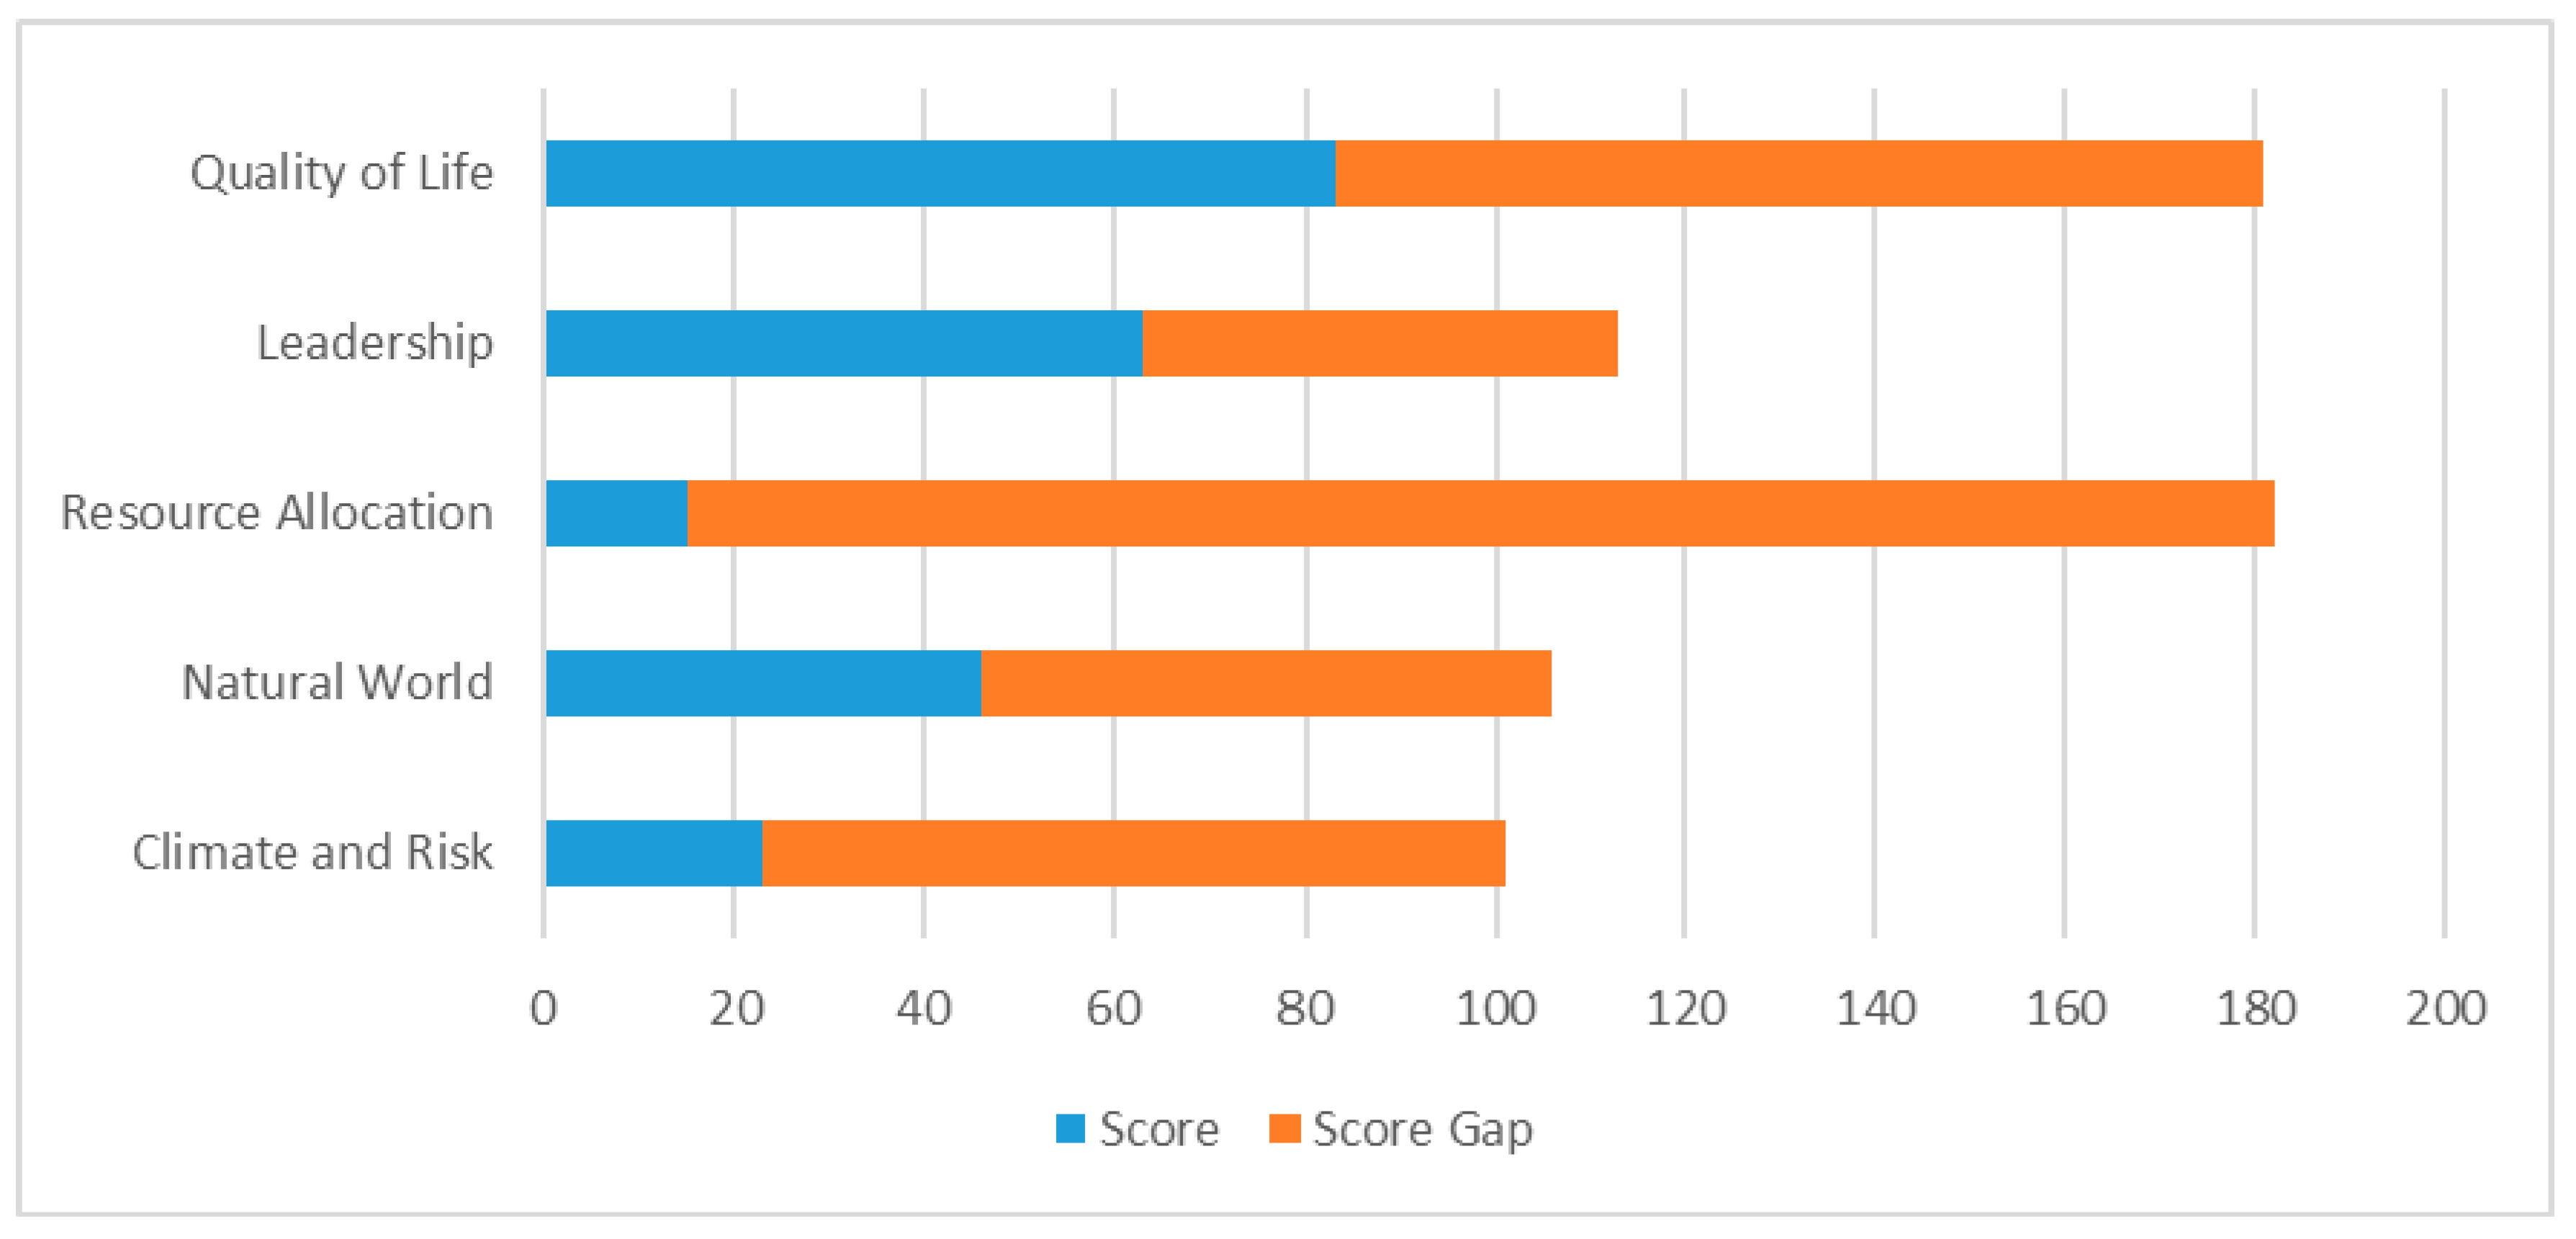
Forty-four (44) credits out of the sixty (60) credits in the Envision rating system were applicable to this project. Project 1 scored no points in 14 of the applicable credits. Figure 2 shows the points the project earned across the categories in the Envision rating system in relation to the applicable points for each category. For example, in the quality of life category, the project scored 83 points out of 181 applicable points.
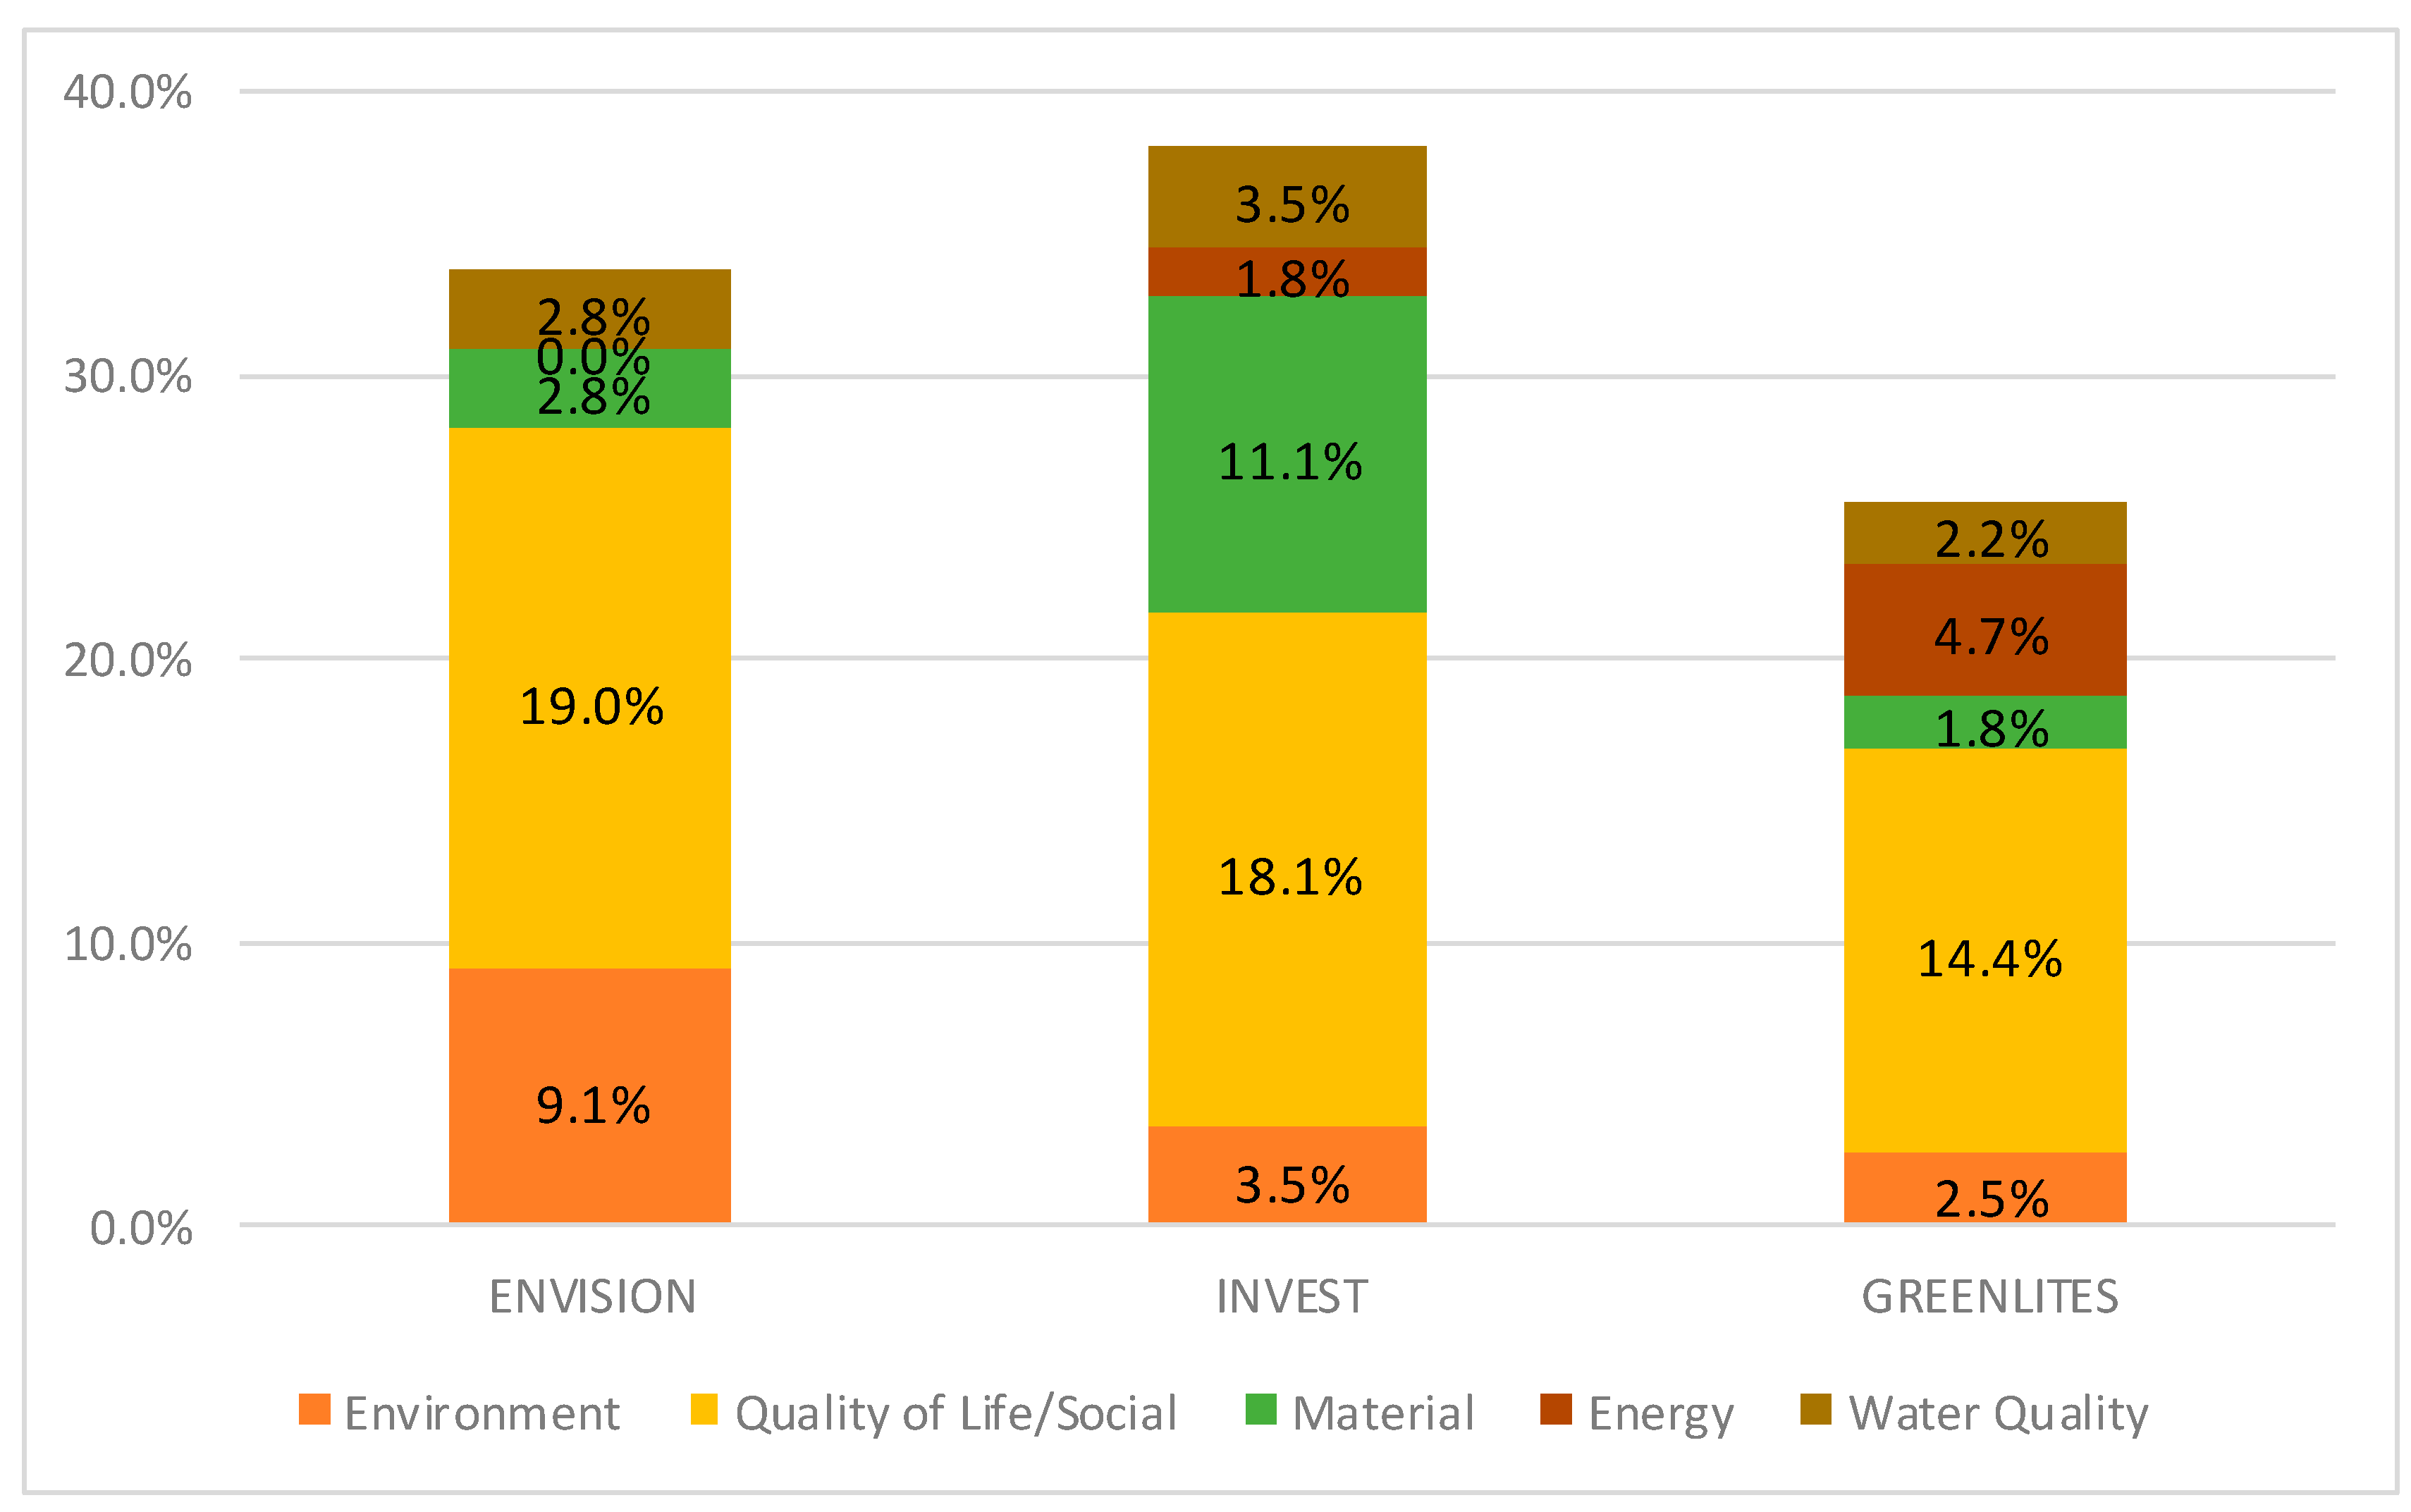
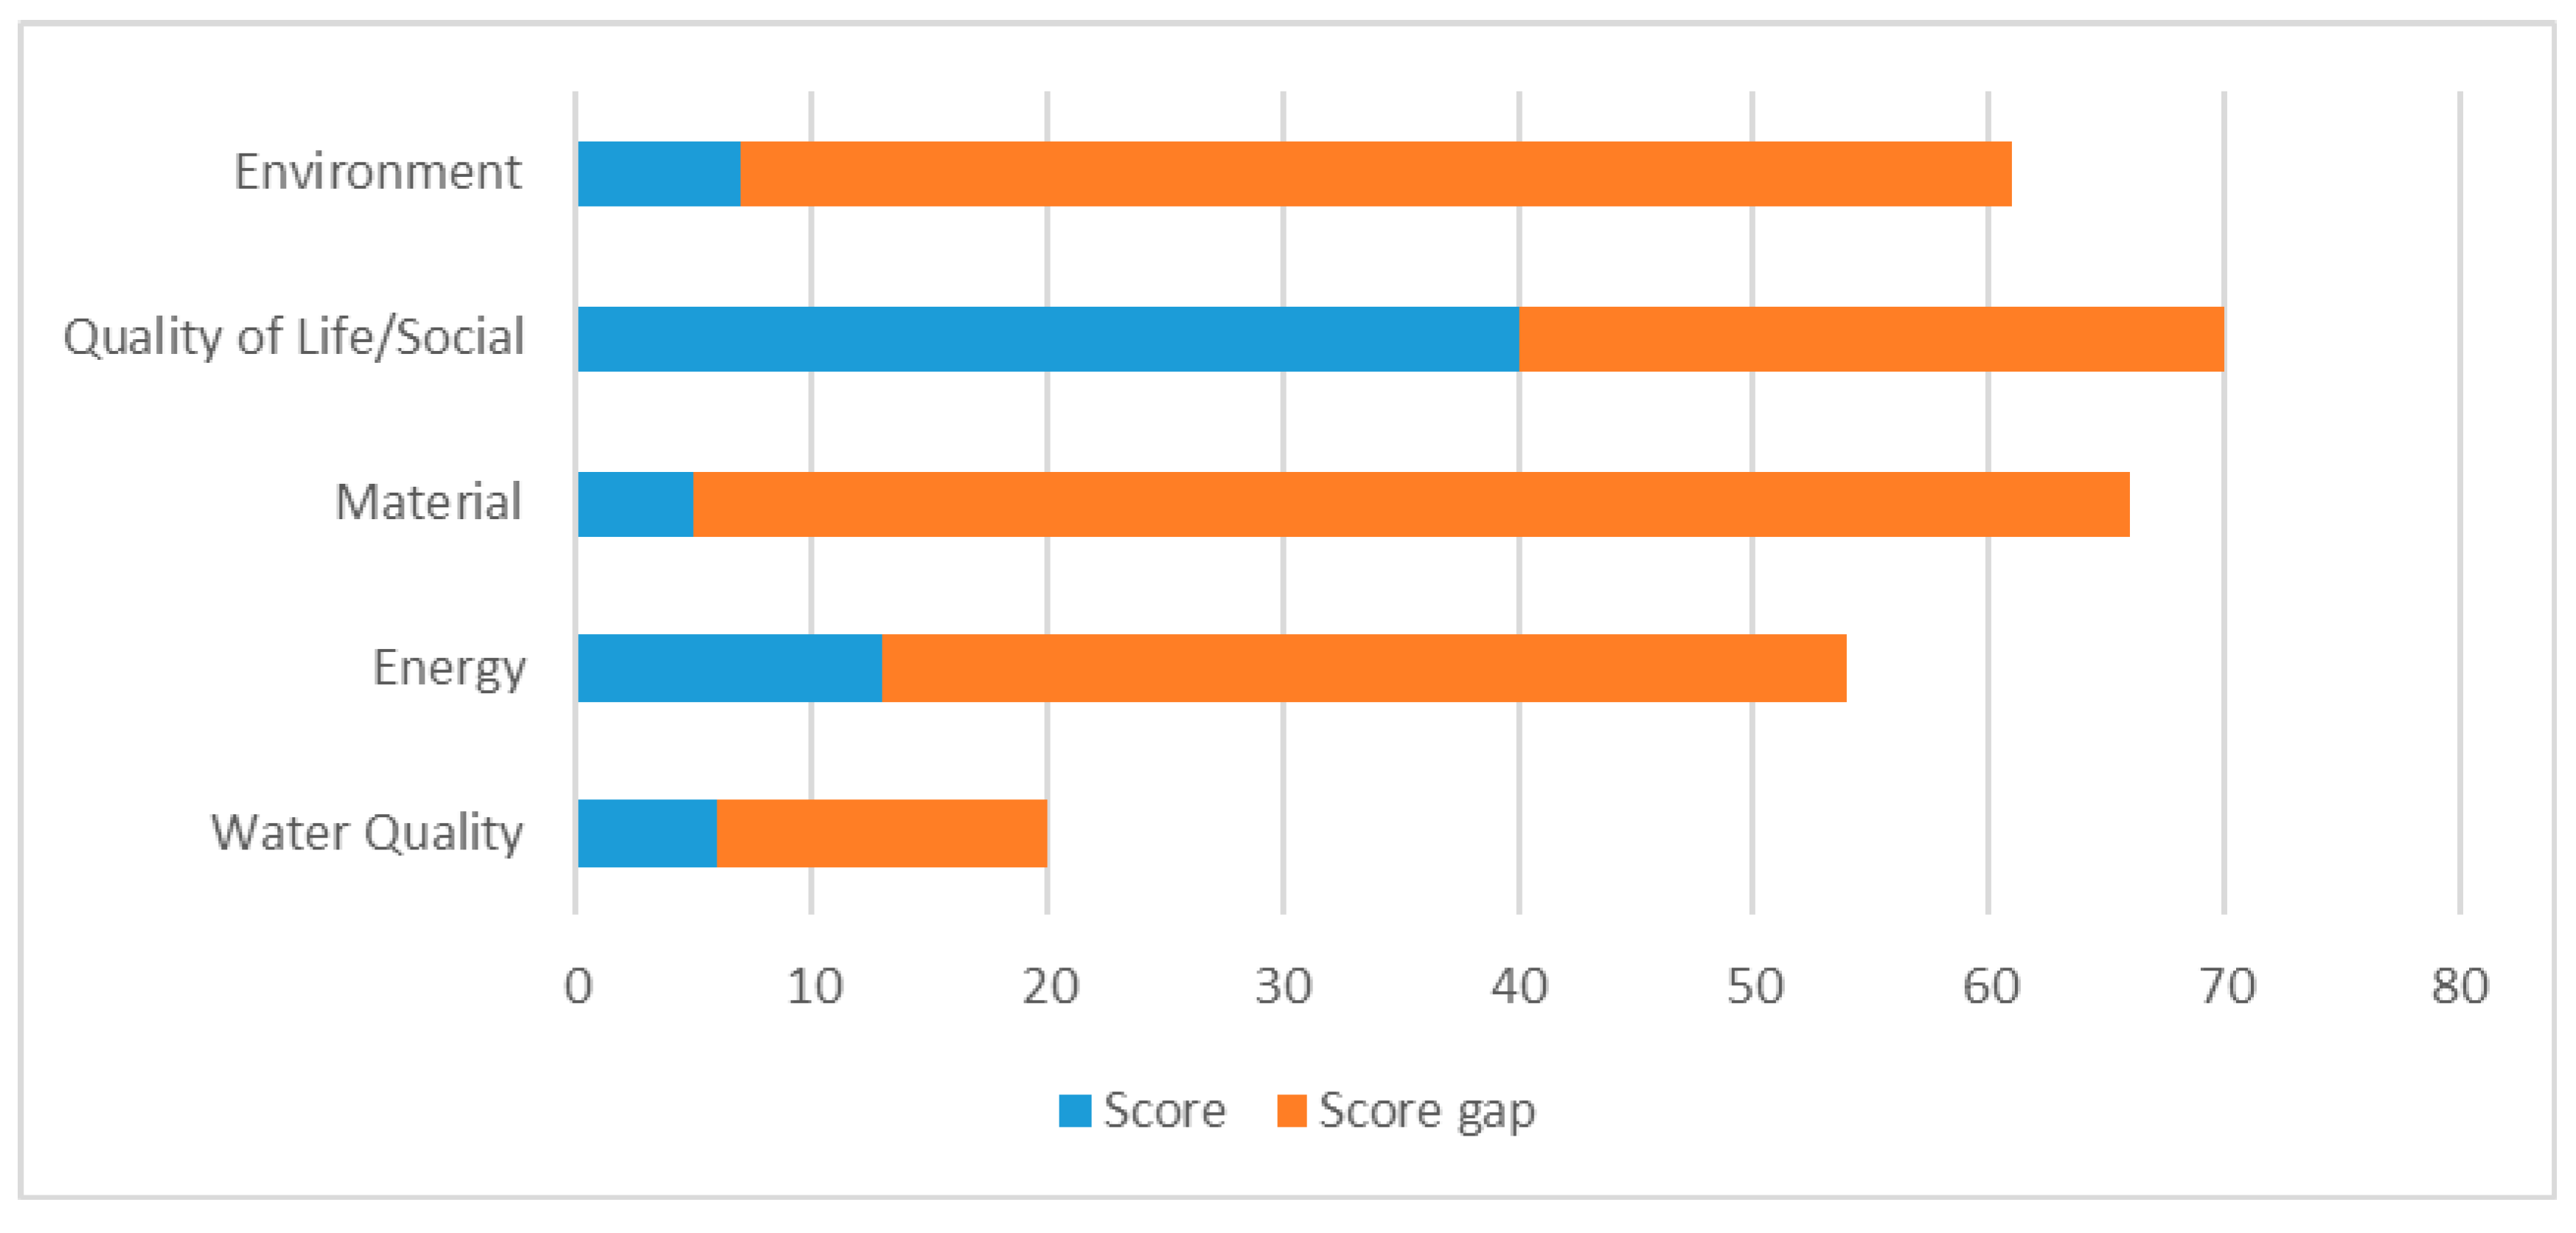
The credits under the Envision rating system were split into the five categories of the triple bottom line used in this research. The credits were split based on what aspect of the five categories they are related to. Figure 3 displays the points the project earned in each category in relation to the applicable points for each category.
The Environment category is made up of two applicable credits under the Leadership category, namely: Improve Infrastructure integration and plan for long-term monitoring and maintenance; four applicable credits under the natural world category namely: Preserve prime habitat, preserve greenfields, preserve species biodiversity, and restore disturbed soils; and five applicable credits under the climate and Risk category namely: Reduce greenhouse gas emissions, assess climate threats, avoid traps and vulnerabilities, prepare for long-term adaptability, and prepare for long-term hazards. In this category, Project 1 earned 62 points out of 194 applicable points.
The quality of life/social category is made up of 12 applicable credits under the quality of life category, namely: Improve community quality of life, stimulate sustainable growth and development, develop local skills and capabilities, enhance public health and safety, minimize noise and vibration, minimize light pollution, improve community mobility and access, encourage alternative modes of transportation, improve site accessibility, safety and wayfinding, preserve historic and cultural resources, preserve views and local character, and enhance public space; five credits under the Leadership category, namely: Provide effective leadership and commitment, establish a sustainability management system, foster collaboration and teamwork, provide for stakeholder involvement, and extend useful life. In this category, Project 1 earned 130 points out of 253 applicable points.
The Material category is made up of one applicable credit under the leadership category, namely: Pursue byproduct synergy opportunities; and seven applicable credits under the resource allocation category, namely: Reduce net embodied energy, support sustainable procurement practices, use recycled materials, use regional materials, divert waste From landfills, reduce excavated materials taken off site, and provide for deconstruction and recycling. In this category, Project 1 earned 19 points out of 95 applicable points.
The Energy category is made up of three applicable credits under the resource allocation category, namely: Reduce energy consumption, use renewable energy and commission, and monitor energy systems. In this category, Project 1 earned 0 points out of 49 applicable points.
The water quality category is made up of three applicable credits under the resource allocation category, namely: Protect fresh water availability, reduce potable water consumption, and monitor water systems; and two applicable credits under the natural world category, namely: Manage stormwater, and prevent surface and groundwater contamination. In this category, Project 1 earned 19 points out of 92 applicable points.
4.4. Detailed Results for Project 1 Using the INVEST Rating System
The project development module of the INVEST rating system was applied in this study. The scorecard selected was the extended urban scorecard, which is used in the urban construction project of a new roadway facility or structure where nothing of its kind currently exists and major reconstruction projects that add travel lanes to an existing roadway or bridge. This scorecard was selected because the project involved the construction of a new traffic roundabout in an urban area. With this scorecard, all 33 criteria contained in the project development module were applicable to Project 1. Project 1 scored no points in 14 of these criteria. The project had an overall score of 65 points out of 171 achievable points. This score was normalized to 38%. A distinct feature of the INVEST rating system is that it is not divided into categories. Thus, the project performance will only be discussed with respect to the triple bottom line.
The criteria under the INVEST rating system were split into the five categories of the triple bottom line used in this research. The criteria were split based on what aspect of the five categories they are related to. Figure 4 shows the points the project earned in each category in relation to the applicable points for each category.
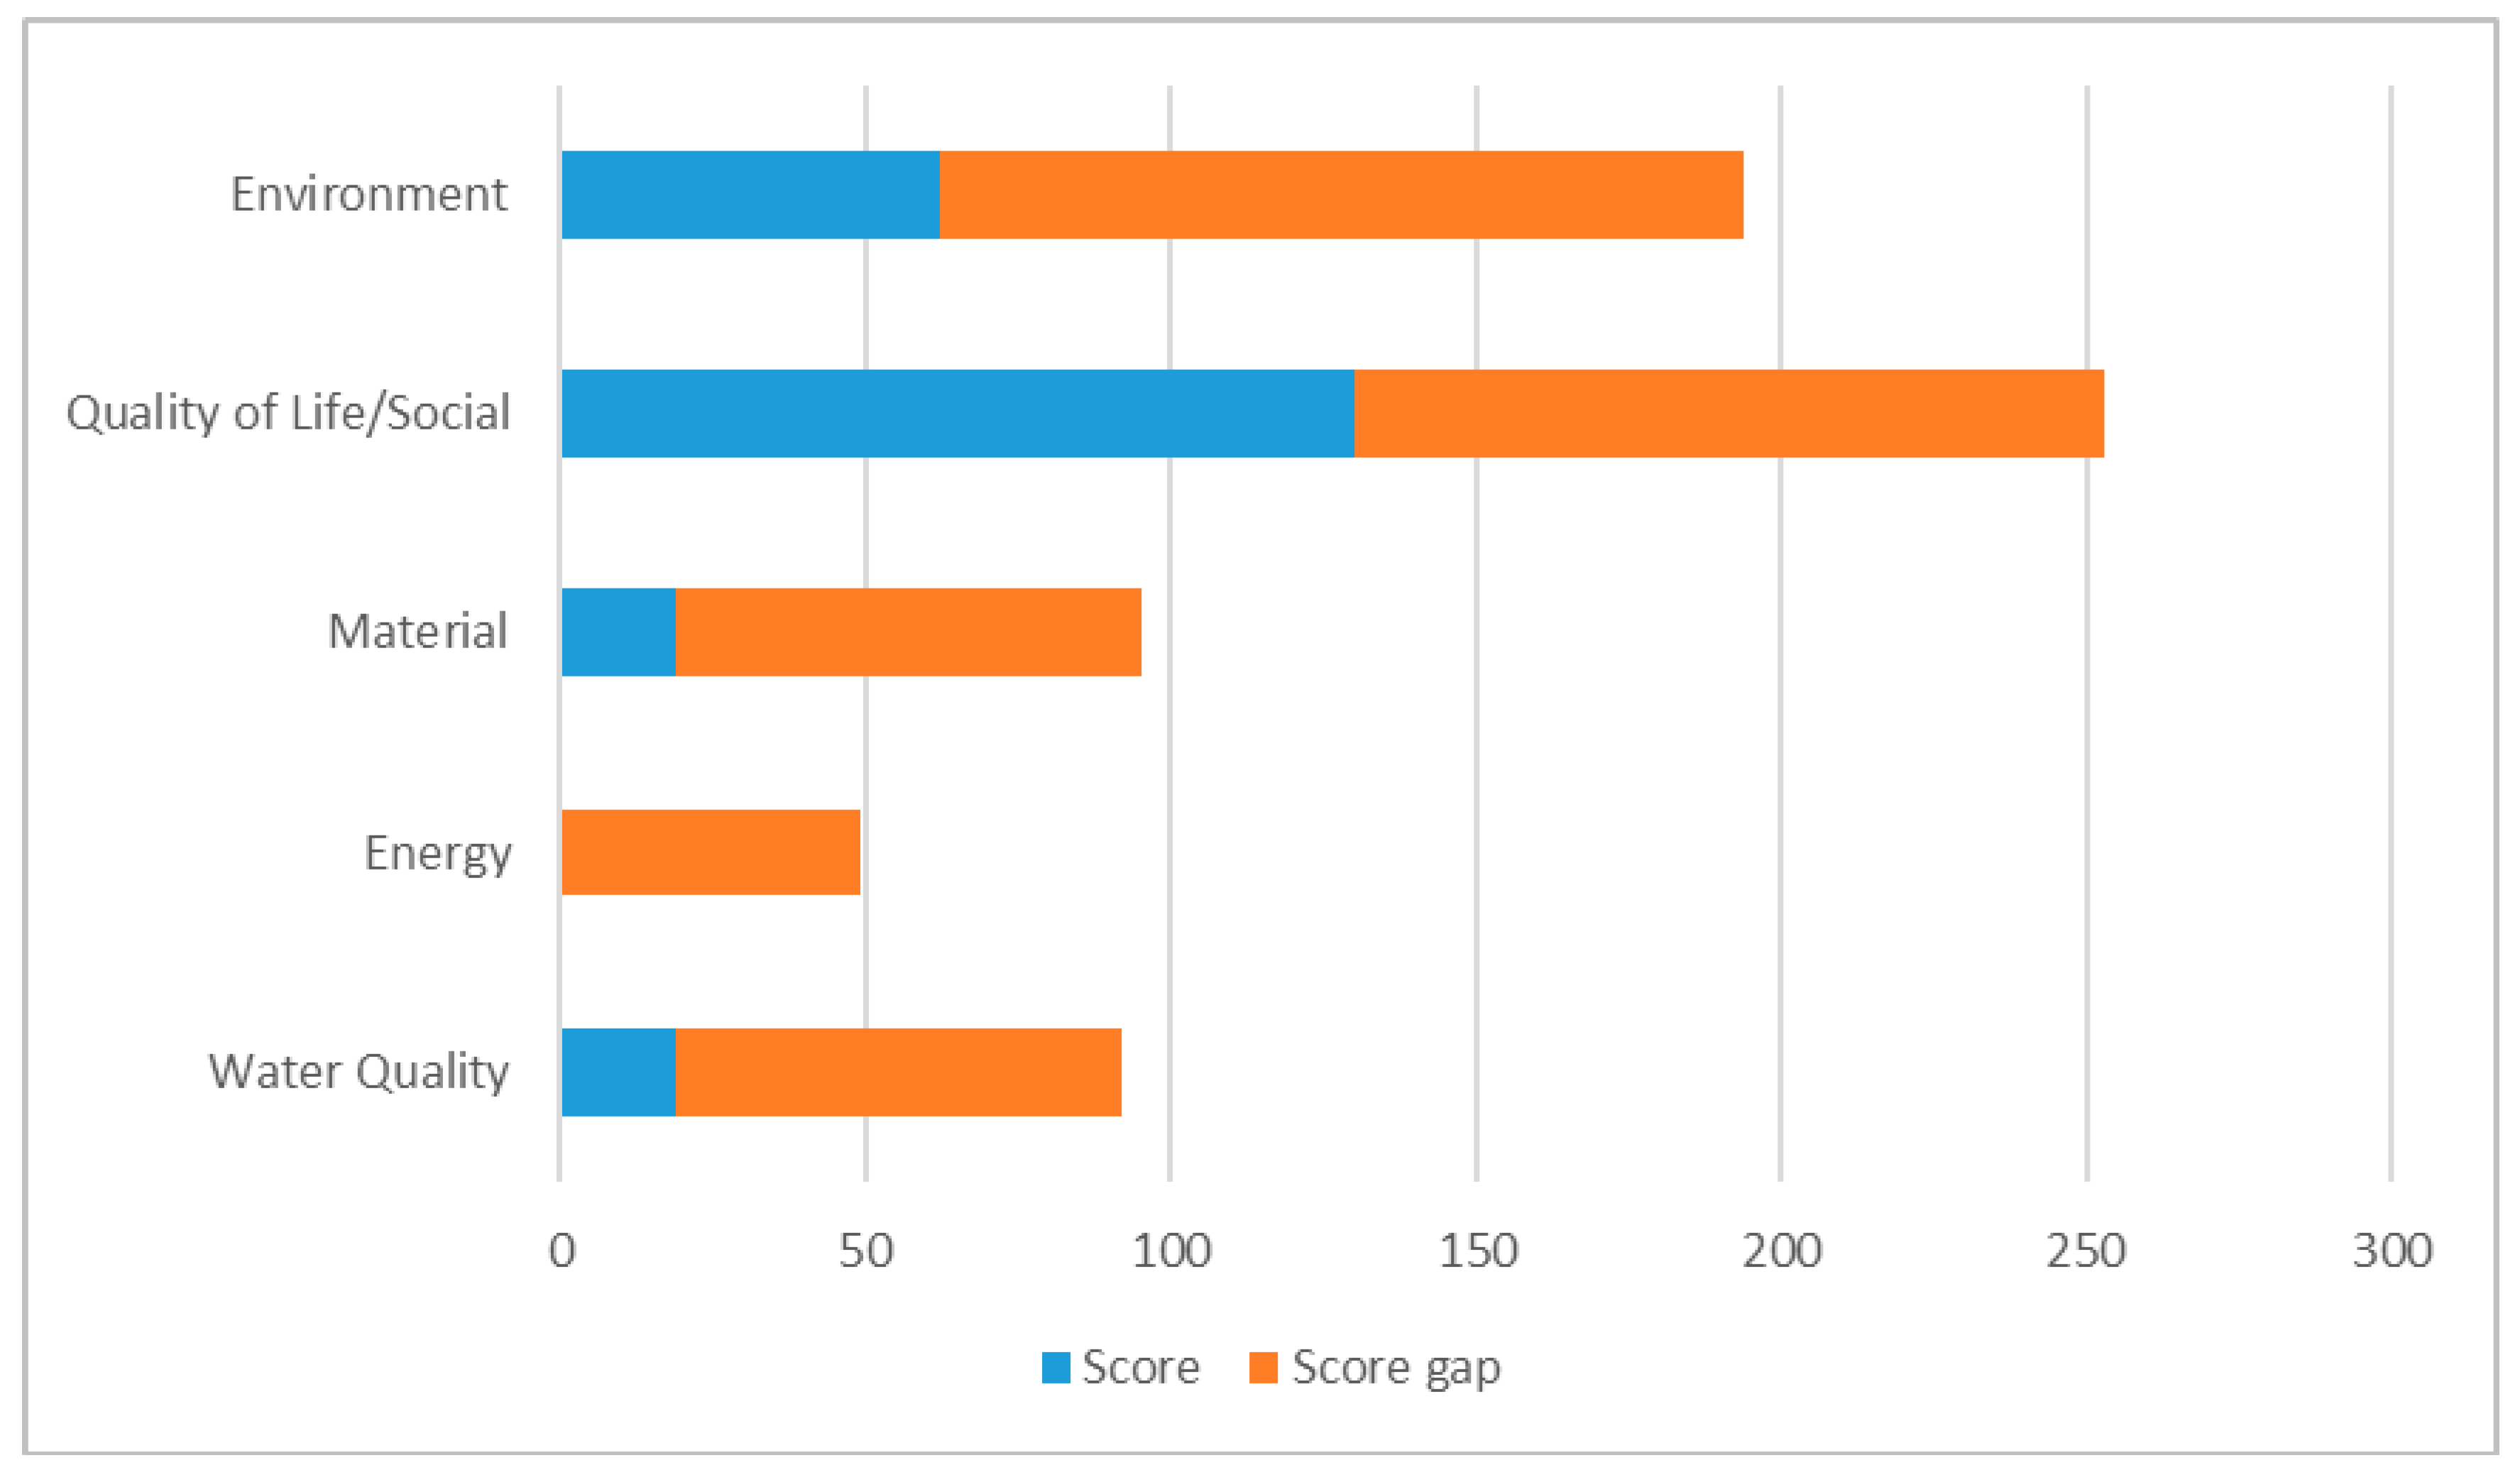
The environment category is made up of ten criteria, namely: Tracking environmental commitments, habitat restoration, ecological connectivity, site vegetation, maintenance and irrigation, earthwork balance, construction environmental training, construction noise mitigation, infrastructure resiliency planning and design, light pollution, and noise abatement. In the environment category, the project earned a total of 6 points out of 50 achievable points.
The quality of life/social category is made up of eight criteria, namely: Context-sensitive project development, highway and traffic safety, educational outreach, pedestrian facilities, bicycle facilities, transit and high occupancy vehicle (HOV) facilities, historic, archaeological, and cultural preservation, and scenic, natural or recreational qualities. In the quality of life/social category, the project earned a total of 31 points out of 39 achievable points.
The material category is made up of eight criteria, namely: Economic analyses, lifecycle cost analyses, reduce, reuse and repurpose materials, recycle materials, long-life pavement, reduced energy and emissions in pavement materials, construction quality control plan, and construction waste management. In the material category, the project earned 19 points out of 49 achievable points.
The energy category is made up of four criteria, namely: Freight mobility, intelligent transportation system (ITS) for system operations, energy efficiency, and construction equipment emission reduction. In the energy category, the project earned 3 points out of 22 achievable points.
The last category, the water quality category, is made up of three criteria, namely: Stormwater quality and flow control, permeable pavement, and low impact development. In the water quality category, the project earned 6 points out of 11 achievable points.
4.5. Detailed Results for Project 1 Using the GreenLITES Rating System
With the GreenLITES rating system, Project 1 scored 71 points out of 278 achievable points with a normalized point of 25.6%. Not all credits were applicable to Project 1; nonetheless, no credit could be scoped out in this rating system, as highlighted earlier. Project 1 scored no points in 128 credits. Figure 5 displays the points earned across the categories in the GreenLITES rating system in relation to the applicable points for each category.
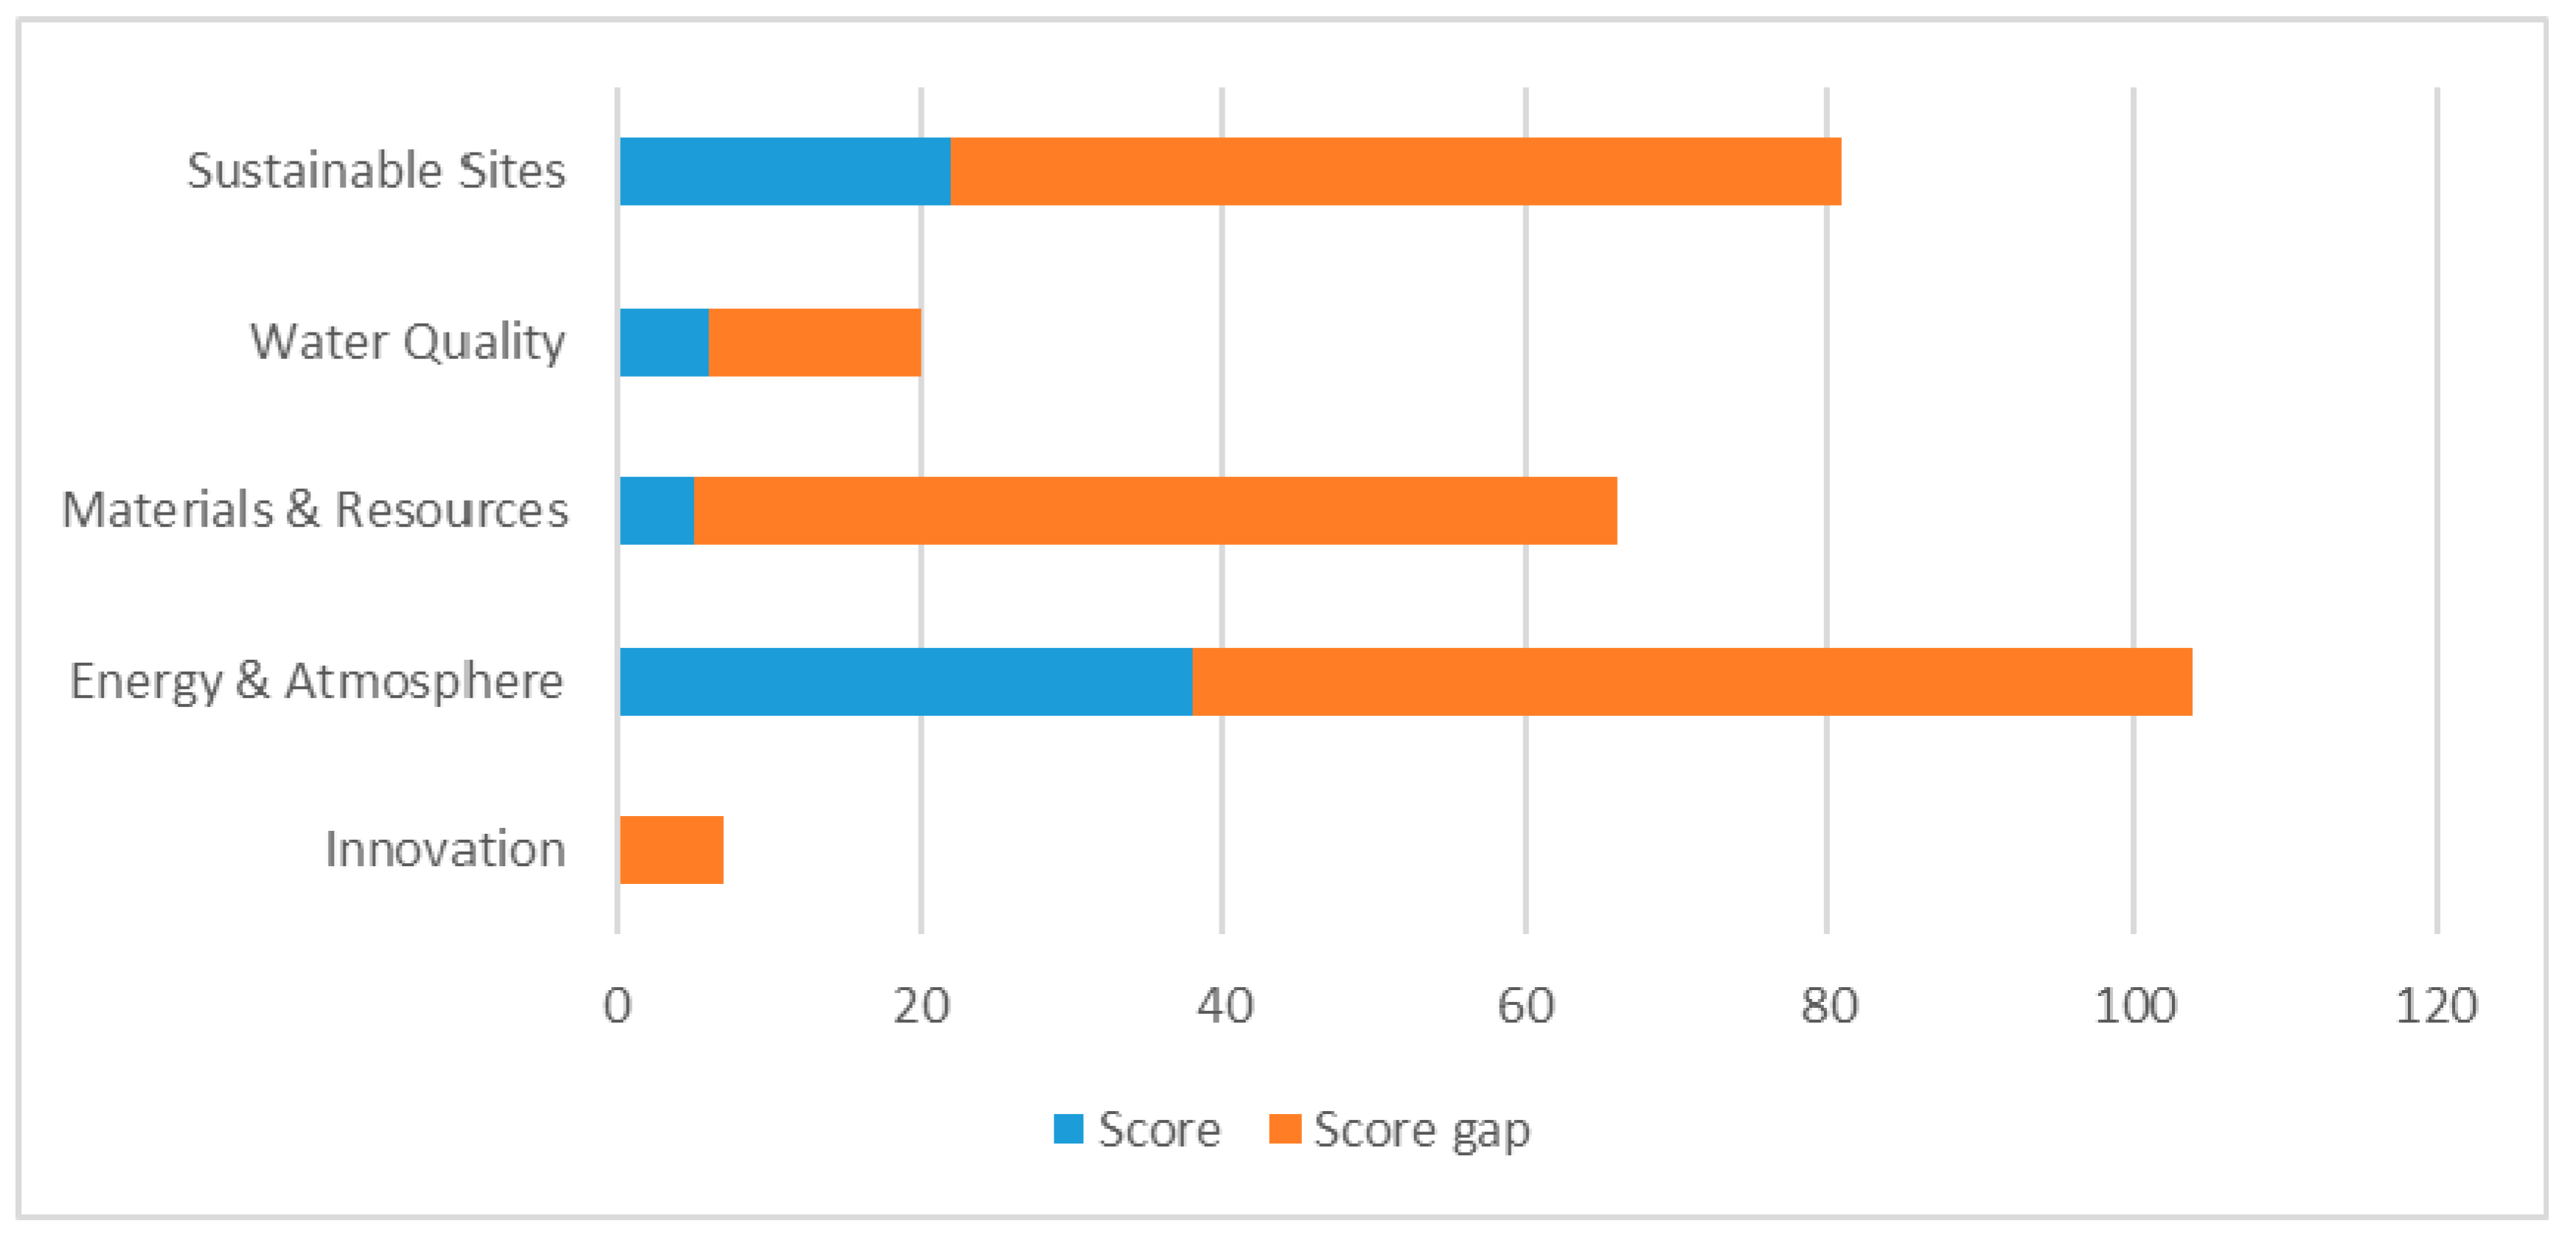
The credits under the GreenLITES rating system were split into the five categories of the triple bottom line used in this research. The credits were split based on what aspect of the five categories they are related to. It is important to note that the “innovation” category of the GreenLITES system is a general category with seven available points which cannot be placed under any of the five categories of the triple bottom line used in this research. Figure 6 illustrates the points the project earned in each category in relation to the applicable points for each category.
The environment category is made up of five GreenLITES subcategories, namely: Alignment selection, protect, enhance or restore wildlife habitat, protect, plant or mitigate for removal of trees and plant communities, noise abatement, and stray light pollution. These subcategories have a total of 42 credits and 61 achievable points. In this category, Project 1 earned 7 points out of 61 achievable points.
The quality of life/social category is made up of three subcategories, namely: Context-sensitive solution, land use/community planning, and improve bicycle and pedestrian facilities. These subcategories have a total of 50 credits and 70 achievable points. In this category, Project 1 scored 40 points out of 70 achievable points.
The material category is made up of five subcategories, namely: Reuse of materials, recycled content, local materials, bio-engineering techniques, and hazardous material minimization. These subcategories have a total of 39 credits and 66 achievable points. In this category, Project 1 scored 5 points out of 66 achievable points.
The energy category is made up of three subcategories, namely: Improved traffic flow, reduce electrical consumption, and reduce petroleum consumption. These subcategories have a total of 32 credits and 54 achievable points. In this category, Project 1 scored 13 points out of 54 achievable points.
The water quality category is made up of two subcategories, namely: Stormwater management (volume and quality), and best management practices (BMPs). These subcategories have a total of 12 credits and 20 achievable points. In this category, Project 1 scored 6 out of 20 achievable points.
5. Discussion
Table 3 presents the high-level results for all five projects run through each of the three rating systems using the methodology described in this paper. Detailed discussion for Projects 2, 3, 4, and 5 (similar to the one presented for Project 1 herein) is available in Reference [19].
The results presented in Table 3 illustrate that the rating tools assess and reward sustainability practices differently. This is consistent with the findings reported in Reference [8], which compared the results gathered from the application of four TSRS (infrastructure sustainability (IS); Envision; CEEQUAL; and Greenroads) on one project only and derived the conclusion that those four TSRS resulted in different ratings.
These findings suggest that the fact that a project rated very high on one rating system does not imply that it will be rated very high on another rating system and vice versa. This disparity may be due to several issues.
First, while it might seem like the rating systems look out for the same sustainability practices, the requirements needed to be fulfilled so as to get rewarded differ from each other. For instance, the three rating systems take context-sensitive solutions (CSS) into consideration. While it might look like the same externally, each rating system considers different sustainability practices in fulfilling these credits. Envision focuses on practices like stakeholder involvement, improvement of community quality of life, developing local skill and capabilities, preserving local character, etc. The INVEST rating system focuses on a six-step CSS framework, a cradle to grave team, project champions amongst the stakeholders, etc. GreenLITES focuses on responding to unique local features. Each of the rating systems considers these different sustainability practices but in varying degrees, thus affecting a project’s performance in the different categories as well as overall.
Second, sustainability practices rewarded on a tool may not be rewarded on another tool. For instance, the INVEST rating system rewards intelligent transport systems, while neither of the other systems considers this. The Envision rating system rewards assessment of climate threats to the project; however, neither of the other rating systems assesses this. These sustainable practices, if implemented on a project, might help to improve the project’s overall performance on one rating system, but not in the other.
Third, the variance in scores observed in all five projects from the three rating systems is a result of some characteristics of the rating systems as well as the difference in sustainability practices measured by the rating systems. With the Envision and INVEST rating systems, inapplicable credits can be scoped out, reducing the project’s chances of ending with a low score based on inapplicable credits. With the GreenLITES rating system, this is not the case. As such, in GreenLITES, the normalized score usually came out low compared to the other rating systems. With respect to sustainability practices measured, Envision and INVEST had different levels of sustainability practices that could be fulfilled. With Envision, there is the improved, enhanced, superior, conserving, and restorative levels. With INVEST, there are different points based on what percentage or level of sustainability practice was attained. With the GreenLITES system, that option is often not available.
An important trend that was identified is that in all projects, GreenLITES resulted in the lowest normalized score, followed by Envision and then INVEST. As can be seen in Table 3, despite having the lowest numerical score in all five projects, GreenLITES resulted in a higher award level than the other two TSRS in four of those five projects. In the remaining one project, award levels resulting from all TSRS were the same (i.e., no award). This trend suggests that it may be easier for a project to get awarded in GreenLITES compared to the other two TSRS.
Notwithstanding all of the above, a consistency was noted in all three rating systems in the quality of life/social performance of projects. In all three systems, with respect to four projects, it can be said that a consistency exists in the performance of a project in the quality of life/social category with the normalized score for each TSRS for this category, in each project, being within 5% of the other. Thus, a project’s performance in the quality of life/social category on one of the rating systems may be indicative of how it will perform in other rating systems.
6. Conclusions
TSRS are tools that have been developed in response to the need for sustainability of transportation projects. This need was borne from the growing desire to incorporate sustainable practices into transportation projects while considering the development in terms of its economic, environmental, and social impacts. While these rating tools may have been developed to fit specific contexts, it is important that a level of consistency be found in the way these rating systems rate project performance. Given this, the purpose of this study was to assess how three prominent transportation sustainability rating systems, Envision, INVEST, and GreenLITES, rate the performance of transportation projects with the ultimate goal of determining if a consistency exists in the way these three TSRS measure sustainability.
The results obtained by running five transportation projects through these three TSRS showed that these three rating tools assess and reward sustainability practices differently. Additionally, it was found that it may be easier for a project to get awarded in GreenLITES compared to the other two TSRS. Notwithstanding all of the above, a consistency was noted in all three rating systems in the quality of life/social performance of projects.
This study helps to inform stakeholders in the transportation industry (i.e., departments of transportation, developers, contractors, and the public) on how transportation projects perform when run through each of these rating systems. This will help stakeholders to make informed decisions with respect to choosing one (or more) TSRS to assess their projects with and evaluating the results obtained from such TSRS.
To date, extensive research has been performed on building sustainability rating systems, while there is relatively less research on transportation/infrastructure sustainability rating systems. Therefore, this study is timely and has the potential to promote more research on this important topic.
A limitation of this study is that in certain cases, the information needed about the projects to perform and confirm ratings was not completely available. Another limitation of the study was the use of a single assessor (albeit a certified Envision sustainability professional), as there could be bias affecting the consistency and validity of the result. Future research with the inclusion of projects with more comprehensive information and more than one assessor can be conducted to address these limitations.
Author Contributions
The authors confirm contribution to the paper as follows: Conceptualization, O.O. and M.E.O.; Data curation, O.O.; Formal analysis, O.O.; Investigation, O.O.; Methodology, O.O.; Supervision, M.E.O.; Validation, O.O.; Visualization, O.O.; Writing—original draft, O.O.; Writing—review and editing, M.E.O.
Funding
This research received no external funding.
Acknowledgments
Authors would like to thank Paul Krekeler, NYSDOT GreenLITES Program Manager, for his assistance during the data collection stage of this study. The opinions and findings are those of the authors and do not necessarily represent the views of NYSDOT.
Conflicts of Interest
The authors declare no conflict of interest.
References
- Veeravigrom, M.; Muench, S.T.; Kosonen, H. A global framework for sustainable roadway rating systems. In Proceedings of the Transportation Research Board 94th Annual Meeting, Washington, DC, USA, 11–15 January 2015. [Google Scholar]
- Simpson, S.P. A Framework for Assessing Transportation Sustainability Rating Systems for Implementation in US State Departments of Transportation. Master’s Thesis, Colorado State University, Fort Collins, CO, USA, 2013. [Google Scholar]
- Lineburg, K. Transportation Rating Systems and Social Sustainability: A Comprehensive Analysis. Bachelor’s Thesis, James Madison University, Harrisonburg, VA, USA, 2016. [Google Scholar]
- Clevenger, C.M.; Ozbek, M.E.; Simpson, S.P. Review of sustainability rating systems used for infrastructure projects. In Proceedings of the 49th ASC Annual International Conference Proceedings, San Luis Obispo, CA, USA, 10–13 April 2013. [Google Scholar]
- Clevenger, C.M.; Ozbek, M.E.; Simpson, S.P.; Atadero, R. Challenges in Developing a Transportation Sustainability Rating System That Meets the Preferences of a Department of Transportation. J. Transp. Eng. 2016, 142, 04016005. [Google Scholar] [CrossRef]
- Simpson, S.P.; Ozbek, M.E.; Clevenger, C.M.; Atadero, R. A Framework for Assessing Transportation Sustainability Rating Systems for Implementation in US State Departments of Transportation; MPC 14-268 Final Report; Mountain-Plains Consortium: Fargo, ND, USA, 2014. [Google Scholar]
- Griffiths, K.; Boyle, C.; Henning, T. Infrastructure sustainability rating tools–how they have developed and what we might expect to see in the future. In Proceedings of the IPWEA 2015: Sustainable Communities Sharing Knowledge, Rotorua, New Zealand, 7–11 June 2015. [Google Scholar]
- Griffiths, K.A.; Boyle, C.; Henning, T.F.P. Comparative Assessment of Infrastructure Sustainability Rating Tools. In Proceedings of the Transportation Research Board 96th Annual Meeting, Washington, DC, USA, 8–12 January 2017. [Google Scholar]
- Oluwalaiye, O.; Ozbek, M.E. Application of Envision, Invest, and GreenLITES Sustainability Rating Systems to Multiple Transportation Projects. In Proceedings of the 2019 TRB 98th Annual Conference, Washington, DC, USA, 13–17 January 2019. [Google Scholar]
- Yudelson, J.a.M.T.A. Book Reviews-The Green Building Revolution. J. Real Estate Lit. 2008, 16, 253. [Google Scholar]
- Simpson, S.P.; Clevenger, C.M.; Ozbek, M.E.; Rabbani, E.R.K.; Atadero, R. A Framework for Assessing Transportation Sustainability Rating Systems for Implementation in U.S. State Departments of Transportation. In Proceedings of the Transportation Research Board 93rd Annual Meeting, Washington, DC, USA, 12–16 January 2014. [Google Scholar]
- Bosco, C.; Buckingham, T.C. Applying Sustainable Practices to the Roadway Improvements of East Rosedale Street in Fort Worth, Texas. In Green Streets, Highways, and Development 2013: Advancing the Practice; American Society of Civil Engineers: Reston, VA, USA, 2013; pp. 388–397. [Google Scholar]
- Anderson, J.; Muench, S. Sustainability trends measured by the greenroads rating system. Transp. Res. Rec. J. Transp. Res. Board 2013, 2357, 24–32. [Google Scholar] [CrossRef]
- ISI. Envision Rating System for Sustainable Infrastructure. Available online: https://research.gsd.harvard.edu/zofnass/files/2015/06/Envision-Manual_2015_red.pdf (accessed on 22 July 2017).
- FHWA. Which Scorecard Should I Use? Available online: https://www.sustainablehighways.org/1086/which-scorecard-should-i-use.html (accessed on 1 October 2017).
- NYSDOT. D263572 F. A Project Proposal Contractor’s Bid Package: Highway Reconstruction on Route 5S (1 Mile) in the City of Utica; NYSDOT: New York, NY, USA, 2015; p. 76. [Google Scholar]
- NYSDOT. Transportation Project Report: Final Design Report; NYSDOT: New York, NY, USA, 2017; p. 829. [Google Scholar]
- NYSDOT. Transportation Project Report: Stormwater Pollution Prevention Plan; NYSDOT: New York, NY, USA, 2017; p. 279. [Google Scholar]
- Oluwalaiye, O. Comparative Assessment of Transportation Sustainability Rating Systems. Master’s Thesis, Colorado State University, Fort Collins, CO, USA, 2018. [Google Scholar]
Figure 1.
Project 1’s points across each category of the triple bottom line used in this research.

Figure 2.
Points achieved in relation to applicable points across each category of the Envision rating system for Project 1.
Figure 2.
Points achieved in relation to applicable points across each category of the Envision rating system for Project 1.

Figure 3.
Points achieved in relation to applicable points across each category of the triple bottom line used in this research for the Envision rating system for Project 1.
Figure 3.
Points achieved in relation to applicable points across each category of the triple bottom line used in this research for the Envision rating system for Project 1.

Figure 4.
Points achieved in relation to applicable points across each category of the triple bottom line used in this Research for the INVEST rating system for Project 1.
Figure 4.
Points achieved in relation to applicable points across each category of the triple bottom line used in this Research for the INVEST rating system for Project 1.

Figure 5.
Points achieved in relation to applicable points across each category of the GreenLITES rating system for Project 1.
Figure 5.
Points achieved in relation to applicable points across each category of the GreenLITES rating system for Project 1.

Figure 6.
Points achieved in relation to applicable points across each category of the triple bottom line used in this research for the GreenLITES rating system for Project 1.
Figure 6.
Points achieved in relation to applicable points across each category of the triple bottom line used in this research for the GreenLITES rating system for Project 1.


Table 1.
Summary of the rating systems.
| Envision | INVEST | GreenLITES | |
|---|---|---|---|
| Developed in | 2012 | 2012 | 2008 |
| Developer | Zofnass Institute in alliance with the Institute of Sustainable Infrastructure (ISI) | Federal Highway Administration (FHWA) | Ney York State Department of Transportation (NYSDOT) |
| Type | Third Party Rating System | Self-assessed Rating System | Self-assessed Rating System (in-house) |
| Applicable to Phases of Project | Planning | Planning | Planning |
| Design | Design | Design | |
| Construction | Construction | ||
| Operation & Maintenance | Operation & Maintenance | ||
| Sustainability Practices accounted for | Quality of Life | System Planning for States/System Planning for Region | Sustainable Sites |
| Leadership | Project Development | Water Quality | |
| Resource Allocation | Operations & Maintenance | Material and Resources | |
| Natural World | Energy and Atmosphere | ||
| Climate and Risk | Innovation/Unlisted | ||
| Levels of Award | Bronze Award | Bronze Award | GreenLITES Certified |
| Silver Award | Silver Award | GreenLITES Silver | |
| Gold Award | Gold Award | GreenLITES Gold | |
| Platinum Award | Platinum Award | GreenLITES Evergreen | |
| Version of tool used in this study | 2.0 (second version since inception) | 1.3 (third version since inception) | 2.1.0 (third version since inception) |
Table 2.
Project 1′s normalized score and award level on each rating system.
| Rating System | Points Assessed/Points Applicable | Normalized Score (% of Applicable Points) | Award Level |
|---|---|---|---|
| Envision | 230/683 | 33.7% | SILVER |
| INVEST | 65/171 | 38.0% | BRONZE |
| GreenLITES | 71/278 | 25.6% | EVERGREEN |
Table 3.
All projects’ normalized scores and award levels on each rating system.
| Project | Rating System | Normalized Score (% of Applicable Points) | Award Level |
|---|---|---|---|
| Project 1 | Envision | 33.7% | Silver |
| INVEST | 38.0% | Bronze | |
| GreenLITES | 25.6% | Evergreen | |
| Project 2 | Envision | 13.8% | No Award |
| INVEST | 28.6% | No Award | |
| GreenLITES | 1.4% | No Award | |
| Project 3 | Envision | 23.4% | Bronze |
| INVEST | 30.4% | Bronze | |
| GreenLITES | 14.4% | Silver | |
| Project 4 | Envision | 13.1% | No Award |
| INVEST | 14.1% | No Award | |
| GreenLITES | 5.8% | Certified | |
| Project 5 | Envision | 19.8% | Bronze |
| INVEST | 23.0% | No Award | |
| GreenLITES | 15.1% | Silver |
© 2019 by the authors. Licensee MDPI, Basel, Switzerland. This article is an open access article distributed under the terms and conditions of the Creative Commons Attribution (CC BY) license (http://creativecommons.org/licenses/by/4.0/).
Share and Cite
MDPI and ACS Style
Oluwalaiye, O.; Ozbek, M.E. Consistency between Infrastructure Rating Systems in Measuring Sustainability. Infrastructures 2019, 4, 9. https://0-doi-org.brum.beds.ac.uk/10.3390/infrastructures4010009
AMA Style
Oluwalaiye O, Ozbek ME. Consistency between Infrastructure Rating Systems in Measuring Sustainability. Infrastructures. 2019; 4(1):9. https://0-doi-org.brum.beds.ac.uk/10.3390/infrastructures4010009
Chicago/Turabian StyleOluwalaiye, Oluwatobi, and Mehmet E. Ozbek. 2019. "Consistency between Infrastructure Rating Systems in Measuring Sustainability" Infrastructures 4, no. 1: 9. https://0-doi-org.brum.beds.ac.uk/10.3390/infrastructures4010009