1. Introduction
Urban drainage networks experience failures in their operation due to aging and other structural problems, but also due to urbanization and climate change, which is is affecting the intensities and frequencies of extreme rainfall events. One of the objectives of rehabilitation is to avoid the consequences of extreme events. Drainage networks should be adapted to the new climatologic and environmental conditions. Jeong et al. [
1] said that if a rainfall event is higher than the infrastructure facilities’ capacity, their neighboring assets will be spoiled, and this will provoke a flood. Climate change adaptation in the infrastructure sector mitigates these damages by expanding the capacity of existing facilities or by installing new ones. According to Quinn et al. [
2], extreme events cause damages to public infrastructures, so they presented a methodology composed of an adaptation strategy and an implementation plan allowing transport infrastructures to mitigate the climate change effects with an aim to avoid service disruption and the associated financial costs. Additionally, to ensure flexibility when incorporating new knowledge, the implementation of their methodology aims to help users assess their adaptation grade and try to strengthen it. Szewrański et al. [
3] developed a pluvial flood risk assessment tool to support stakeholders in rainwater management and adapt existing networks to climate change. Their tool implements spatial identification of flooding vulnerable areas and can be used in areas with different sizes. This tool can be used for identifying rainfall flood risk in a new developed area and help in flood monitoring in disaster recovery centers. Jeong et al. [
1] showed how adaptation costs could be managed through a framework based on game theory. The aim of their study was proposing a suitable framework to allocate adaptation costs among local governments. One of the conclusions of the work of Jeong et al. was that the allocation of costs of climate change adaptation among stakeholders allowed them to solve some conflicts. Silva and Costa [
4] enumerated the challenges faced by climate change adaptation and referred to public space as a powerful way to help in climate change adaptation. In addition to the fact that public space promotes adaptation action and help reduce risk of catastrophes, public spaces improve awareness of climate change. Therefore, everybody should be a public space manager in the sense of helping with climate change adaptation. The involvement of people and communities in the urban vulnerability management leads to adequate solutions in adaptation to climate change. These studies clearly show that adaptation is an important process to overcome the problem such as floods caused by extreme rainfall events.
There are different approaches in the literature to reduce or eliminate floods. There are traditional solutions based on the replacement of existing conduits by others of greater capacity. Other more recent solutions are based on the control of generated runoff. These are called Low Impact Developments (LID). Additionally, there are solutions based on the operational control of the network. These are the so-called Real Time Control (RTC) solutions, based on operating the different elements of the network in order to reduce concentration times and minimize flooding. Lastly, there are methodologies based on the application of several of the previous techniques. These generally use optimization algorithms that can be single or multi-objective.
Zhang et al. [
5] proposed a traditional engineering method consisting of increasing pipes’ capacity and the use of the free space as storage environment during extreme events. The main objective was to increase the response time and reduce the overflow at the wastewater treatment plant. The increase of pipe diameters alone was not adequate to eliminate overflow. Prasad et al. [
6] developed a comprehensive list of parameters affecting stormwater pipe performance. They also developed a performance index using a fuzzy inference method to capture interdependencies among parameters. Sedimentation is a phenomenon that seldom occurs in conduits and has the following consequences: reduction of the cross section of the conduit, reduction of the transportation capacity, and provoking of floods. Pipe characteristics determine the structural condition. In that way, frequent maintenance is needed to solve sedimentation and blockage problems. Song et al. [
7] carried out a study on the prevention of sedimentation in urban drainage conduits. They concluded that sedimentation should be taken into consideration when a drainage network is designed. Song et al. showed that low velocity of incoming sludge and big particle sizes promote sludge deposition and reduce pipes’ transportation capacities. In recent years, canalization was used to reduce floods. It has been substituted by other methods due to its ineffectiveness ahead of floods caused by environmental conditions and urbanization adverse effects [
8].
The other method considered to solve this problem is the RTC. According to Kroll et al. [
9], sewer network managers hesitate to implement RTC to manage their system. They proposed a strategy for RTC and they obtained satisfactory results in terms of CSO reduction. They concluded that RTC strategy achieves better results when the control locations are well selected. Vermuyten et al. [
10] presented a meta-heuristic approach based on a genetic algorithm and a predictive control model for flood RTC. Their algorithm did not find the optimal solution, but rapidly converged to a solution near of the optimal one. For the same optimal control parameters, their approach provided better results in damage costs reduction than the programmable logic controller (PLC) did. Direct flood mitigation implies a risk of failure due to unexpected structural defections that can occur during rainfall events. Therefore, despite the effectiveness of RTC in reducing flood damages, network managers hesitate to implement this option.
There are preventives methods implying that actions must be taken to avoid the occurrence of floods. Therefore, the notion of risk arose. The idea is to identify the flood risks and take necessary structural and non-structural actions to prevent their occurrence. Salinas-Rodriguez et al. [
11] presented the difference between the standards-based approach, which has many limitations, and the risk-based approach, which include flood hazard and impact assessments. Their method involves stakeholders when defining risk level, which prevents and gives a variety of possible actions for the network adaptation against frequent, extreme rainfall events. The method also requires drawing the flooding risk map of the study area. Implementing the approach will be useful in drainage network management and help to deal with extreme rainfall events. Scionti et al. [
8] proposed a quasi-2D model composed of the 1D model simplicity and the 2D model having the ability to better represent the surface flows and connected it to MODCEL, which can discretize the urban area in cells where rainfall-runoff transformation is operated. The flood risk index considered in the study links the flood level to flood damage cost and the model provides important data in terms of flood risk and level for critical areas and various scenarios of flood reduction. The methodology is a decision support tool that can allow the localization, assessment, and comparison of flood risk’s determining areas and grade. Caldas et al. [
12] studied the flood vulnerability of Batatais municipality in Sao Polo, Brazil. All the parameters used to characterize the flood vulnerability have been evaluated through the analytic hierarchy process (AHP) method. Vulnerability maps were drawn based on geographical information system (GIS) assets and historic flood events. Effects of flood intensity have been presented for environmental land use conflicts and results showed that the vulnerability area in that municipality occupied 60% of the area. Such studies would be helpful in the adequate use of soil and water resources of the region. Decision-makers prefer implementation of grey measures, which are suitable for moderate rainfall events. Additionally, green measures are effective against excess runoff. Alves et al. [
13] combined both measures in an approach to make it reliable and adaptable to climate change effects. The approach considers multi-criteria decision analysis, which provides results in the form of information to help decision-makers select the suitable solution for their specific problem. A tool implementing the methodology has been carried out and applied to cases studies and the results showed that the tool is reliable, helpful, and convenient. For flooding mitigation, Kolen and Van Gelder [
14] proposed a risk-based decision model. This is is a tool providing a set of decisions to be implemented by decision-makers to plan evacuation and reduce flood damage costs and life loss. Elaboration and implementation of an evacuation diagram would be useful in reducing the loss of life during floods. A risk-based approach seems to be an effective method for flood prevention especially in urban network adaptation, but they can face the problem of implementation by the managers or decision-makers. All the preceding studies are related by the fact that they are solutions of adapting the drainage network to new climatic and environmental conditions. Even if those approaches are reliable in some situations such as those they solve, they, unfortunately, become inefficient with time. The need to implement better solutions is then required.
A new trend in recent decades consisted of installing some hydraulic assets to reduce the conductivity of the runoff or to store the excess of water during rainfall events and later re-introduce that water in the system and convey it to a water treatment plant. These assets are designated by several names: Green Infrastructures, Best Management Practices, Sustainable urban drainage, and Low impact development practices. There are many studies in the literature implementing those measures. Song et al. [
15] proposed a water management analysis module (WMAM) framework based on Low Impact Development (LID) practices integrated box in SWMM to establish a reliable design and plan parameters related to LID practices implementation. The methodology has been applied for an infiltration trench and the results showed that they considerably reduce runoff. The WMAM leads to defining an adequate design of the LID and the corresponding parameters while reducing flooding. De Paola et al. [
16] implemented a Decision Support System on two cases studies using SWMM as a hydraulic analysis tool and Harmony search as an optimization method. The aim of their study was to reduce the flooding volume while minimizing the objective function. The proposed strategy started with territorial analysis in the Geographical Information System (GIS), which was followed by a setting of the network, and, finally, an optimization. In the context of extreme rainfalls, the proposed model can select and implement adequate LID practices to reduce floods and ensure minimal investments. Xiao et al. [
17] evaluated the effectiveness of bioswales on stormwater runoff quality and quantity. Their treatment bioswale eliminated more than 99% of surface runoff, but this ability of the bioswale gradually decreased due to the underlying soil layer saturation. It was also effective in removing pollutants and support tree growth in an urban landscape. Integrate Engineering Soil Mixed in Bioswales is an effective solution for stormwater runoff reduction. Martínez et al. [
18] proposed a framework aiming to select and install green infrastructure between Bio-retention cells, infiltration trenches, porous pavement, and vegetation swales. The main objective of their study was urban runoff reduction and improvement of water quality while reducing investment costs. To achieve it, SWMM was connected to non-dominated sorting genetic algorithm II (NSGA-II) for simulations and optimization. Pareto fronts were presented for flooding volumes against investment costs and for pollution loads against investment costs. For the same investment amount, a smaller number of porous pavements needed to be installed to achieve good results for any type of rainfall events. Hu et al. [
19] used three types of pavement to investigate their capacity on flood reduction and the effects of clogging and first water quality on permeable pavement performance in a sponge city. Twelve scenarios were generated, and the results showed that permeable pavements reduced urban runoff and that clogging affected the performance of permeable pavements. The limit of their study was the reduced number of calibration and validation information. The earliest water quality reduces pavement performance, but permeable asphalt implementation provides better results. Leimgruber et al. [
20] studied the impact of the installation of 3 LIDs on the water balance using long-term simulation. They wanted to provide the influential parameters list to practitioners. Results should be integrated in a complete water balance considering LID configured in SWMM. Unfortunately, results of Leimgruber et al. showed that, by increasing the substrate thickness of green roofs, the retention rate increased. Green roof runoff retention capacity lays on various parameters. Therefore, Gong et al. [
21] studied the effects of various parameters on the green roof runoff retention capacity for several rainfall events and 10 extensive green roof modules. Their results showed that green roofs were effectives for rainfall events of moderate intensity and were affected by extreme rainfall events. Mora et al. [
22] also obtained results showing that green roofs as LID practices are efficient for moderate rainfall events, but their implementation cannot prevent the generation of flood for extreme rainfall events. Therefore, green infrastructures are effective for moderate rainfall events but cannot deal with extreme rainfall events. Therefore, there is a necessity to have a better asset to overcome this problem.
The last category of authors considered that the drainage network simply must be rehabilitated based on the objectives to achieve. Rehabilitation strategies of single-objective or multi-objective have been proposed. Vojinovic et al. [
23] proposed a multi-objective approach for drainage network rehabilitation. Appropriate modifications were operated in SWMM. Latin Hypercube Sampling was used to sample statistical distribution and uncertainty while NSGA-II was applied to provide the set of optimal solutions. Two approaches were implemented. The first considers uncertainty in objective function, which provided the best results globally and the second considers uncertainty in the optimization process. To achieve strong results, uncertainty impacts should be considered in drainage network optimal rehabilitation. Lim et al. [
24] presented a drainage network multi-objective rehabilitation approach considering the installation of detention facilities and the optimization of their locations and capacity by a multi-objective genetic algorithm. The aim was total overflow reduction while minimizing investment. The methodology will be helpful for managers in the effective selection and installation of retention assets in drainage networks. What they did not consider in their study is the substitution of pipes and they did not consider search space reduction. In this work, we consider both pipe renewal and storm tank installation. In addition, a search space reduction model resolution is proposed and compared with the complete model rehabilitation. Xu et al. [
25] proposed a rehabilitation methodology to improve the capacity of drainage networks in the city of Fuzhou, China. Their methodology considered climate change and adopted a periodic installation of storage facilities as well as pump to reduce flood damages while reducing the investment costs. It was suggested that the methodology be implemented throughout the city of Fuzhou. Yazdi [
26] proposed an optimal methodology for drainage networks rehabilitation and flooding mitigation, which considers effects of unexpected structural failures during rainfall events. To achieve this, he connected SWMM to non-dominated sorting differential evolution to track the set of optimal solutions. Martínez et al. [
27] presented a multi-objective approach combining the 1D/2D model to an NSGA-II to rehabilitate drainage networks in order to help them in the process of adaptation to climate change and reduction of flood damage costs. The major inconvenience of the methodology was that it needed elevated calculation time to find the set of optimal solutions. The combined use of pipes substitution and storage facilities installation provides better results than each measure implemented alone. Ngamalieu-Nengoue et al. [
28] proposed a single-objective optimization method to reduce the search space of the problem and reduce the calculation time while obtaining better results. The NSGA-II [
29], which includes an elitism consisting of keeping two individuals in each generation was proposed by Ngamalieu-Nengoue et al. [
30] to solve multi-objective rehabilitation of drainage networks considering pipes substitution and storm tanks installation. Drainage network rehabilitation considering pipe substitution combined with storm tank installation presents good results, but the elevated calculation time needed to obtain them is a serious problem that can hinder the obtainment of the global optimal solution.
A new challenge in the optimization of water resources management is the reduction of the computation time and the obtainment of better results. To achieve this, some authors proposed the reduction of solution space to help the optimization algorithm find the optimal solution by providing it a better exploration capacity. Maier et al. [
31] presented the new challenges such as reduction of solution space and applied them to water resource management, while Sophocleous et al. [
32] proposed the reduction of solution space to the leak localization in real water distribution. After the assessment of the robustness of their methodology, it could be applied in the industry.
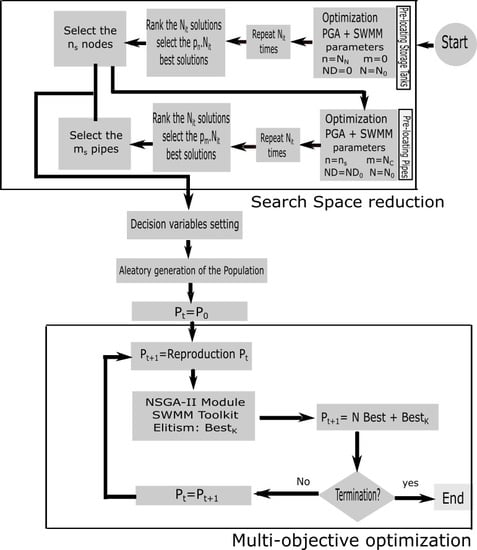
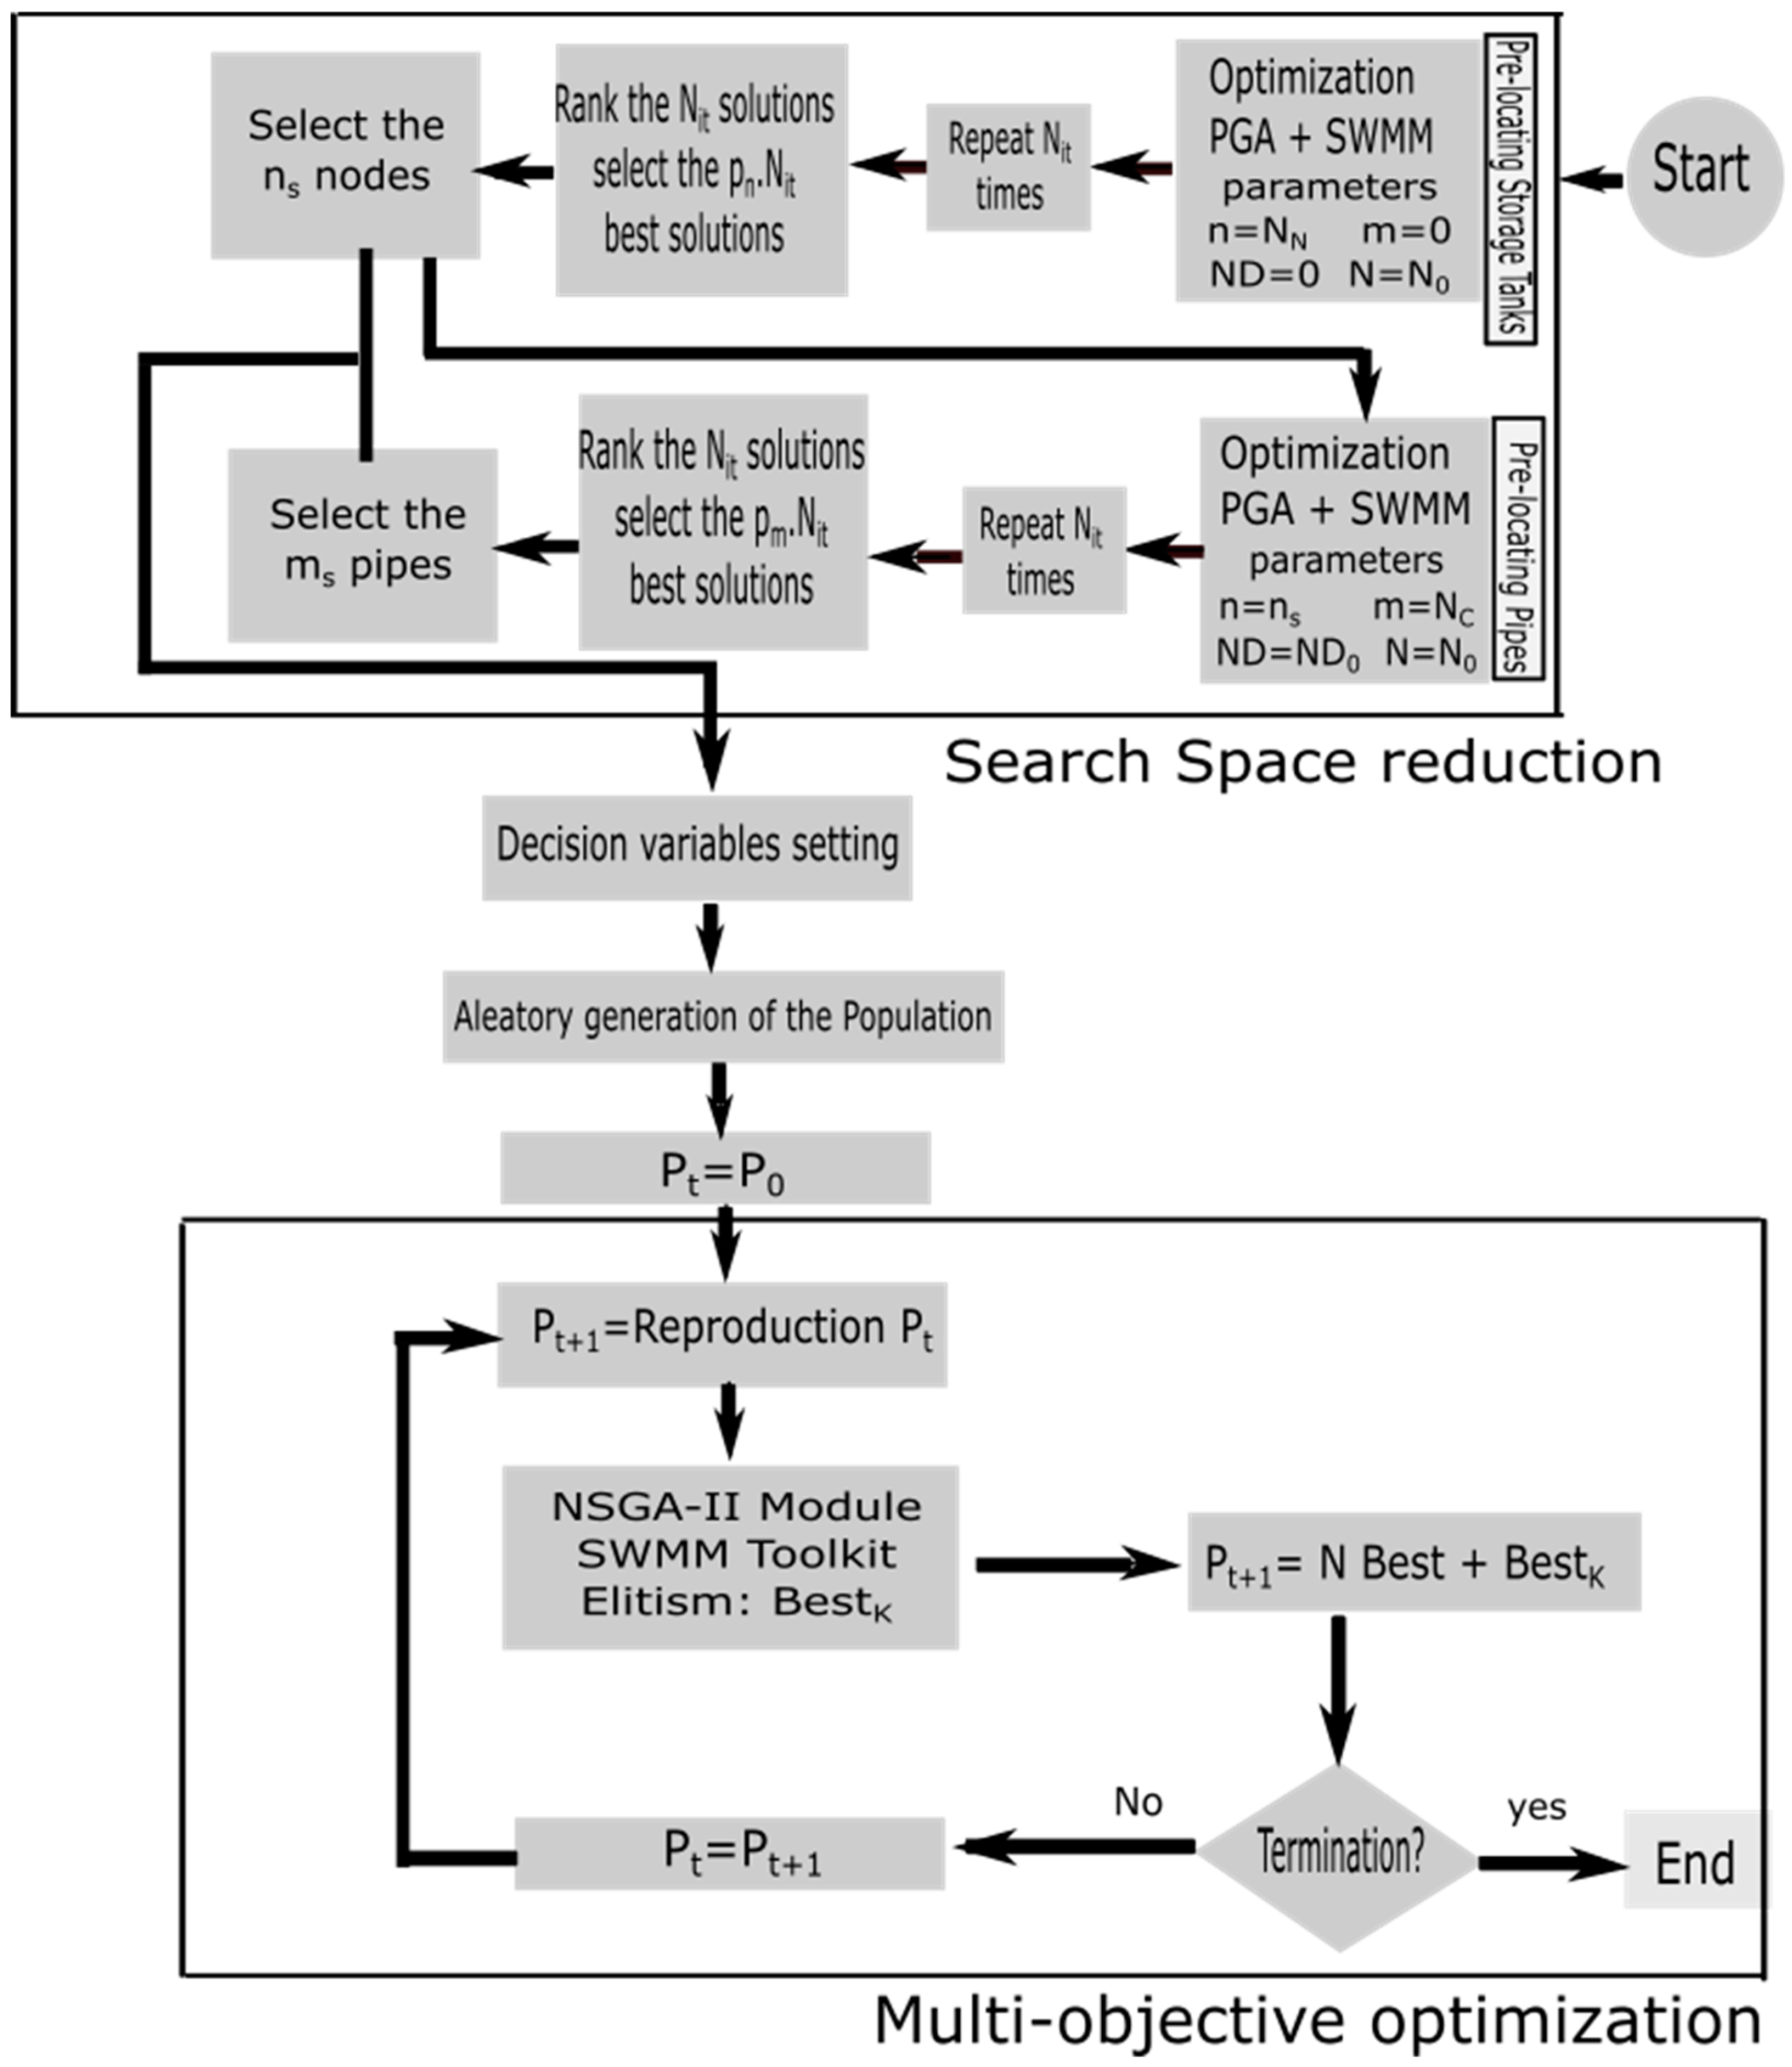
The state-of-the-art discussion shows that, to adapt networks to climatic conditions, authors concentrated more efforts to work on methodologies such as RTC that network manager hesitate to implement. They also dedicated many studies on LID implementation, which is inefficient for extreme rainfall events. The reduction of search space as a new challenge is a good approach to reduce computation time in water resource management. Therefore, the main objective of this study is to propose multi-objective optimization for an urban drainage network rehabilitation strategy that first apply a search space reduction methodology to reduce the size of the addressed problem. Then a multi-objective evolutionary algorithm is applied for the optimization of the search space reduction model obtained. The methodology considers pipes substitution and storm tank installation in the network.
2. Problem Formulation
Drainage networks are civil engineering infrastructures present in several countries around the world. Their main mission is to drain rainfall water of the cities where they are installed.
During recent decades, rainfall intensities and frequencies increased by converting them into extreme rainfalls events, which caused insufficiencies to drainage networks. The network capacity is reduced, and floods appear. In this work, a two-parts methodology to solve this problem is presented.
The starting hypotheses considered are below.
Scenarios damaging the networks considerably are those that should be used during the optimization process. The rehabilitation will be operated considering only the worst scenario obtained.
The rain-runoff transformation considered in this study is one within SWMM models, which is named the Curve Number model. Basically, SWMM is composed of three different models for the rainfall-runoff transformation. Horton, Green-Ampt, and the Soil Conservation Service (SCS) Curve Number models. The latter option was adopted due to the fact that it was the simplest one and there is only one parameter needed, which is the Curve Number. Once the rainfall-runoff transformation has been calculated, the hydraulic model just takes into account inflows at nodes instead of precipitation scenarios.
There are various calibration models and the calibration of the network is important, which can be seen in these papers [
33,
34,
35], but calibration is beyond the scope of this work. Therefore, SWMM [
36] will be used and the hydraulic model of the drainage network will be the starting point of the process. The model will be analyzed using a dynamic wave model to obtain a better representation of flood rather than the uniform flow, which is generally used in this case.
Every model must be simplified. Therefore, the accuracy of the result must not be compromised. The aim of the simplification is to highly reduce calculation times of each hydraulic simulation.
The corrective actions will be storm tank installations and pipe diameter modifications. The volume of tanks will be calculated and assigned to those to be installed and new diameters of pipes will also be calculated and assigned. A full range of commercial diameters and their installing costs is provided [
28].
Storm tanks to install will have the following characteristics: single chamber, in-line tank, and no control device. The storm tanks will be installed on the corresponding node location and only the base area will be modified, according to the calculated value.
It is in monetary units that the optimization problem will be addressed. First, hydraulic variables will be defined as monetary units in some cost functions, as presented by Cunha et al. [
37] and Ngamalieu-Nengoue et al. [
28].
Heuristic approaches will be effective to optimize the mathematical formulation of the problem. Based on precedent studies, a pseudo-genetic algorithm [
38] method is used.
The approach rehabilitates the drainage network by renewing pipes and installing storm tanks in some nodes. The problem encountered in this case is that the calculation time is elevated, and the objective function best value is caught up in a local minimum. The probability to obtain a repetitive solution is elevated. Due to a wide solution space, the search of the best solution is difficult. The aim of this work is to propose a multi-objective optimization methodology of drainage networks. The methodology first applies a search space reduction methodology to reduce the size of the addressed problem. A multi-objective evolutionary algorithm is then applied to the optimization of the reduced problem size obtained.
2.1. Cost Functions
To assess rehabilitation costs, there are three terms: pipe substitution costs, storm tank installation costs, and flooding costs. These costs represent mathematical values in monetary units. The following presents the expressions of those cost functions.
2.1.1. Pipe Substitution Cost Function
From real data supplied by pipe manufacturers, a mathematical formulation to express the cost of pipe installation in Euros per meter has been carried out. This cost depends on the diameter of the pipe to be installed. The cost grows with the diameter size.
In Equation (1), A and B represent adjustment coefficients.
2.1.2. Storm Tank Installation Cost Function
Depending on the calculated volume of a storm tank (
Vj) that can be installed on a node of the network to collect and store extra water during extreme events, this cost function can be defined by using real data supplied by manufacturers. These tank’s sizes can be small and medium with the aim to expand the storage capacity of the nodes or the original installed storm tanks existing in the network. The first term of the formulation represents the minimum cost relative to the construction (
Cmin) and the second term depends on the total volume through a constant (
Cvar) and an exponent (
n). The first term is fixed while the second is variable.
2.1.3. Flood Damage Cost Function
In the literature, flooding is considered to be a volume for some authors [
39] while other authors consider flooding as the highest depth reach by the water (
y) out of the network. According to Lee and Kim [
40], flooding damage is different from flooding volume. They showed that some sub-areas can be immediately damaged by a certain amount of flooding while other sub-areas are not, which confirms that flood damage depends on the land use. Since flood damage costs represent the damages provoked by the flooding, Lee and Kim [
40] represented flood damage costs in function of the depth reached by water. On the base of their model, the flood damage cost function was expressed as a function of the depth (
y) of the flooding.
The ponded area model proposed by SWMM defines the ponded area (A
p) related to each node. Then, by dividing the flooding volume (V
fl) by the ponded area, the highest depth reached by the water or the flood level can be obtained. Flood damage cost is given by the following equation.
In Equation (3),
Cmax stands as the maximum cost per square meter that a flooding can cause. The constant (
ymax) is the fixed depth where the damage is considered as irrecoverable so that it stops the increase of the function, which causes the attainment of the maximum cost value (
Vmax = 1.4). The exponent k is an adjusting coefficient based on historical data of damages provoked by flooding (
k = 4.89). In all cases, Equation (3) depends completely on the value of
Cmax whose values are presented in
Table 1.
2.2. Objective Functions
When an optimization problem is addressed, there is always an objective function to optimize. In this study, the problem size reduction is based on the optimization of a single objective function. The obtained values of the optimization are ranked in order to perform the selection of nodes and conduits, which allow the formation of the reduced problem size. That is the reason why a single-objective function is presented. The multi-objective optimization, which is the main optimization to be operated in this study, is characterized by two conflicting objective functions. They are represented by the investment costs and by the flood damage costs. More investments reduced flood damage costs and vice versa.
2.2.1. Problem Size Reduction Methodology: Single Objective Function
The main objective of the optimization is the minimization of the objective function. In the case of the search space reduction methodology, the objective function (
F) is the sum of the three cost functions presented. The obtained results represent a monetary value of the total cost necessary to rehabilitate the network. The mathematical expression is represented by Equation (4).
where
Nc represents the total number of conduits in the network,
NN represents the total number of nodes in the network, and
NT represents the total number of storm tanks installed in the network.
2.2.2. Multi-Objective Optimization
In this part of the methodology, the objective is to minimize two conflictive objective functions. The first represents the investment costs and the second represents the flood damage costs. These functions are linked such that, if more investments are made, flood damage costs will be reduced reciprocally.
Equation (5) represents the investments costs (
F1) composed of pipe substitution costs and storm tank installation costs. Equation (6) represents the flood damage costs. The two objective functions express hydraulic values in monetary units as presented in the hypothesis of the work.
In Equations (5) and (6), NC represents the total number of conduits in the network, NN represents the total number of nodes in the network, and NT represents the total number of storm tanks installed in the network.
4. Case Study
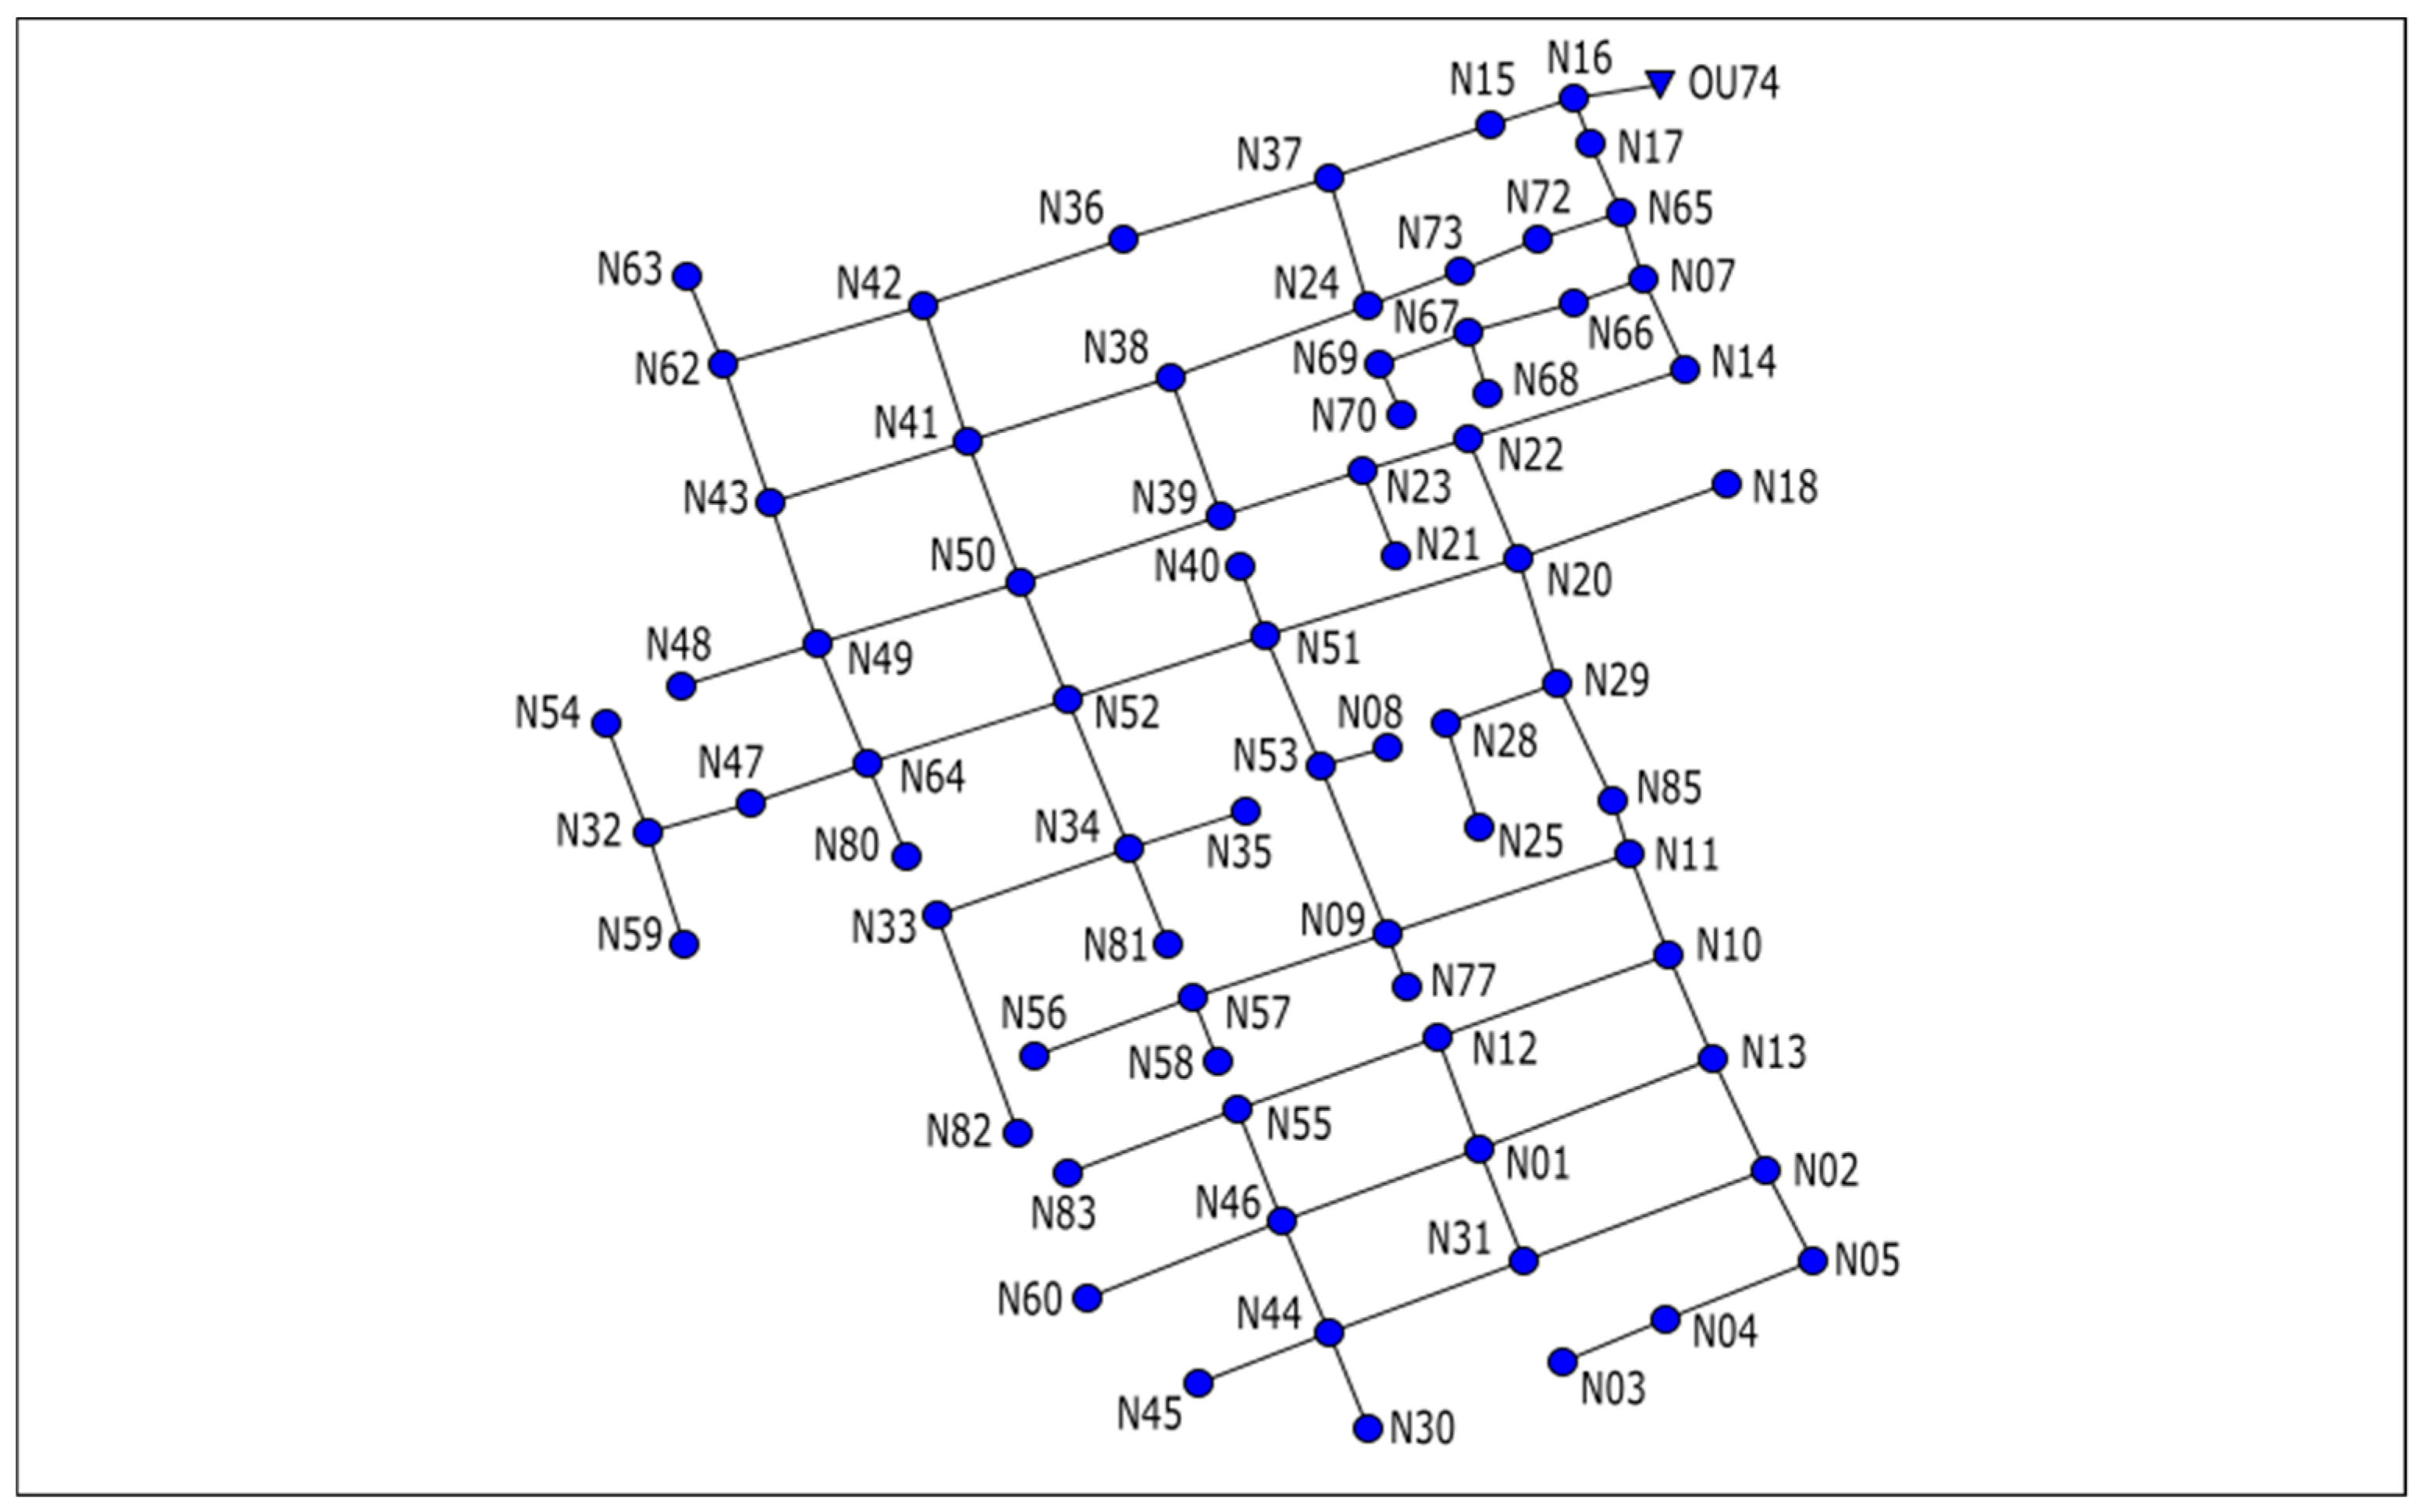
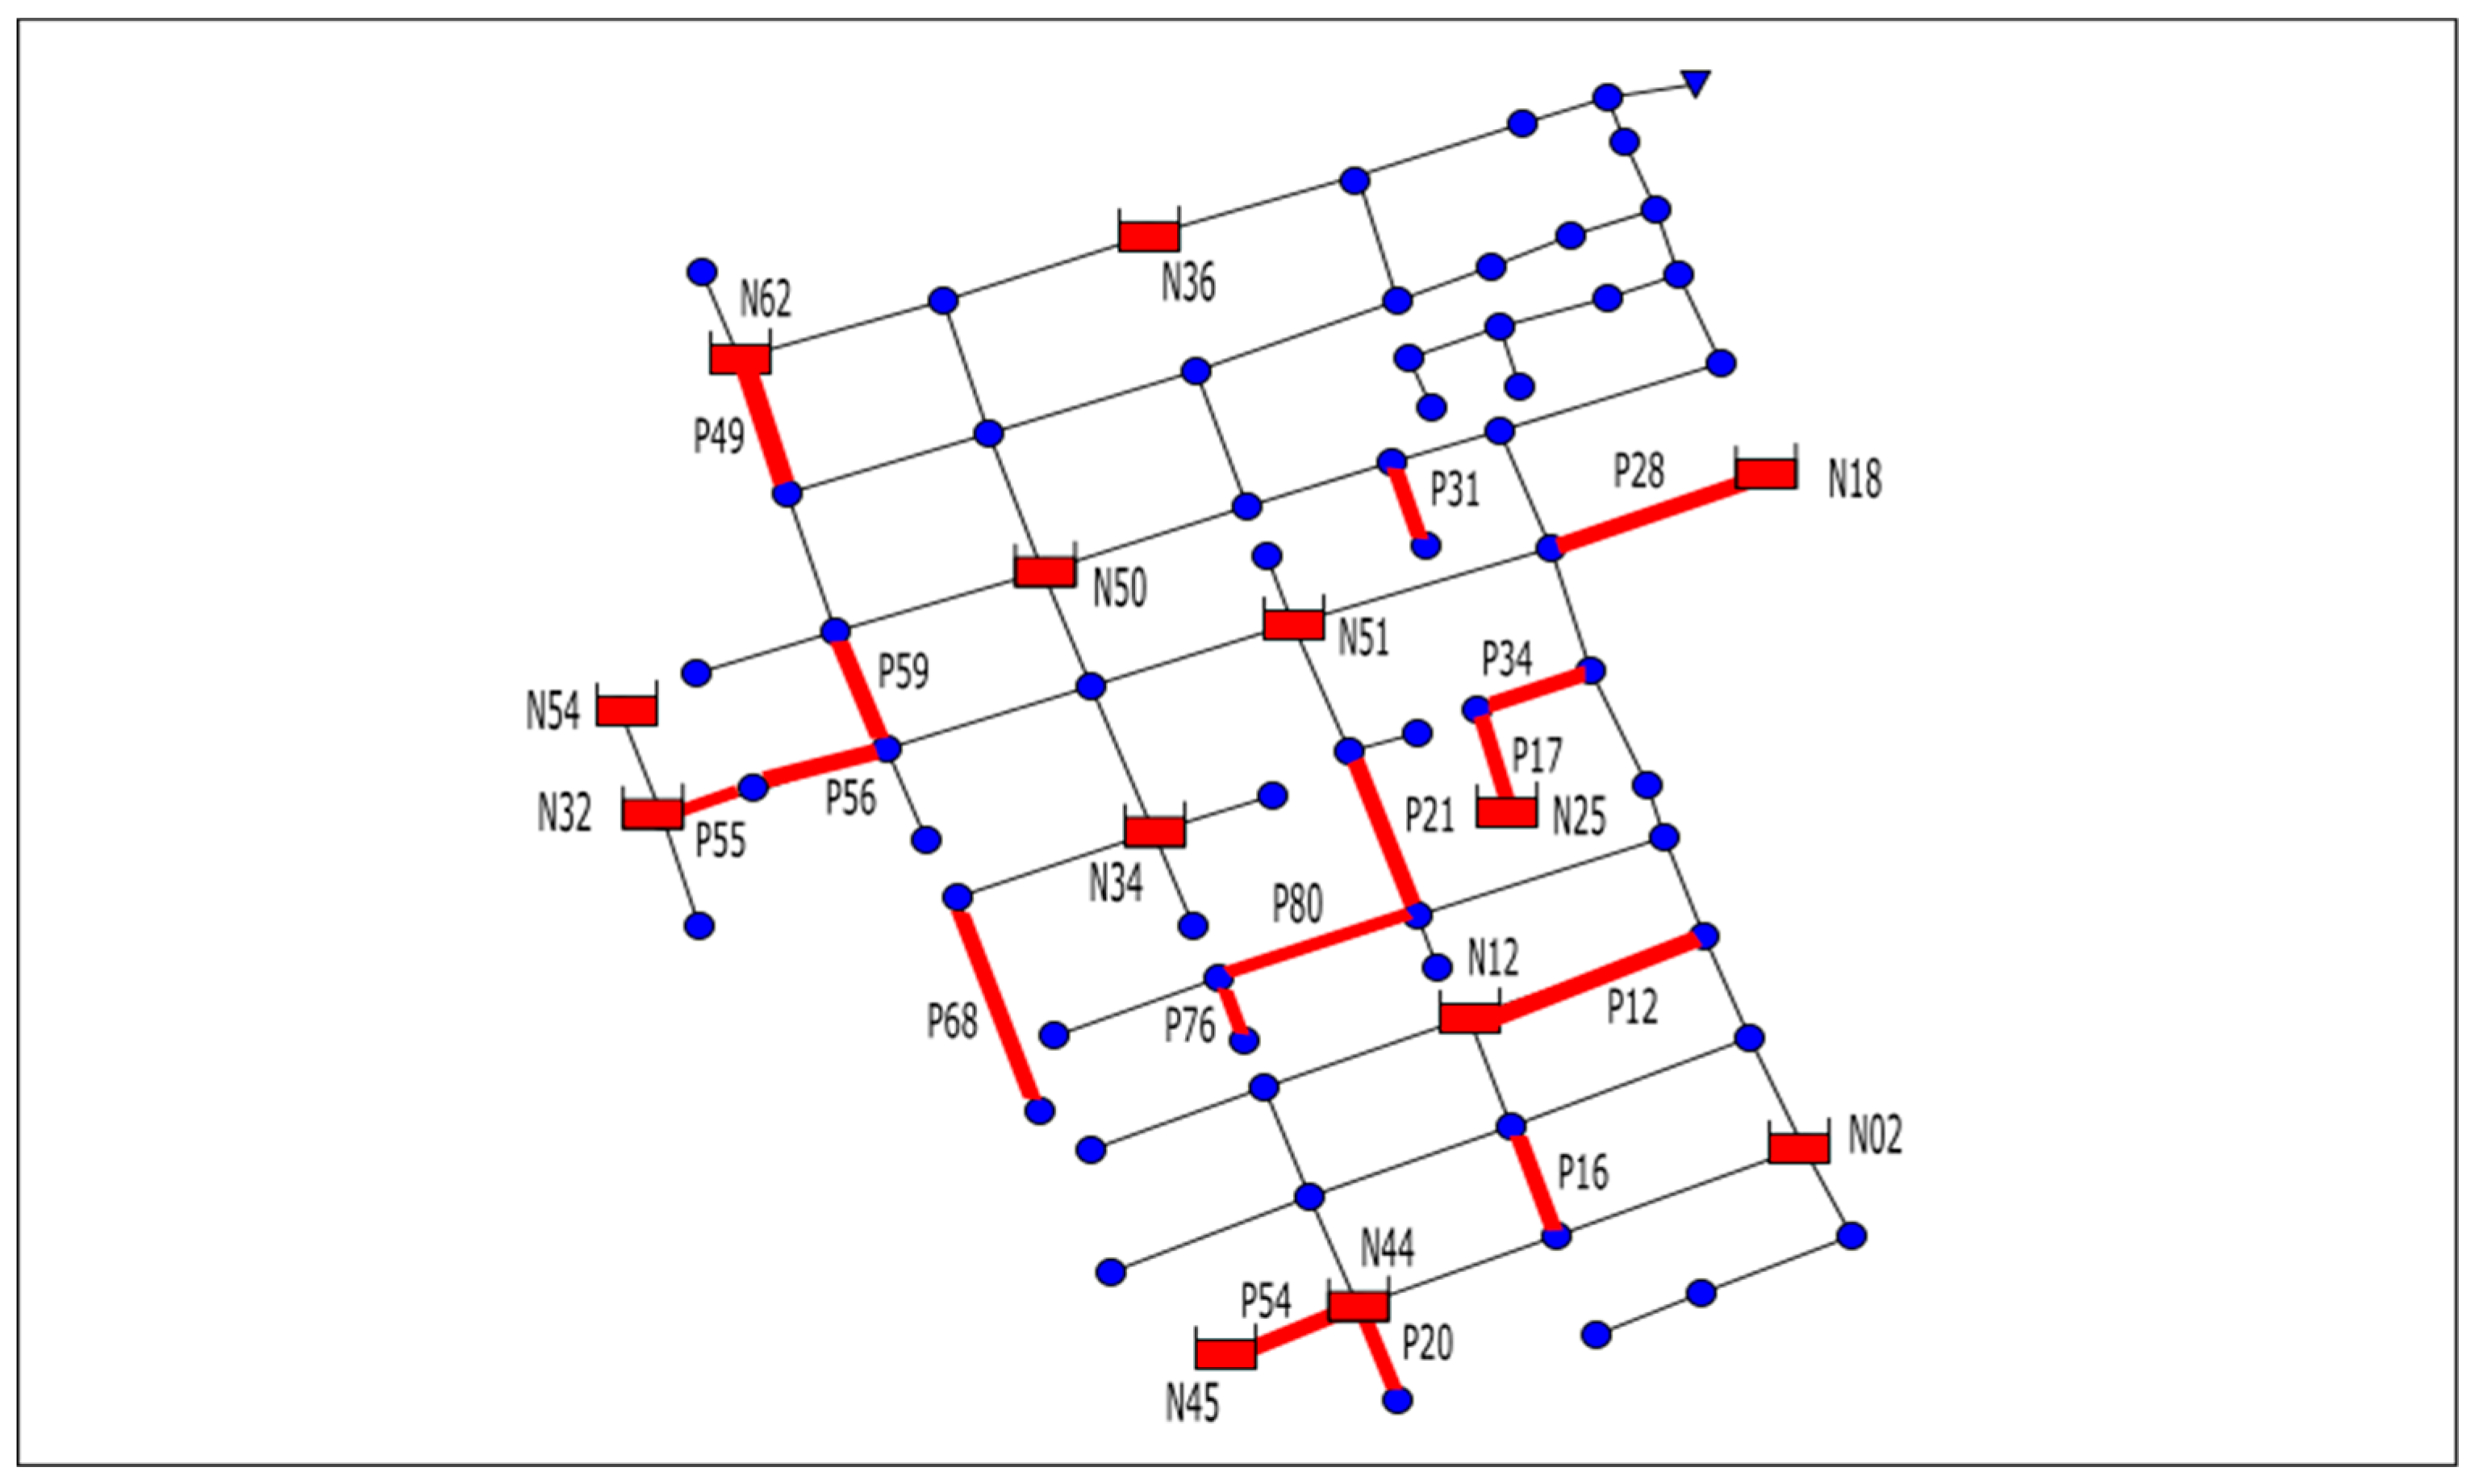
In order to test the methodology mentioned above, a sub-catchment of the drainage network of Medellin city (Colombia) was used. The part of the drainage network studied is generically known as Ayurá district. The drainage network flows into the Medellín River, which cross the city from South to North. The network is extended over 22.5 ha and is divided into 83 hydrological sub-catchments for 73 nodes and 86 circulars conduits from 200 to 1050 mm diameters. The difference between the highest point and the lowest point of the network is 15.61 m. The network works completely by gravity, since the terrain profile is favorable for the drainage of rainwater. The methodology has been applied to various networks, but Ayurá has been selected for this paper due to the elevated number of conduits and nodes and to the fact that Ayurá is a mesh network.
Figure 2 presents the Ayurá network.
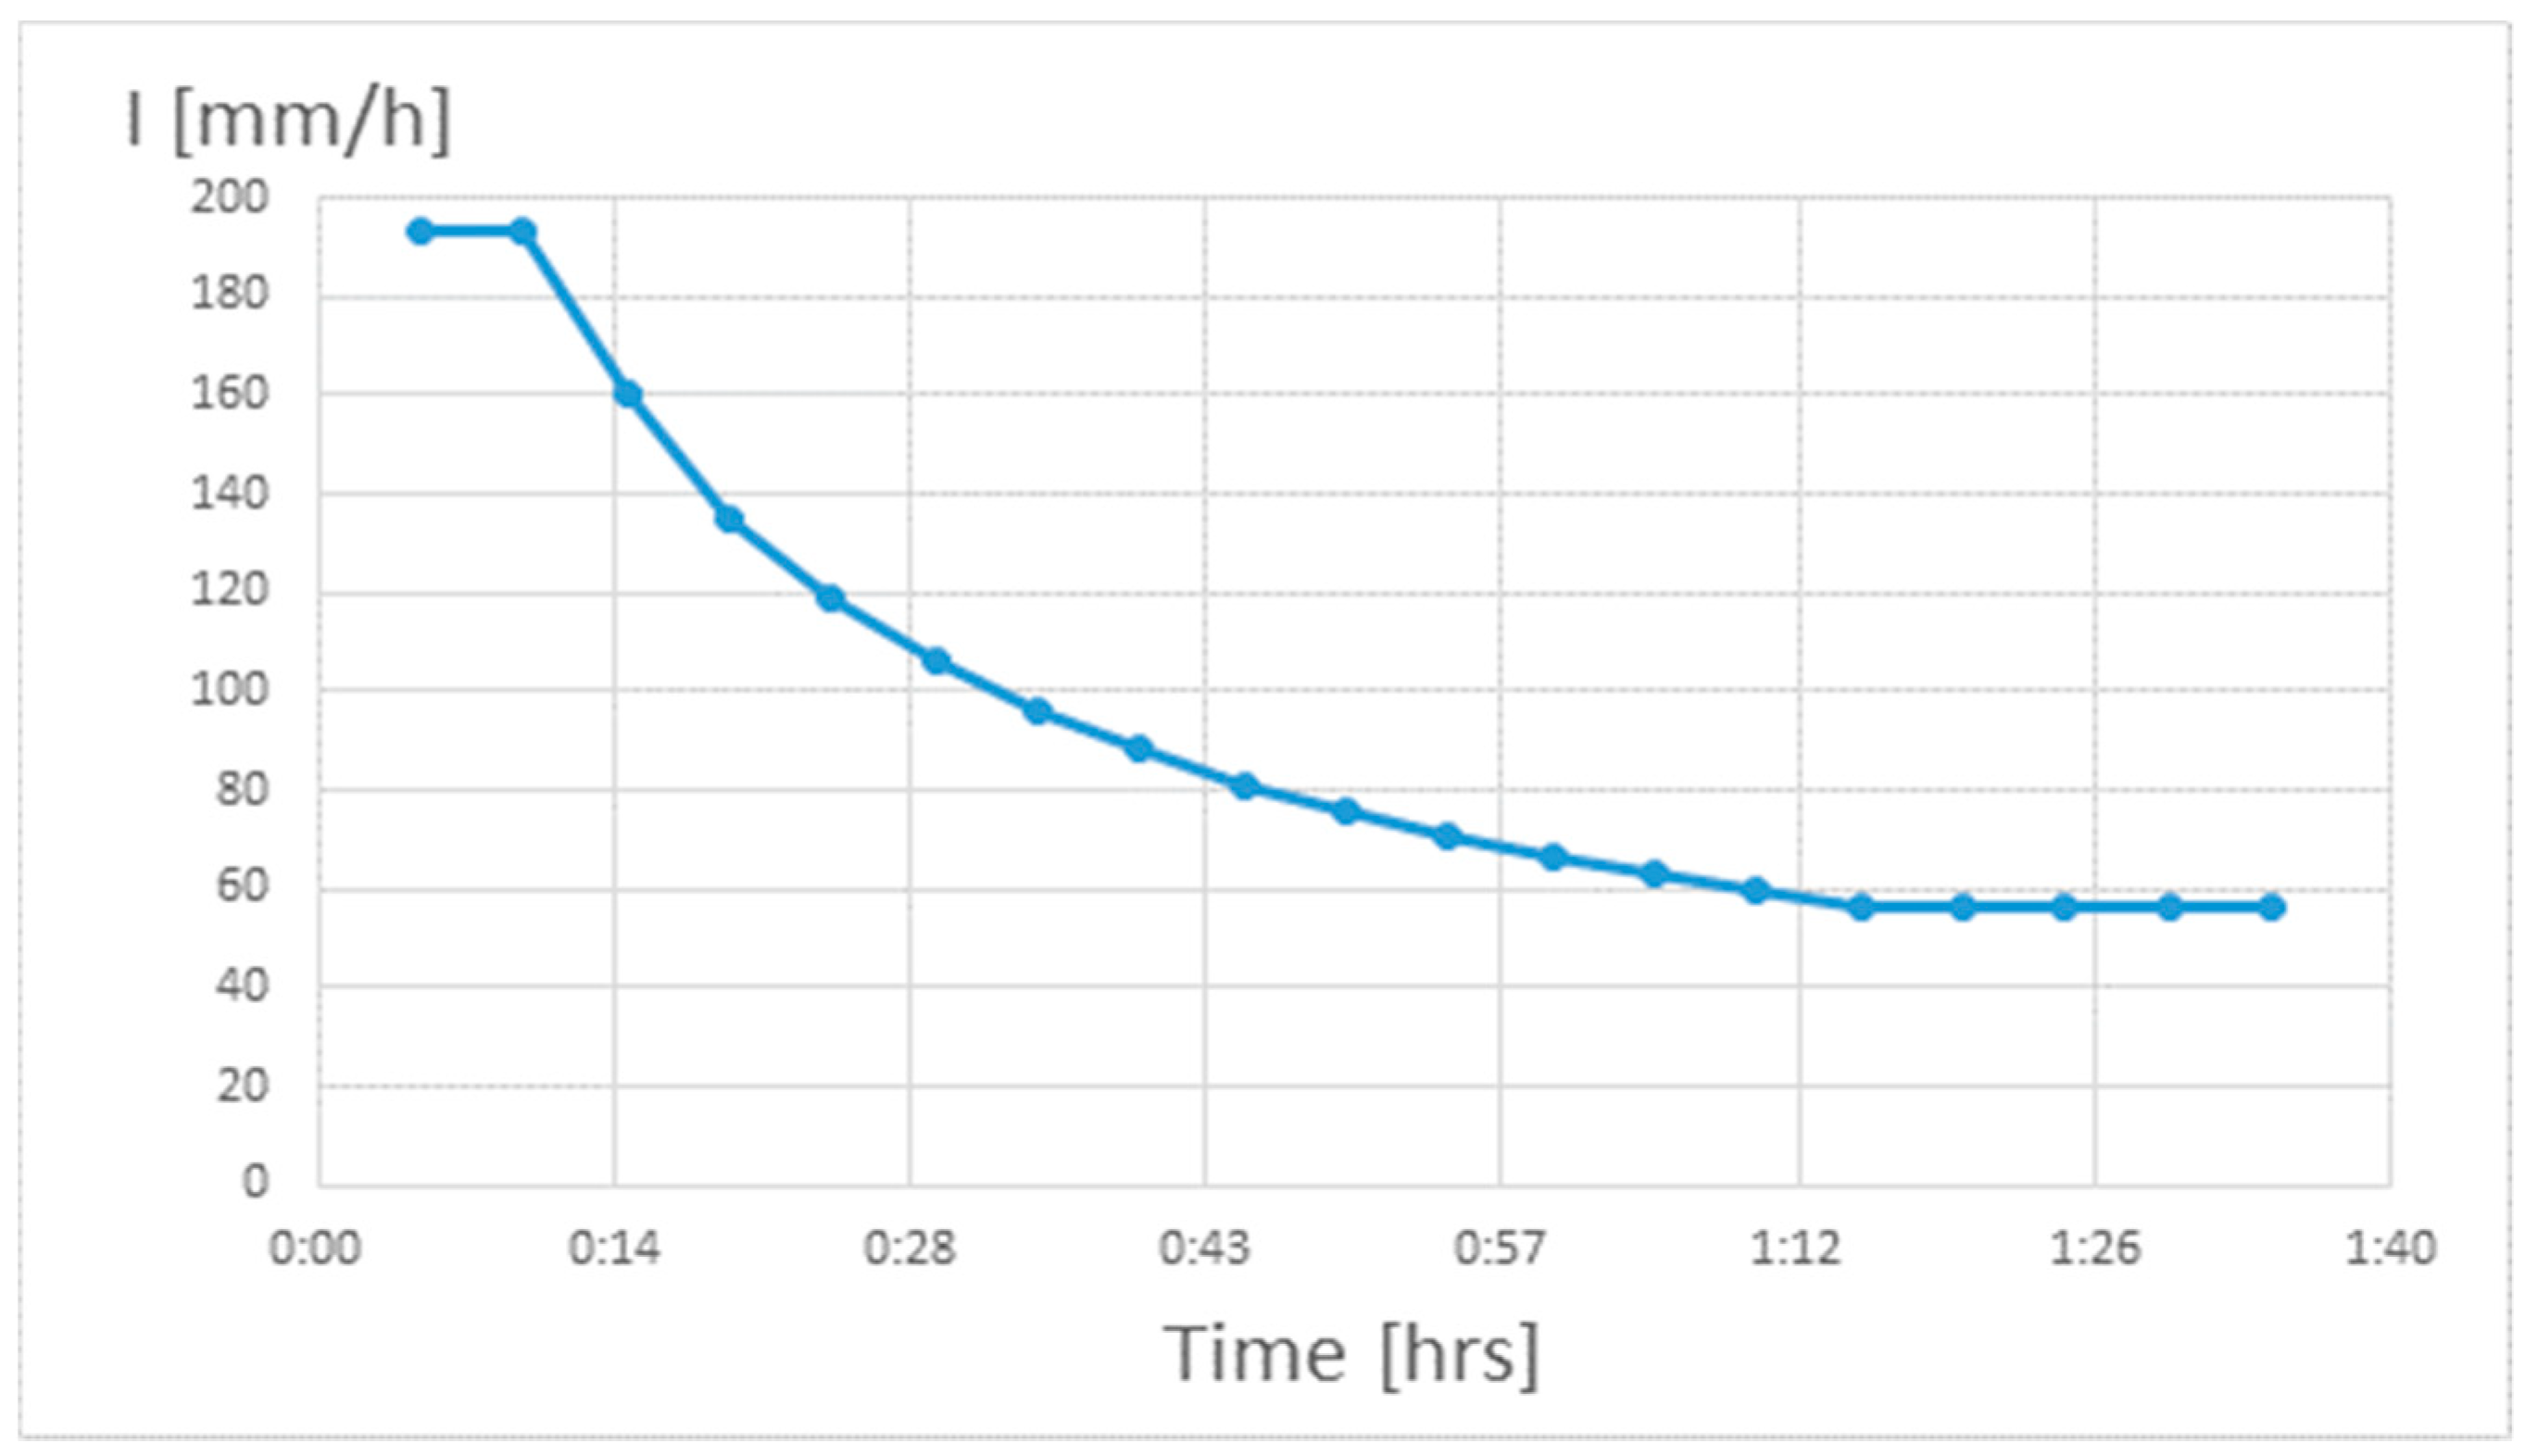
From the first hydraulic analysis performed in SWMM, the total flooding volume of the network is about 4271 m
3, which represents 27.14% of the generated runoff (15,735 m
3) from the selected rainfall. The IDF curve of the project rain is presented in
Figure 3.
To sum up, the preliminary analysis of the network shows that it is unable to drain the selected project rain. Therefore, the Ayurá drainage network was considered adequate to apply the proposed rehabilitation methodology of this work.
Any simulation is only possible after the definition of all the data in the expression of the objective functions. Basically, this means define the following parameters: A and B of Equation (1) and C
min, C
var, and
n of Equation (2). The values considered are price databases established for the area where the network is located (Colombia). These values are shown in
Table 2.
Table 3 presents the full range of pipe diameters (D) and respective installation cost (C) of each diameter. There are
ND =
NDmax = 25 parameters considering the 24 probable diameters than can be installed and the state corresponding to no action taken on the original pipe. The application of parameters in
Table 2 to Equation (1) obtains the different installation costs of commercial diameters.
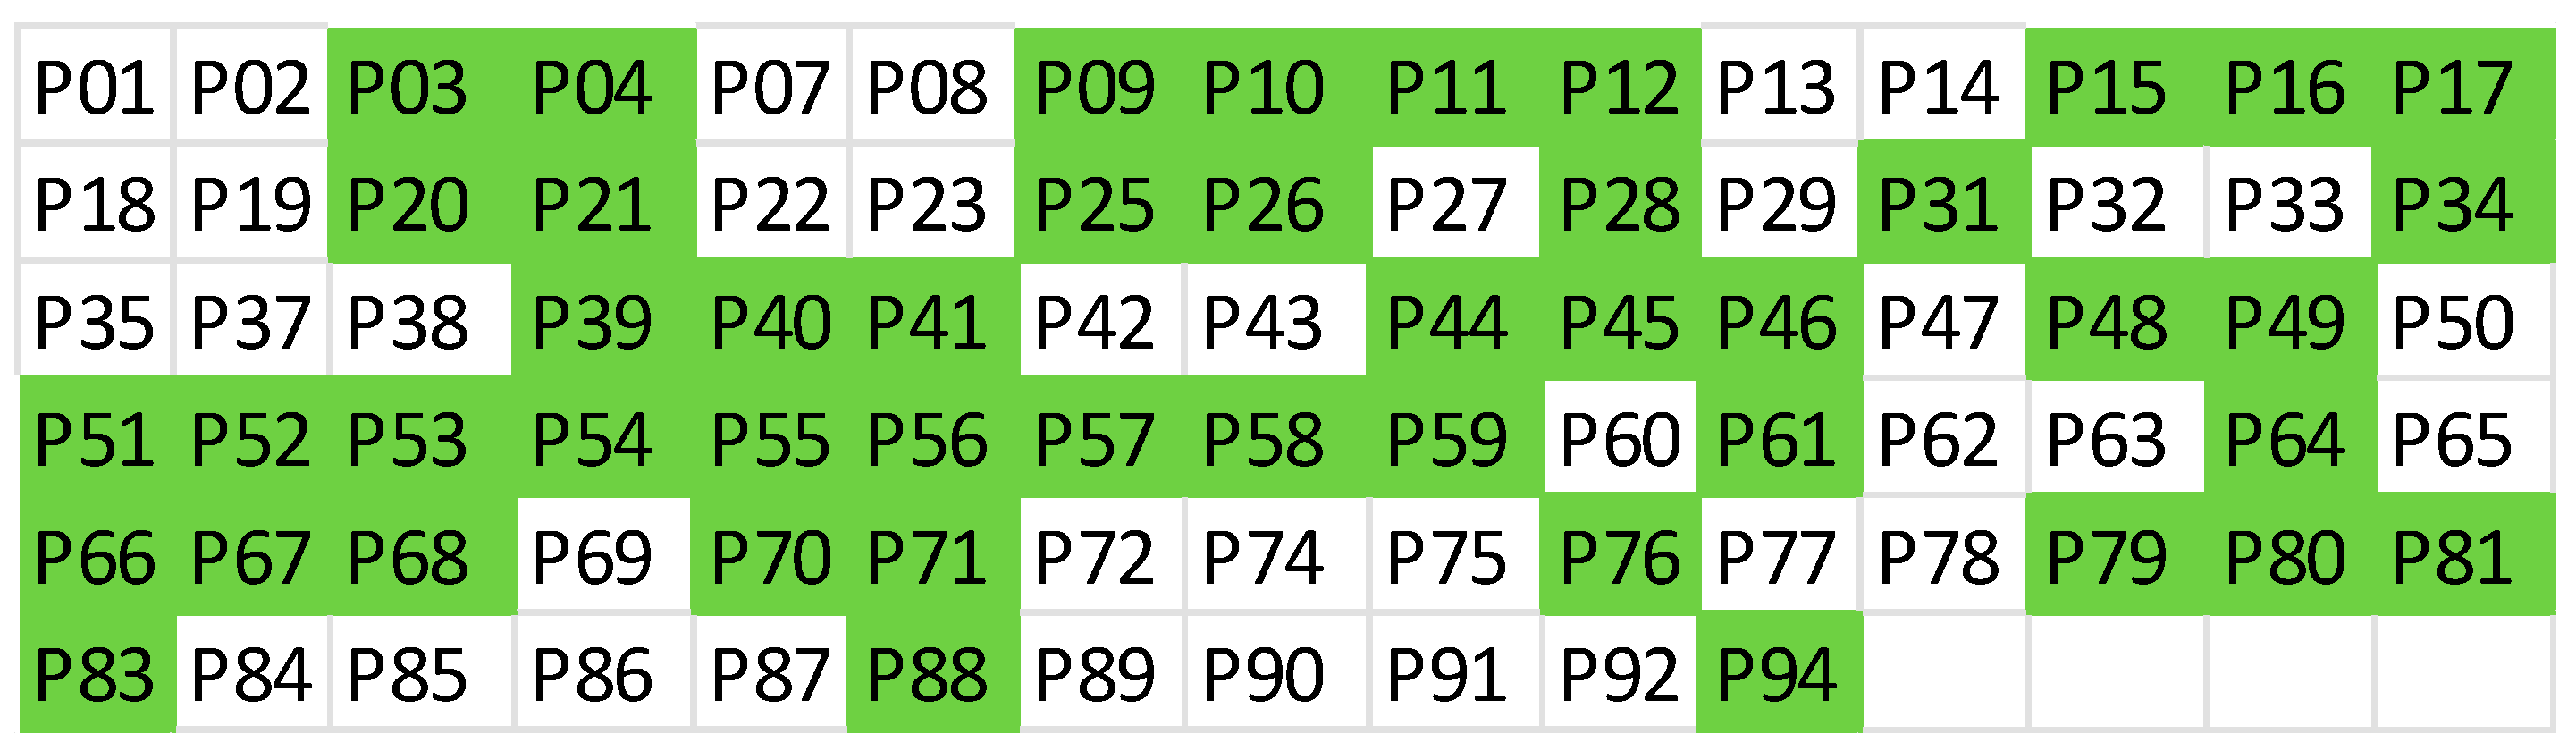
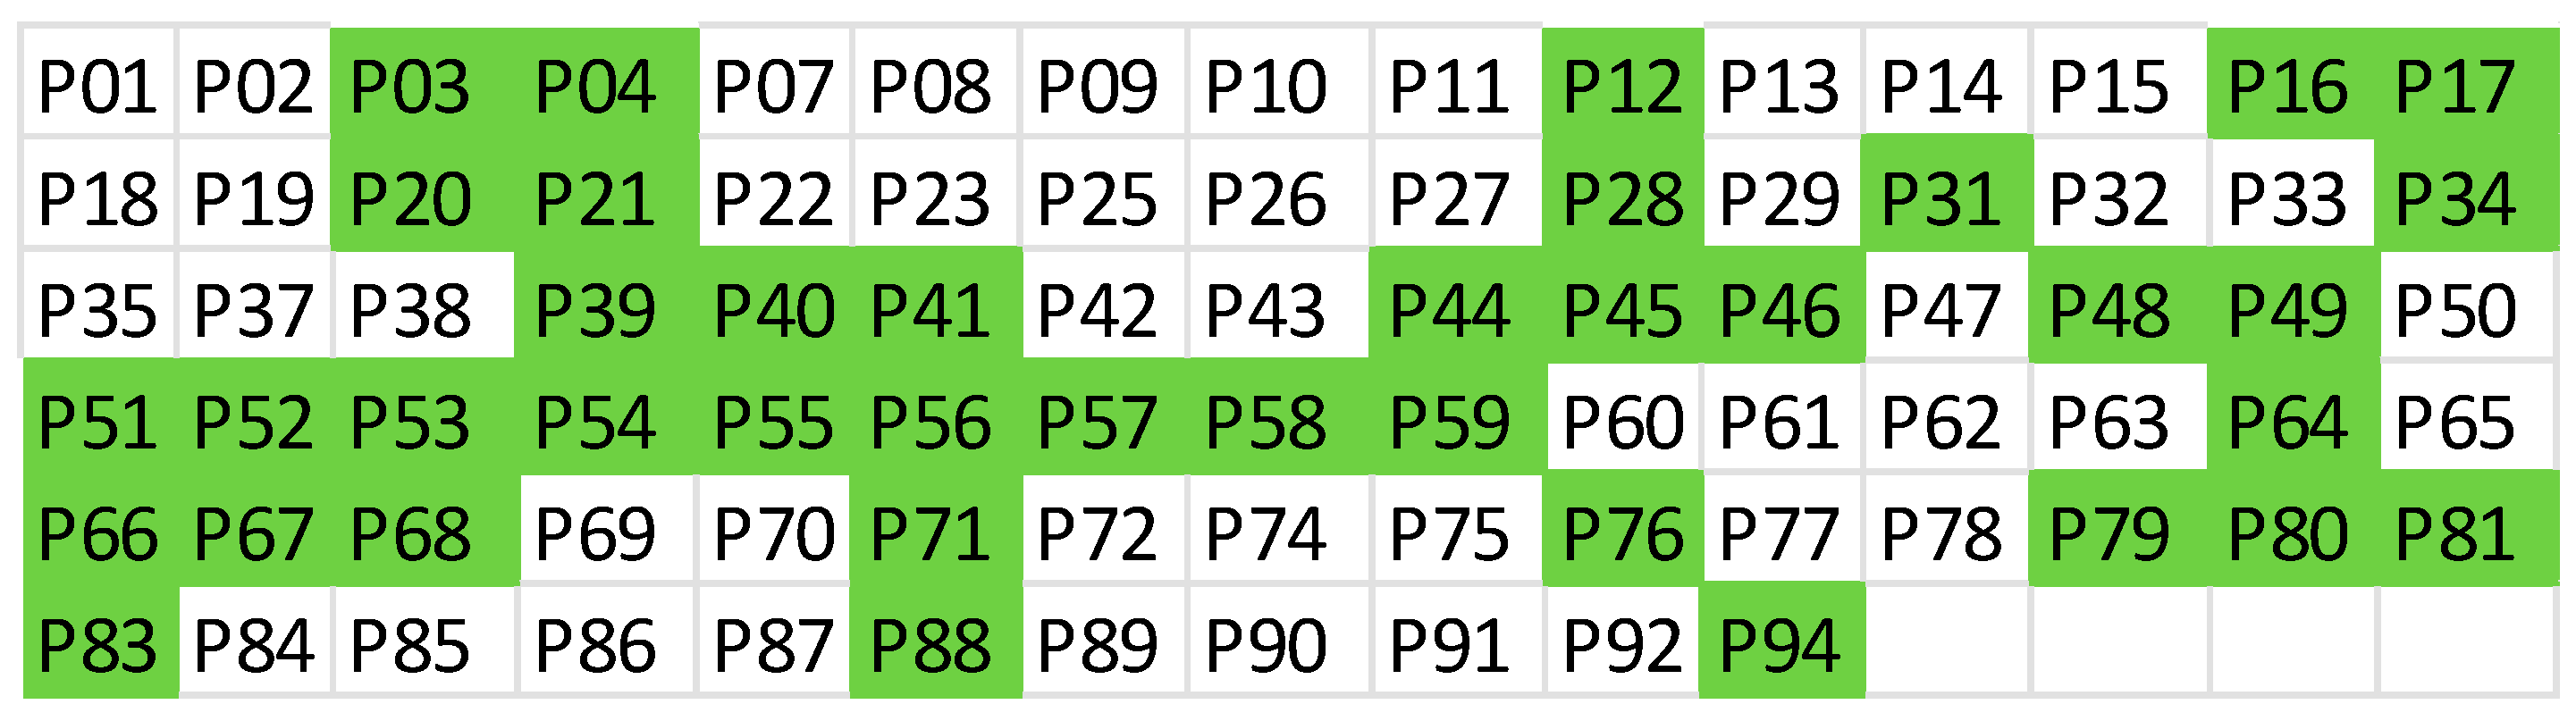
The first rehabilitation process has been performed to the whole network, which considers decision variables of all the 73 nodes and all the 86 lines, which are specifically defined as:
Complete Model: Rehabilitation of the network combining the installation of conduits and storm tanks. The total number of decision variables is 159.
The complete model is reduced after the application of the search space reduction (SSR) methodology and various search space reduction models can be obtained based on the selection probability.
Search space reduction model 1 for 10% selection probability: The number of conduits and nodes where action can be taken is reduced.
The search space reduction model 2 for 5% selection probability: The number of conduits and nodes where action can be taken is reduced.
Another selected probability will give another search space reduction model.
7. Conclusions
Extreme rainfall events and urbanization cause flooding problems to some originally well-designed drainage networks. One approach considers that these networks should be adapted to the new environmental and climatic conditions. Therefore, many strategies of adaptation have been planned and applied to solve the problem. Unfortunately, some of these strategies with time become ineffective due to climate change. Gong et al. [
22] and Mora et al. [
23] arrived at the conclusion that the green roof is inefficient for extreme rainfall events. It is important to always look for new and better strategies. Rehabilitation of drainage networks using pipes replacement and storm tank installations appears to be a better alternative to implement in order to effectively reduce or mitigate flooding. The problem encountered in this case is that the necessary time to implement such a solution is too elevated. In this work, an optimal rehabilitation methodology is presented. The methodology is composed by a search space reduction part, which reduces the problem size and a multi-objective part. This solves the search space reduction model based on the different defined objectives. The methodology implements key options to achieve the search space reduction. Reduction of search space reduces the number of local minima and calculation time. Reduction of search space achieves better results in both single-objective and multi-objective optimization.
The proposed methodology applied to the Ayurá network can be extended to any type of drainage network, since the methodology has been presented in a general form so that it can be easily extrapolated to other networks.
Drainage networks with pumping stations can be sources of uncertainties, but the presented methodology would be applicable. If the pumping station already exists in the network, the new decision variables can be the start and stop levels of the pump and the size of the suction tank. If the pumping station has to be installed in the drainage network, the flows to be evacuated by each pump would be defined as decision variables. The pumping investment costs should then be added in the objective function.
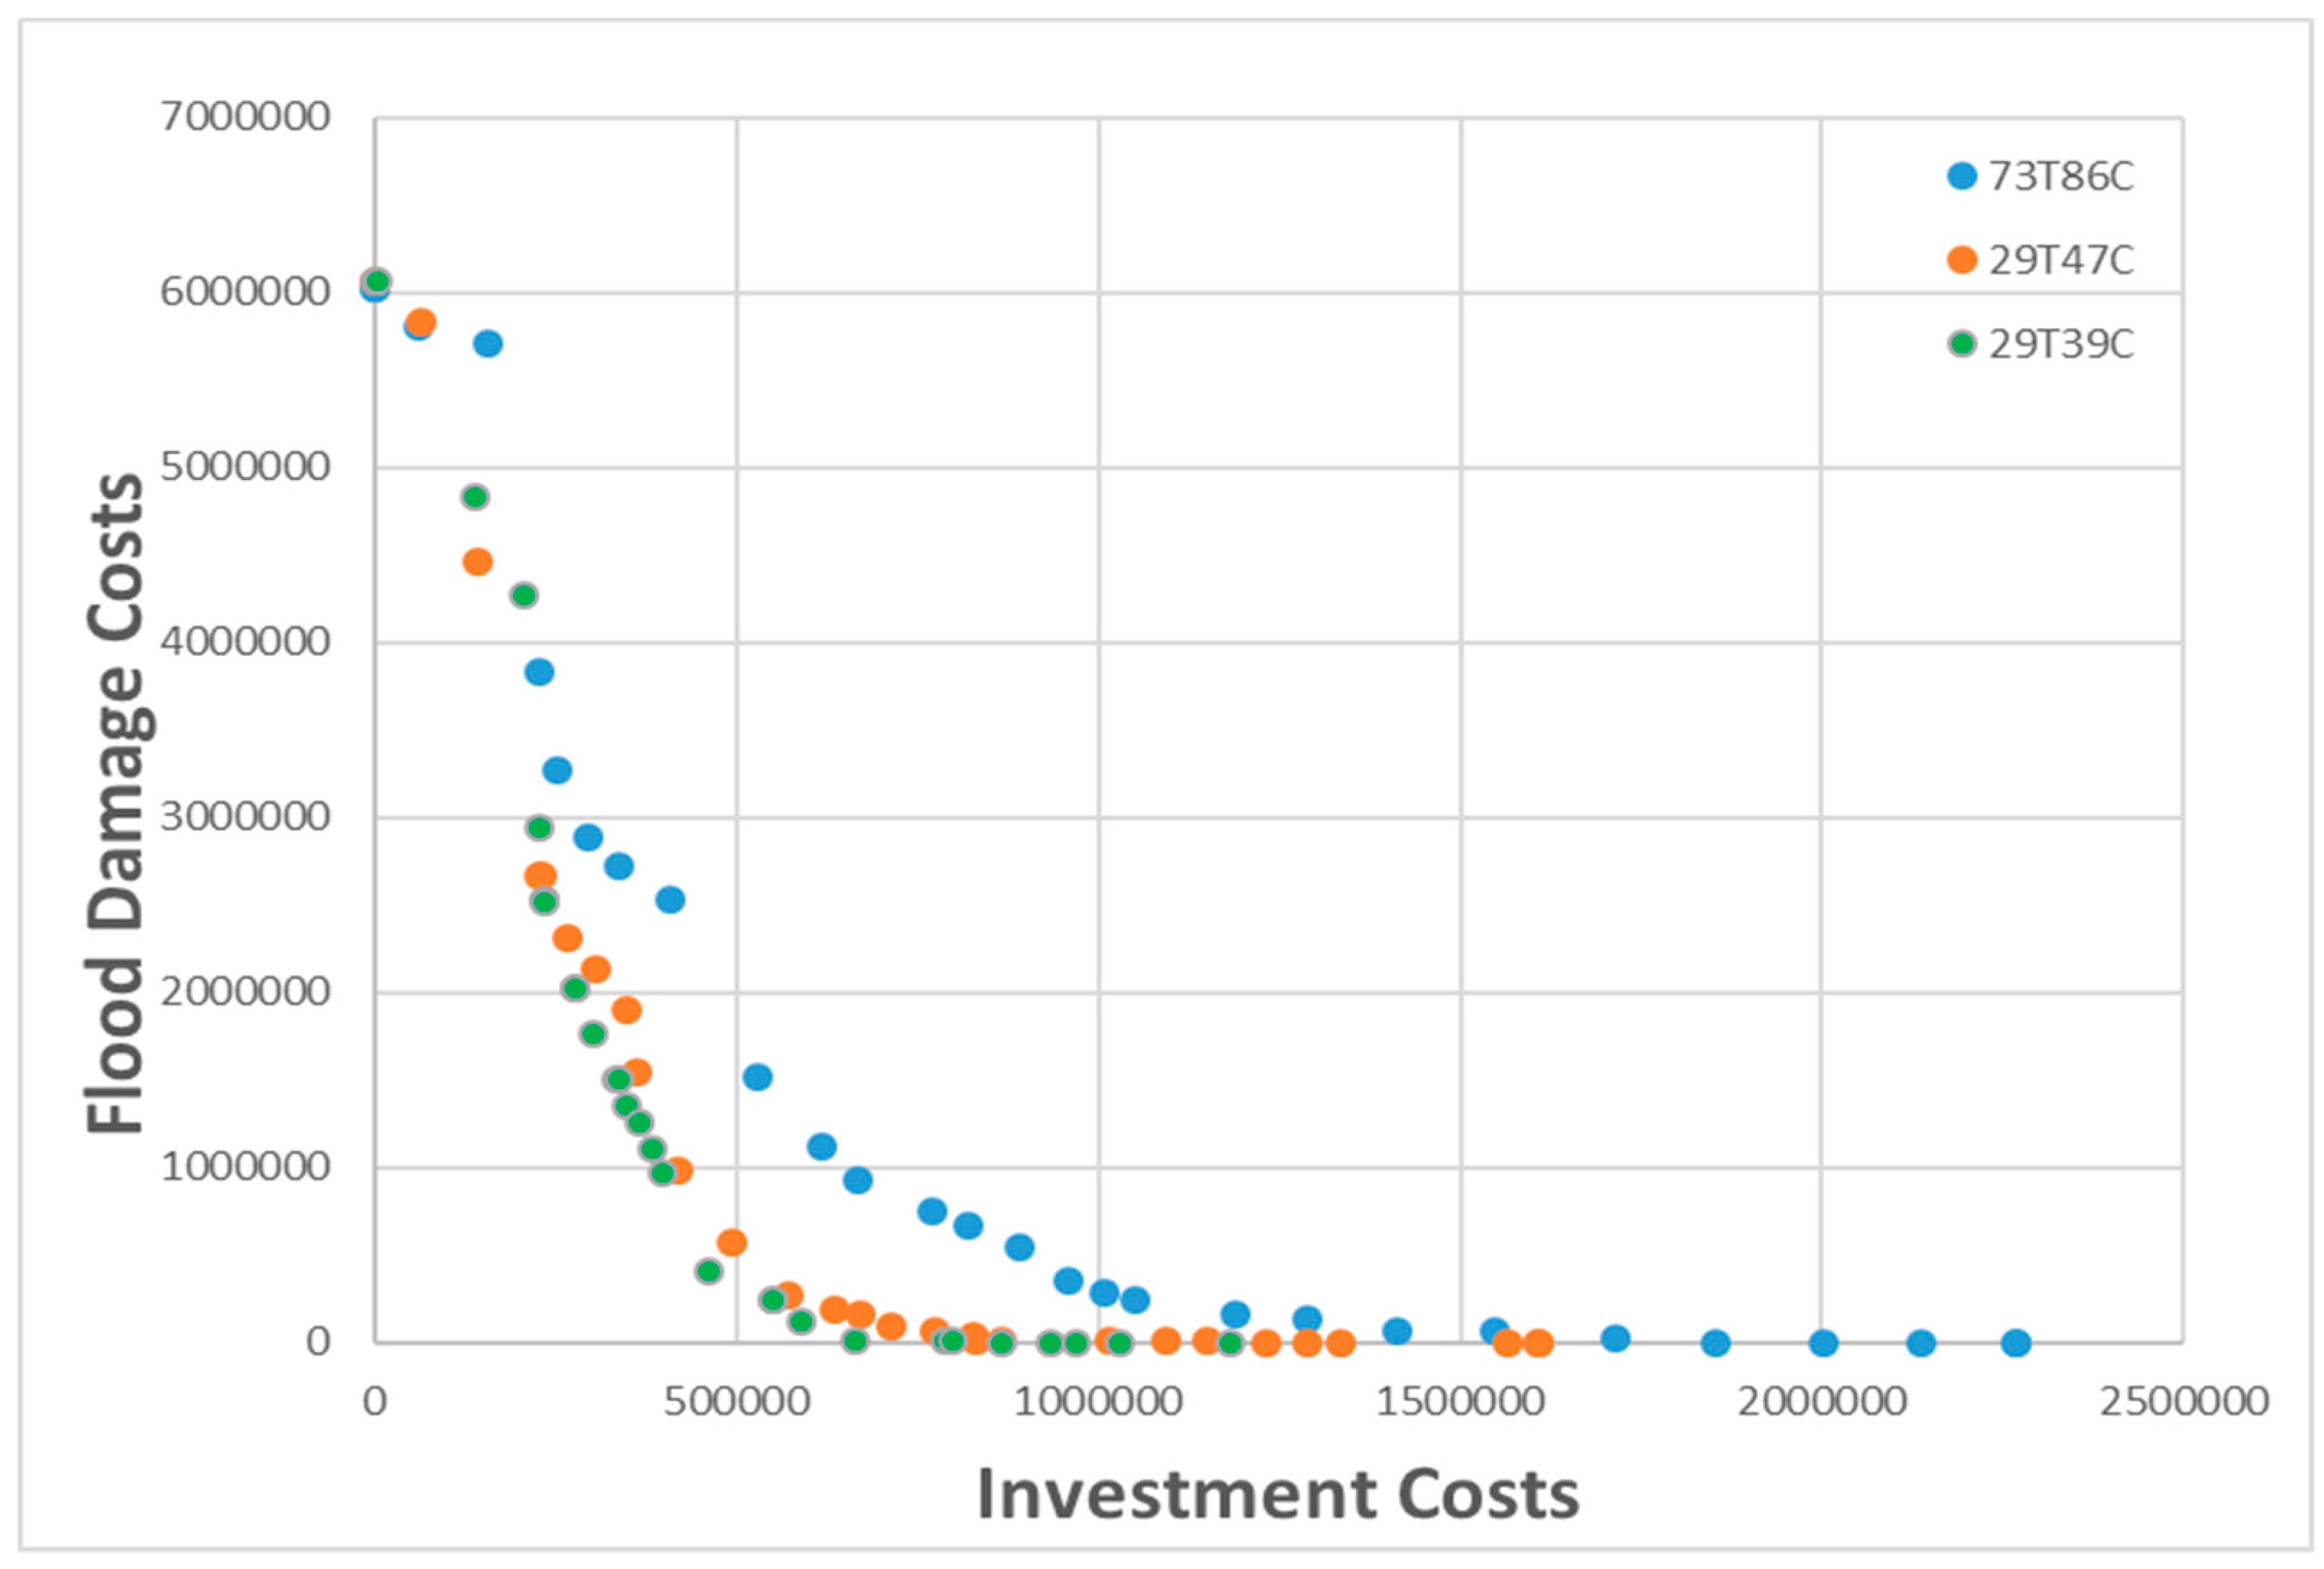
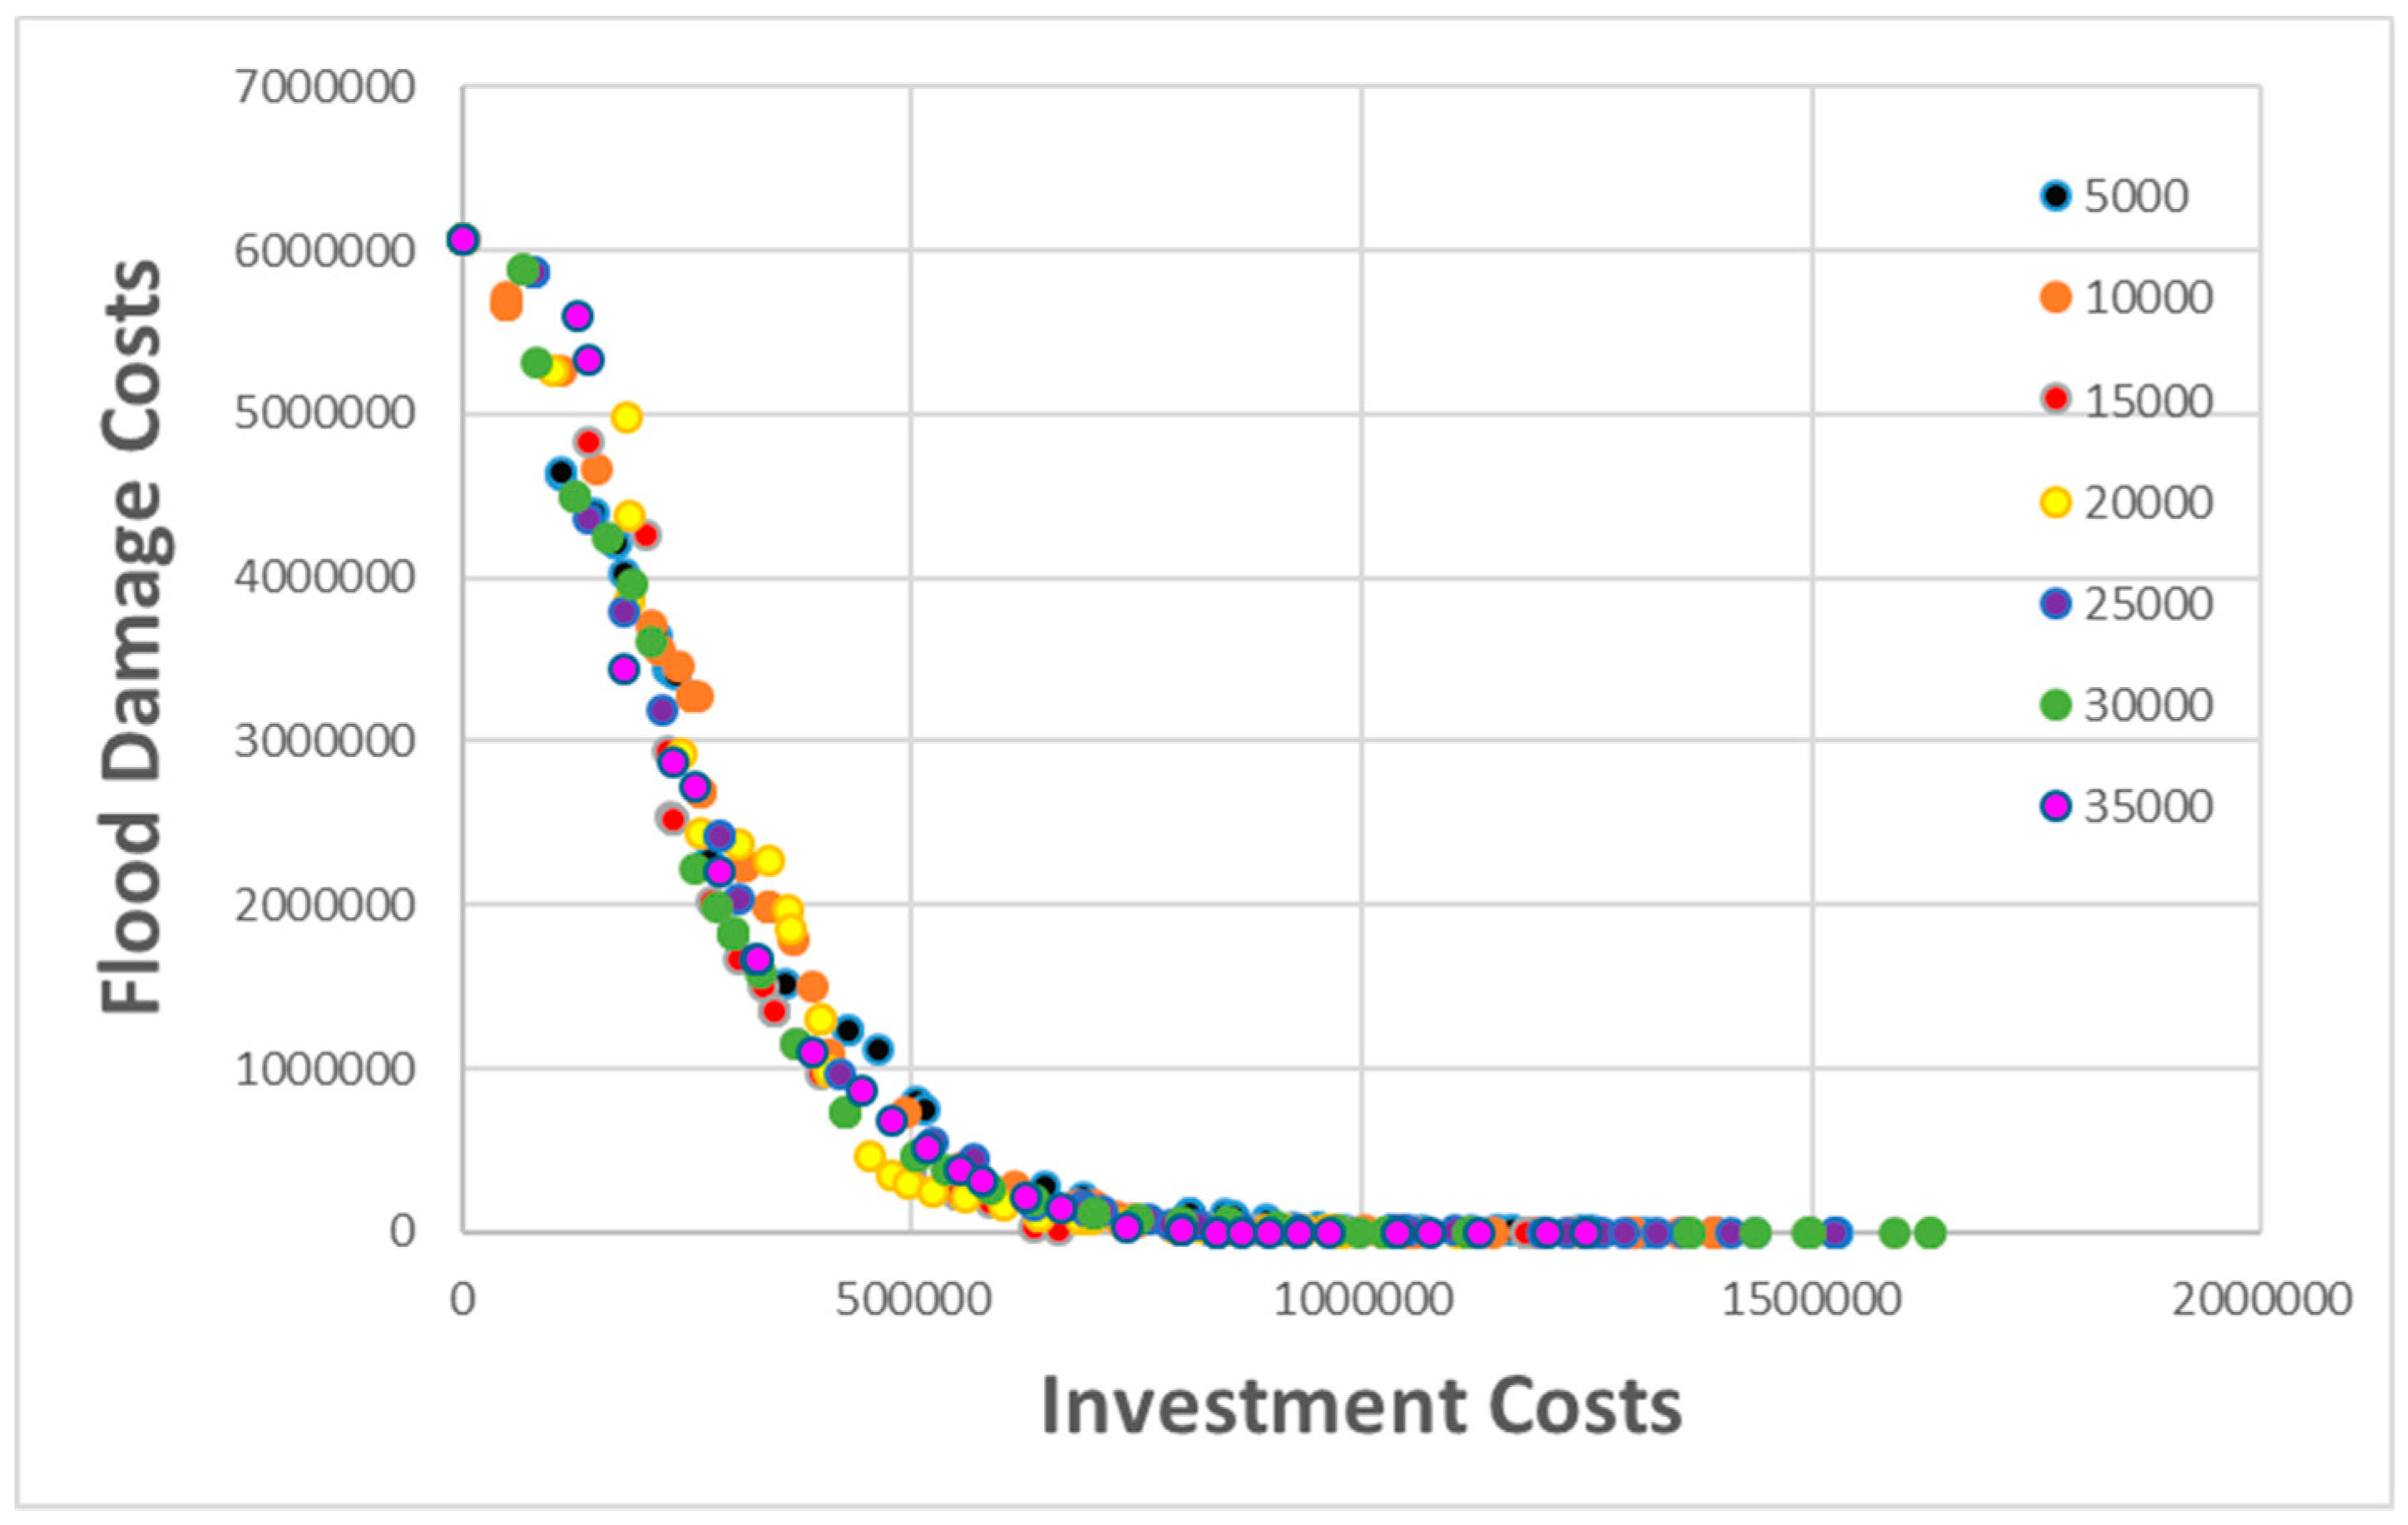
Search space reduction is an easy task to implement but, depending on the network size and the computer capacity, this operation may need more time. However, it is necessary to reduce the search space because it increases the exploration capacity of the optimization algorithm. The optimization of a search space reduction model provides better results (
Figure 7) than the complete model and the computation time is considerably reduced.
The application of the proposed methodology to Ayurá, which is a mesh drainage network, shows the effectiveness and the robustness of the proposed methodology.
Address the rehabilitation in monetary units permits the assessment of the flood damages and selects the corresponding investments to mitigate them. Pareto fronts provided a set of optimal solutions that can help drainage managers to select the ones corresponding to their budget, the risk assessment, or the network design criteria.
In a context where time optimization is a new challenge in water resources management, this study shows that problem size reduction or search space reduction is important to save time and investments in the presence of an optimization problem. The SSR problem gives the smallest investments costs that reduce flood damage costs because the reduction of problem size allows a better exploration of the solution space for the optimization algorithm.
Results obtained for the zero-flooding solution of model SSR 2 show that it will be interesting to include some hydraulic dissipation elements such as orifices or gates during the rehabilitation process to operate the hydraulic control.


