1. Introduction
Underground infrastructure is a critical component of the basic utility services provided to society. There are over 35 million miles of buried services in the United States (US), and this number is growing every year [
1]. In addition, the growth of urban underground space (UUS) is increasing significantly in the world’s largest cities [
2]. The single largest threat to the safety of UUS is being struck by a construction earthworks project [
3]. In 2016, the societal damage caused by utility strikes in the US came to an estimated
$1.5 billion [
4]. The main causes of this problem were the lack of data on urban underground spaces (UUS), and miscommunications between utility owners and contractors [
5,
6].
It is vitally important to coordinate resources, information sharing, and efficient communication between construction personnel and utility owners. In addition, the information intensiveness of construction projects requires the site workers to have on-demand access to project data such as drawings, utility locations, and utility depth [
7]. Geographic information systems (GIS) can provide a solution for interoperability in the construction industry by capturing, storing, analyzing, managing, and presenting all types of geographical data [
8]. GIS technology has advanced from simply creating two-dimensional (2D) maps to being able to create highly detailed three-dimensional (3D) models that present users with a more realistic view of the real world, as described by Bobylev [
2]. The 3D-GIS schemas such as collaborative design activity (COLLADA) and keyhole markup language (KML) [
9,
10] are able to store diverse types of attributes pertaining to specific real-world objects [
11]. However, applying such technologies in the field of underground construction and utility mapping requires accurate and up-to-date information, and has been thoroughly studied by Dutta et al., Muggleton et al., and Royal et al., [
12,
13,
14], which provided a significant improvement over the former state of the art.
These requirements currently limit the usage of GIS during many excavations and earthwork projects [
15]. Therefore, construction personnel often engage in traditional methods to identify the location of underground utilities. These methods include utilizing metal-detecting locating devices, reflective spray paint, and flagging [
16]. A full review of the non-disruptive applications used can be found in Metje et al., [
17]
To improve access to and utilization of information, augmented reality (AR) has been identified as a technique that can enhance human perception and information extraction from the virtual world to the real world [
18,
19]. AR systems already exist, although they are predominantly used for presenting data that have been specially prepared by specialized or custom software in an office context [
7,
15,
20,
21].
These systems can be accessed through portable devices, but usually have no capability to edit or add data dynamically on site [
22,
23,
24]. Therefore, the objective of this research was to develop an integrated AR and GIS for the specific purpose of mapping underground utilities. Additionally, this new integrated system will give users the ability to input utility locations using mobile devices in the field, and to instantaneously share the data with other stakeholders through a cloud-based system.
To achieve these objectives, a design research approach was utilized [
25,
26] to develop and evaluate an integrated AR and GIS solution. This designed solution aimed to enhance the information retrieval process during underground construction. Specifically, this research investigated the potential of utilizing the KML platform for handling unstructured data collected at construction sites. This was done by selecting commercially available tools and software, such as Google Earth, Unity 3D, and Apple’s augmented reality development platform (ARKit) [
27,
28,
29]. The major challenges that were overcome were the import and export process of KML files to a cloud service, the locational accuracy of utilities, modeling alignment, and the user interface. The motivation of this research was to provide a rich database of underground utility data for construction stakeholders to instantly access in the field, to enhance information retrieval, improve worker safety, and ultimately reduce pipe-striking occurrences.
1.1. Background
1.1.1. Current Practice of Existing Subsurface Identification
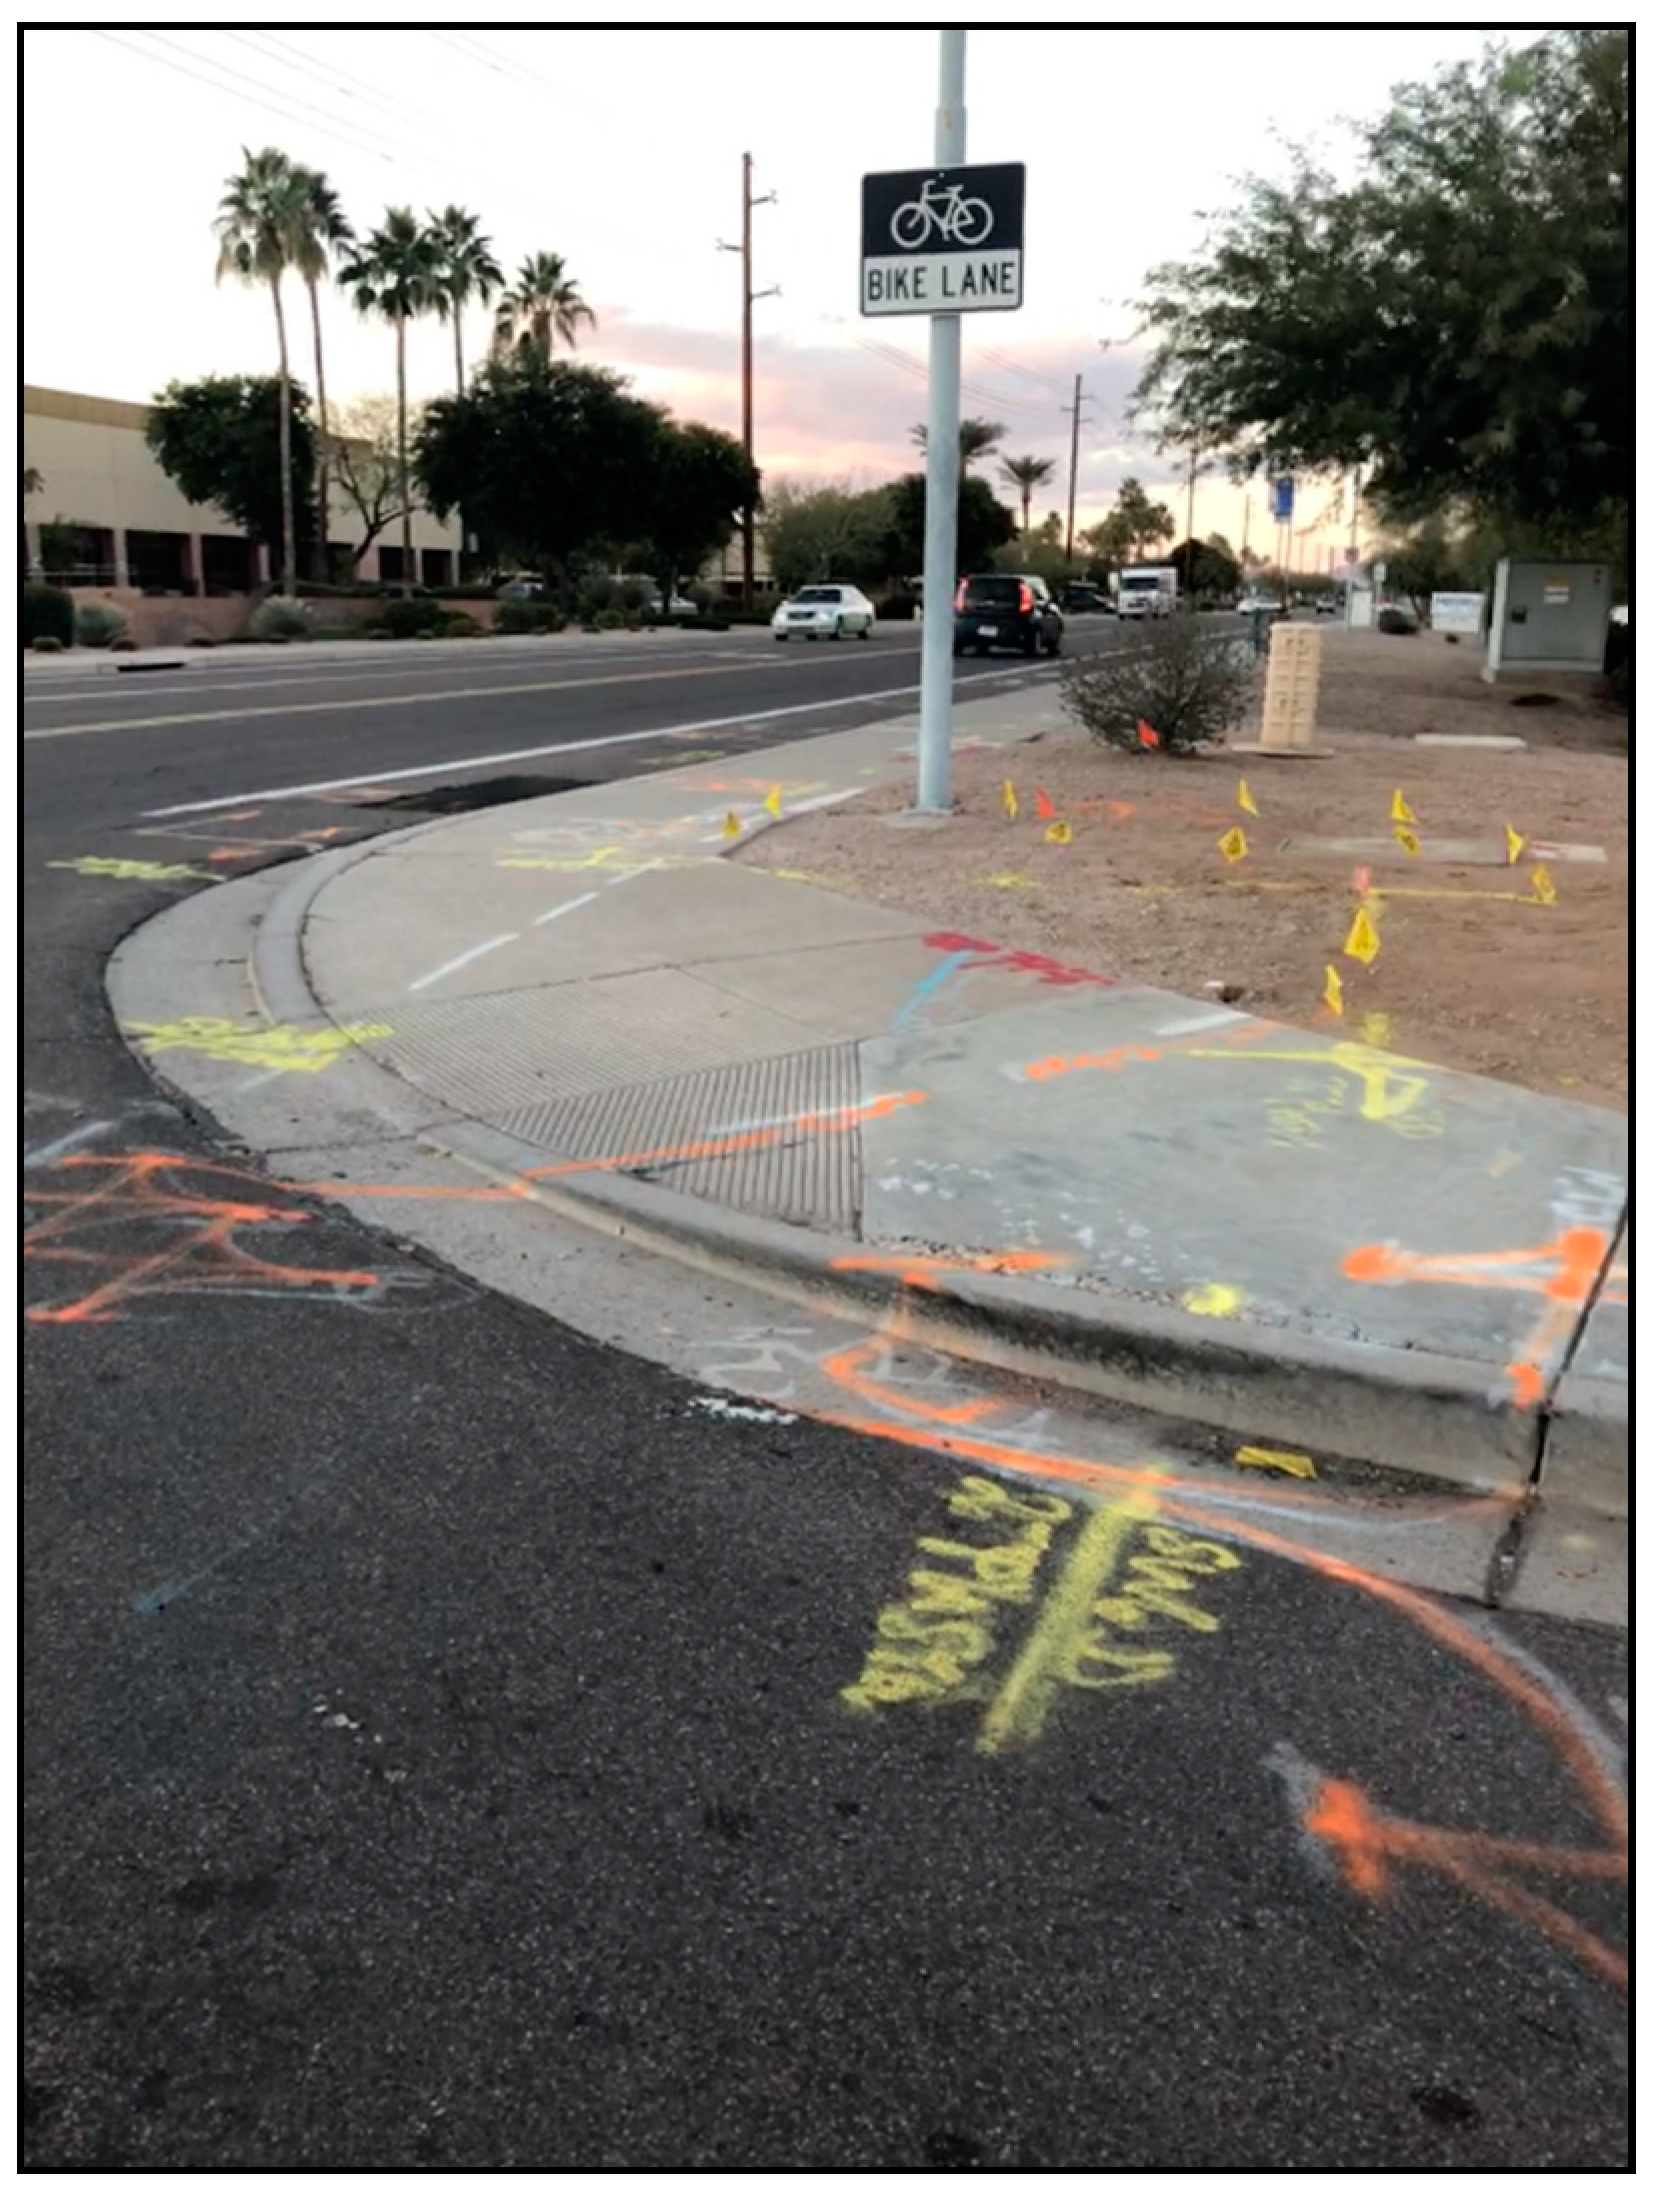
The main method of identifying buried utility locations in the US is through a one-call center, which requires, by law, those who carry out excavations to determine the location of the utilities to be excavated before digging. The process starts with the one-call center contacting the utility service providers that fall within the center’s jurisdiction, after which the utility providers mark the surface using either one or a combination of spray paint, flags, and stakes as shown in
Figure 1. When the digging begins, the markers are the first elements to be removed and the excavation operators must either rely on memory to find the location of the utility [
21] or go through the one-call system again, which will inevitably cause a delay in the project. Even with the diligent efforts of each state’s one-call system, the reality is that many undocumented underground utilities still exist throughout the nation.
Talmaki et al., [
3] identified three limitations with the one-call practice. The first is a lack of detailed information regarding the buried utilities. The second limitation is the degree of accuracy. The accurate locations of at least 50% of buried assets remain unknown [
30], with the utility markings only indicating the approximate location of the lines.
The one-call centers claim that the pre-marked areas are typically equal to the diameter of the utility line plus 0.6 m on either side of its outer diameter, and the utility line can lie anywhere within this area. The third limitation concerns the temporary nature of the markings, which are no longer visible once the top surface has been removed. This research aimed to reduce these limitations by integrating AR and GIS technologies.
1.1.2. Geographic Information System (GIS)
A geographic information system (GIS) is a system that collects, stores, analyzes, and displays geographic data [
31]. GIS is an effective tool for asset management because of its ability to integrate spatial and non-spatial data in a centralized database platform with real world geographical coordinates [
21]. With the advent of global positioning systems (GPS) and more modern global navigation satellite systems (GNSS), GIS technology has advanced exponentially and is now being used in a plethora of contexts including educational training, AR, and various scientific disciplines [
20,
31,
32,
33,
34,
35,
36]. GPS and GNSS are systems of geosynchronous satellites that orbit the Earth, providing location and time information to millions of users spread across the globe. By providing accurate geographic locations to devices, users have been able to collect more reliable field data and store these data in complex geographic systems.
Many utility owners have switched from computer-aided drafting (CAD) systems to more robust GIS for the creation, storage, and management of their utility information [
37]. For example, GIS allows utility owners to have their complete asset inventory archived in a single repository for data extraction, visualization, analysis, and updating information [
3]. Therefore, GIS has the inherent ability to store attribute information about the assets in a real-world system. Furthermore, in the construction industry, GPS now provides three-dimensional location information to machine-controlled heavy equipment such as excavators, graders, and bulldozers for higher accuracy builds and cost efficiency [
38].
1.1.3. Augmented Reality (AR)
According to Milgram et al., [
39], AR is the additional presence of data generated by a computer displayed on a user’s view of the real world. AR provides a tool for the further exploration of relevant data [
23], and a user’s experience can be supplemented with geo-referenced virtual objects. In accordance with the tracking method used, AR systems can be classified into outdoor AR systems and indoor AR systems [
40]. An outdoor AR system requires a global navigation satellite system (GNSS) and inertial measurement unit (IMU) sensors, such as accelerometers and gyroscopes, to aid in the registration process of the virtual objects [
41]. However, GPS does not work very efficiently in buildings. Additionally, because of the finite amount of space leveraged in an indoor system, these systems rely solely on using vision-tracking methods for location. Note that this research does not engage with indoor AR systems, instead focusing solely on outdoor applications.
Recently, researchers have been developing various AR outdoor vision-tracking applications. For example, Huang et al., [
41] developed a 3D geospatial system using an AR application to improve the efficiency and accuracy of data registration. Additionally, and more in keeping with this project, researchers have been using AR to visualize underground utilities, providing the ability to look beneath the ground for the purpose of subsurface utility inspection [
15,
42]. For example, Zhang et al., [
43] developed a GIS to improve the inspection of urban underground pipelines. Their system used two different techniques of computer vision and sensor fusion, so that the researchers could make detailed comparisons of these individual techniques. However, it has been discovered that most AR applications and AR research have focused on registration performance, without reporting on the data accuracy inputted into the applications by the users.
In the field of underground construction, the data used in AR applications have three main uses. The first use is to view what has not been built yet, such as a newly proposed gas utility line. Secondly, AR applications can be used to see what is hidden to the naked eye, such as buried elements or obstructed objects that would otherwise be in sight. Thirdly, they can be used to see things that cannot otherwise be seen, such as attribute information, organizational information, site boundaries, or environmental events. This research project aimed to develop an AR system that would incorporate all three of these main applications within one system. The system would then be able to provide a new information-sharing mechanism between all applicable stakeholders in the underground construction industry.
2. Materials and Methods
The aim of this research was to develop an artifact that could input data using mobile AR and store it in a centralized GIS database using cloud services. The integration of AR and GIS has been developed and evaluated from a technical performance perspective using a custom-built platform [
41,
42,
43] called the extended reality geographic information system (XR-GIS). The term extended reality (XR) encompasses virtual, augmented, and mixed reality systems [
44].
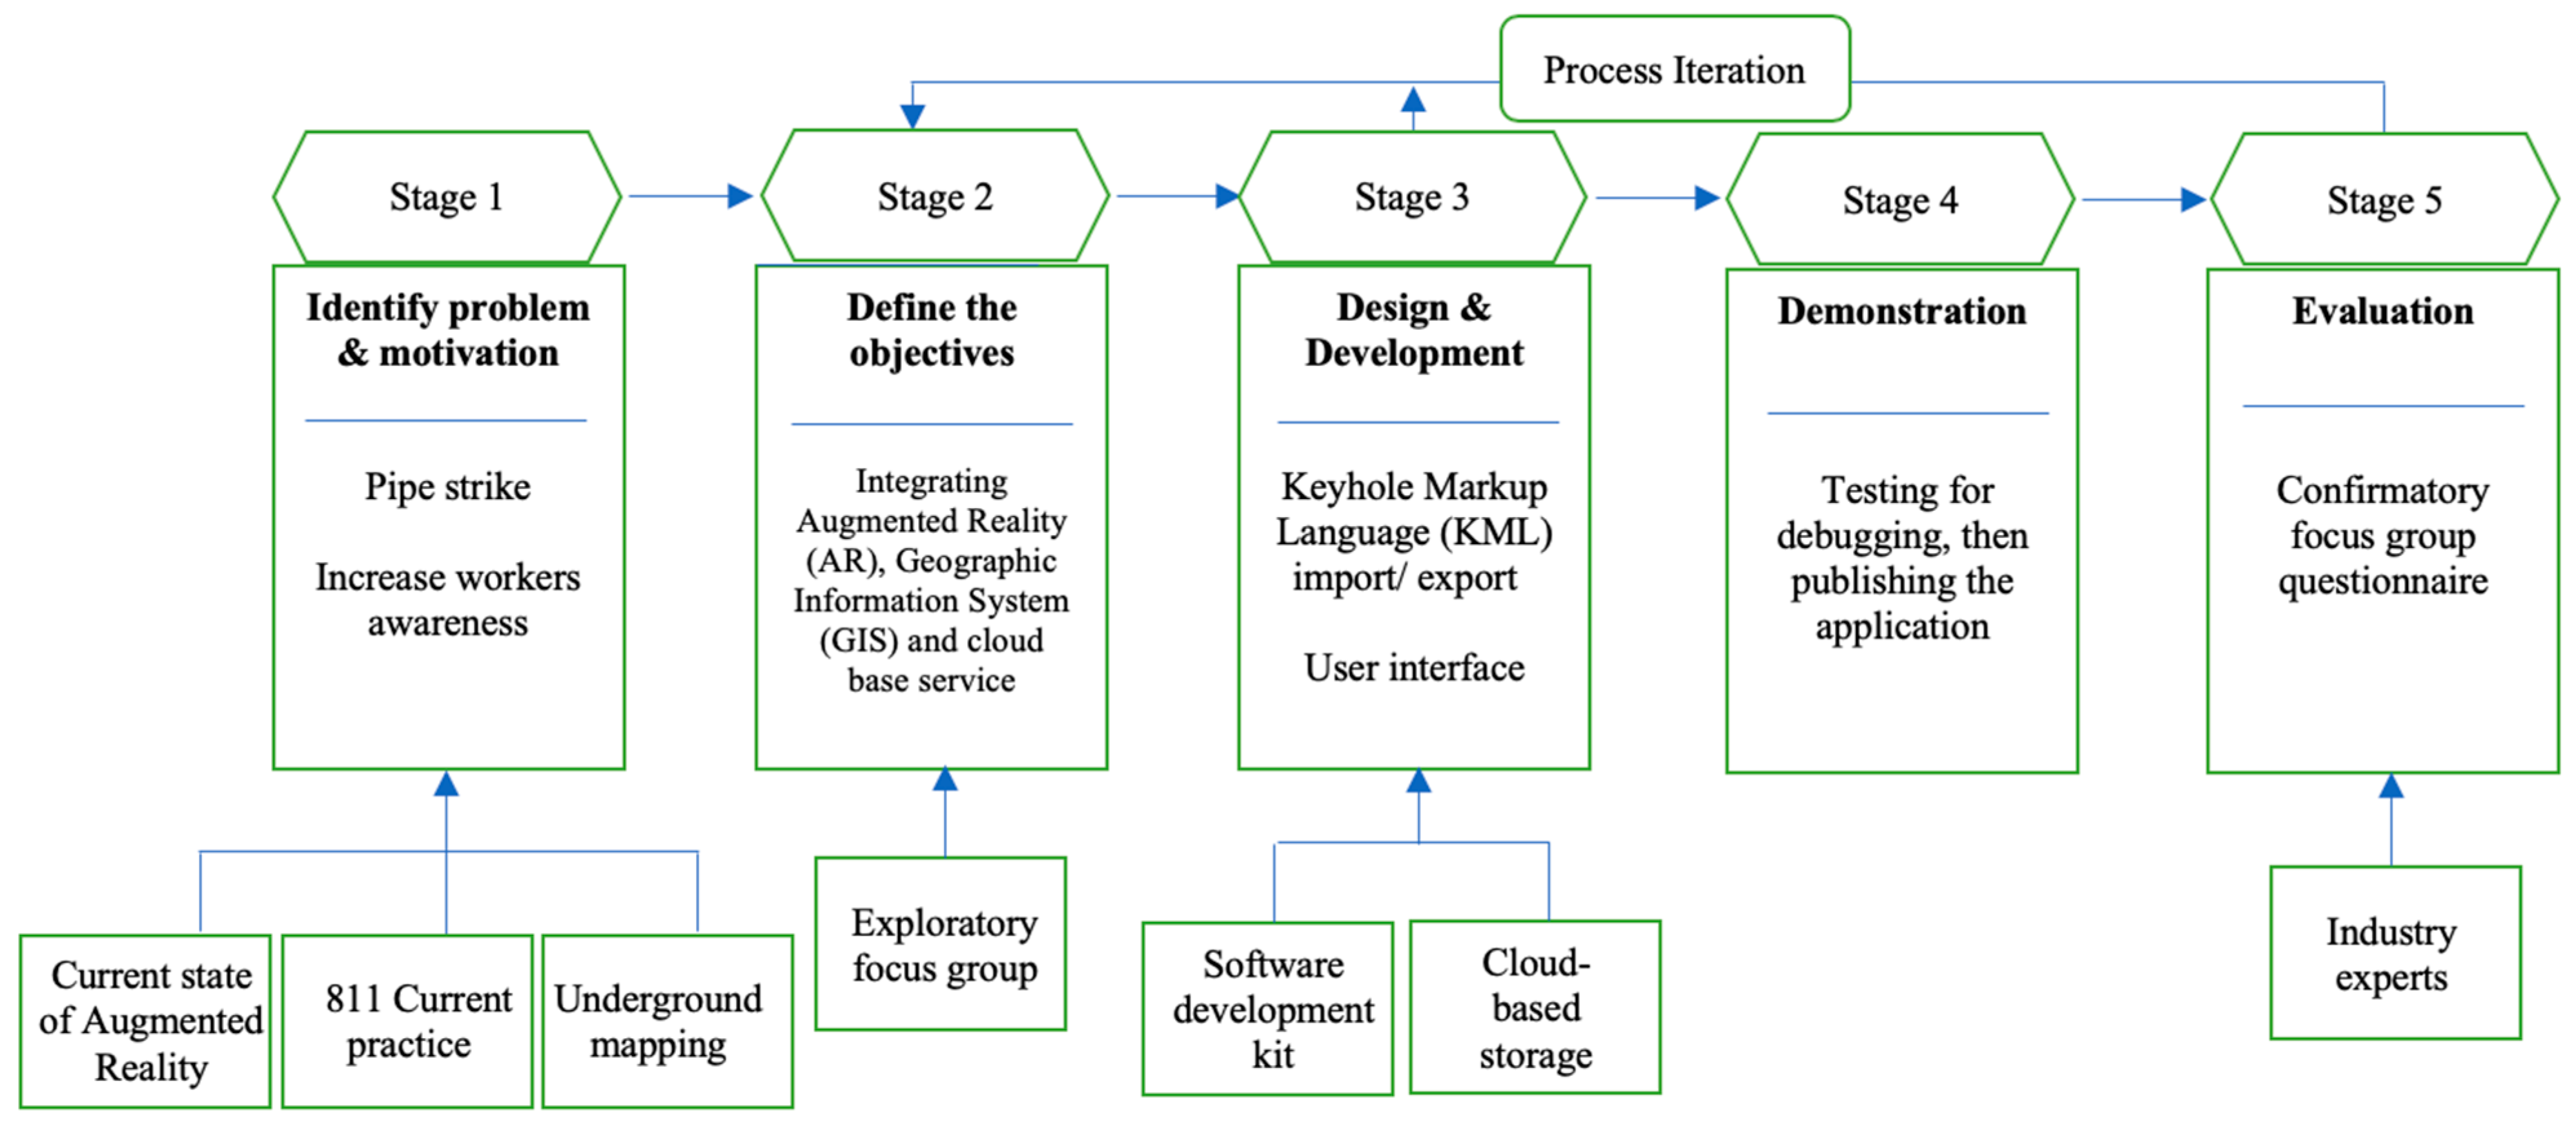
To achieve this aim, this research followed a design science (DS) research approach [
8]. The DS process includes five stages: (1) identifying the problem; (2) defining the objective; (3) designing and developing; (4) demonstrating; and (5) evaluating. The stages have been explained in detail by Peffers et al., [
25] and are shown in
Figure 2. The objective of this approach was to produce a mobile application that could assist underground construction personnel in capturing utility marks and sharing the data among other users. This method was conceived in order to create an accurate and reliable underground utilities database, which will also reveal the potential of integrating GIS and AR into one system.
Figure 2 summarizes the research approach, which started by identifying the limitations of current practice in subsurface utility engineering, which has been denoted as the first stage. In addition, recently developed AR systems in the construction industry have been mentioned in the background section of this paper [
45,
46]. The second stage focused on the main objective of the artifact development, using an exploratory focus group discussion to assist in designing the user interface. In the third stage, the authors examined the software development kits (SDK), using a competitive study to select the optimum SDK [
47] for the desired solution. The fourth stage was the testing stage for debugging before being published on the Apple store platform. It is important to note that focus group discussions were engaged in at each stage of this project’s development. This ensured and permitted feedback in the iterative process.
2.1. Defining the Objective
This research used two focus groups: (1) an exploratory focus group (EFG), which was used for the object definition and design iteration of the XR-GIS, and is denoted as Stage 2 in
Figure 2; and (2) a confirmatory focus group (CFG), which was used for the proof of concept in the underground utility industry, and is denoted as Stage 5 in
Figure 2. The use of a focus group in design research is widely used to pose stimulating opportunities and ideas [
48] to potential users. Each member of the focus group was required to have experience in the underground construction industry and to have used the call-center service to map the underground utilities.
At the beginning of the EFG discussion, the research goals and the problems facing the industry were clearly identified before the start of the session. The questions (
Table 1) in the EFG were open-ended but were carefully predetermined. The focus group discussion lasted approximately one hour on each of the following topics: current industry practice, major challenges facing the industry, AR technology, and information retrieval processes. The moderator encouraged the sharing of ideas and wrote down the discussion processes of participants as they discussed issues and various industry needs. The major outcomes from the EFG are discussed in
Section 4.
2.2. Design Development of XR-GIS
2.2.1. Software Development Kits: Competitive Study
The design and development of XR-GIS commenced after a review of the literature. Studies have found that Unity3D and ARKit [
49,
50] provided a suitable platform for AR development. The platform development features were available through an open source that allowed for full customization of its source code. In addition, the authors developed an algorithm to assist in the flow of data between the users and the cloud storage system.
Unity3D is a professional game development platform that features a three-dimensional display, real-time interactions, and server communication [
33]. The Unity3D platform also supports cross-platform development for iOS and Android operating systems without the need for extra development kits. Each object created by the platform is made up of components containing position, rotation, scale, materials, and mesh network [
33].
ARKit provides developers with a tool to create geo-located AR applications using the GPS and inertial measurement units (IMU) available on today’s mobile phones [
29]. In 2017, Apple announced the new ARKit framework that provided developers with programming features able to easily create AR apps for iPhone and iPad [
51]. In this research, ARKit was used to create the mobile XR, assisting in the positioning of the device. The device can be detected with respect to the real world through the use of visual inertial odometry, which merges camera sensor data with other embedded sensors to track the position of the device [
52].
One of the main features used in ARKit to assist in the development of XR-GIS was plane detection. When plane detection is activated, ARKit will continuously look for feature points. These are features in an image that are considered interesting for world tracking [
53]. This means that streets and roads will typically have fewer feature points, while a colored object with a pattern will have many feature points. This creates a baseline for the user to add the underground utility lines at the site. Moreover, lighting has a profound effect on how many feature points ARKit can identify. A bright environment is recommended in order to get the best experience.
If ARKit detects enough feature points on any plane, an ARPlaneAnchor object is added to its list of anchors [
42]. Anchors provide information about the location using the integrated GPS feed. These locations are then added to the 3D model through geographic coordinates. ARKit will continuously try to improve the position of the anchor as it learns more about the environment during a recording session of the desired underground utility.
2.2.2. Cloud-Based Storage
Digital storage is required in order to collect, store, and share data among users. Li and Lu [
27] suggested using a cloud-based storage system integrated with Google Earth as a solution for construction data management. Therefore, XR-GIS utilizes the Google Earth platform and Amazon Web Services (AWS) to store and manage data [
54]. In order to tackle the unstructured data collected from the construction site, the application utilized the standardized extended markup language (XML), chosen for its extensibility and interoperability on the web schemas, to share the project information 3D models [
9].
There are two types of geometrical data file formats: KML and XML [
9]. In many cases, KML is leveraged for its wide and varied usage [
53]. A code was written to import and export geometrical data from the mobile AR system to a cloud-based solution using the KML format. However, KML is a generic plane text formatted file, thus making the file size large and potentially difficult to manage. Therefore, the application compresses the data using a ZIP feature [
53] format into a compressed KML, which is known as KMZ.
Moreover, a KMZ contains the default KML file and other attachments such as name and date. For the data import required to use a KMZ file in Unity3D and ARKit, one must first extract the KML file from the KMZ file by unzipping it. Conversely, to export data, one must begin by creating the KML file as an XML structure for ease of use, and then converting it to a KMZ file using a compression algorithm. The XR-GIS utilizes the KMZ file format in sharing information between users.
Figure 3 shows the workflow between the different components used in the development of the XR-GIS.
2.2.3. User Interface (UI)
During the EFG discussion, participants were able to assist in the design and development of the user interface (UI) of the artifact. To better align the artifact with the underground construction industry, each participant was asked to define the areas of improvement they felt were important in sharing information (
Table 1). The main outputs of the group discussion were: (1) using the color-coded method used by the call center, (2) an interactive application that can add and edit pipeline models, (3) information input capability, such as utility depth, date of input, and comments, and (4) centralizing and sharing data.
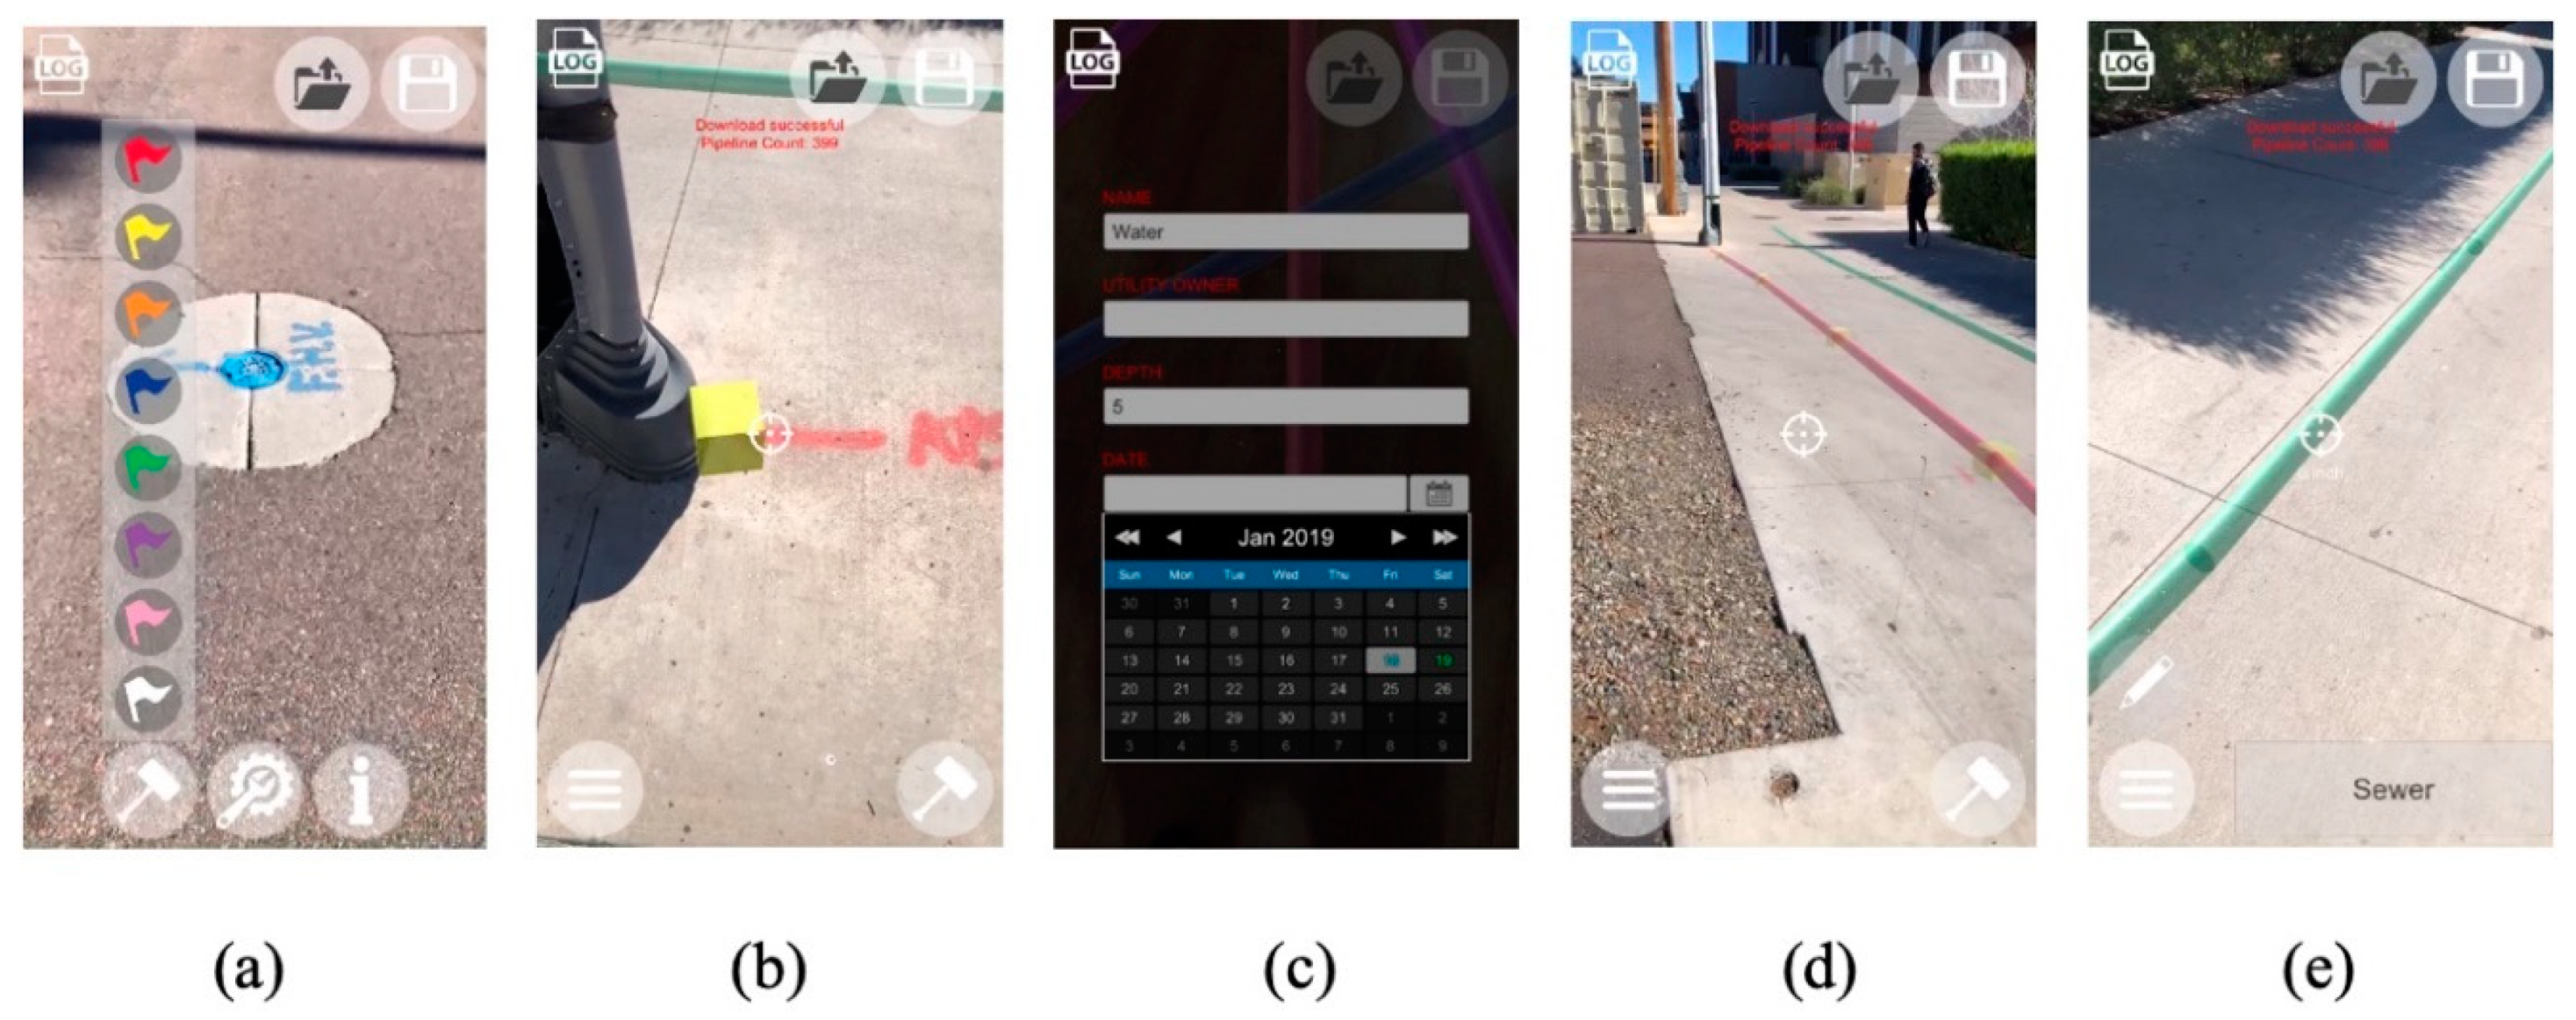
The XR-GIS UI was then created based on the EFG discussion. Users started by selecting the type of utility, choosing the corresponding color that matched the call-center color code (
Figure 4a): blue for water pipes, yellow for gas, orange for communication, green for sewer, purple for claim water, pink for survey, and white for a new proposed line. Once the type of utility is selected, the building mode started (
Figure 4b) and the utility information name and depth could be added (
Figure 4c). The application has the ability to edit or delete pipeline 3D models on site (
Figure 4d).
3. Results
In order to demonstrate the value of the artifact, a confirmatory focus group (CFG) was used to validate the proof of concept in the underground utility industry, denoted as Stage 4 and 5 in
Figure 2. The population group for this research consisted of twenty participants. The sample size used was similar to that of Chu et al.’s [
19] research, who used twenty participants, each of whom had at least one year of industry experience.
In the validation task, each participant was given the option to use a personal mobile device or one offered by the moderator. They were then asked to download XR-GIS directly from the Apple store (
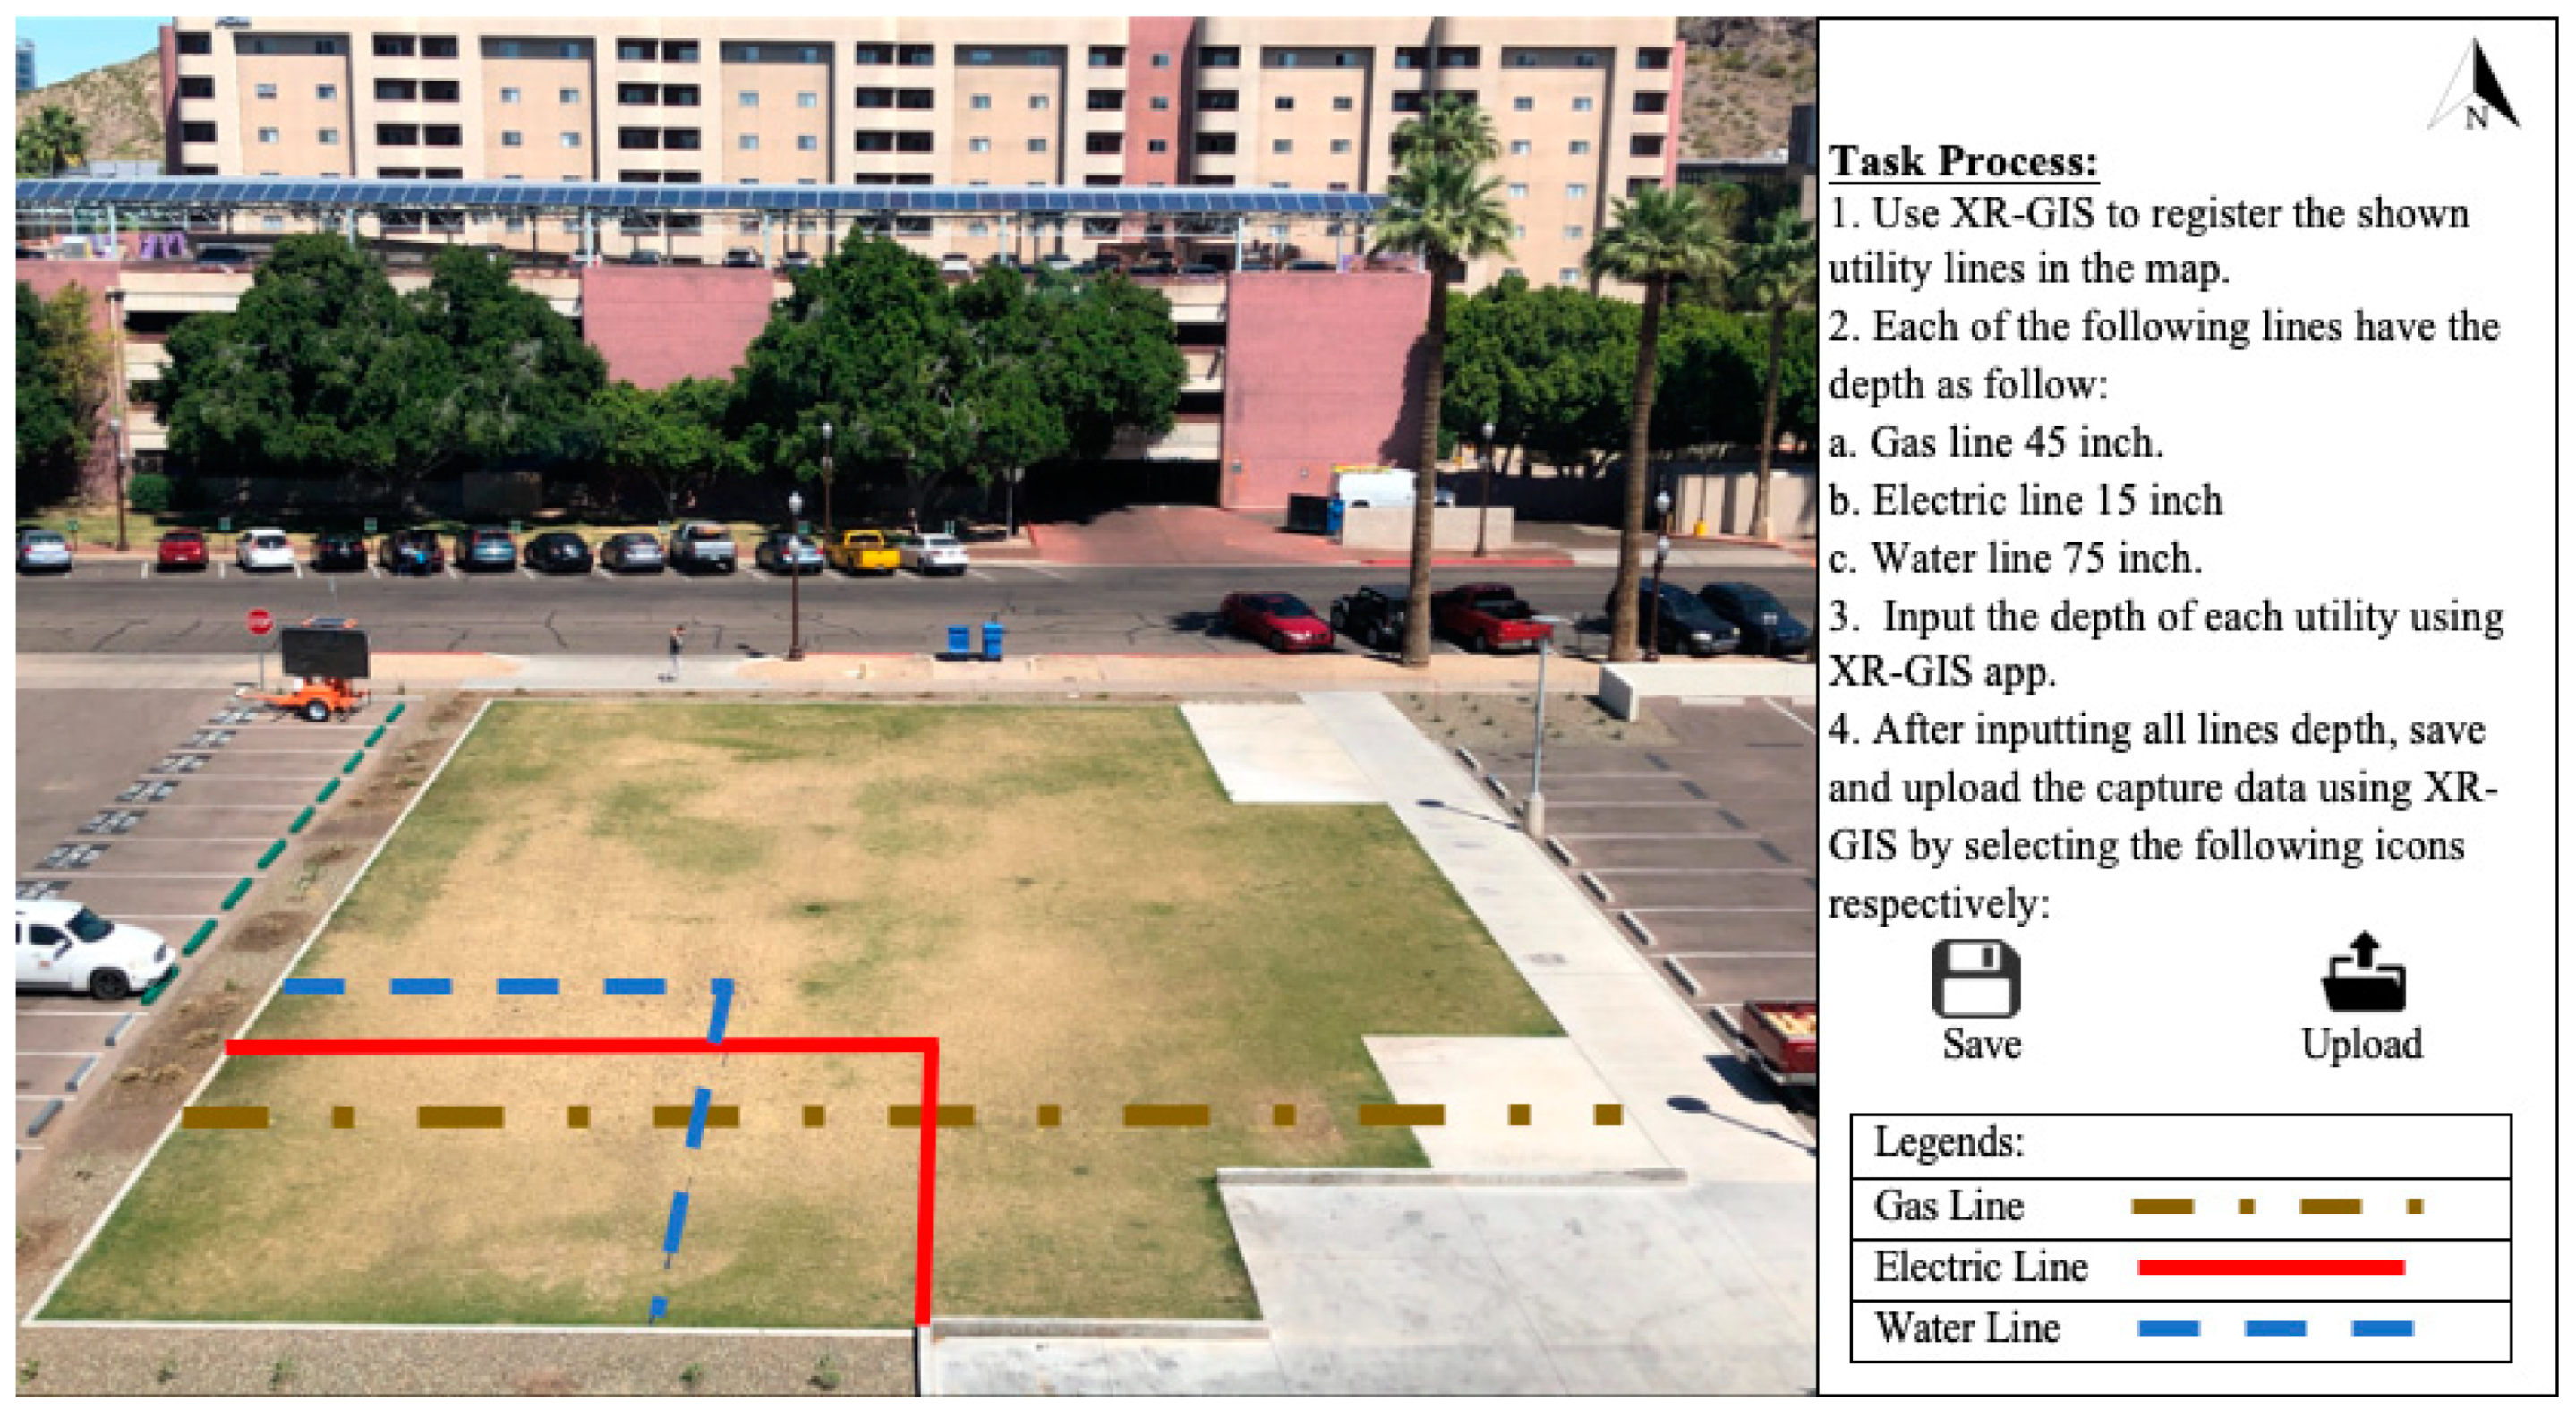
Figure 5) in order to get the full experience of using the application. This platform gave easy access to the software and a full experience for participants examining the application. After this, each participant was escorted individually to an outdoor area that had pre-painted utility lines (
Figure 6), and was asked to use XR-GIS to capture gas, electric, and water utility line. An information sheet and a blank answer sheet were prepared for the participants, which explained the experiment’s requirements and detailed the tasks to be undertaken.
Directly after completing the tasks, each participant was asked to complete a post-experiment questionnaire, displayed in
Table 2. The participants’ responses on the answer sheet were assessed. The results were then analyzed, using descriptive statistics to provide an overview of application validation. The post-experiment questionnaire was adapted from Alsafouri [
55] and contained subjective measures that focused on mobile mixed reality to influence design and constructability review sessions. The intent of the questionnaire was to identify the usability and capabilities of using XR-GIS for utility mapping.
The procedure for carrying out the experiment was as follows:
Introduction: The objective of the artifact was explained to participants, followed by an explanation of how XR-GIS linked to a cloud-based server.
Familiarization: The participants were all given the opportunity to take time to familiarize themselves with the application. In addition, the moderator answered participants’ questions regarding how to use the application.
Experiment process: Once familiarized with the application, the participants began the tasks (
Figure 4 and
Figure 6):
Post-experiment questionnaire: Directly after finishing the tasks, the participants were asked to complete the post-experiment questionnaire in order to capture their experiences and opinions relating to validation of the application’s usage in the underground industry (
Table 2).
4. Validation and Results
In total, 20 industry experts participated in the validation testing for the application (
Figure 6). A breakdown of the sample characteristics of the individuals is presented in
Table 3. The mean age of the participants was approximately 31 years. After completing the tasks, the participants completed questionnaires about the experience (
Table 2). The responses from the questionnaire indicated that all participants considered XR-GIS to be an effective medium for mapping utilities and information sharing. The participants felt that they could effectively record utility lines using only the app, and that XR-GIS was easier to use than traditional methods using spray paints and survey equipment.
Table 4 summarizes the findings from the session questionnaires.
In addition to asking participants about their perception of using XR-GIS, they were asked to provide feedback related to how XR-GIS might be used for a database center for all utilities nationwide. Eight of the participants indicated that it would be beneficial for the industry to have an open, centralized database. One of the participants believed that XR-GIS should be the only information-sharing technology used on-site between stakeholders. Furthermore, most participants seemed to consider that XR-GIS was a superior information registering delivery method. For example, only one participant disagreed with the statement that “It was convenient to use the XR-GIS application to physically navigate through the site.” Even though there were mixed opinions about the value of XR-GIS, these results show that industry members generally perceived this approach to be very positive.
In the open-ended questions, the participants described their experiences using XR-GIS. Specifically, they were asked to provide their favorite and least favorite parts of the application. In general, participants often mentioned that they liked the fact that the XR-GIS UI was clear and was correctly aligned during the building mode.
Furthermore, several participants mentioned that XR-GIS allowed them to input information and comment before saving and sharing information. Conversely, many participants mentioned that they did not like having a device in their hand throughout the mapping task. Several also mentioned that the mobile phone screen felt too small and limited their sight of their surroundings.
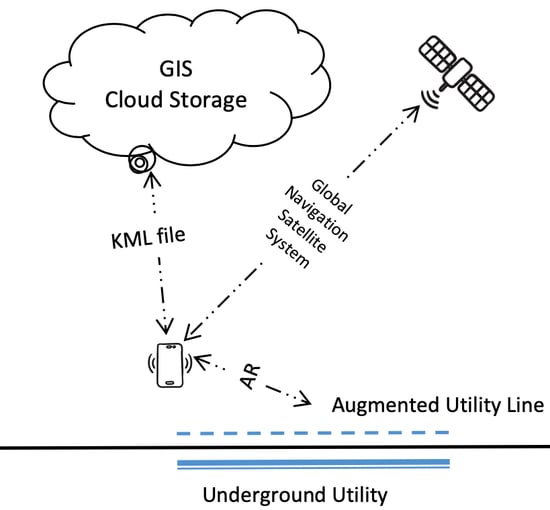
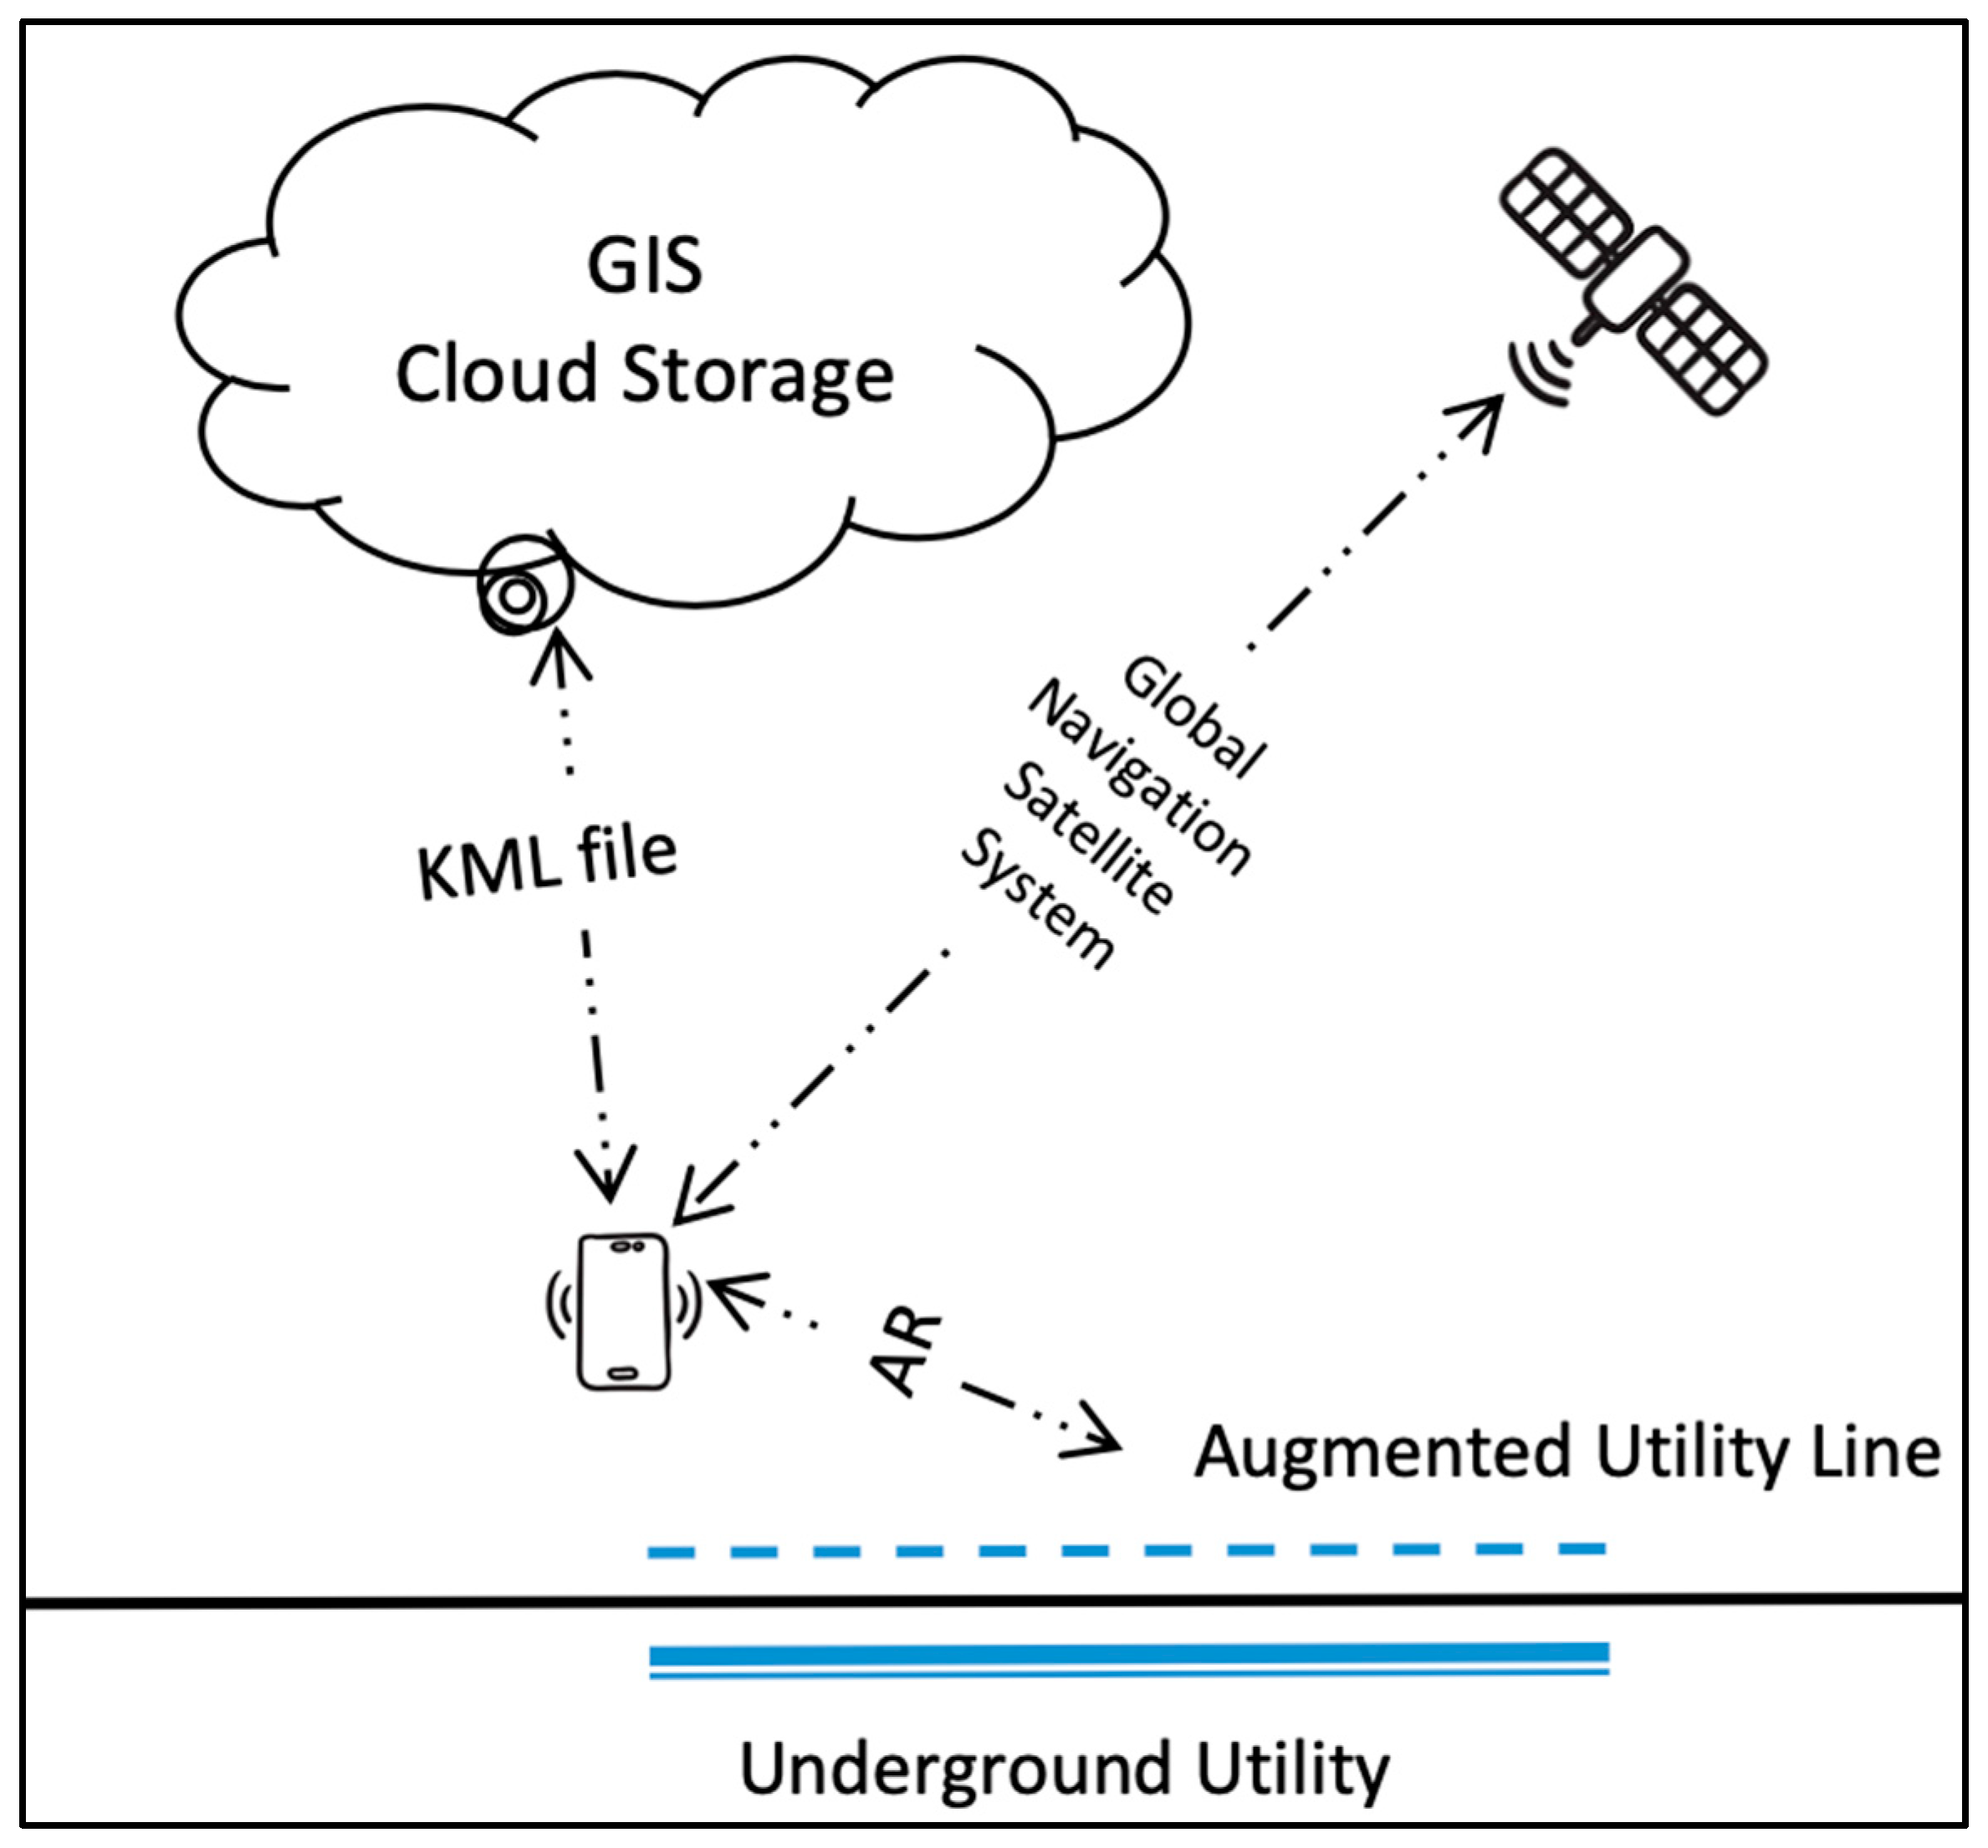
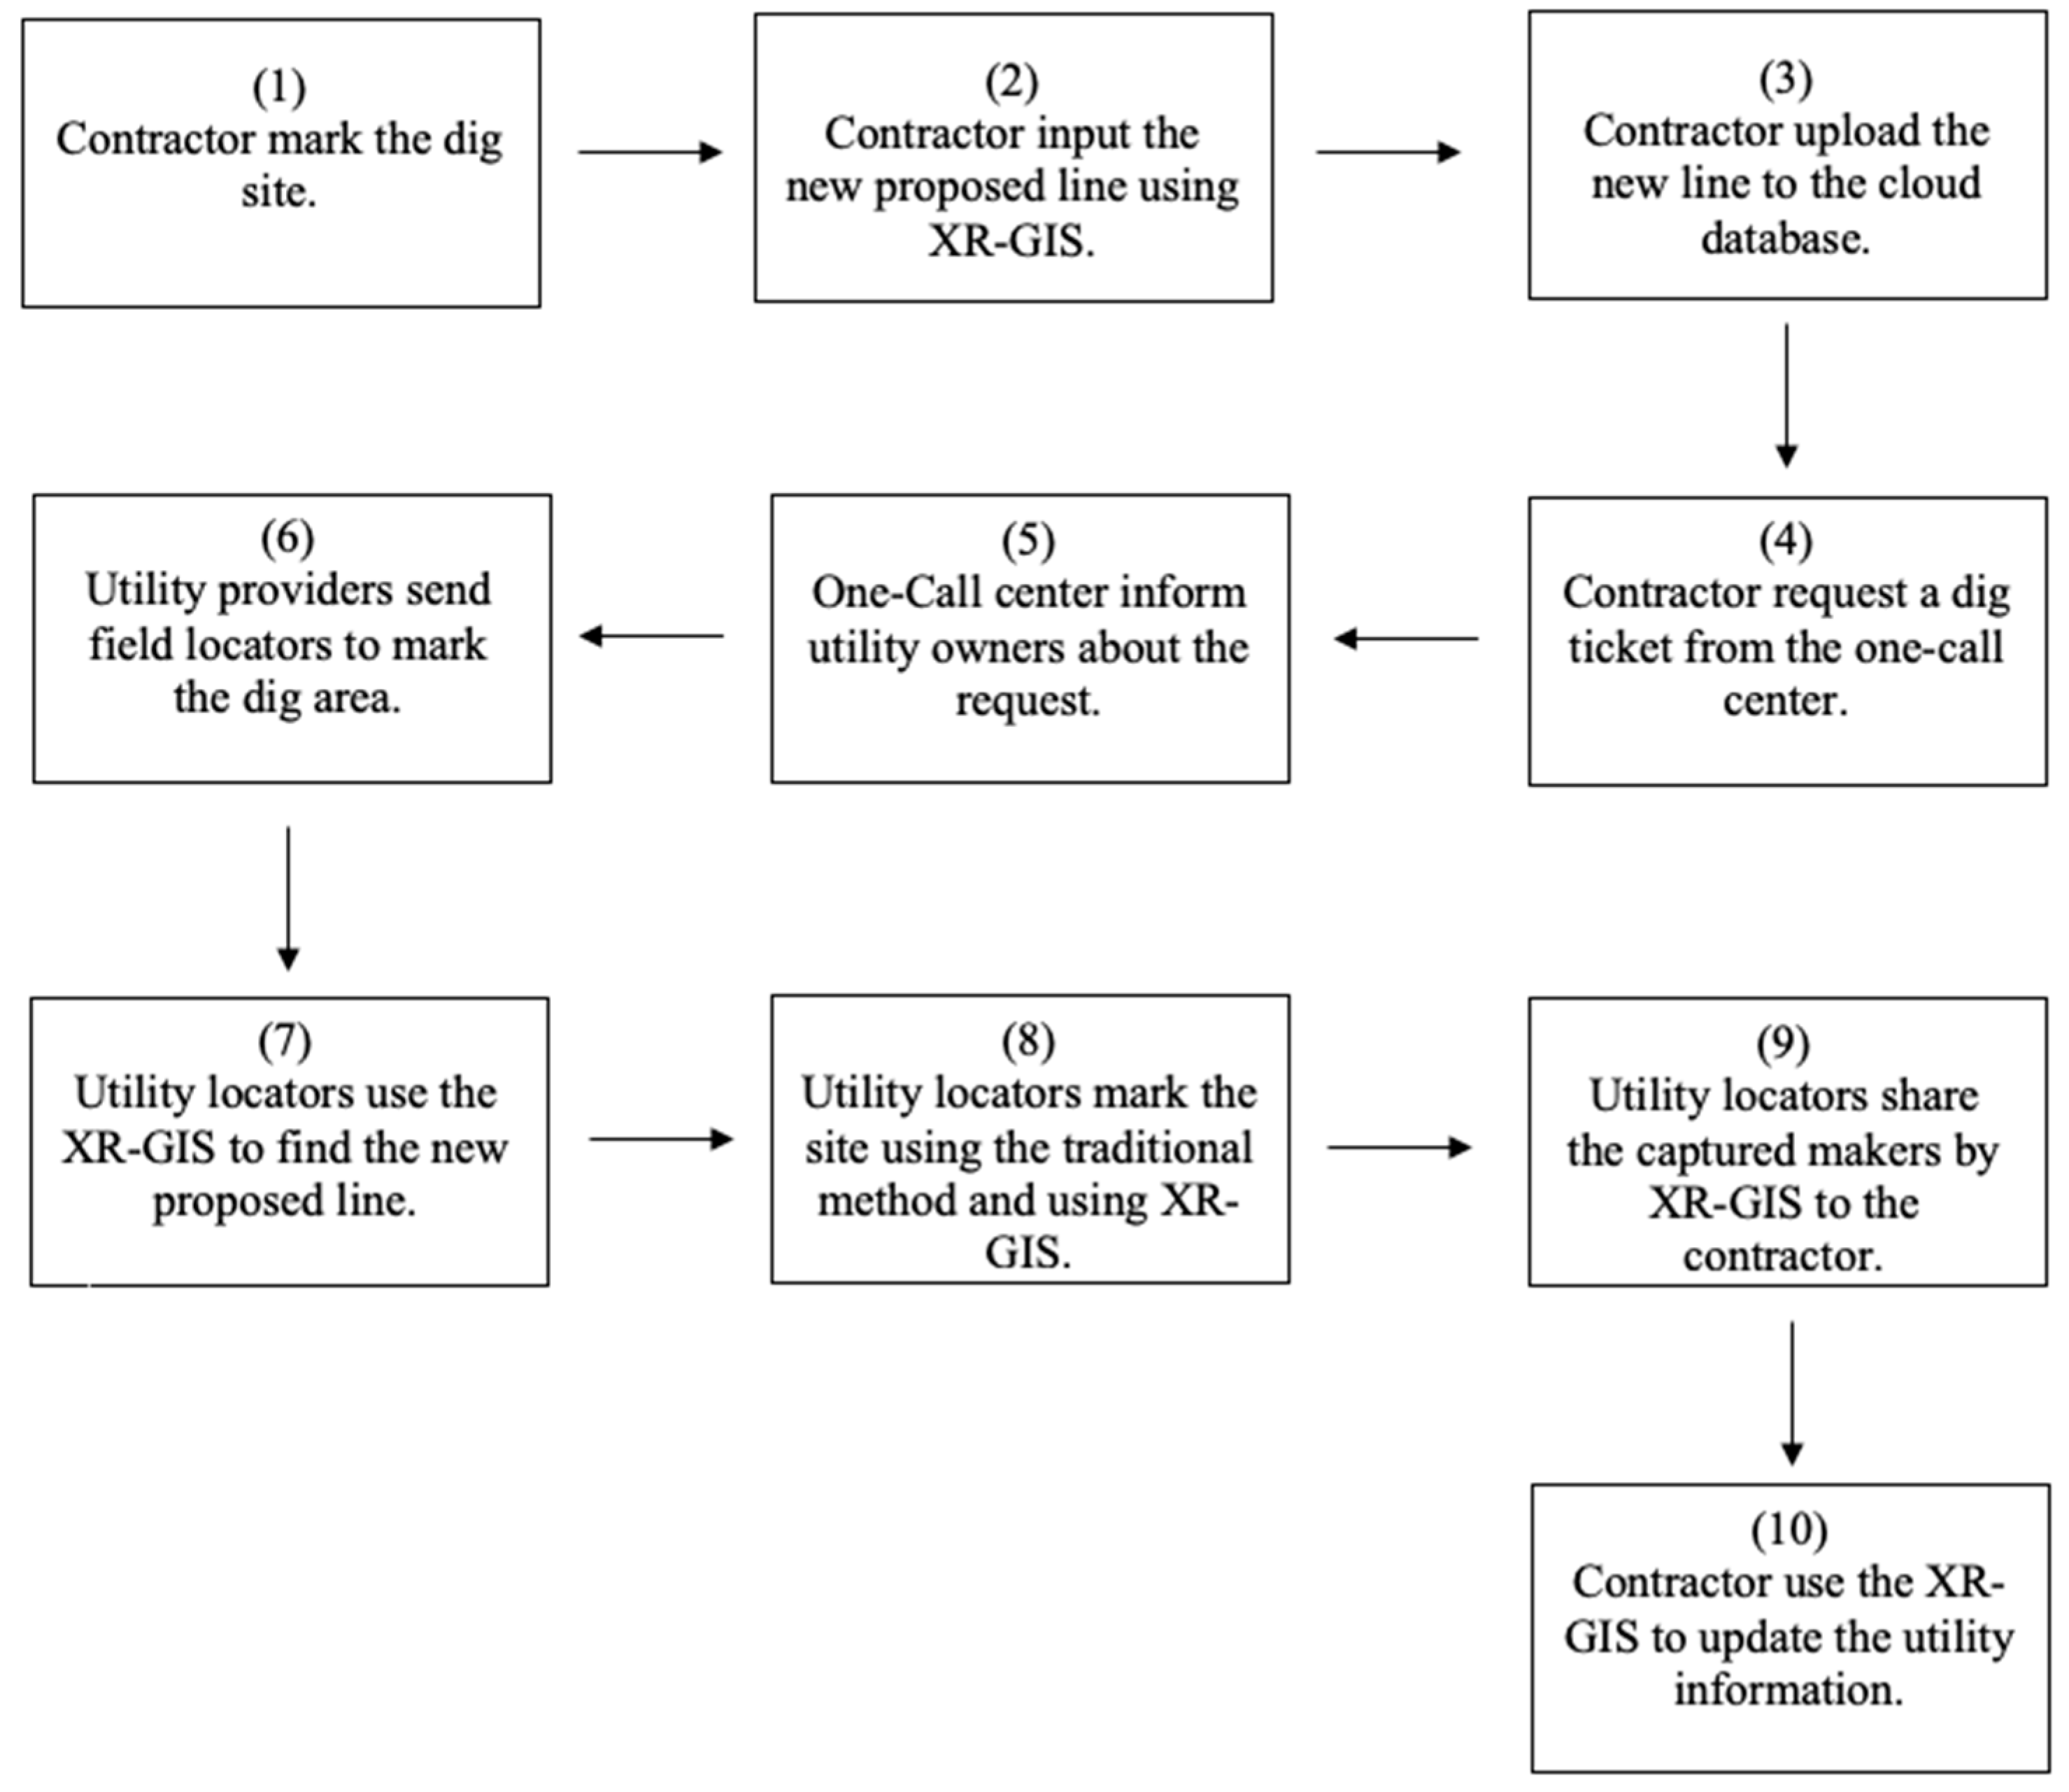
Most existing AR systems focus on rendering inputted data from the database, such as as-built maps. In other words, people cannot input data using AR on site. The main objective of this research in developing an integrated AR and GIS for mapping and capturing underground utilities using a mobile device on site has been proven by industry experts. In addition, the findings presented validate the research claim with respect to improving information sharing and retrieval among underground construction stakeholders. The XR-GIS framework ensures a real-time information flow between utility owners and contractors. The framework, as exemplified in
Figure 7, can be described as follows: Steps (1–4): The contractor pre-marks the area of excavation using the traditional methods of white paint or flags; then inputs the new proposed line using the XR-GIS. The new lines are uploaded to a cloud database and stored for future access. Thereafter, the contractor requests a dig ticket from the one-call center. Steps (5–6): The one-call center informs the utility owners of the contractor’s request and sends filed locators to mark out the underground utilities. Next, in Steps (7–9), the utility locators use the XR-GIS for guidance as to the exact location of the new line proposed by the contractor in Step (3), then mark out the job site using both the traditional method and XR-GIS. The captured utilities from the locators are uploaded to the cloud database and shared with the contractor. Finally, in Step (10), excavators start digging, using XR-GIS to update the depth of the utilities; this step will assist in building a reliable database that can be shared among stakeholders.
5. Discussion
The work presented here is promising, with limitations related to the experience of the testing participants and currently available hardware technology. These should improve over time, as more and more applications of these technologies will ensure more future utilization. The participants had no prior experience with this technology. As a result, the application had the appealing effect of novelty to users, which that could theoretically have impacted their judgment during the questionnaire session. However, the findings do support the claim that, when used properly, XR-GIS can share utility locations more efficiently than the traditional methods. Future research aimed at generalizing the findings of this paper would need to identify statistically representative samples.
There are hardware limitations related to GPS accuracy. The use of GPS is an effective tracking tool for outdoor projects, but in order to obtain an accurate reading of the user’s location, it has to be visible to a certain number of GPS satellites [
56]. After examining the shared data and captured utility lines, there was a shift in the location of the input data of three to four meters due to GPS accuracy. Future studies will use external GPS receivers to obtain a more reliable location. A well-designed GPS receiver can typically reach a positioning accuracy of one to three meters [
57]. Therefore, the use of more tools will more likely boost accuracy and could include image tracking, wireless sensors, Bluetooth, or radio frequency identification (RFID), which can also be used as tracking technologies for AR [
58]. Better positional accuracy is needed for tracking the location of utilities. This need for high accuracy led to Chen et al., [
59] proposing a novel way of providing reliable positioning using a differential GPS (DGPS) technique by adding a ground station, which increased accuracy to 5 cm.
Finally, the participants used the application in a controlled environment rather than on an active job site. Additional jobsite conditions, such as noise and safety concerns, could affect the implementation of the application. Moreover, as a proof of concept, the authors went through several iterations before being able to design a responsive UI. However, the authors recognize that it would require additional investment over the current design to expand XR-GIS usage into the broader construction industry.
6. Conclusions
In this paper, an integration of GIS, AR, and cloud-based solutions for mapping underground utilities (XR-GIS) was designed and developed as a promising platform to improve access to and utilization of information. This research was undertaken to evaluate the effectiveness of the system to enhance mapping inputs for utility lines. The findings improved the users’ capabilities in information registration and retrieval processes. The XR-GIS successfully integrates several currently available information technologies, including AR, GIS and mobile technology. The XR-GIS offers an electronic method for data/information collection and communication in construction sites.
The captured data using XR-GIS is stored and processed automatically in cloud-based storage. The processed data/information can then be visualized on a map using the Google Earth platform to immediately allow real-time decision making. The on-site model inputs, such as location and depth, can also be easily accessed through the XR-GIS interface, which is an advantage in data management. Hence, XR-GIS is effective as a safety information and communication management system for the underground construction industry. No doubt the construction industry will move into cloud-computing-based communication and management sooner or later, and some of the first movers have already started this journey [
16].
The intellectual contribution and novelty of this research highlights the processes for using GPS coordination, AR, and free-to-use developing platforms for developing a real-time communication tool. The current state of XR-GIS has presented significant opportunities for research and development in four areas: an open centralized utility database, the real-time registration of utilities, the information sharing and retrieving process, and increasing the awareness of construction personnel. In addition, in future follow-up research, data captured by this XR-GIS system will be analyzed to measure the location accuracy of the data, which will help to further improve construction safety.
Author Contributions
Conceptualization, A.F.; methodology, A.F.; software, A.F.; validation, A.F.; formal analysis, A.F.; investigation, A.F.; resources, A.F.; data curation, A.F.; writing—original draft preparation, A.F.; writing—review and editing, N.S.; visualization, A.F.; supervision, S.T.A. and S.K.A.
Funding
This research received no external funding.
Conflicts of Interest
The authors declare no conflict of interest.
References
- Starnes, M.; Taylor, C. SHRP 2 Tools for underground utility location, data collection, and analysis. Strateg. Highw. Res. Program 2012, 2, 2–4. [Google Scholar]
- Bobylev, N. Underground space as an urban indicator: Measuring use of subsurface. Tunn. Undergr. Space Technol. 2016, 55, 40–51. [Google Scholar] [CrossRef] [Green Version]
- Talmaki, S.; Kamat, V.R. Real-time hybrid virtuality for prevention of excavation related utility strikes. J. Comput. Civ. Eng. 2012, 28, 04014001. [Google Scholar] [CrossRef]
- Lyle, S.K. Damage Information Reporting Tool; Common Ground Alliance: San Diego, CA, USA, 2017; Volume 13, p. 3. [Google Scholar]
- Makana, L.; Metje, N.; Jefferson, I.; Rogers, C. What Do Utility Strikes Really Cost? University of Birmingham: Birmingham, UK, 2016. [Google Scholar]
- Bilal, M.; Khan, W.; Muggleton, J.; Rustighi, E.; Jenks, H.; Pennock, S.R.; Atkins, P.R.; Cohn, A. Inferring the most probable maps of underground utilities using Bayesian mapping model. J. Appl. Geophys. 2018, 150, 52–66. [Google Scholar] [CrossRef]
- Behzadan, A.H.; Aziz, Z.; Anumba, C.J.; Kamat, V.R. Ubiquitous location tracking for context-specific information delivery on construction sites. Autom. Constr. 2008, 17, 737–748. [Google Scholar] [CrossRef]
- Sweeney, M.W. Geographic information systems. Water Environ. Res. 1999, 71, 551–556. [Google Scholar] [CrossRef]
- Wilson, T. Open Geospatial Consortium Keyhole Markup Language; Open Geospatial Consortium: Wayland, MA, USA, 2008. [Google Scholar]
- International Organization for Standardization (ISO). ISO/PAS 17506:2012, Industrial Automation Systems and Integration—COLLADA Digital Asset Schema Specification for 3D Visualization of Industrial Data; International Organization for Standardization: Geneva, Switzerland, 2012. [Google Scholar]
- Deng, Y.; Cheng, J.C.; Anumba, C. Mapping between BIM and 3D GIS in different levels of detail using schema mediation and instance comparison. Autom. Constr. 2016, 67, 1–21. [Google Scholar] [CrossRef]
- Dutta, R.; Cohn, A.G.; Muggleton, J.M. 3D mapping of buried underworld infrastructure using dynamic Bayesian network based multi-sensory image data fusion. J. Appl. Geophys. 2013, 92, 8–19. [Google Scholar] [CrossRef]
- Muggleton, J.; Brennan, M.; Gao, Y. Determining the location of buried plastic water pipes from measurements of ground surface vibration. J. Appl. Geophys. 2011, 75, 54–61. [Google Scholar] [CrossRef]
- Royal, A.C.; Atkins, P.R.; Brennan, M.J.; Chapman, D.N.; Chen, H.; Cohn, A.G.; Foo, K.Y.; Goddard, K.F.; Hayes, R.; Hao, T. Site assessment of multiple-sensor approaches for buried utility detection. Int. J. Geophys. 2011, 2011, 496123. [Google Scholar] [CrossRef]
- Li, S.; Cai, H.; Kamat, V.R. Uncertainty-aware geospatial system for mapping and visualizing underground utilities. Autom. Constr. 2015, 53, 105–119. [Google Scholar] [CrossRef]
- Anspach, J.H. Standard Guideline for the Collection and Depiction of Existing Subsurface Utility Data; ASCE: Reston, VA, USA, 2002; p. 1. [Google Scholar]
- Metje, N.; Atkins, P.; Brennan, M.; Chapman, D.; Lim, H.; Machell, J.; Muggleton, J.; Pennock, S.; Ratcliffe, J.; Redfern, M. Mapping the Underworld–State-of-the-art review. Tunn. Undergr. Space Technol. 2007, 22, 568–586. [Google Scholar] [CrossRef]
- Milgram, P.; Kishino, F. A taxonomy of mixed reality visual displays. IEICE Trans. Inf. Syst. 1994, 77, 1321–1329. [Google Scholar]
- Chu, M.; Matthews, J.; Love, P.E. Integrating mobile building information modelling and augmented reality systems: An experimental study. Autom. Constr. 2018, 85, 305–316. [Google Scholar] [CrossRef]
- Meža, S.; Turk, Ž.; Dolenc, M. Component based engineering of a mobile BIM-based augmented reality system. Autom. Constr. 2014, 42, 1–12. [Google Scholar] [CrossRef]
- Su, X.; Talmaki, S.; Cai, H.; Kamat, V.R. Uncertainty-aware visualization and proximity monitoring in urban excavation: A geospatial augmented reality approach. Vis. Eng. 2013, 1, 2. [Google Scholar] [CrossRef]
- Zou, P.X.; Lun, P.; Cipolla, D.; Mohamed, S. Cloud-based safety information and communication system in infrastructure construction. Saf. Sci. 2017, 98, 50–69. [Google Scholar] [CrossRef]
- Côté, S.; Mercier, A. Augmentation of Road Surfaces with Subsurface Utility Model Projections. In Proceedings of the 2018 IEEE Conference on Virtual Reality and 3D User Interfaces (VR), Reutlingen, Germany, 18–22 March 2018; IEEE: Piscataway, NJ, USA, 2018; pp. 535–536. [Google Scholar]
- Forcada, N.; Casals, M.; Fuertes, A.; Gangolells, M.; Roca, X. A web-based system for sharing and disseminating research results: The underground construction case study. Autom. Constr. 2010, 19, 458–474. [Google Scholar] [CrossRef] [Green Version]
- Peffers, K.; Tuunanen, T.; Rothenberger, M.A.; Chatterjee, S. A design science research methodology for information systems research. J. Manag. Inf. Syst. 2007, 24, 45–77. [Google Scholar] [CrossRef]
- Papalambros, P.Y. Design science: Why, what and how. Des. Sci. 2015, 1, e1. [Google Scholar] [CrossRef]
- Li, D.; Lu, M. Integrating geometric models, site images and GIS based on Google Earth and Keyhole Markup Language. Autom. Constr. 2018, 89, 317–331. [Google Scholar] [CrossRef]
- Buyuksalih, I.; Bayburt, S.; Buyuksalih, G.; Baskaraca, A.; Karim, H.; Rahman, A.A. 3d modelling and visualization based on the unity game engine—Advantages and challenges. ISPRS Ann. Photogramm. Remote Sens. Spat. Inf. Sci. 2017, 4, 161. [Google Scholar] [CrossRef]
- Dilek, U.; Erol, M. Detecting position using ARKit II: Generating position-time graphs in real-time and further information on limitations of ARKit. Phys. Educ. 2018, 53, 035020. [Google Scholar] [CrossRef]
- Marvin, S.; Slater, S. Urban infrastructure: The contemporary conflict between roads and utilities. Prog. Plan. 1997, 4, 247–318. [Google Scholar] [CrossRef]
- Bell, S. GIS for the people: Cognitive errors and data restrictions. In Prairie Perspectives: Geographical Essay; The University of Winnipeg: Winnipeg, MB, Canada, 2002; pp. 310–319. [Google Scholar]
- Hsu, Y.-C.; Ching, Y.-H. Mobile app design for teaching and learning: Educators’ experiences in an online graduate course. Int. Rev. Res. Open Distrib. Learn. 2013, 14. [Google Scholar] [CrossRef]
- Tian, F.; Luo, L. Roaming of large urban scenes based on Unity 3D. In Proceedings of the 2018 International Conference on Electronics Technology (ICET), Chengdu, China, 23–27 May 2018; pp. 438–441. [Google Scholar]
- Lannin, D.G.; Scott, N.A. Social networking ethics: Developing best practices for the new small world. Prof. Psychol. Res. Pract. 2013, 44, 135–141. [Google Scholar] [CrossRef]
- Weisberg, S.M.; Newcombe, N.S. How Do (Some) People Make a Cognitive Map? Routes, Places, and Working Memory. J. Exp. Psychol. Learn. Mem. Cogn. 2016, 42, 768–785. [Google Scholar] [CrossRef]
- Crawford, D. Implementing a Utility Geographic Information System for Water, Sewer, and Electric; Northwest Missouri State University: Maryville, MO, USA, 2012. [Google Scholar]
- Heikkilä, R.; Jaakkola, M. Intelligent Road Construction Site—Development of Automation into total Working Process of Finnish Road Construction. In Proceedings of the 20th International Symposium on Automation and Robotics in Construction, Eindhoven, The Netherlands, 21–24 September 2003. [Google Scholar]
- Quiroga, C.; Anspach, J.; Scott, P.; Kraus, E. Feasibility of Mapping and Marking Underground Utilities by State Transportation Departments; Federal Highway Administration: Washington, DC, USA, 2018.
- Milgram, P.; Takemura, H.; Utsumi, A.; Kishino, F. Augmented reality: A class of displays on the reality-virtuality continuum. In Telemanipulator and Telepresence Technologies; International Society for Optics and Photonics: Bellingham, WA, USA, 1995; Volume 2351, pp. 282–292. [Google Scholar]
- Azuma, R.; Hoff, B.; Neely, H.; Sarfaty, R. A motion-stabilized outdoor augmented reality system. In Proceedings of the IEEE Virtual Reality (Cat. No. 99CB36316), Houston, TX, USA, 13–17 March 1999; pp. 252–259. [Google Scholar]
- Huang, W.; Sun, M.; Li, S. A 3D GIS-based interactive registration mechanism for outdoor augmented reality system. Expert Syst. Appl. 2016, 55, 48–58. [Google Scholar] [CrossRef]
- Roberts, G.W.; Evans, A.; Dodson, A.; Denby, B.; Cooper, S.; Hollands, R. The Use of Augmented Reality, GPS and INS for Subsurface Data Visualization; CiteSeerX: University Park, PA, USA, 2002; pp. 1–12. [Google Scholar]
- Zhang, X.; Han, Y.; Hao, D.; Lv, Z. ARGIS-based outdoor underground pipeline information system. J. Vis. Commun. Image Represent. 2016, 40, 779–790. [Google Scholar] [CrossRef]
- Chuah, S.H.-W. Why and who will adopt extended reality technology? Literature review, synthesis, and future research agenda. Lit. Rev. Synth. Future Res. 2018. [Google Scholar] [CrossRef]
- Fenais, A.; Smilovsky, N.; Ariaratnam, S.T.; Ayer, S.K. A meta-analysis of augmented reality challenges in the underground utility construction industry. Constr. Res. Congr. 2018, 2018, 80–89. [Google Scholar]
- Fenais, A.; Smilovsky, N.; Ariaratnam, S. Using augmented reality in horizontal directional drilling to reduce the risk of utility damages. In Pipelines 2018: Utility Engineering, Surveying, and Multidisciplinary Topics; American Society of Civil Engineers (ASCE): Reston, VA, USA, 2018; pp. 290–298. [Google Scholar]
- Rehman, U.; Cao, S. Augmented-reality-based indoor navigation: A comparative analysis of handheld devices versus google glass. IEEE Trans. Hum. Mach. Syst. 2016, 47, 140–151. [Google Scholar] [CrossRef]
- Tremblay, M.C.; Hevner, A.R.; Berndt, D.J. Focus groups for artifact refinement and evaluation in design research. Cais 2010, 26, 599–618. [Google Scholar] [CrossRef]
- Apple Inc. ARKit. ARKit: Apple Developer Documentation. Available online: https://developer.apple.com/documentation/arkit (accessed on 17 January 2019).
- Adăscăliţei, I.; Bălţoi, I.-C.-M. The influence of augmented reality in construction and integration into smart city. Inf. Econ. 2018, 22, 55–67. [Google Scholar]
- Sumera, M. Kentico Cloud Content Delivery Using Augmented Reality. Ph.D. Thesis, Fakulta informatiky, Masarykova University, Brno, Czechia, 2018. [Google Scholar]
- Bergquist, R.; Stenbeck, N. Using Augmented Reality to Measure Vertical Surfaces. Ph.D. Thesis, Linköping University, Linköping, Sweden, 2018. [Google Scholar]
- Cox, S.; Cuthbert, A.; Daisey, P.; Davidson, J.; Johnson, S.; Keighan, E.; Lake, R.; Mabrouk, M.; Margoulies, S.; Martell, R. Opengis® Geography Markup Language (GML) Implementation Specification, Version; CiteSeerX: University Park, PA, USA, 2002. [Google Scholar]
- Joseph, A.D.; Katz, R.; Konwinski, A.; Gunho, L.; Patterson, D.; RABKin, A. A view of cloud computing. Commun. ACM 2010, 53. [Google Scholar] [CrossRef]
- Alsafouri, S. Information Technology and Human Factors to Enhance Design and Constructability Review Processes in Construction. Ph.D. Thesis, Arizona State University, Tempe, AZ, USA, 2017. [Google Scholar]
- Song, J.; Haas, C.T.; Caldas, C.H. Tracking the location of materials on construction job sites. J. Constr. Eng. Manag. 2006, 132, 911–918. [Google Scholar] [CrossRef]
- Renfro, B.; Rosenquest, J.; Terry, A.; Boeker, N. An Analysis of Global Positioning System (GPS) Standard Positioning System (SPS) Performance for 2015; Space and Geophysics Laboratory, Applied Research Laboratories, The University of Texas at Austin: Austin, TX, USA, 2017. [Google Scholar]
- Jian, M.-S.; Wang, Y.-C.; Wu, B.-H.; Cheng, Y.-E. Hybrid Cloud Computing for User Location-Aware Augmented Reality Construction; IEEE: Piscataway, NJ, USA, 2018; pp. 90–194. [Google Scholar]
- Chen, Y.; Zhao, S.; Farrell, J.A. Computationally efficient carrier integer ambiguity resolution in multiepoch GPS/INS: A common-position-shift approach. IEEE Trans. Control Syst. Technol. 2015, 24, 1541–1556. [Google Scholar] [CrossRef]
© 2019 by the authors. Licensee MDPI, Basel, Switzerland. This article is an open access article distributed under the terms and conditions of the Creative Commons Attribution (CC BY) license (http://creativecommons.org/licenses/by/4.0/).


